Air Quality Impacts during the 2015 Rough Fire in Areas Surrounding the Sierra Nevada, California

 ,
,
Abstract
:1. Introduction
2. Materials and Methods
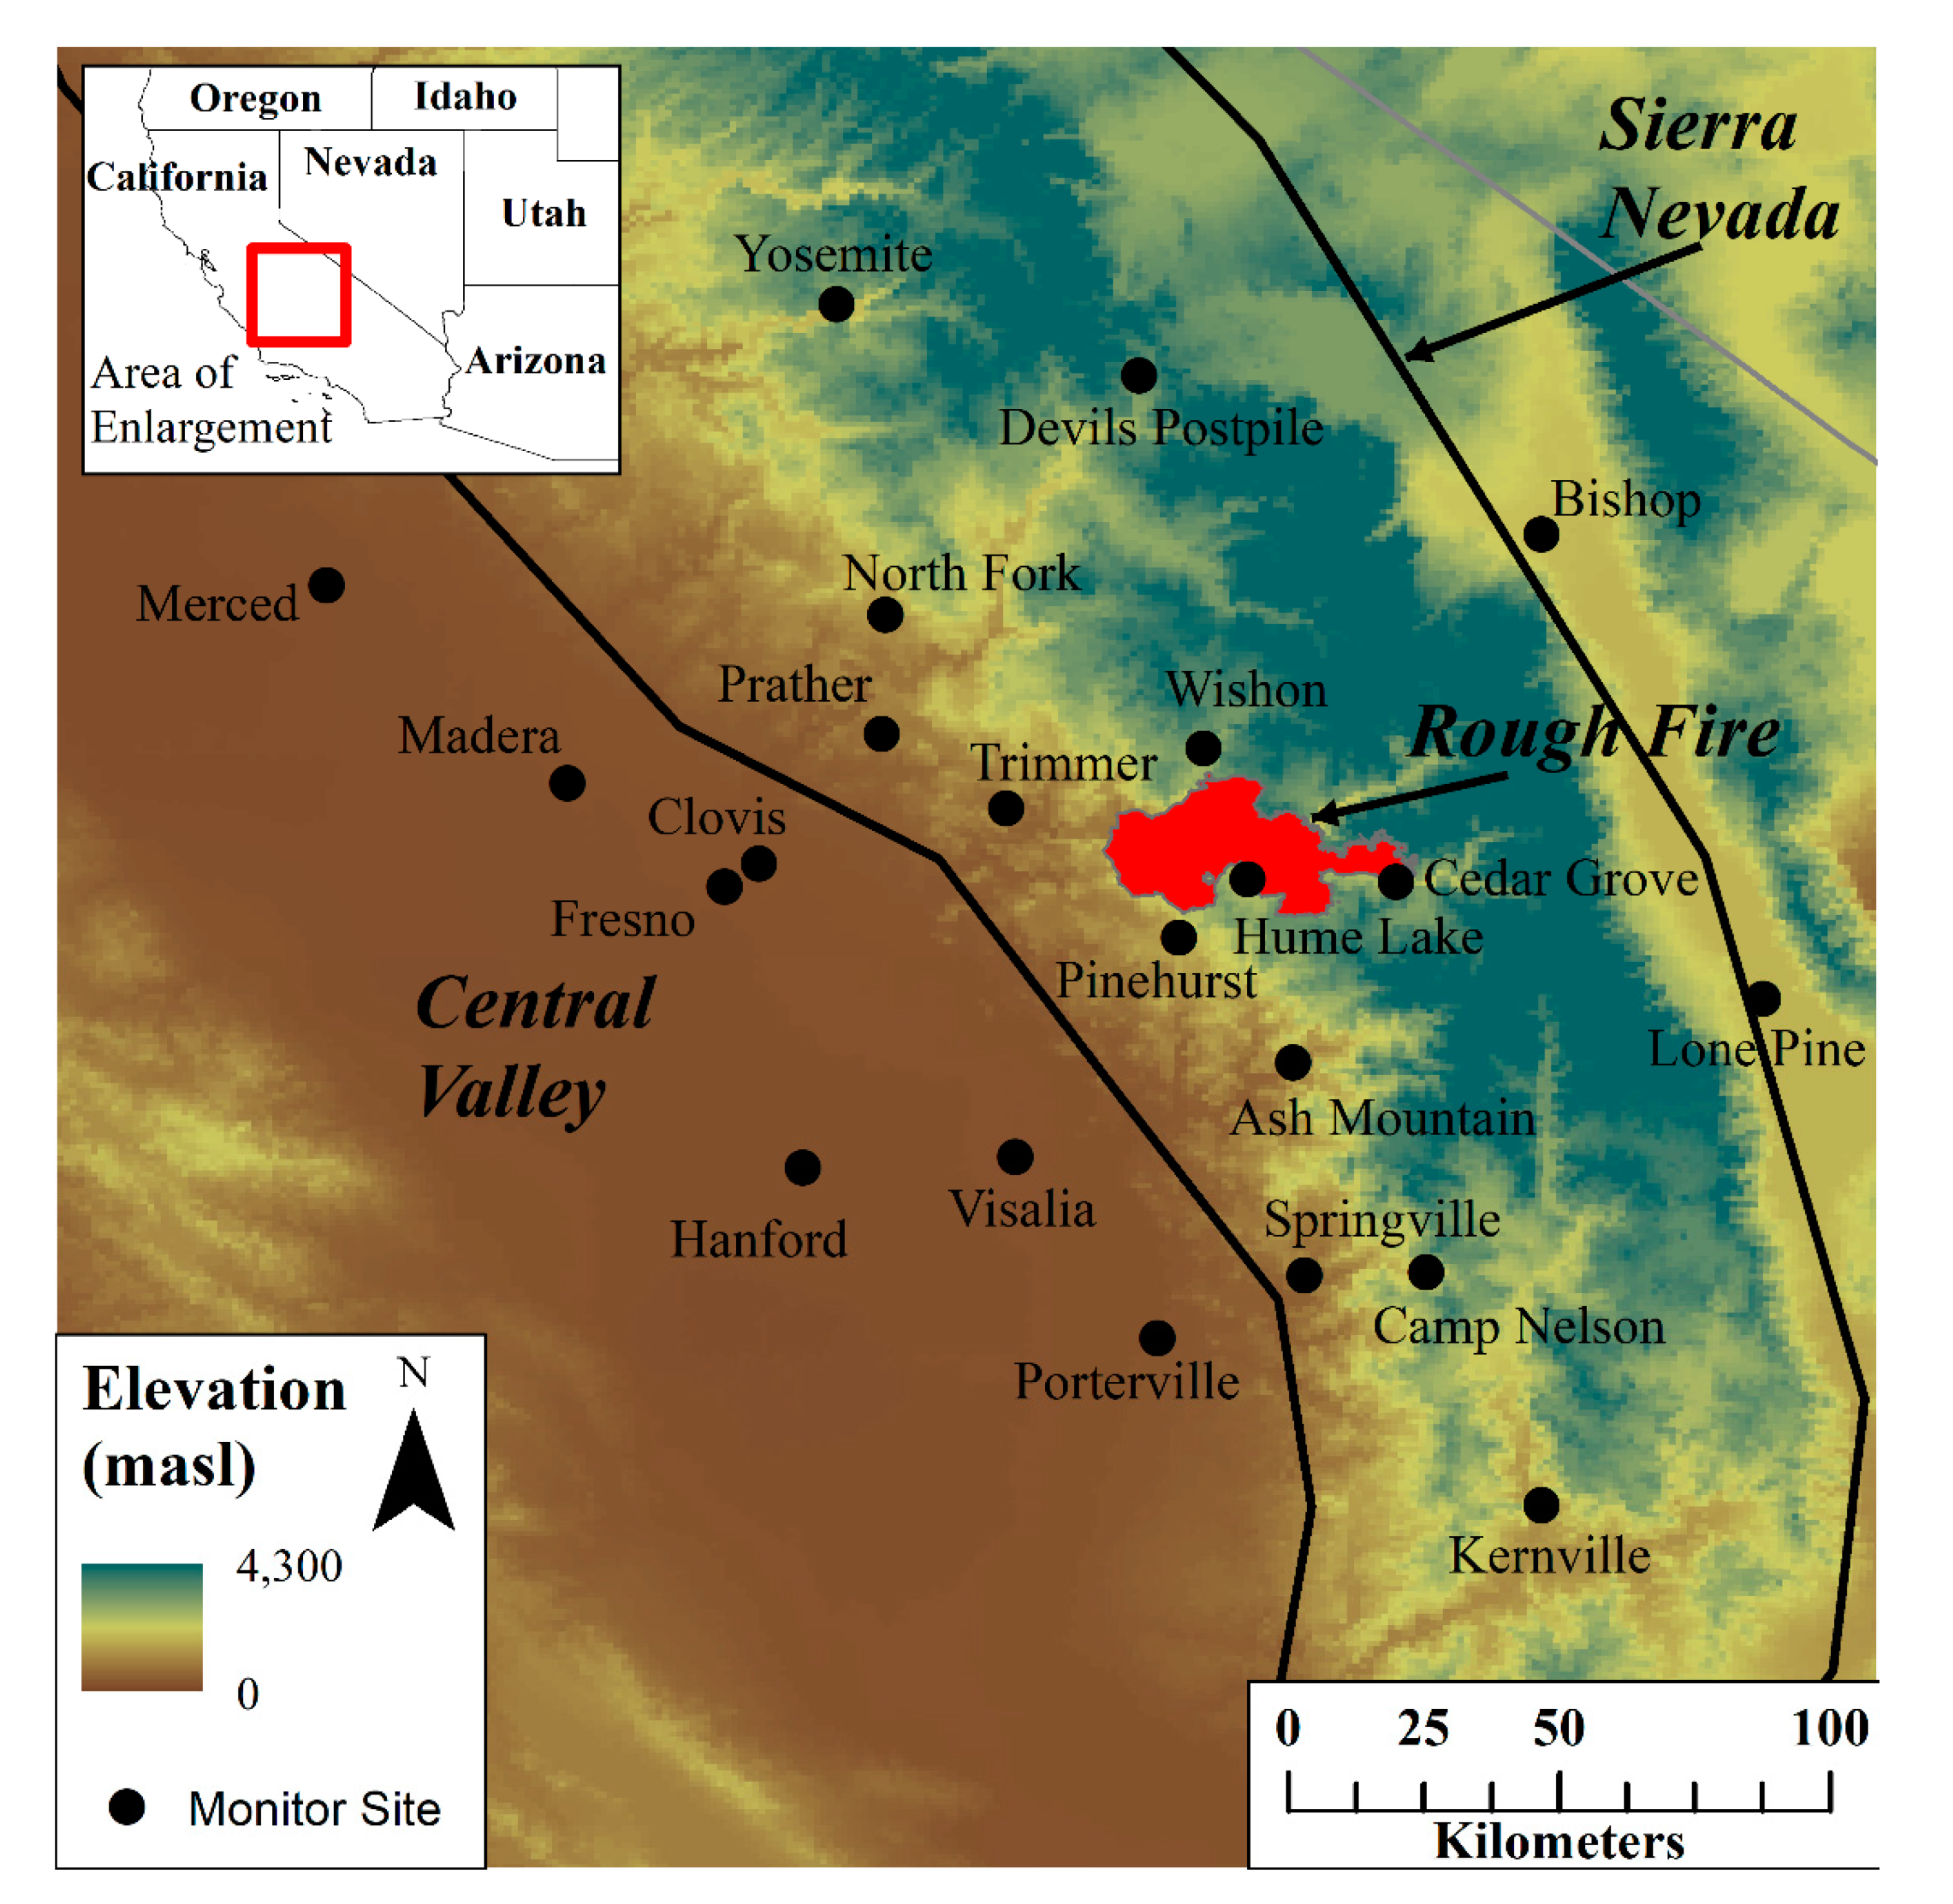
2.1. Study Location Time Frame
2.2. Air Quality Data
2.3. Air Quality Index
3. Results
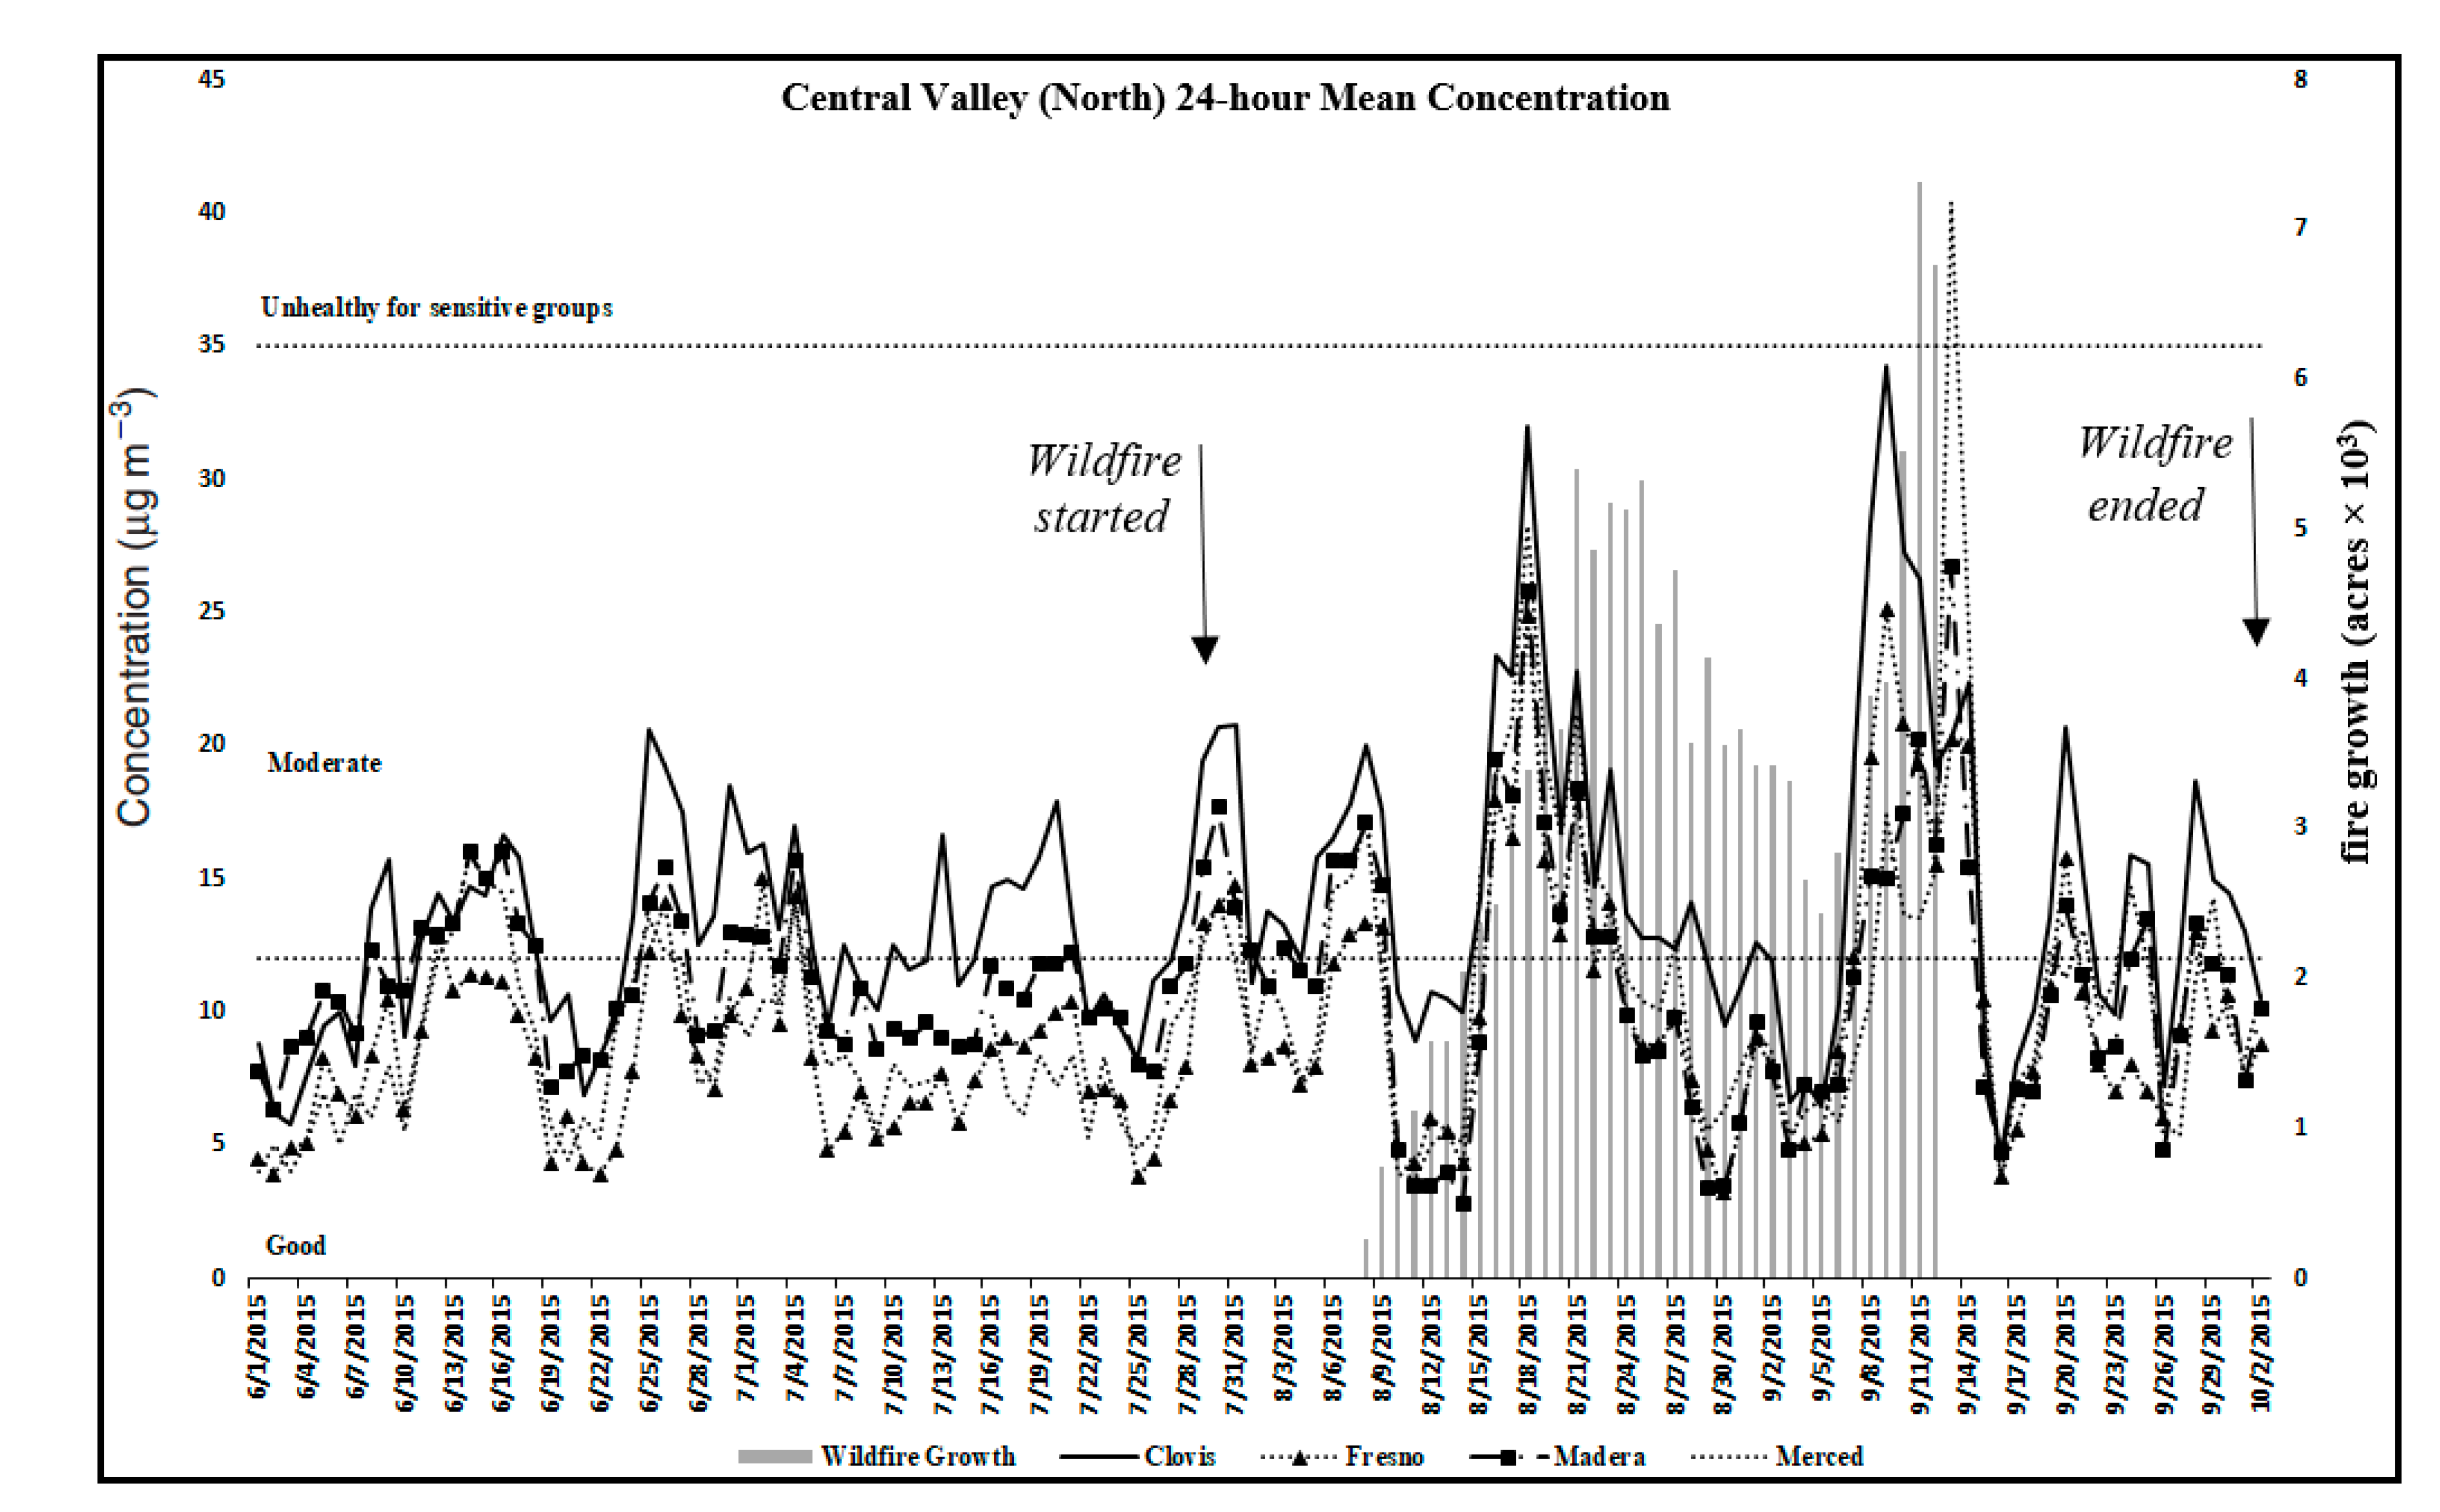
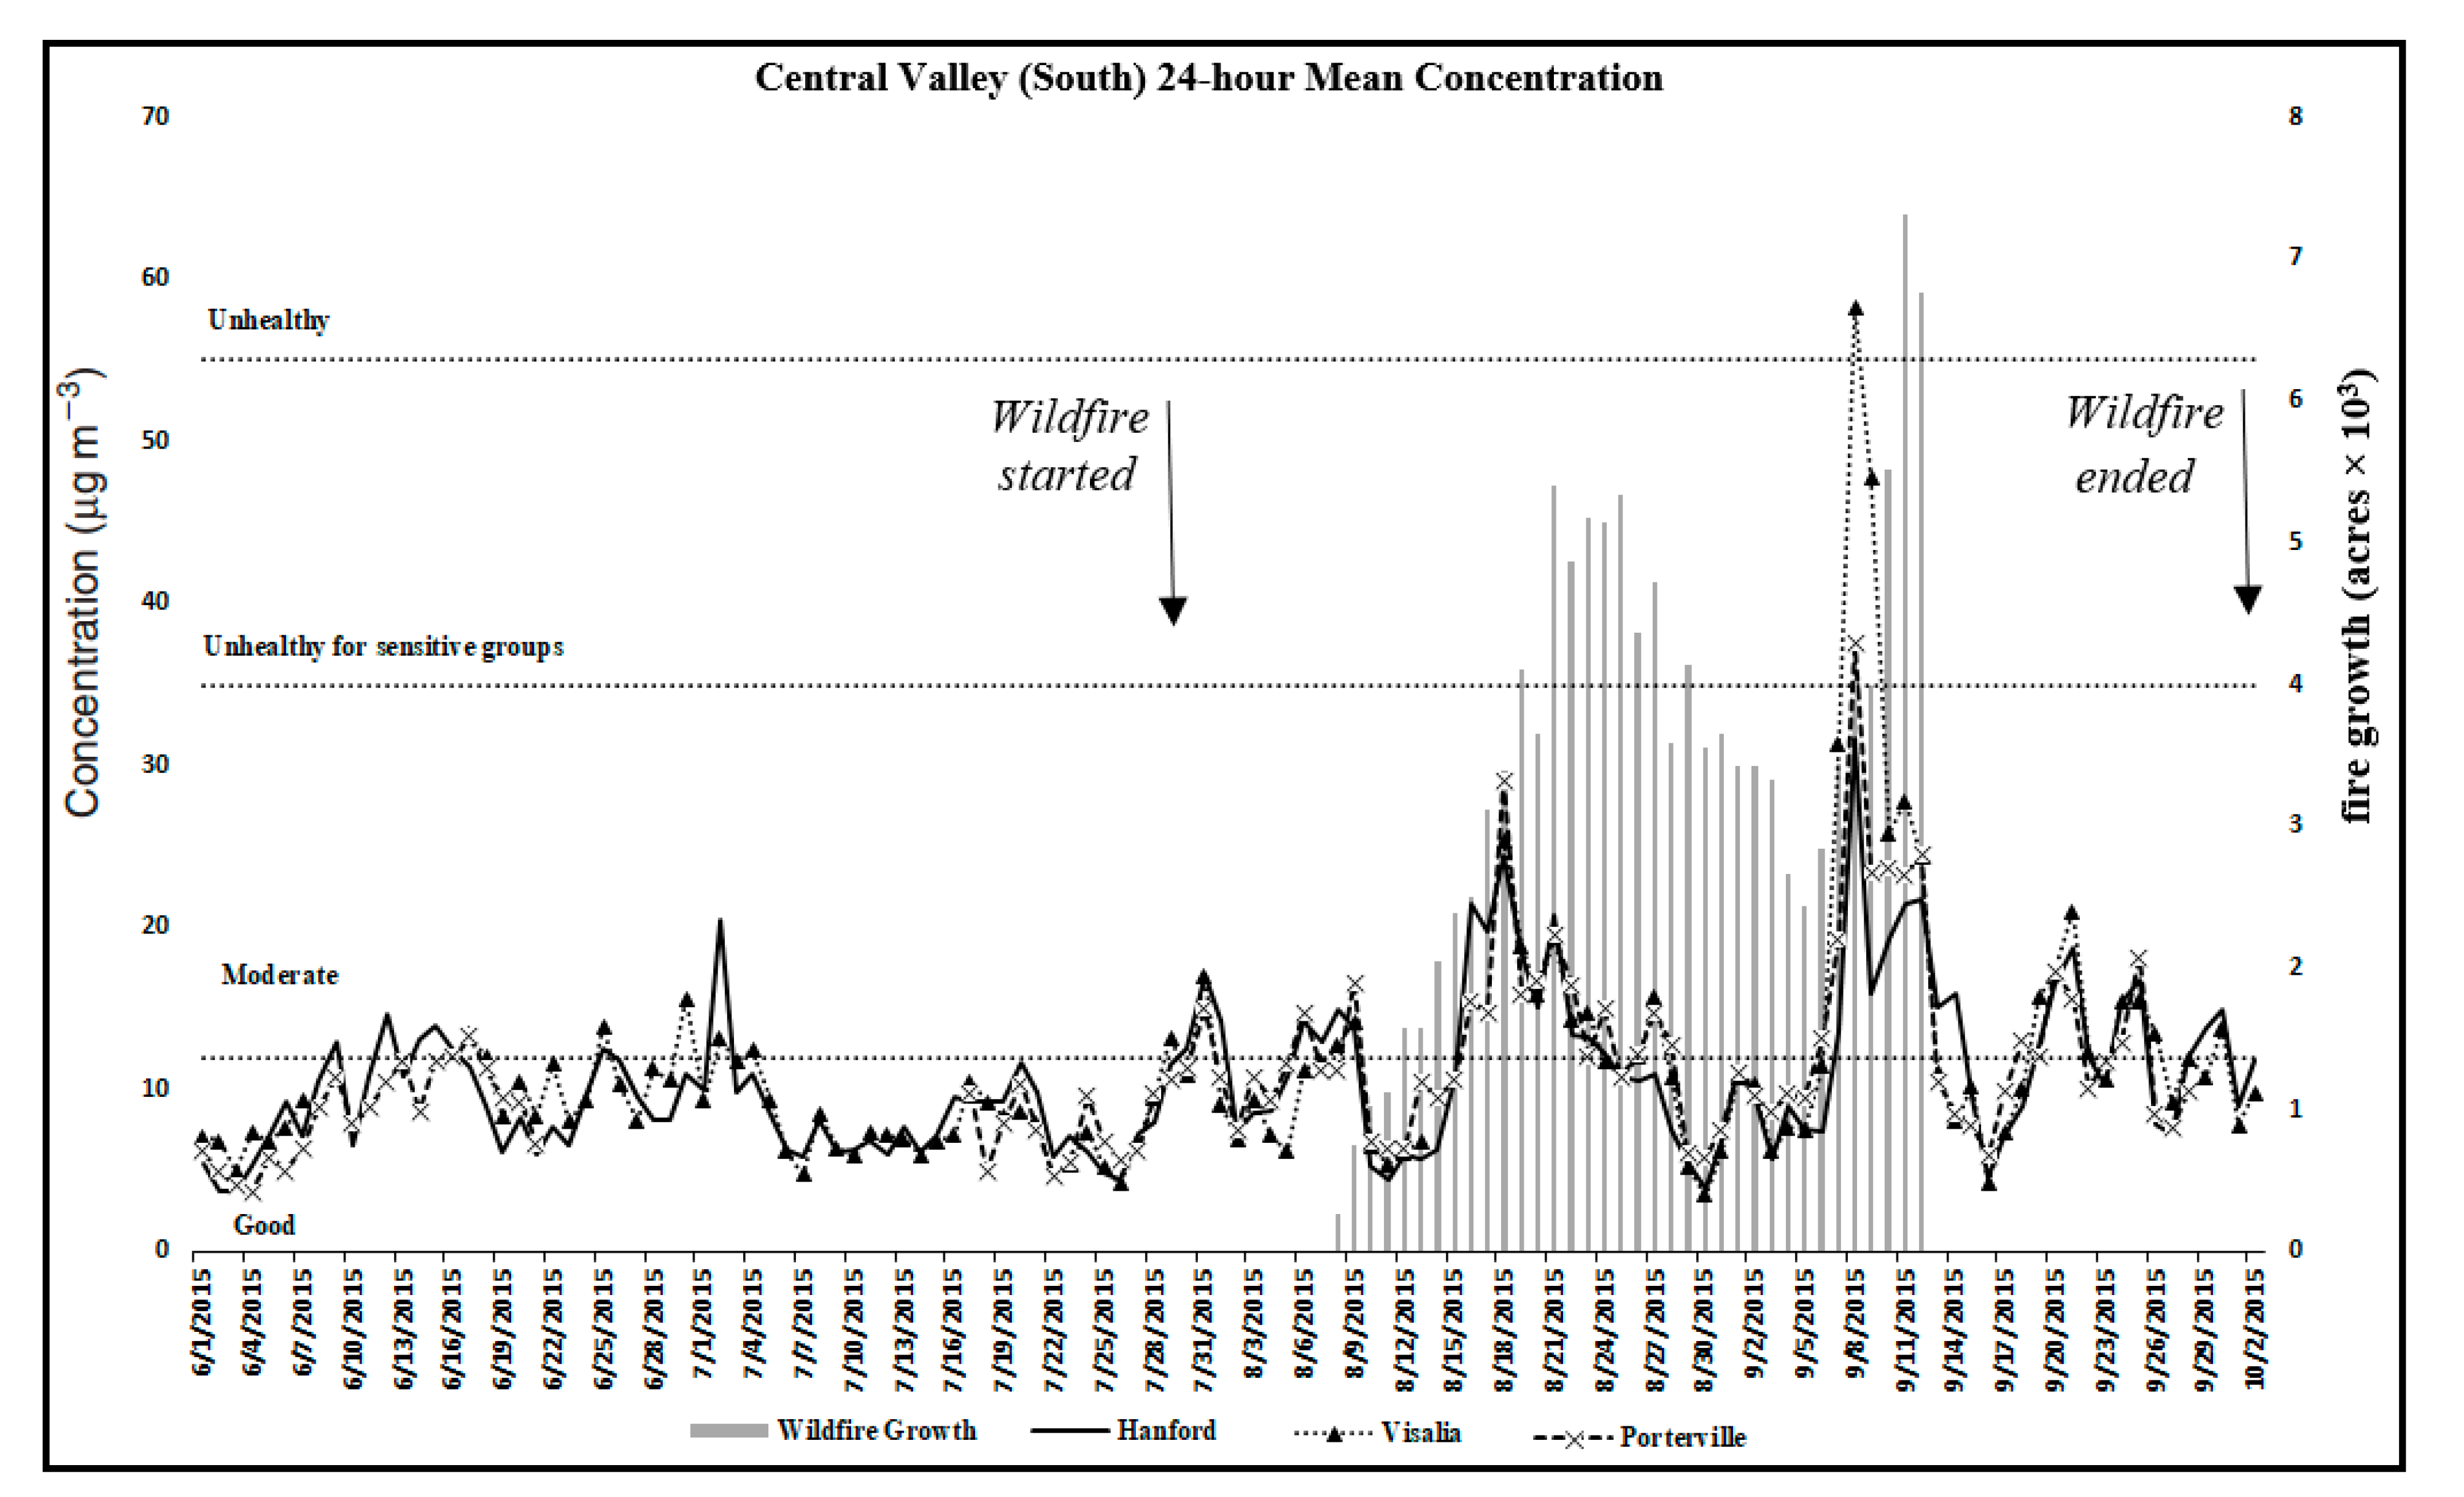
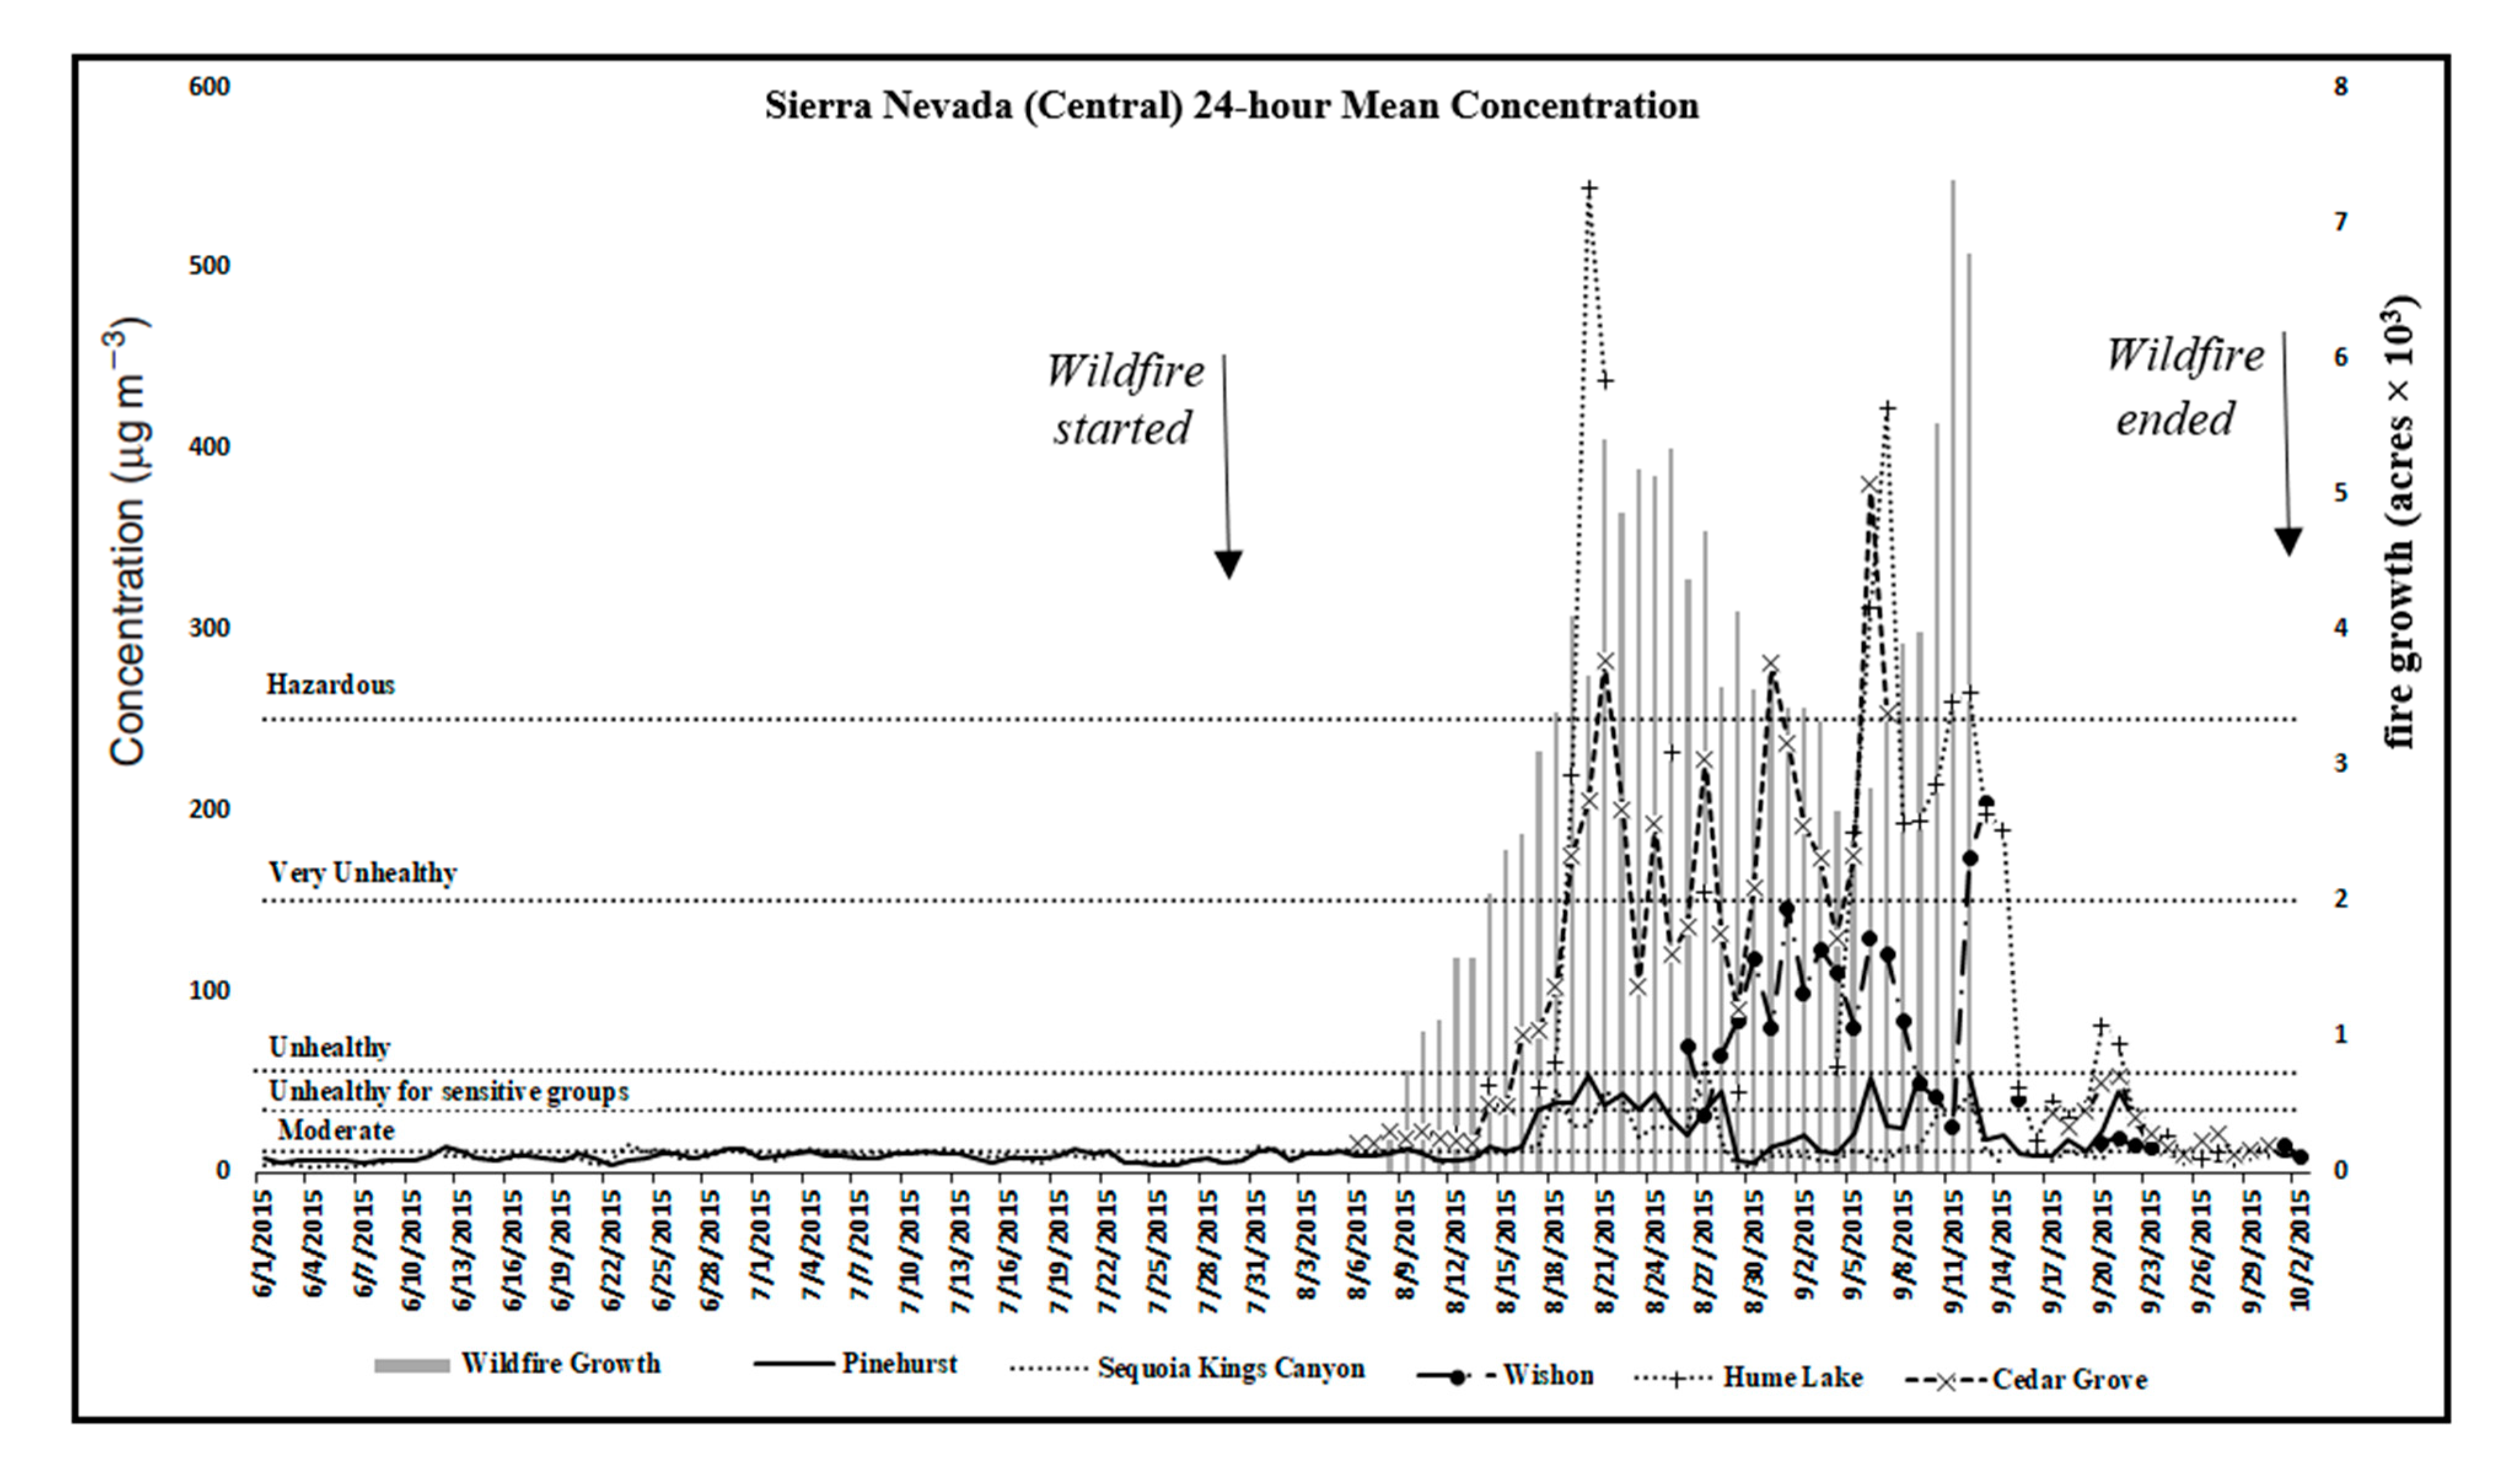
Smoke Impacts on PM2.5 Concentrations
4. Discussion
4.1. Case-Crossover Analysis
4.2. Smoke Management Implications
5. Conclusions
Supplementary Materials
Author Contributions
Funding
Data Availability Statement
Acknowledgments
Conflicts of Interest
References
- Bae, M.S.; Skiles, M.J.; Lai, A.M.; Olson, M.R.; Foy, B.D.; Schauer, J.J. Assessment of forest fire impacts on carbonaceous aerosols using complementary molecular marker receptor models at two urban locations in California’s San Joaquin Valley. Environ. Pollut. 2019, 246, 274–283. [Google Scholar] [CrossRef]
- Burley, J.D.; Bytnerowicz, A.; Buhler, M.; Zielinska, B.; Schweizer, D.; Cisneros, R.; Schilling, S.; Varela, J.C.; McDaniel, M.; Horn, M.; et al. Air quality at devils postpile national monument, sierra nevada mountains, california, USA. Aerosol Air Qual. Res. 2016, 16, 2315–2332. [Google Scholar] [CrossRef] [Green Version]
- Bytnerowicz, A.; Burley, J.D.; Cisneros, R.; Preisler, H.K.; Schilling, S.; Schweizer, D.; Ray, J.; Dulen, D.; Beck, C.; Auble, B. Surface ozone at the Devils Postpile National Monument receptor site during low and high wildland fire years. Atmos. Environ. 2013, 65, 129–141. [Google Scholar] [CrossRef]
- Cisneros, R.; Schweizer, D. The efficacy of news releases, news reports, and public nuisance complaints for determining smoke impacts to air quality from wildland fire. Air Qual. Atmos. Health 2018, 11, 423–429. [Google Scholar] [CrossRef]
- Cisneros, R.; Schweizer, D.; Tarnay, L.; Navarro, K.; Veloz, D.; Procter, C.T. Climate Change, Forest Fires, and Health in California. In Climate Change and Air Pollution; Akhtar, R., Palagiano, C., Eds.; Springer Climate: Cham, Switzerland, 2017. [Google Scholar]
- Li, Y.; Tong, D.Q.; Ngan, F.; Cohen, M.D.; Stein, A.F.; Kondragunta, S.; Zhang, X.; Ichoku, C.; Hyer, E.J.; Kahn, R.A. Ensemble PM2. 5 Forecasting During the 2018 Camp Fire Event Using the HYSPLIT Transport and Dispersion Model. J. Geophys. Res. Atmos. Atmos. 2020, 125. [Google Scholar] [CrossRef]
- Navarro, K.M.; Cisneros, R.; Schweizer, D.; Chowdhary, P.; Noth, E.M.; Balmes, J.R.; Hammond, S.K. Incident command post exposure to polycyclic aromatic hydrocarbons and particulate matter during a wildfire. J. Occup. Environ. Hyg. 2019, 16, 735–744. [Google Scholar] [CrossRef] [PubMed]
- Preisler, H.K.; Schweizer, D.; Cisneros, R.; Procter, T.; Ruminski, M.; Tarnay, L. A statistical model for determining impact of wildland fires on Particulate Matter (PM2. 5) in Central California aided by satellite imagery of smoke. Environ. Pollut. 2015, 205, 340–349. [Google Scholar] [CrossRef]
- Rooney, B.; Wang, Y.; Jiang, J.H.; Zhao, B.; Zeng, Z.; Seinfeld, J.H. Air quality impact of the Northern California Camp Fire of November 2018. Atmos. Chem. Phys. 2020, 14597–14616. [Google Scholar] [CrossRef]
- Schweizer, D.; Cisneros, R.; Navarro, K. The effectiveness of adding fire for air quality benefits challenged: A case study of increased fine particulate matter from wilderness fire smoke with more active fire management. For. Ecol. Manag. 2020, 458, 117761. [Google Scholar] [CrossRef]
- Schweizer, D.; Preisler, H.K.; Cisneros, R. Assessing relative differences in smoke exposure from prescribed, managed, and full suppression wildland fire. Air Qual. Atmos. Health 2019, 12, 87–95. [Google Scholar] [CrossRef]
- Schweizer, D.; Cisneros, R.; Buhler, M. Coarse and fine particulate matter components of wildland fire smoke at Devils Postpile National Monument, California, USA. Aerosol Air Qual. Res. 2019, 19, 1463–1470. [Google Scholar] [CrossRef]
- Schweizer, D.; Cisneros, R. Forest fire policy: Change conventional thinking of smoke management to prioritize long-term air quality and public health. Air Qual. Atmos. Health 2017, 10, 33. [Google Scholar] [CrossRef]
- Cisneros, R.; Gharibi, H.; Entwistle, M.R.; Tavallali, P.; Singhal, M.; Schweizer, D. Nitrogen dioxide and asthma emergency department visits in California, USA during cold season (November to February) of 2005 to 2015: A time-stratified case-crossover analysis. Sci. Total Environ. 2021, 754, 142089. [Google Scholar] [CrossRef] [PubMed]
- Entwistle, M.R.; Gharibi, H.; Tavallali, P.; Cisneros, R.; Schweizer, D.; Brown, P.; Ha, S. Ozone pollution and asthma emergency department visits in Fresno, CA, USA, during the warm season (June–September) of the years 2005 to 2015: A time-stratified case-crossover analysis. Air Qual. Atmos. Health 2019, 12, 661–672. [Google Scholar] [CrossRef]
- Gharibi, H.; Entwistle, M.R.; Ha, S.; Gonzalez, M.; Brown, P.; Schweizer, D.; Cisneros, R. Ozone pollution and asthma emergency department visits in the Central Valley, California, USA, during June to September of 2015: A time stratified case-crossover analysis. J. Asthma 2018, 9, 1–12. [Google Scholar] [CrossRef] [PubMed]
- Gharibi, H.; Entwistle, M.R.; Schweizer, D.; Tavallali, P.; Cisneros, R. The association between 1,3-dichloropropene and asthma emergency department visits in California, USA from 2005 to 2011: A bidirectional-symmetric case crossover study. J. Asthma 2019, 2, 1–9. [Google Scholar] [CrossRef] [PubMed]
- Gharibi, H.; Entwistle, M.R.; Schweizer, D.; Tavallali, P.; Thao, C.; Cisneros, R. Methyl-Bromide and asthma emergency department visits in California, USA from 2005 to 2011. J. Asthma 2019, 31, 1–10. [Google Scholar] [CrossRef] [PubMed]
- Lee, T.S.; Falter, K.; Meyer, P.; Mott, J.; Gwynn, C. Risk factors associated with clinic visits during the 1999 forest fires near the Hoopa Valley Indian Reservation, California, USA. Int. J. Environ. Health Res. 2009, 19, 315–327. [Google Scholar] [CrossRef]
- Kunzli, N.; Avol, E.; Wu, J.; Gauderman, W.J.; Rappaport, E.; Millstein, J.; Bennion, J.; McConnell, R.; Gilliland, F.D.; Berhane, K.; et al. Health Effects of the 2003 Southern California Wildfires on Children. Am. J. Respir. Crit. Care Med. 2006, 174, 1221–1228. [Google Scholar] [CrossRef] [Green Version]
- Mirabelli, M.C.; Kunli, N.; Avol, E.; Gilliland, F.D.; Gauderman, J.W.; McConnel, R.; Peters, J.M. Respiratory symptoms following wildfire smoke exposure: Airway size as a susceptibility factor. Epidemiology 2009, 20, 451–459. [Google Scholar] [CrossRef] [Green Version]
- Delfino, R.J.; Brummel, S.; Wu, J.; Stern, H.; Ostro, B.; Lipsett, M.; Winer, A.; Street, D.H.; Zhang, L.; Tjoa, T.; et al. The relationship of respiratory and cardiovascular hospital admissions to the southern California wildfires of 2003. J. Occup. Environ. Med. 2009, 66, 189–197. [Google Scholar] [CrossRef] [PubMed] [Green Version]
- Rappold, A.G.; Stone, S.L.; Cascio, W.E.; Neas, L.M.; Kilaru, V.J.; Carraway, M.S.; Szykman, J.J.; Isling, A.; Cleve, W.E.; Meredith, J.T.; et al. Peat bog wildfire smoke exposure in rural North Carolina is associated with cardiopulmonary emergency department visits assessed through syndromic surveillance. Environ. Health Perspect. 2011, 119, 1415–1420. [Google Scholar] [CrossRef] [PubMed] [Green Version]
- Navarro, K.M.; Cisneros, R.; O’Neill, S.M.; Schweizer, D.; Larkin, N.K.; Balmes, J.R. Air-Quality Impacts and Intake Fraction of PM2.5 during the 2013 Rim Megafire. Environ. Sci. Technol. 2016, 50, 11965–11973. [Google Scholar] [CrossRef] [PubMed]
- Schweizer, D.; Cisneros, R. Wildland fire management and air quality in the southern Sierra Nevada: Using the Lion Fire as a case study with a multi-year perspective on PM2.5 impacts and fire policy. J. Environ. Manag. 2014, 144, 265–278. [Google Scholar] [CrossRef] [PubMed]
- Cisneros, R.; Schweizer, D.; Zhong, S.; Hammond, K.; Perez, M.A.; Guo, Q.; Traina, S.; Bytnerowicz, A.; Bennett, D. Analysing the effects of the 2002 McNally fire on air quality in the San Joaquin Valley and southern Sierra Nevada, California. Int. J. Wildland Fire 2012, 21, 1065–1075. [Google Scholar] [CrossRef]
- Schweizer, D.; Cisneros, R.; Shaw, G. A comparative analysis of temporary and permanent beta attenuation monitors: The importance of understanding data and equipment limitations when creating PM2.5 air quality health advisories. Atmos. Pollut. Res. 2016, 7, 865–875. [Google Scholar] [CrossRef] [Green Version]
- Schweizer, D.; Cisneros, R.; Traina, S.; Ghezzehei, T.A.; Shaw, G. Using National Ambient Air Quality Standards for fine particulate matter to assess regional wildland fire smoke and air quality management. J. Environ. Manag. 2017, 201, 345–356. [Google Scholar] [CrossRef]


| Sampling Stations | Pre-Wildfire (1st June to 30th July) | During-Wildfire (31st July to 2nd October) | ||||||||||||
|---|---|---|---|---|---|---|---|---|---|---|---|---|---|---|
| N | Mean (SD) | Min | Percentile | Max | N | Mean (SD) | Min | Percentile | Max | |||||
| 25 | 50 | 75 | 25 | 50 | 75 | |||||||||
| Sierra Nevada (North) | ||||||||||||||
| North-Fork | 41 | 14 (12) | 6 | 8 | 11 | 12 | 50 | 64 | 19 (14) | 5 | 8 | 12 | 24 | 55 |
| Yosemite | 60 | 7 (3) | 3 | 5 | 7 | 9 | 16 | 64 | 17 (27) | 2 | 7 | 9 | 12 | 165 |
| Prather | 2 | 11 (0.2) | 11 | 11 | 11 | 11 | 11 | 64 | 18 (16) | 4 | 9 | 11 | 22 | 99 |
| Trimmer | 0 | NA | NA | NA | NA | NA | NA | 52 | 24 (19) | 4 | 11 | 15 | 33 | 89 |
| Sierra Nevada (Central) | ||||||||||||||
| Ash Mountain | 58 | 9 (3) | 3 | 6 | 8 | 11 | 16 | 51 | 16 (12) | 3 | 8 | 12 | 19 | 62 |
| Pinehurst | 60 | 8 (2) | 4 | 6 | 8 | 10 | 13 | 62 | 21 (17) | 6 | 10 | 11 | 30 | 53 |
| Wishon | 0 | NA | NA | NA | NA | NA | NA | 28 | 70 (54) | 9 | 18 | 67 | 114 | 204 |
| Cedar Grove | 0 | NA | NA | NA | NA | NA | NA | 47 | 99 (94) | 10 | 19 | 53 | 175 | 381 |
| Hume Lake | 0 | NA | NA | NA | NA | NA | NA | 37 | 128 (138) | 7 | 22 | 58 | 198 | 545 |
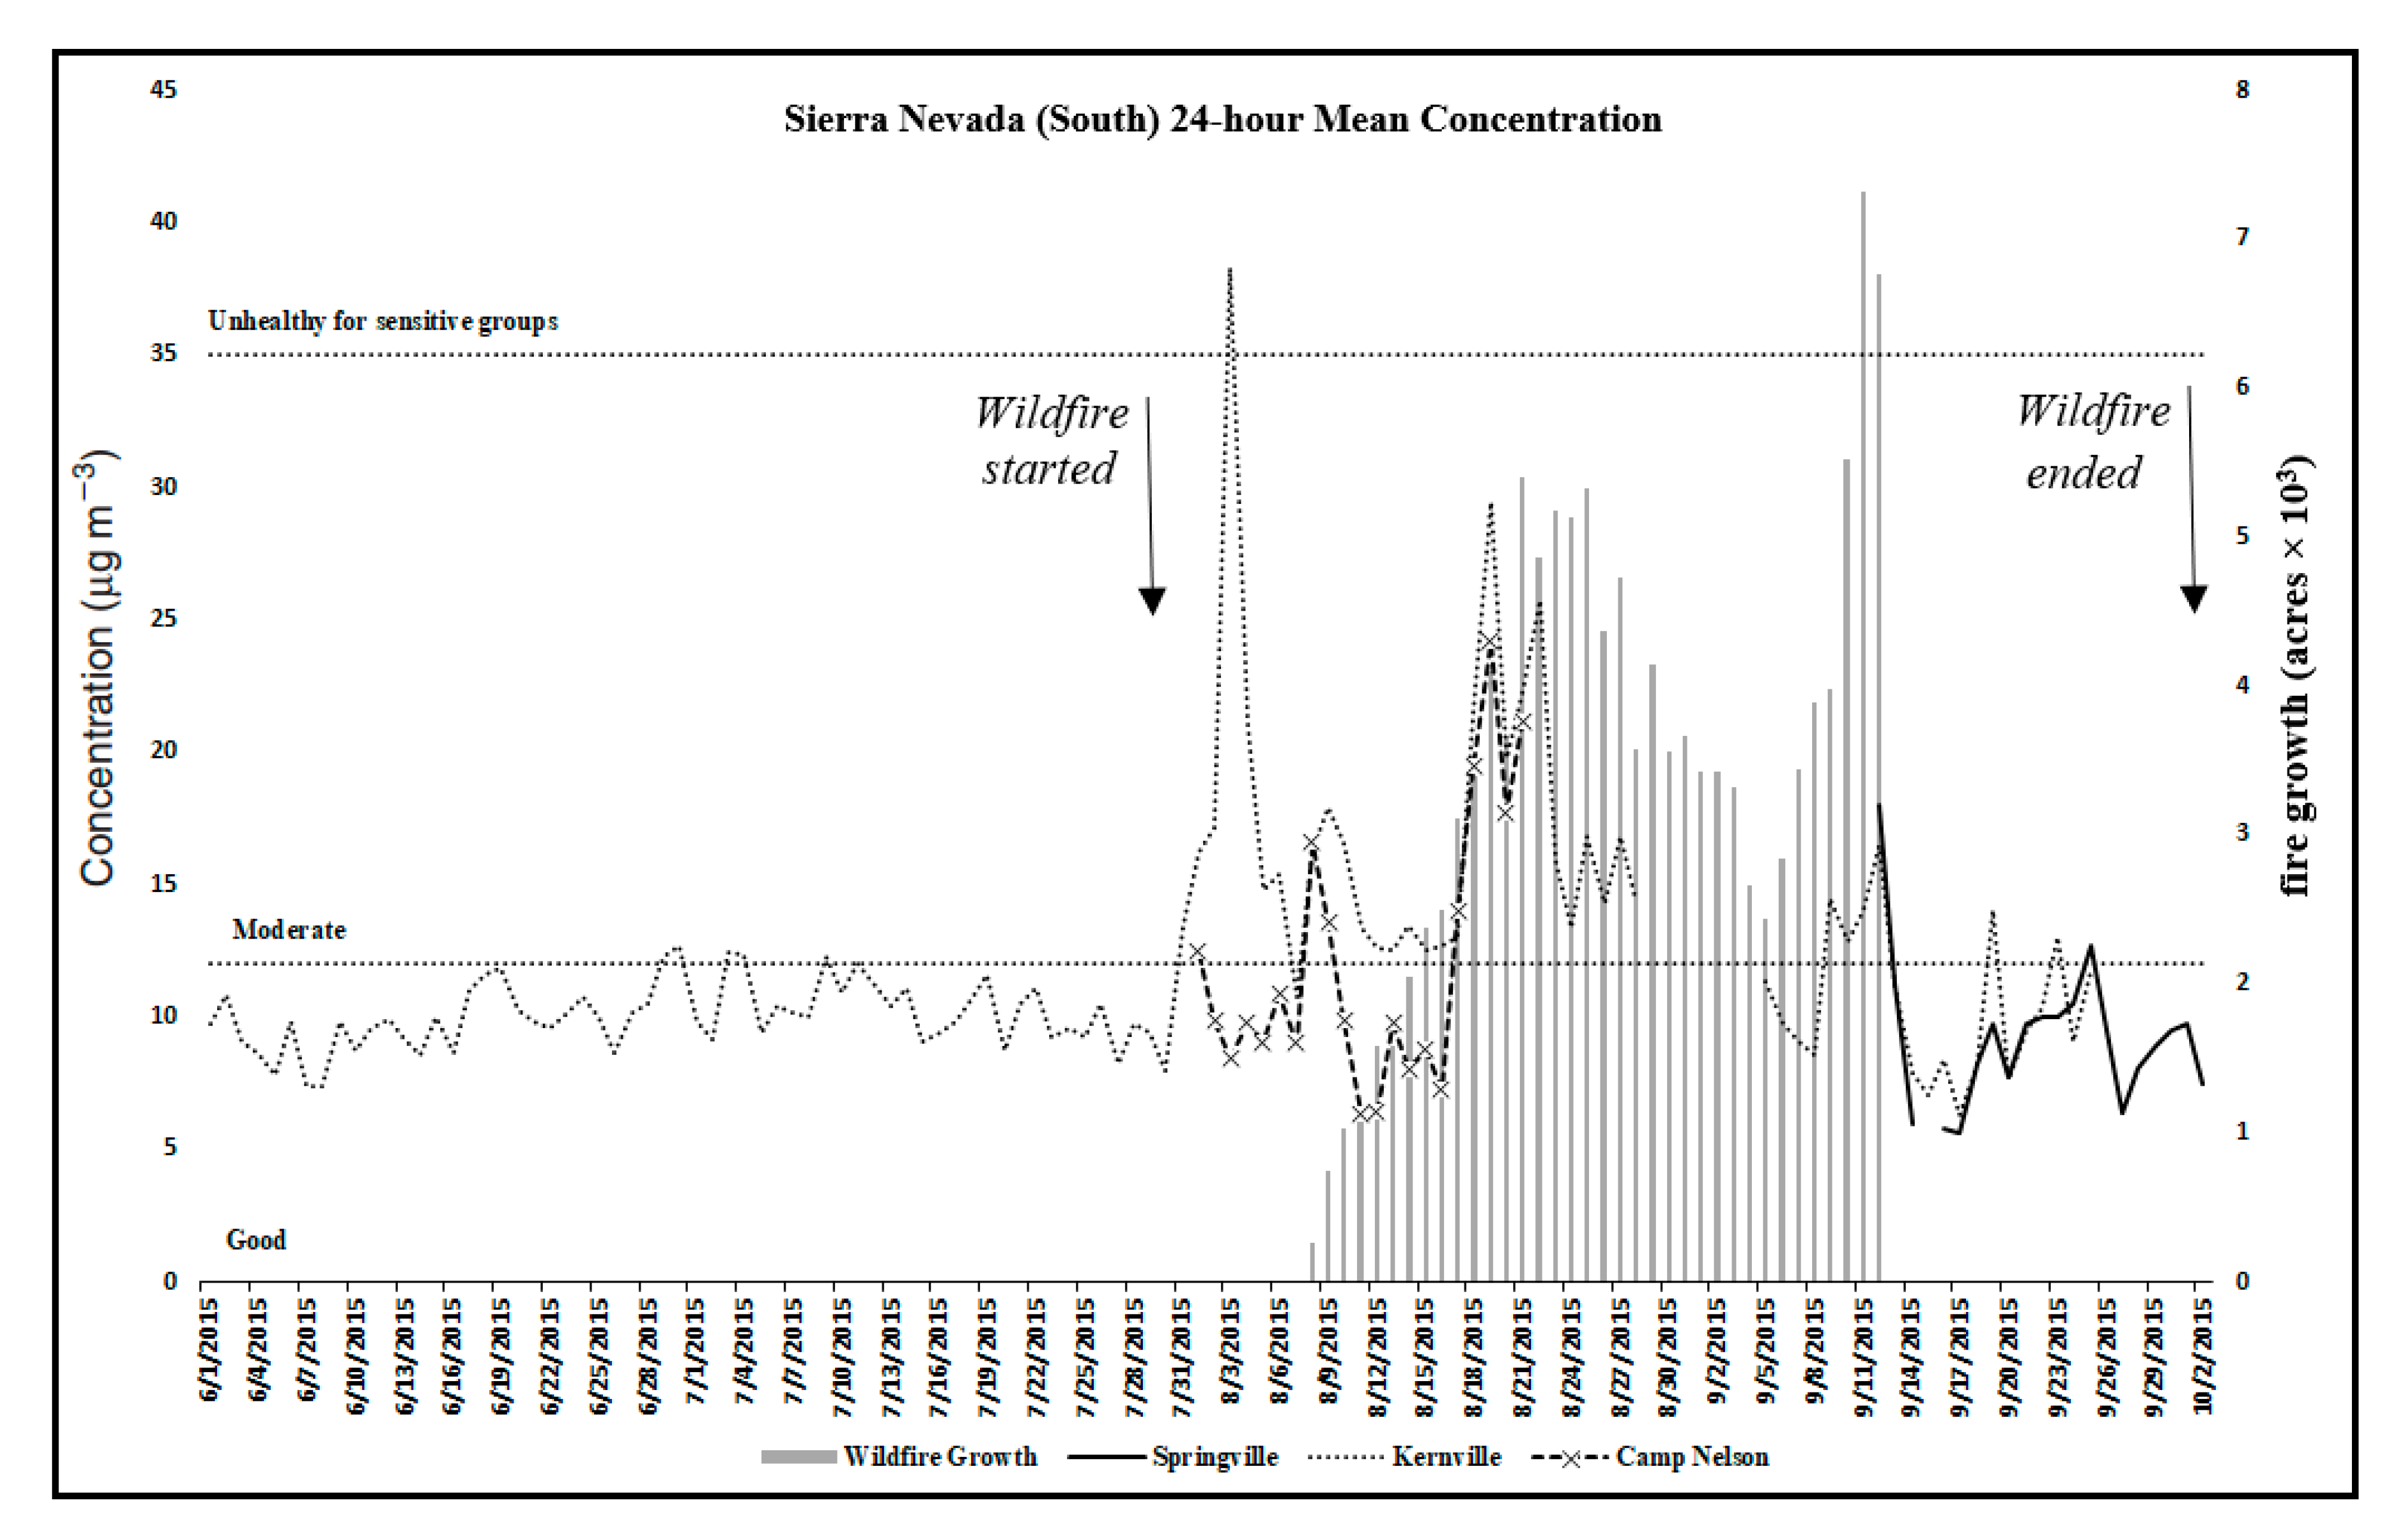
| Sierra Nevada (South) | ||||||||||||||
| Springville | 0 | NA | NA | NA | NA | NA | NA | 20 | 9 (3) | 6 | 8 | 9 | 10 | 18 |
| Kernville | 60 | 10 (1) | 7 | 9 | 10 | 11 | 13 | 52 | 14 (6) | 6 | 10 | 13 | 16 | 38 |
| Camp Nelson | 0 | NA | NA | NA | NA | NA | NA | 21 | 12 (5) | 5 | 8 | 11 | 15 | 27 |
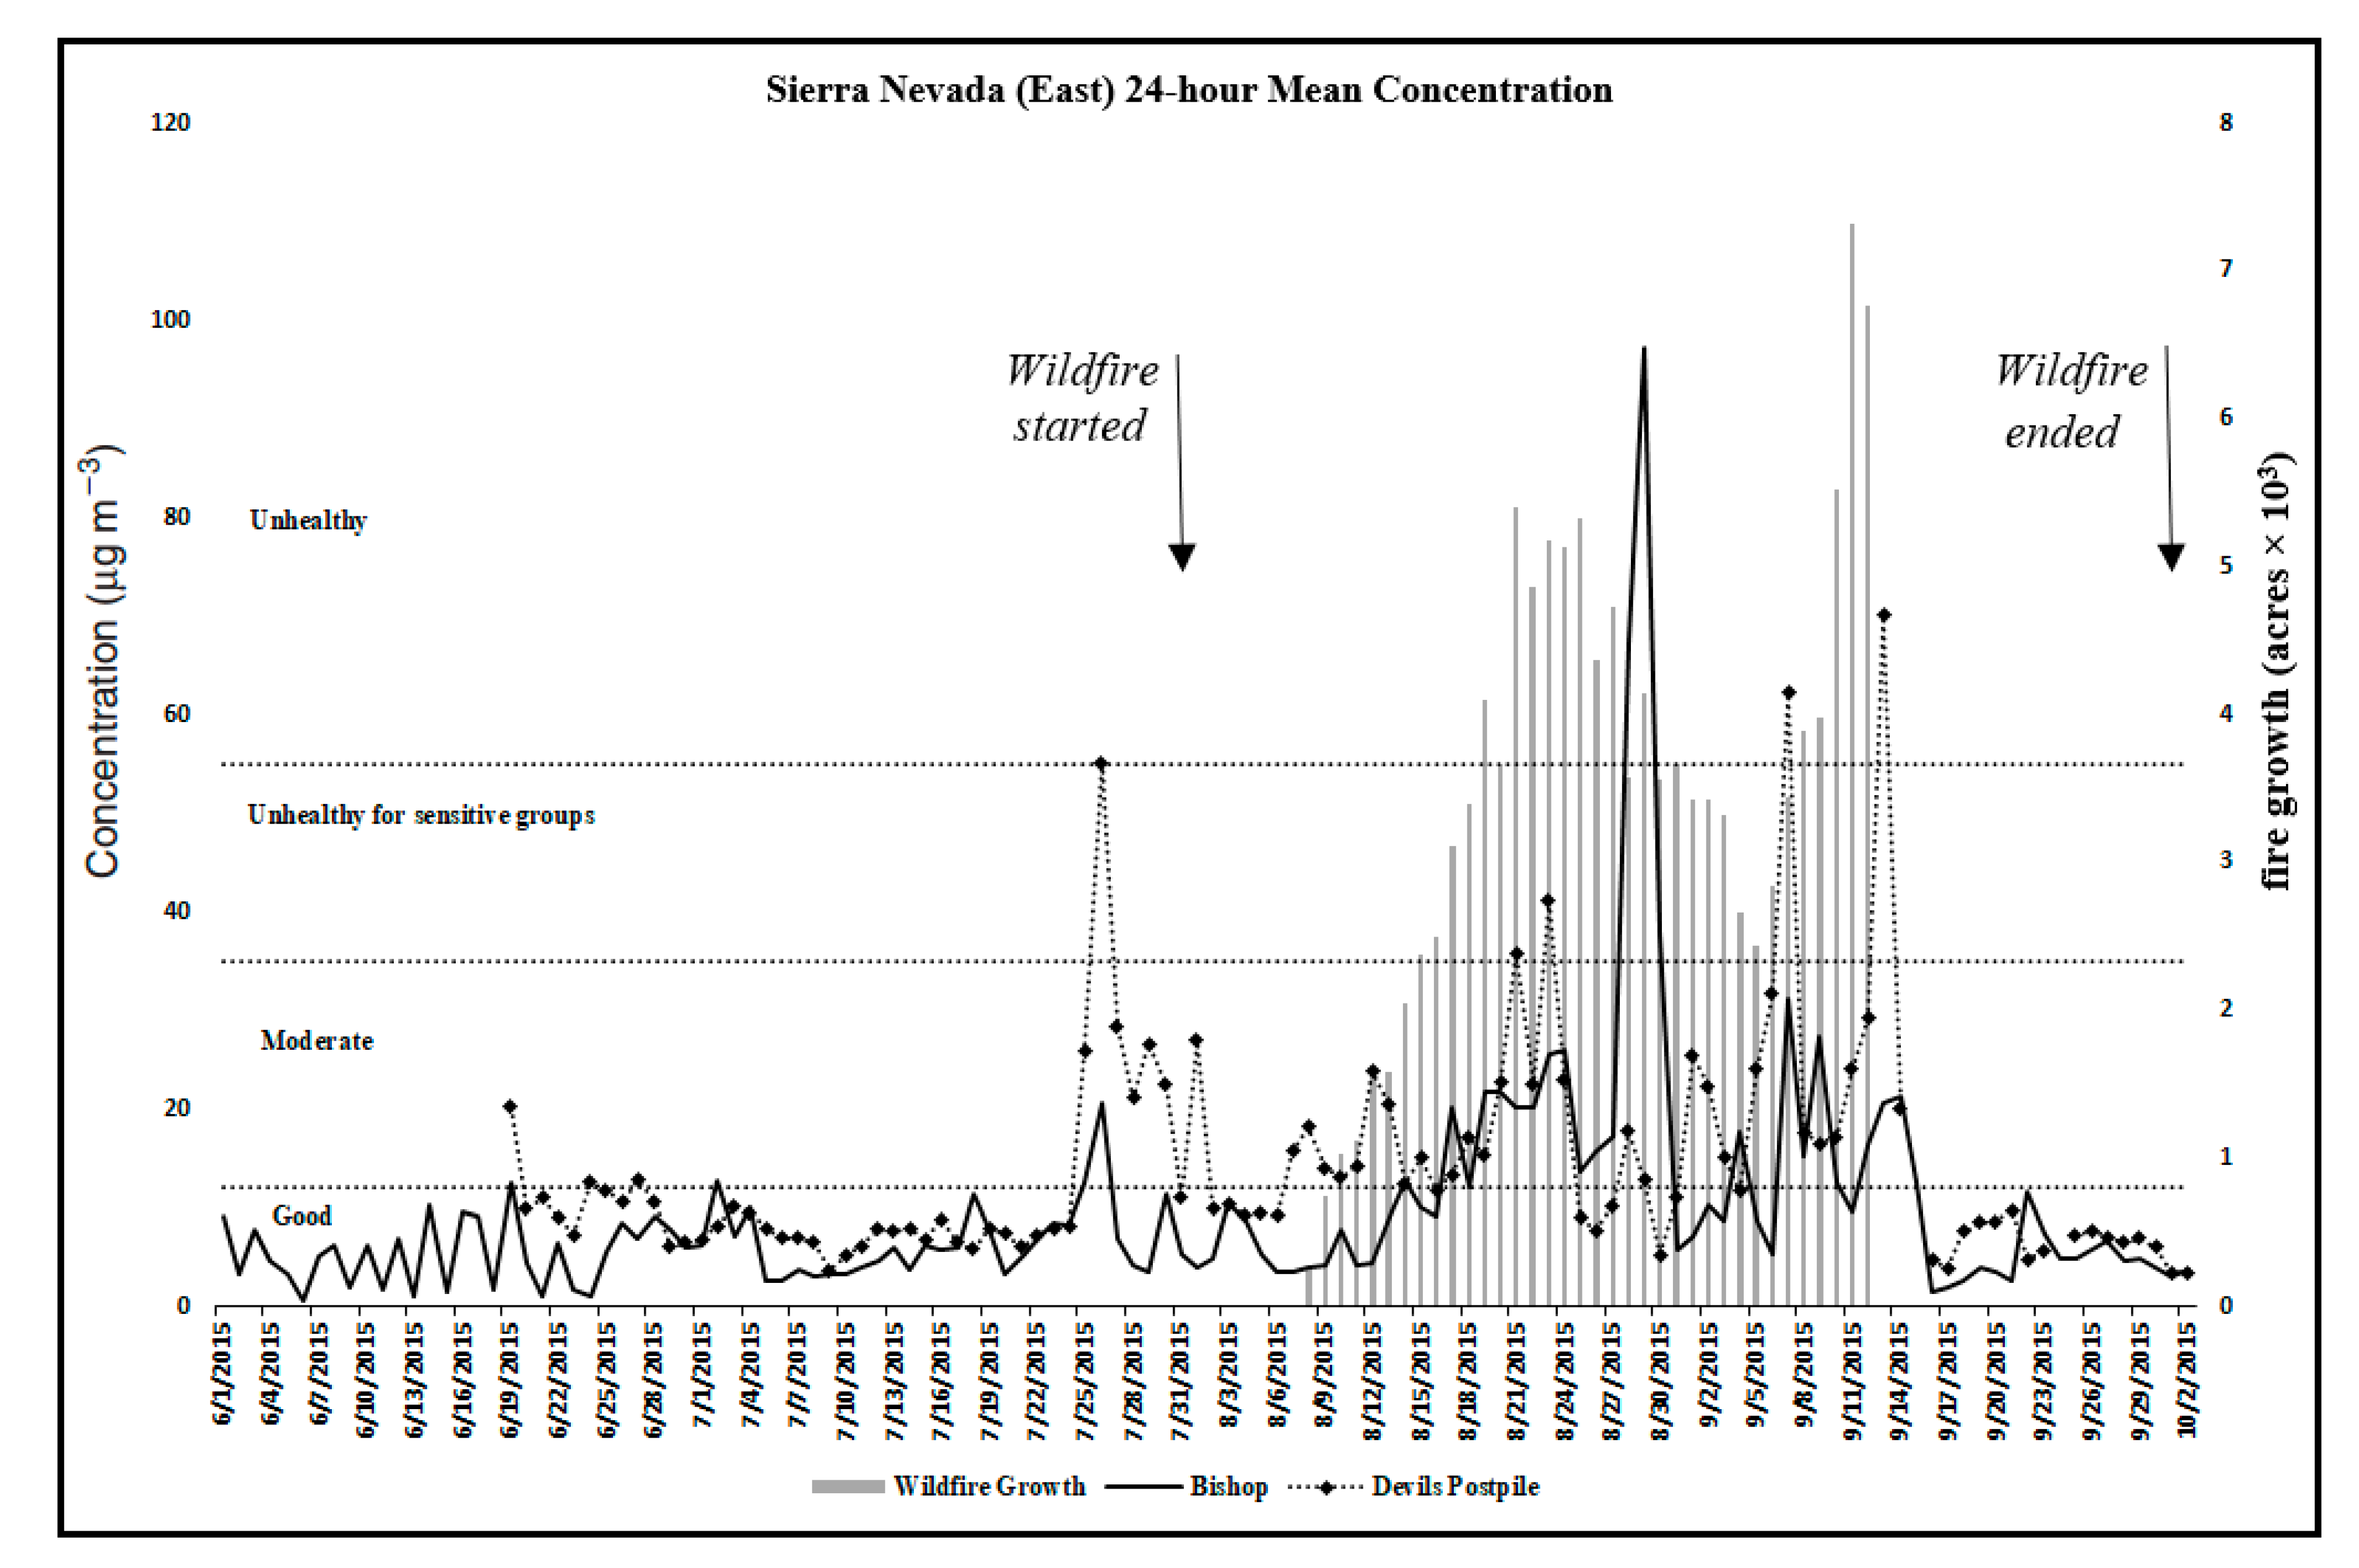
| Sierra Nevada (East) | ||||||||||||||
| Bishop | 60 | 6 (3) | 1 | 3 | 6 | 8 | 20 | 64 | 14 (17) | 2 | 5 | 9 | 17 | 97 |
| Devils Postpile | 42 | 11 (9) | 4 | 7 | 8 | 11 | 55 | 62 | 15 (12) | 3 | 8 | 12 | 20 | 70 |
| Lone Pine | 60 | 7 (2) | 4 | 6 | 7 | 8 | 12 | 64 | 9 (5) | 4 | 6 | 6 | 12 | 27 |
| Central Valley (North) | ||||||||||||||
| Clovis | 60 | 13 (4) | 6 | 10 | 12 | 16 | 21 | 64 | 15 (6) | 4 | 11 | 14 | 19 | 34 |
| Fresno | 60 | 8 (3) | 4 | 6 | 8 | 10 | 15 | 60 | 11 (5) | 3 | 7 | 10 | 13 | 25 |
| Madera | 60 | 11 (2) | 6 | 9 | 11 | 13 | 18 | 64 | 11 (5) | 3 | 7 | 11 | 15 | 27 |
| Merced | 50 | 9 (3) | 4 | 7 | 8 | 11 | 16 | 64 | 12 (6) | 4 | 7 | 10 | 15 | 40 |
| Central Valley (South) | ||||||||||||||
| Hanford | 60 | 9 (3) | 4 | 6 | 8 | 11 | 20 | 64 | 12 (6) | 4 | 7 | 12 | 15 | 32 |
| Porterville | 35 | 8 (3) | 4 | 6 | 9 | 10 | 15 | 60 | 13 (6) | 6 | 9 | 11 | 16 | 37 |
| Visalia | 51 | 9 (3) | 4 | 7 | 8 | 10 | 17 | 60 | 14 (10) | 3 | 8 | 11 | 15 | 58 |
Publisher’s Note: MDPI stays neutral with regard to jurisdictional claims in published maps and institutional affiliations. |
© 2021 by the authors. Licensee MDPI, Basel, Switzerland. This article is an open access article distributed under the terms and conditions of the Creative Commons Attribution (CC BY) license (https://creativecommons.org/licenses/by/4.0/).
Share and Cite
Cisneros, R.; Schweizer, D.; Gharibi, H.; Tavallali, P.; Veloz, D.; Navarro, K. Air Quality Impacts during the 2015 Rough Fire in Areas Surrounding the Sierra Nevada, California. Fire 2021, 4, 31. https://0-doi-org.brum.beds.ac.uk/10.3390/fire4030031
Cisneros R, Schweizer D, Gharibi H, Tavallali P, Veloz D, Navarro K. Air Quality Impacts during the 2015 Rough Fire in Areas Surrounding the Sierra Nevada, California. Fire. 2021; 4(3):31. https://0-doi-org.brum.beds.ac.uk/10.3390/fire4030031
Chicago/Turabian StyleCisneros, Ricardo, Donald Schweizer, Hamed Gharibi, Pooya Tavallali, David Veloz, and Kathleen Navarro. 2021. "Air Quality Impacts during the 2015 Rough Fire in Areas Surrounding the Sierra Nevada, California" Fire 4, no. 3: 31. https://0-doi-org.brum.beds.ac.uk/10.3390/fire4030031