
Hotspot Analysis of Structure Fires in Urban Agglomeration: A Case of Nagpur City, India


Department of Architecture and Planning, Visvesvaraya National Institute of Technology, Nagpur 440010, India
*
Author to whom correspondence should be addressed.
Fire 2021, 4(3), 38; https://0-doi-org.brum.beds.ac.uk/10.3390/fire4030038
Submission received: 23 June 2021
/
Revised: 17 July 2021
/
Accepted: 19 July 2021
/
Published: 21 July 2021
(This article belongs to the Special Issue Performance-Based Design in Structural Fire Engineering)
Abstract
:Fire Service is the fundamental civic service to protect citizens from irrecoverable, heavy losses of lives and property. Hotspot analysis of structure fires is essential to estimate people and property at risk. Hotspot analysis for the peak period of last decade, using a GIS-based spatial analyst and statistical techniques through the Kernel Density Estimation (KDE) and Getis-Ord Gi* with Inverse Distance Weighted (IDW) interpolation is performed, revealing fire risk zones at the city ward micro level. Using remote sensing, outputs of hotspot analysis are integrated with the built environment of Land Use Land Cover (LULC) to quantify the accurate built-up areas and population density of identified fire risk zones. KDE delineates 34 wards as hotspots, while Getis-Ord Gi* delineates 17 wards within the KDE hotspot, the central core areas having the highest built-up and population density. A temporal analysis reveals the maximum fires on Thursday during the hot afternoon hours from 12 noon to 5 p.m. The study outputs help decision makers for effective fire prevention and protection by deploying immediate resource allocations and proactive planning reassuring sustainable urban development. Furthermore, updating the requirement of the National Disaster Management Authority (NDMA) to build urban resilient infrastructure in accord with the Smart City Mission.
1. Introduction
Structure fires are the fires involving the structural components of various types of residential, commercial, educational, or industrial buildings. Structure fires have substantial consequences adversely affecting urban sustainable development threatening life safety, property protection, continuity of operations, environmental protection, and heritage conservation. As per the International Association of Fire and Rescue Services, India has accounted the average fire rate as 1.18 per 1000 inhabitants per year with an average fire death of 1.04 per 100 fires for a period of five years from 2014 to 2018 [1]. The Indian Risk Survey Report 2018 has listed fire as the third of the top five identified risks, with the increased vulnerability causing tremendous losses to physical assets over the last three years, and in 2019, fire risk was on the tenth rank. Hence, fire is of major concern [2]. The National Crime Records Bureau 2019 data of India has accounted for a total of 11,037 accidental fires, with 69% of these fires being in the structures of schools or commercial, residential, and governmental buildings, and a total of 10,915 deaths, with 62% in structure fires, and a total of 441 persons injured, with 78% in structure fires [3]. Hence, it is evident that structure fires have an adverse impact on the sustainability of an urban built environment, affecting and disrupting the urban functionality with heavy losses of property and lives [4]. Therefore, the fire incidence pattern of the urban agglomeration is to be assessed delineating the hotspot area along with statistically significant fire risk areas for effective and efficient mitigation [5].
Urban agglomeration is an inevitable phenomenon in the process of urbanization sheltering nearly 68% of the Earth’s population by 2050 and with its center of gravity in the Asian cities of China and India [6,7]. Mckinsey and company have predicted the probability of Indian urban agglomeration with an intense rise in population density accounting for nearly thirteen cities with a population of more than four million and a million-plus population in sixty-eight cities by 2030 [8]. With the rapid urban agglomeration, cities are leading to have compact development and expansion by urban sprawl development with land-use transformations resulting in a multitude of challenges by increased and new fire risks [9,10,11]. In addition, the increasing demography increases the vulnerability of fire risk, demanding a significant availability of fire service provisions for efficient and reliable fire safety management [12]. As the urban growth develops, the provision of fire service facilities becomes a priority to cope up with the alarming demand for fire safety [13] and has to be strengthened by comprehensive and accurate information for balanced decision making with an emergent response [14]. Therefore, understanding the fire incidence pattern with its severity, particularly structure fires in the context of sustainable urban development, is of great significance for the implementation through systematic risk assessment by mitigating measures [15]. The planning of preparedness of fire service on the basis of risk assessment can improve the emergency response and thus enhance the efficiency of fire service. It is, therefore, recognized as an essential part of fire prevention and signs to assess the fire risk zones, delineating hotspots based on the historical fire incidences to understand the fire incidence pattern at the specific geographical location, as the geographical characteristics vary globally.
Geospatial tools comprising Geographic Information Systems (GIS) and Remote Sensing (RS) are powerful tools to evaluate the spatial fire distribution patterns integrating the temporal data [16] and are widely adopted as an analysis system for urban infrastructures [17]. The spatial and temporal patterns of structure fires are of interest, integrating the potential dimensions of space and time [15,16,17,18,19,20,21]. The fire distribution often has a wide variation over space and time, and it is critical to categorize fire distributing under uniform or random patterns with the changing challenges of the urban agglomerating space [22,23]. The fire distribution pattern has a close association with human activities and the surrounding built environment, as well as the demographic and socioeconomic factors [11,24]. Built environments with high population densities reflect high human activities with an increased risk of structure fires [15,20]. Fire risk has been researched in residential fires associated with varied socioeconomic aspects [25,26,27,28]. The impact of fire incidences was revealed with high risk to very young children and very old residents of Canada [29]. Structure fire studies have analyzed the various causes of fire incidents, integrating time in months and hours [30]. The temporal data analyses of fire incidences of previous studies in Australia revealed maximum fire incidence frequencies on weekdays and school holidays, establishing the close association between fire incidences and the socioeconomic conditions of the urban areas [20,28], with an increased rate over the pace of time [11]. RS integrated with GIS has many applications in the various fields of weather, forestry, agriculture, surface changes, biodiversity, and many more [30]. In the urban planning context for fire services, RS technologies can be used for detecting land use and land cover (LULC) with active fires (hotspots) determining the physical properties of land with accuracy and precision [11,31,32], quantifying the built-up land for allocation of fire service resources and enhancing the efficiency of emergency responses with sustainability.
Previous studies quantified the fire risk correlating the various aspects of the socioeconomic characteristics of neighborhoods in developed countries at macro-level spatial units such as countries, states, and census tracks [15,16,17,18,33]. In South Asia, Indian cities have undergone a rapid decadal transformation of the built environment, changing the urban landscape with social structures accommodating the increasing population and resulting in the urban agglomeration of a developing country [34,35], which are comparatively less researched. The fire incidence pattern in urban areas at the micro-level of urban agglomeration in developed countries is a research topic of great interest and an emergent need as well [24,36]. Research on fire severity quantifying the losses to assess the impacts of fire and identifying the fire risk areas for strategic interventions has become increasingly popular in recent years [37]. Population density as well can be the final output and target for resource allocation.
Hotspot analysis determines the dense concentration of events within a limited geographical area. Numerous statistical models such as descriptive statistics, Poisson regression, binomial regression, and Bayesian network models for hotspot analysis were adopted in varied disciplines, dealing with the randomness of events in space and time [38,39,40]. Being statistical, these methods do not consider the spatial characteristics of the events. GIS tools have advanced techniques to estimate and quantify hotspots identifying the high concentration of events to detect areas with active fires inferring as high fire risk zones, referred to as a hotspot, represented by cartographic maps for visualization [41]. In addition, Kernel Density Estimation (KDE) and Hotspot Analysis (Getis-Ord Gi*) HA(GOG*) with Inverse Distance Weighted (IDW) interpolation are widely applied in varied disciplines of geography, traffic safety management, and crime [42,43,44].
In India, a developing country, cities have undergone fundamental transformations in an urban landscape and social structures, and the process of urbanization has increased fire incidences and intensified consequences [2,35]. Fire service is a part of the responsibilities of Urban Local Bodies (ULB) to provide fire safety of urban areas [45] and plays a significant role in the success of all schemes by the Government of India carried out for the betterment of citizen’s life and infrastructures integrating sustainable urbanization in the cities such Atal Mission for Rejuvenation and Urban Transformation (AMRUT) [46], Pradhan Mantri Awas Yojna (PMAY) [47], Urban Livelihood Mission, and Heritage City Development and Augmentation Yojna (HRIDAY) [48]. The National Disaster Management Authority (NDMA) has listed above 95% deficiencies in fire services throughout the country in 2012, with updating requirements of later date, which is still awaiting [49]. The spatial accessibility of fire vehicles for emergency response was a major consideration for assessing the deficiencies. Thus, the questions raised for considering the fire incidence pattern of urban areas for updating and strengthening the deficiencies are as follows:
- Are fire incidences evenly distributed?
- Are the fire risk areas identified and quantified?
- Are the fire occurrences analyzed on the temporal scale?
- Are the causes of fire incidences assessed for the identified fire risk areas?
- Are urban and human activities responsible for fire occurrences? How so?
Therefore, to address the research questions, the objective of the study is hotspot analysis delineating the fire risk zones to understand the fire pattern on a spatial and temporal scale with cause-wise analysis on historical fire incidences. The results of the study are to be integrated in the reassessment and restructuring of the fire service building community in order to achieve a resilient and sustainable built environment. The continual reassessment and restructuring of fire service provisions are essential in reducing fire severity in terms of fire deaths, injuries, and property damage [50]. Resource allocations for fire service involve a heavy budget investment and hence a long-term peak period has to be assessed when updating the requirements. The study aims to assess structure fire patterns in the urban agglomeration for a decadal period of historical fire incidences from 2011 to 2020, delineating the hotspot areas with the quantification of the built-up areas and population density under significant fire risk zones for effective and efficient mitigation with proactive planning during the peak period. The study has the potential to inform policy makers of other ULBs of similar cities to reassess and restructure fire services, integrating Smart City Mission, assuring sustainability [51], overlapping with the Sustainable Development Goals (SDG-11) [52] to develop a sustainable city, state, and nation.
2. Materials and Methods
2.1. Study Area
The urban agglomeration of Nagpur city of Maharashtra state is centrally located in India with a zero-mile location at 21°9′ N and 79°5′ E coordinates. The population of the city is 2.45 million as per the 2011 census and is ranked as the third most populated urban centre in the state and thirteenth in the country, with an average population density of 10,873 persons per km2, covering an area of 225.08 km2, merging two census towns of Narsala and Hudkeshwar [53], and subdivided into 138 wards as shown in Figure 1. Nagpur has a tropical savannah climate (Aw in Koppen climate classification) with dry conditions throughout the year, where summer temperatures intensify up to 47.8 °C, making it the hottest place in India [54] and suitable for the escalation of the fire frequency. The winter temperature declines to 10° to 12 °C and has the average annual rainfall of 1161.54 mm [55].
Structures refer to the urban functional confined spaces that have a significant impact on human life and daily activities [56]. According to the Census 2011, 594,272 buildings were housed for various purposes covering 52% of the built up land area of the city, expanding to 73% in 2020. Out of these buildings, 82.24% are used as a residence; 2.79% for residence-cum-other use; 8.60% for shops and offices; 0.31% for schools and colleges, 0.26% for hotels, lodges, guest houses, etc.; 0.48% as hospital, dispensary, etc.; 0.90% as factory, workshop, work shed, etc.; 0.58% as a place of worship; and 3.85% as other non-residential use.
Census 2011 has accounted for the structures of the residences and residence-cum-other by proportional building materials listed under roof, walls, and floors. The material of walls comprised a maximum of burnt bricks with 65.5%, followed with concrete—11.2%, Mud/unburnt—10.6, stoned packed—4.3%, stone not packed—3%, grass/thatch—2.2%, wood—1.3%, plastic/polythene—0.5%, and any other—0.2%. Material of roofs comprised a maximum of concrete with 62.6%, followed with galvanized iron/metals/asbestos—12.9%, machine-made 11.8%, hand-made—5.7%, stone/slate—2.5%, grass/thatch—2%, burnt brick—1.1%, plastic/polythene—1%, and any other—0.3%. Material of floors comprised a maximum of cement with 42.5%, followed by mosaic/floor tiles—40.3%, mud—8.6%, stone—6%, burnt brick—1.5%, any other material—0.9%, and wood/bamboo—0.2%.
2.1.1. Data and Sources
Nagpur Municipal Corporation (NMC) administers the urban centre of Nagpur, and the administrative data with regard to ward limits and the population was provided by NMC in kml format. The decadal population growth rate for 2011 was 19.3% and a growth of 20.9% is projected for 2021, 21.2% for 2031, and 20.7% for 2041 [55]. The yearly population size from 2011 to 2020 was procured from World Urbanization Prospects 2018 [57] to analyze on a yearly basis.
Fire incidence data for the period of a decade from 2011 to 2020 was procured from the Fire Service Department of NMC on a yearly, monthly, and daily basis, revealing the rise of fire incidents with the population growth. The maximum incidences were observed in the hottest month of May with a highest z-score value of 2.01 > 1.96 at a 95% confidence level as shown in Figure 2, indicating the impact of climatic conditions on fire incidence frequency. Therefore, the dataset for the hottest month of May with maximum fire occurrences is researched cumulatively from 2011 to 2020 for hotspot analysis of structure fires.
Structure fire incident data of the city were considered for the study, with a cumulative count of 570 fire events for the hottest month of May with maximum fire frequency from 2011 to 2020. The daily fire incidence data was in regional language in the daily call register, including the addresses, date, call time, cause of the fire, and brief of occupancy type for each fire event (such as house fire, shop fire, hospital fire, etc., for structure fires). For the study, structure fires are grouped and classified by occupancy type based on the National Building Code of India (NBCI), 2016 [58] and the proportion of each structure fire reveals that the Residential fires have the highest proportion of 48% with next mercantile with 32%, while industrial of 7%, business of 4%, assembly of 3%, storage of 3%, educational of 2%, and institutional of 2%. The material of construction was not mentioned in the register and hence the Census 2011 building material data is considered with the maximum of framed structures with concrete and masonry.
2.1.2. Land Cover Data
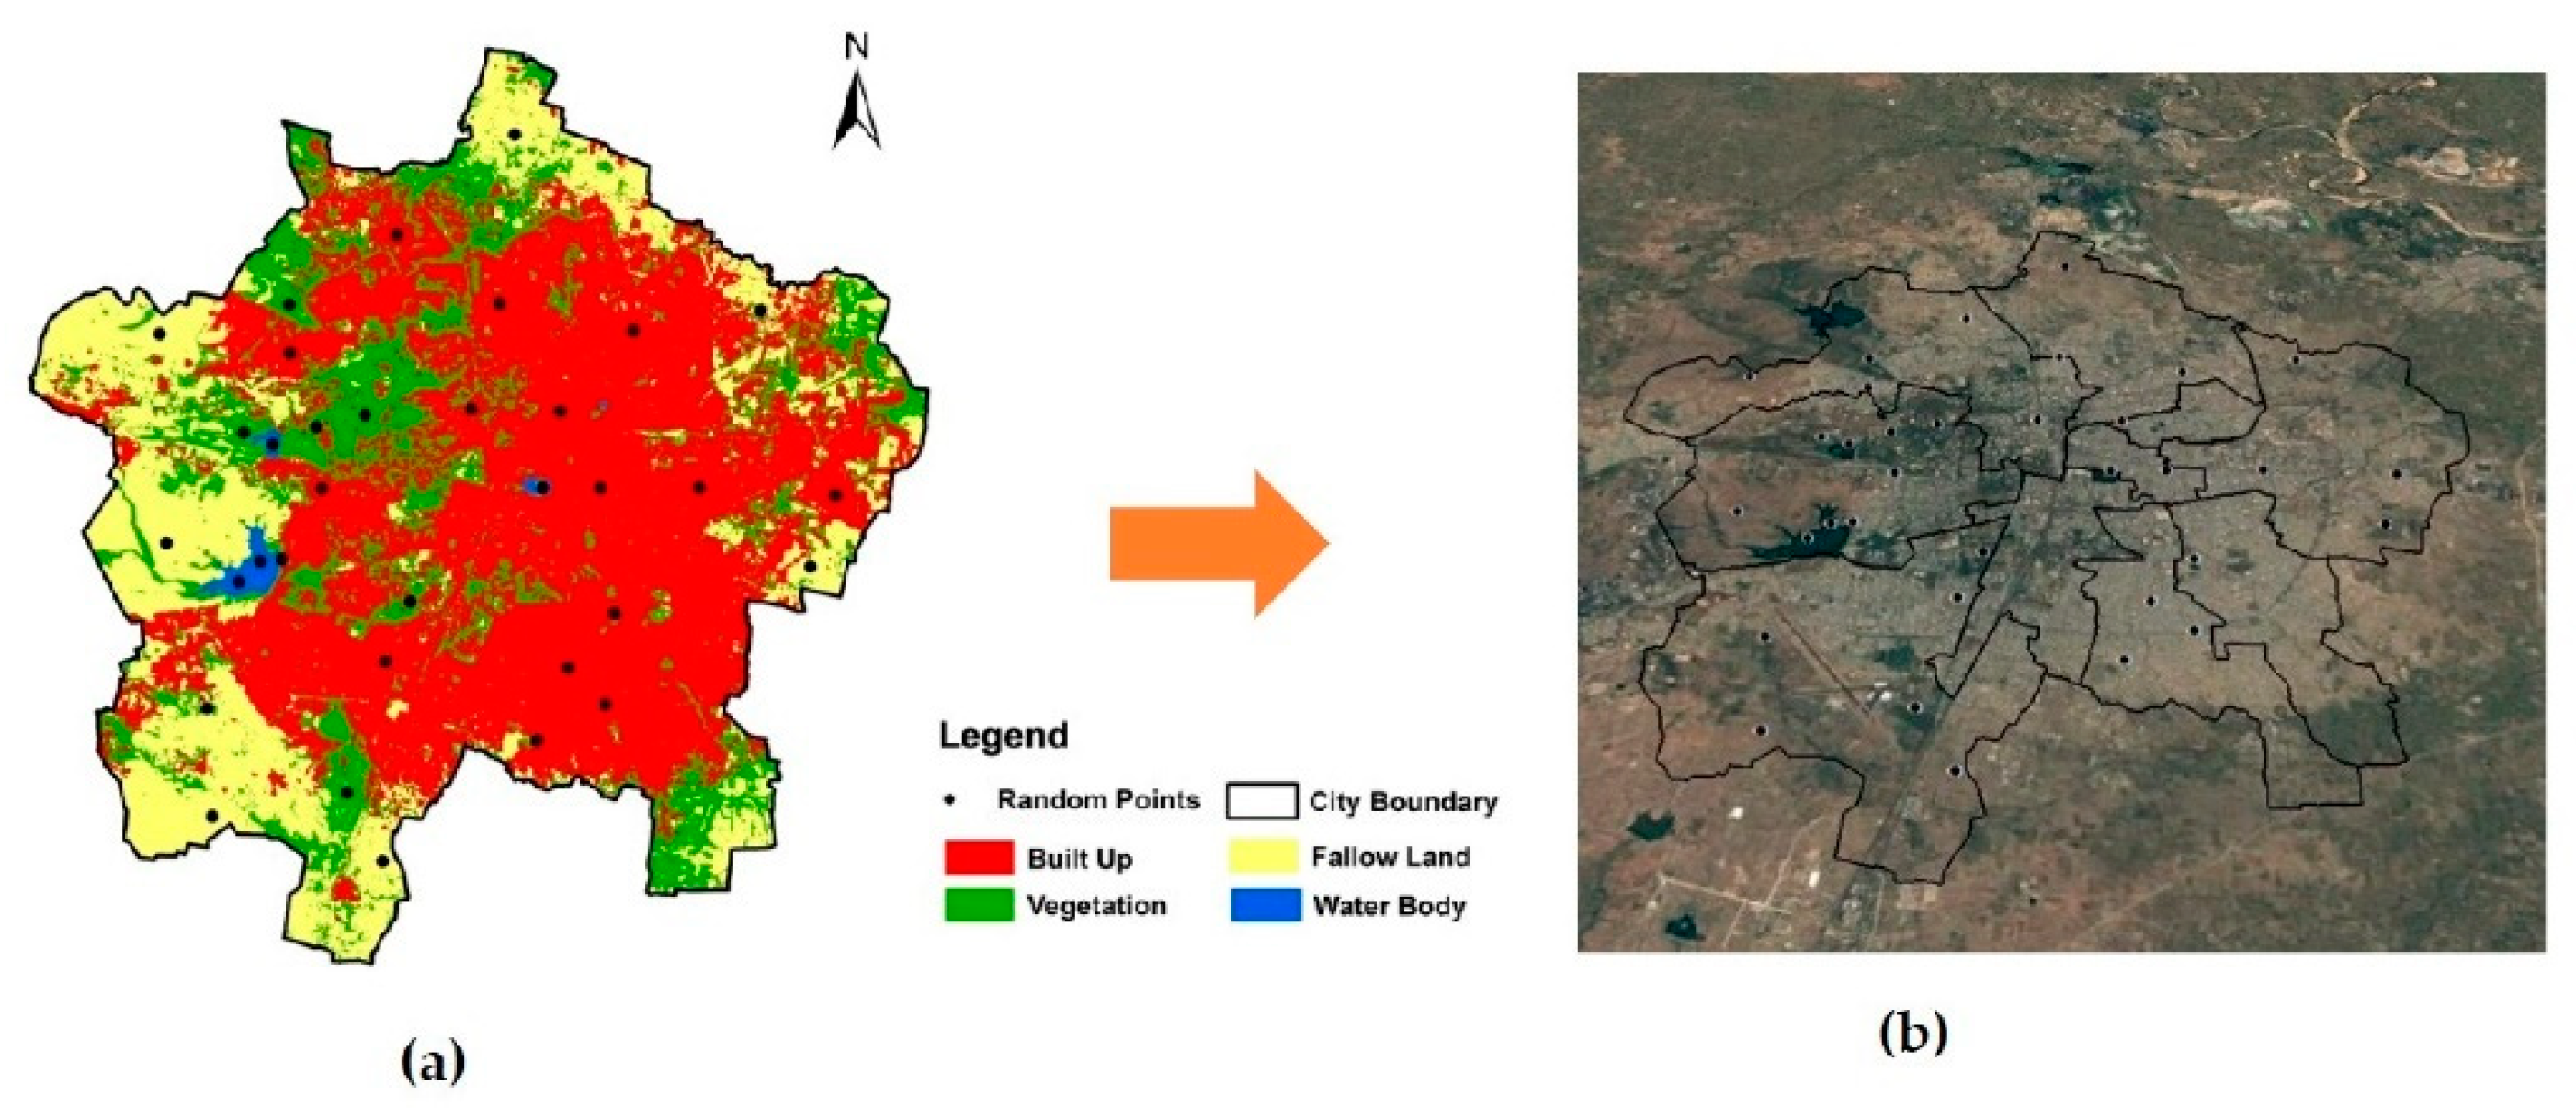
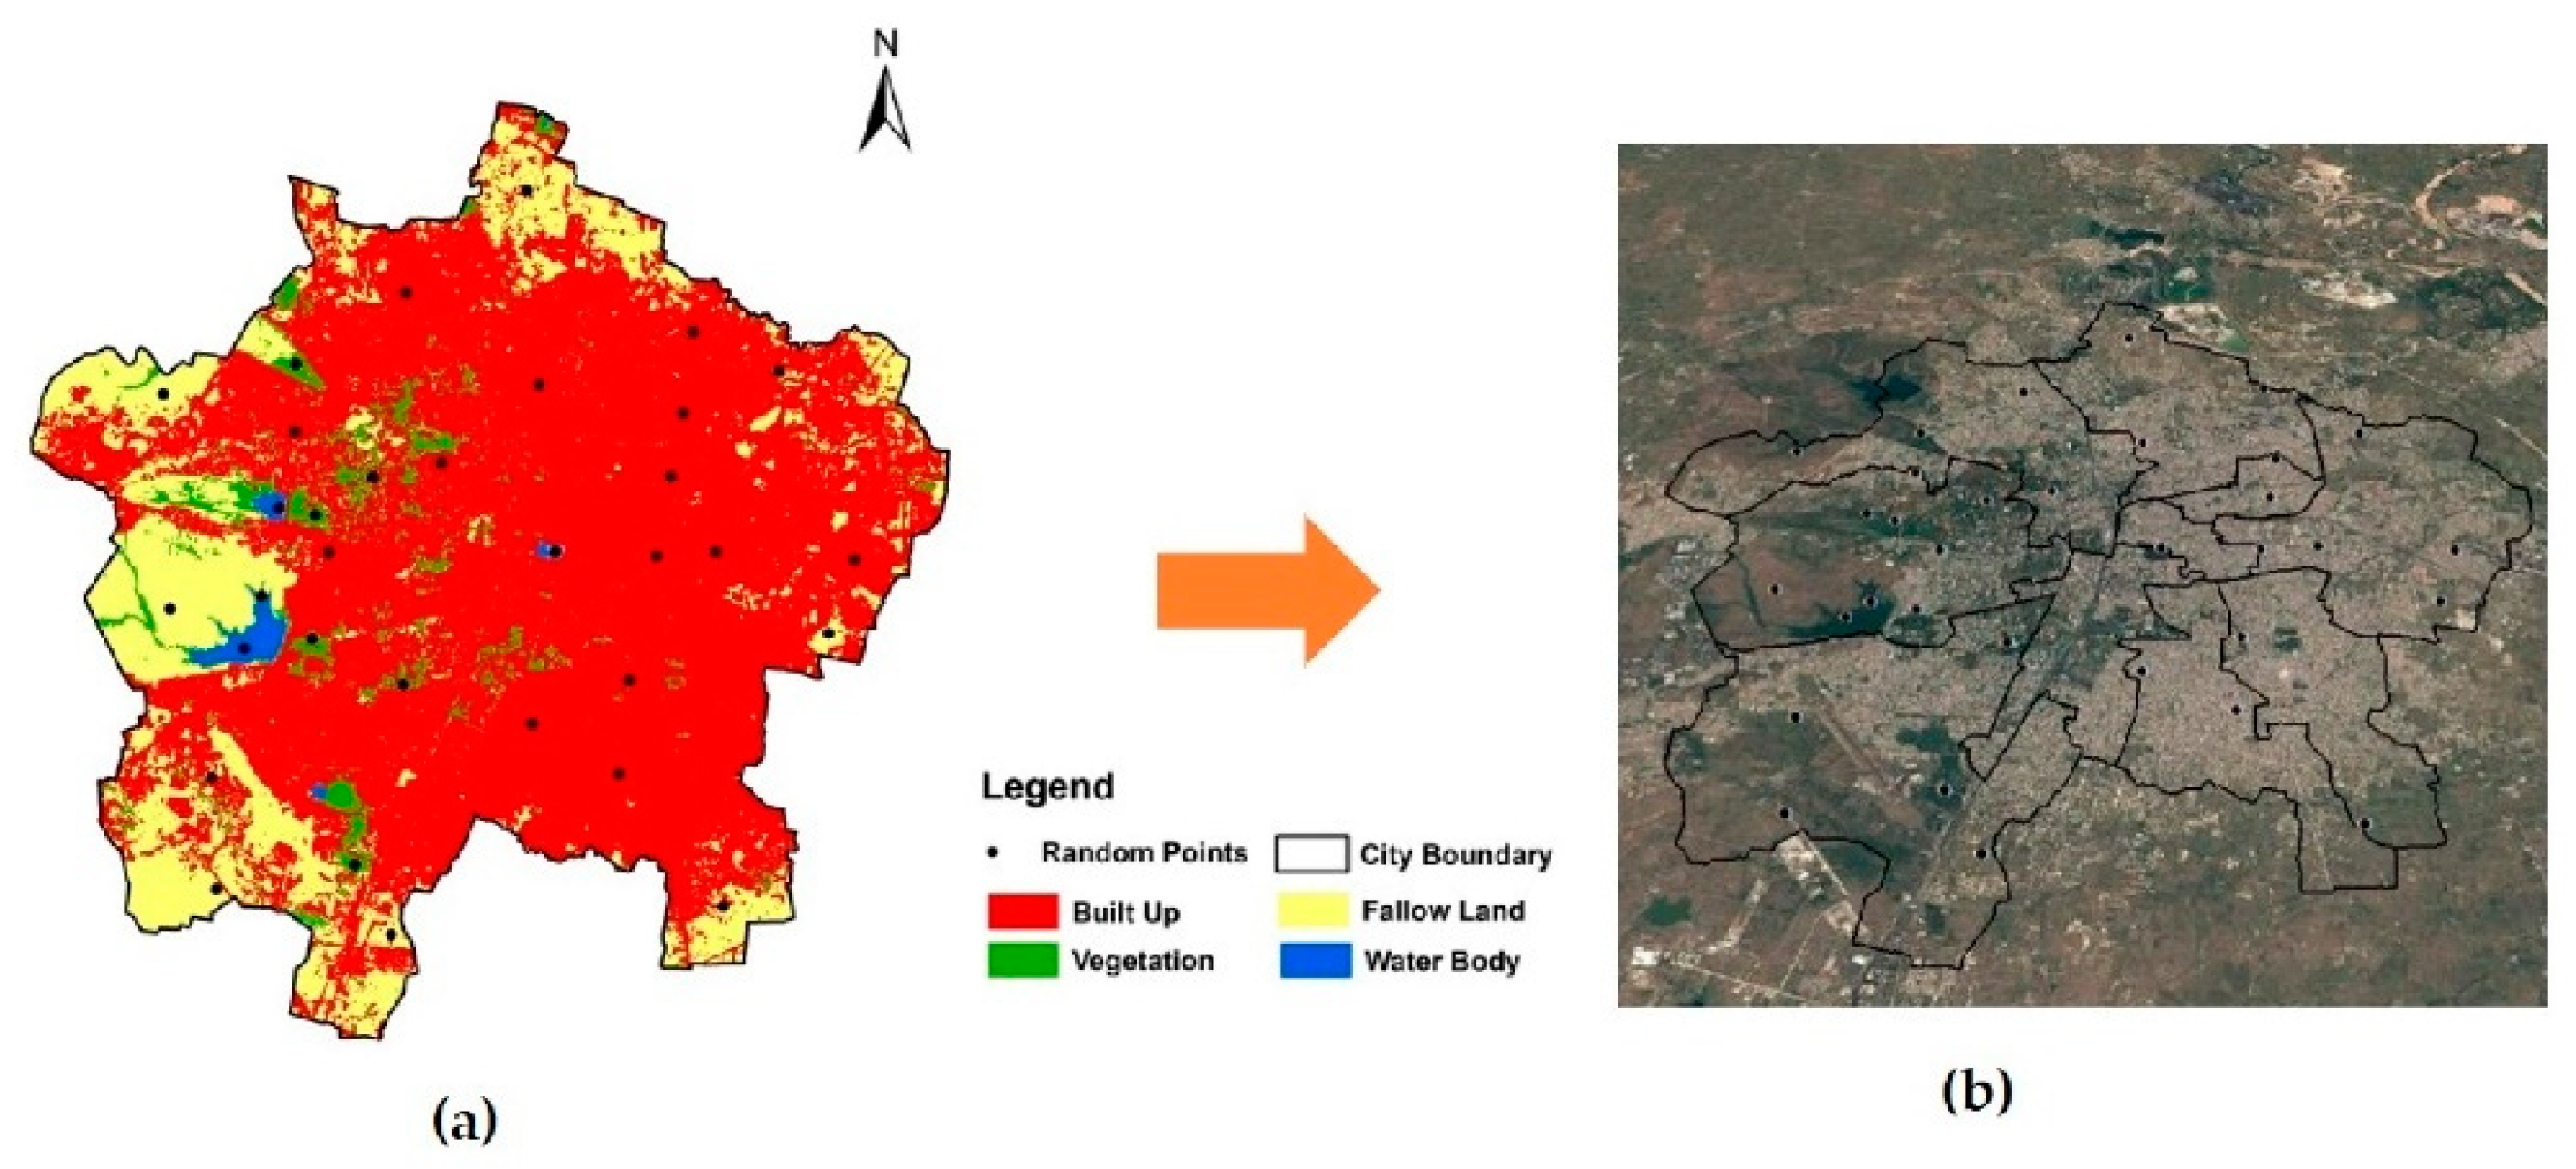
Landsat-5 and Landsat-8 satellite images from the USGS Earth Explorer website were procured with a minimum cloud cover of less than 5% (details described in Table 1) for the years 2011 and 2020 to understand the urban expansion with built infrastructure accommodating the increased population. The images were classified using the false-color bands of 7, 6, and 4 to develop the LULC maps of the city, and the land cover was classified as built-up area, vegetation, fallow land, and water body. For analysis, only built-up areas were delineated comprising the structures and other land covers were excluded.
2.2. Methods
The hotspot analysis of structure fires is performed with two spatial analyst techniques of KDE and HA(GOG*) with IDW interpolation to arrive at fire risk zones. Administrative data with population density are joined with the ward areas, and furthermore, the results from these two methods are compared to assess the significant fire risk zones. The RS tool is used to acquire the built-up areas to quantify the fire risk zones. Furthermore, population density is estimated for each fire risk zones and ranked to reveal the fire risk due to structure fires in the city for implications. The temporal analysis on yearly, weekdays, and time, along with cause-wise analysis was also performed to reveal the association of urban and human activities with the fire occurrences. The study is performed as represented in Figure 3.
2.2.1. Data Pre-Processing
The fire incidences were tagged in Google Earth Pro after acquiring the coordinates physically using Epicollect5 and imported in ArcGIS for analysis. Before performing the hotspot analysis, the data are combined using the ‘collect event’ tool to combine all the events in the same geographical location with the new point feature class of ‘ICOUNT’ and used as input for both methods.
2.2.2. Kernel Density Estimation (KDE)
The KDE identifies the dense areas based on the total count of the geographical events over time and is helpful to rectify the spatial pattern with classified intensities of density estimate values [56,59]. The KDE technique was adopted in the developed countries to reveal the occurrence of fire foci under different land uses in the State of Amazonas during 2005 [60] and to explore the spatial and temporal dynamics of fire incidents in South Wales, UK [18]. The KDE method statistically represents the spatial smooth continuous surface for intensities of the geographical event points over the space of the study area [61]. The kernel is the circular area of the defined bandwidth radius around each event, indicating the surrounding area under influence with a statistical value indicating the density per unit area, and adding of all the values at all places gives a surface of density estimates. ArcGIS 10.6 is used for evaluation considering the default search radius (bandwidth) based on the spatial configuration and number of input points [30]. The kernel density tool calculates a magnitude per unit area from a point using a kernel function to fit a smoothly tapered surface to each point. The surface value is highest at the location and diminishes at the edge of the surface radius considering the distance decay effect [62]. KDE is performed by the mathematical formula as in Equation (1) [61] as follows:
where n = total number of observations; b = smoothing parameter (bandwidth); s = coordinate vector that indicates where the function is being estimated; sj = coordinate vector representing each event point; and K = density function that satisfies the following condition given by Equation (2):
2.2.3. Hotspot Analysis (Getis-Ord Gi*)–HA(GOG*)
A hotspot analysis by Gi* statistics was introduced by Getis and Ord for identifying statistically significant spatial clusters of each area at the local level with clusters of high values as Hotspots and low values as cold spots [41,63,64]. The HA(GOG*) technique is widely adopted in varied disciplines of geography, traffic safety management, and crime [56,64,65]. The vulnerable areas associated with high crime rate along with fire were revealed for targeted fire prevention in the city of Surrey, British Columbia, Canada [27]. The statistic is a z-score at a local level, calculated by the mathematical formula as expressed in Equation (3) [41,66]. A high positive GiZ score indicates hotspots while negative low GiZ scores indicate cold spots and values near to zero indicates a random distribution of clusters with significance, as follows:
where is the attribute value for event j, is the spatial weight between event i and j, n is the total number of events, = mean is calculated by Equation (4), and S = standard deviation is calculated by Equation (5).
Hotspot analysis technique in ArcGIS is used to conduct a Gi* statistical significance test identifying the clusters with high concentration values surrounded by high concentration values indicating the clusters to be a hotspot and the low concentration values are surrounded by low concentration values indicating the clusters to be a cold spot [67,68]. Identification of hotspots is of particular operational interest, and with this goal in mind, the count itself was an appropriate measure [44,65,69,70].
2.2.4. Inverse Distance Weighted (IDW)
The IDW interpolation method estimates the measured values by hotspot analysis surrounding the prediction location [30]. The measured values closest to the prediction location have more influence on the predicted value than those farther away. IDW assumes that each measured point has a local influence that diminishes with distance. It gives greater weights to points closest to the prediction location, and the weights diminish as a function of distance, hence the name inverse distance weighted [30,42].
The IDW interpolation method is employed for demarcation of significant fire risk areas representing the spatial distribution in the study area. The IDW interpolation output was spatially joined with the census ward level of the city using a zonal spatial analyst tool to estimate the significant fire risk zonal areas and population under the risk areas. Furthermore, the IDW interpolation is used for predicting the high fire risk zonal areas with the population under risk integrating urbanization for implications.
2.2.5. Built-Up Area Estimation from LULC
Land cover has been conducted in ArcGIS 10.6 employing maximum likelihood with an image classification tool to measure the built-up area [71]. The land cover was classified into four major classes of built-up area (structures, roads, and small open spaces), vegetation (trees in forest areas, large open spaces, and wetland vegetations), fallow land (remaining open or unutilized land), and water bodies (lakes and ponds) [72]. An accuracy assessment was conducted for each classified image with ground truth data from Google Earth Pro using overall accuracy (OA) and kappa coefficient (K) as shown in Equations (6) and (7) [73]:
where CD = a total number of reference samples chosen; TP = total number of correctly classified samples; P(o) is the observed proportion of agreement; and P(e) is the proportion expected by chance [74].
The LULC map was used to assess the actual built-up areas for quantification of population density under the risk of GiZ-score fire types. The built-up density is calculated by using Equation (8), and population density by Equation (9) as follows:
where BUD = Built-up Density; TB = Sum of the total built-up area of all wards; TA = sum of the total area of all wards; PD = Population Density; and TP = sum of the total urban population of the wards.
2.2.6. Temporal and Cause-Wise Analysis
Temporal data statistical analysis significantly evaluates the association with the correlated variables responsible for fire incidences through the period of years, months, weekdays, and hourly events [36]. The statistical methodology helps in the interpretation of the parameters and, due to its simple application, is extensively applied at urban scale by the decision makers for econometrics, financial inferences, and planning disciplines [75,76]. Temporal analysis on a yearly basis for the selected month is performed statistically, fire index for the time series of the year is calculated using Equation (10), z-score for each year is calculated by using Equation (11), and the probability evaluation is performed using z-score value to reveal the highest fire incidences. The ratio between fire incidences and population size of the year is evaluated to understand the impact of urban activities with population growth on fire incidences. Furthermore, the fire incidences are segregated on basis of weekdays and hours to arrive at the maximum frequency by circular statistics represented in radar charts. Pearson’s correlation is evaluated for the hourly fire frequencies using Equation (12) and the sensitivity analysis is performed by Durbin–Watson (DW) statistic using Equation (13) [77]:
where FI is the fire index for the time series of a year, X is the number of fire incidents for the time series of a year, and is the mean value of the time series of a year. Z = standard score, x = observed value, µ = mean of sample, and σ = standard deviation of the sample. R = Pearson’s correlation coefficient and x and y are variables. T= Number of observations, et = residual given by et = et−1 + vt, and = null hypothesis.
Human and urban activities causing fire incidences on a yearly temporal scale were investigated to relate with the fire severity [36,78,79]. Cause-wise categorization of the fire incidences is performed, and percentage calculation helps to understand the fire cause pattern due to urban and human activities in the identified fire risk zones for implications.
3. Results
3.1. Hotspot Spatial Analysis
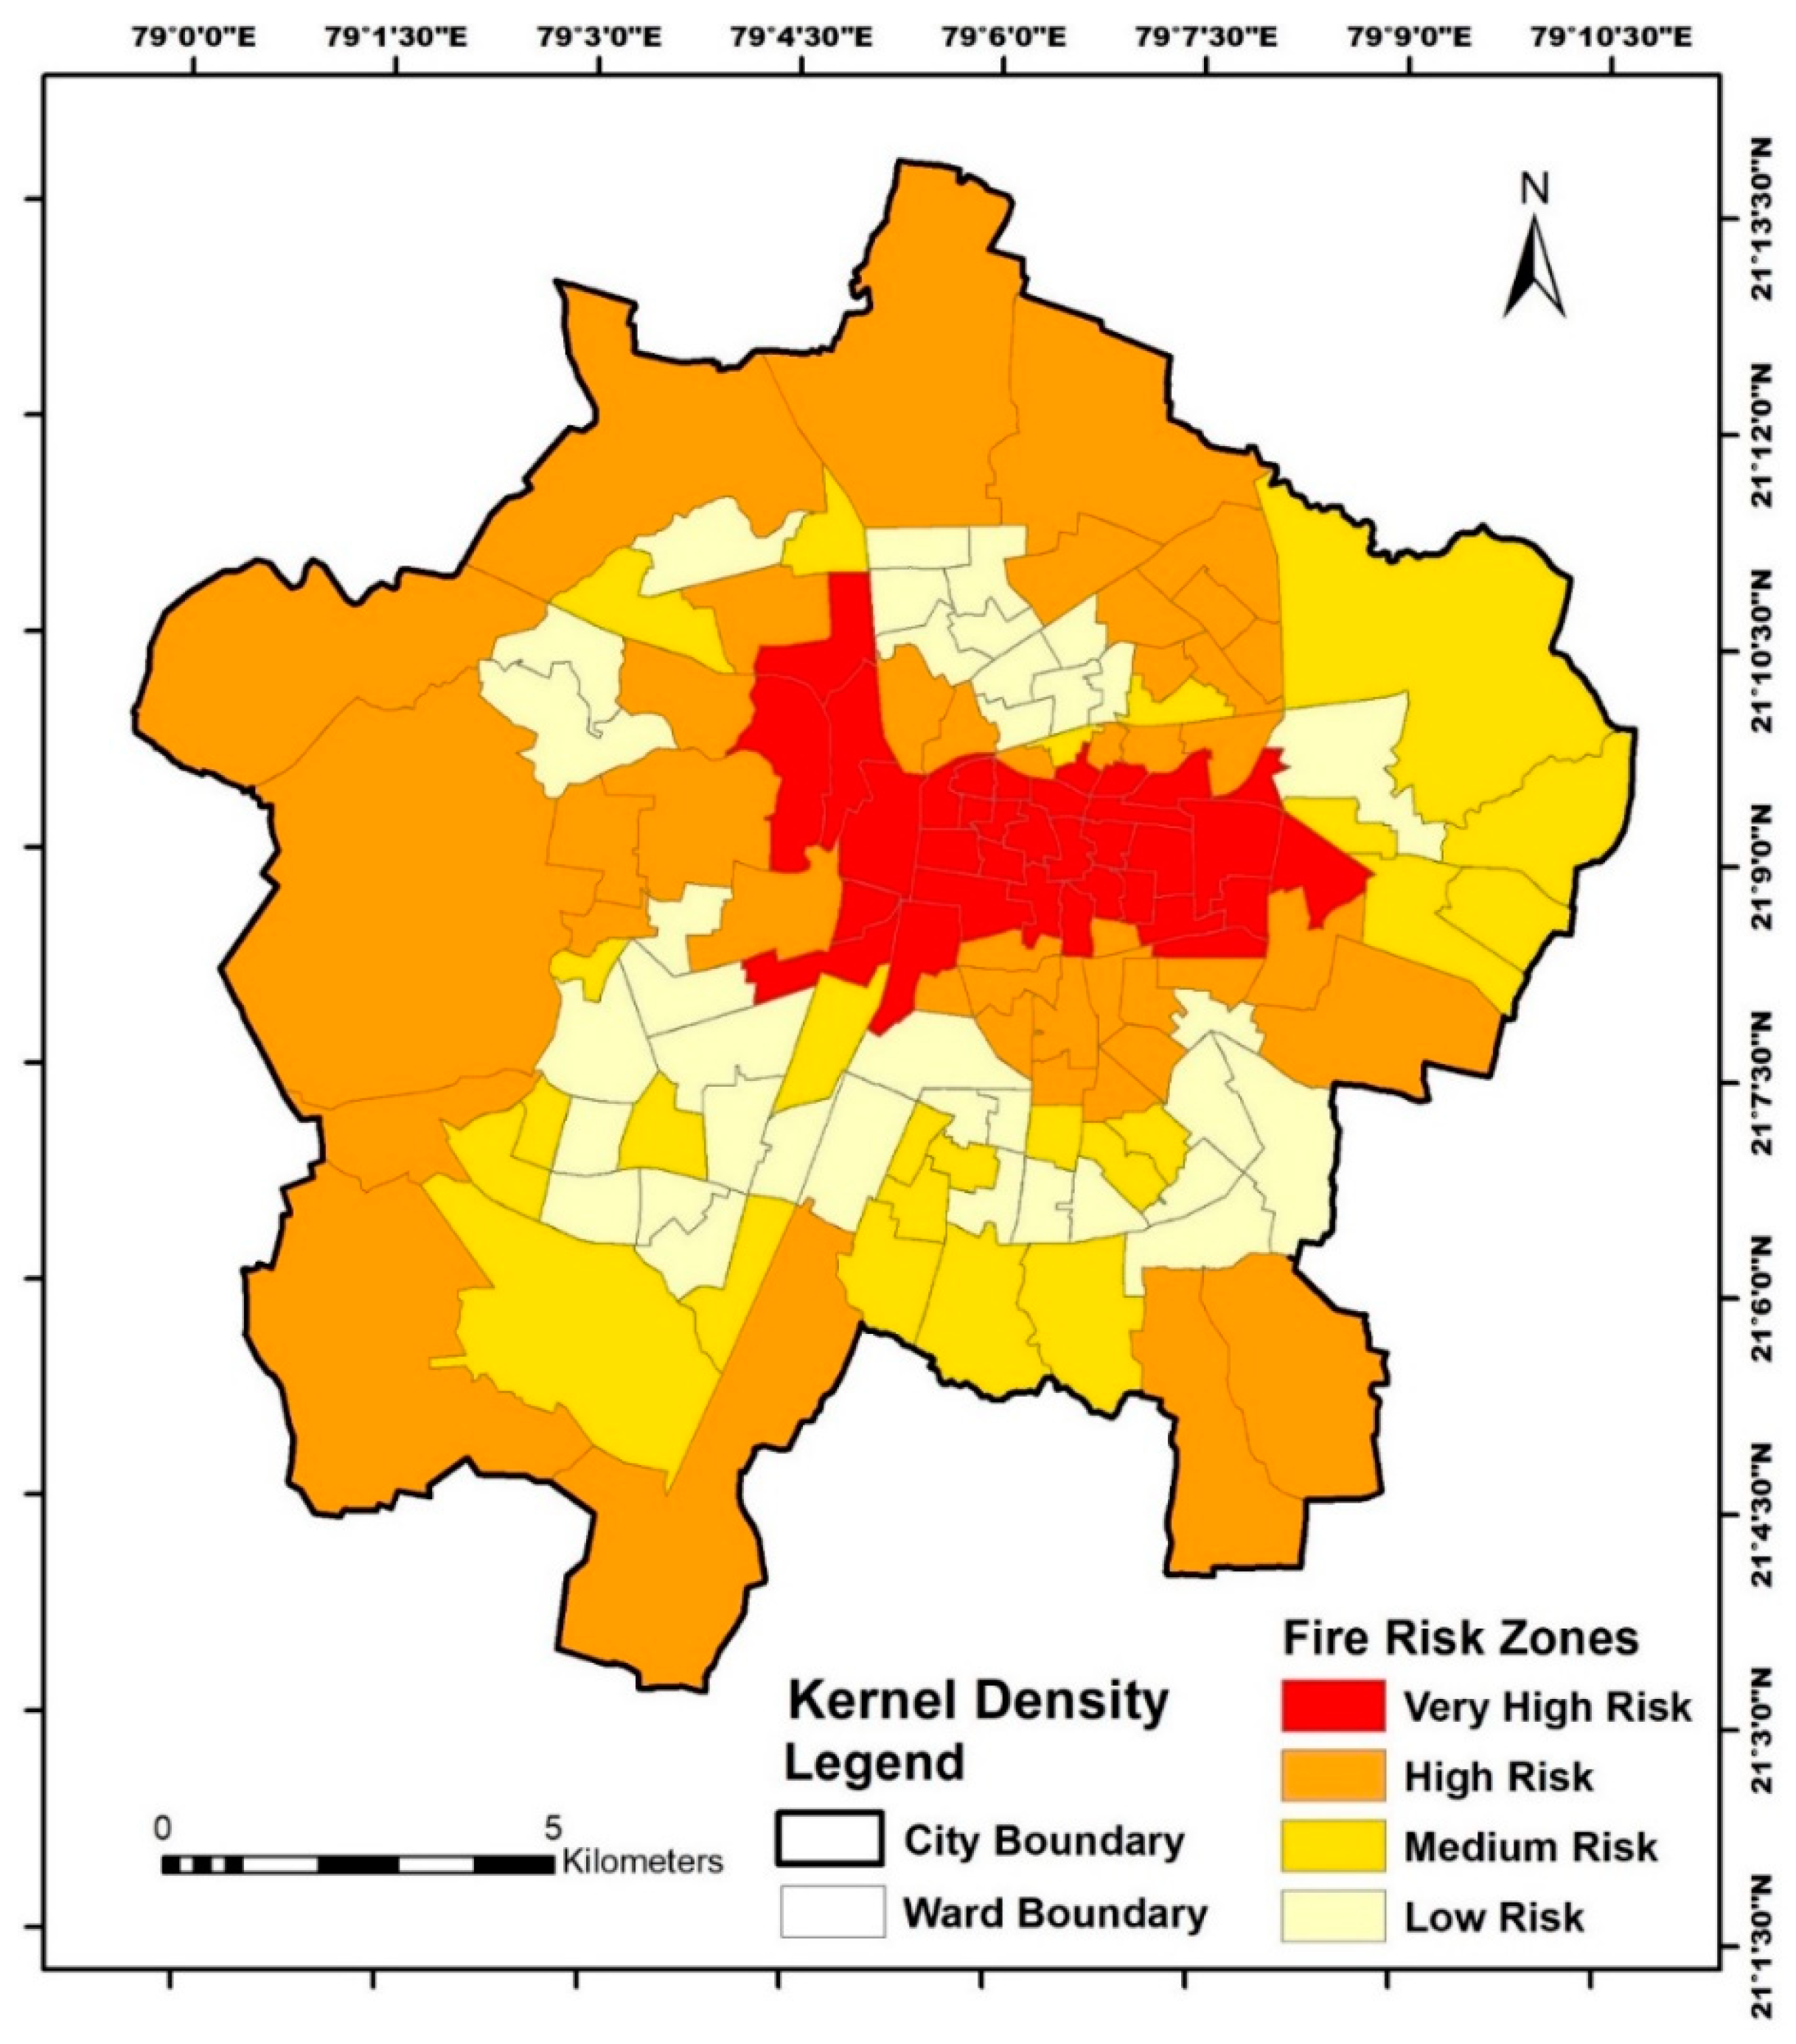
3.1.1. Kernel Density Estimation Result
The KDE analysis is performed by applying a spatial analyst tool. The maps generated are spatially joined with the ward map as represented in Figure 4. The output is classified into four groups at the geometric interval as listed in Table 2. The intense area in red color is the identified hotspot area categorized with a very high fire risk zone, with the highest value comprising 9% of the total area and with the highest population density located in the central core and extending towards the northern part of the city with high rise development. The ranking of population density reveals the very high fire risk zone with a maximum population under threat on the least percentage area, while the high fire risk zone has the lowest population density covering the maximum of 54% of the city area with a maximum of 33% of population size, spreading majorly towards the fringe area of the city with low rise development
3.1.2. Hotspot Analysis (Getis-Ord Gi*)–HA(GOG*) Result
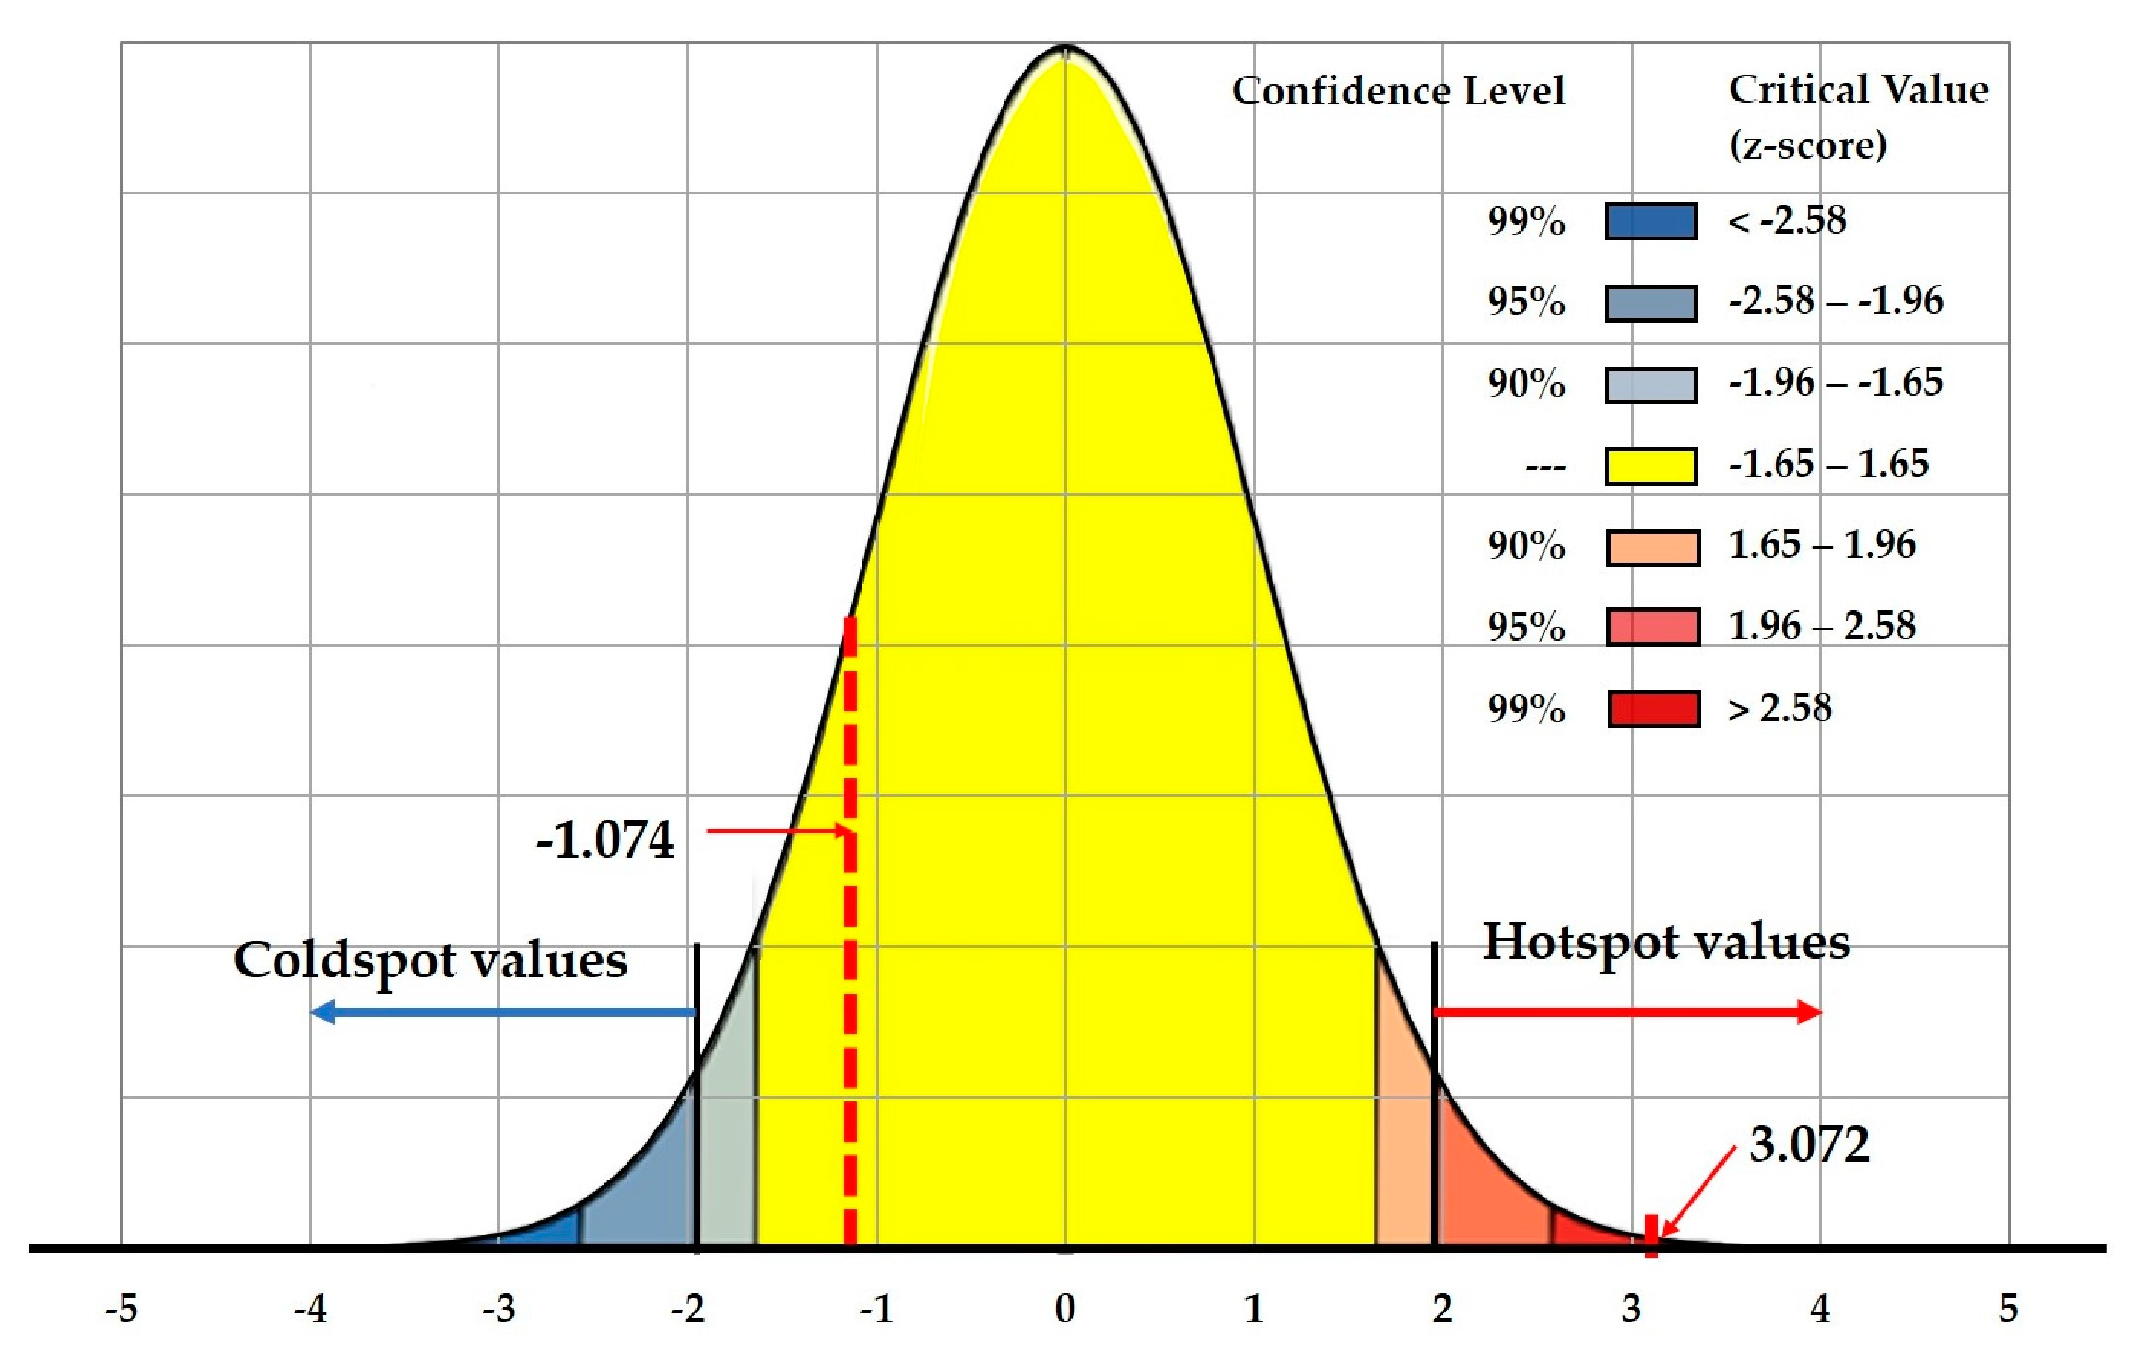
The local level HA(GOG*) was performed to identify the statistical spatial distribution pattern after the process of collected events in ArcGIS to include all overlapping events, and the evaluated GiZ-score varies from 3.07216 to −1.07437 as represented in Figure 5. The results reveal that the hotspots with higher values of 3.07216 exceed the critical value of 1.96 at a 95% confidence level, indicating clusters with high fire event values are surrounded by high fire event values. The lower value of −1.07437 > −1.96 is within the 95% confidence level, indicating no cold spots in the spatial distribution pattern.
3.1.3. Inverse Distance Weighted (IDW) Interpolation Result
The IDW Interpolation techniques are extensively performed for the generation of HA(GOG*) outputs on spatial dimensions [30,42]. The hotspot analysis results were spatially joined by a zonal statistics tool to the census ward map after IDW interpolation to identify administrative areas for estimation and implications, as represented in Figure 6. Fire disasters are not planned events and any fire incidence can be disastrous with heavy losses. Therefore, every fire event has to be considered with significant risk. Therefore, all GiZ scores at 95% confidence level are categorized under the four fire risk types as listed in Table 3 and reveal the highest population density in the hotspot zones.
3.1.4. Built-Up Area Estimation from LULC
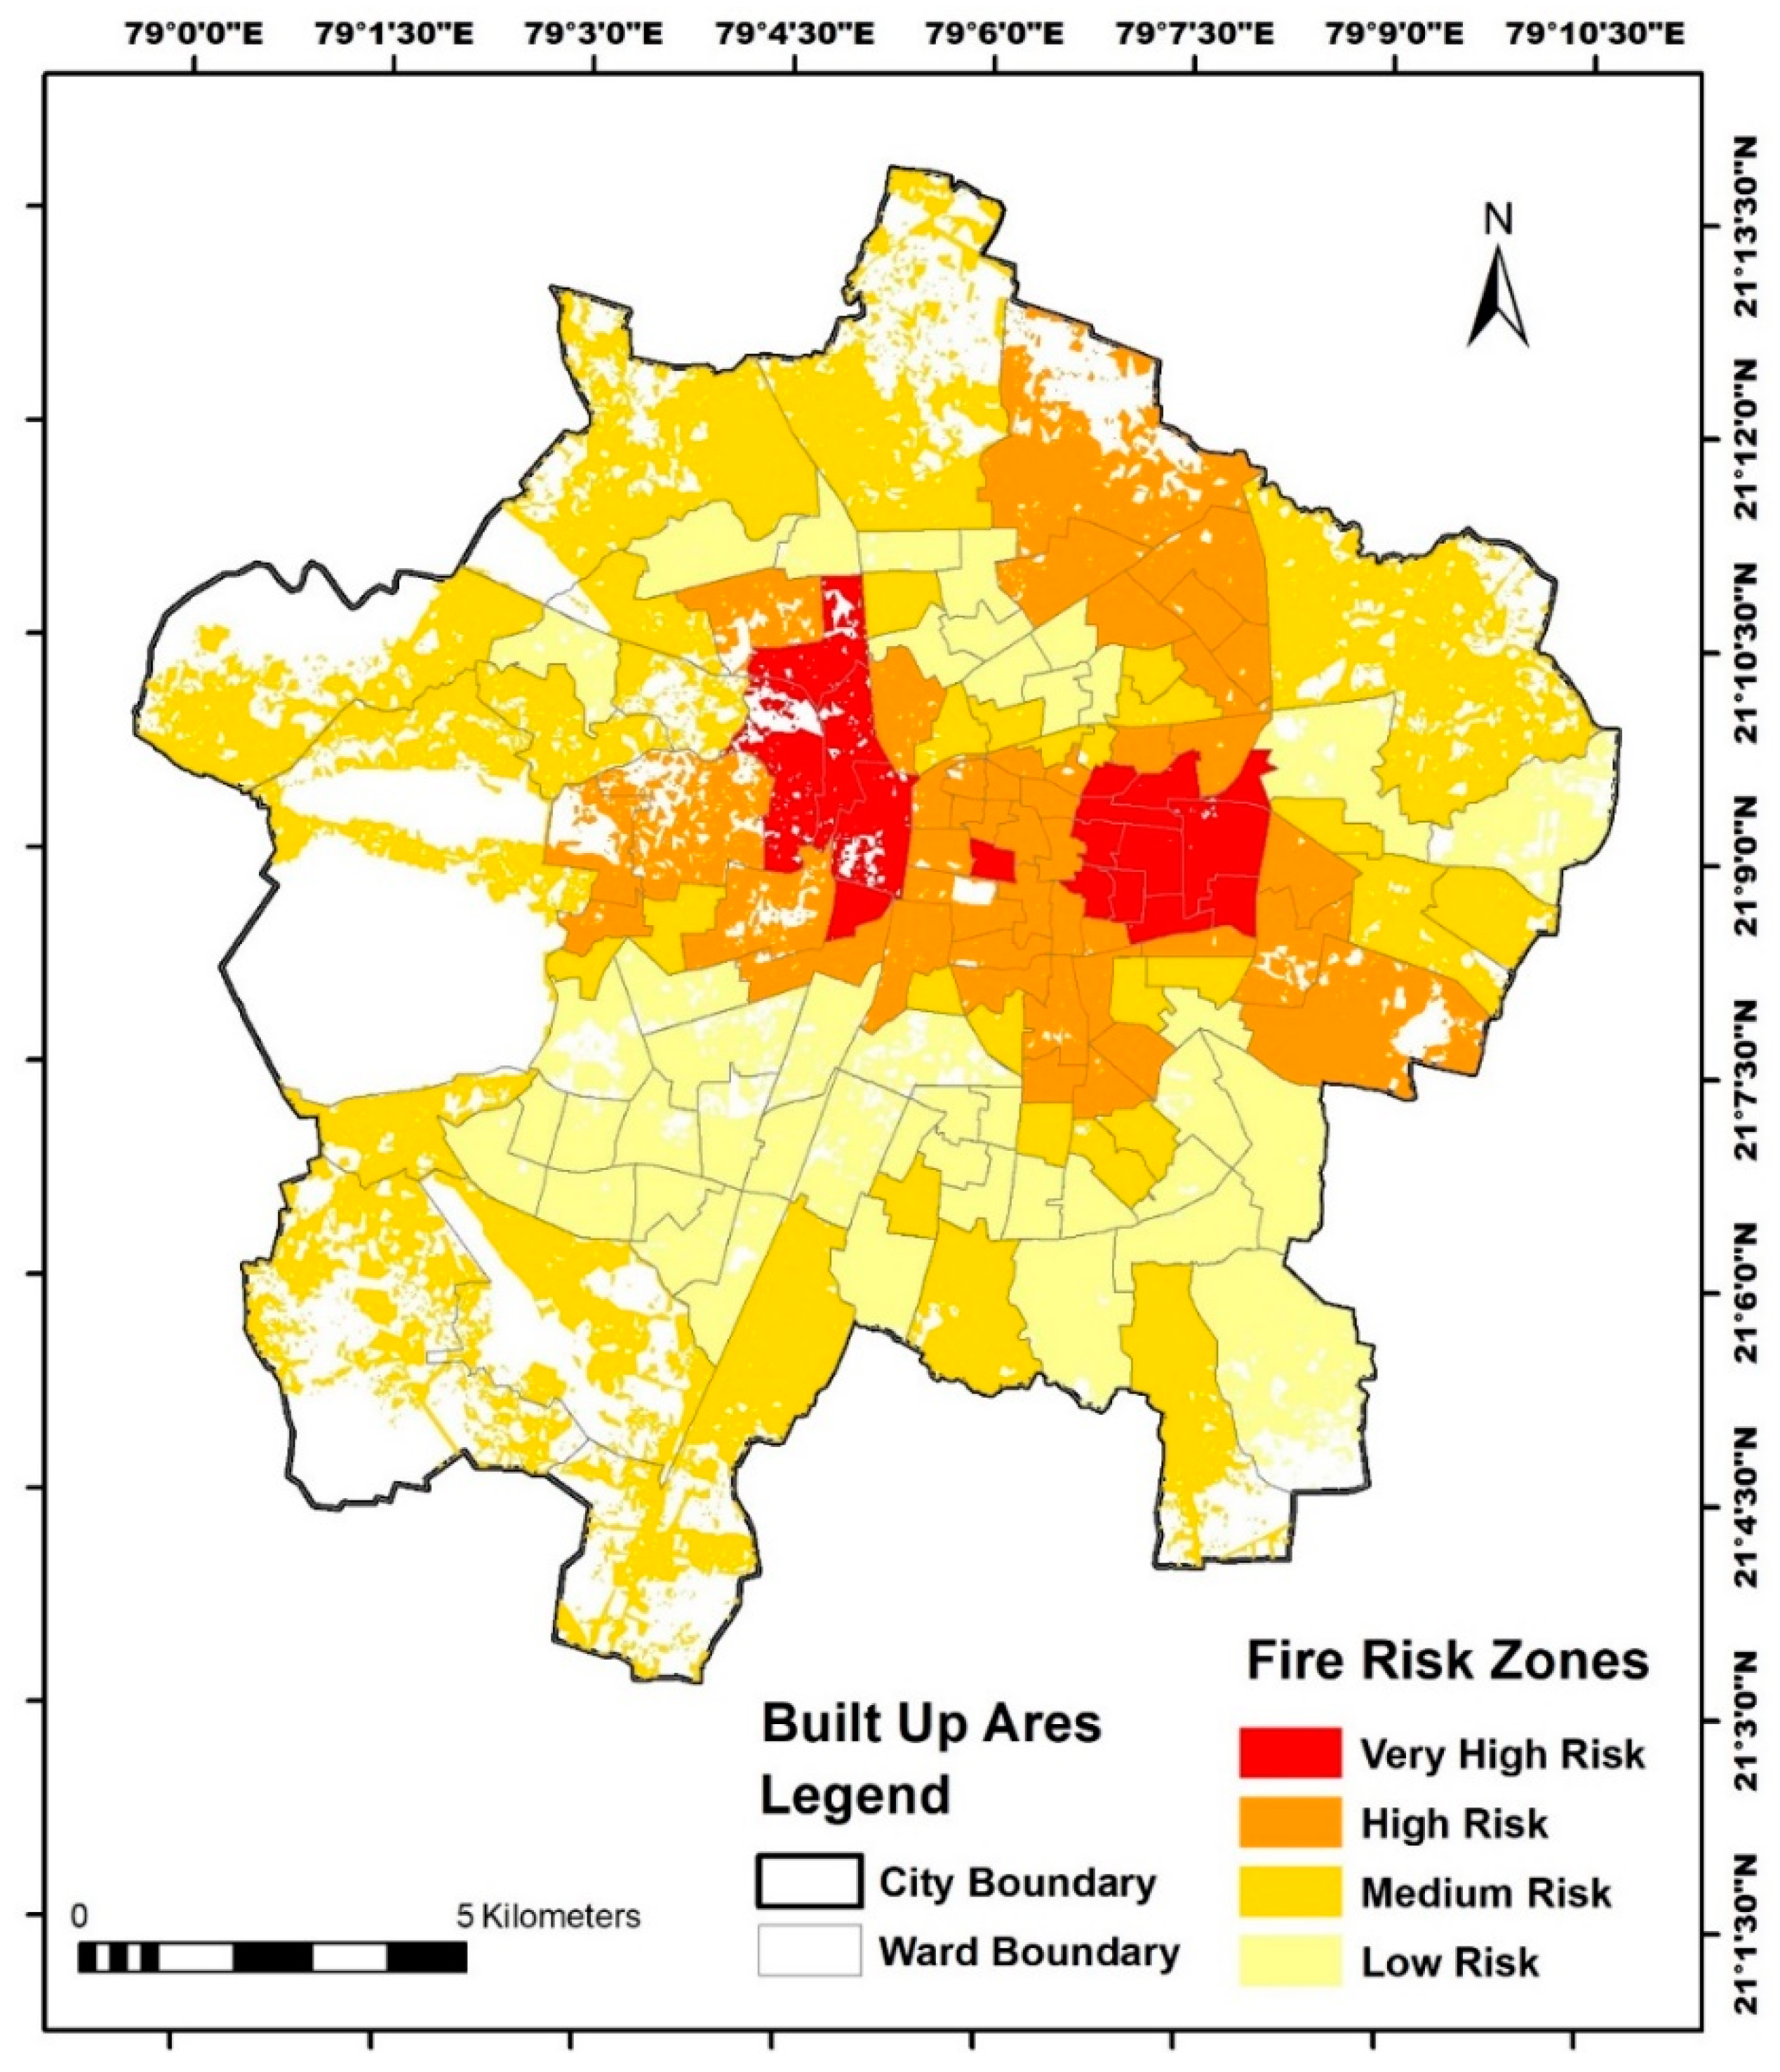
The Landsat Satellite images from the USGS Earth Explorer website were classified through the maximum likelihood supervised classification tool in ArcGIS 10.3 to assess the urban built environment of 2011 and 2020 to then estimate the significant fire risk areas. Figure 7 represents the built-up areas of the city with structure fires from 2011 to 2020, comprising 52% in 2011 and increasing to 73% in 2020, which is an increase of 21%. The accuracy assessment of both the LULC maps has been performed using the ground truth data marked in Figure A1 and Figure A2 and as per the findings listed in Table A1 and Table A2. The overall accuracy for both years is 91%, and the Kappa coefficient is 85% in 2011 and 86% in 2020, satisfying the 85% limit for minimum accuracy [74].
The quantification of the built environment with classified fire types is performed, and the results are listed in Table 4. The spatial distribution for visualization is represented in Figure 8, which reveals that the highest percentage of actual built-up areas is in the Medium category with 46%, the highest built-up density percentage is in high fire risk category with 91%, revealing the highest development in the built environment and the highest population density in very high fire risk category, while the lowest are in the low category, indicating the impact of urbanization.
Table 5 has the classified structures as per the NBCI, representing the percentage of fires to understand the human activity from occupancy fires. The hotspot area with a very high-risk zone in the central part of the city has a maximum of 39% fires in mercantile occupancy, 35% in residential, 12% in industrial, and 8% in the business occupancy. While other risk zones have maximum fires in residential class following with mercantile class of structures.
3.1.5. Predictive Probable Fire Risk Evaluation Results
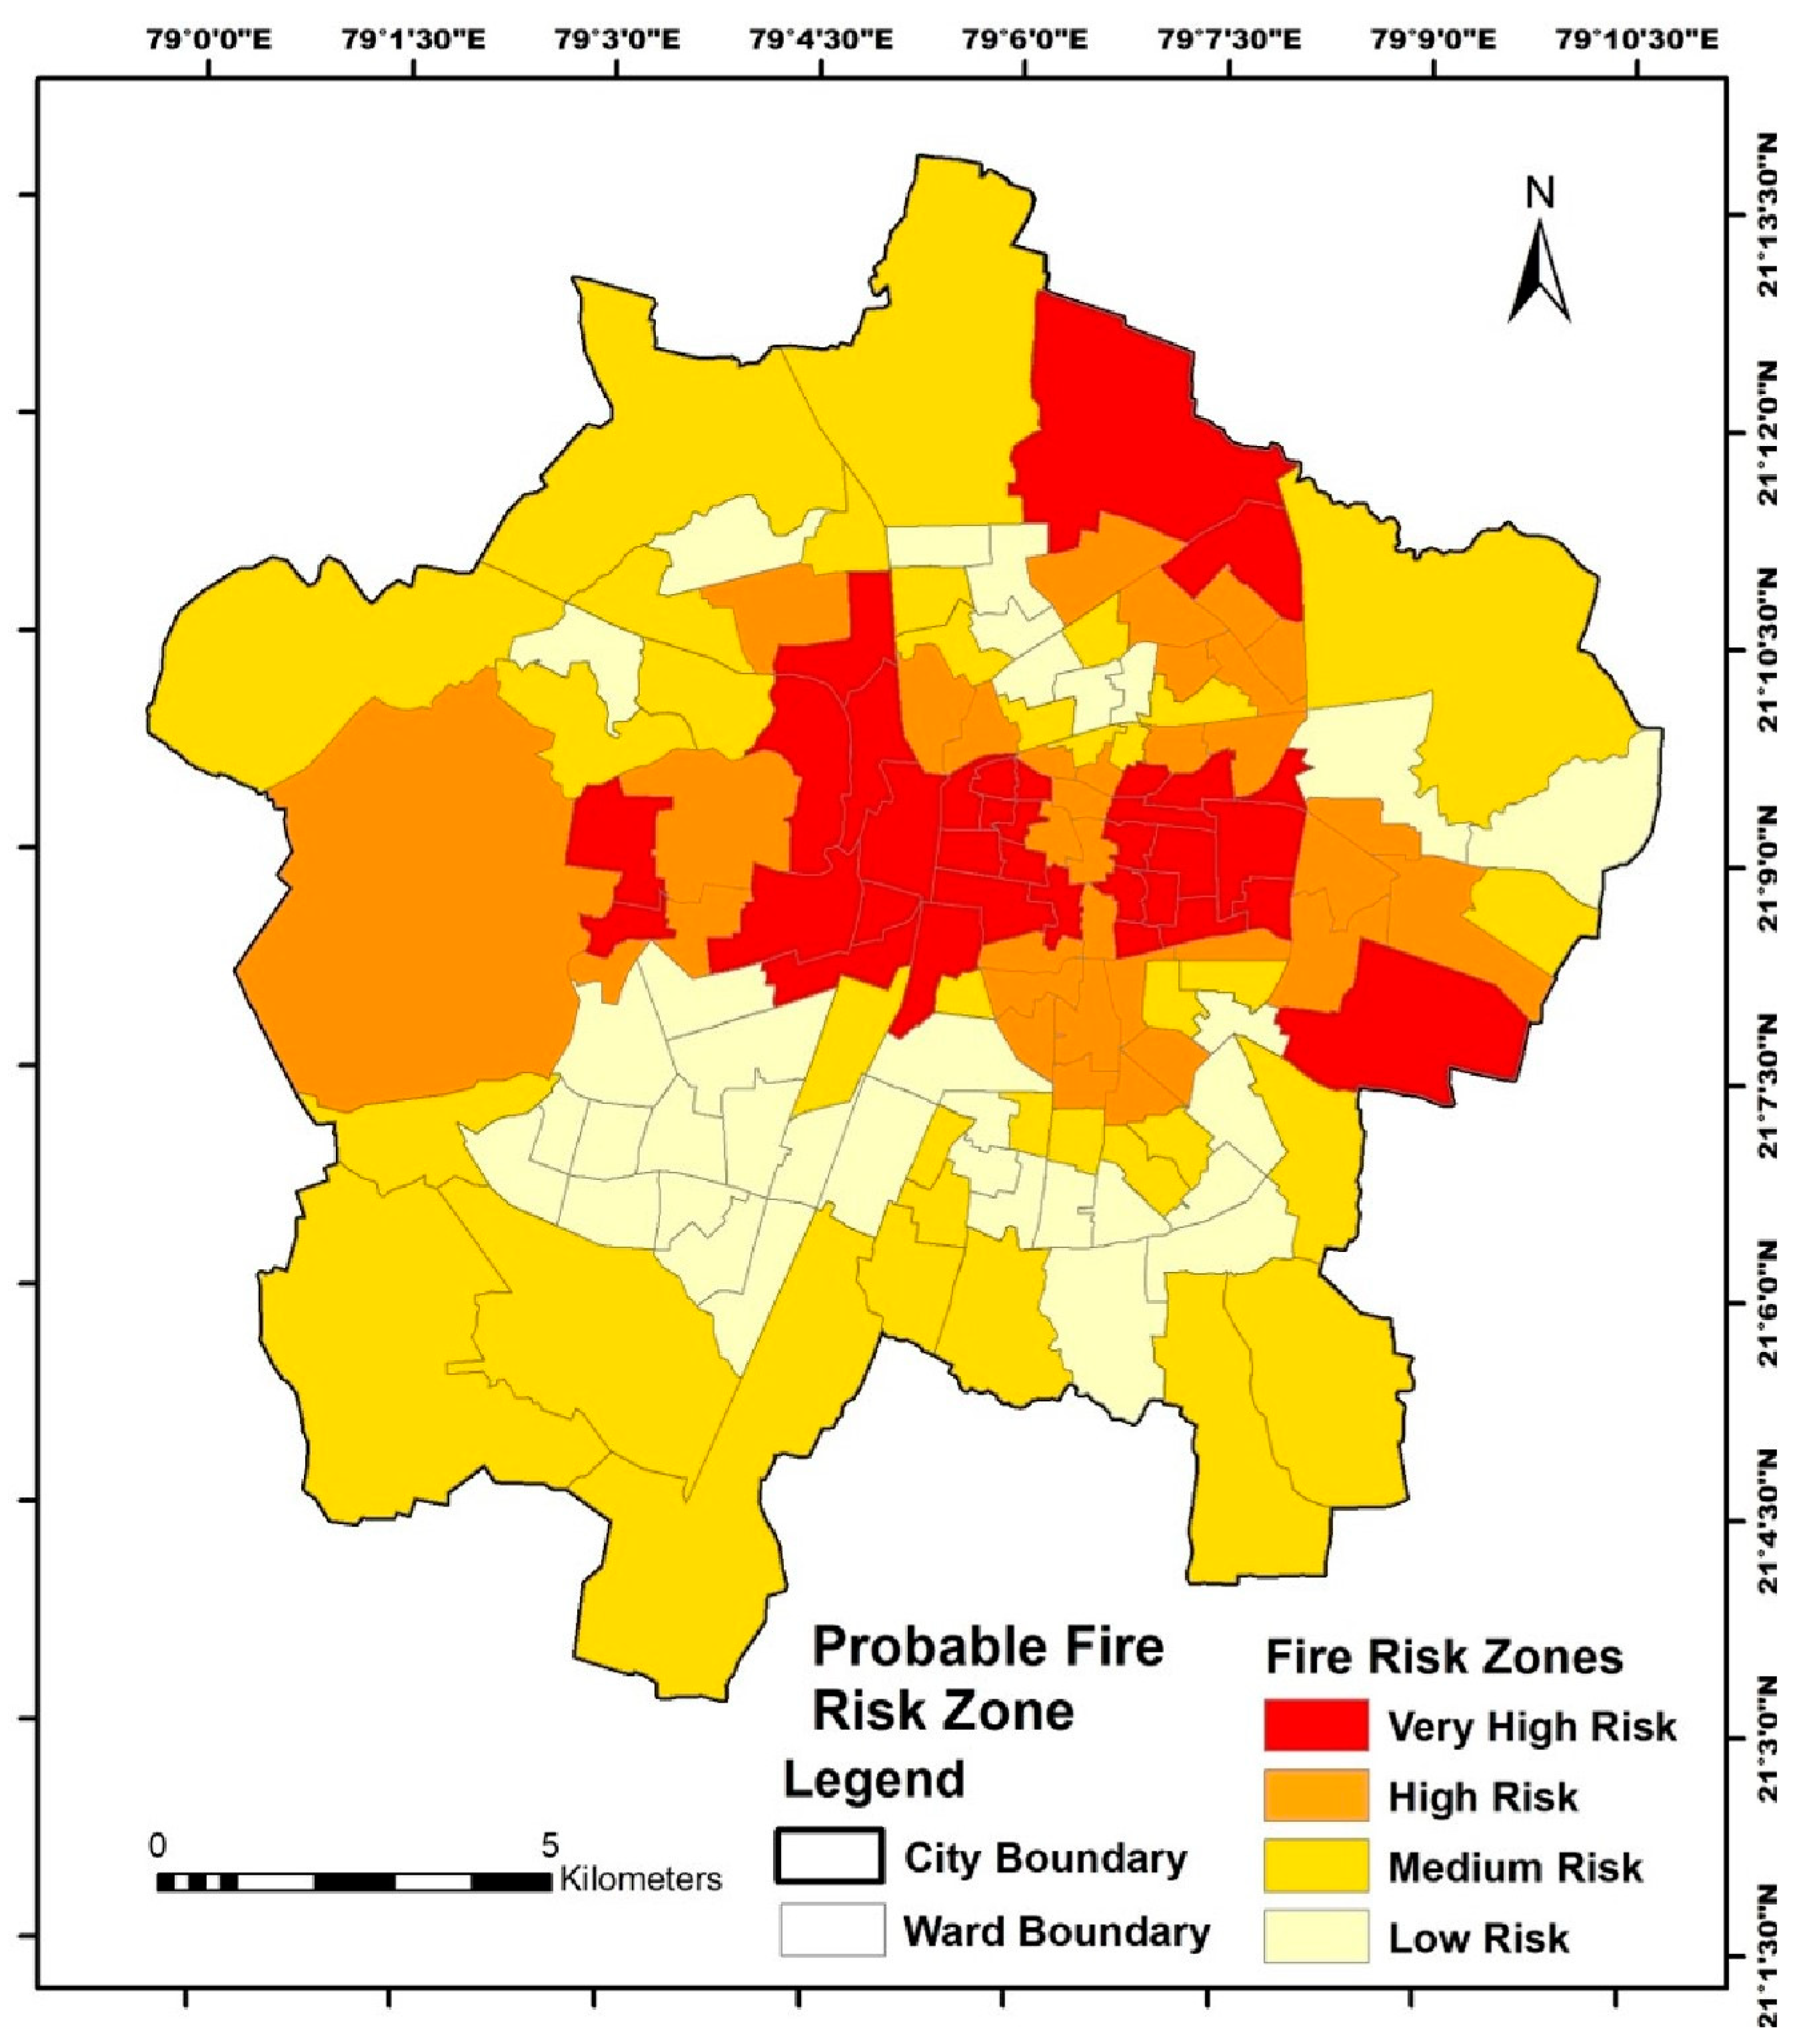
IDW interpolation techniques are extensively performed for the generation of hotspot analysis outputs on spatial dimensions [30,42]. Figure 9 represents the predictive continuous smooth surfaces classified into five different classes based on the quantile classification method at the extreme limits considering the raising population due to rapid urbanization with the predictive decadal population growth rate for 2031 as 21.2% and 2041 as 20.7% [55]. The very high fire risk zone is represented in red color with high values. The results represented the central part of the city extending towards the lower eastern part under predictive very high fire risk covering 19.20% area of the city as shown in Table 6, and the higher three classes cover 58.69% of the city area, indicating proactive planning by the resource allocation of fire services for the future decades.
3.2. Temporal Analysis
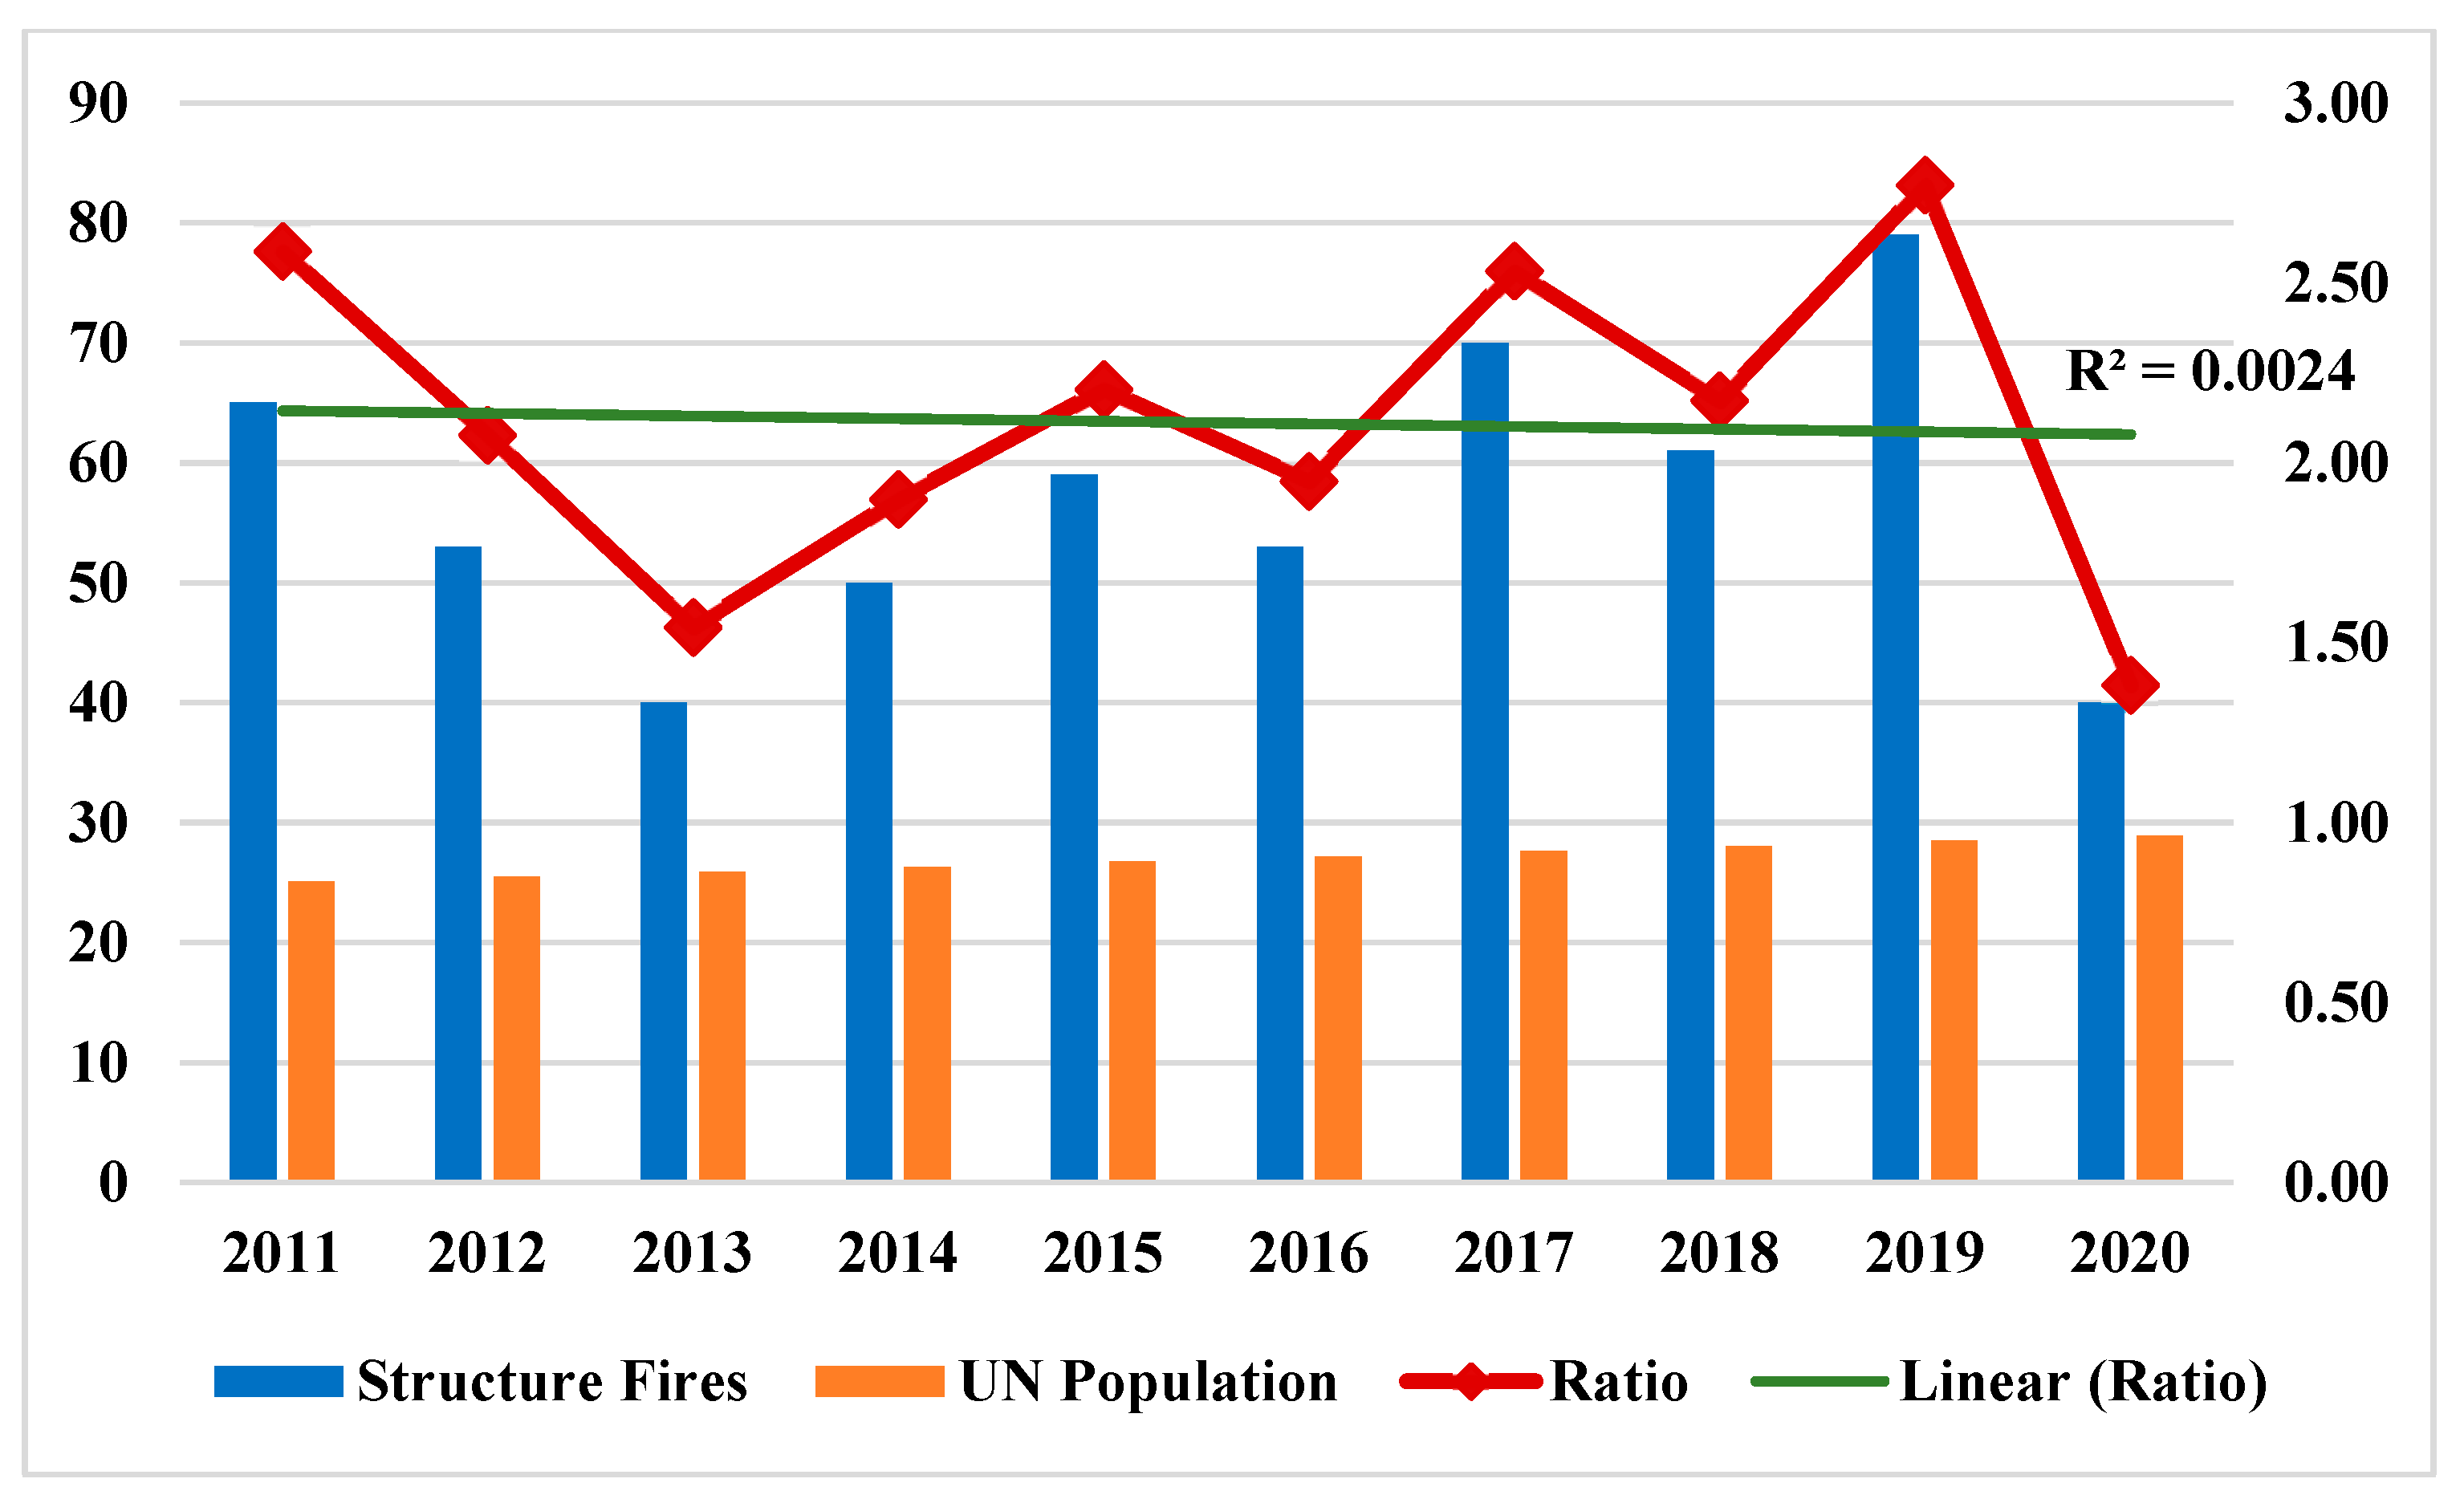
Fire incidences and the population growth across the study period for the hottest month are evaluated statistically and the output is listed in Table 7 revealing the highest fire incidence frequency in 2019 with the highest Fire Index, z-score, and probability values, while least is in the years 2013 and 2020. The urban activities were restricted in 2020 due to the COVID-19 pandemic lockdown, resulting in a reduced fire incidence frequency. The population growth has the rising trend as per the UN population projection in lacks [57] and the ratio of fire incidences is revealed to be the highest in 2019 and lowest in 2020, as shown in Figure 10. The output reveals the impact of urban and human activities on fire incidences in a rising pattern during the normal conditions, but during the pandemic, the ratio lowers down to the least throughout the decadal period, and furthermore, the trendline of ratio is in a declining pattern with R square value 0.0024.
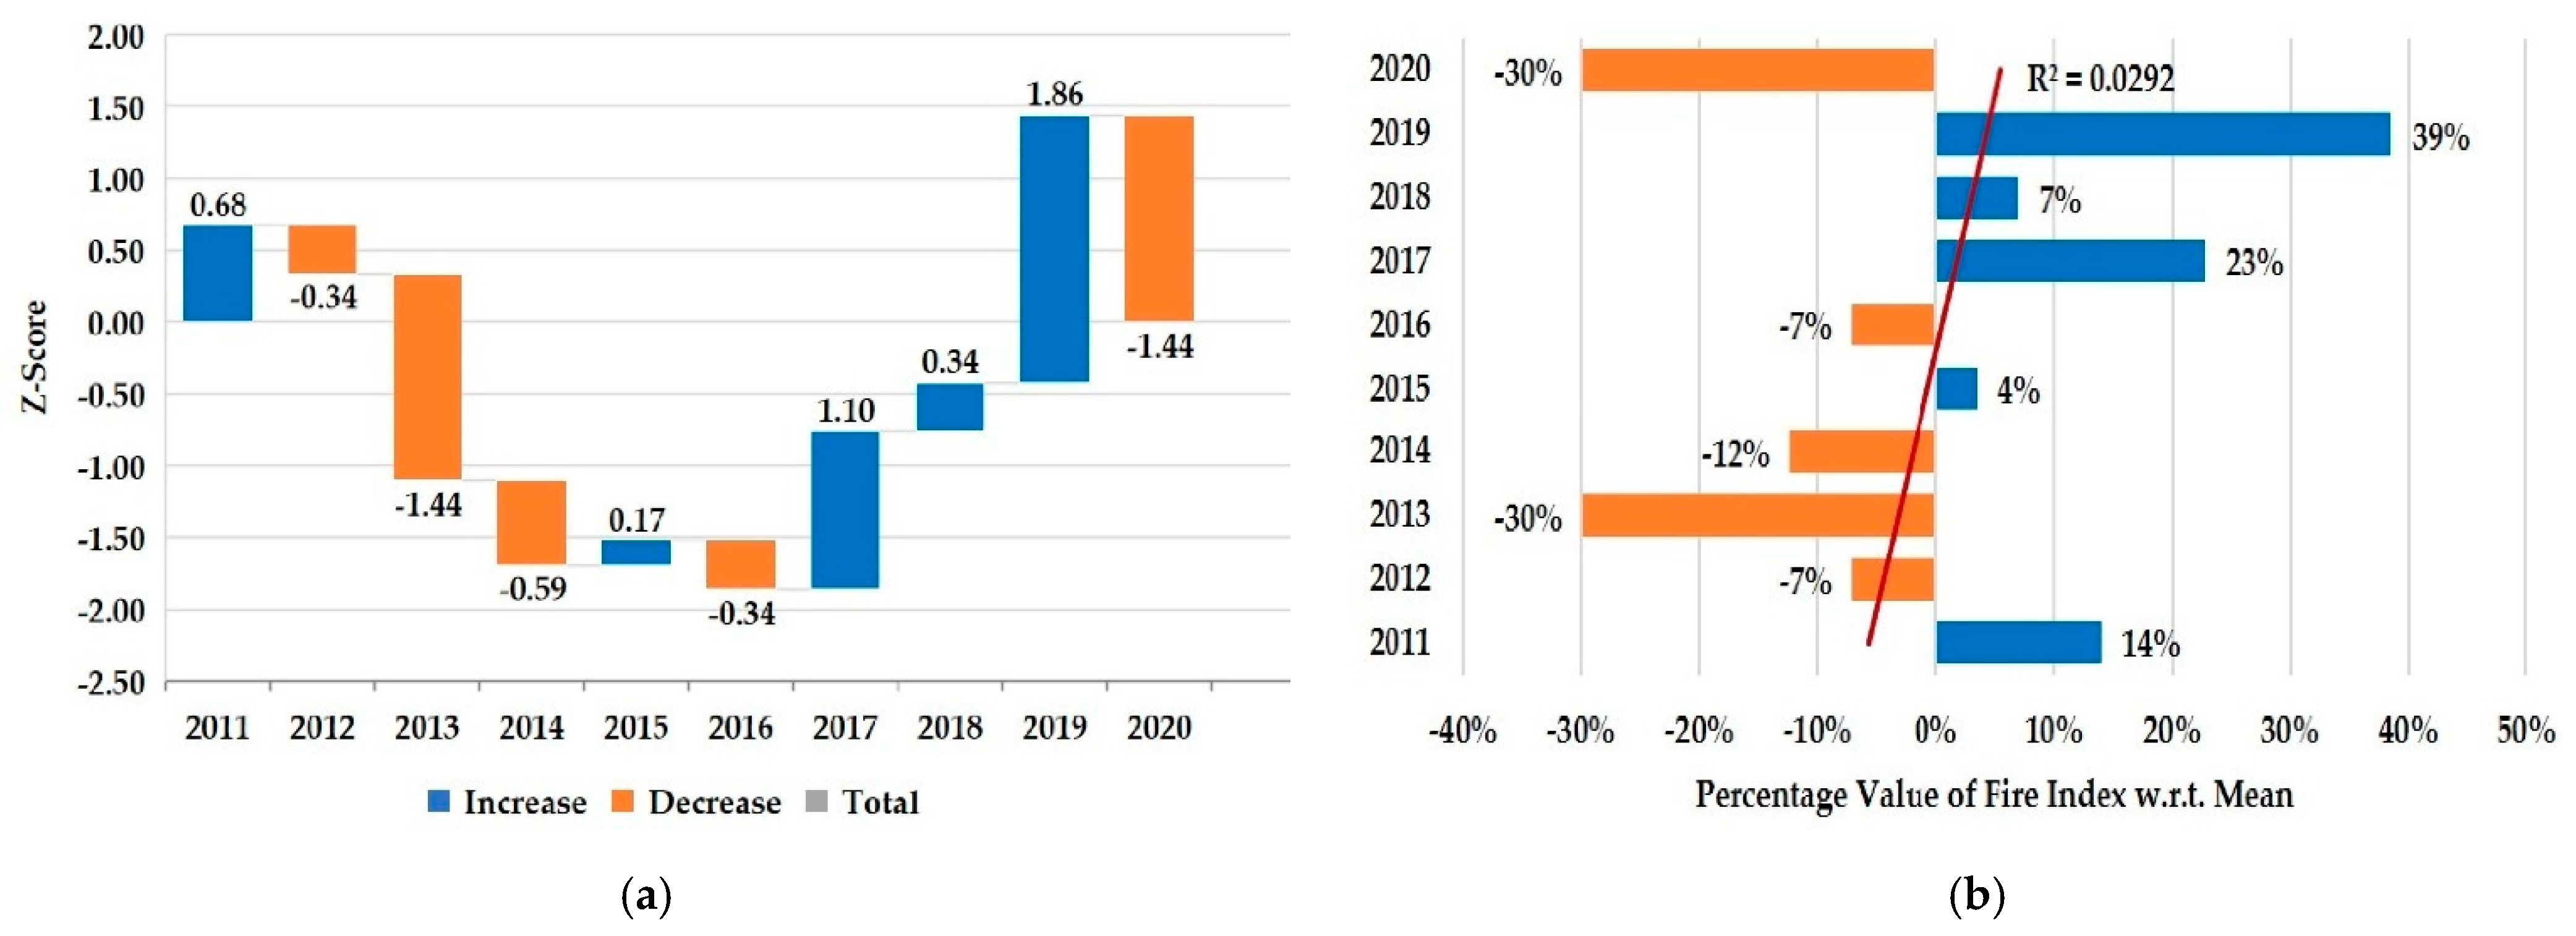
Figure 11a depicts the waterfall chart of the evaluated z-score of the fire incidence pattern, as listed in Table 3, revealing the maximum increase in 2019 with a 1.86 z-score and decreasing in 2020 for a pandemic reason. Figure 11b depicts the evaluated proportion of the fire indexes reiterating the fact of maximum rise in 2019 with 39% above the mean value with the trend line of R square value of 0.00292 indicating a very slow but rising pattern.
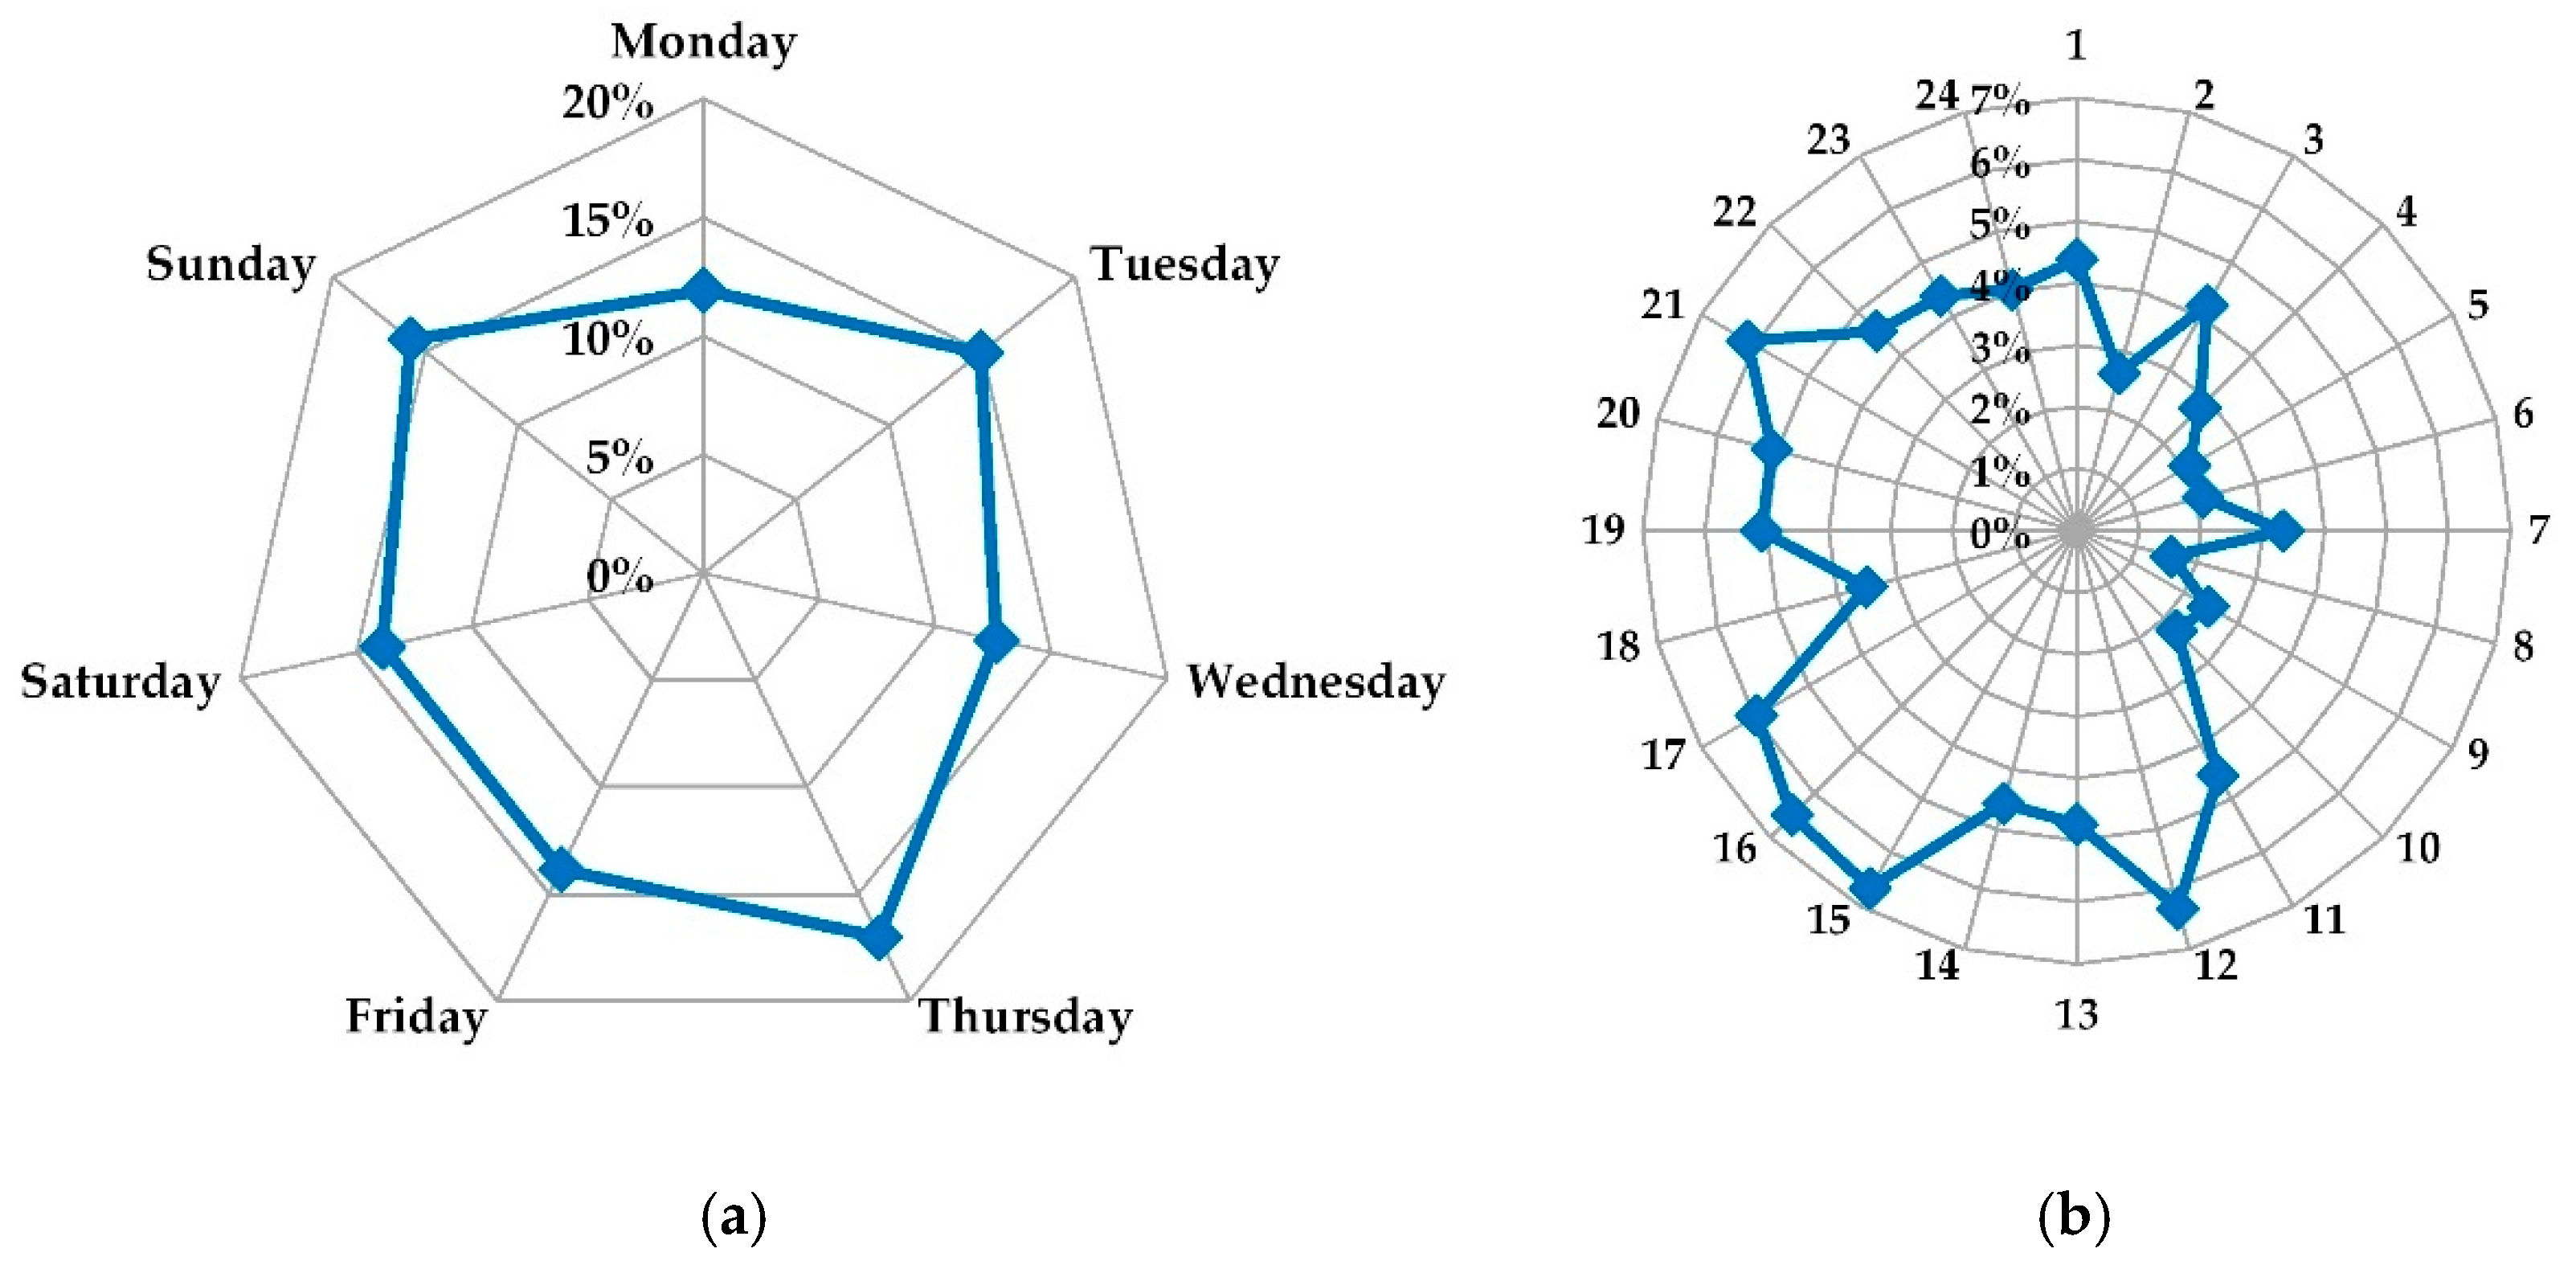
Figure 12 depicts the temporal data of weekdays and hourly fire incidences. The weekdays dataset (as in Figure 12a) has the maximum fire frequencies on Thursday at 17% and a minimum on Monday at 12%, then the weekends. The hourly dataset (as in Figure 12b) has the maximum fire events during the hot afternoon hours from 12:00 to 17:00 with a maximum of 7% indicating the impact of climatic conditions and the human urban activities hours. The late hours from 19:00 to 21:00 correspond to dinner time, with the rise in fires indicating human activities.
The Pearson’s correlation between the hourly fire frequencies has the coefficient value of 0.54, indicating a moderate correlation. The sensitivity analysis through autocorrelation test by Durbin–Watson (DW) statistics with the null hypothesis states that fire frequencies have no relation with the hour of the day at which they occur. The DW value ranges from 0 to 4 and the 0 to 2 value indicates a positive correlation and from 2 to 4 indicates negative relation. The DW value nearer to zero indicates strong positive autocorrelation and nearer to 2 indicates no autocorrelation. The DW statistic test evaluated the value of d = 0.35 (nearer to zero) at p-value < 0.05, which rejects the null hypothesis indicating the positive autocorrelation between the hour of the day and fire frequencies.
3.3. Cause-Wise Analysis to Understand Urban and Human Activities
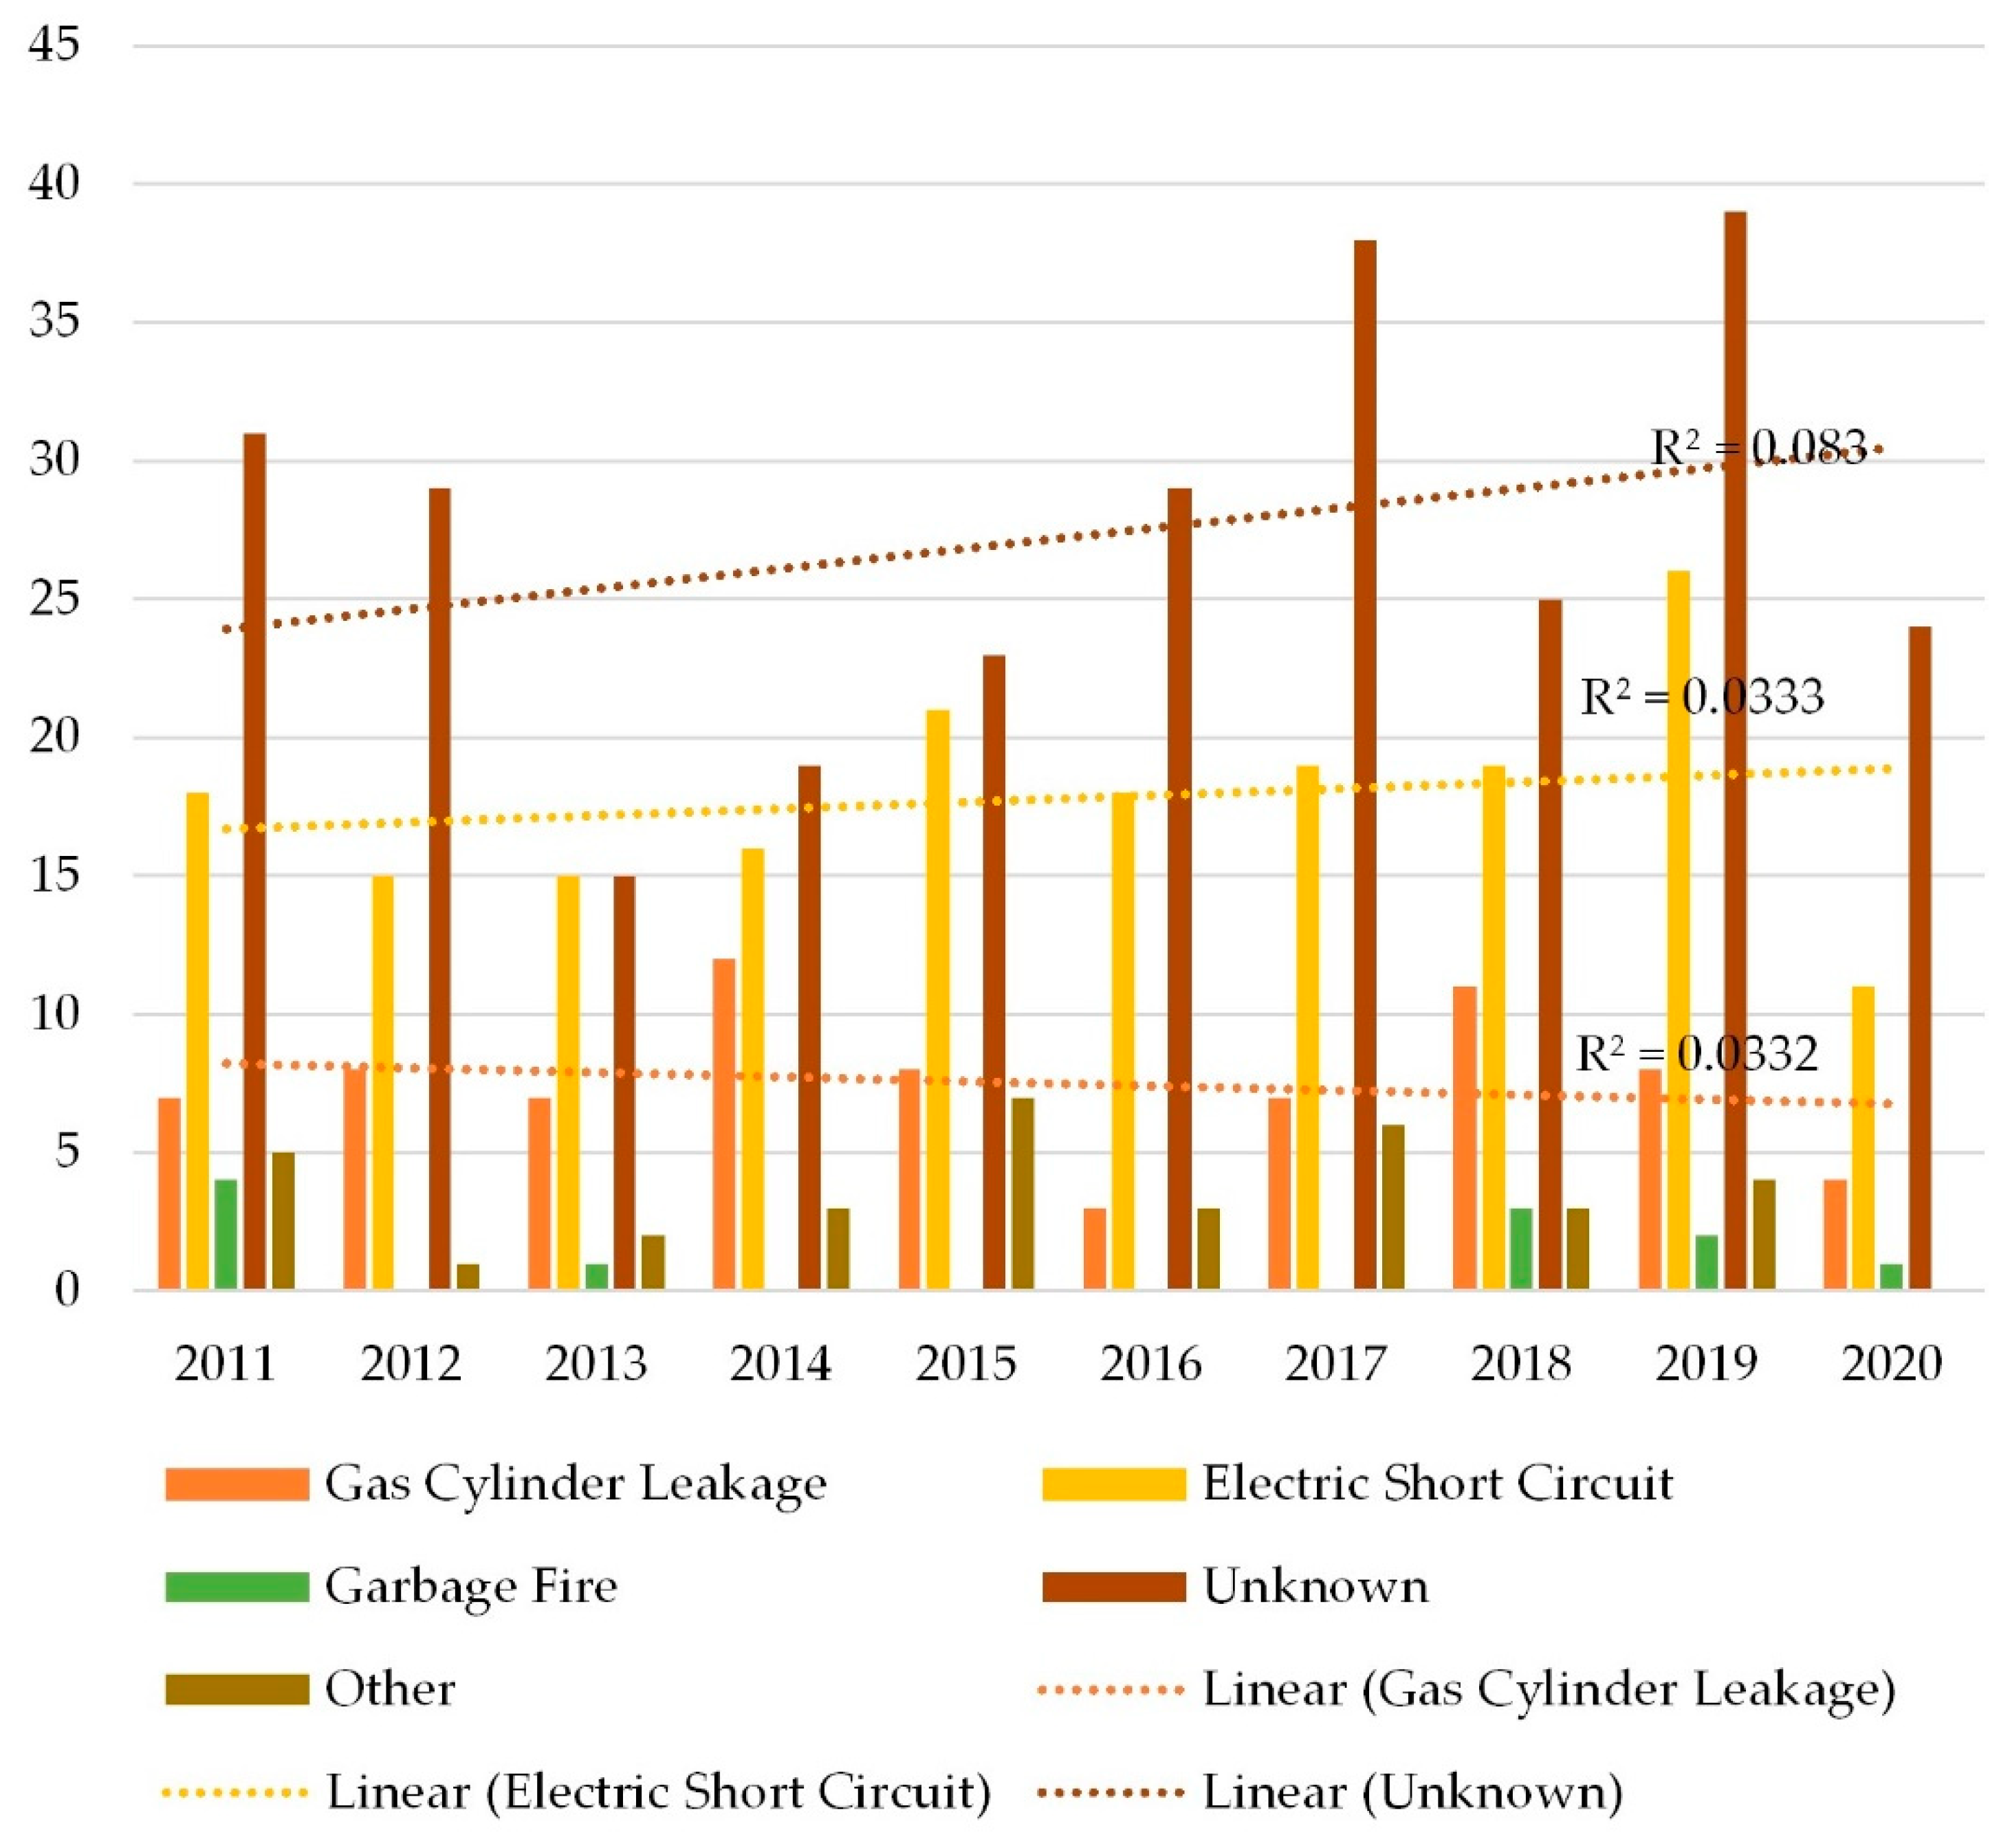
Table 8 represents the causes of the fire in the fire risk zones across the study period, classified in five types as gas cylinder leakage (14%), electric short circuits (31%), adjacent garbage fire (2%), other causes (6%) including lamps, cooking, mechanical failure, and electric press, and highest cause being unknown with 48% of total structure fires. All fire risk zones have a maximum of unknown causes followed by electric short circuits and gas cylinder leakages. The electric short circuit cause is generally due to increased load on electricity causing voltage fluctuation due to the operation of electrical cooling devices for comforting the confined spaces during the scorching hot May month, indicating the impact of climatic conditions.
Figure 13 depicts the yearly cause-wise fires with the trendlines of the unknown and electric short circuit causes showing a rise with an R2 value of 0.083 and 0.0333, respectively, indicating a gradual rise, and the gas leakage cause has a declining trendline with an R2 value of 0.0332. The unknown cause has to be studied in depth for identifying the actual causes for intervention and implications.
4. Discussion
The geospatial analyses approach connects the data to a spatial visualization map, integrating location data with all types of statistical and descriptive information, providing a foundation for mapping, and an analysis for urban planning, particularly for fire service provision. The quantification of the built-up areas and populations under risk is essential for efficient and effective mitigation. The historical fire incidence data of a decadal period for the hottest month of May with maximum fire frequencies are analyzed with the spatial analyst and statistics tools to identify the spatial variation of fire risk zones across the study area with an increasing population under persistent threat. The fire risk zone hotspot analysis through the KDE and HA(GOG*) is performed, compared, and estimated statistically.
4.1. Result Overview
The detection by KDE identifies one hotspot area through the entire city area, in the central core part of the city under a very high fire risk zone revealing the highest population under persistent threat. The high population size indicates the rapid growth of urbanization due to the prominent commercial and administrative activities associated with increased urban and human activities, resulting in the development of high rises and compact development that challenges the management of fire services. The KDE is a nonparametric technique identifying the probability density estimate of event hotspots, revealing the concentration of the fire events across the study period to identify the influenced areas.
The HA(GOG*) technique evaluates the fire risk zones statistically for the same data set and helps to understand results with statistically significant z-scores in the study. The very high fire risk class is the hotspot area above the critical value of 1.96 at a 95% confidence level, identifying three hotspot areas within the single identified hotspot area of the KDE analysis. The hotspot area comprises a total of 17 wards out of 34 wards of the KDE over an area of 5% out of 9% of the KDE, with a population density of 25,526 persons per km2 out of 29,860 persons per km2. The high and medium fire risk classes have wide variations influencing the varied population densities under respective threats. The results from both techniques have wide variation, and the results of HA(GOG*) are more accurate with statistical analysis than the KDE technique, helping decision makers to optimally and sustainably utilize resources.
The built-up areas under the significant fire risk zones are estimated to quantify the actual area and population size under persistent fire threats. The built-up density reveals the development pattern with the influenced population density. The very high fire risk zone has the highest population density at 27,994 persons per km2, whereas, at the ward level, the population density is 25,526 persons per km2, indicating the compact development. Meanwhile, the low fire risk zone has the second-highest built-up density, revealing the compactness but comparatively with less population density of the third rank.
Structure fires are most frequent in mercantile occupancy structures followed by residential and industrial within the identified hotspot areas, while residential structure fires are prominent in other fire risk areas followed with the mercantile class. The population density indicates that human activities contribute to the fire incidences, integrating the urbanization trend from the cause-wise analysis with the most common cause being the unknown cause, followed by electric short circuits and gas cylinder leakages. The temporal data analysis reveals that the maximum fire incidences occur on Thursday afternoons during the hot hours rather than the early morning and sleeping night hours. The result indicates the impact of human activities of daytime and hot climatic conditions with increased electrical load for cooling the confined spaces of structures.
4.2. Planning Implications
The geospatial analysis approaches are significantly useful for enhancing the efficiency of the fundamental fire services. The outcomes are helpful to the decision makers for fire disaster management purposes, both in terms of risk estimation [16,80,81] and impacts on the environmental services. The outcomes of the hotspot analysis provide evidence to the decision makers for improving the provision of fire services. The hotspot maps are a useful visualization tool for the policy makers implicating proactive planning with immediate resource allocations in the potential fire risk zones. Proactive planning has the potential to significantly minimize the losses and reduce the economic impact of fire hazards and is a powerful tool for planners attempting to enhance the efficiency of fire service and increase sustainability [82].
The temporal analysis reveals the maximum fire rates in the hot afternoon hours, implicating the resource allocative actions. Awareness programs for fire safety can be implemented regarding human activities to reduce fire incidence rates as assessed from the cause analysis. The fire frequency with an unknown cause has to be controlled by alerting the occupants about towards fire safety through public education. Fire safety behavior for gas cylinder operation is to be conducted repeatedly. Continuous awareness for public participation in prevention and suppression techniques to handle incipient fires through fire safety practices is to be encouraged [83]. Fire prevention and preparedness programs help to reduce the damages, promote the role of understanding in the community, and reduce the adverse impacts of fire in the ecosystem [17]. The policy has to be effectively planned and adopted at regular intervals with maximum participation considering the fire risk zones.
The results of the study can help to enhance the effectiveness of the emergency fire services over the potential spatial dimension with strategic proactive planning and interventions to build community resilience continuing the urban functionality fulfilling all the other fire safety objectives.
4.3. Limitations and Future Scope
The approach adopted for the study is with the data constraint limitations acquired from the administrative authority. The impact of socioeconomic factors on spatial fire incidence patterns can be researched with various interventions. −564. Secondly, the open-source Landsat images used are of 30-m resolution in most bands (4.5 pixels per acre) at a 16-day revisit cycle. The high-resolution images of 5-m have the potential to differentiate the built-up areas comprising buildings and varied sizes of opens spaces which are used as parks, gardens and open grounds enhancing to assess actual structural areas improving the accuracy of the built-up areas and thus is a limitation. In addition, visualizations in immersive virtual reality (VR) provide information in real-time and from a first-person perspective, which can be adopted for conducting future studies in detail at a smaller scale of the zone, ward, or neighborhood level, escalating the potential of fire safety objectives with sustainability. Furthermore, an “environmental approach” for the evaluation of the city is suggested due to the interdependence of various parameters to supplement our analysis and fulfill the fire safety objective of environment protection.
4.4. Linking with Urban Development Schemes and City’s Vision
Urban agglomeration integrates the physical, institutional, and socioeconomic infrastructure challenging fire service management [35]. Fire Services are the responsibilities of local bodies and play a significant role in the success of all governmental schemes of India such as AMRUT [46], PMAY [47], HRIDAY [48] carried out for the betterment of citizen’s life and infrastructure in the cities for sustainable urbanization. Nagpur City is achieving urban transformation under the Smart City Mission [51], and the second Smart City Proposal has additional convergence of the Solar City Programme, the Safe City Project Crime and Criminal Tracking Network and System (CCTNS) Project, and the National River Conservation Project [84]. The potential Transit-Oriented Development (TOD) due to the Metro Rail project across the city encourages high density mixed development through FSI of four or more along the Metro alignment, resulting in high rise development challenging fire service management. Fire services’ responsibility safeguards the functionality of urban centres, enhancing the quality of life and infrastructure. The study has the potential to inform policy makers and ULBs to reassess and restructure fire service targeting resource allocation for vulnerable built environments integrating the Smart Cities Mission [51], and is a significant preparatory tool for updating fire service in the country. This study output acts as a foundational step to achieving the research goals in detail overlapping the Smart City Goals [51], fulfilling the Sustainable Development Goals (SDG-11) [52], and helping urban planners and policy makers to develop a sustainable city, state, and nation.
5. Conclusions
The study investigated the historical structure fire events of the typical urban agglomerating mid-sized Indian city for a decade from 2011 to 2020. The analysis for the peak period of the year in the hottest month of May with the highest fire incidence frequency is evaluated for extreme consideration, revealing the direct impact of climatic conditions on fire incidence frequency affecting urban sustainable development.
The hotspot analysis delineates the areas with the highest vulnerability, along with other significant fire risk areas and revealing the random distribution of fire events, thus alerting urban planners to the need for the provision of appropriate fire services as fire incidences are unplanned events resulting in irrecoverable heavy losses. Fire service is the fundamental civic service to provide fire safety, fulfilling the objectives of protection to citizen’s lives, property loss, continuity of operations, environment protection, and heritage conservation, which also overlaps the goals of SDG 11, making cities resilient towards fire hazards developing a sustainable city, state, and nation.
The geoinformation techniques implementing KDE provide the visual concentration of the hotspot area, which is nonparametric, while the HA(GOG*) reveals the statistically significant hotspots delineating vulnerability of fire risk zones, which are within the KDE hotspot. The IDW interpolation of the hotspot analysis reveals the administrative zonal area at the local ward level for proactive fire service planning enhancing the efficiency, reducing the losses of life and property with clear visualization of risk areas. Remote sensing dataset and GIS tool quantified the actual built environment under the significant fire risk zones. The estimation of built-up area density and the population density reveals the urbanization impact with varied human activities in the urban built environment threatening sustainability concentrating in the central core part of the city. The cartographic maps developed through the spatial analysis helps in clear visualization to sense the severity of the structure fires in the city. Thursday of the weekdays had the maximum fire frequencies, and the hourly analysis revealed that the highest fire frequencies occurred during the hot afternoon hours of the day from noon to 5 pm and the hours of the waking human activities up to 10 pm, while night hours had the minimum frequencies. The major cause of electric short circuits, gas cylinder leakages, and unknown causes directly reflect the heavy load on electricity in hot hours for cooling, and gas cylinder leakages in hot hours emphasize the need for users’ awareness for minimizing the fire frequencies and hence, the losses.
The spatial statistical technique of GIS is an effective and powerful tool for detecting the significant fire risk zones from the historical dataset in urban planning contexts for proactive resource allocations, and strategic planning for mitigation programs minimizes the losses with the better use of finite resources, reducing the budgetary load on the government as fire service involves high budget investment and management. The outputs can be adopted for enhancing the potentiality of the fire services building community resilience. In addition, the methodology can be standardized for evaluation of similar-sized urban agglomeration of India quantifying the built environment upgrading the NDMA requirement to build urban resilient infrastructure and in accord with Smart City Mission.
Author Contributions
Conceptualization, P.P.S.; methodology, P.P.S.; formal analysis, P.P.S.; validation, P.P.S.; software, P.P.S.; writing—original draft preparation, P.P.S.; writing—review and editing, P.P.S.; supervision, C.S.S. and V.S.K. All authors have read and agreed to the published version of the manuscript.
Funding
This research received no external funding.
Acknowledgments
This research is funded by the scholarship awarded to Priya Singh from the Ministry of Human Resource Development (MHRD), Government of India. The authors are thankful to the Fire Service Department of Nagpur Municipal Corporation for providing the data and information helping to carry out the study. The authors also are thankful to the staff of other departments of Nagpur Municipal Corporation for sharing the data and knowledge regarding the study. Furthermore, the authors are thankful to the anonymous reviewers and editors for providing insightful comments that helped to improve the manuscript.
Conflicts of Interest
The authors declare no conflict of interest.
Appendix A
Figure A1.
LULC 2011 accuracy assessment random points image in (a) GIS (b) Google Earth.


Table A1.
Accuracy assessment of LULC-2011.
| LULC 2011 | Built-Up | Vegetation | Fallow Land | Water Bodies | Row Total | User’s Accuracy |
|---|---|---|---|---|---|---|
| Built-Up | 12 | 1 | 1 | 0 | 14 | 86 |
| Vegetation | 0 | 7 | 1 | 0 | 8 | 88 |
| Fallow Land | 0 | 0 | 7 | 0 | 7 | 100 |
| Water Bodies | 0 | 0 | 0 | 5 | 5 | 100 |
| Total | 12 | 8 | 9 | 5 | 34 | |
| Producer’s Accuracy | 100 | 88 | 78 | 100 | ||
| Overall Accuracy | 91 | |||||
| Kappa Coefficient | 85 | |||||
Figure A2.
LULC-2020 accuracy assessment random points image in (a) GIS (b) Google Earth.

Table A2.
Accuracy assessment of LULC-2020.
| LULC 2011 | Built-Up | Vegetation | Fallow Land | Water Bodies | Row Total | User’s Accuracy |
|---|---|---|---|---|---|---|
| Built-Up | 12 | 0 | 1 | 0 | 13 | 92 |
| Vegetation | 0 | 7 | 1 | 0 | 8 | 88 |
| Fallow Land | 1 | 0 | 6 | 0 | 7 | 100 |
| Water Bodies | 0 | 0 | 0 | 5 | 5 | 100 |
| Total | 13 | 7 | 8 | 5 | 33 | |
| Producer’s Accuracy | 92 | 100 | 75 | 100 | ||
| Overall Accuracy | 91 | |||||
| Kappa Coefficient | 86 | |||||
References
- Brushlinsky, N.N.; Ahrens, M.; Sokolov, S.V.; Wagner, P. World Fire Statistics, Centre of Fire Statistics 25. 2020. Available online: http://www.ctif.org/sites/default/files/ctif_report23_world_fire_statistics_2018.pdf (accessed on 11 September 2020).
- Pinkerton and FICCI, India Risk Survey 2019. Available online: https://ficci.in/Sedocument/20487/India-Risk-Survey-2019-ficci.pdf (accessed on 23 April 2019).
- National Crime Records Bureau 2019. Available online: https://ncrb.gov.in/en/crime-india-2019-0 (accessed on 23 August 2020).
- Rahardjo, H.A.; Prihanton, M. The most critical issues and challenges of fire safety for building sustainability in Jakarta. J. Build. Eng. 2020, 29, 101133. [Google Scholar] [CrossRef]
- Lee, Y.H.; Kim, M.S.; Lee, J.S. Firefighting in vulnerable areas based on the connection between fire hydrants and fire brigade. Sustainability 2021, 13, 98. [Google Scholar] [CrossRef]
- UNDESA. Department of Economics and Social Affairs. 2017. Available online: https://www.un.org/development/desa/en/news/population/2018-revision-of-world-urbanization-prospects.html (accessed on 11 May 2019).
- UN-Habitat. World Cities Report 2016, Urbanization and Development: Emerging Futures. Available online: www.unhabitat.org (accessed on 11 May 2019).
- Mckinsey. India’s Urban Awakening: Building Inclusive Cities, Sustaining Economic Growth. 2010. Available online: https://www.mckinsey.com//media/Mckinsey/GlobalThemes/Urbanization/UrbanawakeninginIndia/MGI_Indias_urban_awakening_executive_summary.ashx (accessed on 18 November 2018).
- Kantakumar, L.N.; Kumar, S.; Schneider, K. SUSM: A scenario-based urban growth simulation model using remote sensing data. Eur. J. Remote Sens. 2019, 52, 26–41. [Google Scholar] [CrossRef] [Green Version]
- Perez, J.; Fusco, G.; Moriconi-Ebrard, F. Identification and quantification of urban space in India: Defining urban macro-structures. Urban Stud. 2019, 56, 1988–2004. [Google Scholar] [CrossRef]
- Zhang, X.; Yao, J.; Sila-Nowicka, K.; Jin, Y. Urban fire dynamics and its association with urban growth: Evidence from Nanjing, China. ISPRS Int. J. Geo Inf. 2020, 9, 218. [Google Scholar] [CrossRef] [Green Version]
- Kiran, K.C.; Corcoran, J. Modelling residential fire incident response times: A spatial analytic approach. Appl. Geogr. 2017, 84, 64–74. [Google Scholar] [CrossRef]
- Yao, J.; Zhang, X. Location optimization of fire stations: Trade-off between accessibility and service coverage. In Proceedings of the 9th International Conference on GIScience Short Paper Proceedings, Montreal, QC, Canada, 27–30 September 2016. [Google Scholar] [CrossRef] [Green Version]
- Yao, J.; Zhang, X.; Murray, A.T. Location optimization of urban fire stations: Access and service coverage. Comput. Environ. Urban Syst. 2019, 73, 184–190. [Google Scholar] [CrossRef]
- Špatenková, O.; Virrantaus, K. Discovering Spatio-temporal relationships in the distribution of building fires. Fire Saf. J. 2013, 62, 49–63. [Google Scholar] [CrossRef]
- Masoumi, Z.; van L Genderen, J.; Maleki, J. Fire risk assessment in dense urban areas using information fusion techniques. ISPRS Int. J. Geo-Inf. 2019, 8, 579. [Google Scholar] [CrossRef] [Green Version]
- Raškauskaitė, R.; Grigonis, V. An Approach for the analysis of the accessibility of fire hydrants in urban territories. ISPRS Int. J. Geo-Inf. 2019, 8, 587. [Google Scholar] [CrossRef] [Green Version]
- Corcoran, J.; Higgs, G.; Brunsdon, C.; Ware, A.; Norman, P. The use of spatial analytical techniques to explore patterns of fire incidence: A South Wales case study. Comput. Environ. Urban Syst. 2007, 31, 623–647. [Google Scholar] [CrossRef]
- Gul Guldåker, N.; Hallin, P.O. Spatio-temporal patterns of intentional fires, social stress and socio-economic determinants: A case study of Malmö, Sweden. Fire Saf. J. 2014, 70, 71–80. [Google Scholar] [CrossRef] [Green Version]
- Corcoran, J.; Higgs, G.; Higginson, A. Fire incidence in metropolitan areas: A comparative study of Brisbane (Australia) and Cardiff (United Kingdom). Appl. Geogr. 2011, 31, 65–75. [Google Scholar] [CrossRef]
- Ardianto, R.; Chhetri, P. Modeling spatial-temporal dynamics of urban residential fire risk using a Markov chain technique. Int. J. Disaster Risk Sci. 2019, 10, 57–73. [Google Scholar] [CrossRef] [Green Version]
- Jennings, C.R. Socioeconomic characteristics and their relationship to fire incidence: A review of the literature. Fire Technol. 1999, 35, 7–34. [Google Scholar] [CrossRef]
- Wang, Z.; Zhang, X.; Xu, B. Spatio-temporal features of China’s urban fires: An investigation with reference to gross domestic product and humidity. Sustainability 2015, 7, 9734–9752. [Google Scholar] [CrossRef] [Green Version]
- Jennings, C.R. Social and economic characteristics as determinants of residential fire risk in urban neighborhoods: A review of the literature. Fire Saf. J. 2013, 62, 13–19. [Google Scholar] [CrossRef]
- Duncanson, M.; Woodward, A.; Reid, P. Socioeconomic deprivation and fatal unintentional domestic fire incidents in New Zealand 1993–1998. Fire Saf. J. 2002, 37, 165–179. [Google Scholar] [CrossRef]
- Chhetri, P.; Corcoran, J.; Stimson, R.J.; Inbakaran, R. Modelling potential Socio-economic determinants of building fires in southeast Queensland. Geogr. Res. 2010, 48, 75–85. [Google Scholar] [CrossRef]
- Wuschke, K.; Clare, J.; Garis, L. Temporal and geographic clustering of residential structure fires: A theoretical platform for targeted fire prevention. Fire Saf. J. 2013, 62, 3–12. [Google Scholar] [CrossRef]
- Corcoran, J.; Higgs, G.; Brunsdon, C.; Ware, A. The use of comaps to explore the spatial and temporal dynamics of fire incidents: A case study in South Wales, United Kingdom. Prof. Geogr. 2007, 59, 521–536. [Google Scholar] [CrossRef] [Green Version]
- LeBlanc, J.C.; Pless, I.B.; King, W.J.; Bawden, H.; Bernard-Bonnin, A.C.; Klassen, T.; Tenenbein, M. Home safety measures and the risk of unintentional injury among young children: A multicentre case-control study. CMAJ 2006, 175, 883–887. [Google Scholar] [CrossRef] [PubMed] [Green Version]
- Besag, J.; Newell, J. The detection of clusters in rare diseases. J. R. Stat. Soc. Ser. A Stat. Soc. 1991, 154, 143–155. [Google Scholar] [CrossRef]
- Schaefer, A.J.; Magi, B.I. Land-cover dependent relationships between fire and soil moisture. Fire 2019, 2, 55. [Google Scholar] [CrossRef] [Green Version]
- Sequeira, C.R.; Rego, F.C.; Montiel-Molina, C.; Morgan, P. Half-century changes in LULC and fire in two iberian inner mountain areas. Fire 2019, 2, 45. [Google Scholar] [CrossRef] [Green Version]
- Caggiano, M.D.; Hawbaker, T.J.; Gannon, B.M.; Hoffman, C.M. Building loss in WUI disasters: Evaluating the core components of the wildland–Urban interface definition. Fire 2020, 3, 73. [Google Scholar] [CrossRef]
- Dhyani, S.; Lahoti, S.; Khare, S.; Pujari, P.; Verma, P. Ecosystem based disaster risk reduction approaches (EbDRR) as a prerequisite for inclusive urban transformation of Nagpur City, India. Int. J. Disaster Risk Reduct. 2018, 32, 95–105. [Google Scholar] [CrossRef]
- Singh, P.P.; Sabnani, C.S.; Kapse, V.S. Integrating benchmark assessment of emergency fire service using geoinformation technology. Int. J. Disaster Risk Reduct. 2021, 63, 102432. [Google Scholar] [CrossRef]
- Asgary, A.; Ghaffari, A.; Levy, J. Spatial and temporal analyses of structural fire incidents and their causes: A case of Toronto, Canada. Fire Saf. J. 2010, 45, 44–57. [Google Scholar] [CrossRef]
- Han, A.; Qing, S.; Bao, Y.; Na, L.; Bao, Y.; Liu, X.; Zhang, J.; Wang, C. Short-term effects of fire severity on vegetation based on sentinel-2 satellite data. Sustainability 2021, 13, 432. [Google Scholar] [CrossRef]
- Lin, Y.S. Estimations of the probability of fire occurrences in buildings. Fire Saf. J. 2005, 40, 728–735. [Google Scholar] [CrossRef]
- Hanea, D.; Ale, B. Risk of human fatality in building fires: A decision tool using Bayesian networks. Fire Saf. J. 2009, 44, 704–710. [Google Scholar] [CrossRef]
- Wu, J.; Hu, Z.; Chen, J.; Li, Z. Risk assessment of underground subway stations to fire disasters using Bayesian network. Sustainability 2018, 10, 3810. [Google Scholar] [CrossRef] [Green Version]
- ArcGIS Desktop. Arcmap 10.3; An overview of the Mapping Clusters toolset. Available online: https://desktop.arcgis.com/en/arcmap/10.3/tools/spatial-statistics-toolbox/an-overview-of-the-mapping-clusters-toolset.htm (accessed on 11 March 2020).
- Majumder, R.; Bhunia, G.S.; Patra, P.; Mandal, A.C.; Ghosh, D.; Shit, P.K. Assessment of flood hotspot at a village level using GIS-based spatial statistical techniques. Arab. J. Geosci. 2019, 12, 1–12. [Google Scholar] [CrossRef]
- ZahranEl-Said, M.M.; Jiann, T.S.; Mohamad’Asri, N.A.A.B.; Tan, E.H.A.; Yap, Y.H.; Rahman, E.K.A. Evaluation of various GIS-based methods for the analysis of road traffic accident hotspot. In MATEC Web of Conferences; EDP Sciences: Les Ulis, France, 2019; Volume 258, p. 03008. [Google Scholar] [CrossRef] [Green Version]
- Andersen, M.A.; Wuschke, K.; Kinney, J.B.; Brantingham, P.; Brantingham, P.J. Cartograms, crime and location quotients. Crime Patterns Anal. 2009, 2, 31–46. [Google Scholar]
- Constitution of India. Twelth Schedule-Arcticle 243 W. 1950. Available online: https://www.constitutionofindia.net/constitution_of_india/article_243w/articles (accessed on 14 August 2020).
- Atal Mission for Rejuvenation and Urban Transformation. Mission Statement and Guidelines, Ministry of Urban Development, Government of India. Available online: http://amrut.gov.in/upload/uploadfiles/files/AMRUT%20Guidelines%20(1).pdf (accessed on 25 January 2019).
- Pradhan Mantri Awas Yojna, Housing for All (Urban), Scheme Guidelines, Ministry of Housing and Urban Poverty Alleviation, Government of India, 2015. Available online: https://pmaymis.gov.in/PDF/HFA_Guidelines/hfa_Guidelines.pdf. (accessed on 27 January 2019).
- Heritage City Development & Augmentation Yojna. Ministry of Urban Development, Government of India. Available online: http://mohua.gov.in/upload/uploadfiles/files/Guidelines%20HRIDAY.pdf (accessed on 25 January 2019).
- National Disaster Management Authority, Government of India. Available online: https://ndma.gov.in/Response/Fire-Service (accessed on 16 September 2019).
- Kiran, K.C.; Corcoran, J.; Chhetri, P. Measuring the spatial accessibility to fire stations using enhanced floating catchment method. Socio Econ. Plan. Sci. 2020, 69, 100673. [Google Scholar] [CrossRef]
- Smart City Mission. Transform-nation, Mission Statement and Guidelines, Ministry of Urban Development, Government of India. 2015. Available online: https://smartcities.gov.in (accessed on 11 September 2019).
- Sustainable Development Goals, SDG-11. Available online: https://www.un.org/sustainabledevelopment/cities/ (accessed on 22 September 2019).
- Census of India. Census Digital Library. Registrar General & Census Commissioner, India, Ministry of Home affairs, Government of India. 2011. Available online: https://www.censusindia.gov.in/2011-Common/CensusData2011.html (accessed on 22 September 2018).
- India Meteorological Department (IMD); Ministry of Earth Sciences; Climate Application and User Interface; Climatology of Smart Cities, Climate Smart City-Nagpur (Sonegaon). Available online: https://imdpune.gov.in/caui/smartcities.html (accessed on 23 March 2021).
- Nagpur Municipal Corporation. Available online: https://www.nmcnagpur.gov.in/assets/250/2018/10/.../Final_CDP_Nagpur_Mar_15.pdf (accessed on 11 August 2019).
- Zhang, X.; Yao, J.; Sila-Nowicka, K. Exploring spatiotemporal dynamics of urban fires: A case of Nanjing, China. ISPRS Int. J. Geo Inf. 2018, 7, 7. [Google Scholar] [CrossRef] [Green Version]
- World Urbanization Prospects 2018-United Nations Population Estimates and Projections of Major Urban Agglomerations. Available online: https://worldpopulationreview.com/world-cities/nagpur-population. (accessed on 22 March 2019).
- National Building Code of India (NBCI) 2016, Bureau of Indian Standards, The National Standards Body of India; Government of India: New Delhi, India, 2016.
- Hart, T.; Zandbergen, P. Kernel density estimation and hotspot mapping. Polic. Int. J. Police Strategy Manag. 2014, 37, 305–323. [Google Scholar] [CrossRef]
- Barbosa, M.L.F.; Delgado, R.C.; Teodoro, P.E.; Pereira, M.G.; Correia, T.P.; de Mendonça, B.A.F.; de Ávila Rodrigues, R. Occurrence of fire foci under different land uses in the State of Amazonas during the 2005 drought. Environ. Dev. Sustain. 2019, 21, 2707–2720. [Google Scholar] [CrossRef]
- Colak, H.E.; Memisoglu, T.; Erbas, Y.S.; Bediroglu, S. Hot spot analysis based on network spatial weights to determine spatial statistics of traffic accidents in Rize, Turkey. Arab. J. Geosci. 2018, 11, 1–11. [Google Scholar] [CrossRef]
- ESRI. Available online: https://desktop.arcgis.com/en/arcmap/10.3/tools/3d-analyst-toolbox/how-idw-works.htm#:~:text=Inverse%20distance%20weighted%20(IDW)%20interpolation,of%20a%20locationally%20dependent%20variable (accessed on 30 April 2021).
- Silverman, B.W. Density Estimation for Statistics and Data Analysis; Routledge: London, UK, 2018. [Google Scholar] [CrossRef]
- Ord, J.K.; Getis, A. Local spatial autocorrelation statistics: Distributional issues and an application. Geogr. Anal. 1995, 27, 286–306. [Google Scholar] [CrossRef]
- Srikanth, L.; Srikanth, I. A case study on kernel density estimation and hotspot analysis methods in traffic safety management. In Proceedings of the 2020 International Conference on COMmunication Systems & NETworkS (COMSNETS), IEEE, Bangalore, India, 7–11 January 2020; pp. 99–104. [Google Scholar] [CrossRef]
- Lippi, C.A.; Stewart-Ibarra, A.M.; Romero, M.; Lowe, R.; Mahon, R.; Van Meerbeeck, C.J.; Rollock, L.; Hilaire, M.G.S.; Trotman, A.R.; Holligan, D.; et al. Spatiotemporal tools for emerging and endemic disease hotspots in small areas: An analysis of dengue and chikungunya in Barbados, 2013–2016. Am. J. Trop. Med. Hyg. 2020, 103, 149–156. [Google Scholar] [CrossRef]
- Smith, M.; Goodchild, M.F.; Longley, P.A. Geoespatial Analisys. A Comprehensive Guide to Principles Techniques and Software Tools. Available online: https://www.spatialanalysisonline.com/extractv6.pdf (accessed on 12 May 2021).
- ESRI. How Hotspot Analysis (Getis-Ord Gi*) Works. Available online: https://pro.arcgis.com/en/pro-app/latest/tool-reference/spatial-statistics/h-how-hot-spot-analysis-getis-ord-gi-spatial-stati.htm (accessed on 11 February 2020).
- Simpson, S. Resource allocation by measures of relative social need in geographical areas: The relevance of the signed χ2, the percentage, and the raw count. Environ. Plan. A 1996, 28, 537–554. [Google Scholar] [CrossRef]
- Prasannakumar, V.; Vijith, H.; Charutha, R.; Geetha, N. Spatio-temporal clustering of road accidents: GIS-based analysis and assessment. Procedia Soc. Behav. Sci. 2011, 21, 317–325. [Google Scholar] [CrossRef] [Green Version]
- Montiel-Molina, C.; Vilar, L.; Romão-Sequeira, C.; Karlsson, O.; Galiana-Martín, L.; Madrazo-García de Lomana, G.; Palacios-Estremera, M.T. Have historical land use/land cover changes triggered a fire regime shift in central Spain? Fire 2019, 2, 44. [Google Scholar] [CrossRef] [Green Version]
- Chettry, V.; Surawar, M. Assessment of urban sprawl characteristics in Indian cities using remote sensing: Case studies of Patna, Ranchi, and Srinagar. Environ. Dev. Sustain. 2021, 23, 11913–11935. [Google Scholar] [CrossRef]
- Patel, N.; Mukherjee, R. Extraction of impervious features from spectral indices using artificial neural network. Arab. J. Geosci. 2015, 8, 3729–3741. [Google Scholar] [CrossRef]
- Minta, M.; Kibret, K.; Thorne, P.; Nigussie, T.; Nigatu, L. Land use and land cover dynamics in Dendi-Jeldu hilly-mountainous areas in the central Ethiopian highlands. Geoderma 2018, 314, 27–36. [Google Scholar] [CrossRef]
- Korhonen, P.; Moskowitz, H.; Wallenius, J. Multiple criteria decision support-A review. Eur. J. Oper. Res. 1992, 63, 361–375. [Google Scholar] [CrossRef]
- Krackhardt, D. Predicting with networks: Nonparametric multiple regression analysis of dyadic data. Soc. Netw. 1988, 10, 359–381. [Google Scholar] [CrossRef]
- White, K.J. The Durbin-Watson test for autocorrelation in nonlinear models. Rev. Econ. Stat. 1992, 370–373. [Google Scholar] [CrossRef]
- Lee, J.H.; Chun, W.Y.; Choi, J.H. Weighting the attributes of human-related activities for fire safety measures in historic villages. Sustainability 2021, 13, 3236. [Google Scholar] [CrossRef]
- Ricotta, C.; Bajocco, S.; Guglietta, D.; Conedera, M. Assessing the influence of roads on fire ignition: Does land cover matter? Fire 2018, 1, 24. [Google Scholar] [CrossRef] [Green Version]
- Nyimbili, P.H.; Erden, T. A hybrid approach integrating entropy-AHP and GIS for suitability assessment of urban emergency facilities. ISPRS Int. J. Geo Inf. 2020, 9, 419. [Google Scholar] [CrossRef]
- Vani, M.; Prasad, P.R.C. Assessment of spatio-temporal changes in land use and land cover, urban sprawl, and land surface temperature in and around Vijayawada city, India. Environ. Dev. Sustain. 2020, 22, 3079–3095. [Google Scholar] [CrossRef]
- Syphard, A.D.; Rustigian-Romsos, H.; Keeley, J.E. Multiple-scale relationships between vegetation, the wildland–urban interface, and structure loss to wildfire in California. Fire 2021, 4, 12. [Google Scholar] [CrossRef]
- Ebenehi, I.Y.; Mohamed, S.; Sarpin, N.; Masrom, M.A.N.; Zainal, R.; Azmi, M.M. The management of building fire safety towards the sustainability of Malaysian public universities. In Proceedings of the IOP Conference Series: Materials Science and Engineering, Birmingham, UK, 13–15 October 2017; Volume 271, p. 012034. [Google Scholar] [CrossRef]
- The Smart City Challenge, Stage 2, Smart City Proposal, Nagpur. Available online: http://smartcities.gov.in/upload/uploadfiles/files/Nagpur_SCP.pdf (accessed on 25 January 2020).
Figure 1.
The geographical location of the study area with structure fires across the study period.
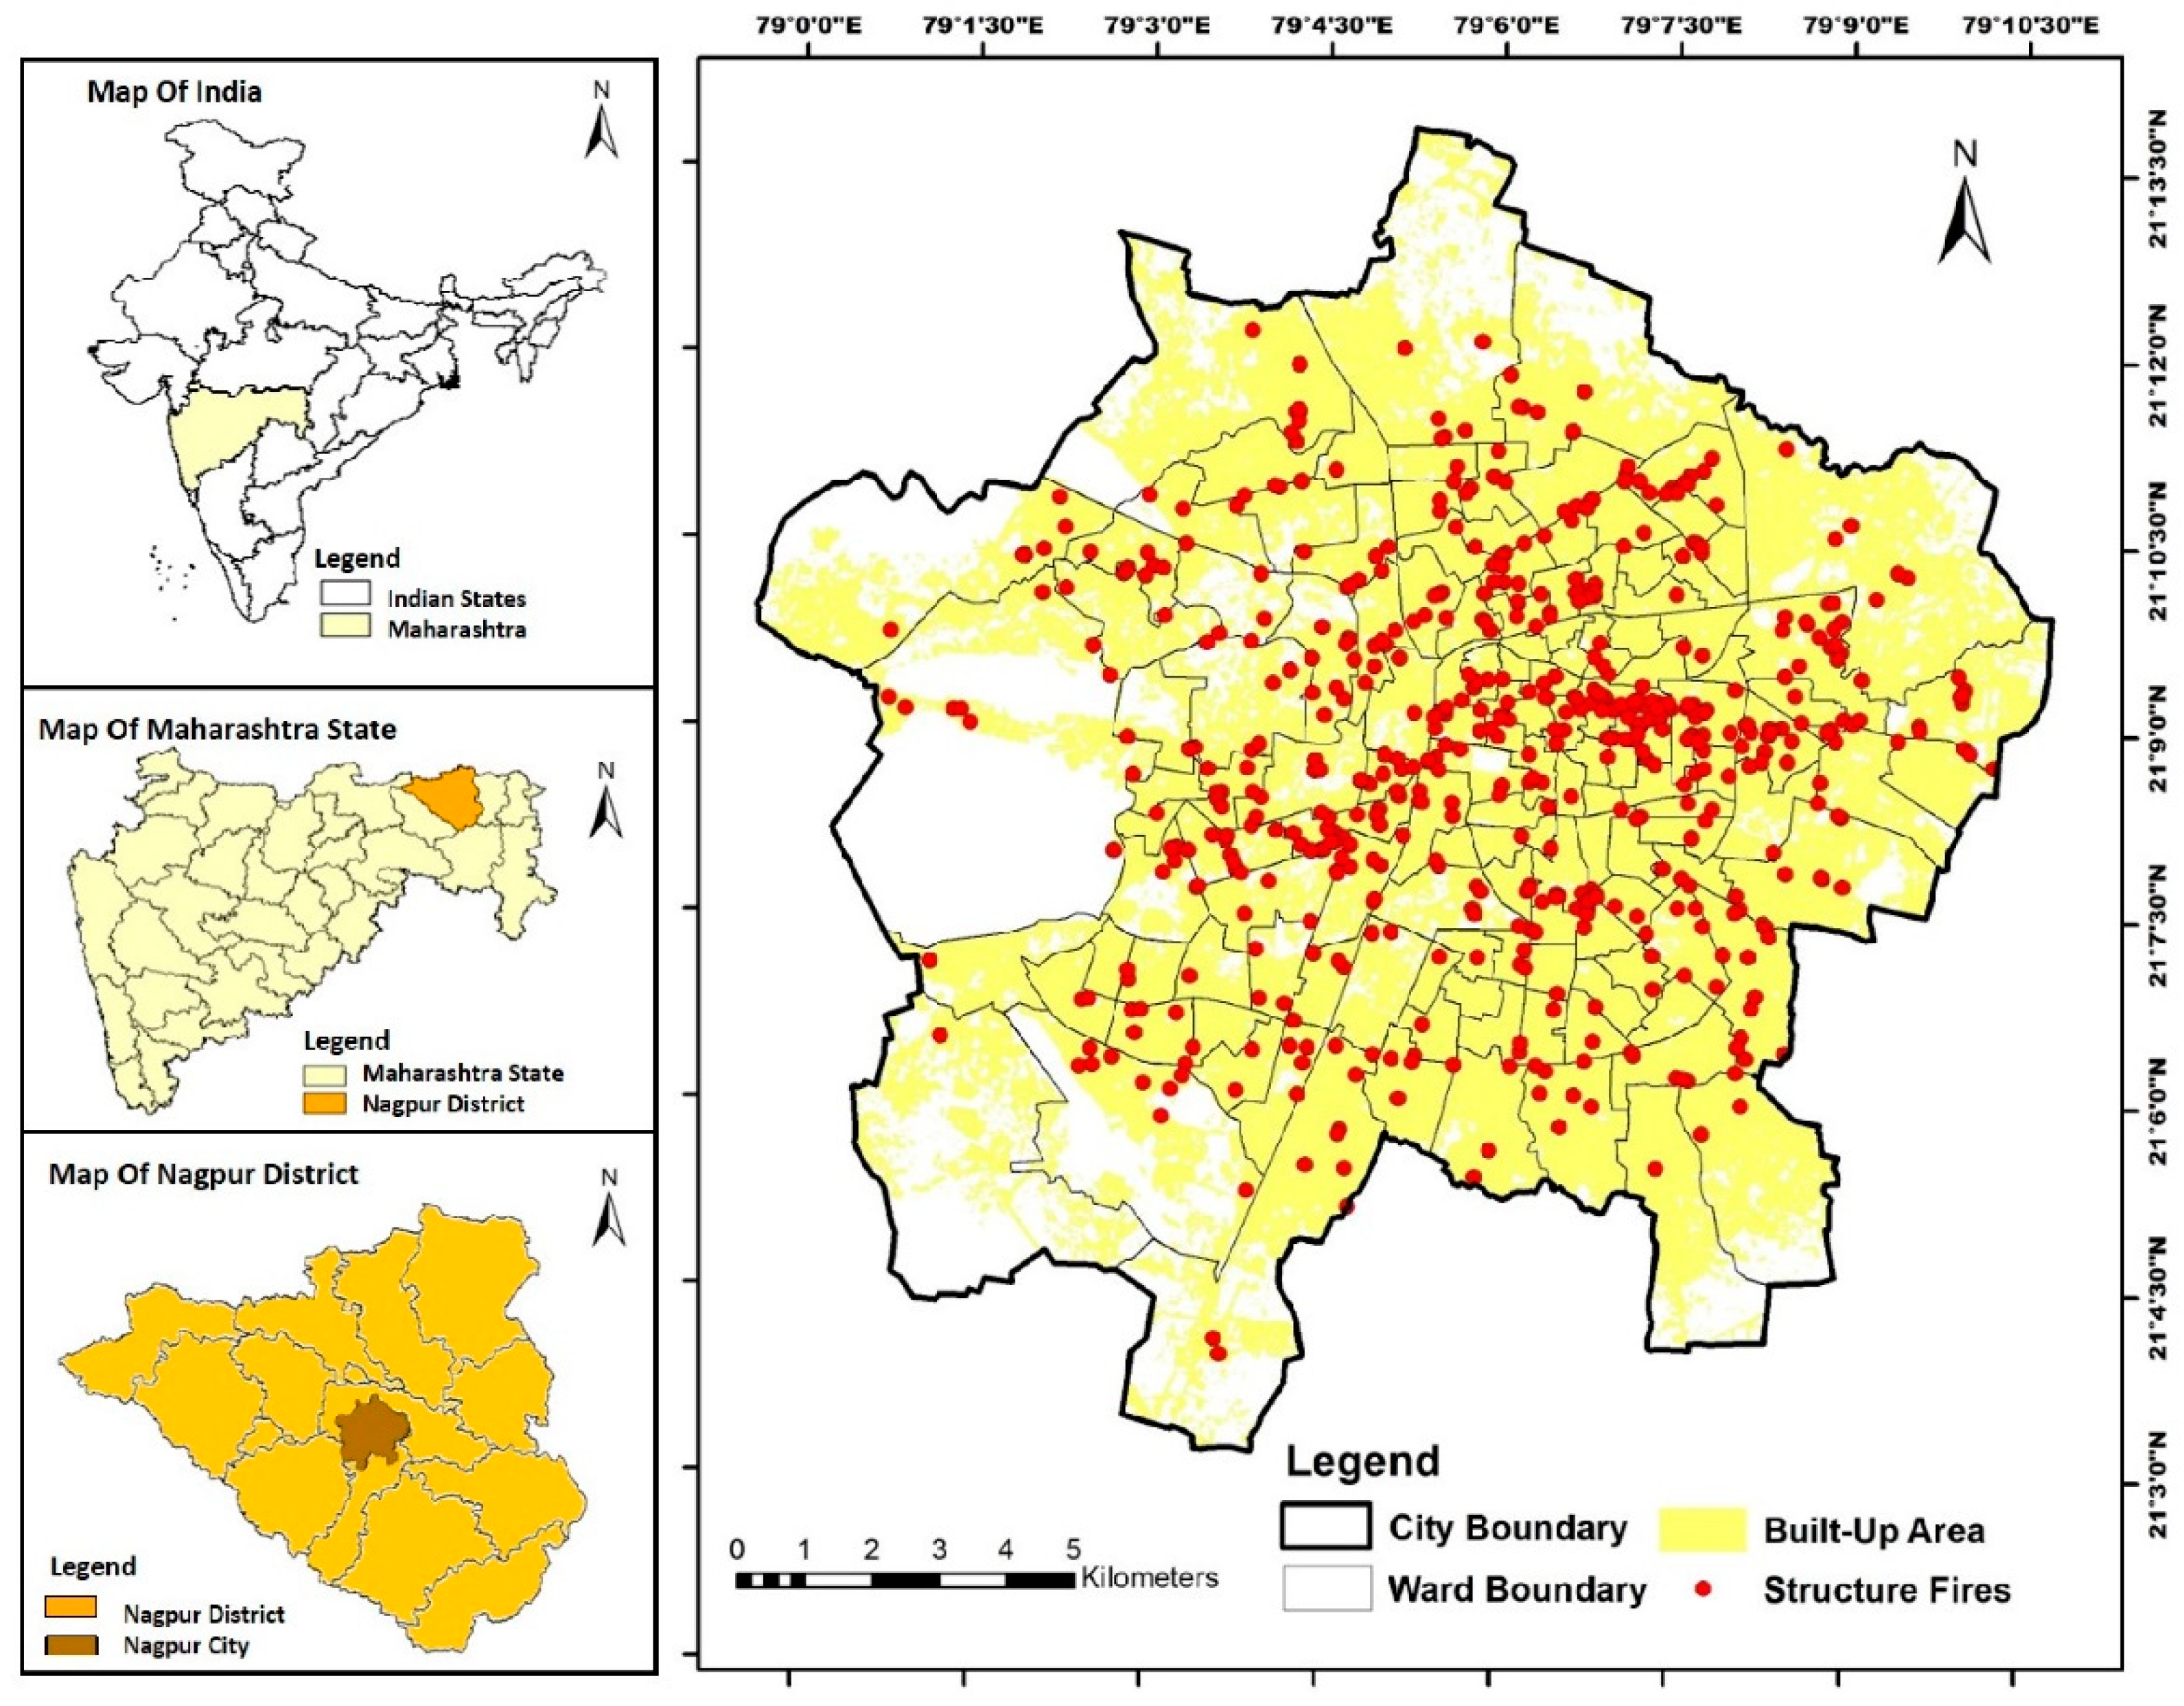
Figure 2.
Monthly fire incidences.
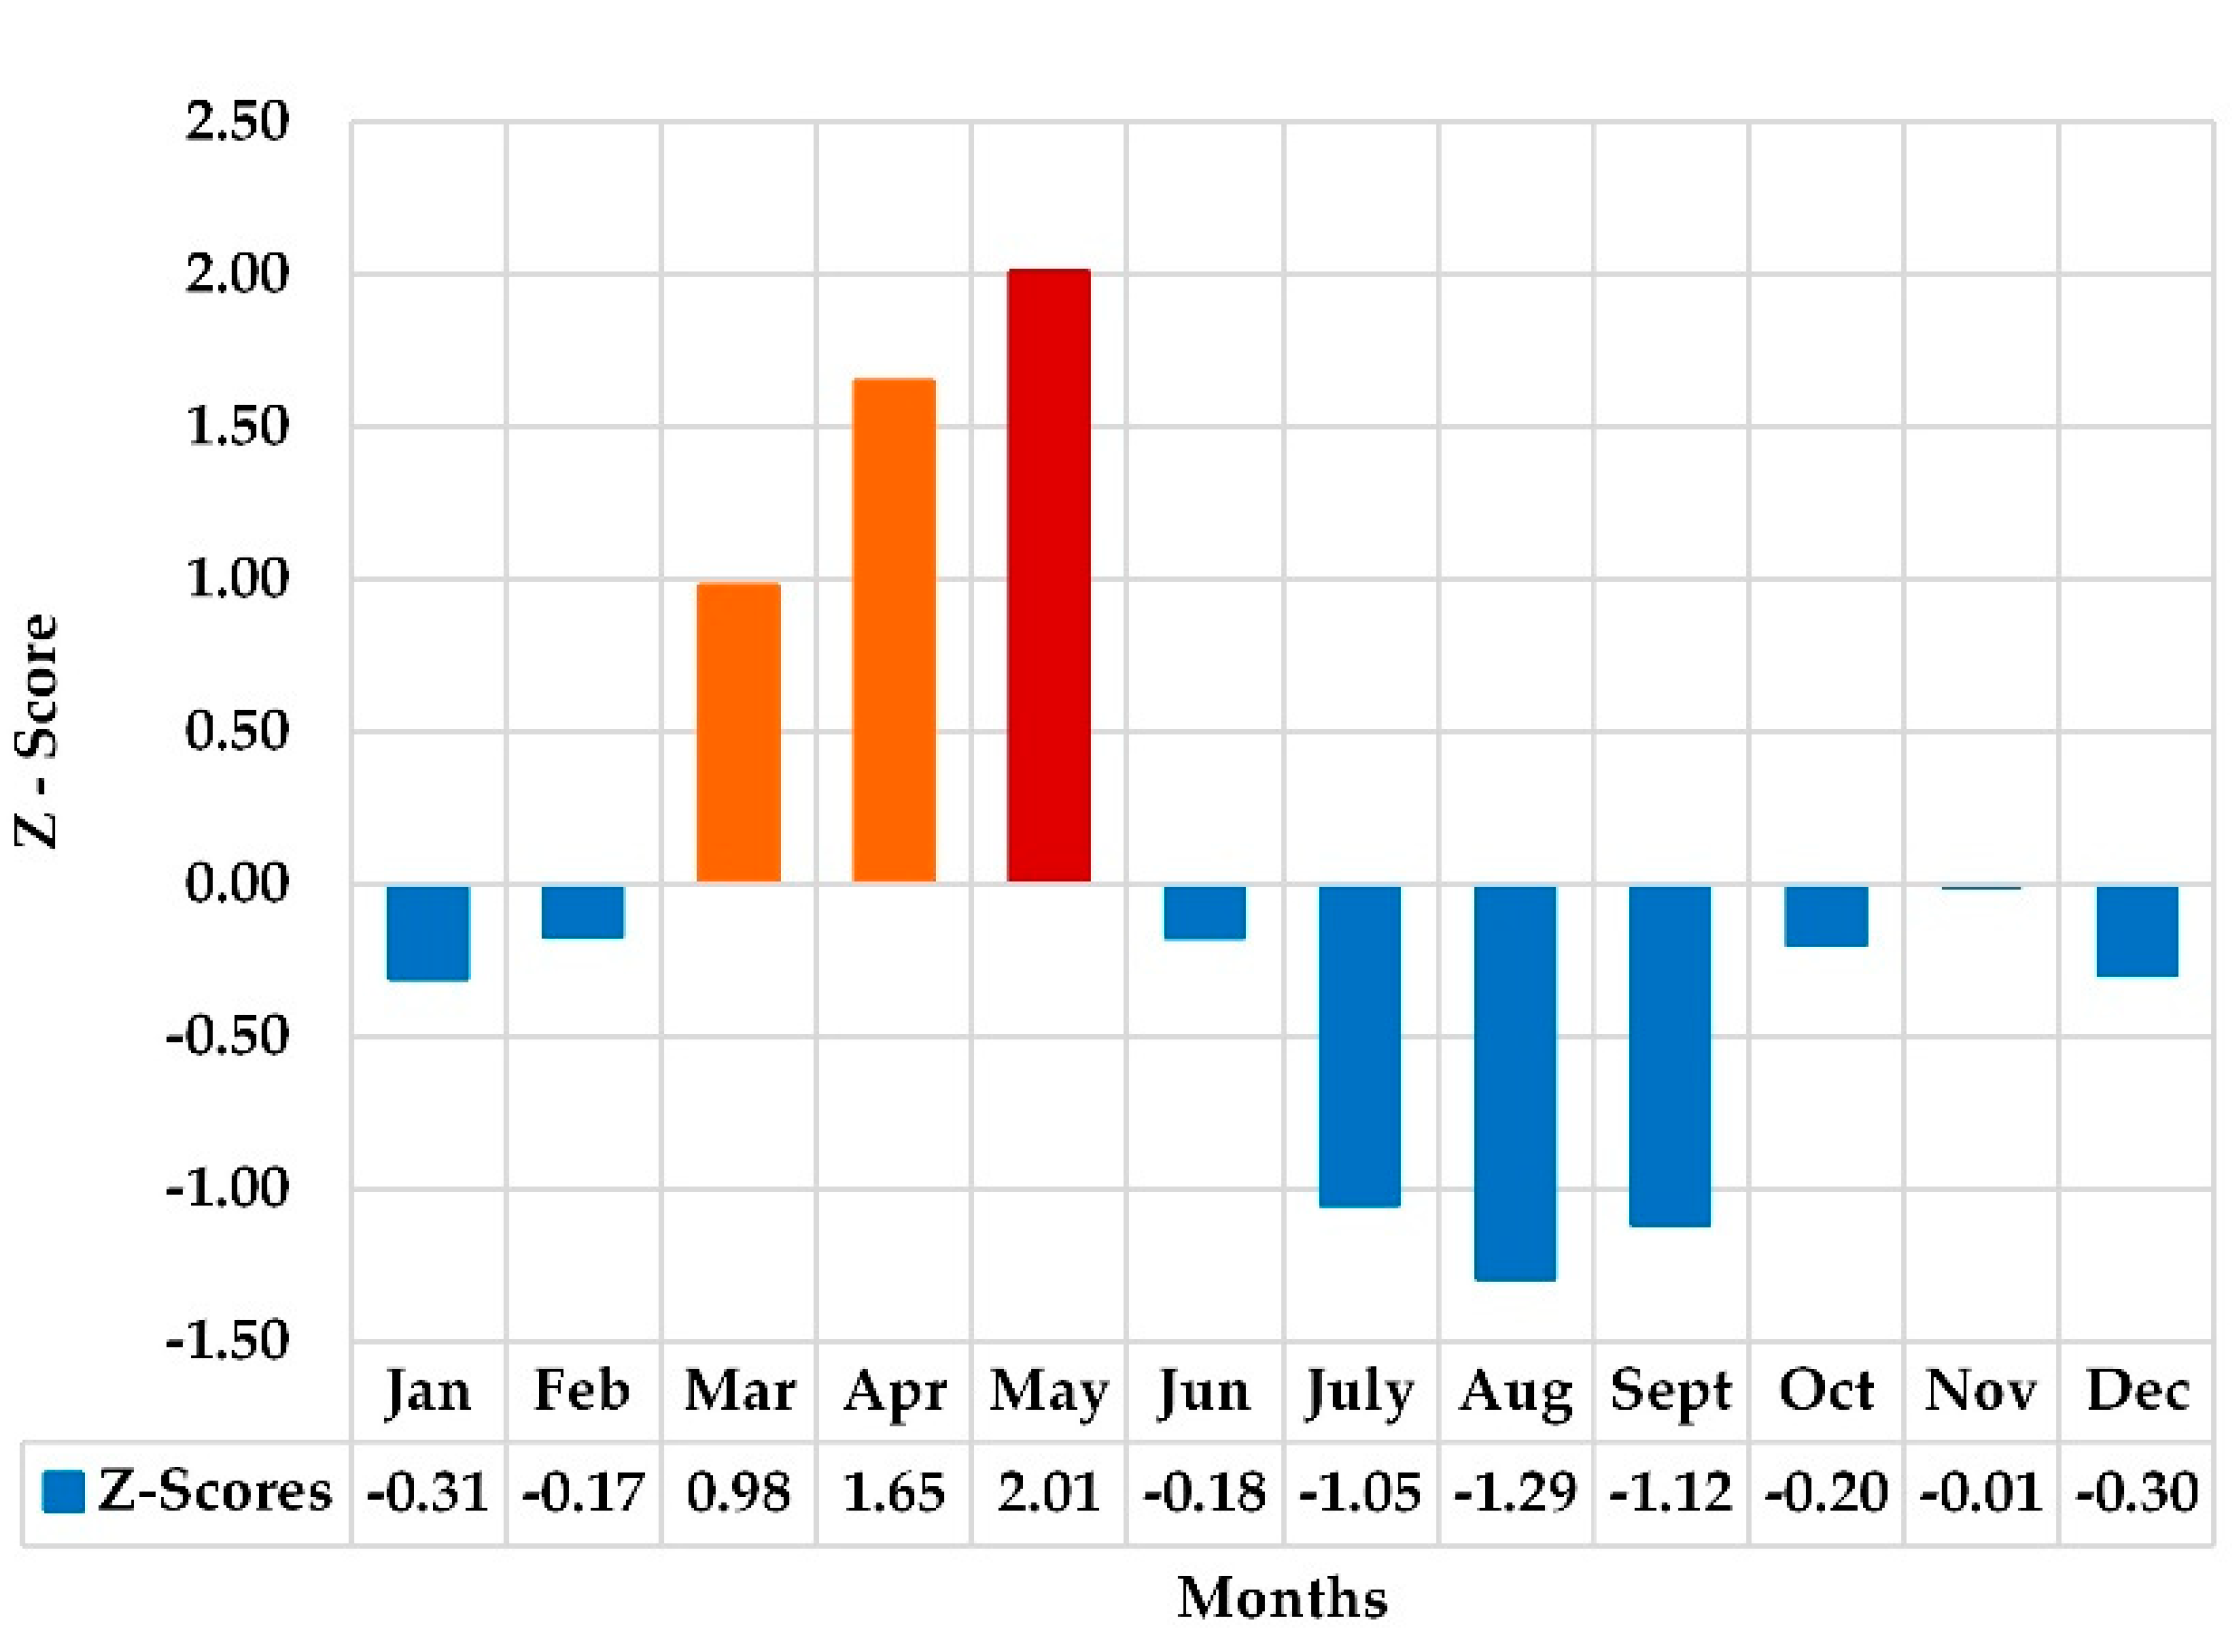
Figure 3.
Methodological flow chart of the study.
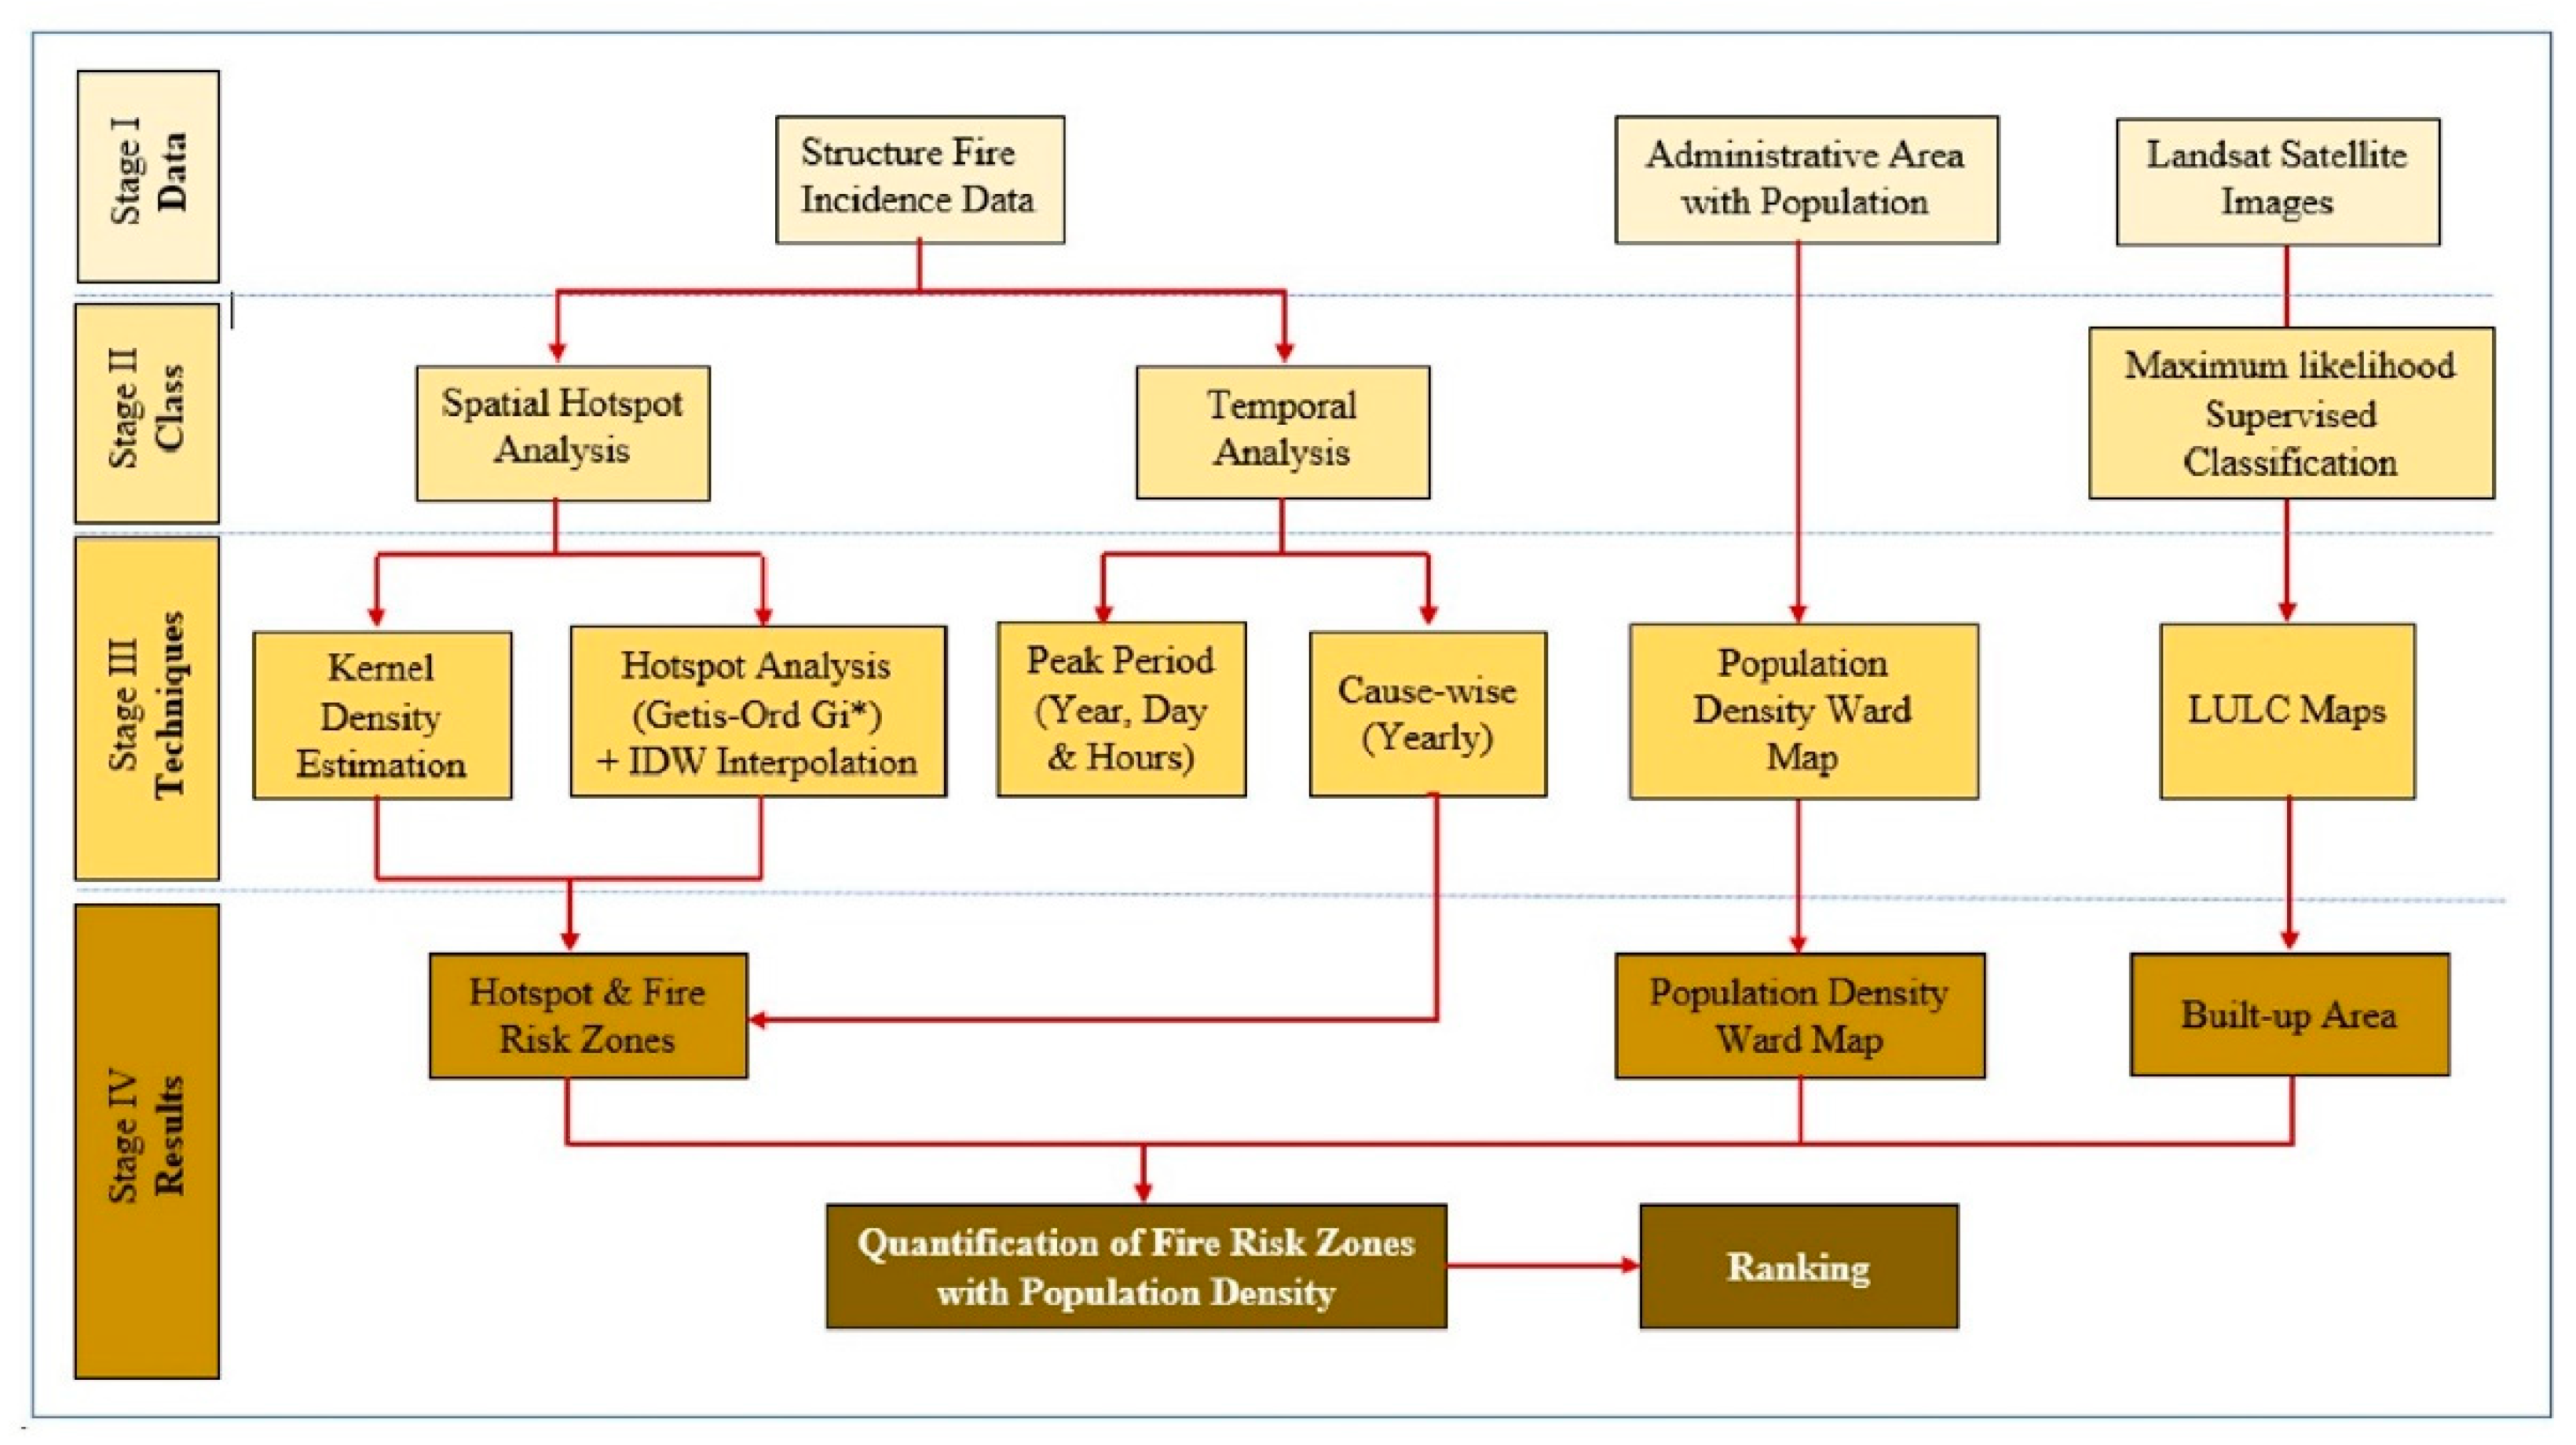
Figure 4.
Hotspot from the Kernel Density Estimation.

Figure 5.
Hotspot (Getis-Ord Gi*) results.

Figure 6.
IDW Interpolation of hotspot analysis (Getis-Ord Gi*) joined to the census ward map.
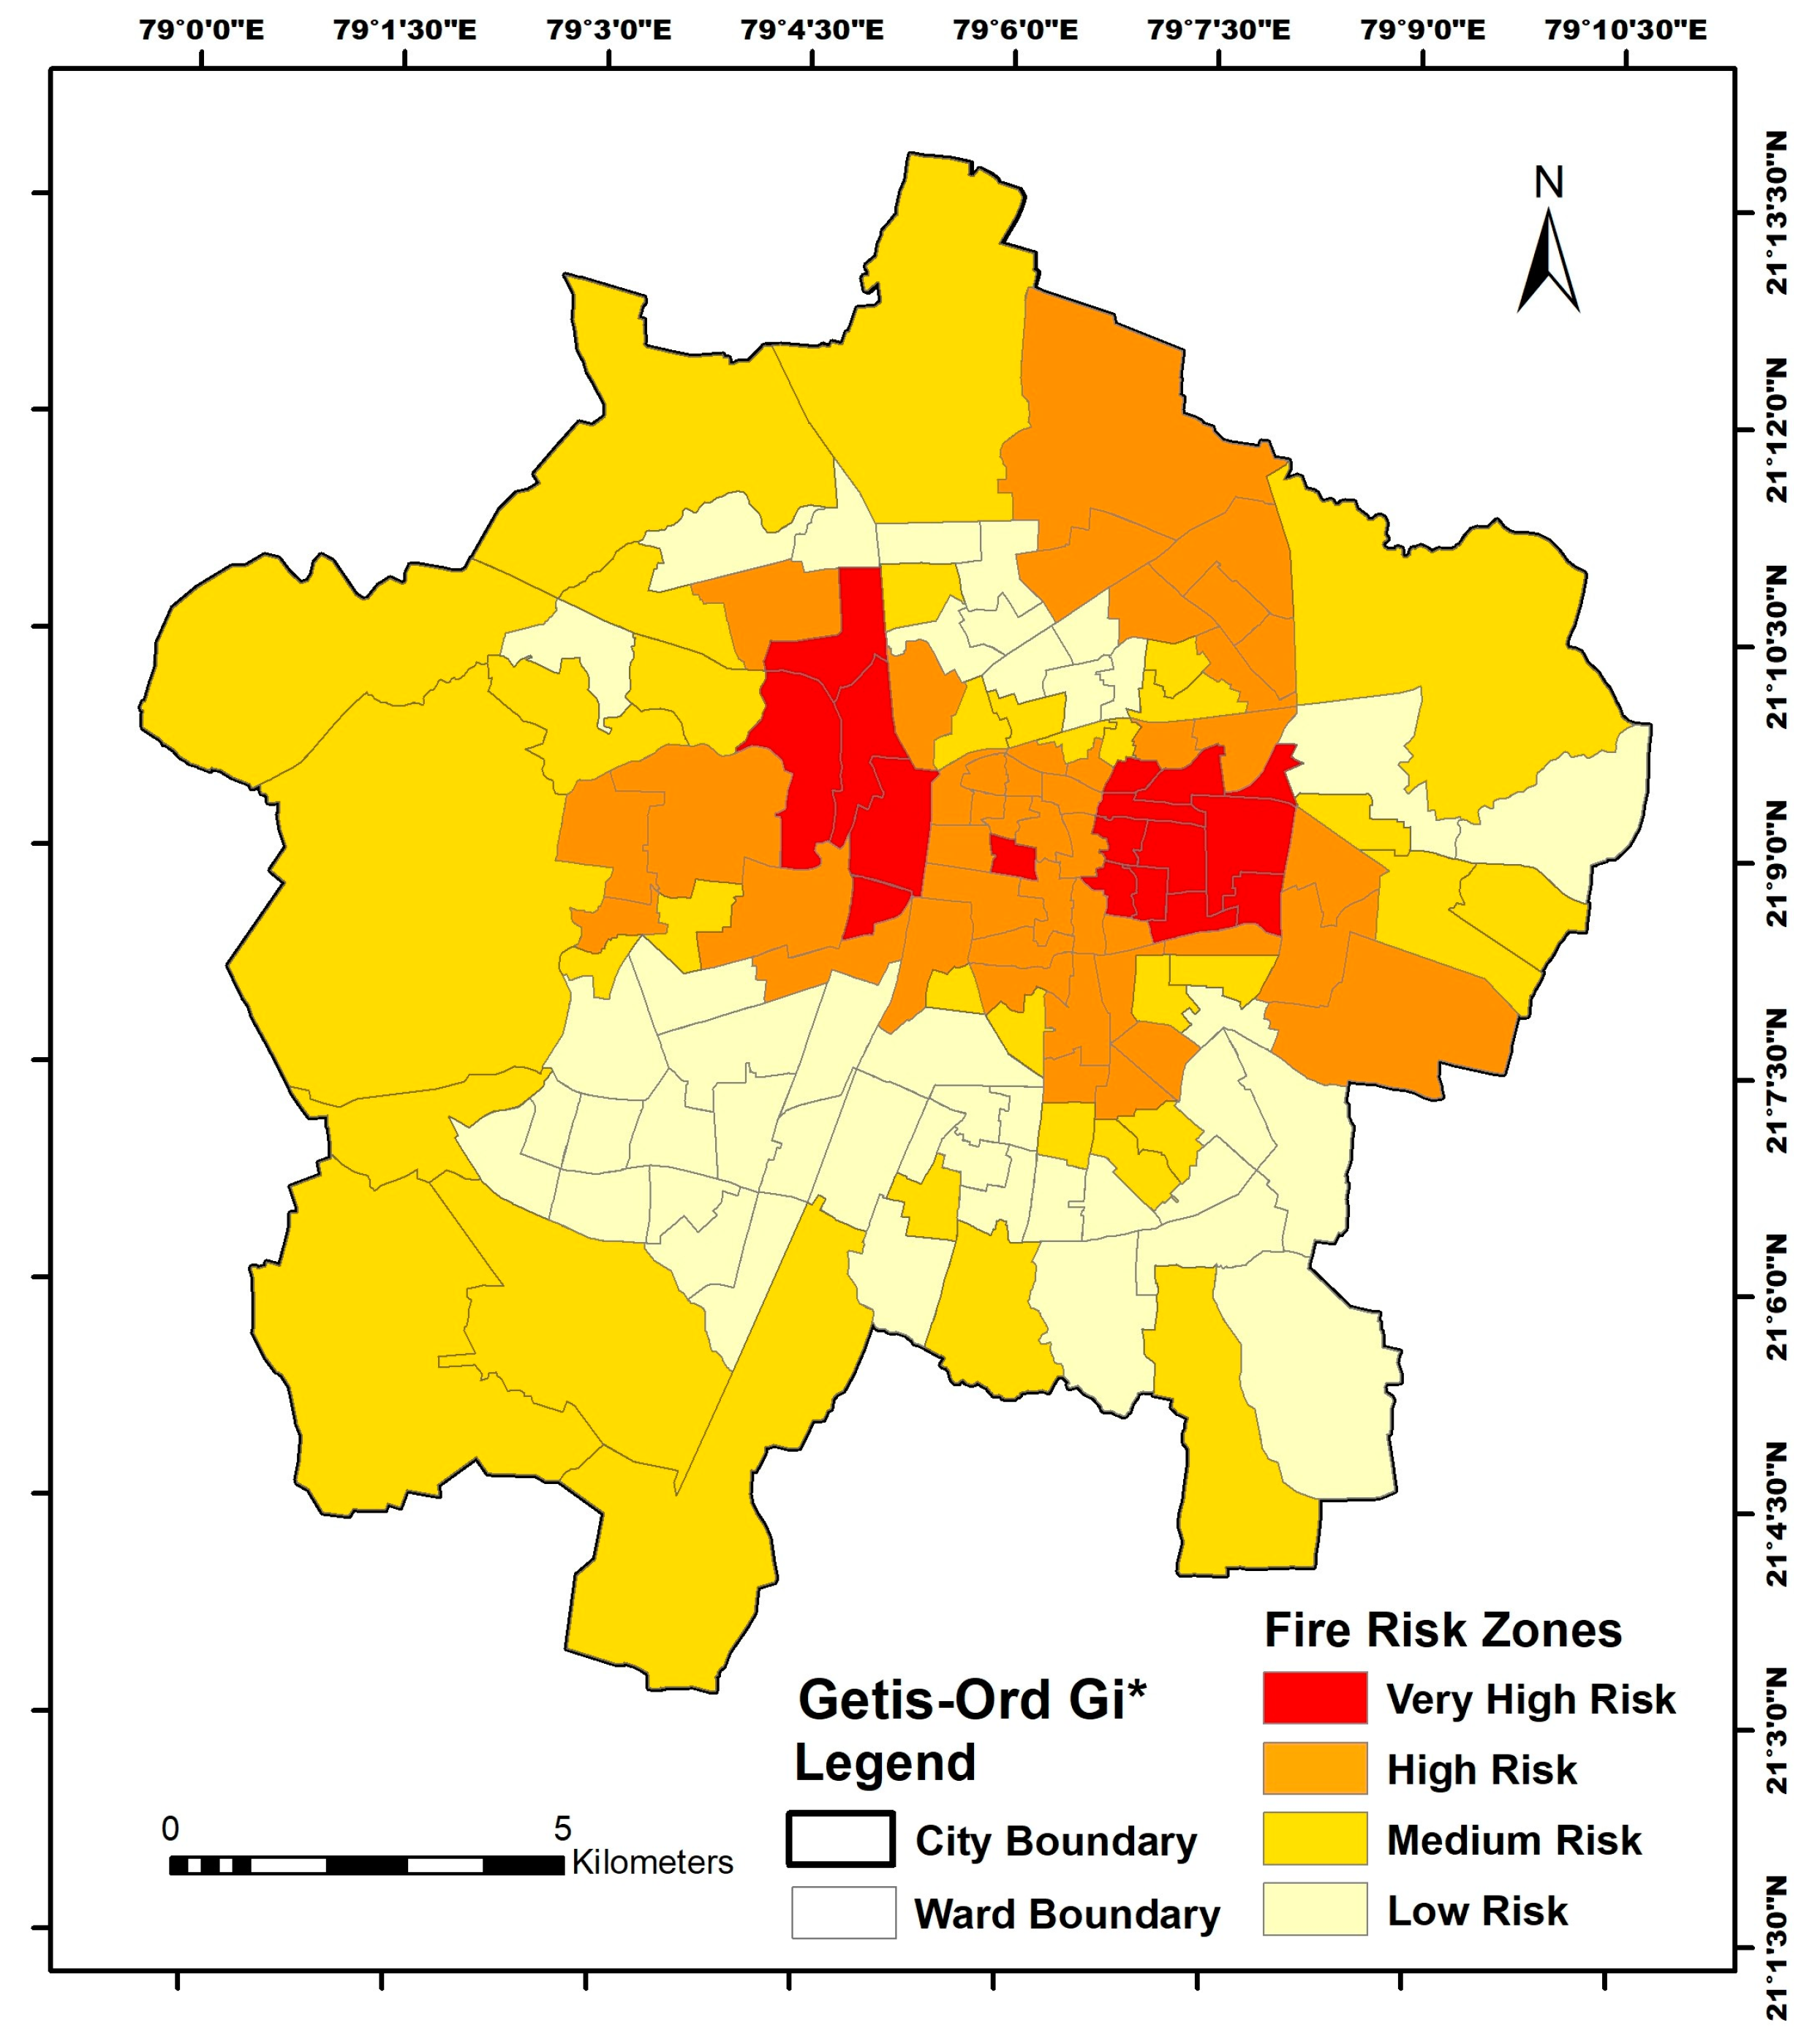
Figure 7.
Built-up areas from 2011 to 2020.
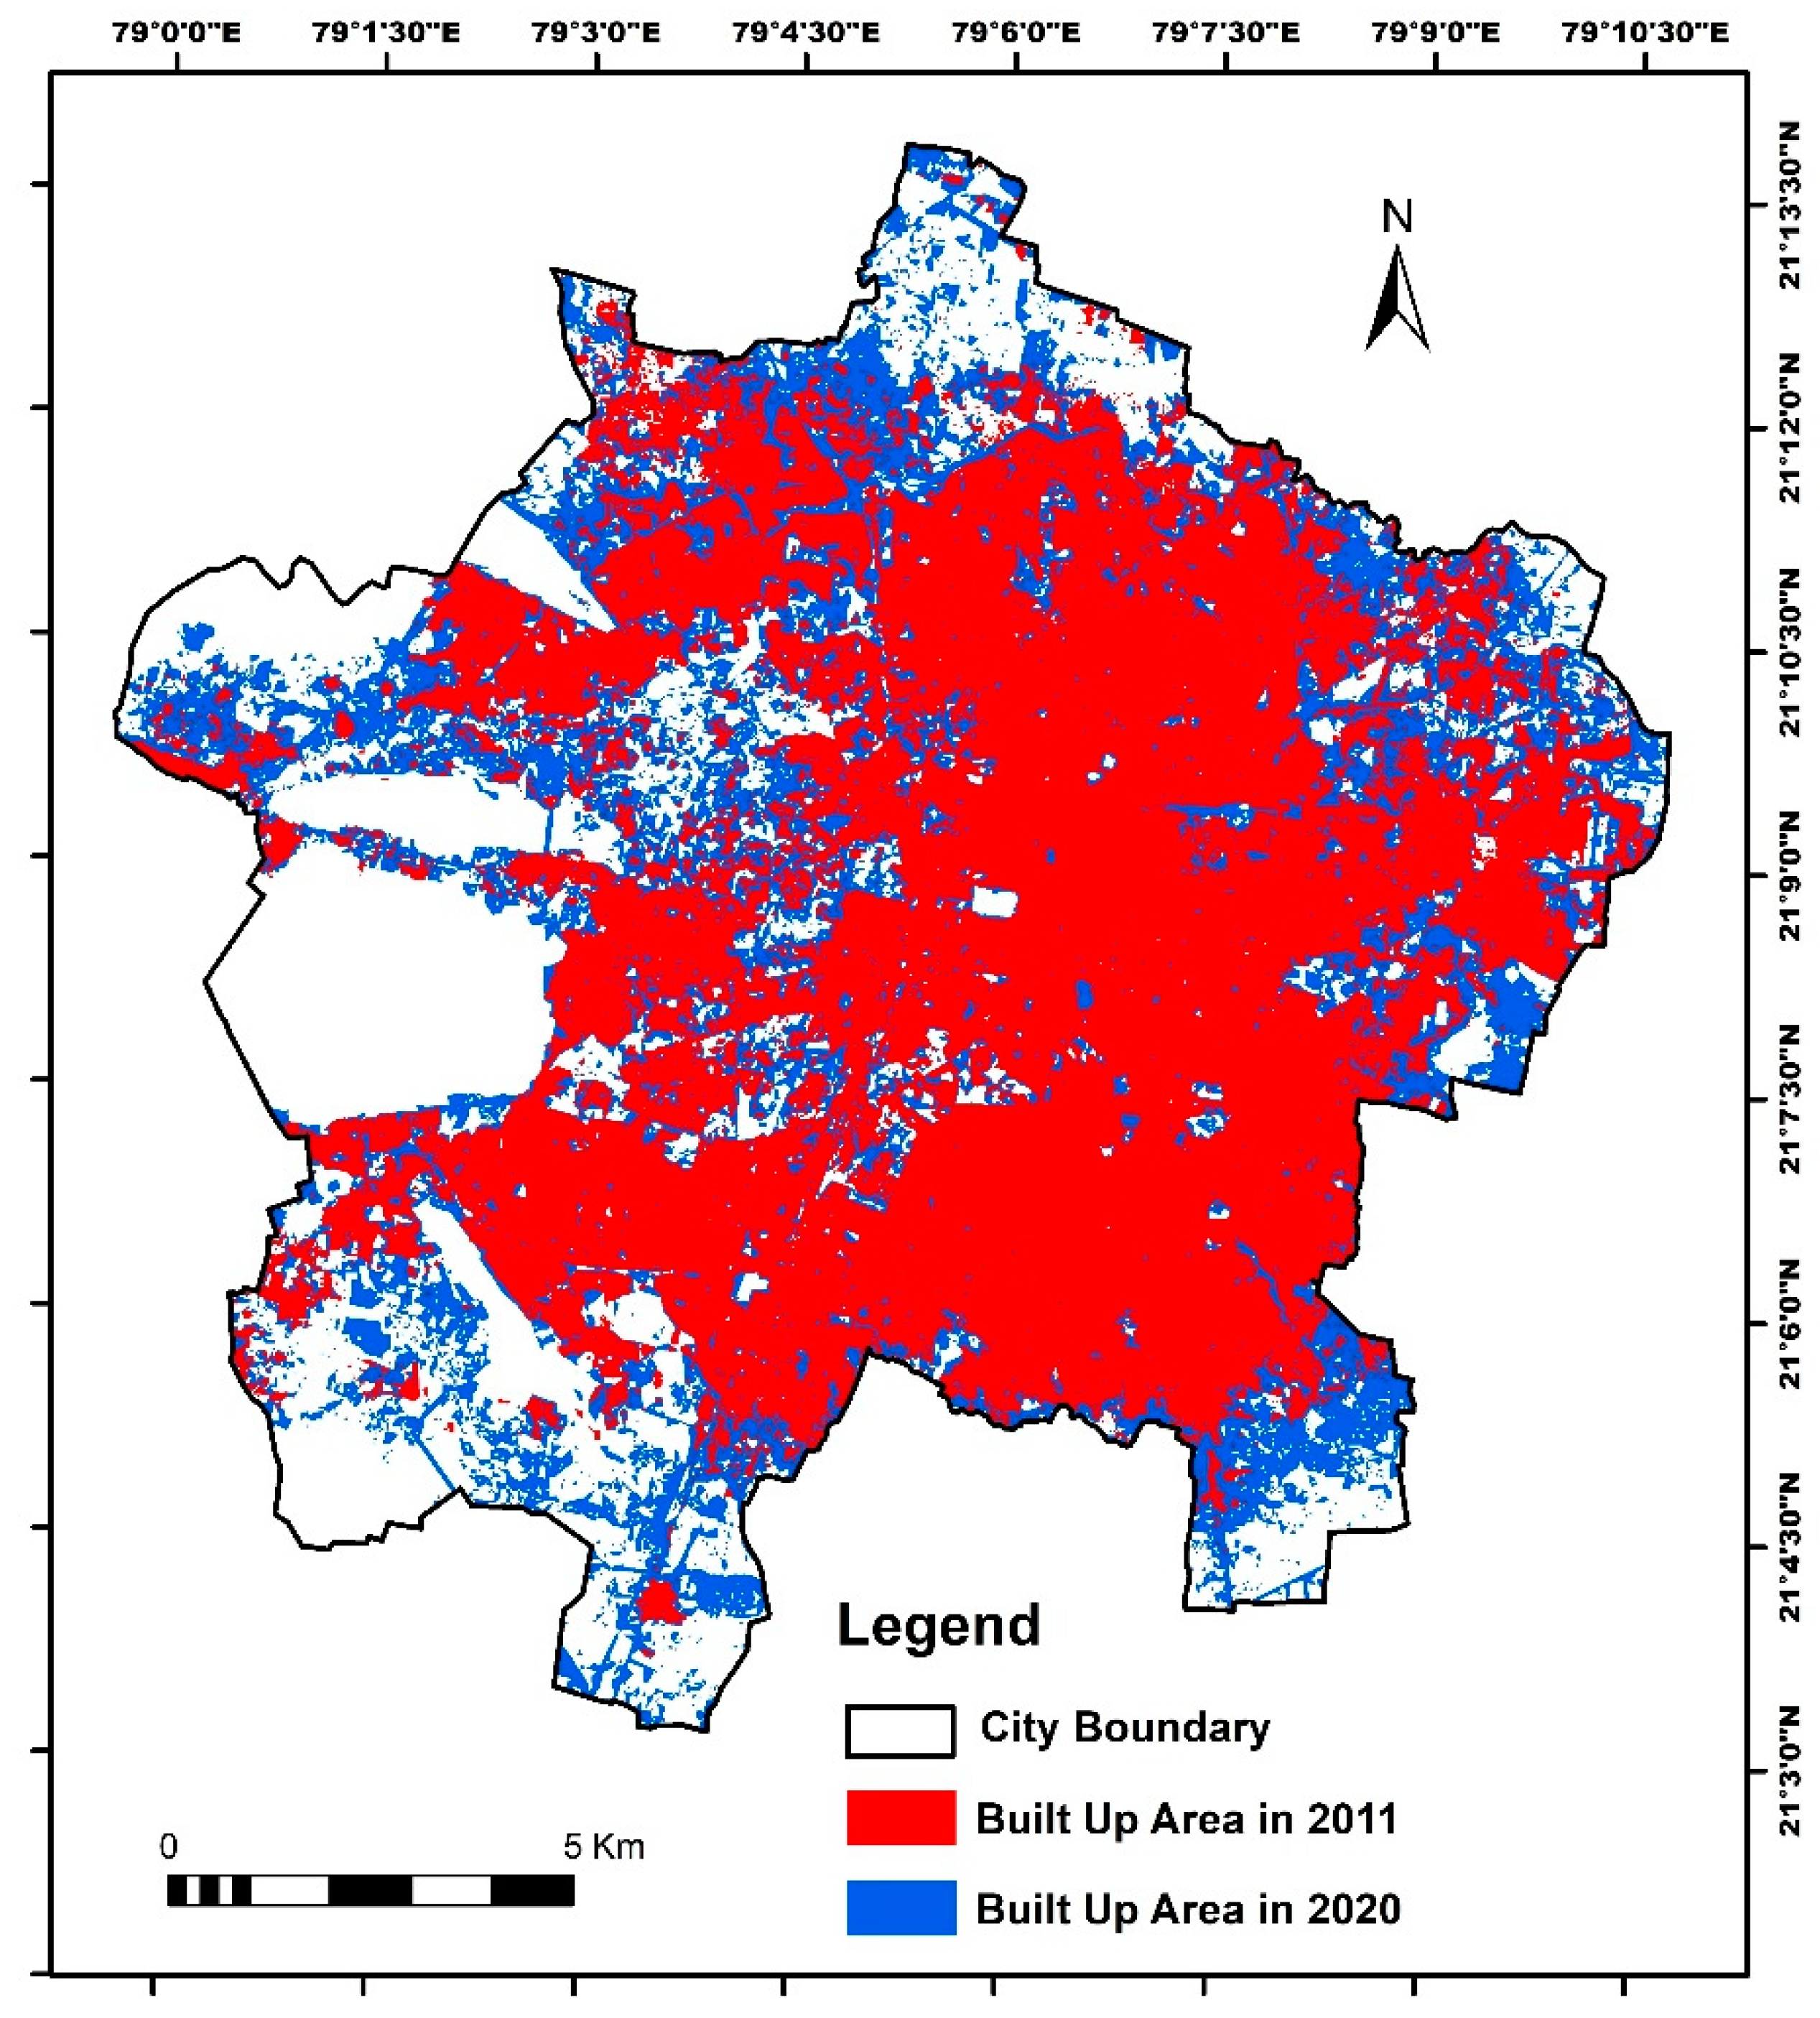
Figure 8.
Built-up areas with structure fire risk zones.
Figure 9.
Predictive probable fire risk zones of the city.

Figure 10.
Yearly fire incidences, UN population, and ratio.

Figure 11.
Temporal fire incidence pattern: (a) Z-score waterfall chart; (b) proportional fire index.
Figure 11.
Temporal fire incidence pattern: (a) Z-score waterfall chart; (b) proportional fire index.

Figure 12.
Temporal fire incidence pattern: (a) Weekdays; (b) Hourly.

Figure 13.
Cause-wise yearly structure fires.

Table 1.
Details of Landsat-8 satellite imaginary used in the study.
| Landsat Satellite | Sensor | Scene ID | Path/Row | Acquisition Date |
|---|---|---|---|---|
| Landsat-5 | TM | LT51440452011162KHC04 | 144/45 | 11 June 2011 |
| Landsat-8 | OLI_TIRS | LC81440452020139LGN00 | 144/45 | 18 May 2020 |
Table 2.
Fire risk zone classification for KDE outputs.
| Geometric Interval Values | Fire Risk Zones | Number of Wards | Percentage Area | Percentage Population | Population Density per km2 | Ranking Based on Population Density |
|---|---|---|---|---|---|---|
| 3.43–24.48 | Very High | 34 | 9 | 20 | 29,860 | 1 |
| −0.50–3.42 | High | 43 | 54 | 33 | 8339 | 4 |
| −1.23–−0.51 | Medium | 25 | 21 | 22 | 14,268 | 3 |
| −5.17–−1.24 | Low | 36 | 17 | 26 | 21,078 | 2 |
Table 3.
Fire risk zone classification for hotspot analysis (Getis-Ord Gi*) of census wards.
| Z-Score | Type | Number of Wards | Percentage Area | Percentage Population | Population Density per km2 | Ranking Based on Population Density |
|---|---|---|---|---|---|---|
| >1.96 | Very High | 17 | 5 | 10 | 25,526 | 1 |
| 1.96 to 0.65 | High | 43 | 19 | 28 | 20,313 | 2 |
| 0.65 to −0.65 | Medium | 34 | 52 | 29 | 7655 | 4 |
| −0.65 to −1.96 | Low | 44 | 24 | 33 | 18,857 | 3 |
Table 4.
Estimation of fire risk zones with significant z-scores.
| Z-Score | Type | Actual Built-Up Area Percentage | Built-Up Density Percentage | Population Density per km2 of Built-Up Area | Ranking Based on Population Density |
|---|---|---|---|---|---|
| >1.96 | Very High | 7 | 91 | 27,994 | 1 |
| 1.96 to 0.65 | High | 22 | 86 | 23,659 | 2 |
| 0.65 to −0.65 | Medium | 42 | 60 | 12,750 | 4 |
| −0.65 to −1.96 | Low | 29 | 90 | 20,904 | 3 |
| Total | 73 | 18,508 | |||
Table 5.
Percentage of fires based on occupancy types in classified fire risk zones.
| Occupancy Type | Very High | High | Medium | Low |
|---|---|---|---|---|
| Residential | 35 | 43 | 59 | 53 |
| Educational | 1 | 1 | 3 | 2 |
| Institutional | 0 | 1 | 1 | 3 |
| Assembly | 0 | 3 | 3 | 5 |
| Business | 8 | 5 | 3 | 3 |
| Mercantile | 39 | 34 | 30 | 27 |
| Industrial | 12 | 11 | 1 | 3 |
| Storage | 5 | 2 | 1 | 3 |
Table 6.
Predictive probable fire risk zones.
| Z-Score | Type | Number of Wards | Percentage Area | Percentage Population 2031 | Population Density for 2031 per km2 | Ranking Based on Population Density |
|---|---|---|---|---|---|---|
| >1.96 | Very High | 34 | 15 | 21 | 22,350 | 1 |
| 1.96 to 0.65 | High | 34 | 20 | 22 | 18,258 | 3 |
| 0.65 to −0.65 | Medium | 35 | 47 | 30 | 10,138 | 4 |
| −0.65 to −1.96 | Low | 35 | 18 | 26 | 23,726 | 2 |
Table 7.
Fire incidences and population matrices.
| Year | Fire Incidence Matrices | Population Matrices | Ratio | ||||
|---|---|---|---|---|---|---|---|
| Fire Index | Z-Score | Probability | PopulationIndex | Z-Score | Probability | ||
| 2011 | 1.14 | 0.68 | 0.75 | 0.93 | −1.54 | 0.06 | 2.59 |
| 2012 | 0.93 | −0.34 | 0.37 | 0.95 | −1.21 | 0.11 | 2.08 |
| 2013 | 0.70 | −1.44 | 0.08 | 0.96 | −0.88 | 0.19 | 1.54 |
| 2014 | 0.88 | −0.59 | 0.28 | 0.98 | −0.54 | 0.29 | 1.90 |
| 2015 | 1.04 | 0.17 | 0.57 | 0.99 | −0.19 | 0.42 | 2.20 |
| 2016 | 0.93 | −0.34 | 0.37 | 1.01 | 0.16 | 0.56 | 1.95 |
| 2017 | 1.23 | 1.10 | 0.86 | 1.02 | 0.52 | 0.70 | 2.53 |
| 2018 | 1.07 | 0.34 | 0.63 | 1.04 | 0.88 | 0.81 | 2.17 |
| 2019 | 1.39 | 1.86 | 0.97 | 1.06 | 1.22 | 0.89 | 2.77 |
| 2020 | 0.70 | −1.44 | 0.08 | 1.07 | 1.58 | 0.94 | 1.38 |
Table 8.
Cause-wise percetage of structure fires in the fire risk zones.
| Type | Gas Cylinder Leakage | Electric Short Circuit | Garbage Fire | Unknown | Other |
|---|---|---|---|---|---|
| Very High | 13 | 33 | 2 | 41 | 11 |
| High | 10 | 30 | 2 | 54 | 3 |
| Medium | 16 | 28 | 2 | 51 | 4 |
| Low | 17 | 31 | 2 | 42 | 8 |
| Total | 14 | 31 | 2 | 48 | 6 |
Publisher’s Note: MDPI stays neutral with regard to jurisdictional claims in published maps and institutional affiliations. |
© 2021 by the authors. Licensee MDPI, Basel, Switzerland. This article is an open access article distributed under the terms and conditions of the Creative Commons Attribution (CC BY) license (https://creativecommons.org/licenses/by/4.0/).
Share and Cite
MDPI and ACS Style
Singh, P.P.; Sabnani, C.S.; Kapse, V.S. Hotspot Analysis of Structure Fires in Urban Agglomeration: A Case of Nagpur City, India. Fire 2021, 4, 38. https://0-doi-org.brum.beds.ac.uk/10.3390/fire4030038
AMA Style
Singh PP, Sabnani CS, Kapse VS. Hotspot Analysis of Structure Fires in Urban Agglomeration: A Case of Nagpur City, India. Fire. 2021; 4(3):38. https://0-doi-org.brum.beds.ac.uk/10.3390/fire4030038
Chicago/Turabian StyleSingh, Priya P., Chandra S. Sabnani, and Vijay S. Kapse. 2021. "Hotspot Analysis of Structure Fires in Urban Agglomeration: A Case of Nagpur City, India" Fire 4, no. 3: 38. https://0-doi-org.brum.beds.ac.uk/10.3390/fire4030038