Case Report

UAV Assisted Spatiotemporal Analysis and Management of Bushfires: A Case Study of the 2020 Victorian Bushfires

1
School of Built Environment, University of New South Wales, Kensington, Sydney 2052, Australia
2
School of Civil Engineering and Surveying, University of Southern Queensland, Springfield 4300, Australia
3
Faculty of Chemical Energy, University of New South Wales, Kensington, Sydney 2052, Australia
4
School of Computing Engineering and Mathematics, Western Sydney University, Locked Bag 1797, Penrith 2751, Australia
*
Author to whom correspondence should be addressed.
Submission received: 16 June 2021 / Revised: 17 July 2021 / Accepted: 23 July 2021 / Published: 26 July 2021

Abstract

:
Australia is a regular recipient of devastating bushfires that severely impacts its economy, landscape, forests, and wild animals. These bushfires must be managed to save a fortune, wildlife, and vegetation and reduce fatalities and harmful environmental impacts. The current study proposes a holistic model that uses a mixed-method approach of Geographical Information System (GIS), remote sensing, and Unmanned Aerial Vehicles (UAV)-based bushfire assessment and mitigation. The fire products of Visible Infrared Imager Radiometer Suite (VIIRS) and Moderate-resolution Imaging Spectroradiometer (MODIS) are used for monitoring the burnt areas within the Victorian Region due to the 2020 bushfires. The results show that the aggregate of 1500 m produces the best output for estimating the burnt areas. The identified hotspots are in the eastern belt of the state that progressed north towards New South Wales. The R2 values between 0.91–0.99 indicate the fitness of methods used in the current study. A healthy z-value index between 0.03 to 2.9 shows the statistical significance of the hotspots. Additional analysis of the 2019–20 Victorian bushfires shows a widespread radius of the fires associated with the climate change and Indian Ocean Dipole (IOD) phenomenon. The UAV paths are optimized using five algorithms: greedy, intra route, inter route, tabu, and particle swarm optimization (PSO), where PSO search surpassed all the tested methods in terms of faster run time and lesser costs to manage the bushfires disasters. The average improvement demonstrated by the PSO algorithm over the greedy method is approximately 2% and 1.2% as compared with the intra route. Further, the cost reduction is 1.5% compared with the inter-route scheme and 1.2% compared with the intra route algorithm. The local disaster management authorities can instantly adopt the proposed system to assess the bushfires disasters and instigate an immediate response plan.

1. Introduction and Background

Bushfires are unplanned fire events or disasters that occur in forests, heavy vegetated, and wildland regions. These have been a constant disturbance source for about 400 million years in various parts of the world. Bushfires are a frequent, recurrent, and devastating environmental hazard that can result in adverse environmental, social, and economic impacts, affecting all sustainability pillars [1,2,3]. In the era of increased demand for sustainability, savings of natural resources, and increased reliance on digital technologies for disaster management, it is imperative to develop technology-based solutions for handling bushfires [4,5,6]. Bushfires are attributed to several factors ranging from climatological causes to anthropogenic causes. Bushfires are not entirely undesired; sometimes, they are needed and planned events and play an important role in a region’s ecological landscaping. However, unplanned and uncontrolled bushfires cause devastation, wiping out forests, wild animals and impacting agricultural land. Thus, it is a matter of controlled vs uncontrolled bushfires that shape their outlook. Raucous fire events have adverse and severe impacts on the environment, economy, and society. Whether controlled or uncontrolled, bushfires significantly affect the physical environment, such as land use, land cover, biodiversity, forest ecosystem, and global warming. Therefore, monitoring the bushfires is essential to understand the impact of these events in line with the goals of smart and sustainable societies and countries.
Contrary to other natural hazards like earthquakes and volcanic eruptions, the bushfire phenomenon is considered an avoidable risk [7,8,9,10]. Accordingly, significant resources are expended on bushfire suppression activities in developed countries such as Australia. However, fire suppression strategies may increase the risk of more extreme and extensive fire incidents within the fire-susceptible regions [11]. Table 1 provides a list of global bushfire events since 2000. The data is compiled by the authors of the current study from the EMDAT 2019 report [12]. Since 2000, the average number of deaths due to reported bushfire events is around 138 per fire. Further, the affectees and total damages average out $77,242 and $3,710,000, respectively.
Australia is a developed country and enriched with biodiversity and natural ecosystems. However, it is also prone to various environmental hazards such as bushfires due to the diverse landscape. It is considered the fourth most devastating natural hazard [13]. Bushfires are of critical concern in Australia since its southern coastal region has a Mediterranean-type climate characterized by hot, dry summers and cold, wet winters, increasing the chances for bushfire events. These bushfires threaten human life and result in significant economic loss, thus impacting Australia’s sustainable development dreams. It has been reported that bushfires are responsible for 20% of property losses, killing 1.25 billion animals and burning over a billion trees in Australia [14,15]. The fires have damaged 10 million hectares of land, equivalent to 21 million acres across the six Australian states [16]. It has been predicted that future bushfires may become fatal and severe in Australia. Of the concerned areas, the southeastern parts of the continent are at greater risk. These are forecasted to be at “very high” and “extreme” dangers of bushfires [17]. A large area of significant positive pattern for bushfires includes southeastern South Australia (SA), western New South Wales (NSW), Victoria (VIC), and northern Tasmania (TAS). The forest fire danger index (FFDI) trend is significantly increased along the mainland’s southern regions, specifically in VIC, NSW, and SA in 2020. The area is densely populated with reserved areas of national parks, making it a good target for bushfires.

1.1. Victorian Bushfires

The state of VIC is susceptible to bushfire hazards traditionally. VIC is particularly prone to drought conditions that aggravate the issue of bushfires in this state. For instance, the Black Saturday fires of 2009 started due to extreme drought conditions in the earlier months [18]. The most recent and by far the deadliest fire events recorded in VIC are the Black Summer Fires of 2019–2020. These bushfires have resulted in 34 fatalities, affected over 1.5 million hectares of Australian land, killed millions of wild animals, and destroyed 9352 buildings, including 2800 homes. VIC is of critical importance in terms of environmental deterioration due to recurrent bushfires in southeastern Australia. The region has experienced some of the most severe and catastrophic bushfire events in Australian history, such as Black Summer, Red Hill, Black Saturday, and others. Table 2 illustrates some of the most extensive and devastating bushfires in this region in the last century. The recent fire seasons are alarming as each latest fire season is becoming progressively dangerous with more ecological and economic disturbance. The Black Saturday fire season of 2009 affected Kinglake-Marysville, Beechworth, Bendigo, Redesdale, and Gippsland. It was one of Australia’s all-time deadliest bushfire disasters. The fires started during the severe bushfire weather conditions and resulted in the country’s highest-ever human life losses due to fires, with 173 deaths. About 400 individual fire incidents were reported on Saturday, 7 February 2009, referred to as Black Saturday. Afterward, the Australian bushfire season of 2010–11 was observed along eastern Australia, attributed to a strong climatic phenomenon of the La Nina effect. It resulted in severe floods, particularly in Queensland and VIC. Because of these drastic weather conditions, most of the fire events occurred in Western and South Australia, where fire incidents occurred in Gippsland and eastern VIC. Thirty-four lives were lost to these fire events, and more than 90 buildings were damaged.
VIC is selected as the case study due to its frequently occurring bushfire events. It has a land cover of 237,659 km2 and is the second most densely populated Australian state with an average population of 26.56 per km2. Of the total land cover, the land encompasses 227,436 km2, whereas about 10,213 km2 is covered by water. VIC comprises diverse geographical features and climates ranging from temperate coastal and central regions to the northeastern VIC Alps and semi-arid northwestern region. The upper Wimmera and Mallee are the warmest regions with hot winds originating from adjacent semi-deserts. The average temperature often exceeds 32 °C in the summer and 15 °C in winter. The northeastern VIC Alps are the coldest VIC region, where the average temperatures are below 9 °C during winter and below 0 °C in the mountaineous ranges [
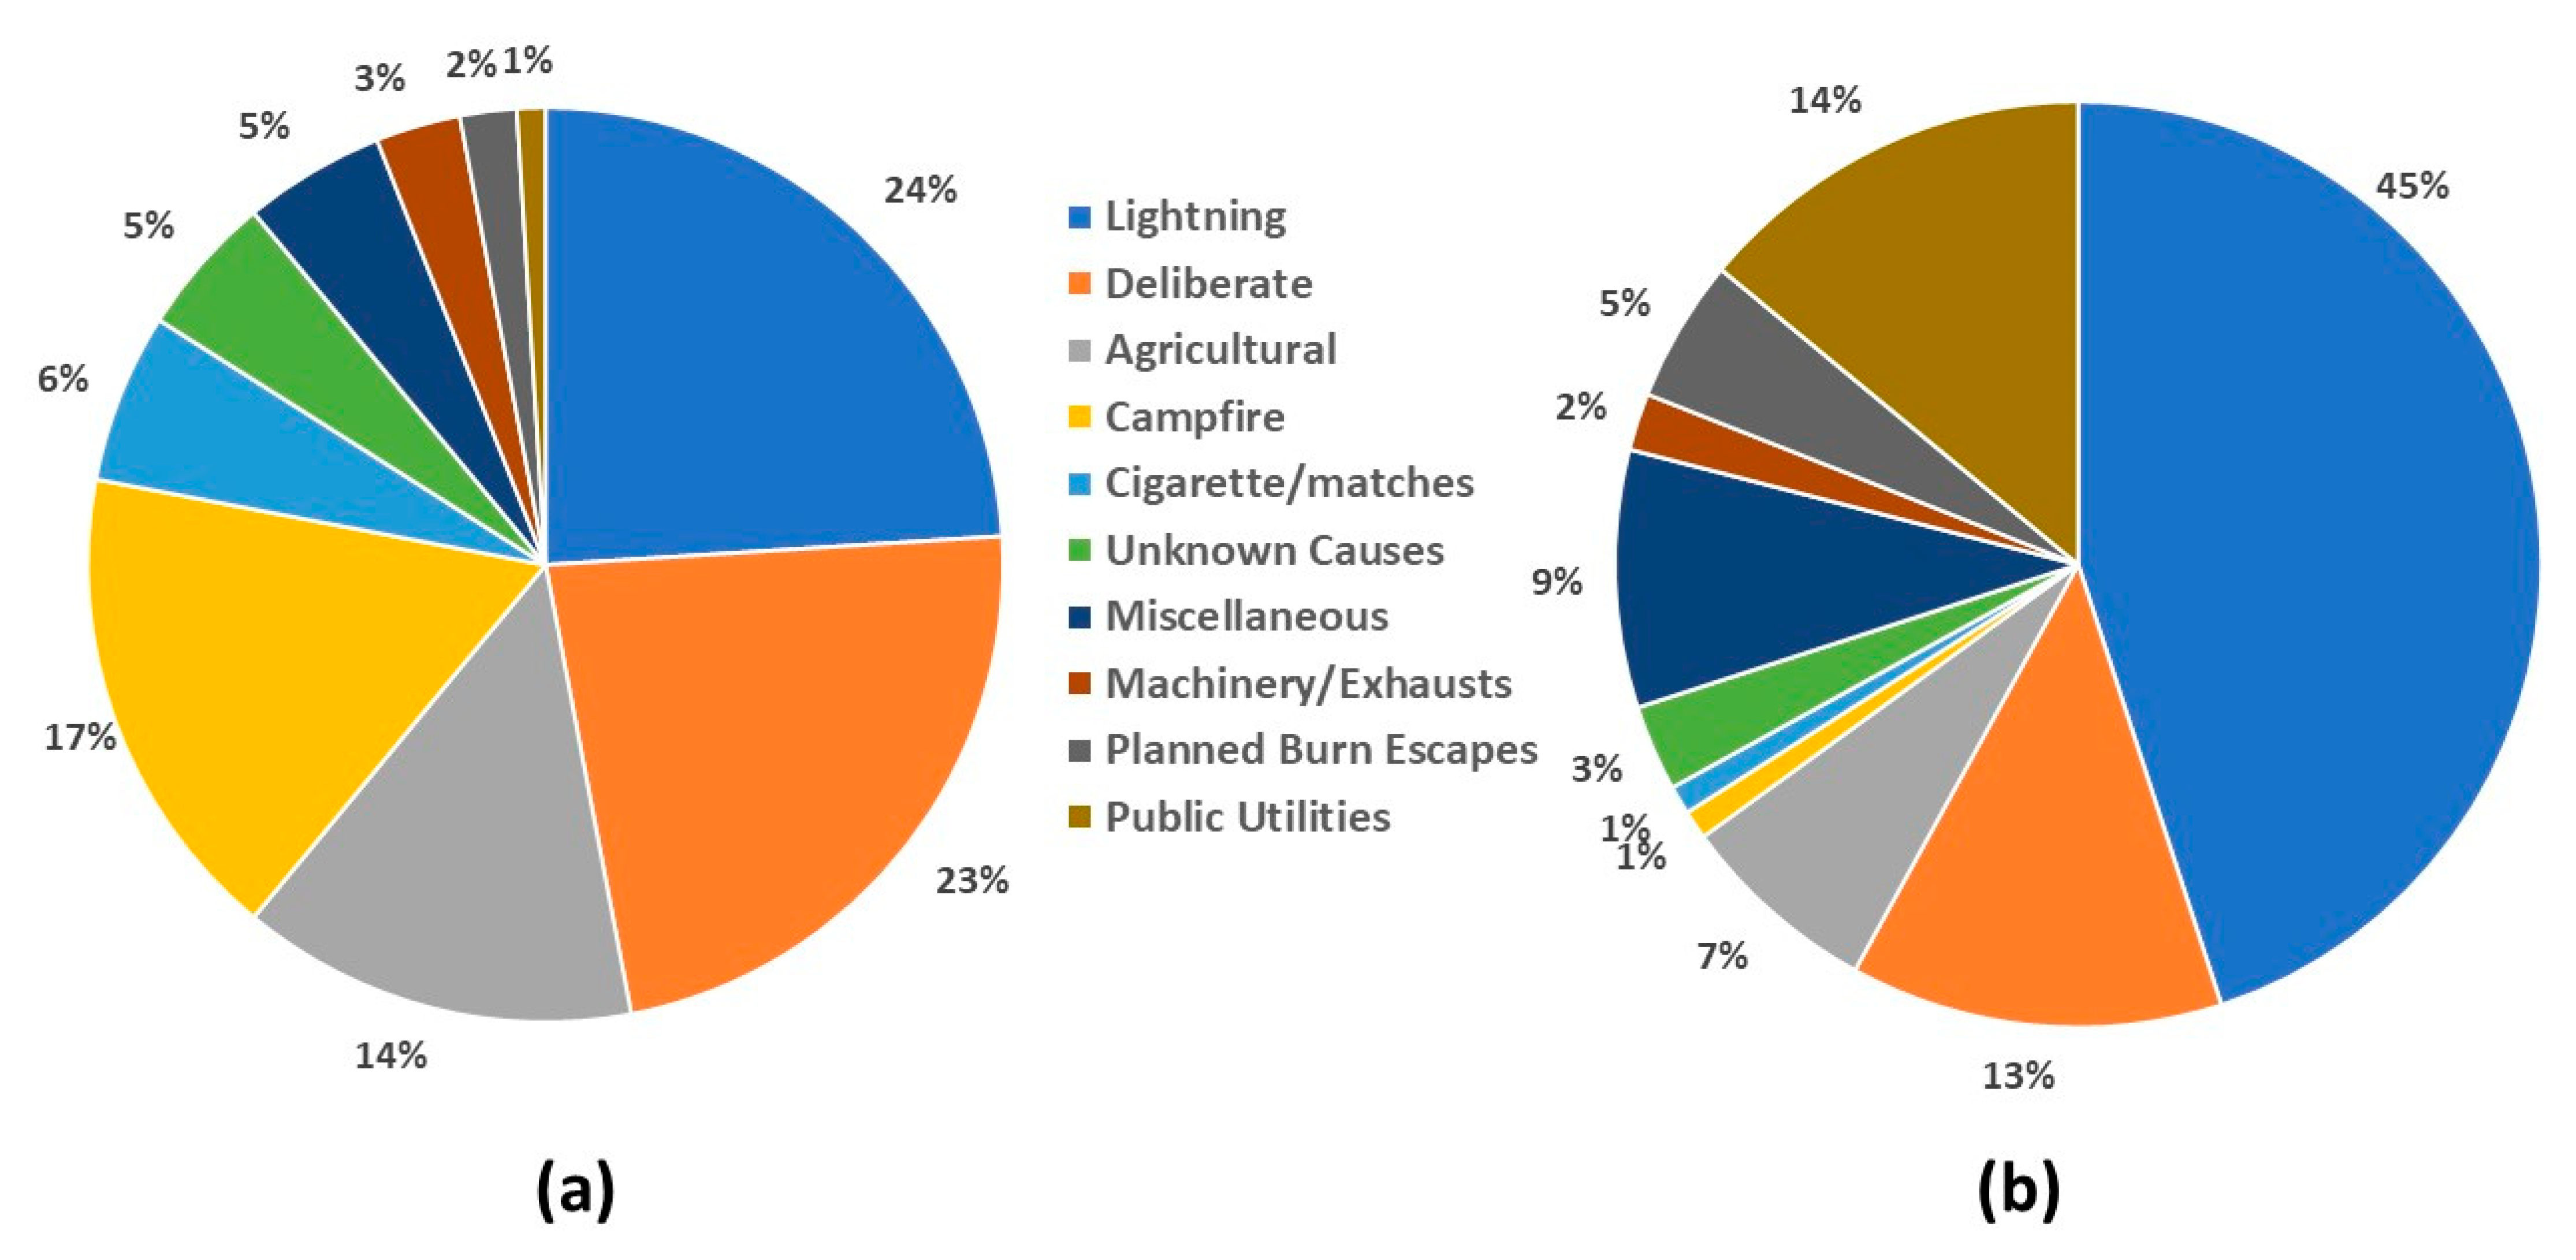
19]. The majority of VIC population is in the central south, surrounded by Port Phillip Bay and the metropolitan region of Greater Melbourne. As per the VIC Department of Sustainability and Environment (DSE), in the past 20 years, most Australian fires are majorly attributed to lightning or deliberately caused by humans. Figure 1 reports that about 24% of the fires are caused by lightning, followed by anthropogenic causes, including deliberate (23%) and campfires (17%), respectively. In terms of the burnt areas, lightning-based fires have a 45% contribution, followed by misuse of public utilities (14%), deliberate fires (13%), and agricultural (7%) reasons.

The 2019–2020 Victorian Bushfires Impacts

The initial causes of the 2020 VIC bushfires are reported to be lightning strikes, accidents, and alleged arson [20,21,22]. However, the propagation of the 2020 bushfire is more intense and deep-rooted. It includes global warming, record-breaking temperatures, drought conditions, and an Indian Ocean Dipole (IOD) [23,24]. Of the total national death toll of 34, five were from the VIC bushfire. Regarding the property damage, almost 300 houses were damaged [25]. In terms of the diversity loss, it has been reported that 170 species are impacted: comprising 19 mammalian species, 13 amphibian species, ten reptilian species, nine bird species, 29 aquatic species, and 38 plant species [26].
VIC has been known as one of the most bushfire-prone areas in the world, particularly in Australia. The reasons for this are attributed to a relatively simple landscape climate and vegetation, settlement, weather, and population. VIC has the undesirable record of being the deadliest bushfire-affected state in Australia. As a result, more people have died in VIC bushfires than in any other state or territory in Australia. VIC has recorded more fatalities than any jurisdiction from 1900 till 2008. These were nearly three times more than NSW, the next highest. Since then, VIC has sustained a further 183 bushfire deaths adding more toll to the state’s burden. These include 173 deaths in 2009 and nine between 2010 and 2020, bringing 479 deaths or 61 percent of the national fatality toll since 1900.
According to the United States Environmental Protection Agency’s National Ambient Air Quality Standard, the worst air pollution was recorded on 13 and 14 January 2020 in VIC. The air quality scores for these days have been 212 and 255, respectively, representing ‘very unhealthy’ on the scale of air quality index (AQI) [27]. Although the bushfire’s cost estimates are not confirmed yet by the VIC and federal governments, climate criminologist Paul Read and economist Richard Dennis regarded it to be Australia’s costliest natural disaster to date. The Black Summer Fires are alarming due to their direct impacts; however, the indirect effects also contributed to many problems, such as the too high temperatures putting human and wild lives at risk. The associated fire and smoke created severe local weather and posed dangers to life, raising concerns for the residents and emergency response authorities [23]. Once the event starts, all adjacent areas are at risk of experiencing its aftermath. One thousand three hundred five patients presented to emergency departments with asthma due to the 2020 VIC bushfires [28].
Owing to these damages and the ever-hovering danger of another bushfire in the VIC region, a bushfire mitigation strategy or instant emergency response mechanism must be devised to assess and manage these fires. Various tools such as GIS and remote sensing are proposed to assess bushfire’s impacts and associated disaster management response [29,30]. Notably, in the post-disaster period, the disaster relief agencies’ focus is on locating and reaching the stranded people to rescue them [4,31,32]. However, in many cases, the number of sites to be visited for this purpose is very high. Due to limited time in emergency responses and limited resources, it is practically impossible to reach all the sites in an affected region immediately. Such a situation can lead to an additional number of fatalities if a well-defined mechanism is not followed. The expenses related to vehicles and transportation to the disastrous locations make up a considerable part of a disaster relief organization’s overall expenditures. A significant portion of these expenses consists of costs of services like locating, transporting the affectees and managing the fires. The limited vehicles, human resources, instant emergency response, and other limiting factors intensify the bushfire’s damages. Costs reduction for emergency responses, determining a proper route for vehicles, and locating the target sites are the key decisions for instigating an adequate emergency response plan [30,32,33]. Accordingly, these factors should be considered while planning an appropriate plan of response.
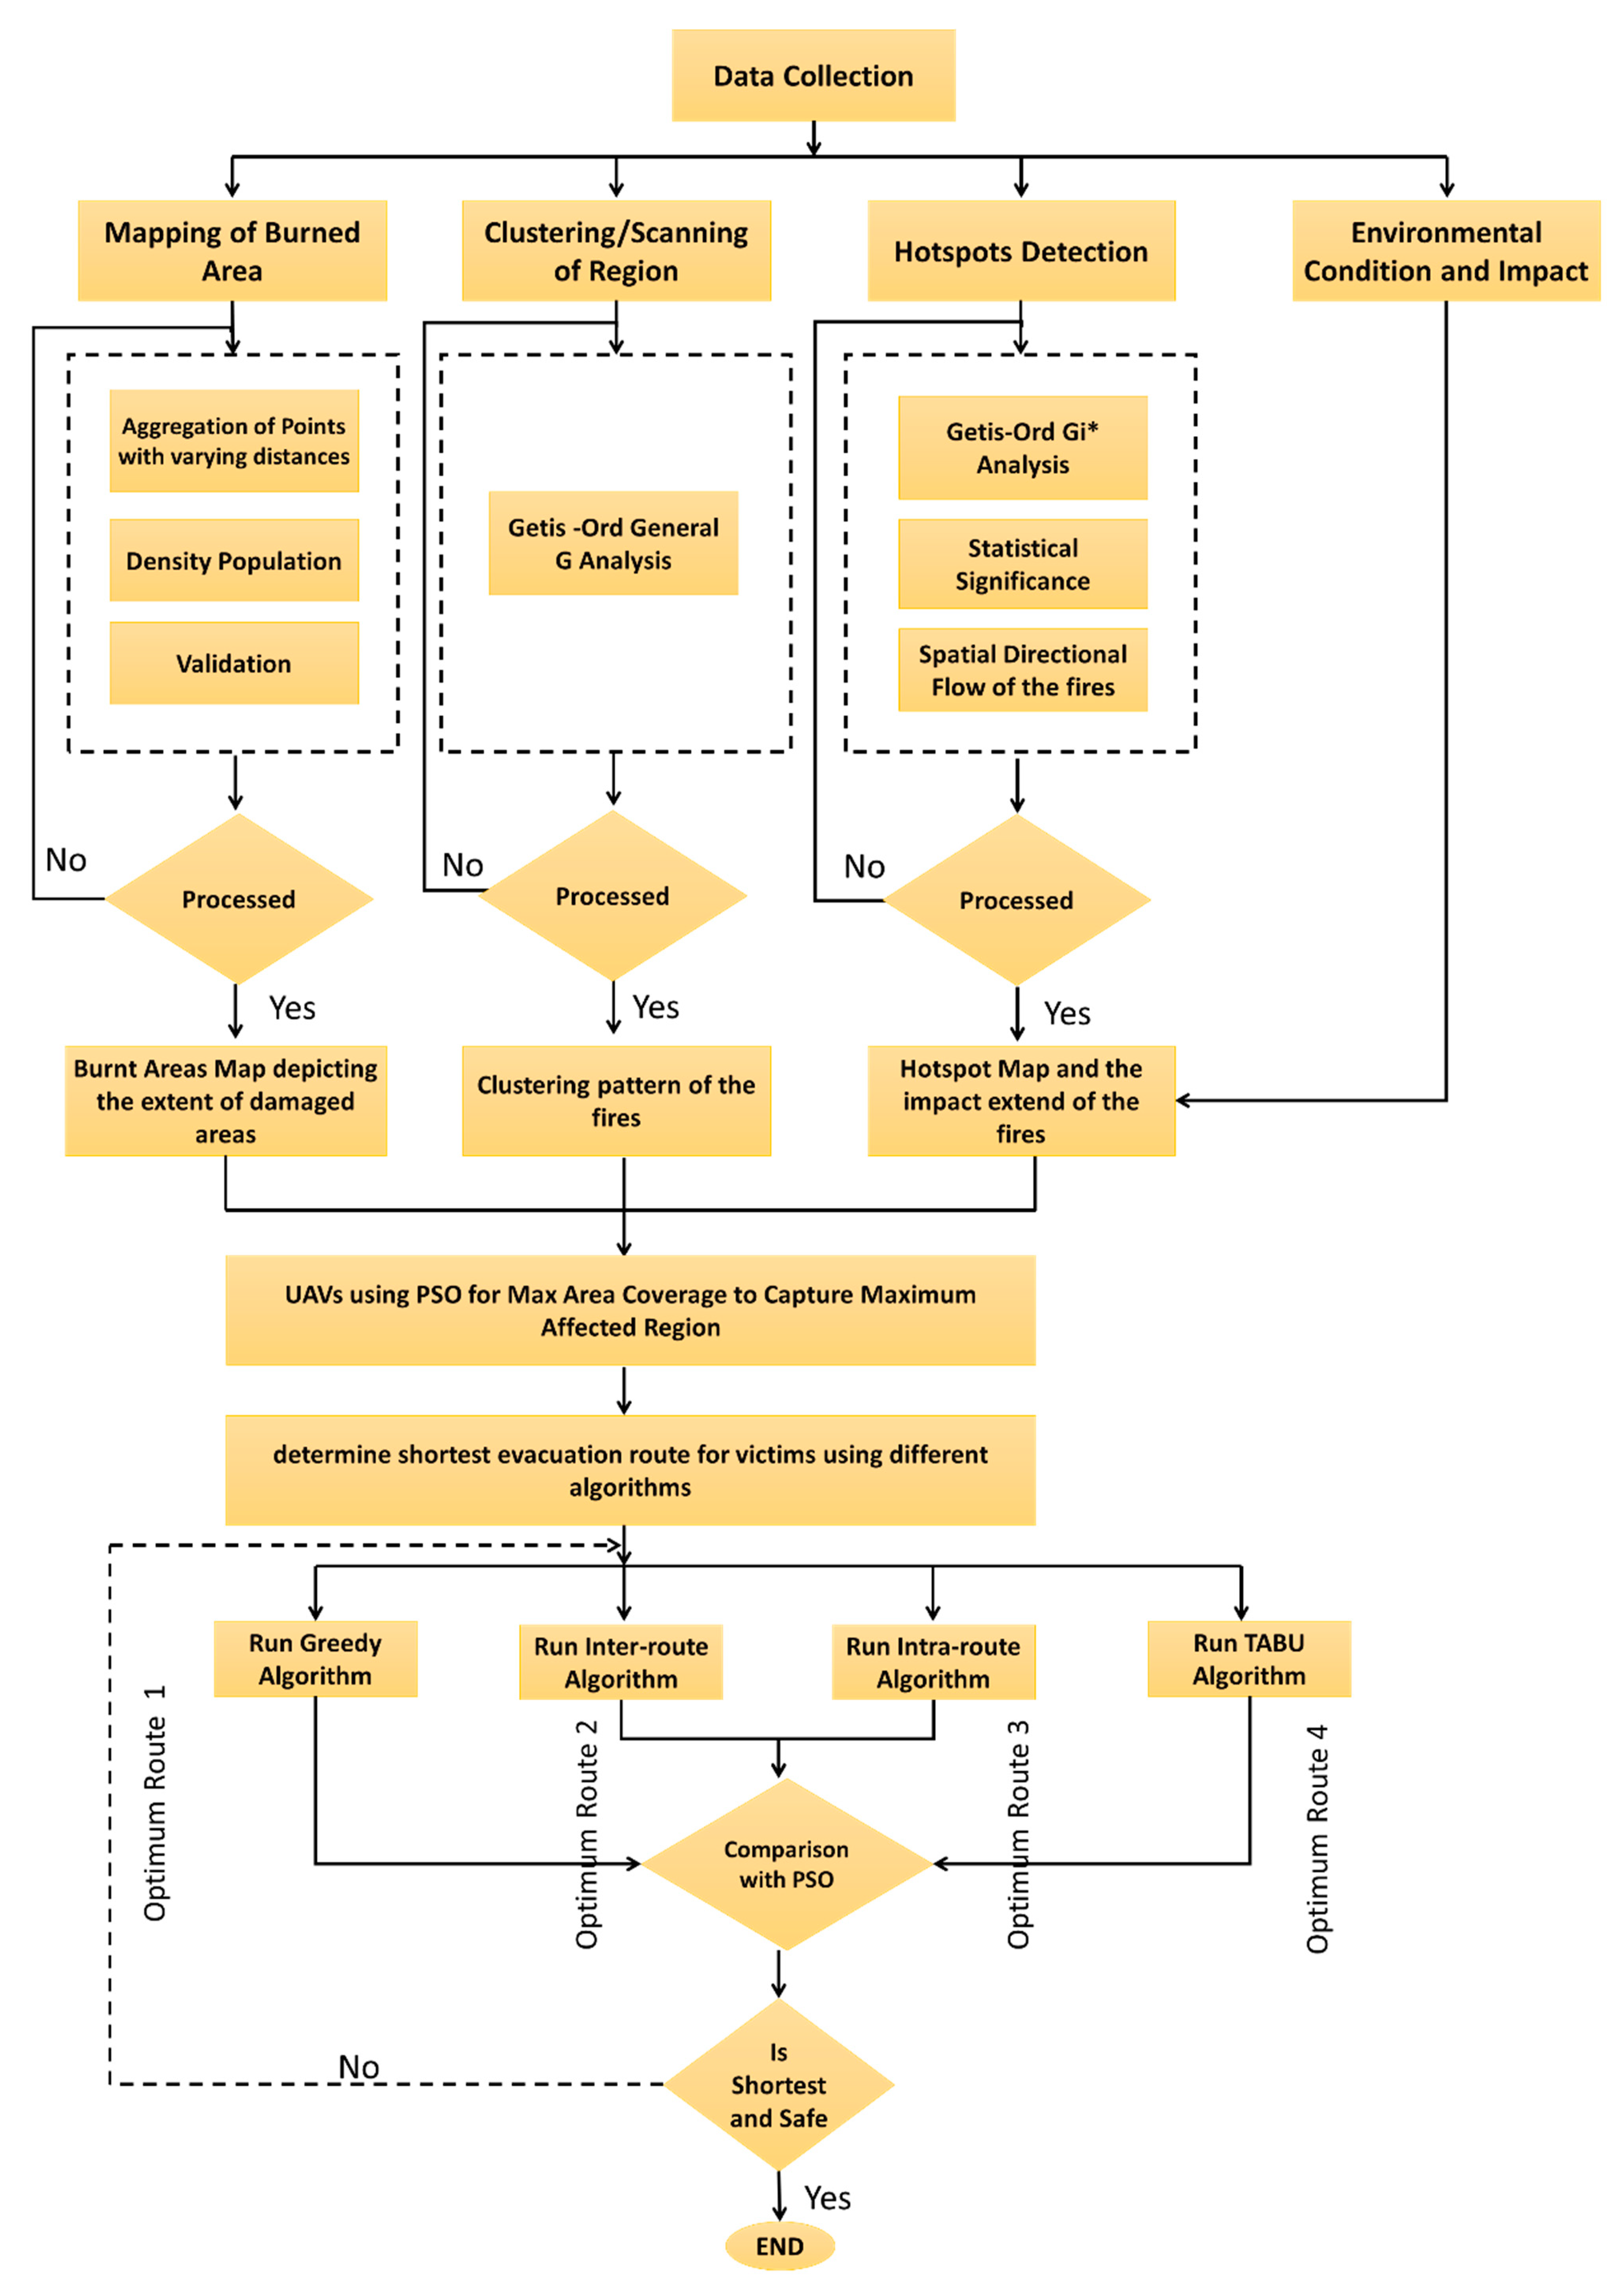
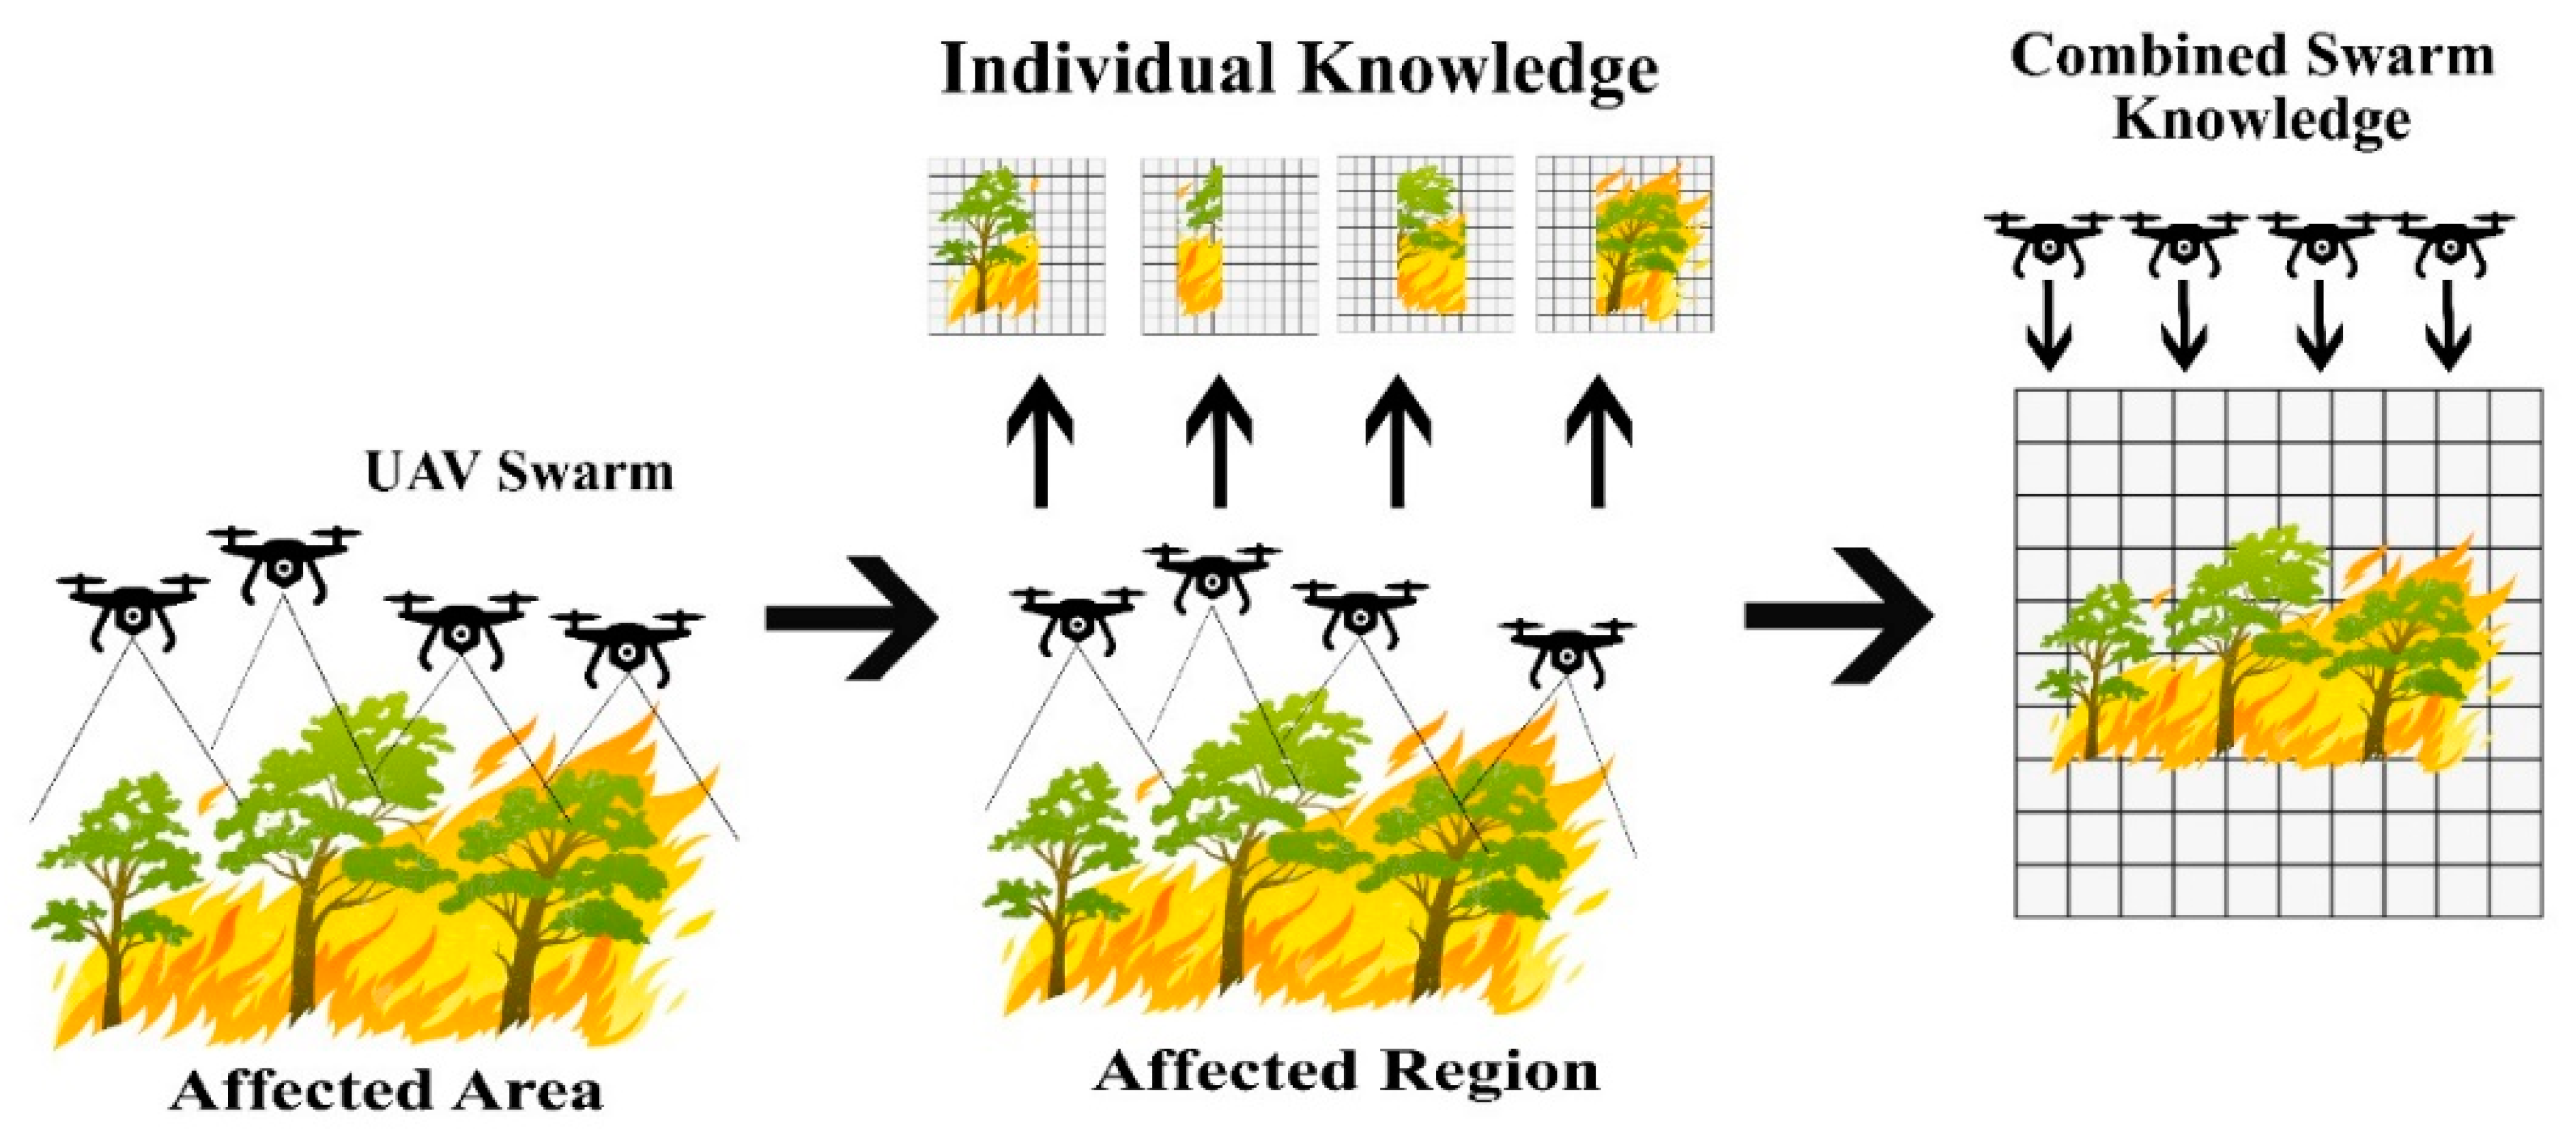
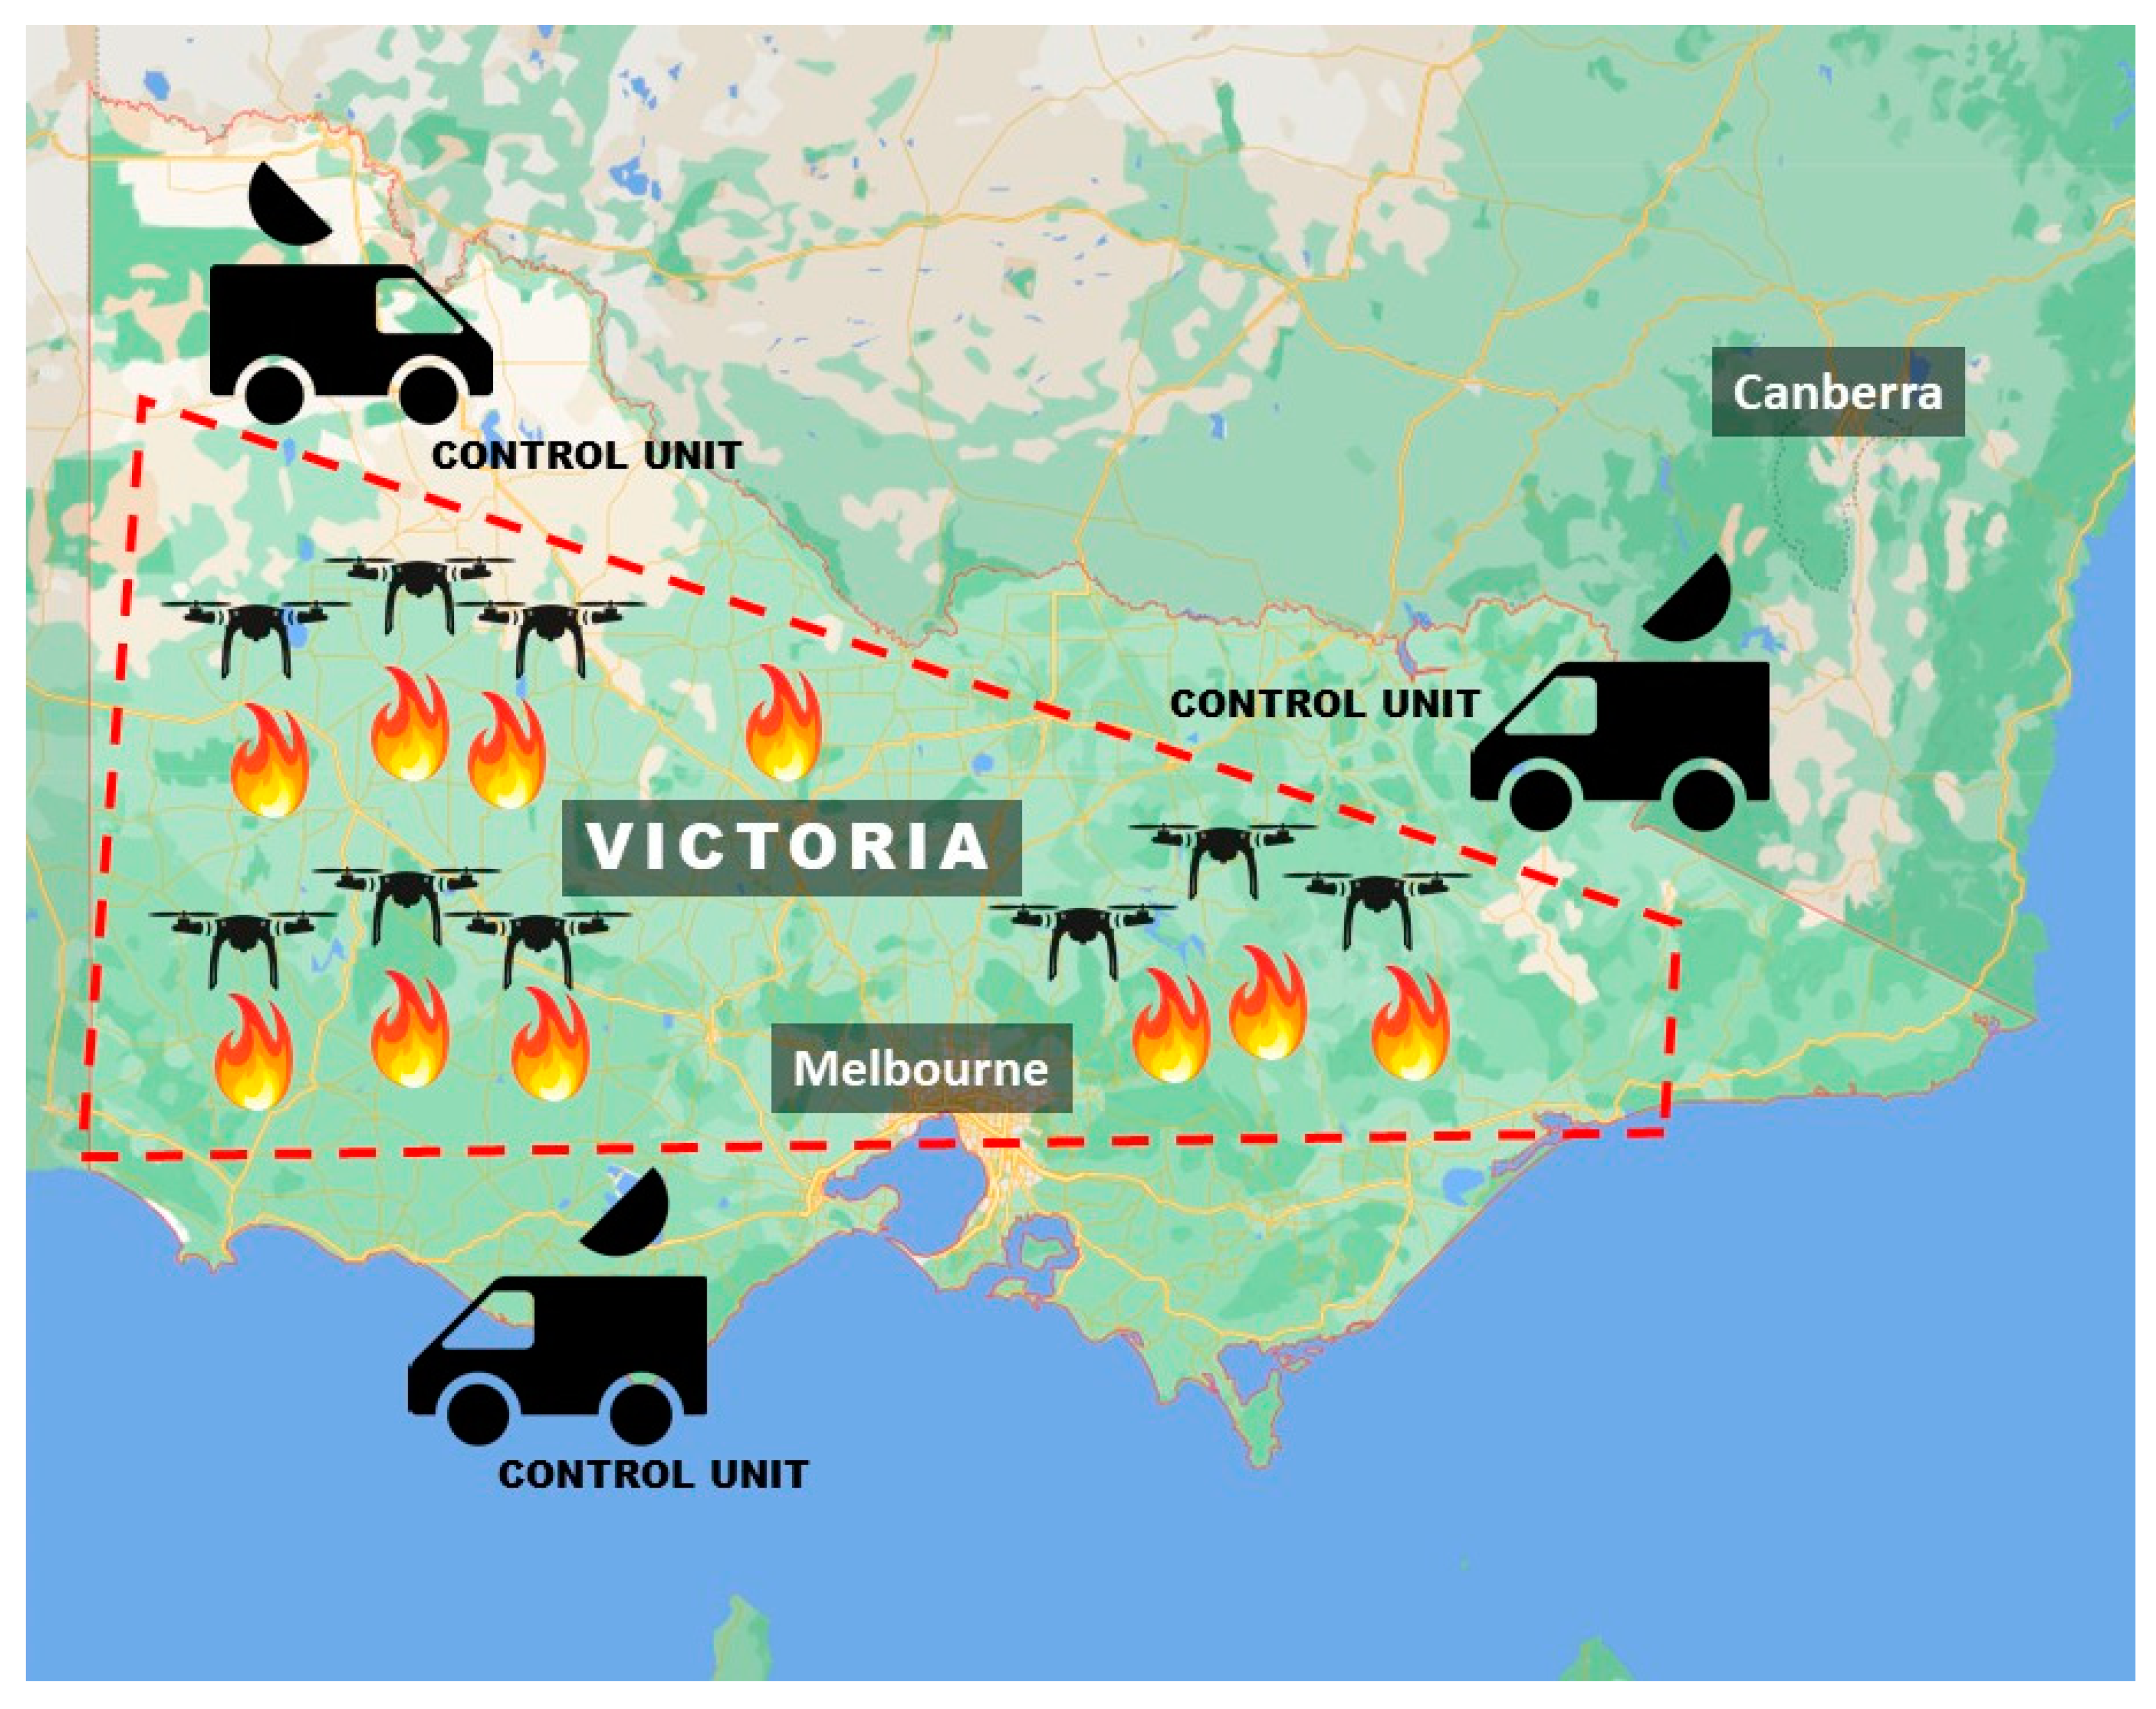
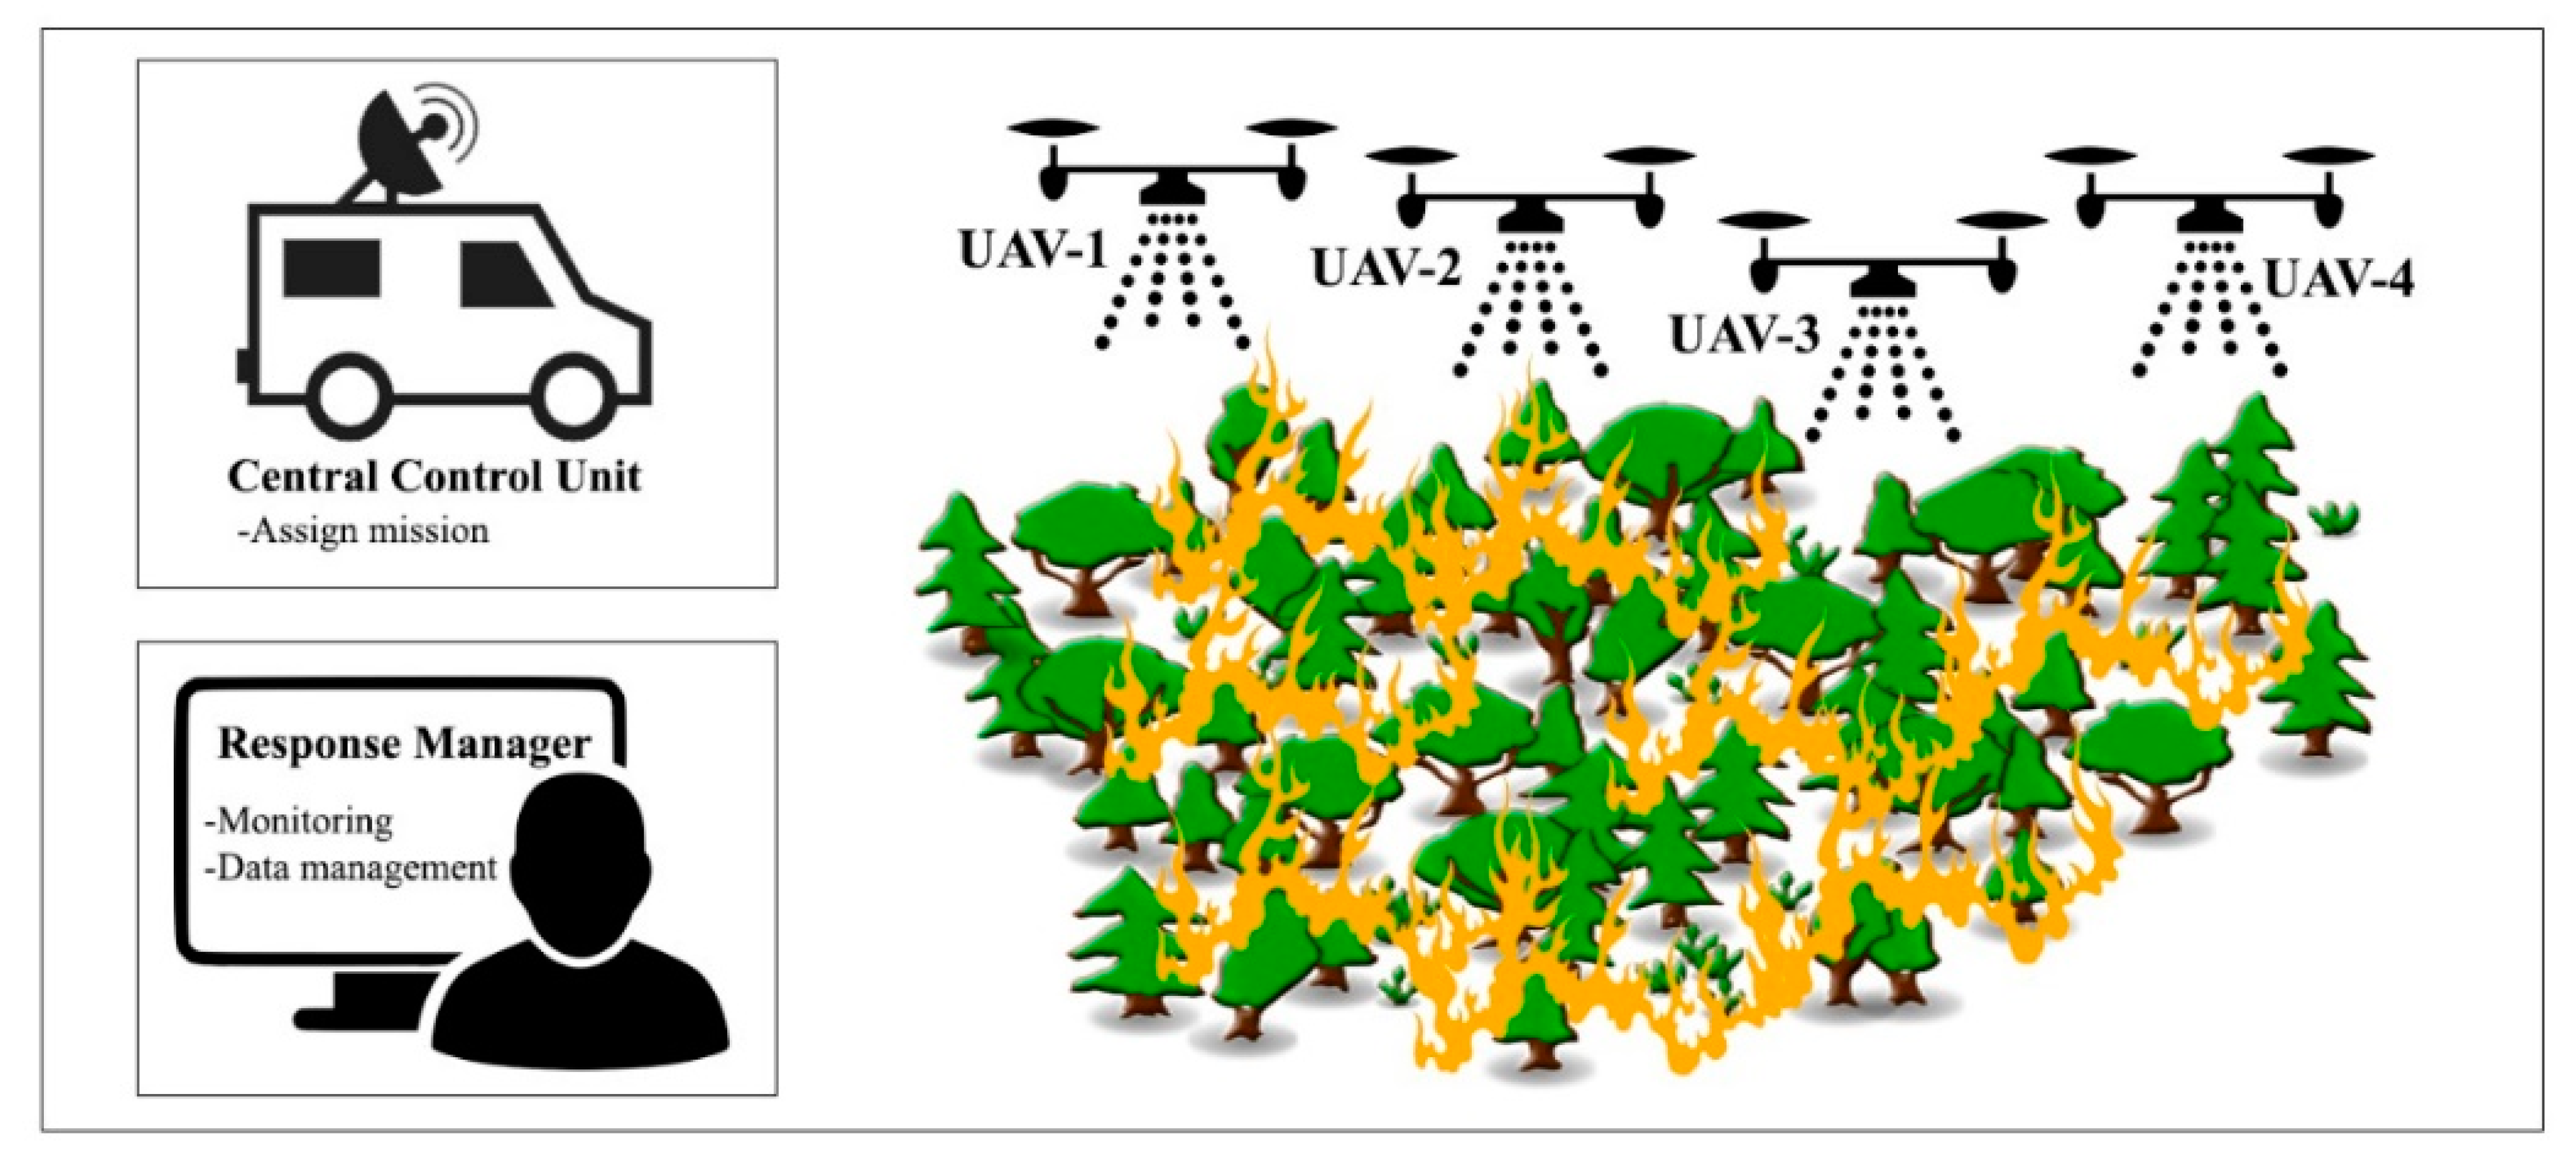
Further, many roads, bridges, and paths for vehicles are damaged, blocked, or destroyed due to bushfires or other associated emergencies that make road-based response planning very difficult in the post-disaster scenario. Also, the bushfires damages may destroy the telecommunication system resulting in loss of internet services, leading to the unavailability of technologies like GPS and GIS. This calls for a need to devise a system that would automatically find the shortest possible route to the affected area to address each bushfire site. A key advantage of this system is its non-dependency on the telecommunication infrastructure, where the swarm can create their own communication network and share real-time information to the communication vans or stations situated at a safe distance to instigate proper and immediate response plans. Accordingly, a UAV-based bushfire assessment and mitigation system are devised in the VIC region in the current study. Therefore, this study proposes a UAV-based bush fire assessment and mitigation system using GIS-based tools and remote sensing. Initially, the mapping of the bushfire areas and hotspot detection is carried out using the GIS and remote sensing. After gathering the preliminary data, the UAV swarm is assigned to the affected area to expedite the disaster response plan through damage assessment, locating the best optimized routes to and from the depot, and generating a map of the region. The study also aims to optimize UAV allocation by reducing the distance between the source and target area, thus reducing travel time.
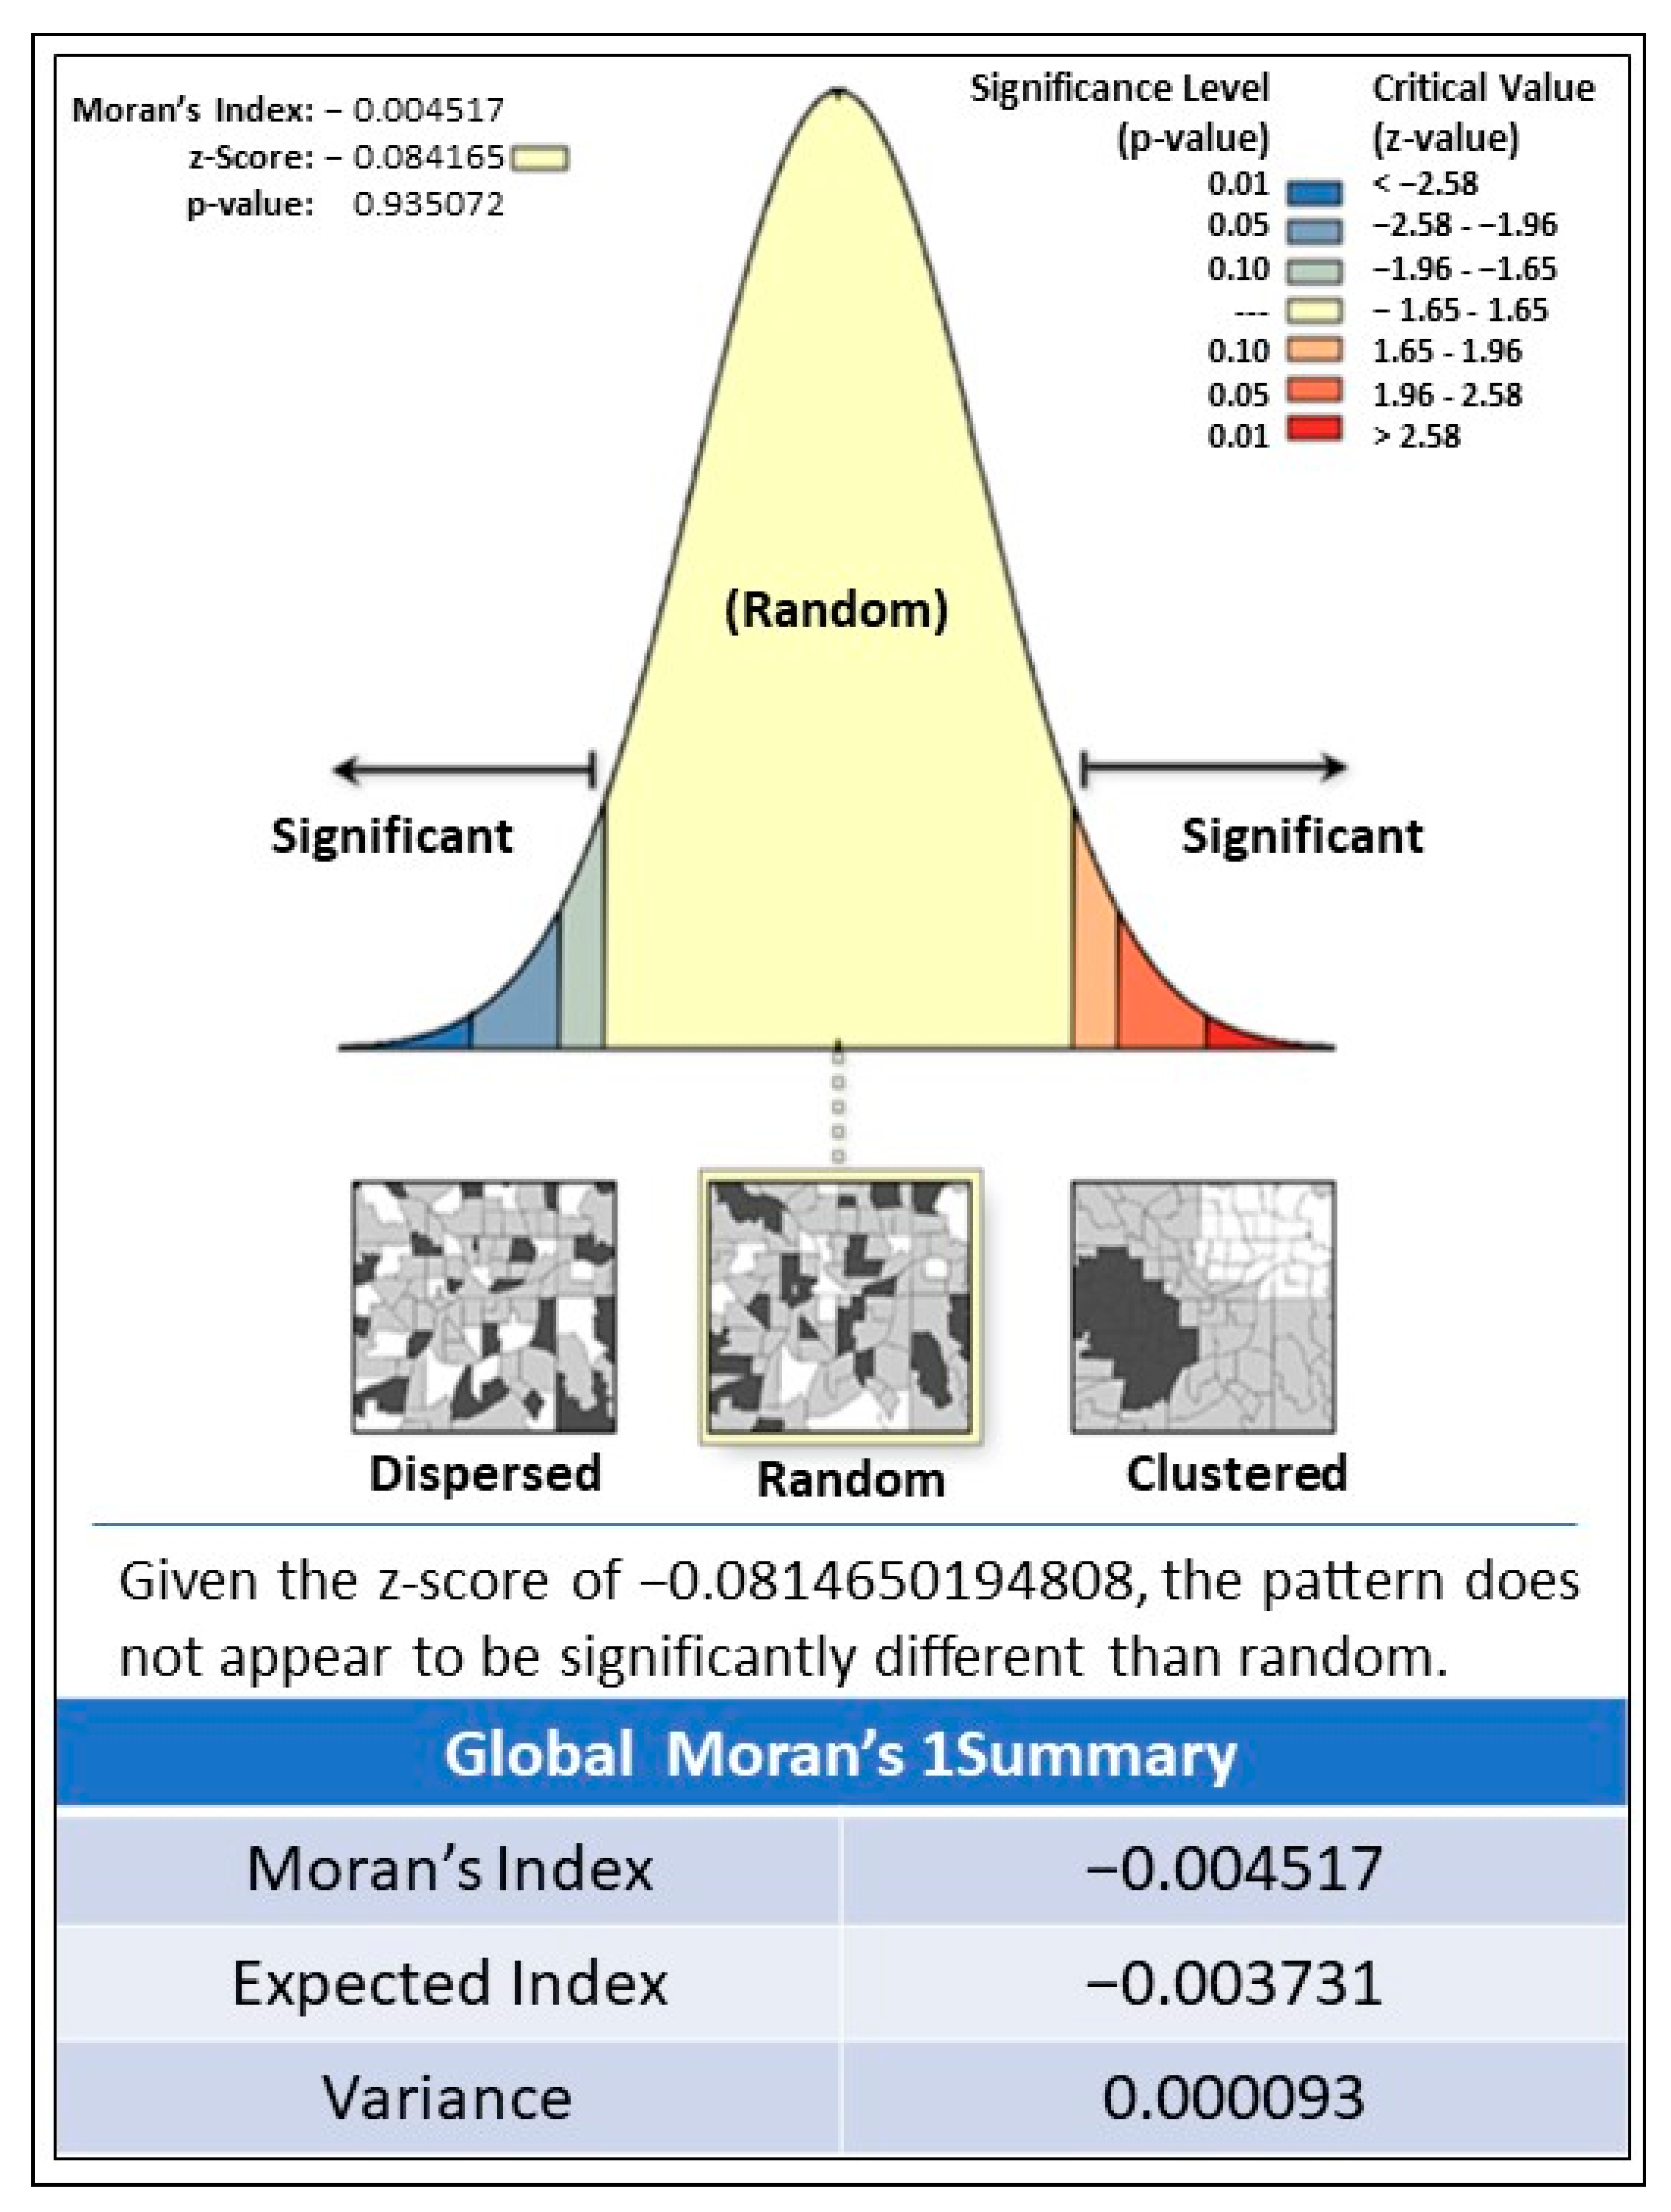
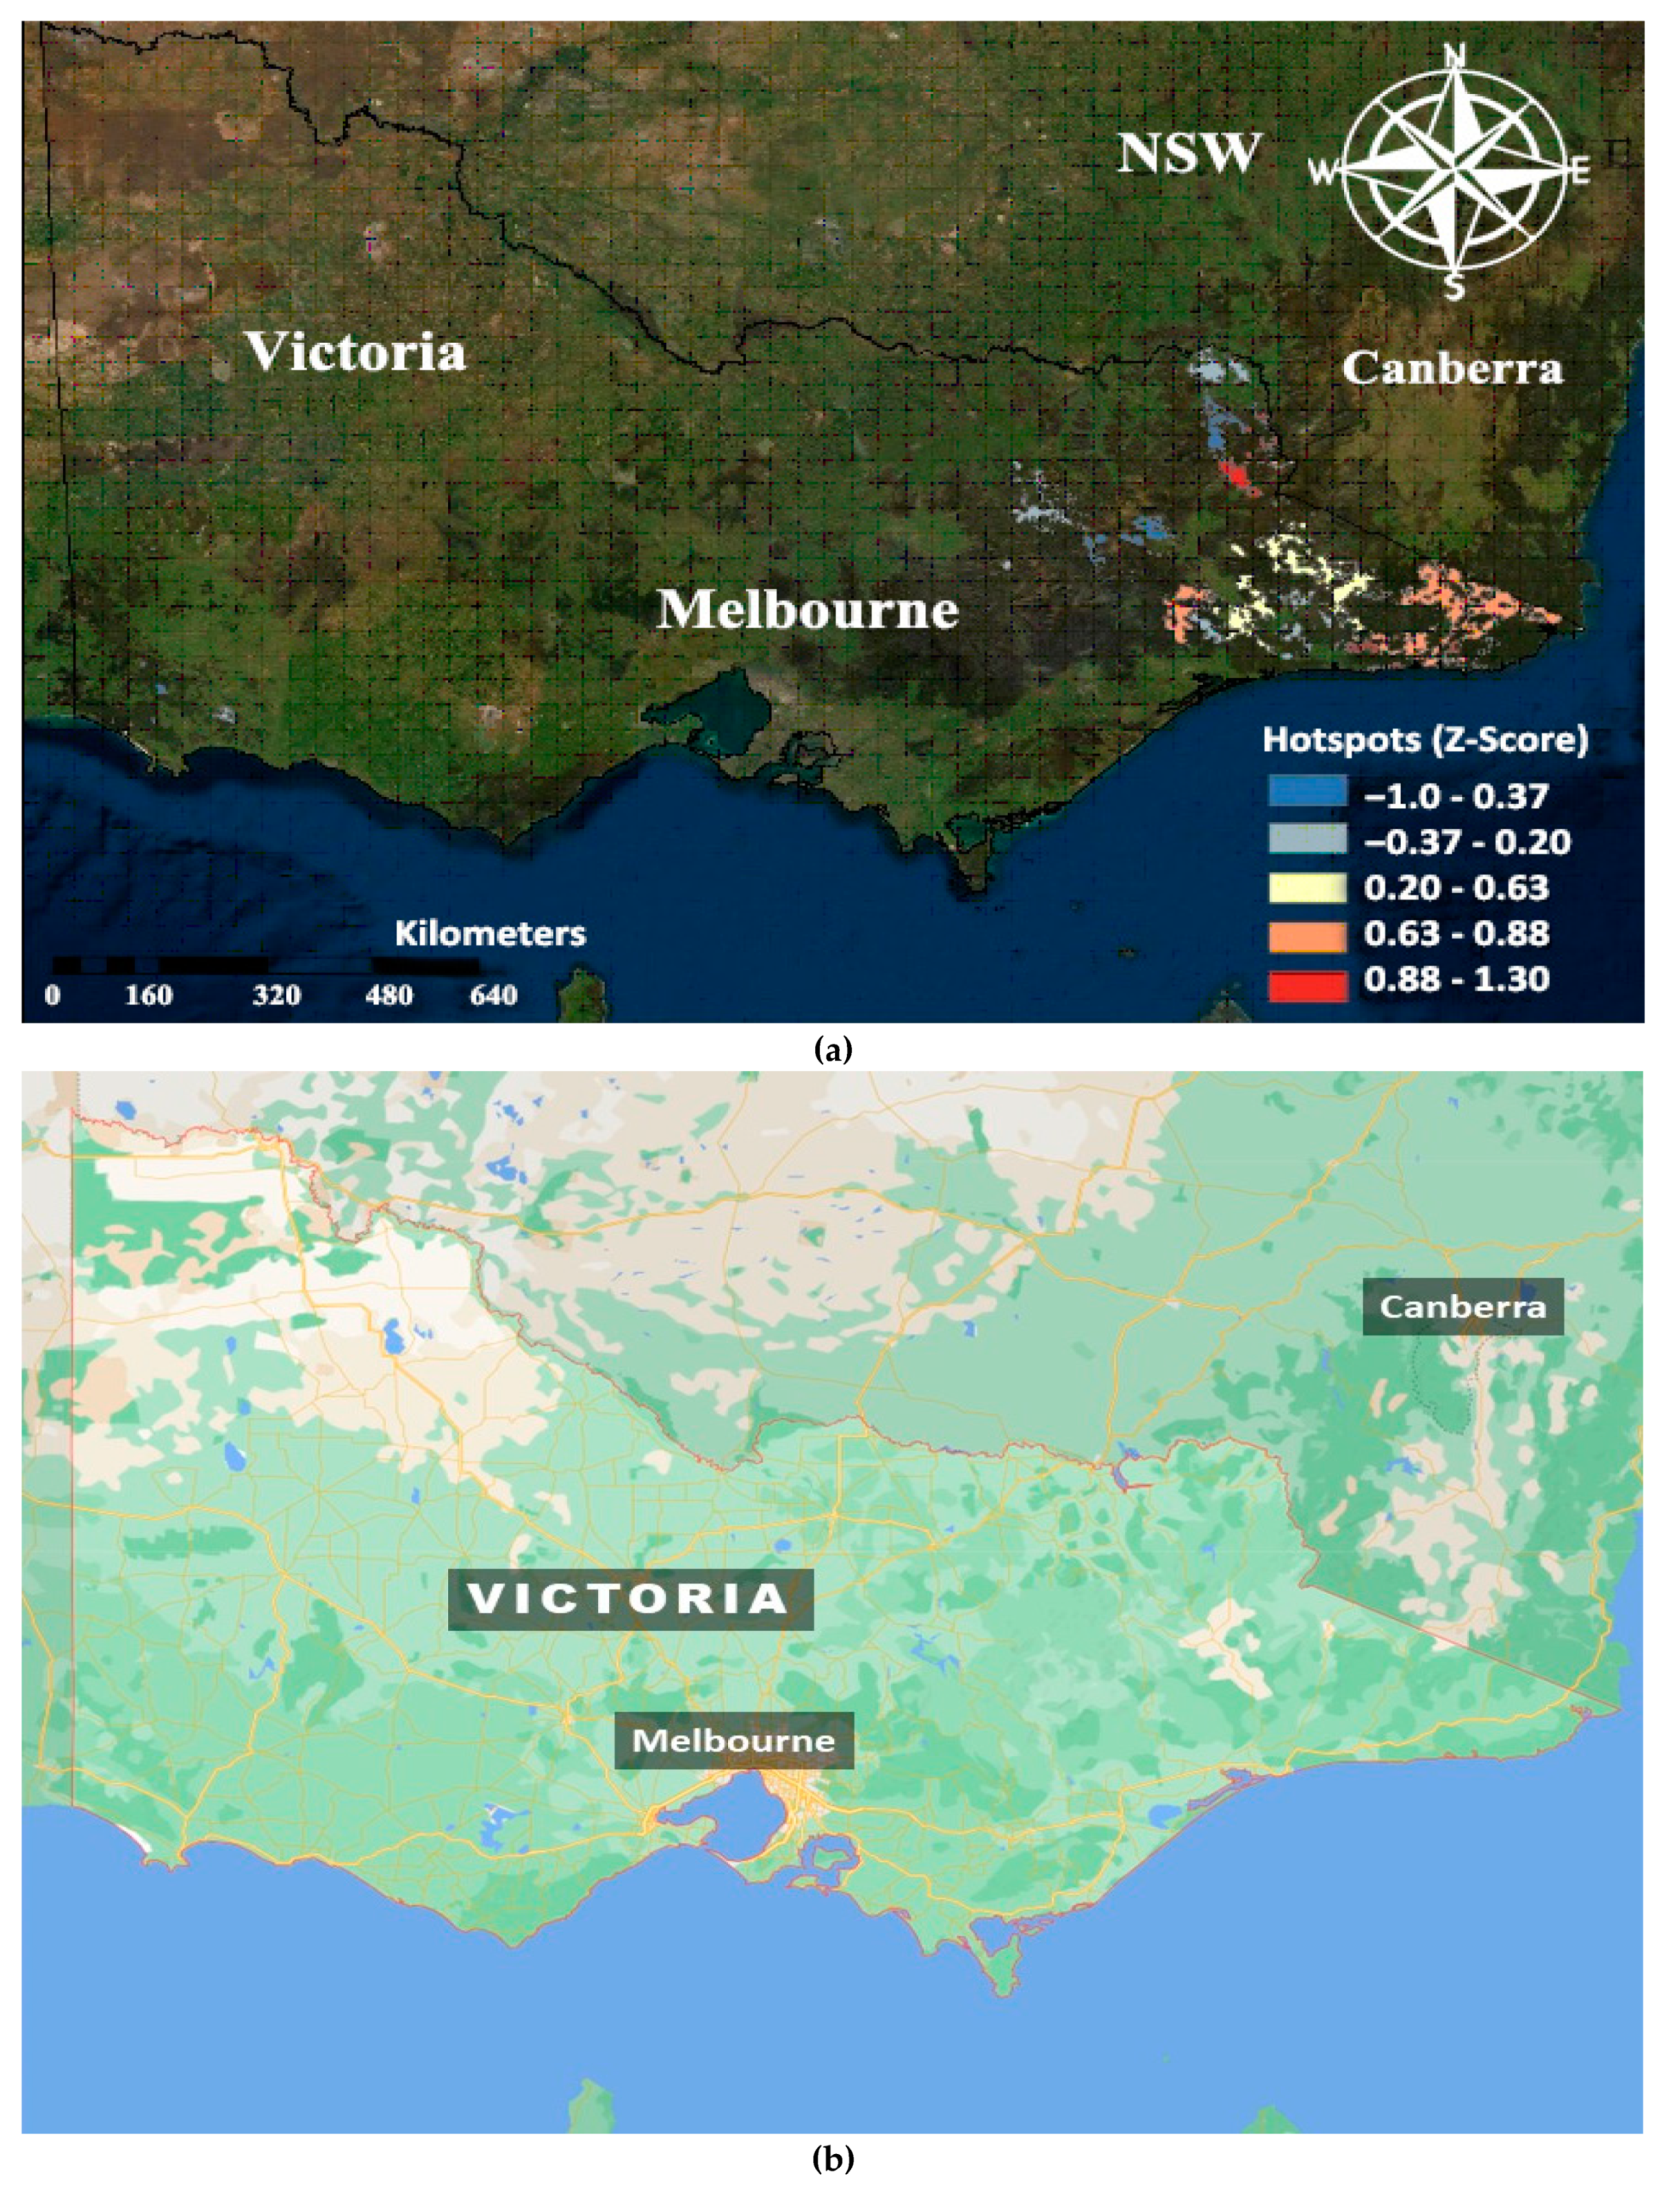
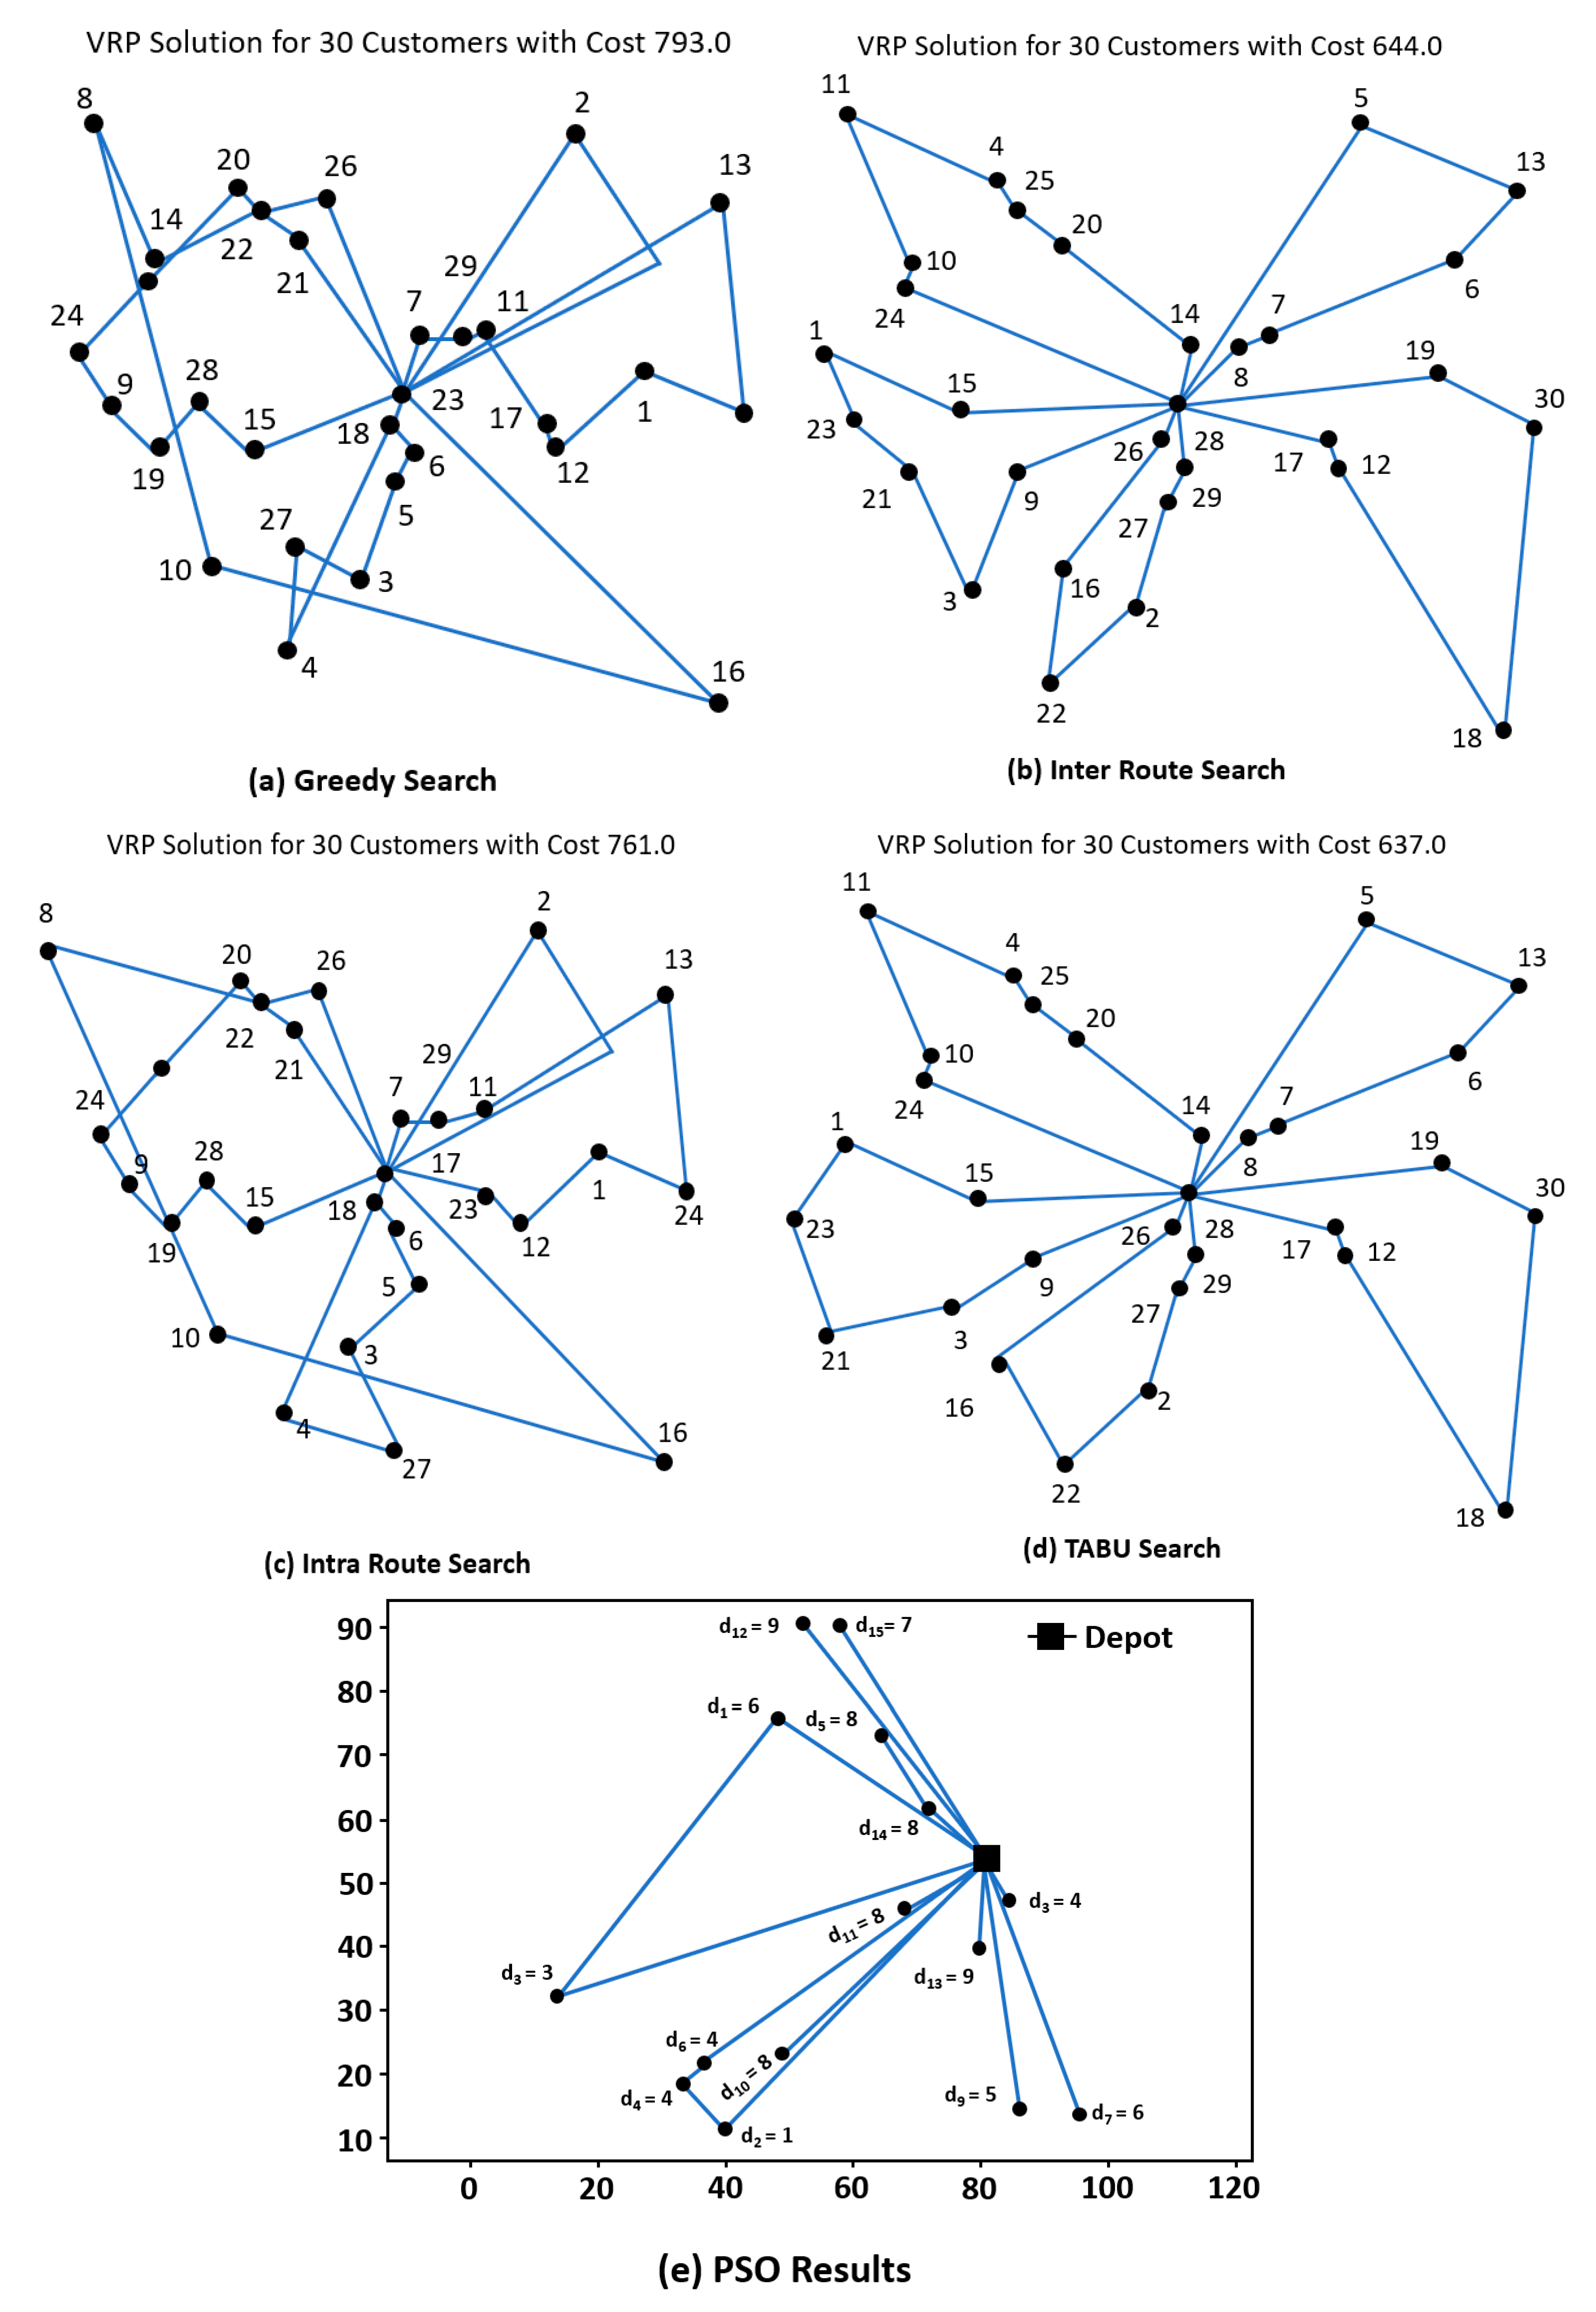
Overall, data is collected for mapping, scanning, and hotspot detection using Getis-Ord General G Analysis for the VIC region in the current study. Based on this analysis, the extent and impact of the bushfire are evaluated. A mathematical model is developed using particle swarm optimization (PSO) for the UAV maximum area coverage, the shortest path to the disaster location, and minimize the time to perform the assigned task. Different algorithms such as tabu, greedy, intra-route, and inter-route are evaluated to find the shortest route to the disaster location. The performance of these algorithms is compared to the PSO, and the best solution is used for UAV path planning.

1.2. Causes of Bushfires

A combination of edaphic, human, and climatic factors contributes to the bushfires. High terrain steepness coupled with elevated summer temperature, increased wind velocity, and fuel availability on the forest floors or bushlands usually result in significant damage and widespread fires. It has been reported that anthropogenic causes greatly enhance the fire intensity, contributing almost 75% to the propagation of the bushfire [34]. However, the natural causes of bushfires are higher than human-initiated fires. Many wildfires are intentionally lit for land conversion, harvesting, slash and burn agriculture, social and economic conflicts, land use, and property rights. These include anthropogenic activities, climate change, landscape, and combustible fuel. The bushfires are mostly a direct or indirect consequence of anthropogenic activities [35]. The urban settlements or agricultural production sites are usually adjacent to the forests. The cultivation burning creates a budding site for the onset of bushfires, as the burning is not regulated periodically. The common anthropogenic causes of bushfires include burning agricultural lands, hunting wildlife, or harvesting honey through smoke [36]. Climate changes are also linked to bushfire events. The fire events are closely linked with the weather conditions, both prevalent and antecedent. The fire risk index (FRI) is strongly influenced by air temperature, wind speed, and relative humidity [37,38]. The next cause of bushfires is the landscape, including the slope, aspect, elevation, and curvature. This complexity of terrain mainly impacts the changes in fuel and atmospheric circumstances. Slope angles of 15–20 °C are favorable conditions for propagating fire hazards. The surface elevation influences fire response and behavior [39]. The other reported cause of bushfires is the presence of combustible fuel. It is an essential component of the fire triangle. This factor affects the flammability, size, and intensity of the fire. Fuel refers both to the fuel state and fuel type. The fuel state describes the fuel’s moisture content or the plant’s status: decayed or alive. The fuel type comprises the physical features of the fuel and its composition. The fuel’s physical component influences fuel burns, including frequency, size, alignment, and material arrangement [40]. The most critical impact of moisture on fire is the influence of steam from burning fuel, which minimizes the amount of available oxygen and its combustion.

1.3. Bushfire Management with Advanced Tools

Effective bushfire risk management and minimizing its damage are essential for long-term bushfire management planning and strategy development to achieve a smart and sustainable planet and societies [41]. Various technologies have been used and their applications investigated in such endeavors [42,43,44,45]. Subsequently, identifying bushfire areas in the region is the foremost priority for environmental protection agencies. Once the areas prone to bushfires are identified, a detailed analysis of potential hazards is prepared using appropriate tools, knowledge, and planning. Remote sensing and GIS emerge as two key candidates for such management [36,41]. Accordingly, bushfire hazard models for respective regions considering the topography or environmental factors influencing the fires have been prepared. The spread of fires is broadly attributed to fuel moisture, fuel type, weather conditions, and topography. Accordingly, all the bushfire risk zones are identified. These bushfire risk zones are the areas where a fire is expected to occur and from where it can easily spread to other regions. An accurate evaluation of forest fire issues and pertinent decision systems are only reliable when the fire risk zone maps are available. Thus, integrated dynamic mathematical models coupled with remote sensing and geographical information system techniques are introduced to delineate the risk zones based on the fire risk mappings [36].
Satellite data is a widely used primary source of information for mapping active fire areas at regional to global scales [46,47]. The Moderate-resolution Imaging Spectroradiometer (MODIS) from NASA Terra and Aqua satellites is the first-satellite borne sensor with the ability to monitor fire radiative energy (FRE) release rate, or power (FRP), quantitatively on a worldwide scale [47]. Planned satellite systems like polar-orbiting Visible Infrared Imager Radiometer Suite (VIIRS) and the geostationary GOES-R Advanced Baseline Imager (ABI) provide fine spatial and temporal resolution of fire incidents. Their monitoring effectiveness is ensured through airborne sensors like the calibrated Autonomous Modular Sensor (AMS) [48]. Two types of satellite data are used to detect and analyze fire events: active fire and burnt area products [49]. Burnt area products are based on the variations in the reflectance, or a combination of reflectance and active fires [50]. At the same time, active fire products are dependent on the detection of thermal anomalies. The global burnt area products are used to input the Global Fire Emissions Database (GFED), with the integration of empirical relationships to determine the role of small fires. Such fires are not monitored through course-resolution burned area products from MODIS active fires data [51]. A key concern for the functional products of global burnt areas is that the results are available within a month of the fire event instead of immediate availability [50]. This delay in the results challenges its applicability for near-real-time fire perimeter monitoring that is required for instant fire management and early evaluations regarding the location and extent of the fires. To address this issue, space-borne sensors are used for active fire monitoring. Contrary to the conventional products of burnt area data, monitoring of active fires through space-borne sensors ensures that data is instantly available, with a regular latency. Accordingly, modern fire management authorities use near-real-time active fires to estimate the burnt area [46].
Randerson et al. [51] and Van Hoang et al. [36] have correlated the frequency of the active fire detections with the monthly observed burnt area from medium-coarse resolution sensors on the global to local scales. The local scale monitoring is typically validated through satellite burnt area imagery of the field measured samples. However, the cloud variability, topography, fuel, weather, and fire behavior, coupled with miscellaneous spatial and temporal resolution issues of the imagery used for calibration, can present challenges to this method [49]. Oliva and Schroeder [52] and Vadrevu et al. [53] suggested that instead of incorporating the pixels of active fires, aggregation of the active fire could yield appropriate fire perimeter delineation at regional levels. Other studies have tested the interpolations of active fire clusters and successfully visualized these large fire perimeters, and calibrated the fire propagation models [52,54]. Various techniques have been used for the aggregation method, ranging from buffering of fire zones [52], Kriging analysis [55], weighted mean and distance methods, or the Inverse Distance Weighted (IDW) method [56], to convex hull algorithms applied to the assessing the active fire clusters [57]. Previous studies regarding active fire monitoring are carried out using coarse-resolution sensors, usually of 1 km resolution like MODIS or Advanced Very-High-Resolution Radiometer (AVHRR) [55]. While for the first order burnt areas, the probability is achievable through these sensors, it is highly recommended to examine the possibility of fire perimeter mapping using high spatial and temporal resolutions [
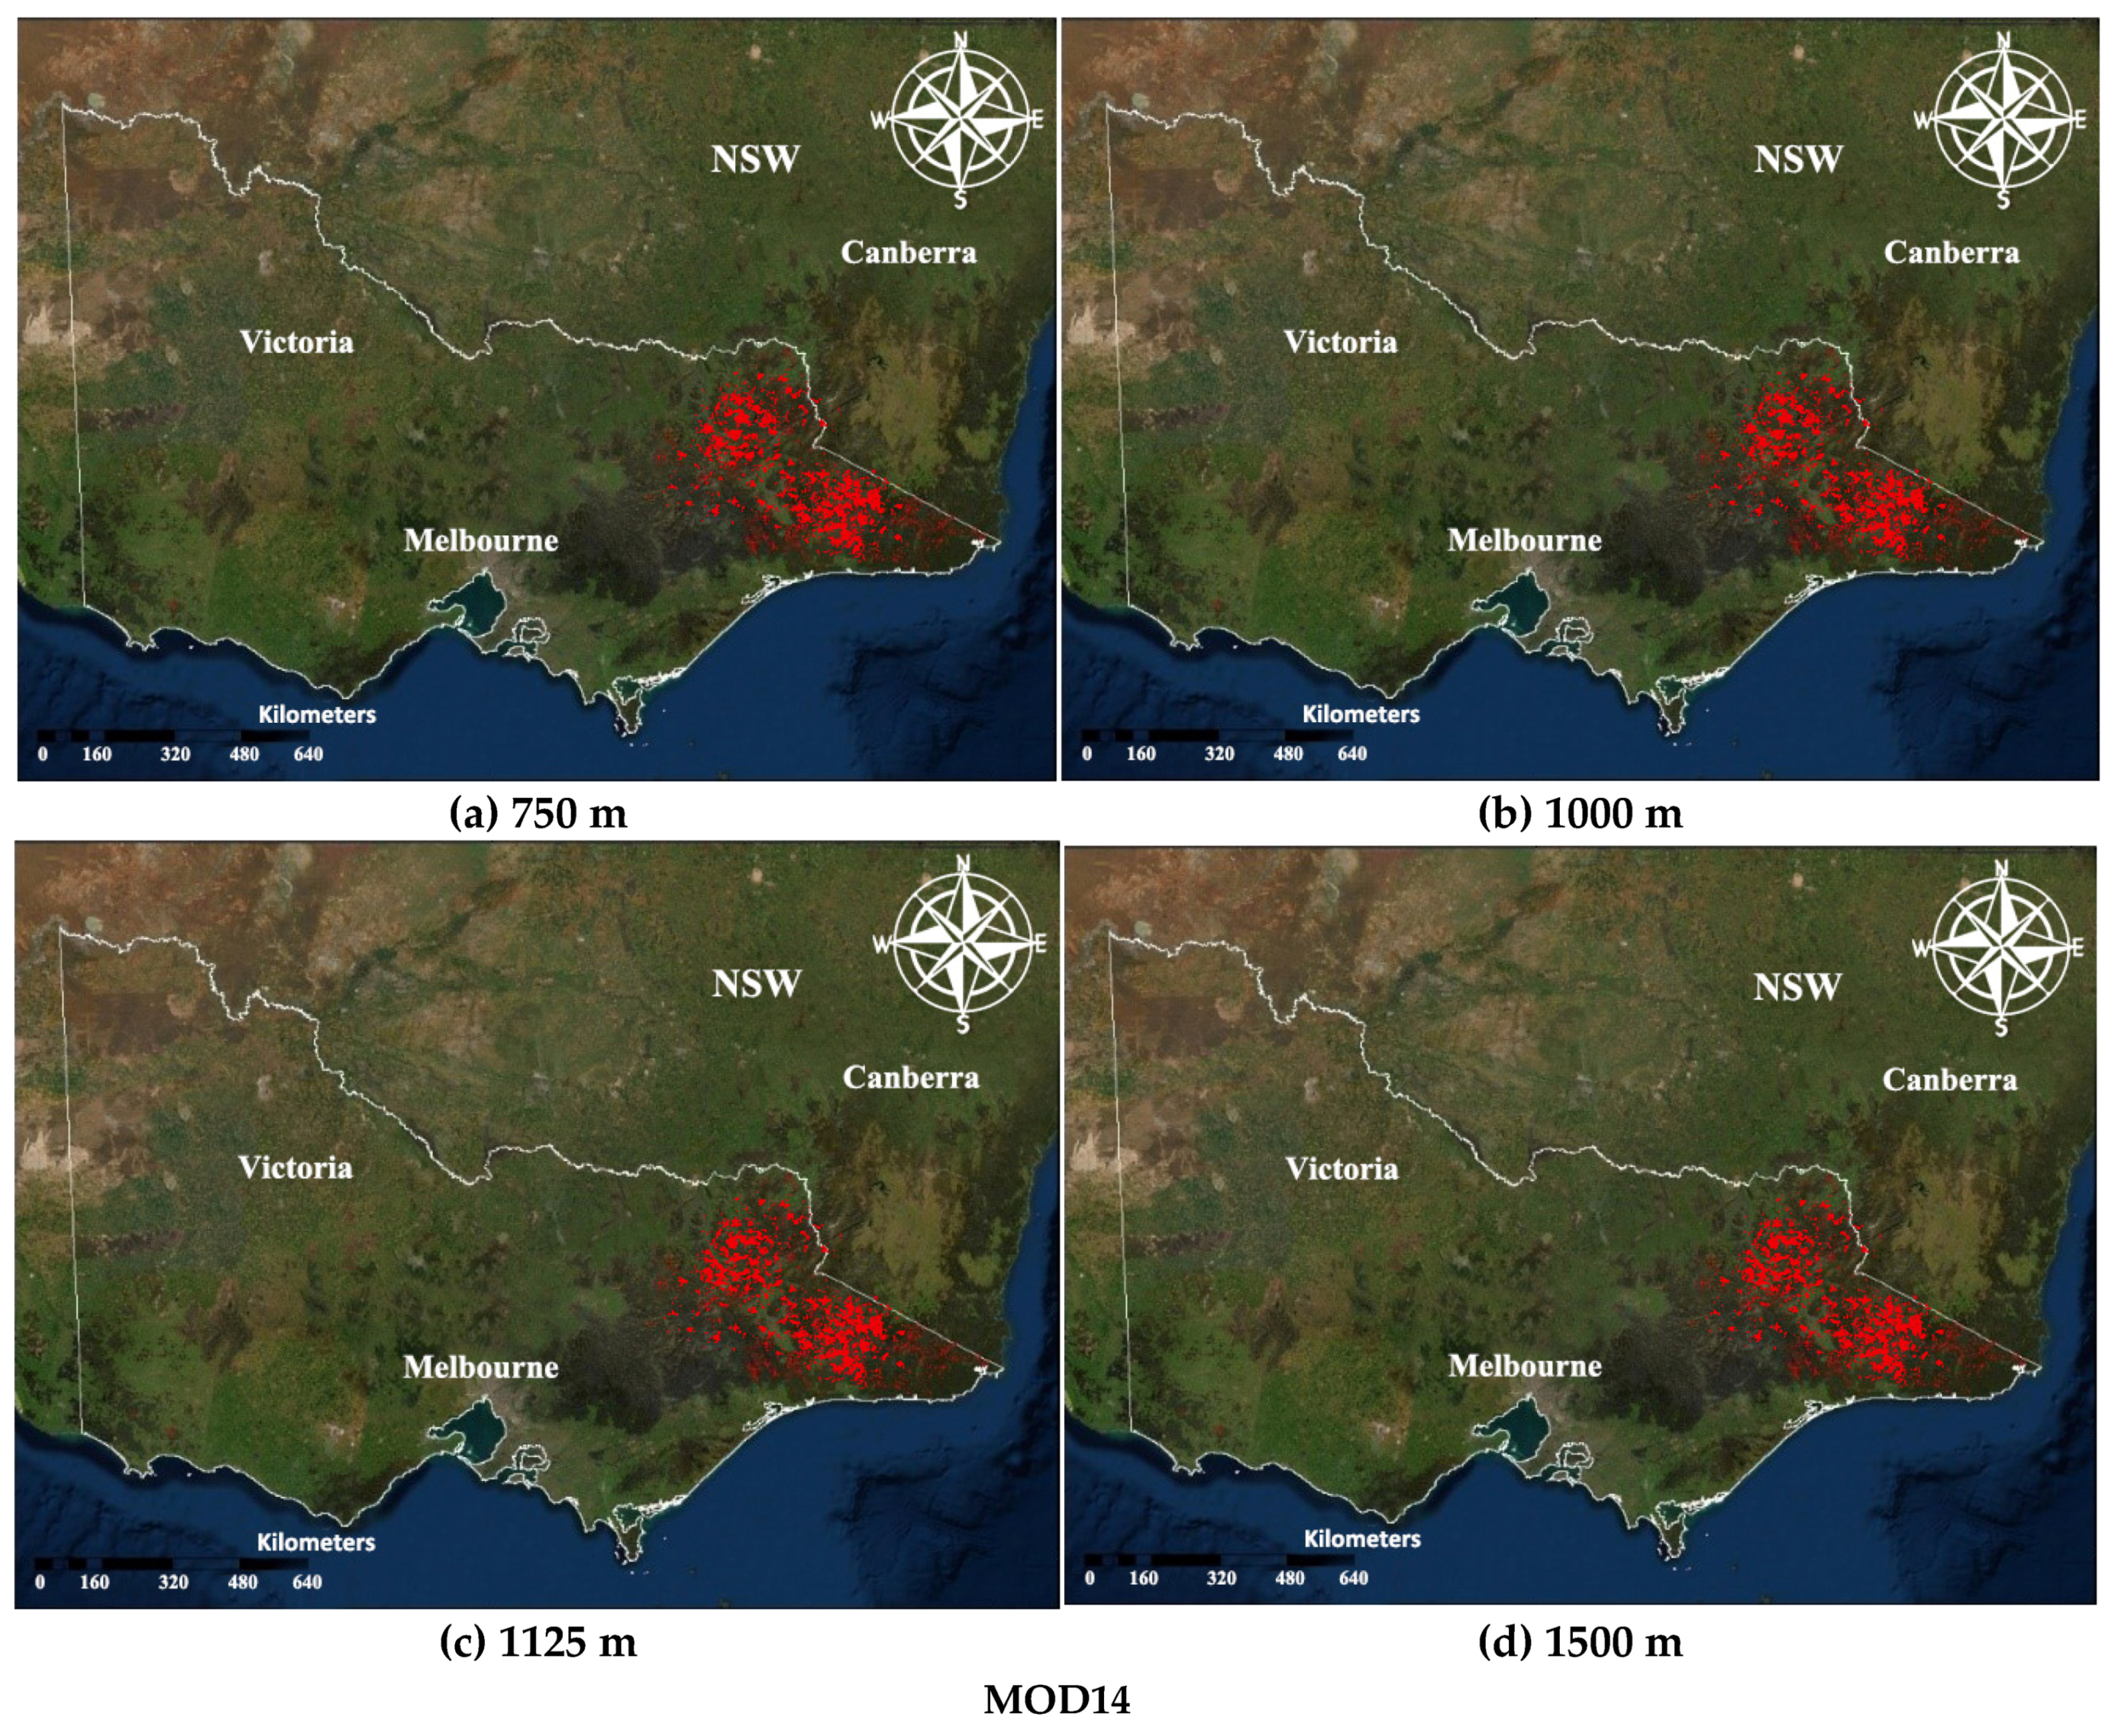
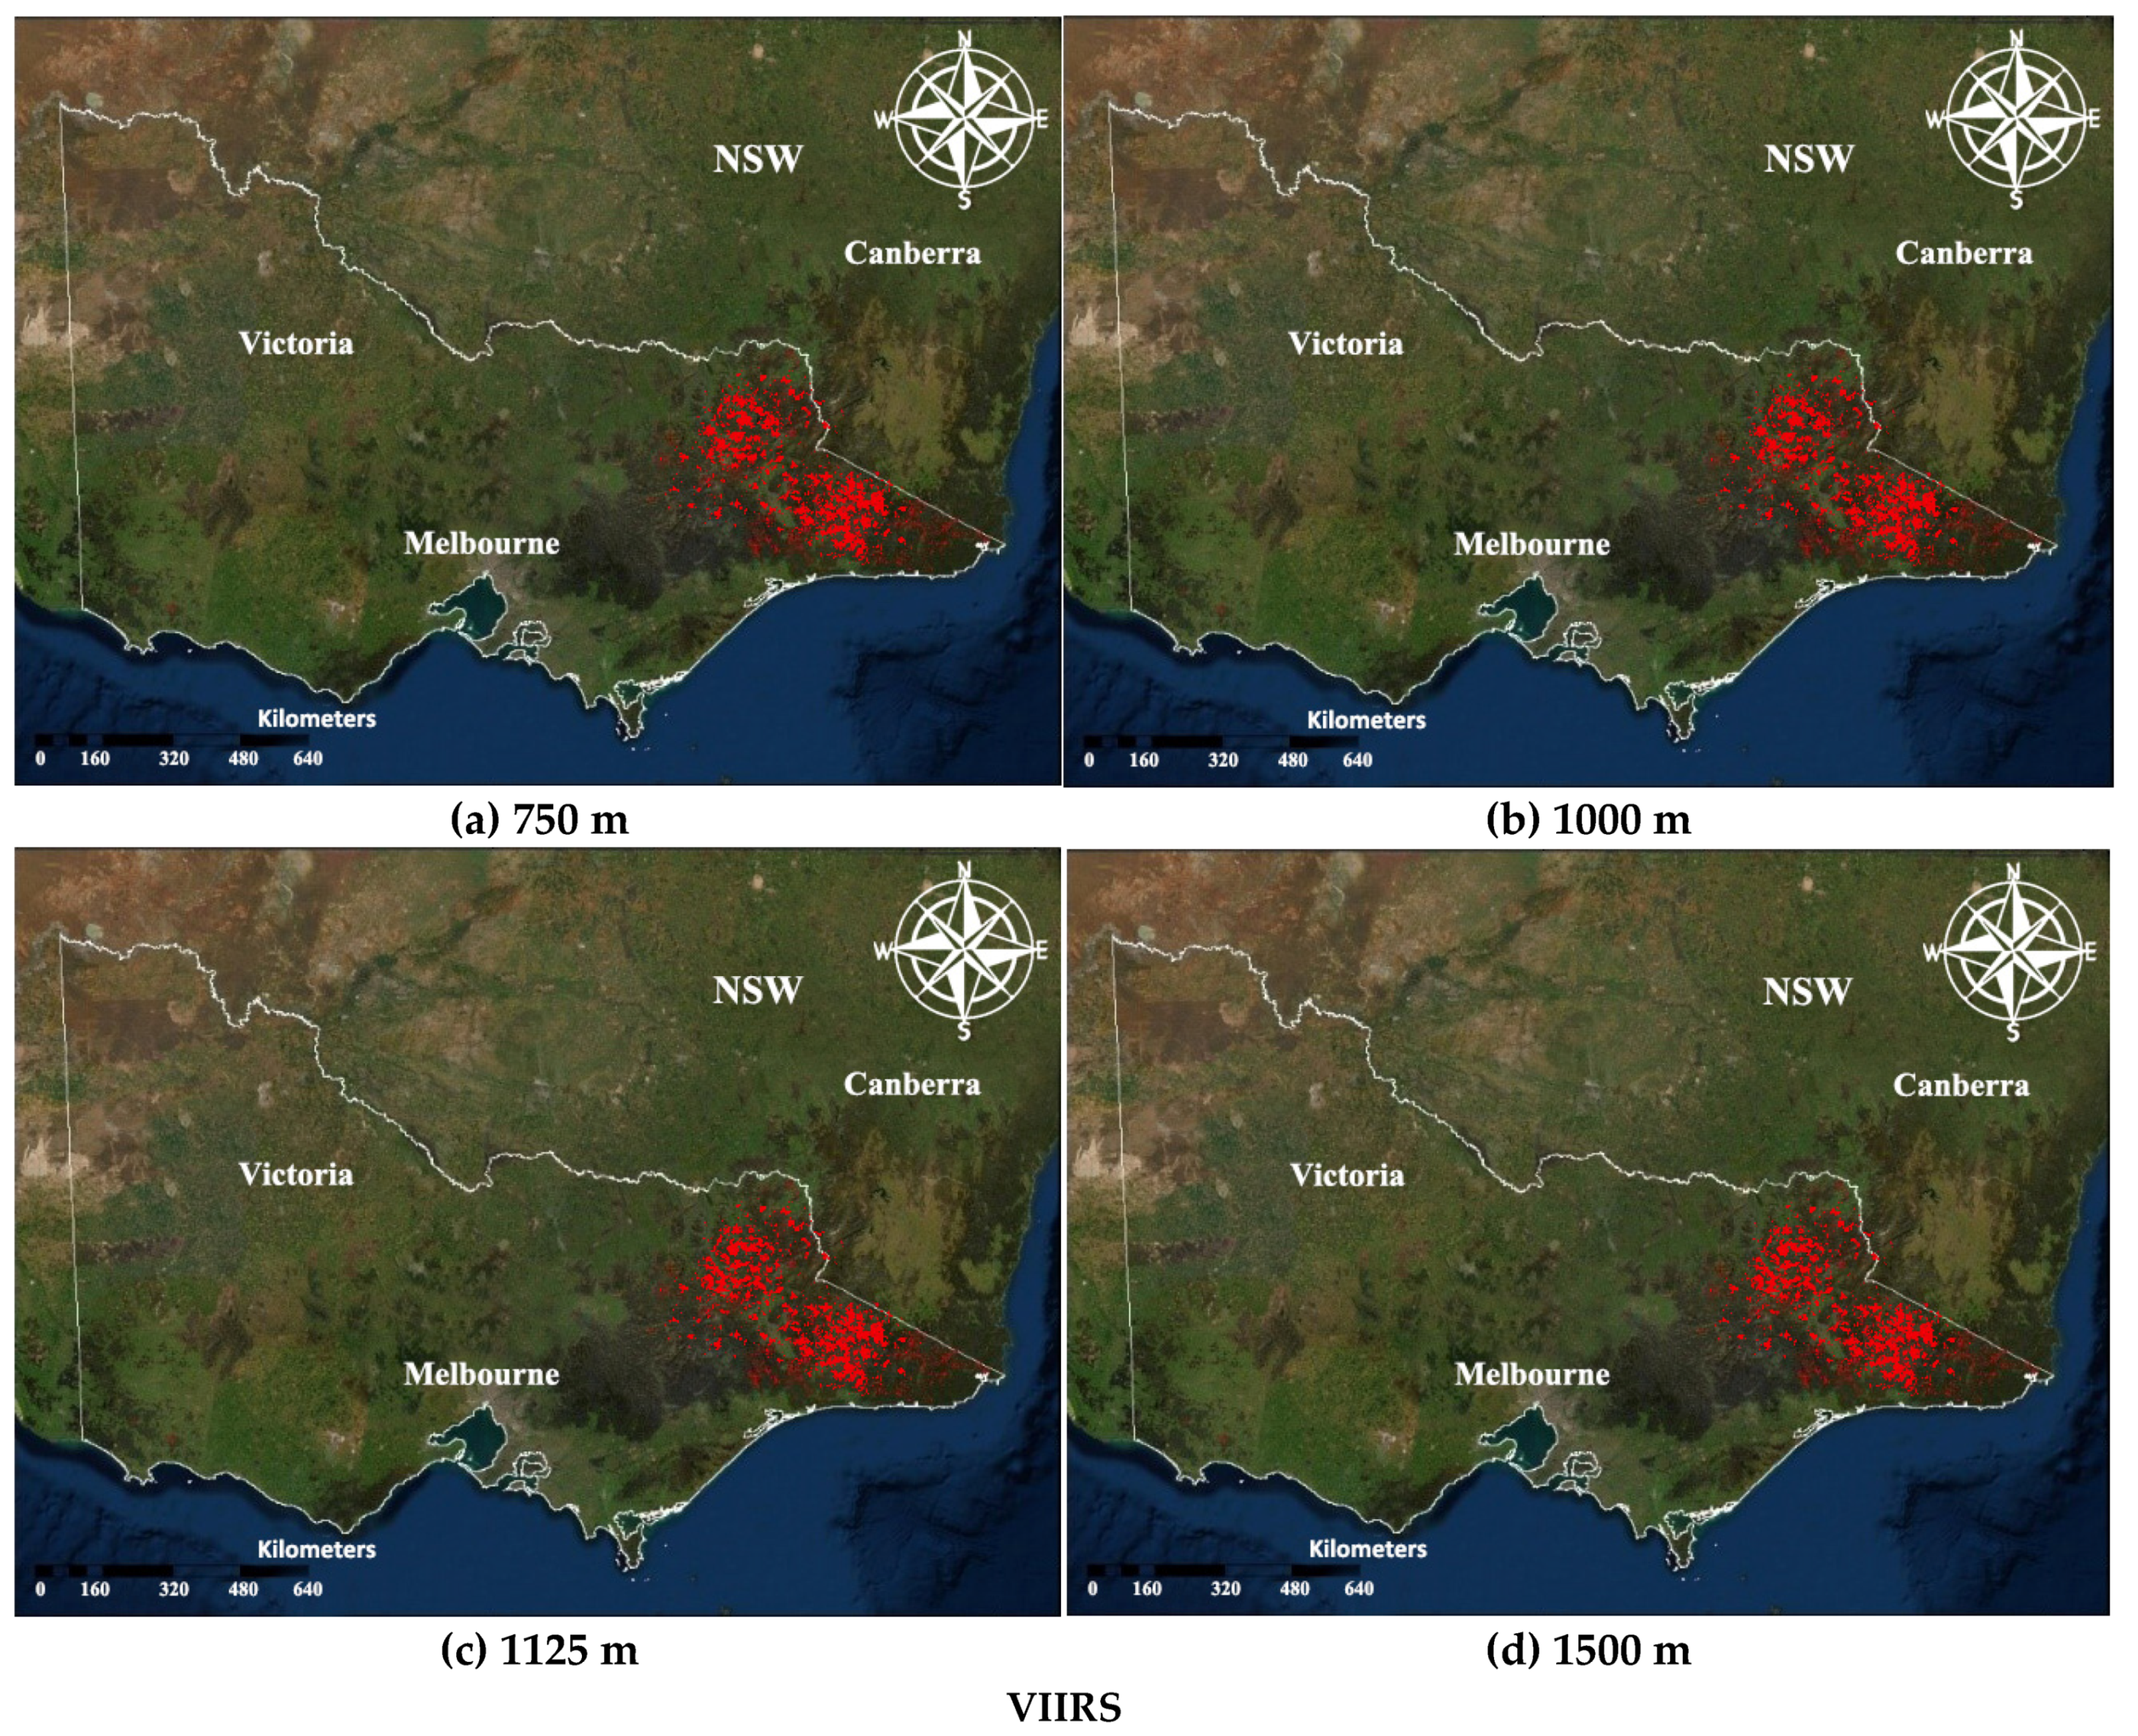
52]. However, monitoring using satellite data is a trade-off between spatial and temporal resolutions. Thus, high temporal resolution data is preferred when assessing a large region. Some of the more recent available sensors like VIIRS on the Suomi National Polar-Orbiting Partnership (S-NPP) satellite provide great potential for detecting small fires that may have broader impacts. This sensor has a high spatial and temporal resolution of 375 m. These improved features of the VIIRS active fire products have reopened the possibility of directly mapping burnt areas using the active fire products [52,57]. Despite the great applicability of VIIRS active fire products, there is still a lack of studies to test bushfire monitoring. Further, an innovation in the estimation of forest fires perimeters is the introduction of the aggregated distance of MODIS and VIIRS active fires to assess the impact on the burnt area’s estimation. These have been utilized in the current study for VIC bushfire mapping and monitoring.
Coordination and communication are vital for any disaster response plan to execute all disaster management phases, i.e., preparedness, response, recovery, and reconstruction. Monitoring the impacts of the natural disaster are performed by space and airborne sensors equipped with optical instruments. UAVs have gained popularity for possible usage in disaster relief operations recently [58]. It provides opportunities for disaster monitoring and mitigation. However, several challenges limit the application of UAVs, such as extreme weather events and objects that hinder its path and hidden routes due to smokes and lower visibility due to bushfires. Therefore, the UAV network must be enhanced, and path planning carried out to ensure that the UAVs can locate the disaster locations and carry out the assigned mission in the least amount of time. UAVs can bring substantial advances in disaster management [59]. For example, UAVs can be equipped with various types of sensors for monitoring various aspects of the affected area. UAVs can fly under the clouds based on their lower altitude, which usually hinders satellite-based images; thus, UAVs obtain a higher quality of images [60]. They can be easily deployed on various sites and locations where human access is limited, restricted, or dangerous. UAVs assist exploration teams in finding paths to reach the stranded people or victims and finding their way back to a secure place in case of bushfires. UAVs help generate instant maps of the areas, as existing maps may not be useful due to changes in the regions’ landscape because of bushfires. These maps are very useful in speeding up the relief effort. UAVs with 3D cameras can fly over the area to capture high-resolution images and autonomously generate high-resolution maps.
The post-disaster response, relief, and recovery processes have been investigated in recent research studies related to operations research and disaster management [61,62,63,64]. The associated problems involve distributing aid among the affected people, resource allocations, and the UAVs routing to instigate a swift disaster response. Resource allocation and vehicle routing have been of significant interest to researchers when dealing with such a problem. Rodriguez-Oreggia et al. [64] presented a model based on transporting various relief goods to disaster victims. The properties of various routing problems for humanitarian relief and rehabilitation have also been reviewed [62]. Similarly, the logistic methods to plan the relief of the people affected by a disaster have also been examined by Özdamar and Ertem [63]. Anaya-Arenas et al. [61] suggested providing an appropriate response to a disaster by meeting the victims’ needs through proper need assessment. The methods to be followed to evaluate the needs depend on the nature and severity of a disaster and how this event evolves with time [64]. The needs assessment process begins rapidly as soon as a disaster occurs and is finished within a few days. This need assessment is not carried out to do a comprehensive survey about the requirements of victims. Instead, it is done to understand how a disaster impacts society, determine what difference has been made to the people’s living conditions, and identify the scope and magnitude of the response [63]. The assessment teams authorized with the need assessment task are assigned sub-areas in a site affected by a disaster to conduct a rapid assessment of relief needs in the area. These teams visit all the specified locations periodically to assess the needs during the disaster relief phase. This detailed analysis is conducted to learn about people’s conditions and know whether adequate aid has reached the victims [64]. A successful disaster response strategy is composed of both rapid and detailed needs assessment and response planning. Accordingly, advanced tools such as UAVs can be used for addressing these issues swiftly.
There is a lack of investigation related to the applications of the techniques mentioned above and tools at global and regional scales. Accordingly, this study is an original and novel effort at mapping the VIC bushfire hotspots. It emphasizes the identification of bush fire hotspots through GIS and remote sensing. It suggests mitigation measures to limit the hazards and adverse consequences of the fires using a UAV swarm. The purpose of this study is to provide an early fire warning system to the local communities and the relevant authorities, informing them of the approaching risk of bushfires and a mitigation mechanism based on UAV swarm to address bushfires disasters as soon as they arise. Prior information and early warning system are proposed to take necessary measures before the hazard occurs. By incorporating the potential hazard response measures, the early warning system could be highly beneficial in the decision-making during the post-bushfires disaster management phase. It will reduce the potentially devastating impacts on the economy, environment, and other pillars of sustainability. Similarly, the UAV swarms can assist with rapid response to bushfire disasters. A case study of the VIC region in Australia is used to visualize the proposed UAV swarm model.
The rest of the paper is organized as follows. Section 2 discusses the method adopted in this study, explains the study’s flow, tools, and algorithms used with pertinent assumptions, and presents UAV swarms concepts. Section 3 offers and discusses the results of the study. Finally, Section 4 concludes the study where the study’s key takeaways are given, its limitation stated, and future directions discussed.

2. Materials and Methods

Figure 2 presents the methodology adopted in the current study. It shows the workflow, comprising mapping the burned area using the satellite active fire products, monitoring the bushfire hotspots, and the spatial correlation of these fire sites. The bushfire data collection is carried out by mapping, clustering, and hotspot detection using the ArcGIS tool. The area is mapped based on the spatial point at varying distances to access the damage caused. The clustering and hotspot detection is conducted using Getis-Ord General G analysis to estimate the clustering pattern and bushfire impact on the affected region. The effect on the community, infrastructure, and surrounding environment is also taken into consideration. After gathering the preliminary information, the UAVs are assigned to the disaster location. For this purpose, PSO is used to maximize the area coverage, minimize the distance to the target, and reduce the number of UAVs allocated to enhance disaster response plans. Establishing a UAV path planning method is essential for finding an optimal path between source and target to reduce the time, which is crucial when dealing with emergencies. In this study, five different algorithms, i.e., greedy, inter-route, intra-route, tabu, and PSO, are used to find the optimal route. Obtained results are compared with PSO to finalize the shortest and safest route to the location.

2.1. Data Collection and Sources

The administrative boundary for the State of VIC is acquired from the Diva-GIS website. The study period is from 1 December 2019 to 31 January 2020. These months are selected to capture the impacts of the devastating fires experienced by the case study area at this time. The study utilizes a collection of six MODIS active fire (MOD14A2), VIIRS, and six fire products from the Fire Information for Resources Management System (FIRMS). Burnt area product (MCD64A1) is used as a mask to map the case study bushfires. The details of the datasets are summarized in Table 3. A total of 122,658 fire events have been identified and used in the current study for mapping the fire zones. This consists of 17,179 fire events identified with the MODIS fire product and 105,479 events identified through the VIIRS sensor over the 2019–2020 fire season.

2.1.1. Burnt Area Mapping

The interpolated perimeters from the monthly accumulated fire points are generated using a convex hull aggregation with the ‘aggregate points’ tool in ArcGIS. The convex hull algorithm assigns an area including the clusters of points (minimum 3) at user-defined aggregation distance. Four aggregation distances, 750, 1000, 1125, and 1500 m, are tested for the current study’s fire delineation. These distances are chosen depending on the active fire spatial resolution from VIIRS and MODIS, i.e., 375 m and 1000 m, respectively. The minimum aggregation distance is two VIIRS pixels that are responsible for possible geolocation. The validation of the fire samples is performed using visual interpretation from Google Earth imagery.

2.1.2. Spatial Autocorrelation

Spatial autocorrelation is based on Tobler’s first law of geography: everything is related to everything else, but near things are more connected than distant things. Thus, spatial correlation is the correlation of any single event with itself through space. The spatial autocorrelation (Global Moran’s I) tool is run to identify the patterns and trends in the bushfire events, i.e., whether these disaster events show a random, dispersed, or clustered pattern. The tool compares the mean of the target feature and the mean for all features to each neighbor’s mean and the mean of total features. The Moran’s I statistic for spatial autocorrelation is calculated using Equations (1)–(5).
I   = n i = 1 n · j = 1 n w i , j z i z j   S 0   i = 1   n z i 2  
where zi is the deviation of an attribute for feature I from its mean (xi x ¯ ), wi,j is the spatial weight between features i and j, n is equal to the total number of features, and S0 is the aggregate of all the spatial wights.
S 0 = i = 1 n j = 1 n w i , j  
The zi-score for the statistic is calculated as:
z I = I E ( I ) V ( I )  
E (I) = −1/(n − 1)
V (I) = E [I2] − (E [I])2
where E (I) is the expected value, n is the number of samples, and V (I) is the variance.

2.1.3. Monitoring of Hotspots Using Getis-Ord Gi* Statistics

After assessing the spatial correlation, the hotspot analysis based on Getis-Ord local Gi* spatial statistics is performed to see if the fire pixels are statistically significant. Before the incremental spatial autocorrelation, the tool is operated, beginning distance and distance increment are required to be set. Calculate Distance Band from the Neighbor Count tool is used to monitor these parameters. The tool gives the minimum, average, and maximum distance at which each point has at least one neighbor. The resultant maximum distance is used as the beginning distance, whereas the average distance achieved from the tool is used as the distance increment. Later, the incremental spatial autocorrelation tool is used to measure data grouping in space at an increasing distance. The tool gives an output in the form of a graph of increasing distances and their corresponding z-score. The clustering distance is later used in the Getis-Ord Gi* analysis as a distance band or radius. The Getis-Ord local statistic is calculated using Equations (6)–(8).
Gi * = j = 1 n w i j · x j x ¯ j = 1 n w i j S [ n j = 1 n w i 2 · j j = 1 n w i j ] 2 ] n 1   2
x ¯ = j = 1 n x j n
S = n j = 1 n x j 2 ( x ¯ ) 2 2
where xj is the attribute value for feature j, wi,j is the spatial weight between the feature i and j, and n is the number of features. x ¯ is the mean, and S is the standard deviation of all measurements. The G* is a zone, after which no more calculations are required. The Gi* statistic returned for the features in the fire datasets is a z-score. For the z-scores to be statistically significant, the higher the z-score value, the more intense the cluster will be, thus depicting a hot spot. Consequently, the cluster will have low values for statistically strong negative values, identifying it as a cold spot. Therefore, the spots can be classified into hotspots or cold spots for assessing the fires.

2.2. Bushfire Management Using UAV

Figure 3 and Figure 4 illustrate bushfire detection using UAVs. Figure 3 provides a holistic conceptual setup for detecting fires in the VIC region using UAVs and their control vans or control centers. Accordingly, multiple vans and UAV swarms can be used to cover the entire region. The ignition of bushfires is detected by satellite and field-based sensors. The relevant disaster management control unit is alerted to take necessary remediation action, as shown in Figure 4.
Depending on the area under bushfire, multiple control unit vehicles are sent to the nearest safe place to the disaster location as per Figure 4. This reduces the distance and time that UAVs must travel, thus saving their battery power. It must be kept in mind that these UAVs have limited battery times when planning disaster responses. Most commercially available UAVs have an operation time of 45 min to 2 h. The central control unit must appropriately allocate the task to the UAV, ensuring that maximum coverage can be provided to the impacted area. Any mismanagement of the UAVs by the operator may result in UAV attrition. The response manager finds the shortest distance by applying a UAV routing algorithm to carry out the mission. The UAVs communicate with the central unit and with neighboring UAVs to complete the task in minimum time. The cameras and sensors are attached to the UAVs to capture the image and provide real-time data to the control unit. The gathered information is disseminated to the fire department to conduct relief operations to save people’s lives, animals, reduce property damage, and further spread wildfire.
UAV swarm systems are assigned to different regions affected by bushfires during post-disaster relief operations and can be used for disaster impact analysis, as shown in Figure 5. The monitoring of UAVs is carried out through the control center remotely. UAV communicates with each other based on the designed algorithm and communication from the control center and responds to changing conditions. Each UAV adopts the specific path assigned for maximum area coverage and captures the disaster region’s images. UAV detects and stores individual knowledge and returns it to the control unit or depot, where the knowledge is combined from all the UAVs. This is used to analyze the damage, highlight optimized UAV routes to and from the depot, and map burnt area. The initial assessment by the UAV swarm will give the direction for the disaster response planning. The images will help rescue stranded people find the safest and shortest routes to access the areas for providing relief services. In addition, the survivors can be detected via image analysis, where the rescue team can establish contact with the survivors and perform quick rescue operations. The UAVs have been employed in the United States to provide relief services through enhanced imagery over fire areas [64].

2.3. Problem Formulation and the Proposed Solution

The vehicle routing problem (VRP) model is composed of a set of vehicles that are to be used to carry out relief operations. Each vehicle has a specific capacity, representing the amount or volume of relief goods it can carry. In this problem, all vehicles (UAVs) have the same capacity. Hence these vehicles are referred to as homogenous vehicles. The disaster locations to be visited by these UAVs are called nodes, while the paths followed to reach these nodes are known as edges. These edges connect two nodes. A set of these nodes and edges make up a directed graph. In the current study, the node represents a disaster area that must be visited so that aid and recovery items could be delivered there [65]. A single depot serves as the disaster relief station, from where these UAVs are dispatched, as shown in Figure 6.
Each UAV has a limited capacity to carry the relief items, which must be delivered to the victims present at these nodes. In terms of the directed graph, each node is called the vertex. The victims to be visited are denoted by 1, 2, 3, …, m, which belongs to set C. As each route starts and begins on the same depot, the graph’s total number of vertices is |C| + 2, where the depot is represented by nodes 0 and m + 1. The vertices in the graph are denoted by 0, 1, 2, 3, …, m + 1. The edges in this graph connect depot to the victims or the victims to each other. Each edge originates from the depot node 0, and each route terminates at the depot node m + 1. A cost value is associated with each edge connecting two customers, r and s. Each vehicle has a limited capacity, and each customer has a demand regarding relief. All these notations and terminologies are defined in Table 4.
The following variables are used to model the UAV routing problem with time windows:
x r s t { 1   i f   v e h i c l e   t   v i s i t s   a   v i c t i m   r   a f t e r   v i c t i m   s   0   o t h e r w i s e
The major goals of the UAV routing problem with the time windows model are outlined below:
  • Formulate a set of routes with minimum costs.
  • Each vehicle will have one route assigned to it.
  • Each victim will be visited once only.
  • Each route starts at node 0 and terminates at node m + 1.
Based on these goals, the objective function and constraints for the system are shown in Equations (9)–(17):
m i n t V r N s N c r s x r s t  
t V r N x r s t = 1     r C  
r C d r s N x r s t q   t V  
s N x 0 s t = 1   t V  
r N x r i t s N x i s t = 0     i C ,   t V
r N x r m + 1 t = 1   t V  
x r s t { 0 , 1 } ,     r , s   N ,     t   V  
s t a r t D v o p e n D     v V  
e n d D v c l o s e D     v V  
As presented in Equation (9), the objective function ensures that the total distance/costs are minimized. The constraint given in Equation (10) ensures that each victim is visited only once. According to the constraint in Equation (11), the load carried by each vehicle should not exceed its capacity. The constraints provided in Equations (12)–(14) ensure that each UAV starts the journey by leaving the depot node 0. On reaching a victim’s location and completing its task, the UAV leaves the victim again. Finally, the UAV arrives at the depot node m + 1. The constraint in Equation (15) is the integrality constraint that models the discrete nature of the decision. The constraint in Equation (16) ensures that UAV’s starting time is greater than the depot’s opening time. As given in Equation (17), the last constraint ensures that the vehicle completes its mission within the depot’s closing time. The pseudocode and associated solution approach based on tabu-search and nearest node rules is presented in Figure 7.
Figure 8 illustrates the UAV’s routing solution algorithm. In this illustration, the algorithm begins from step 1, where an initial solution InitSol is developed, comprising a set of routes (Route1, Route2, Route3). Each route consists of a set of nodes that are to be traversed by the UAV. The initial solution is determined using the nearest neighbor rule, which aims at arriving at an optimal solution. The algorithm first considers a potential solution in the nearest neighbor approach and checks the solution sets identical to it to find a better one. When an initial solution is determined, the algorithms move to step 2, where the initial solution’s fitness f is calculated. This value is determined by taking a sum of the total distance d and demand or quantity q of the aid goods that are to be carried by the UAV. After calculating the fitness of the InitSol, the algorithm reaches step 3, where the best solution (BestSol) is initialized as the initial solution. The system then enters a loop consisting of 11,000 iterations containing steps 4, 5, and 6. At step 4, a random solution (RandSol) is generated using the same nearest neighbor rule. The fitness of this solution is then determined in step 5. At step 6, the value of RandSol is compared against BestSol. If the random solution is better than the best solution in terms of fitness, the random solution is the best solution. Otherwise, BestSol remains unchanged. This process is carried out iteratively until the most optimal routes are achieved in the best solution.
The goal is to determine the optimal routes for the UAV swarm that start their journey from the depot. To select an approximation of the optimal solution, heuristic approaches are used. Here, it is crucial to compare the proposed tabu search method results with other state-of-the-art optimization approaches. Accordingly, the key tests are performed using five algorithms. In the first test, the PSO algorithm is run. PSO is a heuristic method that starts its search process using an initial population of particles. Each particle represents a potential solution to the problem. There is a multi-dimensional search space where these particles move around until they reach a constant state or the computational constraints are fully exhausted. PSO mimics the behavior of birds in a flock or sheep in a herd. It is based on a collection of particles in a swarm where each particle represents a possible solution to the problem. Figure 9 outlines the procedure for the source location on the PSO algorithm. In the second test, the tabu search algorithm is initiated in conjunction with the nearest neighbor-based model to solve UAV routing in the post-disaster scenario.
The best solution is obtained in this method and checked in each iteration until the most optimal one is reached. In the third test, a greedy search-based solution is explored to select a solution in each iteration. This selection is based on which solution seems best at present, without considering whether it will make sense in the next iterations. In test 4, an intra-route heuristic algorithm is applied. According to this strategy, two edges from a route are removed, and another two edges are added to make a connected route. Using this heuristic, an affectee can be assigned a new position in the same route. Finally, an inter route method is applied in the last test to reduce the UAVs used in the solution. The idea is to choose two edges from two distinct routes and exchange their end portions to generate two new routes. Using this scheme, an affectee can be assigned a new position in all routes.
As shown in Figure 9, the PSO algorithm is initialized randomly depending on the source position and particle (UAV) velocity. The particles update their velocity and position throughout the optimization process. The initial population is evaluated based on the objective function and fitness value. The particle with optimum fitness values is selected, and the position and velocity are updated accordingly. The updated population is re-evaluated for its fitness, and if necessary, coordinates are updated. If the output conditions, i.e., source coordinates and velocity, are satisfied, then the optimization process is completed; otherwise, the process is repeated. The output of the optimization process is the obtained best solution for the PSO parameters.

3. Results and Discussion

3.1. Burned Area Mapping Using the Active Fire Products

As explained in the method, the first mapping of the burnt area is performed using the ArcGIS tool. The aggregated fire events from the MOD14 fire products for the distances of 375, 1000, 1125, and 1500 m are shown in Figure 10a–d. Similarly, for VIIRS, Figure 11a–d presents the aggregated fire events for the distances of 375, 1000, 1125, and 1500 m. Notably, aggregated MODIS and VIIRS samples illustrated an excellent efficiency for detecting some small active fire clusters missing in the burned mask layer. Among these products, VIIRS perimeters showed better identification of the fire sites, depending on the 350 m resolution data. This is due to thermal bands of active fires’ capability to detect fine pixels of small fires that can not be captured by the course reflectance burnt area band. Precisely, the aggregates of 1500 m are the most accurate visual depiction of the burnt area (along the coastal region including Sale, Orbost, Genoa, Bairnsdale, and NSW’s border Wodonga, Bombala, and Eden) due to the 2020 bushfires. The bushfires’ spatial pattern also showed that the fires are propagating outwards from the coast and NSW regions.
The current study shows that active fire products have an immense potential for evaluating large fire perimeters. Previous studies focused on individual fires at local scales [52]; the current study, on the other hand, has a much broader scale where the burnt area in the state of VIC is focused and estimated. The emphasis is to assess fire products’ applicability to delineate the regions burnt in an almost near-real time frame to establish a sophisticated early warning system. The available sensors and products provide the burned area products; however, the results are accessible one month after the hazard. This issue can be tackled with the usage of fire products. Thus, the fire products are incredibly useful in approximating the widespread progression in near-real-time extents and geolocation. This method can be used on a wide scale to help monitor and recover management through early disaster detection and assessment. These early estimates can facilitate operational near-real-time fire management planning and decision making. The method adopted for this study can successfully be used to delineate the burnt area both for the individual and collective fires. Moreover, such interpolated aggregates can open ways for the researchers to initialize and calibrate the fire propagation models to help real-time operational decisions.
Geographically Weighted Regression (GWR) is a spatial regression technique used in geography and other disciplines. It evaluates a local model of the variable or process under consideration or predicts the outcomes by fitting a regression equation to every feature in the dataset. The GWR statistics for the current study are presented in Table 5. Table 5 summarizes the local model of the fire events in VIC, intending to understand and predict the fire events by fitting a regression equation to each feature in the respective datasets. The corrected Akaike Information Criterion (AICc) measures the model performances and its facilitation for comparing varying models. Accordingly, the lower AICc value reflects better model performance and vice versa. In the current study, the active fire product aggregates show negative values, depicting the model’s better performance. R2 is a measure of goodness of fit whose values can range from 0 to 1, with higher values as preferable. For all the aggregates, the R2 values are between 0.91–0.99, indicating the method is fit to use. Finally, the R2 adjusted values are used to normalize the numerator and denominator by the degrees of freedom. The adjusted R2 is almost always lesser than the R2, as shown in Table 5. However, it is also expected to lose some interpretation when the adjustments are made. Therefore, AICc is the preferred way of comparing the models. The statistics in the current study context signify that the estimates using the aggregates method can be adapted for medium to large-scale studies. Although there is a slight chance of omission and commission errors in some small fire events delineation, the method can map the burnt regions in the broader and more impactful sense of the application. Conversely, in some instances, some minor fires are also detected in the processing, which is omitted in MODIS burn mask. Although some smaller fires may be detectable with the aggregates, it is preferred to use the fine higher-resolution imagery for refined results.

3.2. Spatial Autocorrelation

To know about the distributions of the bushfire events in VIC, spatial autocorrelation is performed. This highlights if the fire events are clustered at a particular point or otherwise randomly scattered. Figure 12 shows the statistical significance of the observed fire locations.
The results show the z-score as −0.08 and the p-value to be 0.93. As previously discussed, for the z-scores to be statistically significant, the higher the z-score value, the more intense the cluster will be. This means that the fire events are randomly scattered throughout VIC. The associated Moran’s Index value is −0.004. The geostatistics results indicate that the fire events show a random distribution along the state of VIC. This spatial autocorrelation method, i.e., the Global Moran’s I, is an inferential statistic based on the probability theory. In this case, the probability is a measure of chance. The underlying statistical patterns (either directly or indirectly) are probability calculation, which assesses the likelihood of a fire event occurrence in a specific location. This suggests that although the data values in these fire databases are fixed, the spatial occurrences and arrangement of bushfires within VIC state vary.

3.3. Mapping the Bushfire Hotspots

A strong z-value index in the current study depicts the statistical significance of the hotspots. The values are varying from 0.03 to 2.9. The map showing the clusters of weak to strong hotspots for VIC fires is given in Figure 13, where the Getis-Ord Gi* output is provided. Figure 13a presents the output in the form of a Gi Z Score map highlighting the hot spots and cold spots within VIC. The polygons show the hotspots and cold spots.
The features with high values are shown in red, classifying them as the hot spot that progressively lowers down towards the relatively cold spots with blueish colors. The z-score determines whether the pattern within the data is random or statistically significant clustering is prevalent. Hence, the values are higher for the statistically significant positive z-score, and the cluster is intense to depict the hotspot. The location of all the hotspots and cold spots is within the southeastern areas of the VIC. The visual identification of the clusters of fires is made using Google Earth. All the bushfires clusters included the zones of Snowy River National Park, Cape Conran Coastal Park, Mount Elizebath NCR, Coopracambra National Park, Burrow-Pine Mountain National Park, Mount Buffalo National Park, Alpine National Park, and Martin’s Creek.
Additional spatial directional analysis of the 2019–2020 VIC bushfires is shown in Figure 13b. The deadly fire smoke traveled to NSW, and its impacts were observed in the other regions. The spatial distribution shows the directional propagation of the fires. The widespread radius of the impact of the fire indicates that these Australian bushfires have a global impact [2]. Hence, it boils down to the climate change phenomenon. Australia’s previous climatic records showed that the country is continuously experiencing hotter temperatures with each progressing year since 1910. The all-time maximum temperature record was broken in December 2019 [13]. The average maximum temperature of 41.9 °C on 18 December 2019 is the highest for any day of December in Australia. This is interesting for climatologists since a climatic phenomenon is responsible for the extreme heatwave: Indian Ocean Dipole (IOD). The IOD is an event in which ocean surface temperatures are hotter on the ocean’s western side and colder on the east. Due to this phenomenon, Australia is expected to have prevalent intense weather and higher fire risks p in the upcoming years. Therefore, preparedness and management must be taken religiously to gear up before the next bushfire season.
Inverse distance weighted (IDW) is applied to the Gi* statistics tool’s hotspot map. This interpolation method is widely used to map the hotspots’ spatial extent produced in the previous step. IDW determines cell values using a linearly weighted combination of a set of sample points. The weight is a function of inverse distance. The surface being interpolated should be that of a locationally dependent variable. IDW smoothens the continuous surface of hotspots, as shown in Figure 14a. The very high (Red) areas show that these areas are incredibly prone to bushfire and require the concerned authorities’ attention. The very low zones shown in blue depict the statistically significant pattern of negative z-score. These areas are free from fire danger; however, the high, moderate, or low-prone areas all require individual attention due to the area’s underlying properties.
The final hotspots map of VIC is depicted in Figure 14b. The map’s highlighted areas include the southwest region, including the Portland, Homerton, Killara, Greenwald, and the western areas, including Dergholm, Kadnook, and Goroke. Most of the hotspots lie towards the coastal and southeastern border region towards NSW, a bushfire-prone area. The areas covered are the national parks along Bairnsdale and Bright. The fire hotspots are mostly seen along the VIC border, indicating it had spread outwards onto the NSW. Identifying hotspots is primarily important for the response and recovery systems to plan and devise a proper response plan [23,40]. As the public is informed before these risks occur, they can evacuate or move to securer places, as suggested by the government. Since the stakes are high in bushfire incidents, the preparedness and response should be timely. In case of serious risk of bushfires’ onset, the concerned authorities can generate a warning system and instruct everyone to evacuate. However, this is easier said than done. As Whittaker et al. (2020) discussed, sometimes, people do not take the warnings seriously. Instead, they feel threatened to obey the authorities, and several others intend to keep their properties and possessions safe. Therefore, to ensure that the warnings are fully understood, the government must clarify three things: firstly, people are supposed to leave before the catastrophic fire starts. Secondly, houses are not defended in catastrophe, and the earlier they leave, the better response can be planned by authorities.

3.4. UAV Route Optimization Results and Discussions

Table 6 shows the results generated after running the five algorithms to solve the UAV routing problem. A scenario was considered where there is a fleet of 10 homogenous UAVs at the disaster relief camp. Each UAV has the capacity of capturing, storing, and transmitting 50 images of the disaster region and some capacity of delivering first aid kits to the affectees. Initially, the number of affectees is 20, where each affectee is randomly located on the map. Each node contains one affectee only. The input parameter, which is the number of affectees to be visited by the UAV, is then changed to determine the nature of output under varying conditions. Other parameters such as UAV capacity and the number of UAVs are kept constant, as in real-world scenarios [65].
These factors are predetermined and mostly do not change during disaster relief missions. The results show that by increasing the number of affectees to be visited, more UAVs are consumed, and consequently, more cost is incurred. As depicted in Table 6, only three vehicles are utilized by the algorithms when the number of affectees is 20, which changes linearly with increasing the number of affectees. All ten vehicles are utilized when the number of affectees is increased to 70. Increasing the number of affectees to 80, the algorithms fail to solve VRP, which shows that ideally, the need of up to 70 affectees can be attended by 10 UAV, each having a capacity of 50 units. Using the five methods applied to the problem scenario, the results achieved show that the least-cost solution is attained using the tabu search algorithm, while the greedy search delivered the highest-cost solution.
Other approaches like intra and inter routing also delivered better results than greedy search. However, the results of the PSO search surpassed all the tested methods. This demonstrates the PSO routing scheme’s success over other standard optimization methods like greedy search, inter, intra, and tabu search routing search heuristics. Table 6 also shows the time taken by each algorithm to reach the optimal solutions. According to the results, a greedy search solution was generated at the highest time, while the PSO-based method took less time than the tabu search to prepare the solution in all successful test runs. Also, both inter and intra route search heuristics took less time than these two methods. After generating results for 50 units for ten homogenous UAVs, the UAV capacity was increased to 100 units to view the results. As shown in Table 6, a significant reduction in the number of vehicles utilized for the same number of affectees is observed. The algorithms showed the same patterns in terms of run time and cost in that the PSO algorithm yielded the least cost among all the algorithms and took less run time than the greedy search. Another significant observation is that the cost is also reduced when the UAV capacity is increased.
Figure 15a–e shows the directed graphs generated by the greedy search, inter route, intra route, tabu search, and PSO, respectively, for a scenario where the number of vehicles is 10, the capacity is 50 and the number of affectees to be visited is 30. Figure 15 clearly illustrates that there are no crossing edges for PSO and tabu search, and the routes generated are the clearest and discrete. The software simulation for a UAV is illustrated in Figure 15e using the PSO algorithm. The number of UAVs and their capacity is configured to be 15 and 10, respectively, along the equalized axis. The green marks depict the number of UAVs, and the red squared spot at the center shows the depot, from where the UAV will take off and land.
Based on the results demonstrated in Table 7, the percentage of improvements yielded by PSO over each of the tested algorithms has been calculated. The average improvement shown by the PSO algorithm over the greedy search-based method is approximately 2% concerning the reduction in cost and 2% reduction in run time. PSO yielded 1.5% fewer costs than the inter-route scheme. However, no reduction in run time was recorded as compared to the run time of inter-route. PSO showed a 1.2% improvement in costs than the intra routing algorithm and a 1% reduction in run time. The percentage improvement values demonstrated by each algorithm over the PSO-based approach have been summarized in Table 7.
The solution for the runtime and cost obtained by the PSO method was statistically significant, as shown in Table 8. It demonstrated optimum solution for runtime over tabu search (p = 0.01, R2 = 0.81), greedy search (p = 0.0008, R2 = 0.95), intra routing (p = 0.031, R2 = 0.67) and inter-routing (p = 0.02, R2 = 0.76). A maximum percentage reduction in cost over PSO was observed for the greedy search (p = 0.005, R2= 0.85), while the minimum was observed for the tabu search (p= 0.001, R2 = 0.67). The p values show that all results are statistically significant.
The statistical results show that the R2 values are significant for all the aggregates, indicating the methods are fit to use. The spatial correlation results show that the fire events are randomly scattered throughout VIC. The global Moran’s I suggest that although the data values in these fire databases are fixed, the spatial occurrences and arrangement of bushfires within the state of VIC can vary. A healthy z-value index depicts the statistical significance of the hotspots from 0.03 to 2.9. All the bushfires’ clusters included the zones of Snowy River National Park, Cape Conran Coastal Park, Mount Elizebath NCR, Coopracambra National Park, Burrow-Pine Mountain National Park, Mount Buffalo National Park, Alpine National Park, and Martin’s Creek. Most of the hotspots lie towards the coastal and southeastern border region towards NSW, a bushfire-prone area. The areas covered are the national parks along Bairnsdale and Bright. The fire hotspots are predominantly seen along the VIC border, indicating it had spread outwards onto the NSW. Additional spatial directional analysis of the 2019–2020 VIC bushfires shows a widespread radius of the fires that boils down to the climate change and IOD phenomenon [23,24]. Based on the current study results, it can be concluded that the active fire products have an immense potential for the evaluation of large fire perimeters. This method can be used on a broad scale to help monitor disaster regions and instigate property response plans through early disaster detection and assessment. Both individual and collective fires can be delineated using the proposed method. Moreover, such interpolated aggregates can open ways for researchers to initialize and calibrate the fire propagation models to help real-time operational decisions.

4. Conclusions

Against the backdrop of a national bushfire crisis, the 2019–2020 fire season in VIC was the most important test of the reformed emergency management arrangements after the disastrous 2009 VIC bushfires. Finding the right balance in maintaining a readiness level to respond to bushfires in VIC is a complex calculation. The required resources in terms of personnel, vehicles, equipment, and UAVs need to be scalable according to seasonal requirements and cannot readily be switched on and off if conditions alter rapidly. In VIC, there are significant standing resources spread across the responder agencies. Every year, the fire season wreaks havoc in VIC’s state. It damages the environment and the biodiversity and sustenance of life around the huge smoke and fire. The current study assessed the aggregation of active fire products of VIIRS and MODIS for monitoring the burnt areas within the state of VIC. The aggregates showed high efficiency in the identification of the burned areas. The burnt area generated the same output regions as referenced in the burn mask product. The study found that the aggregate of 1500 m produced the best output to estimate the burnt areas in VIC. MODIS-based MOD14 is used to generate high-grade fire products to identify thermal anomalies, fires, and volcanoes. The data tracks are almost 2030 km from the point of origin. In case of a bigger distance, the algorithm will shift towards a low quality of fire-mask, assurance, power, and the fire pixels will likely be negatively affected. Secondly, the spatial autocorrelation results showed that the fire events were distributed randomly and had no specific spatial distribution pattern. The hotspots identified are mainly found along the eastern belt of the state and were progressing north, which was the same location where the fires happened. The directional distribution showed the fire had spread across the border towards NSW. Hence, Getis Ord Gi* hotspot analysis was extremely advantageous in rapid preparation in the fire events.
Using the five methods applied to the problem scenario, the UAV path optimization results show that the PSO search results surpassed all the tested methods. This demonstrates PSO’s success over other standard optimization methods like greedy search, inter, intra, and tabu search routing search heuristics. Further, this algorithm yields the least cost among all the algorithms and takes lesser time. The cost can also be reduced by increasing the capacity of the UAVs. Further, there are no crossing edges in the PSO and tabu search, and the routes generated are the clearest and discrete, thus reducing the chances of UAV collisions. The average improvement demonstrated by the PSO algorithm over the greedy search-based method is approximately 2% concerning the reduction in cost and 2% reduction in run time. Similarly, in comparison with others, PSO yielded 1.5% fewer costs than the inter-routing scheme and showed a 1.2% improvement in costs than the intra routing algorithm and a 1% reduction in run time.
The methodology adopted in the current study can be used to study other fire events, whether individual or collective, to readily study the specific study area’s fire behavior. The methodology adopted in this study can provide a near-real-time indication of the damaged and affected areas. This may prove valuable for countries with recurrent fire seasons like Australia. It also suggests that although the datasets may not be statistically significant, they can have a lasting spatial impact. Therefore, timely warning and response management must be taken seriously to avoid any bigger damages. A possible limitation in the aggregation algorithm from active fire data may arise due to overestimating the artifacts achieved in some regions. Moreover, owing to the bulk of data provided in the dataset, there is a chance of omission and commission errors. Hence, validation through reliable field data or high-resolution imagery is preferred. Therefore, the UAV obtained imagery can tackle this issue and provide a holistic two-way system where high-quality real-time images can be remotely sensed and cross-checked with UAV acquired imagery to stage a proper response plan. UAVs’ usage to assist in real-time bushfire assessments and mitigation planning is a humble addition of the current study to the body of knowledge and practice. Using the proposed PSO-based UAV system, Australia’s concerning disaster management authorities can plan for, timely assess, and mitigate the emerging bushfires to reduce their harmful and damaging effects.
It is recommended for future studies to address and quantify the potential of small fire detection against fine resolution imagery. The algorithms utilized in the current study can be supplemented through additional scholarly works and coding to enable the UAVs to demarcate an evacuation route for the bushfire victims that can be shared with the fire and disaster management departments. Further, the proposed system can be applied to various phenomena such as human activity patterns, climatic and phenological features, in addition to fire data for more detailed and refined estimation of the fire burned areas. The study can be further enhanced by evaluating other social and natural causes to map the risk of fires in the study area. Moreover, these processed geographic layers can also be run in real-time using Web Mapping Service.

Author Contributions

Conceptualization, H.S.M. and F.U.; methodology, H.S.M., F.U., S.I.K., Z.Q. and S.Q.; software, H.S.M., F.U., S.I.K., Z.Q. and S.Q.; validation, H.S.M. and F.U.; formal analysis, H.S.M. and F.U.; investigation, H.S.M. and F.U.; resources, F.U. and H.S.M.; data curation, H.S.M. and F.U.; writing—original draft preparation, H.S.M. and F.U.; writing, H.S.M., F.U., S.I.K., Z.Q. and S.Q.; visualization, H.S.M. and F.U.; supervision, F.U. and H.S.M.; project administration, F.U. and H.S.M.; funding acquisition, F.U. All authors have read and agreed to the published version of the manuscript.

Funding

This research received no external funding.

Institutional Review Board Statement

Not applicable.

Informed Consent Statement

Not applicable.

Data Availability Statement

Data is available with the first author and can be shared with anyone upon reasonable request.

Conflicts of Interest

The authors declare no conflict of interest.

References

  1. Read, P.; Denniss, R. With costs approaching $100 billion, the fires are Australia’s costliest natural disaster. The Conversation, 17 January 2020. [Google Scholar]
  2. Whittaker, J.; Taylor, M.; Bearman, C. Why don’t bushfire warnings work as intended? Responses to official warnings during bushfires in New South Wales, Australia. Int. J. Disaster Risk Reduct. 2020, 45, 101476. [Google Scholar] [CrossRef]
  3. Ullah, F.; Sepasgozar, S.M.; Wang, C. A systematic review of smart real estate technology: Drivers of and barriers to, the use of digital disruptive technologies and online platforms. Sustainability 2018, 10, 3142. [Google Scholar] [CrossRef] [Green Version]
  4. Munawar, H.S.; Qayyum, S.; Ullah, F.; Sepasgozar, S. Big data and its applications in smart real estate and the disaster management life cycle: A systematic analysis. Big Data Cogn. Comput. 2020, 4, 4. [Google Scholar] [CrossRef] [Green Version]
  5. Ullah, F.; Sepasgozar, P.S.; Ali, T.H. Real estate stakeholders technology acceptance model (RESTAM): User-focused big9 disruptive technologies for smart real estate management. In Proceedings of the 2nd International Conference on Sustainable Development in Civil Engineering (ICSDC 2019); Jamshoro, Pakistan, 5–7 December 2019.
  6. Felli, F.; Liu, C.; Ullah, F.; Sepasgozar, S. Implementation of 360 videos and mobile laser measurement technologies for immersive visualisation of real estate & properties. In Proceedings of the 42nd AUBEA Conference, 26–28 September 2018. [Google Scholar]
  7. Munawar, H.S.; Hammad, A.; Ullah, F.; Ali, T.H. After the flood: A novel application of image processing and machine learning for post-flood disaster management. In Proceedings of the 2nd International Conference on Sustainable Development in Civil Engineering (ICSDC 2019), Jamshoro, Pakistan, 5–7 December 2019. [Google Scholar]
  8. Munawar, H.S.; Zhang, J.; Li, H.; Mo, D.; Chang, L. Mining multispectral aerial images for automatic detection of strategic bridge locations for disaster relief missions. In Pacific-Asia Conference on Knowledge Discovery and Data Mining; Springer: Berlin, Germany, 2019. [Google Scholar]
  9. Munawar, H.S. Flood disaster management: Risks, technologies and future directions. Mach. Vis. Insp. Syst. Image Process. Concepts Methodol. Appl. 2020, 1, 115–146. [Google Scholar]
  10. Munawar, H.S. Image and video processing for defect detection in key infrastructure. Mach. Vis. Insp. Syst. Image Process. Concepts Methodol. Appl. 2020, 1, 159–177. [Google Scholar]
  11. North, M.; Stephens, S.; Collins, B.; Agee, J.; Aplet, G.; Franklin, J.; Fule, P.Z. Reform forest fire management. Science 2015, 349, 1280–1281. [Google Scholar] [CrossRef] [PubMed]
  12. EMDAT. Natural Disasters 2019: Now is the Time to Not Give Up; School of Public Health, Université catholique de Louvain; EMDAT, Ed.; Centre for Research on the Epidemiology of Disasters-CRED: Brussels, Belgium, 2020. [Google Scholar]
  13. Coates, L.; Haynes, K.; O’brien, J.; McAneney, J.; De Oliveira, F.D. Exploring 167 years of vulnerability: An examination of extreme heat events in Australia 1844–2010. Environ. Sci. Policy 2014, 42, 33–44. [Google Scholar] [CrossRef] [Green Version]
  14. Crompton, R.P.; McAneney, K.J.; Chen, K.; Pielke, R.A., Jr.; Haynes, K. Influence of location, population, and climate on building damage and fatalities due to Australian bushfire: 1925–2009. Weather Clim. Soc. 2010, 2, 300–310. [Google Scholar] [CrossRef] [Green Version]
  15. Ullah, F.; Sepasgozar, S.M. Key factors influencing purchase or rent decisions in smart real estate investments: A system dynamics approach using online forum thread data. Sustainability 2020, 12, 4382. [Google Scholar] [CrossRef]
  16. Dickman, C.; McDonald, T. Some personal reflections on the present and future of Australia’s fauna in an increasingly fire-prone continent. Ecol. Manag. Restor. 2020, 21, 86–96. [Google Scholar] [CrossRef]
  17. Lucas, C.; Hennessy, K.; Mills, G.; Bathols, J. Bushfire weather in southeast Australia: Recent trends and projected climate change impacts. CSIRO Mar. Atmos. Res. 2007, 1, 1–80. [Google Scholar]
  18. Clarke, H.; Lucas, C.; Smith, P. Changes in Australian fire weather between 1973 and 2010. Int. J. Climatol. 2013, 33, 931–944. [Google Scholar] [CrossRef]
  19. Bureau of Meteorology, Government of Australia. 2013. Available online: http://www.bom.gov.au/ (accessed on 10 January 2021).
  20. Cormack, L.; Bungard, M. RFS Volunteer Charged with Lighting Seven Fires; The Sydney Morning Harold: Sydney, Australia, 2019. [Google Scholar]
  21. Alexander, H.; Moir, N. The Monster’: A Short History of Australia’s Biggest Forest Fire; The Sydney Morning Herald: Sydney, Australia, 2019. [Google Scholar]
  22. Sapwell, G. Cigarette butt to blame for devastating binna burra bushfire. ABC News, 13 November 2019. [Google Scholar]
  23. Shukman, D. Sir David Attenborough Warns of Climate ‘Crisis Moment’. BBC News, 16 January 2020. [Google Scholar]
  24. Gourlay, C.; Leslie, T.; Martino, M.; Spraggon, B. From a Single Lightning Strike to Australia’s Largest Bushfire. ABC News, 24 February 2020. [Google Scholar]
  25. Ilanbey, S. Crews to be pulled from fire zones as heavy rains tipped to lash state. The Age, 19 January 2020. [Google Scholar]
  26. Premier, A.D. Immediate Support For Victoria’s Wildlife And Biodiversity. 23 January 2020. Available online: http://www.lilydambrosio.com.au/wp-content/uploads/2020/01/200123-Immediate-Support-For-Victoria%E2%80%99s-Wildlife-And-Biodiversity.pdf (accessed on 1 June 2021).
  27. AirVisual; Explore the Air Quality Anywhere in the World. Available online: https://www.iqair.com/ (accessed on 18 February 2021).
  28. Arriagada, B.N.; Palmer, A.J.; Bowman, D.M.; Morgan, G.G.; Jalaludin, B.B.; Johnston, F.H. Unprecedented smoke-related health burden associated with the 2019–20 bushfires in eastern Australia. Med J. Aust. 2020, 213, 282–283. [Google Scholar] [CrossRef]
  29. Atif, S.; Umar, M.; Ullah, F. Investigating the flood damages in lower indus basin since 2000: Spatiotemporal analyses of the major flood events. Nat. Hazards 2021, 107, 1–27. [Google Scholar]
  30. Ullah, F.; Al-Turjman, F.; Qayyum, S.; Inam, H.; Imran, M. Advertising through UAVs: Optimized path system for delivering smart real-estate advertisement materials. Int. J. Intell. Syst. 2021, 36, 7. [Google Scholar] [CrossRef]
  31. Qadir, Z.; Ullah, F.; Munawar, H.S.; Al-Turjman, F. Addressing disasters in smart cities through UAVs path planning and 5G communications: A systematic review. Comput. Commun. 2021, 168, 114–135. [Google Scholar] [CrossRef]
  32. Ullah, F.; Qayyum, S.; Thaheem, M.J.; Al-Turjman, F.; Sepasgozar, S.M. Risk management in sustainable smart cities governance: A TOE framework. Technol. Forecast. Soc. Chang. 2021, 167, 120743. [Google Scholar] [CrossRef]
  33. Ezequiel, C.A.F.; Cua, M.; Libatique, N.C.; Tangonan, G.L.; Alampay, R.; Labuguen, R.T.; Favila, C.M.; Honrado, J.L.E.; Canos, V.; Devaney, C. UAV Aerial Imaging Applications for Post-Disaster Assessment, Environmental Management and Infrastructure Development. In Proceedings of the 2014 International Conference on Unmanned Aircraft Systems (ICUAS), Orlando, FL, USA, 27–30 May 2014; IEEE: Piscataway, NJ, USA, 2014. [Google Scholar]
  34. Abatzoglou, J.T.; Williams, A.P. Impact of anthropogenic climate change on wildfire across western US forests. Proc. Natl. Acad. Sci. USA 2016, 113, 11770–11775. [Google Scholar] [CrossRef] [PubMed] [Green Version]
  35. Kuter, N.; Yenilmez, F.; Kuter, S. Forest fire risk mapping by kernel density estimation. Croat. J. For. Eng. J. Theory Appl. For. Eng. 2011, 32, 599–610. [Google Scholar]
  36. Van Hoang, T.; Chou, T.Y.; Fang, Y.M.; Nguyen, N.T.; Nguyen, Q.H.; Canh, P.X.; Toan, D.N.B.; Nguyen, X.L.; Meadows, M.E. Mapping forest fire risk and development of early warning system for NW vietnam using AHP and MCA/GIS methods. Appl. Sci. 2020, 10, 4348. [Google Scholar] [CrossRef]
  37. Sivrikaya, F.; Sağlam, B.; Akay, A.E.; Bozali, N. Evaluation of forest fire risk with GIS. Pol. J. Environ. Stud. 2014, 23, 187–194. [Google Scholar]
  38. Wen, C.; He, B.; Quan, X.; Liu, X.; Liu, X. Wildfire Risk Assessment Using Multi-Source Remote Sense Derived Variables. In Proceedings of the IGARSS 2018–2018 IEEE International Geoscience and Remote Sensing Symposium, Valencia, Spain, 22–27 July 2018; IEEE: Piscataway, NJ, USA, 2018. [Google Scholar]
  39. Teodoro, A.C.; Duarte, L. Forest fire risk maps: A GIS open source application–a case study in Norwest of Portugal. Int. J. Geogr. Inf. Sci. 2013, 27, 699–720. [Google Scholar] [CrossRef]
  40. Johnstone, J.F.; Allen, C.D.; Franklin, J.F.; Frelich, L.E.; Harvey, B.J.; Higuera, P.E.; Mack, M.C.; Meentemeyer, R.K.; Metz, M.R.; Perry, G.L. Changing disturbance regimes, ecological memory and forest resilience. Front. Ecol. Environ. 2016, 14, 369–378. [Google Scholar] [CrossRef]
  41. Jenkins, M.E.; Bedward, M.; Price, O.; Bradstock, R.A. Modelling bushfire fuel hazard using biophysical parameters. Forests 2020, 11, 925. [Google Scholar] [CrossRef]
  42. Ullah, F.; Al-Turjman, F. A conceptual framework for blockchain smart contract adoption to manage real estate deals in smart cities. Neural Comput. Appl. 2021, 33, 1–22. [Google Scholar]
  43. Ullah, F.; Sepasgozar, S.M.; Shirowzhan, S.; Davis, S. Modelling users’ perception of the online real estate platforms in a digitally disruptive environment: An integrated KANO-SISQual approach. Telemat. Inform. 2021, 63, 101660. [Google Scholar] [CrossRef]
  44. Ullah, F.; Sepasgozar, S.M.; Thaheem, M.J.; Al-Turjman, F. Barriers to the digitalisation and innovation of Australian Smart Real Estate: A managerial perspective on the technology non-adoption. Environ. Technol. Innov. 2021, 22, 101527. [Google Scholar] [CrossRef]
  45. Ullah, F.; Sepasgozar, S.M.; Thaheem, M.J.; Wang, C.C.; Imran, M. It’s all about perceptions: A DEMATEL approach to exploring user perceptions of real estate online platforms. Ain Shams Eng. J. 2021, 12, 1–23. [Google Scholar]
  46. van Der Werf, G.R.; Randerson, J.T.; Giglio, L.; van Leeuwen, T.T.; Chen, Y.; Rogers, B.M.; Mu, M.; van Marle, M.J.; Morton, D.C.; Collatz, G.J. Global fire emissions estimates during 1997–2016. Earth Syst. Sci. Data 2017, 9, 697–720. [Google Scholar] [CrossRef] [Green Version]
  47. Waigl, C.F.; Stuefer, M.; Prakash, A.; Ichoku, C. Detecting high and low-intensity fires in Alaska using VIIRS I-band data: An improved operational approach for high latitudes. Remote Sens. Environ. 2017, 199, 389–400. [Google Scholar] [CrossRef]
  48. Schroeder, W.; Oliva, P.; Giglio, L.; Csiszar, I.A. The New VIIRS 375 m active fire detection data product: Algorithm description and initial assessment. Remote Sens. Environ. 2014, 143, 85–96. [Google Scholar] [CrossRef]
  49. Hantson, S.; Padilla, M.; Corti, D.; Chuvieco, E. Strengths and weaknesses of MODIS hotspots to characterize global fire occurrence. Remote Sens. Environ. 2013, 131, 152–159. [Google Scholar] [CrossRef]
  50. Giglio, L.; Boschetti, L.; Roy, D.P.; Humber, M.L.; Justice, C.O. The collection 6 MODIS burned area mapping algorithm and product. Remote Sens. Environ. 2018, 217, 72–85. [Google Scholar] [CrossRef]
  51. Randerson, J.; Chen, Y.; van Der Werf, G.; Rogers, B.; Morton, D. Global burned area and biomass burning emissions from small fires. J. Geophys. Res. Biogeosciences 2012, 117, 1–23. [Google Scholar] [CrossRef]
  52. Oliva, P.; Schroeder, W. Assessment of VIIRS 375 m active fire detection product for direct burned area mapping. Remote. Sens. Environ. 2015, 160, 144–155. [Google Scholar] [CrossRef]
  53. Vadrevu, K.P.; Lasko, K.; Giglio, L.; Schroeder, W.; Biswas, S.; Justice, C. Trends in vegetation fires in south and southeast Asian countries. Sci. Rep. 2019, 9, 1–13. [Google Scholar] [CrossRef]
  54. Duff, T.J.; Cawson, J.G.; Cirulis, B.; Nyman, P.; Sheridan, G.J.; Tolhurst, K.G. Conditional performance evaluation: Using wildfire observations for systematic fire simulator development. Forests 2018, 9, 189. [Google Scholar] [CrossRef] [Green Version]
  55. Veraverbeke, S.; Sedano, F.; Hook, S.J.; Randerson, J.T.; Jin, Y.; Rogers, B.M. Mapping the daily progression of large wildland fires using MODIS active fire data. Int. J. Wildland Fire 2014, 23, 655–667. [Google Scholar] [CrossRef] [Green Version]
  56. Parks, S.A. Mapping day-of-burning with coarse-resolution satellite fire-detection data. Int. J. Wildland Fire 2014, 23, 215–223. [Google Scholar] [CrossRef]
  57. Artés, T.; Boca, R.; Liberta, G.; San-Miguel, J. Non-supervised method for early forest fire detection and rapid mapping. In Proceedings of the Fifth International Conference on Remote Sensing and Geoinformation of the Environment (RSCy2017), Paphos, Cyprus, 20–23 March 2017; International Society for Optics and Photonics: Bellingham, WA, USA, 2017. [Google Scholar]
  58. Erdelj, M.; Natalizio, E.; Chowdhury, K.R.; Akyildiz, I.F. Help from the sky: Leveraging UAVs for disaster management. IEEE Pervasive Comput. 2017, 16, 24–32. [Google Scholar] [CrossRef]
  59. Gupta, L.; Jain, R.; Vaszkun, G. Survey of important issues in UAV communication networks. IEEE Commun. Surv. Tutor. 2015, 18, 1123–1152. [Google Scholar] [CrossRef] [Green Version]
  60. Quaritsch, M.; Kruggl, K.; Wischounig-Strucl, D.; Bhattacharya, S.; Shah, M.; Rinner, B. Networked UAVs as aerial sensor network for disaster management applications. e i Elektrotechnik Inf. 2010, 127, 56–63. [Google Scholar] [CrossRef]
  61. Anaya-Arenas, A.M.; Renaud, J.; Ruiz, A. Relief distribution networks: A systematic review. Ann. Oper. Res. 2014, 223, 53–79. [Google Scholar] [CrossRef] [Green Version]
  62. Golden, B.L.; Kovacs, A.A.; Wasil, E.A. Vehicle Routing Applications in Disaster Relief. In Vehicle Routing: Problems, Methods, and Applications; Society for Industrial and Applied Mathematics: Philadelphia, PA, USA, 2014; pp. 409–436. [Google Scholar]
  63. Özdamar, L.; Ertem, M.A. Models, solutions and enabling technologies in humanitarian logistics. Eur. J. Oper. Res. 2015, 244, 55–65. [Google Scholar] [CrossRef]
  64. Rodriguez-Oreggia, E.; de La Fuente, A.; de La Torre, R.; Moreno, H.A. Natural disasters, human development and poverty at the municipal level in Mexico. J. Dev. Stud. 2013, 49, 442–455. [Google Scholar] [CrossRef]
  65. Schermer, D.; Moeini, M.; Wendt, O. A Variable Neighborhood Search Algorithm for Solving the Vehicle Routing Problem with Drones; Technacal Report; TU Kaiserslautern: Kaiserslautern, Germany, 2018. [Google Scholar]
Figure 1. Bushfires in the past two decades (a) Casuse frequency of bushfire events and (b) Contribution of sources of bushfires to the burnt areas.
Fire 04 00040 g001
Figure 2. Method flowchart of the current study.
Fire 04 00040 g002
Figure 3. UAV-based bushfire assessment in the Victoria region.
Fire 04 00040 g003
Figure 4. Bushfire monitoring and management through a central control unit using UAVs.
Fire 04 00040 g004
Figure 5. UAV swarm capturing affected region and knowledge sharing mechanism.
Fire 04 00040 g005
Figure 6. Sample UAV network, the numbers represent the cost units associated with each path.
Fire 04 00040 g006
Figure 7. The pseudocode for the proposed tabu algorithm.
Fire 04 00040 g007
Figure 8. Steps of the route determination algorithm.
Fire 04 00040 g008
Figure 9. Procedure for the source location based on the PSO algorithm.
Fire 04 00040 g009
Figure 10. Aggregate perimeters identified from the MOD14 active fire products using the distances of (a) 750 m, (b) 1000 m, (c) 1125 m, (d) 1500 m.
Fire 04 00040 g010
Figure 11. Aggregate perimeters identified from the VIIRS active fire products using the distances of (a) 750 m, (b) 1000 m, (c) 1125 m, (d) 1500 m.
Fire 04 00040 g011
Figure 12. Spatial Autocorrelation report of the fire events.
Fire 04 00040 g012
Figure 13. Bushfire’s hotspot mapping and direction of flow (a) Value-based Hotspots and Coldspots of Victoria, (b) Directional Flow of the Victorian Bush Fires.
Fire 04 00040 g013
Figure 14. IDW maps and bushfire hotspots of Victoria (a) IDW map after identification of Hotspots, (b) Final bush fire hotspots in the State of Victoria.
Fire 04 00040 g014
Figure 15. Results of the route optimization algorithms for 10 UAVs, 30 victims, and 50 units of capacity (a) Greedy search, (b) Inter route search, (c) Intra route search, (d) Tabu Search, (e) PSO Search.
Fire 04 00040 g015
Table 1. Global wildfire events and their impact (from 2000–2020).
Sr. #YearContinentNo. DeathsTotal AffectedTotal Damages (USD)
1.2019Oceania3288832,000,000
2.2018Americas88250,00016,500,000
3.2017Americas30918513,000,000
4.2017Europe64704232,000
5.2017Africa95500420,000
5.2016Americas19165741,200,000
6.2015Asia19409,6641,000,000
7.2013Oceania9902759268,000
8.2007Europe6553921,750,000
9.2003Europe14150,0001,730,000
10.2000Americas1410001,000,000
Average13877,2423,710,000
Table 2. Some of the devastating fire events of Victorian history (Source: Victoria government website).
YearBushfire EventsRegions AffectedDamaged Area (Million ha)FatalitiesBuildings Destroyed
2020Black Summer Victoria/NSW Mega BlazeEastern Victoria and NSW border regions1.5+349352+
2011Red HillGippsland/ Eastern Victoria1.5+3490+
2009Black SaturdayKinglake-Marysville, Beechworth, Bendigo, Redesdale, Gippsland0.451732029
2006–2007The Great Divide FiresGrampians National Park1.2–1.3<25<1000
2003Bushfire Season 2002–03Northeastern Victoria1.2<25<1000
1983Ash WednesdaySoutheastern Victoria0.21472000
1969Australian Bushfire SeasonNortheastern Victoria1.0233
1967Black TuesdayTasmania0.26711293
1965Australian Bushfire SeasonGippsland0.3<25<1000
1942Australian Bushfire SeasonWestern Victoria1.020650
1939Black FridayVictoria2.0711300
1926Black SundaySouth East Victoria0.2601000
Table 3. Active fire dataset, its characteristics, and date and source of acquisition.
S#Active Fire DataResolution (m)SensorDate AcquiredSource
1MODIS C6500Combined (Terra/Aqua)26 September 2020FIRMs website https://firms.modaps.eosdis.nasa.gov/download/create.php (accessed on 3 Januray 2021)
2VIIRS-NPP370VIIRS26 September 2020
3VIRRS NOAA-20370VIIRS26 September 2020
Table 4. Definitions of the mathematical notations.
NotationDefinition
VSet of homogenous UAV
CSet of victims to be visited
GDirected graph
c r s Cost (distance) required to move from victim r to victim s
mTotal number of victims to be visited
m + 1Depot node where each route terminates
qThe capacity of a UAV
d r The demand of the victim r
NSet of vertices 0,1,2,3…m + 1
DDepot
s t a r t D v the departure time of UAV v  V at depot
e n d D v return time of UAV v   V at the depot
o p e n D Opening time of depot
c l o s e D The closing time of depot
Table 5. Geographic Weighted Regression Results for the Respective Fire Products Aggregates.
Aggregated Distance (m)AICcR2R2 Adjusted
750−4475.90.9950.89
1000−2463.30.9400.92
1125−1841.50.920.90
1500−1309.050.910.88
Table 6. Experimental Results for Solving VRP using Greedy Search, Tabu Search, Inter Route, and Intra Route Search Heuristics, With Total Vehicles = 10.
UAV CapacityNo. of AffecteesUAV UtilizedGreedy SearchTabu SearchInter RouteIntra RoutePSO
Runtime (ms)CostRuntime (ms)CostRuntime (ms)CostRuntime (ms)CostRuntime (ms)Cost
5020334459076470704708756574465
305375793114637476446176198578
40635495796816648166190787796
50838211791631027711036641136158989
60934615621581149123129416414841411005
7010359164514813346213797915041391201
10020232361579434404346161273403
303338616105542435705459498517
40336763519358914958979613145563
5043479531547496678475915150737
6053409692438447186480962201827
70536011441861024571043691091157987
8063481423302107912410796512862891009
Table 7. Percentage reduction in run time and costs of PSO over other tests results.
MethodRuntimeCosts
Tabu Search1%1%
Greedy Search2%2%
Intra Routing0%1.2%
Inter Routing1%1.5%
Table 8. Performance comparison of PSO algorithm with other techniques.
MethodRuntimeCosts
Tabu Searchp = 0.01, R2 = 0.81p= 0.001, R2 = 0.67
Greedy Searchp = 0.0008, R2 = 0.95p = 0.005, R2= 0.85
Intra Routingp = 0.031, R2 = 0.67p = 0.001, R2 = 0.78
Inter Routingp = 0.02, R2 = 0.76p = 0.001, R2= 0.79
Publisher’s Note: MDPI stays neutral with regard to jurisdictional claims in published maps and institutional affiliations.

