
Quantifying the Prevalence and Practice of Suppression Firing with Operational Data from Large Fires in Victoria, Australia


Centre for Environmental Risk Management of Bushfires, Faculty of Science, Medicine and Health, School of Earth, Atmospheric and Life Sciences, University of Wollongong, Wollongong, NSW 2522, Australia
*
Author to whom correspondence should be addressed.
Fire 2021, 4(4), 63; https://0-doi-org.brum.beds.ac.uk/10.3390/fire4040063
Submission received: 25 August 2021
/
Revised: 23 September 2021
/
Accepted: 23 September 2021
/
Published: 27 September 2021
(This article belongs to the Special Issue Wildfire Management in Increasing Complex Socio-Ecological Environments: Needs and Challenges)
Abstract
:Fire management agencies around the world use suppression firing for fire control. Yet, we know little about the extent of its use (e.g., prevalence and spatial coverage) and its impact on containment. We examine the prevalence and practice of suppression firing in Victoria, Australia. We used operational data from five years (2010–2015) to identify and map the incidence of suppression firing on 74 large fires (500+ ha). Suppression firing occurred on half (34) of these fires, 26 of which had data to map firing locations. The area burnt by suppression firing ranged from <1 ha to ~20,000 ha on separate fires. Archetypal suppression firing occurred during intervals of low fire spread and resulted in modest fire behaviour. Ground crews generally conducted the perimeter suppression firing. Aerial ignition was more common on large internal firing operations. For the 26 fires where we mapped the firing locations, firing occurred along 77% of the perimeter-aligned road. Suppression firing was a prominent containment tool used along one-fifth of the total external perimeter of these 74 large fires. Quantification of this practice is a first step towards establishing ignition thresholds, production rates, and integration with containment probability models.
Keywords:
backburn; backfire; burnout; bushfire; counter-fire; firefighting; landscape fire; suppression fire; wildfire1. Introduction
Suppression firing that ‘uses fire to fight fire’ is a widespread practice by fire management agencies [1]. Despite widespread use, a systematic evaluation of the practice and its prevalence is lacking [2,3]. During the devastating 2019/20 Australian Black Summer, a number of suppression fires resulted in substantial damages when they escaped their intended burn area. In response, the Final Report of the 2020 NSW Bushfire Inquiry calls for research into this firefighting practice [4]. To this end, we conduct a formal examination of suppression firing in Victoria, Australia to describe the practice of suppression firing and ascertain the prevalence of its use over a five-year period (2010–2015). We limit our study to large fires (>500 ha, comparable with other studies [5,6]) to ensure adequate data, as the amount of available information increases with fire size [7]. Additionally, the small fraction (1–2%) of fires that become large [8,9] cause the majority of losses [8,10]. We focus on the following questions: (1) What proportion of large fires have suppression firing, and does that vary by fuel type? (2) How much of the fire is contained with suppression firing? (3) What extent of the fire burn area is attributable to suppression firing? Finally, we describe the practice of suppression firing in this jurisdiction [11].
1.1. Terminology
We define suppression firing (Table 1) as the intentional application of fire for containment or control purposes during an unplanned fire event (e.g., wildfire or bushfire). In Australia, suppression firing encompasses two subsidiary terms: backburn and burnout. The Australian definitions [12] of these terms do not reference a rate of fire spread or a change to the convective column. Thus, we borrow from Cooper [13] and define a third subsidiary term, counter-fire. A counter-fire is a suppression fire that (1) occurs in the path or near the projected path of a rapidly spreading fire and (2) results in a purposeful interaction to draw the counter-fire into the primary fire or (3) causes a significant interaction that changes the primary fires’ spread direction. We use suppression firing as an overarching term to encompass all firing operations as subsidiary terms (e.g., backburns, burnouts, and counter-fires) are routinely confused [14].
Suppression firing is defined by similar yet inconsistent terminology across different fire management jurisdictions [2,12,15,16,17]. A clear grasp of definition equivalence is essential for generalizability and fire management as international resource sharing has become more common [18]. Unfortunately, these definitions are rife with ambiguity which is exemplified by differences in Australian and USA terminology (Table 2). The term suppression firing is not commonly used in Australia, and a backburn is thought to be equivalent to the USA’s backfire [19,20]. However, the Australian backburn definition does not reference a fire spread rate or a change to the convective column, thus it is more aligned with the US National Wildfire Coordinating Group (NWCG) definition for burning out. Yet, equivalency with NWCG burning out is confusing, as the term burn out is used in Australia to describe the firing of unburnt islands of fuel. Furthermore, the NWCG uses suppression firing as an encompassing term to which backfire is indirectly linked through the subsidiary term counter fire. This ambiguity also exists over time. For example, Cooper [13] provides a historical definition of suppression firing comparable to the current NWCG definition. Part of Cooper’s [13] definition is still used verbatim by the NWCG. Yet, Cooper’s [13] sub-classifications (counter firing, burning out, and mop-up burning) are different from the types of suppression firing (burning out, counter firing, and strip firing) listed by the NWCG. The NWCG definition of backfiring is also different from Cooper [13]. Cooper [13] denoted backfiring as a slow ignition technique of limited use for a fast-moving fire. The Cooper [13] counter firing definition is akin to the current NWCG backfiring definition.
1.2. Issues with the Practice
The practice of suppression firing is not without risk; firefighters are adding fire to the landscape and that fire could spread beyond the intended burn area. In an unsuccessful USA lawsuit, plaintiffs claimed that suppression fires caused their property damage, not wildfire [21]. A property owner affected by the Butte Complex Fires in the USA made the same claim [22]. Firefighters from both events acknowledged that they had carried out suppression firing operations and maintained that the damage was unrelated [21,22]. The Butte Complex firefighters said their firing operations were “in completely different locations and on different dates than those of the fires that damaged the respondent’s property [22] (p. 119).” In such cases, the public perception of damage may stem from the lack of systematic tracking of suppression firing locations. In the USA, the cumulative size and severity of suppression firing operations is currently unknown [3].
Practitioners face real or perceived legal risks. In the USA, “Incident Management Team (IMT) members believe they are not only putting their jobs in jeopardy but risking personal financial and potential criminal liability if the [wild]fire causes private property loss, personal injuries, or fatalities [23] (p. 418)”. Yet, Bradshaw [24] contends that wildland fire managers in the USA have distorted incentives to overuse backfires to protect structures at the cost of ecological and timberland values. Bradshaw [24] makes two incompatible assertions: (1) that backfires “are the lowest cost alternative among the array of wild fire suppression tools [24] (p. 160),” and (2) that there is “virtually no ex post analysis of the wisdom and cost of different methods of firefighting [24] (p. 156)”. Suppression firing is legal in many southern European countries (e.g., Spain, Portugal, France, Italy), and there is a long history of suppression fire use by the rural populations of Europe [2]. Yet, the extent of the practice remains ‘clandestine’ [2] and perceptions of misuse have resulted in contention and an unsuccessful lawsuit between landowners and firefighters in Spain [25]. Not all European countries have legal or technical definitions for suppression firing and Montiel et al. [2] found it difficult to distinguish the rural fire use from the practice of professional fire management agencies.
Suppression fires in New Zealand have resulted in firefighter entrapments [26]. Fire management professionals in Australia acknowledge that they may face legal challenges and questioning by a Coroner if suppression firing operations were to go wrong [27]. In Australia, failed suppression fires have resulted in significant property damage [4]. The 2009 Victorian Bushfires Royal Commission explicitly investigated whether unauthorized backburning contributed to property damage and deaths in Kinglake West and Marysville [28]. Numerous complaints about suppression fires (e.g., too much or too little backburning occurred, backburns were unauthorized by landowners, or unattended after initial ignition) were detailed in the Inquiry into the 2003 Canberra bushfires [29]. More recently, suppression firing was investigated as a contributing factor to the house losses resulting from the 2015 Wye River–Jamieson Track fire [30].
2. Materials and Methods
2.1. Selected Fires and Data
The Department of Environment, Land, Water and Planning (DELWP) in Victoria recorded ~3100 fires in the state between July 2010 and July 2015. Seventy-four, or 2%, of these fires had a final burn area over 500 hectares (Figure 1). DELWP provided operational data for these 74 fires, which included access to eMap (a live geospatial website used to map incidents) and FireWeb (a live text-based incident-reporting website that was the primary source of fire management data). Fire management data included Situation Reports (SitReps), Incident Shift Plans (also known as Incident Action Plans or IAPs (see [12] for definition), line scans, operational maps, and archived eMap data (spatial fire progression and response data that occasionally recorded the location of suppression firing). DELWP provided further Geographic Information System (GIS) data, including spatial base layers (roads, watercourses, vegetation, etc.), final fire polygons, and ignition locations. In addition to the operational data, we accessed daily and hourly weather station data from the Australian Bureau of Meteorology to reconstruct fire weather conditions. We sourced Moderate Resolution Imaging Spectroradiometer (MODIS) and Visible Infrared Imaging Radiometer Suite (VIIRS) hotspot data from the National Aeronautics and Space Administration (NASA) to verify fire spread.
2.2. Suppression Firing Reconstruction
In a previous suppression analysis, we identified suppression firing on 6 of a subset of 10 of these fires [31]. We used our previous study as a pilot to establish that (1) suppression firing could be identified by examining comments in the SitReps and (2) that suppression firing often occurred along existing roads. SitReps are operational reports on the progress of the fire and efforts to contain it; they are produced at irregular intervals during fire suppression [19]. There were 2805 SitReps for the 74 fires. We confined our analysis to the 532 active fire days (days from the first report to the last day of fire growth, inclusive). To identify suppression firing, a keyword search of SitRep comments was performed for the following terms associated with suppression firing: parallel attack, indirect attack, backfire, backburn, burnout, aerial ignition, drip torch, incendiary, ignite, aerial drip torch, ADT, aerial ignition device, AID, burn, and unburnt. This returned 1242 SitReps, the comments of which were read to confirm that (1) they described suppression firing and (2) that they included geographic information that would assist with mapping. Aspects of suppression firing (e.g., Table 3) were described in 738 of these SitReps, 571 of which had corresponding geographic information.
We assembled daily fire reconstructions for the fires that had identifiable suppression firing in the SitRep comments. We integrated information from different data sources, which included the ignition location, final fire footprint, eMap extract data, MODIS and VIRRS hotspots, line scans, operational maps, spatial base layers (e.g., roads, rivers, vegetation, and topography), comments and information in the SitReps and IAPs, and weather conditions. We used ArcGIS 10.4.1 [Environmental Systems Research Institute, Redlands, USA] to map the fire progression and the suppression firing. We completed an abbreviated examination of the fires that did not have identifiable suppression firing in the SitRep comments. Finally, we verified the occurrence and practice of suppression firing with Incident Management Team members who had managed seven of these fires. We used the qualitative description method [11] to describe the practice of suppression firing on these large fires in Victoria.
2.3. Quantitative Analysis
We separated the 74 fires into three categories, those with sufficient geographic data to map the suppression firing (SF-Map), those with suppression firing but insufficient geographic data to map the extent (SF-NoGeo) and those without detectible suppression firing (No-SF). DELWP classifies fuel types with broad vegetation categories (see [36] for further information on Australian fuel types and structure). We used final-fire-polygons and DELWPs broad vegetation categories to group the fires into five major fuel types: mallee, grassland, heath, woodland, and forest. As large fires burn at a landscape scale, fuel type classification was defined by the fuel that covered the largest proportion of final burn area. We conducted a chi-square test to test whether there was a difference in suppression firing by fuel type, with the expectation that burning would be equally likely in all fuel types.
We performed a series of geoprocessing steps using ArcMap 10.4.1 [Environmental Systems Research Institute, Redlands, USA] to generate the length of the (1) external perimeter, (2) perimeter aligned road, (3) suppression firing perimeter, and (4) suppression firing perimeter aligned road. For external perimeter we erased the internal unburnt areas within the final fire polygons and transformed polygons to polylines to get the external perimeter length. For perimeter aligned road we dissolved DELWPs state-wide GIS road base layer to form a continuous line, then applied a 50-m buffer and intersected the result with the external perimeter. The intersected result was again dissolved and any road <200 m in length was discarded to drop roads that only crossed the perimeter. For the suppression firing perimeter, we intersected the external perimeter with the manually generated suppression firing polygon. For the suppression firing aligned road we applied a 50-m buffer to the manually generated suppression firing polygon, then intersected the result with the perimeter-adjacent road. We conducted a t-test to test whether there is a difference in the percentage of perimeter aligned road between fires with suppression firing (SF-Map and SF-NoGeo) and no suppression firing (No-SF). We conducted a Kruskal–Wallis test to determine whether the percentage of perimeter aligned road varies with fuel type.
As the focus of firefighting operations was containment, operational data pertained more to the perimeter extent (location and progress on the perimeter) of the firing operations, rather than the area burnt. The area extent (area burnt by suppression firing exclusively) had to be estimated from a manual/visual interpretation of maps and line scan images, which was cross-referenced with the SitRep comments, eMap data, and IAPs. The aim of suppression firing is to alter a fire through interaction or to consume intermediary fuels between the control line and the fire [1]. As a result, suppression firing tends to merge with the fire, which prevents the precise area affected from being determined. The area extent becomes difficult to define in line scan images as time elapses and the fires merge (Figure 2). These challenges were compounded by periodic reporting, intermittent data time steps, and variant line scan quality (see [37] for further discussion of line scans and their quality). The internal burn area was interpreted conservatively and only includes suppression firing that could be clearly demarcated. There was greater certainty in the assessment of the perimeter extent of the suppression firing versus the area extent.
3. Results
3.1. Proportion of Large Fires that Have Suppression Firing in Total and by Fuel Type
We found suppression firing on half (37) of the 74 large fires that occurred in Victoria, between July 2010 and July 2015. These 37 fires were active for a combined total of 346 days, and suppression firing was evident on 75% or 261 of the 346 days. The 26 SF-Map fires (sufficient geographic data to map the suppression firing) were larger on average than the 11 SF-NoGeo (suppression firing but insufficient geographic data to map the extent). The 37 No-SF fires did not have detectible suppression firing (Table 4). Suppression firing was more apparent in denser fuels (Table 5). There was a significant difference by fuel type; suppression firing was more prevalent in forest and less prevalent in mallee, which was supported by the chi-square result (p < 0.001). Additionally, the suppression firing that we mapped on grassland fires was in the forested/woodland areas of the fires. There was insufficient geographic data in the SitReps to map the occurrence of suppression firing on mallee fires; one was described as a 15 ha burnout, and the other a post-containment burnout of unspecified size.
3.2. Proportion of External Perimeter Contained by Suppression Firing
For the 26 SF-Map fires, suppression firing occurred along 845 km (42%) of the total 1995 km external fire perimeter length. Thus, suppression firing contained one-fifth (19%) of the total 4400 km external fire perimeter across all 74 fires. The average proportion of external SF-Map fire perimeter contained by suppression firing was 44% (median 47%, SD 27%, range 1–100%); see Figure 3 for a breakdown of all fires by fuel type and suppression firing category. The presence of suppression firing had a substantial effect on the proportion of total external fire perimeter that aligned with roads (within 50 m) compared to other control features such as natural features or constructed firelines. The mean of the perimeter aligned road for fires with suppression firing was 34.6%, and for No-SF fires, the mean was 11.7%; these were significantly different (t = 6.40, p < 0.001). For the SF-Map fires, 39% of the external perimeter was aligned with roads, and suppression firing occurred along 77% of the road length. For the SF-NoGeo and No-SF fires, the percentage of perimeter aligned road was 22% and 14%, respectively. Proportionally, there is 2.8 times more perimeter-aligned road on SF-Map fires than the No-SF fires. There was also substantial difference in the percentage of perimeter aligned road by fuel type; the Kruskal–Wallis test was significant (chi-square = 28.7, df = 4, p < 0.001).
3.3. Extent of Burn Area Attibutable to Suppression Firing
The area burnt by suppression firing ranged from less than one hectare (a 40 × 40 m area on an SF-NoGeo fire) to an aggregate total of ~20,000 ha on the largest fire. The extent of suppression firing, defined as burn area attributable to suppression firing, alone exceeded 500 ha on half (n = 13) of the SF-Map fires; the average of the proportion of burn area attributable to suppression firing for the SF-Map fires was one-quarter of the final area (mean 0.29, median 0.24, min 0.07, max 0.94). The largest identifiable suppression firing operation in a combination of both extent and proportion of final fire area spanned multiple days and burned ~9000 ha of the ~36,000 ha fire (Figure 2). This event exemplifies the magnitude of possible suppression firing and the challenges in demarcating suppression firing area.
3.4. The Practice of Suppression Firing in Vicotria, Australia: Backburns and Burnouts
The archetypal backburn in the fires we analyzed entailed the progressive ignition of fuels (vegetation) adjacent to the control line by ground crews (Figure 4). Kilometers (typically <10) of control line were ignited during a single 24-h burn period. The most common control lines were existing roads or mechanically constructed fireline (e.g., dozer) that joined segments of existing roads together. There was limited alignment between the final external perimeter and rivers (<1%); baring one notable example (~10 km in length along the Snowy River), backburns that used a river as the control line were uncommon. Initial backburn ignition locations typically adjoined or anchored the primary fire; as the backburn progressed, an area of unburnt fuel intervened, spanning hundreds of meters or even several kilometers. When the area of intervening fuels was narrow, and there were sufficient conditions for the fuel to burn naturally, backburns soon became indistinguishable from the primary fire. With a wide strip of unburnt intervening fuel, backburns remained distinct until subsequent burnout operations (Figure 5) were completed, possibly days after the initial ignition. In such cases, the initial backburn spread was modest, reaching a depth from the control line of tens to hundreds of meters in the first burn period. At times, burning conditions deteriorated (e.g., there was substantial rain) and the burnout was never completed, meaning the backburn and the primary fire never joined.
The exclusive use of aerial ignition, independent of ground crews was not a common method of igniting the backburns in our dataset. A unique example of a backburn with exclusive aerial occurred on the Goongerah–Deddick Trail fire, the largest fire in the dataset (165,811 ha, 370 km external perimeter). The ~10-km-long backburn used the Snowy River as the control line, it was lit exclusively by aerial ignition as there was no safe access for ground crews. Although aerial ignition was used occasionally to bolster or increase the depth of a perimeter backburn that ground crews had ignited, the primary use of aerial ignition was larger-scale burnouts, igniting large islands (hundreds to thousands of hectares) of intervening fuels. Ground crews generally completed a perimeter backburn before these aerially ignited burnout operations commenced.
The presence of another nearby fire causes interaction effects that change fire behaviour [38], in particular, increased fire intensity occurs at junction zones [39,40,41]. Some suppression firing operations created unquantified interaction effects between the suppression fire and the primary fire, which could be problematic. This was exemplified by one SitRep which reported that “the main fire front [was] only 140 m away from the track at this location and junction zones of the fire front and the back-burn [were] causing significant fire behaviour [42] (pp. 1–2).” That night, general fire behaviour was reported as ‘moderate’ and the weather was “cool with high relative humidity and light winds [42] (p. 1).” Yet, suppression firing caused challenging fire behaviour that exceeded expectations, resulting in lower-than-expected progress as the ignition rate was slowed to maintain control.
We did not find evidence of any instances of counter-firing where any type of suppression fire was ignited in the path of a rapidly spreading fire (see [43] for a case study example of this practice). Suppression fires in our sample were undertaken as containment measures during intervals of low-fire-growth. Suppression fires that occurred during periods of rapid wildfire growth (e.g., >5000 ha in 24 h) were on either the rear or flank of the fire, not the head. Neither were there any reports of the intentional use of suppression firing to change the force of the convective column or affect the direction of the primary fires’ spread.
4. Discussion
This work provides the first systematic study of the prevalence and practice of suppression firing on large fires. The results demonstrate that a sizeable proportion of large fires (half), fire perimeters (one-fifth of total external perimeter), and the burn area (up to 20,000 ha on one fire) in Victoria are affected by suppression firing. The archetype of the practice coincided with low fire growth (Figure 4). Suppression firing operations made opportunistic usage of existing road networks, and they were more apparent in denser fuel types. Suppression firing was extensive enough to be captured by remote sensing (MODIS and VIIRS hotspots). The suppression firing area-extent ranged from <1 ha to ~20,000 ha and often exceeded the minimum area (120 ha) required for effective burn area mapping using MODIS data [44]. One-sixth (13) of the 74 fires we studied had suppression firing over 500 ha, the size criterion we use to define a large fire. Unidentified suppression firing may confound the remote assessment of fires as multiple sources of operational data were often needed for clear demarcation.
There were inherent quality issues with the operational data that we used as it was generated for fire management, not research. SitReps provide summary information about the fire as a whole and are challenging to interpret as they often contain localised jargon, spelling errors, and typographical errors. SitReps may consist of whole tracts of copied text, barring a novel update about one aspect of the fire, resulting in erroneously repeated information. Additional suppression firing could have been overlooked as the production of SitReps, line scans, maps, and GIS suppression firing location data was irregular in both interval and quality. In confining our analysis to active fire days, small interior burnout operations may have been missed. Infrequent line scans make the demarcation of suppression firing difficult; as the burn cools or the suppression fire merges with the primary fire, it becomes indiscernible. Suppression firing can be difficult to visually detect, even with prior knowledge of its existence. Data was particularly limited during initial periods of rapid fire growth, likely because (1) the information was difficult to quantify during a rapidly changing event, (2) the staff and structure required to record it (e.g., IMT) was not present, or (3) the focus was on fire suppression and containment rather than precise data collection. Data quality issues are limiting factors for further analysis. Future analysis of suppression firing would be significantly improved (and easier) with improved progression data and more frequent line scans. SitReps would be more useful if they included a consistent record of the intended burn area, suppression firing start and finish times, ignition patterns, and an accurate recording of the resources involved. In addition, progress updates need to occur at frequent, regular intervals and include spatial references, observed fire behaviour, and local measures of weather and fuel moisture.
A limitation to operational data is that absence cannot be taken as evidence that the practice did not occur, only that it was not recorded. Yet, we contend that suppression firing either (1) did not occur on the No-SF fires, or (2) it was small-scale in comparison to the SF-Map fires. Additionally, we contend that this is due to the availability of alternate containment options in lighter fuels (e.g., progressive wetlines with firetrucks in grassland), but the evidence is not definitive. Had there been extensive suppression firing on the No-SF fires, we would have expected to see a higher proportion of perimeter-aligned road as the rapid fire growth would necessitate the use of existing barriers for control lines. However, we found that graders were used to build control lines on some grass fires, and a tractor/roller combination was used on some mallee fires. In light fuels (e.g., grass and mallee) these alternate vehicles could construct control lines at a much faster rate than a dozer. Therefore, it is possible that smaller scale, undetected suppression firing could have occurred on these fires adjacent to rapidly built control lines. Another possibility is that wetlines were used as suppression firing control lines, which would leave no mechanical evidence. We confirmed the absence of suppression firing with Incident Management Team members from three of the No-SF fires. The No-SF category includes half of all fires, but only 35% or 186 of the 532 active fire days. These fires were shorter in duration, and they also had less data; there was a tendency for the grass and mallee fires to initiate with a single period of rapid fire growth that outstrips the pace of data recording.
We also infer that the suppression firing on the SF-NoGeo fires was not as extensive as the SF-Map fires. The SF-NoGeo fires were both smaller on average than the SF-Map fires and the No-SF fires (Table 4), and they tended to have less data. However, when extensive suppression firing occurred on the SF-Map fires, it was evident in the available line scans or maps; also, SitRep and IAP comments relating to suppression firing were more numerous and/or provided more detail. Only one of the SF-NoGeo fires had descriptions of both backburns and burnouts in the comments; the remaining 10 fires only had descriptions of burnouts that occurred within containment lines and the largest area reference was a 15-ha mallee burnout. For extensive suppression firing operations to have occurred on the SF-NoGeo fires, a high proportion of these smaller fires would have had to have been burnt by suppression firing without producing detectible evidence.
Landscape features including roads, rivers, and a variety of topographic and fuel variables have been identified as important factors in fire cessation [45,46,47]. In our study, suppression firing was a prominent containment tool. It was used to contain two-fifths (42% or 845 km) of the external perimeter (1995 km) of the 26 SF-Map fires. This is one-fifth (19% or 845 km) of the total external perimeter (4400 km) of all 74 fires. Roads were routinely used as the control line for suppression firing operations. The SF-Map fires’ proportion of perimeter aligned road was 2.8 times greater than the No-SF fires. Suppression firing occurred along 77% of the SF-Map fires’ perimeter aligned road. To use the words of the firefighters themselves, they are “conducting back burning and burning out operations to bring [the] fire edge out to [the] road network [48] (p. 3).” As suppression firing forms a large proportion of fire perimeter, it can be viewed as an intervening variable in the degree to which landscape features, especially roads, impact fire cessation.
To be a successful containment measure, suppression firing must be complete (control lines established, firing completed and controlled) before the next ‘bad day’, or there is a risk that it will enlarge rather than contain the fire. Counter-firing was not present in our data, though there is limited evidence that it occurs in other jurisdictions (e.g., case studies: Manitoba, Canada [21], and the USA, 1941 [43]) The archetypal backburns in our study were lit by ground crews along several (single digit) kilometers of the perimeter. From this, we infer that a crude production rate for this suppression practice is at maximum ~10 km per shift. Further research that examines how suppression firing is affected by variability in fuel, weather and topographic features, resource type and number, containment line type, ignition device, ignition type, and ignition patterns is required to establish robust production rates. Research should also consider the minimum depth (distance from the control line) that is required for successful outcomes. Production rates need to incorporate post-ignition control and mop-up time, as well as the ignition rates. These production rates would facilitate feasibility comparisons between different attack strategies (e.g., direct vs. indirect).
It has been theorized that suppression firing promotes more intense fires, increases total area burned, produces a more homogeneous burned area, and contributes to soil and water contamination [49]. The testing of these theories and other fire ecology effects is an identifiable research gap, and conclusions on such matters were beyond the scope of this research. The identification of operational windows for suppression firing [50], production rates, and ignition thresholds are other significant knowledge gaps that require further study. This study which describes the prevalence, extent, and archetypal practice of suppression firing in Victoria is a first step in filling these gaps. Further research should investigate the use of suppression firing on smaller fires, during initial attack, and in other jurisdictions.
Author Contributions
Conceptualization, H.S., R.B. and O.P.; data curation, H.S.; formal analysis, H.S.; funding acquisition, H.S., R.B. and O.P.; methodology, H.S., R.B. and O.P.; project administration, H.S., R.B. and O.P.; supervision, R.B. and O.P.; writing—original draft, H.S.; writing—review and editing, H.S., R.B. and O.P. All authors will be informed about each step of manuscript processing including submission, revision, revision reminder, etc., via emails from our system or assigned Assistant Editor. All authors have read and agreed to the published version of the manuscript.
Funding
This research has been conducted with the support of the Bushfire Natural Hazards Cooperative Research Centre Scholarship. Funding was provided by the Department of Environment, Land, Water and Planning, Victoria, as part of the “Estimation of the social, economic and environmental costs and benefits of bushfire preparedness and response operations in the 2013/2014 fire season (Schedule 20)” project.
Institutional Review Board Statement
Ethical review and approval were waived for this study as it does not contain information that identifies human beings and there is no foreseeable risk of harm or discomfort to individuals. This is an archival study that uses existing data or records obtained with consent from the Department of Environment, Land, Water and Planning.
Data Availability Statement
Third Party Data. Restrictions apply to the availability of these data. Data was obtained from Department of Environment, Land, Water and Planning, Victoria, and are available from the authors with the permission of Department of Environment, Land, Water and Planning, Victoria.
Acknowledgments
The authors would like to thank Department of Environment, Land, Water and Planning, Victoria, for providing access to the data. The authors would also like to thank the Incident Management Team members from the Country Fire Authority and the Department of Environment, Land, Water and Planning, Victoria, for their time and valuable input.
Conflicts of Interest
The authors declare no conflict of interest. The funders had no role in the design of the study; in the collection, analyses, or interpretation of data; in the writing of the manuscript, or in the decision to publish the results.
References
- Vega, J.A.; Jiménez, E.; Dupuy, J.-L.; Linn, R.R. Effects of flame interaction on the rate of spread of heading and suppression fires in shrubland experimental fires. Int. J. Wildland Fire 2012, 21, 950–960. [Google Scholar] [CrossRef]
- Montiel, C.; Costa, P.; Galán, M. Towards Integrated Fire Management—Outcomes of the European Project Fire Paradox: Overview of Suppression Fire Policies and Practices in Europe; European Forest Institute: Porvoo, Finland, 2010. [Google Scholar]
- Ingalsbee, T. Ecological Fire Use for Ecological Fire Management: Managing Large Wildfires by Design. In Proceedings of the Large Wildland Fires Conference, Missoula, MT, USA, 19–23 May 2014; Department of Agriculture, Forest Service, Rocky Mountain Research Station: Missoula, MT, USA, 2015; pp. 120–127. [Google Scholar]
- Owens, D.; O’Kane, M. Final Report of the NSW Bushfire Inquiry; Department of Premier and Cabinet (NSW): Sydney, Australia, 2020. [Google Scholar]
- Gill, M.; Allan, G. Large fires, fire effects and the fire-regime concept. Int. J. Wildland Fire 2008, 17, 688. [Google Scholar] [CrossRef]
- Tedim, F.; Leone, V.; Amraoui, M.; Bouillon, C.; Coughlan, M.R.; Delogu, G.M.; Fernandes, P.M.; Ferreira, C.; McCaffrey, S.; McGee, T.K.; et al. Defining extreme wildfire events: Difficulties, challenges, and impacts. Fire 2018, 1, 9. [Google Scholar] [CrossRef] [Green Version]
- Filkov, A.I.; Duff, T.J.; Penman, T.D. Improving fire behaviour data obtained from wildfires. Forests 2018, 9, 81. [Google Scholar] [CrossRef] [Green Version]
- Strauss, D.; Bednar, L.; Mees, R. Do one percent of the forest fires cause ninety-nine percent of the damage? For. Sci. 1989, 35, 319–328. [Google Scholar] [CrossRef]
- Stocks, B.J.; Mason, J.A.; Todd, J.B.; Bosch, E.M.; Wotton, B.M.; Amiro, B.D.; Flannigan, M.D.; Hirsch, K.G.; Logan, K.A.; Martell, D.L.; et al. Large forest fires in Canada, 1959–1997. J. Geophys. Res. 2002, 107, 8149. [Google Scholar] [CrossRef]
- San-Miguel-Ayanz, J.; Moreno, J.M.; Camia, A. Analysis of large fires in European Mediterranean Landscapes: Lessons learned and perspectives. Forest Ecol. Manag. 2013, 294, 11–22. [Google Scholar] [CrossRef]
- Sandelowski, M. Whatever happened to qualitative description? Res. Nurs. Health 2000, 23, 334–340. [Google Scholar] [CrossRef]
- Australian Institute for Disaster Resilience Glossary. Available online: https://knowledge.aidr.org.au/glossary (accessed on 9 July 2020).
- Cooper, R.W. Preliminary Guidelines for Using Suppression Fires to Control Wildfires in the Southeast; USDA Forest Service: Asheville, NC, USA, 1969.
- Ingalsbee, T. Friendly Fire: Assessing the Effects of Firing Operations in Managing Wildfires. In Proceedings of the 3rd Fire Behavior and Fuels Conference, Washington, DC, USA, 25–29 October 2010; International Association of Wildland Fire: Spokane, Washington, DC, USA, 2010; pp. 1–7. [Google Scholar]
- Canadian Wildland Fire Management Glossary. Canadian Interagency Forest Fire Centre: Winnipeg, MB, Canada, 2017; Available online: https://www.ciffc.ca/sites/default/files/2019-03/CIFFC_Canadian_Wildland_Fire_Mgmt_Glossary_2017_10_24.pdf (accessed on 25 September 2021).
- Goldammer, J.G.; Ronde, C.D. Wildland Fire Management Handbook for Sub-Sahara Africa; Global Fire Monitoring Center: Freiburg im Breisgau, Germany, 2004; ISBN 978-1-919833-65-1. [Google Scholar]
- National Wildfire Coordinating Group. NWCG Glossary of Wildland Fire, PMS 205. Available online: https://www.nwcg.gov/glossary/a-z (accessed on 15 April 2020).
- Tsang, A.; Larson, K.; McAlpine, R. Resource Sharing for Control of Wildland Fires. In Proceedings of the Twenty-Seventh AAAI Conference on Artificial Intelligence, Washington, DC, USA, 14–18 July 2013; Bellevue: Washington, DC, USA, 2013; Volume 27, p. 7. [Google Scholar]
- Rural and Land Management Group. AFAC Bushfire Glossary; Australasian Fire Authorities Council: Melbourne, Victoria, Australia, 2012. [Google Scholar]
- Plucinski, M.P. Fighting flames and forging firelines: Wildfire suppression effectiveness at the fire edge. Curr. For. Rep. 2019, 5, 1–19. [Google Scholar] [CrossRef]
- Malloy, D.W. Backfire 2000 v. United States; Case 9:03-cv-00198-DWM Document 85. [Online]. 2006. Available online: http://www.coloradofirecamp.com/textdocuments/Backfire-2000-ruling-memo.pdf. (accessed on 1 July 2021).
- Kumagai, Y.; Bliss, J.C.; Daniels, S.E.; Carroll, M.S. Research on causal attribution of wildfire: An exploratory multiple-methods approach. Soc. Nat. Resour. 2004, 17, 113–127. [Google Scholar] [CrossRef]
- Canton-Thompson, J.; Gebert, K.M.; Thompson, B.; Jones, G.; Calkin, D.; Donovan, G. External human factors in incident management team Decisionmaking and their effect on large fire suppression expenditures. J. For. 2008, 106, 416–424. [Google Scholar]
- Bradshaw, K. Backfired! Distorted incentives in wildfire suppression. Utah Environ. Law Rev. 2012, 31, 155–179. [Google Scholar]
- Otero, I.; Nielsen, J.Ø. Coexisting with wildfire? Achievements and challenges for a radical social-ecological transformation in Catalonia (Spain). Geoforum 2017, 85, 234–246. [Google Scholar] [CrossRef]
- Rasmussen, J.H.; Fogarty, L.G. A Case Study of Grassland Fire Behaviour and Suppression: The Tikokino Fire of 31 January 1991; Forest and Rural Fire Science and Technical Series; New Zealand Forest Research Institute in association with the National Rural Fire Authority: Wellington, New Zealand, 1997; p. 26. [Google Scholar]
- Bearup, G. The thin brown line. Bush Fire Bulletin. 2014, 36, 58–65. [Google Scholar]
- Pascoe, S. The 2009 Victorian bushfires royal commission: Lessons for the conduct of inquiries in Australia. Aust. J. Public Adm. 2010, 69, 392–400. [Google Scholar] [CrossRef]
- A Nation Charred: Report on the Inquiry into Bushfires; Nairn, G. (Ed.) Commonwealth of Australia: Canberra, Australia, 2003; ISBN 978-0-642-78445-2. [Google Scholar]
- Inspector General for Emergency Management. Review of the Initial Response to the 2015 Wye River—Jamieson Track Fire; Victoria State Government: Melbourne, Australia, 2016; ISBN 978-0-9944237-5-7.
- Simpson, H.; Bradstock, R.; Price, O. A temporal framework of large wildfire suppression in practice, a qualitative descriptive study. Forests 2019, 10, 884. [Google Scholar] [CrossRef] [Green Version]
- DELWP Powelltown_Learmonth_20140209_2329_SitRep_19. Unpublished Data. 2014.
- DELWP Timbarra_GilGroggin_20140218_0940_SitRep_19. Unpublished Data. 2014.
- DELWP Corryong_Kings_Creek_20140119_0550_SitRep_12. Unpublished Data. 2014.
- DELWP Kentbruck_Portland_20130109_Night_IAP_11. Unpublished Data. 2013.
- Gould, J.; Cruz, M. Australian Fuel Classification: Stage II; Ecosystem Sciences and Climate Adaption Flagship, CSIRO: Canberra, Australia, 2012; p. 108. [Google Scholar]
- Storey, M.A.; Price, O.F.; Sharples, J.J.; Bradstock, R.A. Drivers of long-distance spotting during wildfires in South-Eastern Australia. Int. J. Wildland Fire 2020. [Google Scholar] [CrossRef]
- Finney, M.A.; McAllister, S.S. A review of fire interactions and mass fires. J. Combust. 2011, 2011, 1–14. [Google Scholar] [CrossRef]
- Cui, W.; Qiao, Q. Experimental studies of interactions between backfires and coming surface fires. For. Stud. China 2002, 4, 25–28. [Google Scholar]
- McRae, D.J.; Jin, J.-Z.; Conard, S.G.; Sukhinin, A.I.; Ivanova, G.A.; Blake, T.W. Infrared characterization of fine-scale variability in behavior of boreal forest fires. Can. J. For. Res. 2005, 35, 2194–2206. [Google Scholar] [CrossRef]
- Morvan, D.; Meradji, S.; Mell, W. Interaction between head fire and backfire in grasslands. Fire Saf. J. 2013, 58, 195–203. [Google Scholar] [CrossRef]
- DELWP Aberfeldy_20130120_02:38_SitRep_24. Unpublished Data. 2013.
- Olsen, C.F. An analysis of the honey fire. Fire Control. Notes 1941, 5, 161–178. [Google Scholar]
- Giglio, L.; Loboda, T.; Roy, D.P.; Quayle, B.; Justice, C.O. An active-fire based burned area mapping algorithm for the MODIS sensor. Remote Sens. Environ. 2009, 113, 408–420. [Google Scholar] [CrossRef]
- Jordan, G.J.; Fortin, M.-J.; Lertzman, K.P. Spatial pattern and persistence of historical fire boundaries in southern interior British columbia. Environ. Ecol. Stat. 2008, 15, 523–535. [Google Scholar] [CrossRef]
- Price, O.F.; Bradstock, R.A. The effect of fuel age on the spread of fire in Sclerophyll Forest in the Sydney region of Australia. Int. J. Wildland Fire 2010, 19, 35–45. [Google Scholar] [CrossRef] [Green Version]
- Narayanaraj, G.; Wimberly, M.C. Influences of forest roads on the spatial pattern of wildfire boundaries. Int. J. Wildland Fire 2011, 20, 792–803. [Google Scholar] [CrossRef]
- DELWP Grampians_Northern_20140118_1243_SitRep_12. Unpublished Data. 2014.
- Backer, D.M.; Jensen, S.E.; McPherson, G.R. Impacts of fire-suppression activities on natural communities. Conserv. Biol. 2004, 18, 937–946. [Google Scholar] [CrossRef]
- Plucinski, M.P. Contain and control: Wildfire suppression effectiveness at incidents and across landscapes. Curr. For. Rep. 2019, 5, 20–40. [Google Scholar] [CrossRef]
Figure 1.
Point locations of the 74 fires in our study. Point size is indicative of final fire area in hectares. Point color is indicative of three categories of suppression firing, fires colored: (1) SF-Map (blue) had sufficient data to map the suppression firing, (2) SF-NoGeo (turquoise) had suppression firing but there was insufficient geographic data to map the extent, and (3) No-SF (red) had no evidence of suppression firing.
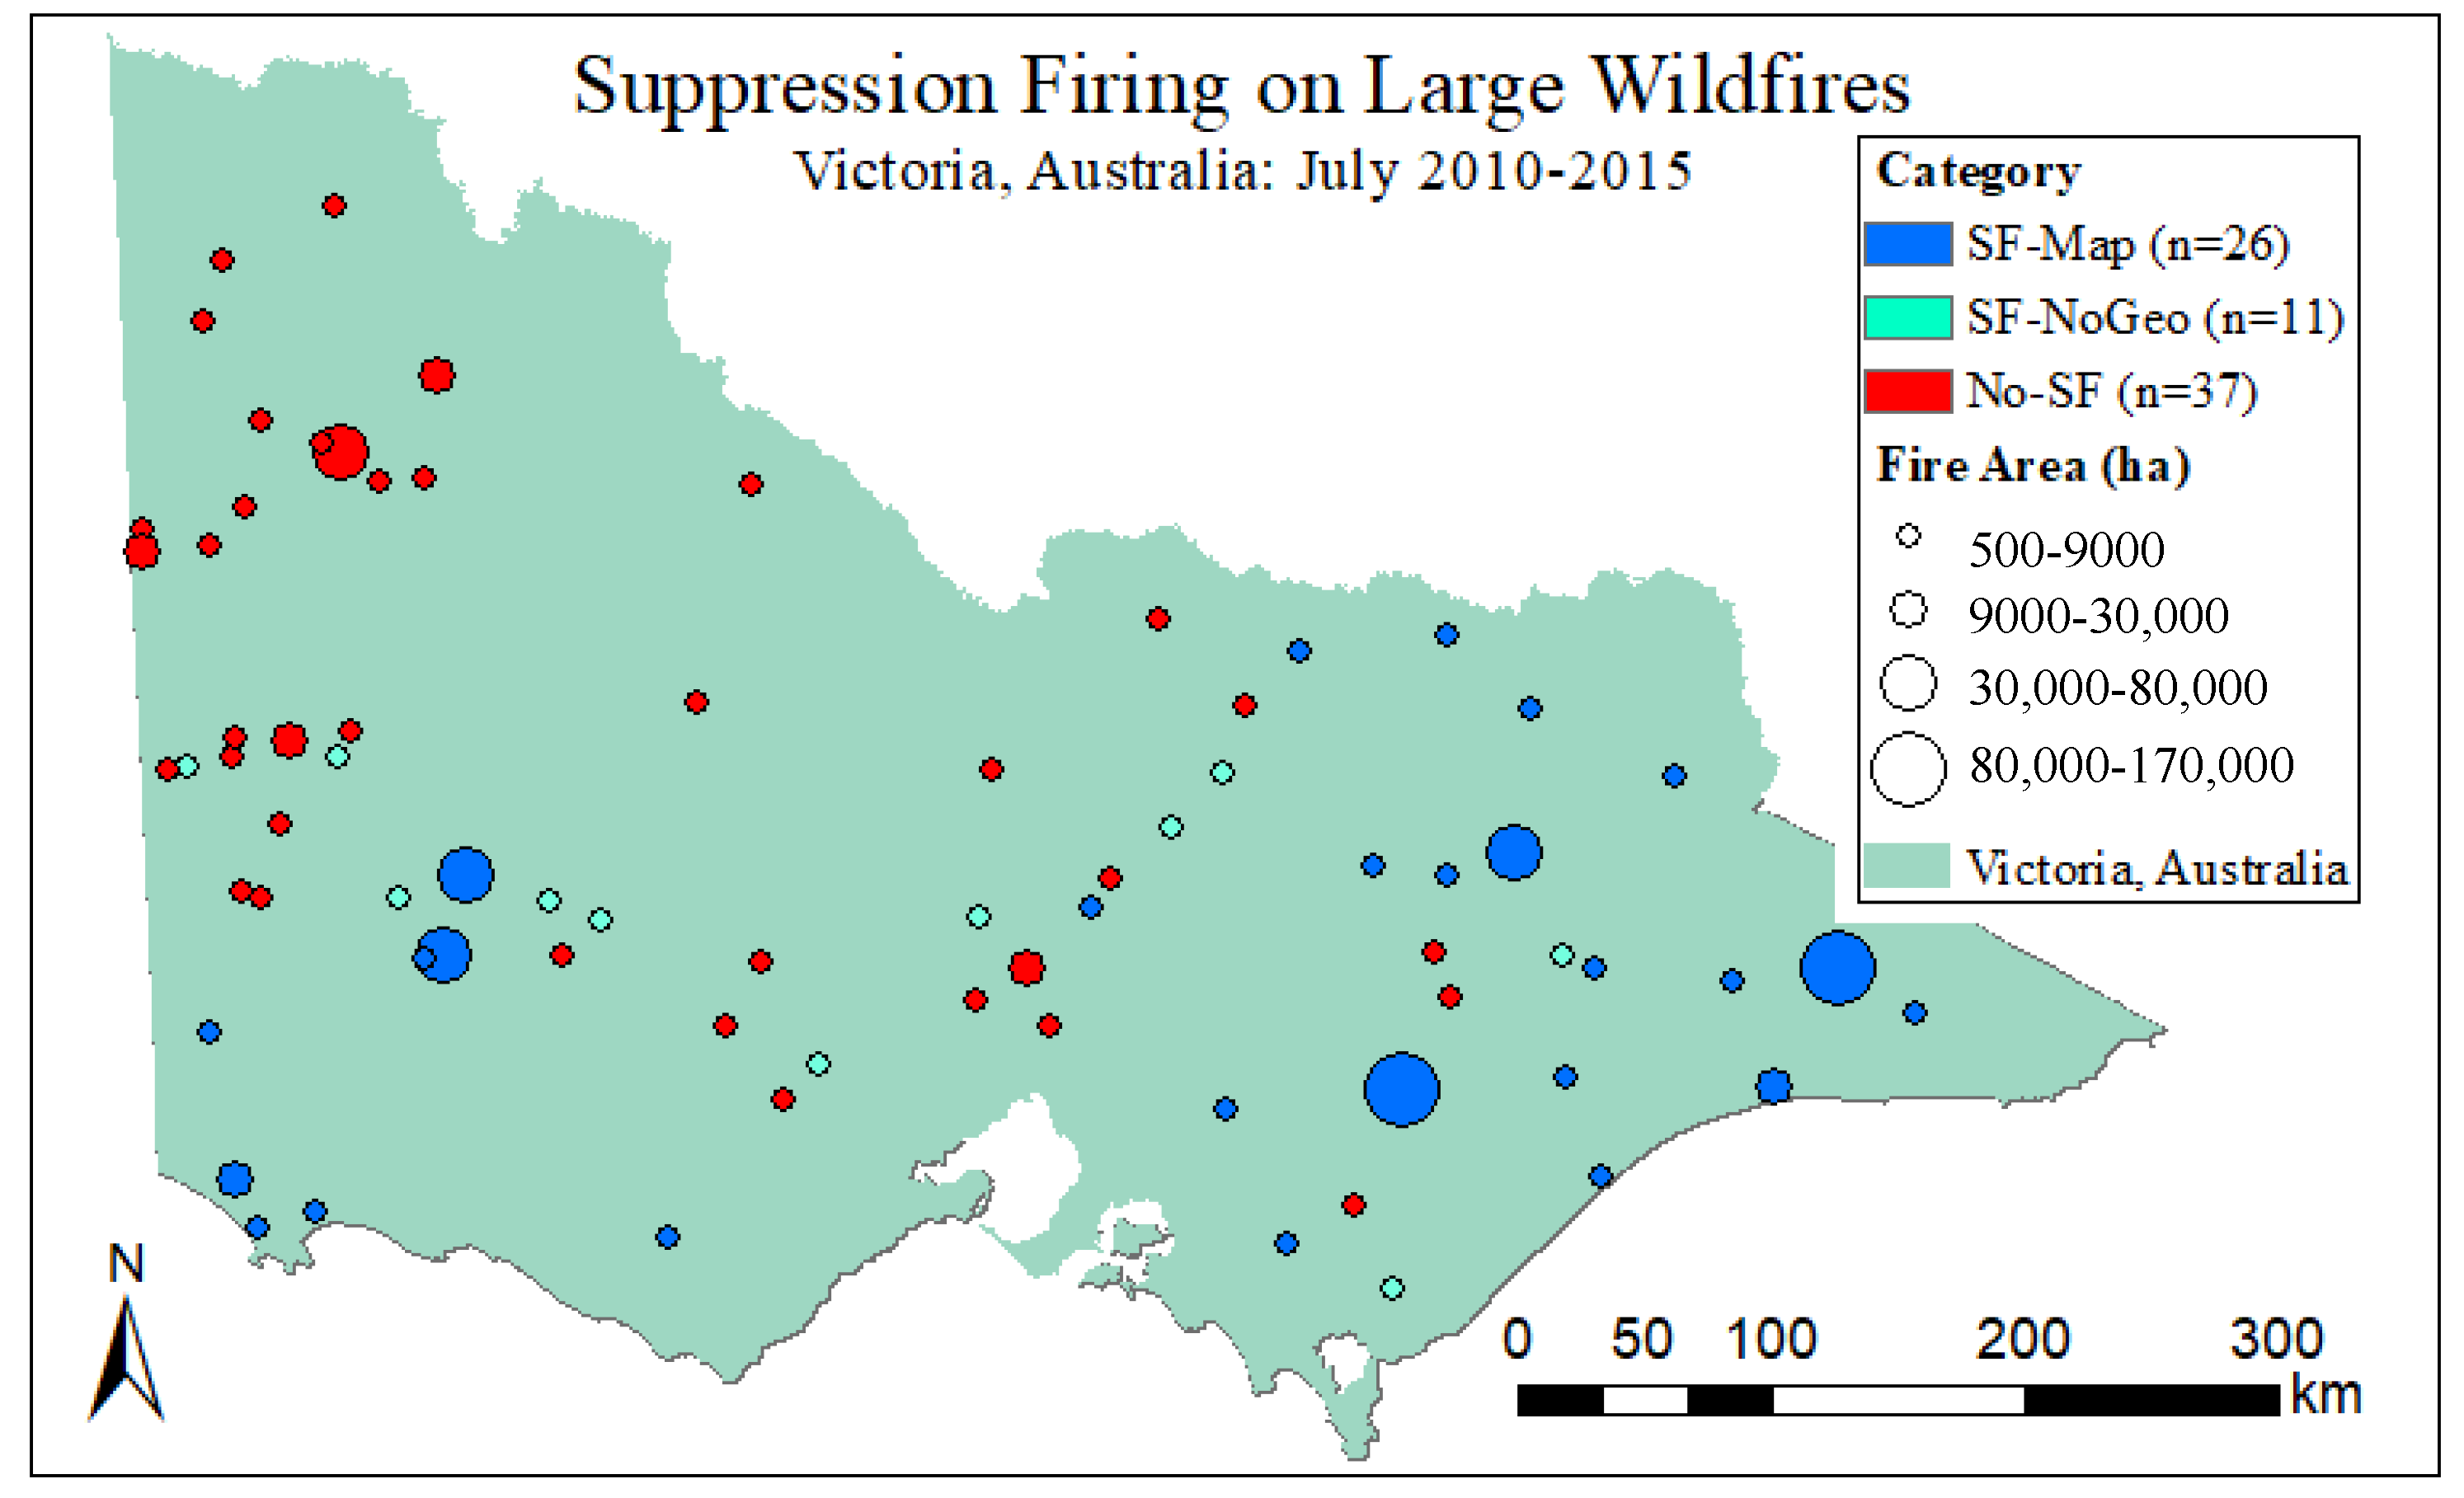
Figure 2.
The process of demarcating the suppression firing. (a) The final fire area (green) is overlayed with three fire progressions (beige, red, purple). (b) The suppression firing area is demarcated with black cross-hatching. (c) Hillside shading, roads, and other GIS layers were used to reconstruct the fire spread. The suppression firing area was identified in a series of line scans (d–f). Active burning is highlighted by red; recently burnt (still hot) by white; unburnt and cooled areas by grey with shading that varies with topographic features. (d) A gap is visible between the suppression fire and the fire, so the suppression firing area can be mapped accurately. (e) The suppression firing extends to the north as the fires merge in the south; the red cross-hatched area is suppression firing from the previous scan. (f) The suppression firing extends northwest; the previous extent is cross-hatched. As the burnt area cools and the fires merge it becomes increasingly difficult to demarcate the suppression firing. This suppression firing operation burned a total of ~9000 ha. In the final fire footprint, the suppression firing is indecipherable from fire as the remaining gap also burned. The area burned by the (1) suppression firing, (2) wildfire, and (3) combined (sum of suppression and wildfire) is shown in the graph (bottom right), which is colour-coded with each progression.

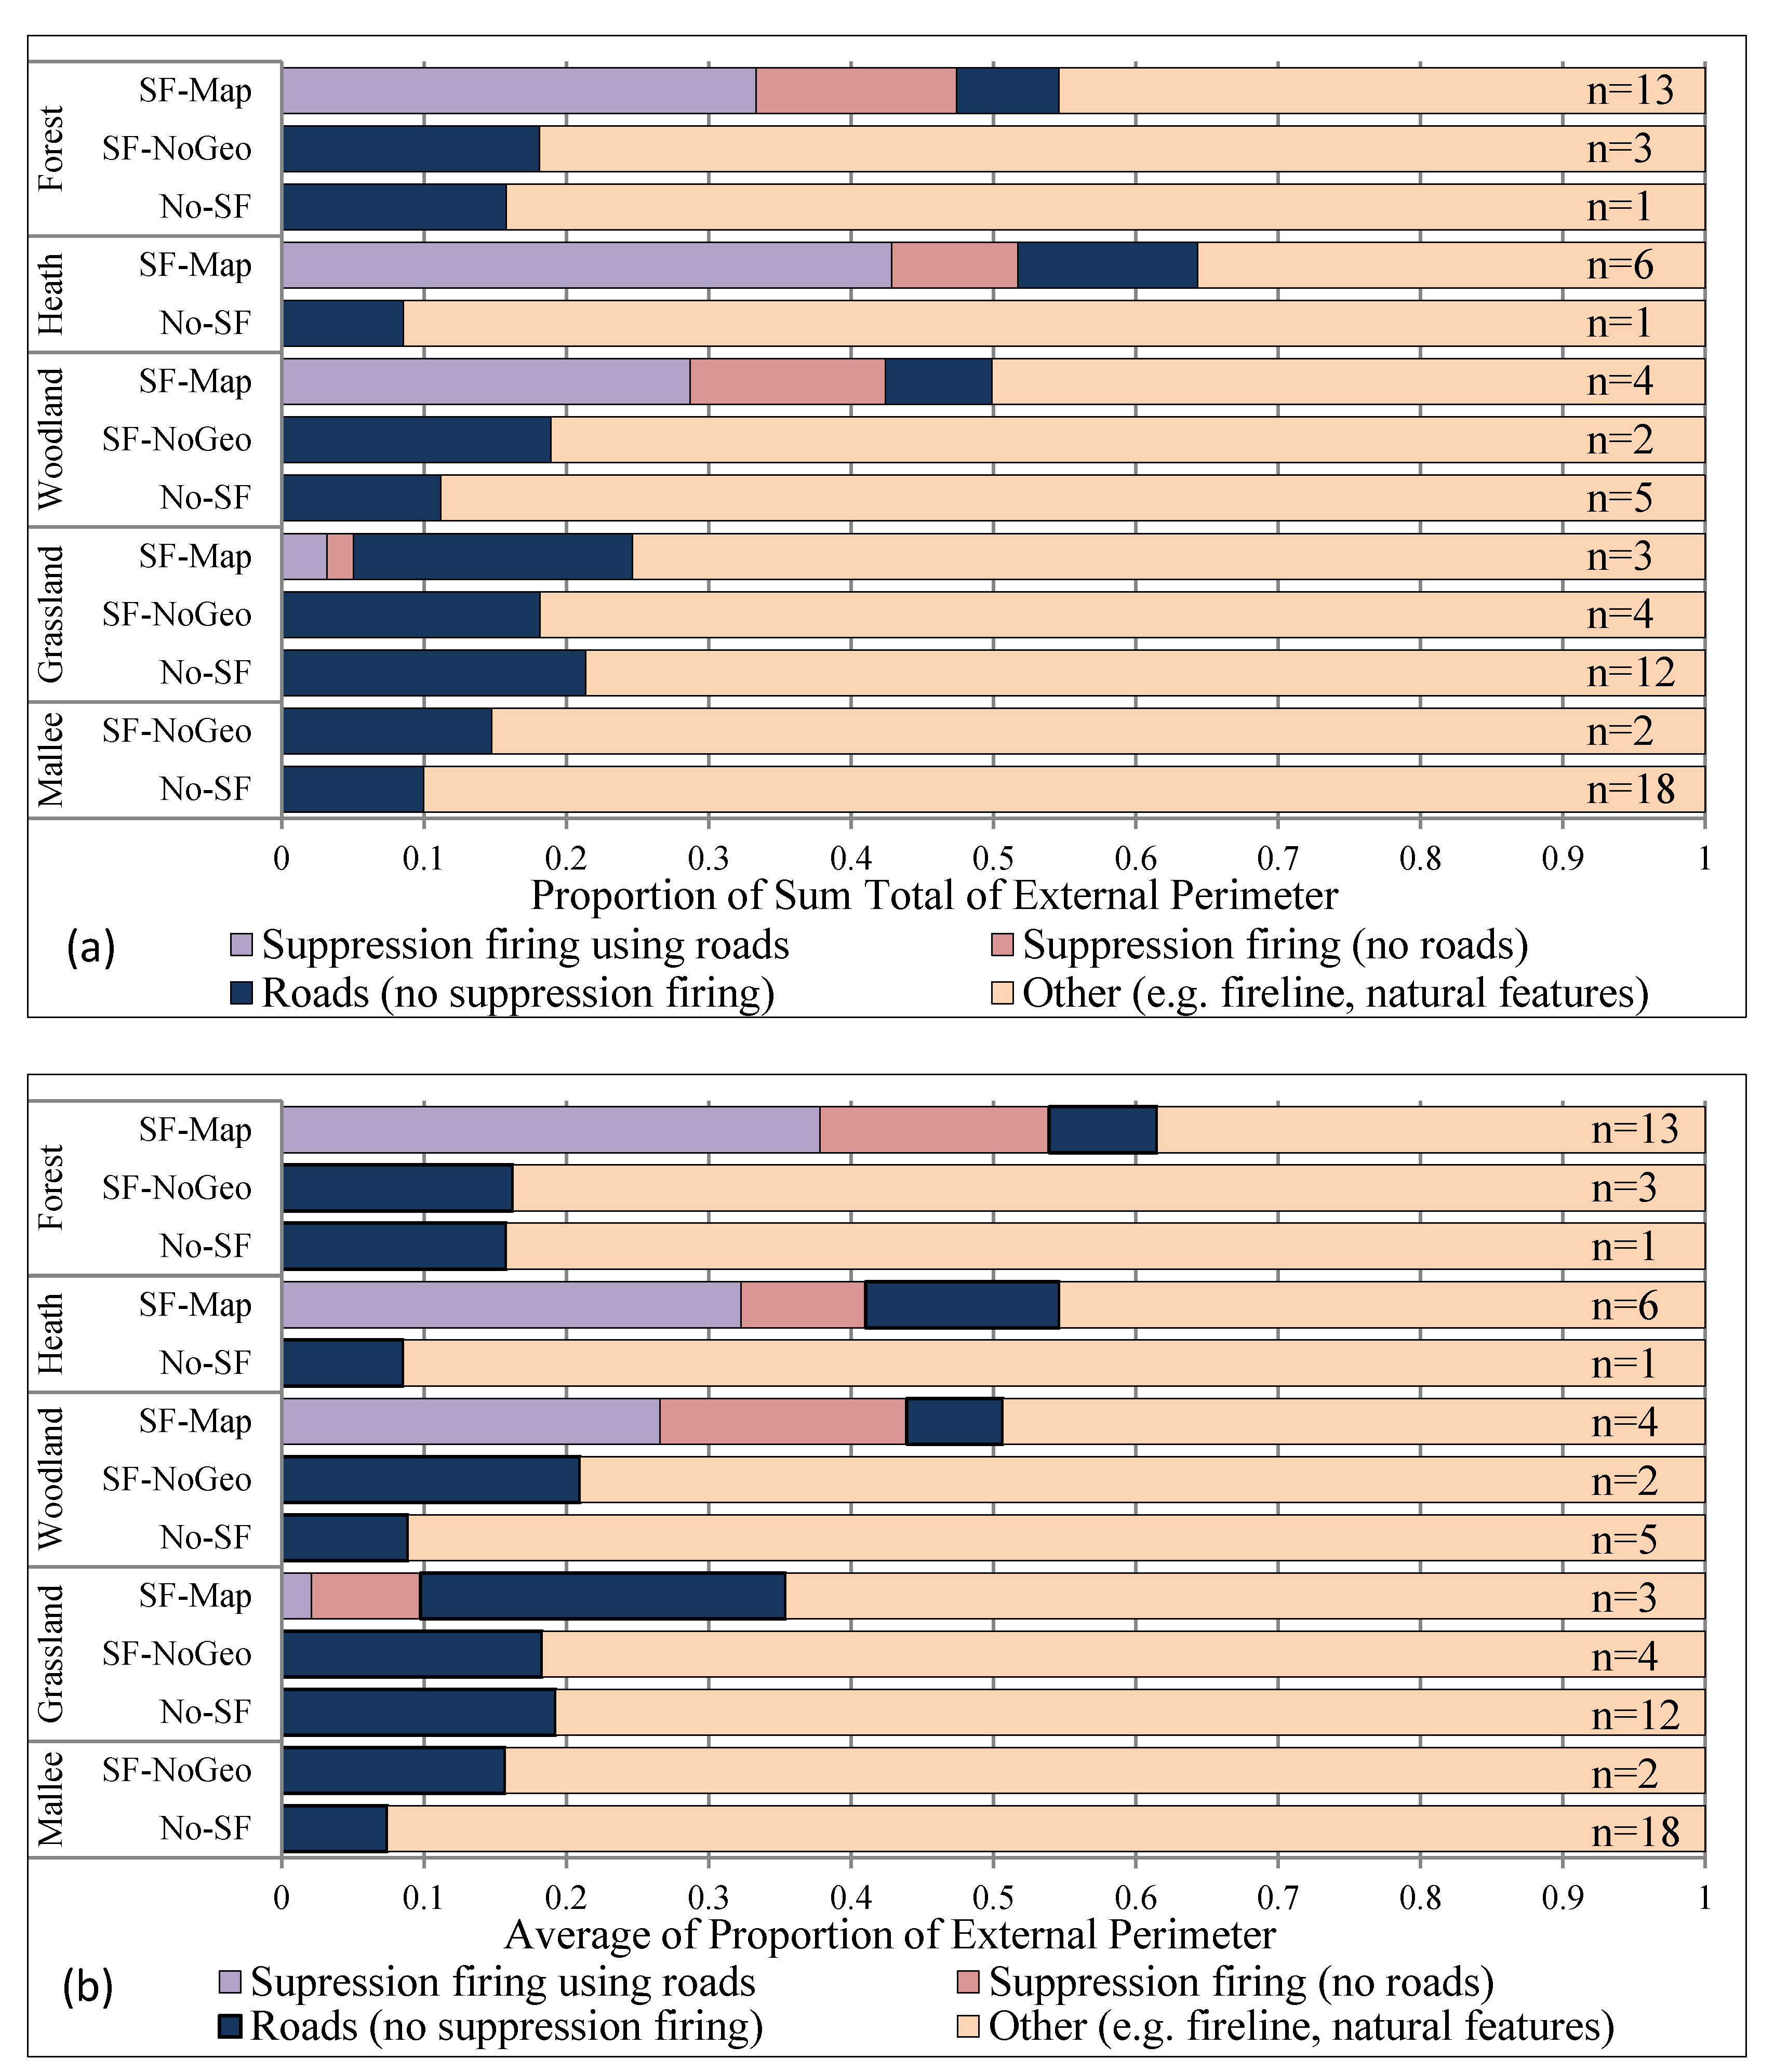
Figure 3.
Proportional containment: the proportion of external fire perimeter that was contained by roads, suppression firing (either along the road or not), or other features. As there is a wide range (1–100%) in the proportion of external fire perimeter contained by suppression firing, we present two graphs. (a) The top graph is proportioning the total perimeter of all the fires. (b) The bottom graph is an average of the proportions for each fire. Fires are grouped by dominant fuel type (forest, heath, woodland, grassland, mallee). SF-Map fires had mapped suppression firing. SF-NoGeo fires did not have enough geographic data to map the suppression firing that was indicated in the SitReps. No-SF had no evidence of suppression firing.

Figure 4.
An archetypal backburn. (a) Hillside shading is used to illustrate how the grayscale of the line scan images varies with topographic features. The line scan images (a,b,d,e) capture the progress of the backburn. Active burning is highlighted by red, recently burnt (still hot) by white, unburnt and cooled areas by grayscale. A GIS road layer (black lines) overlays the line scans. (c) Hillside shading is overlayed with the road layer (black lines). Fire progression polygons (beige and red) map the extent of the fire that is visible in line scans images (a,b). At 11:26, ~2 km was alight (beige progression); by 13:27, backburning progressed a further ~1.7 km along the road in a northeasterly direction (red progression). (d) By 23:51, the ignition of this ~9-km backburn is complete. Initial fire spread was modest extending a few hundred meters from the road. (e) The intervening fuels were left to in-fill burn over several days. (f) All four progressions (color polygons) overlay the hillside shading as well as the roads (black lines) and watercourses (blue lines). The timing of the line scan images (progression) is indicated with the white text boxes.
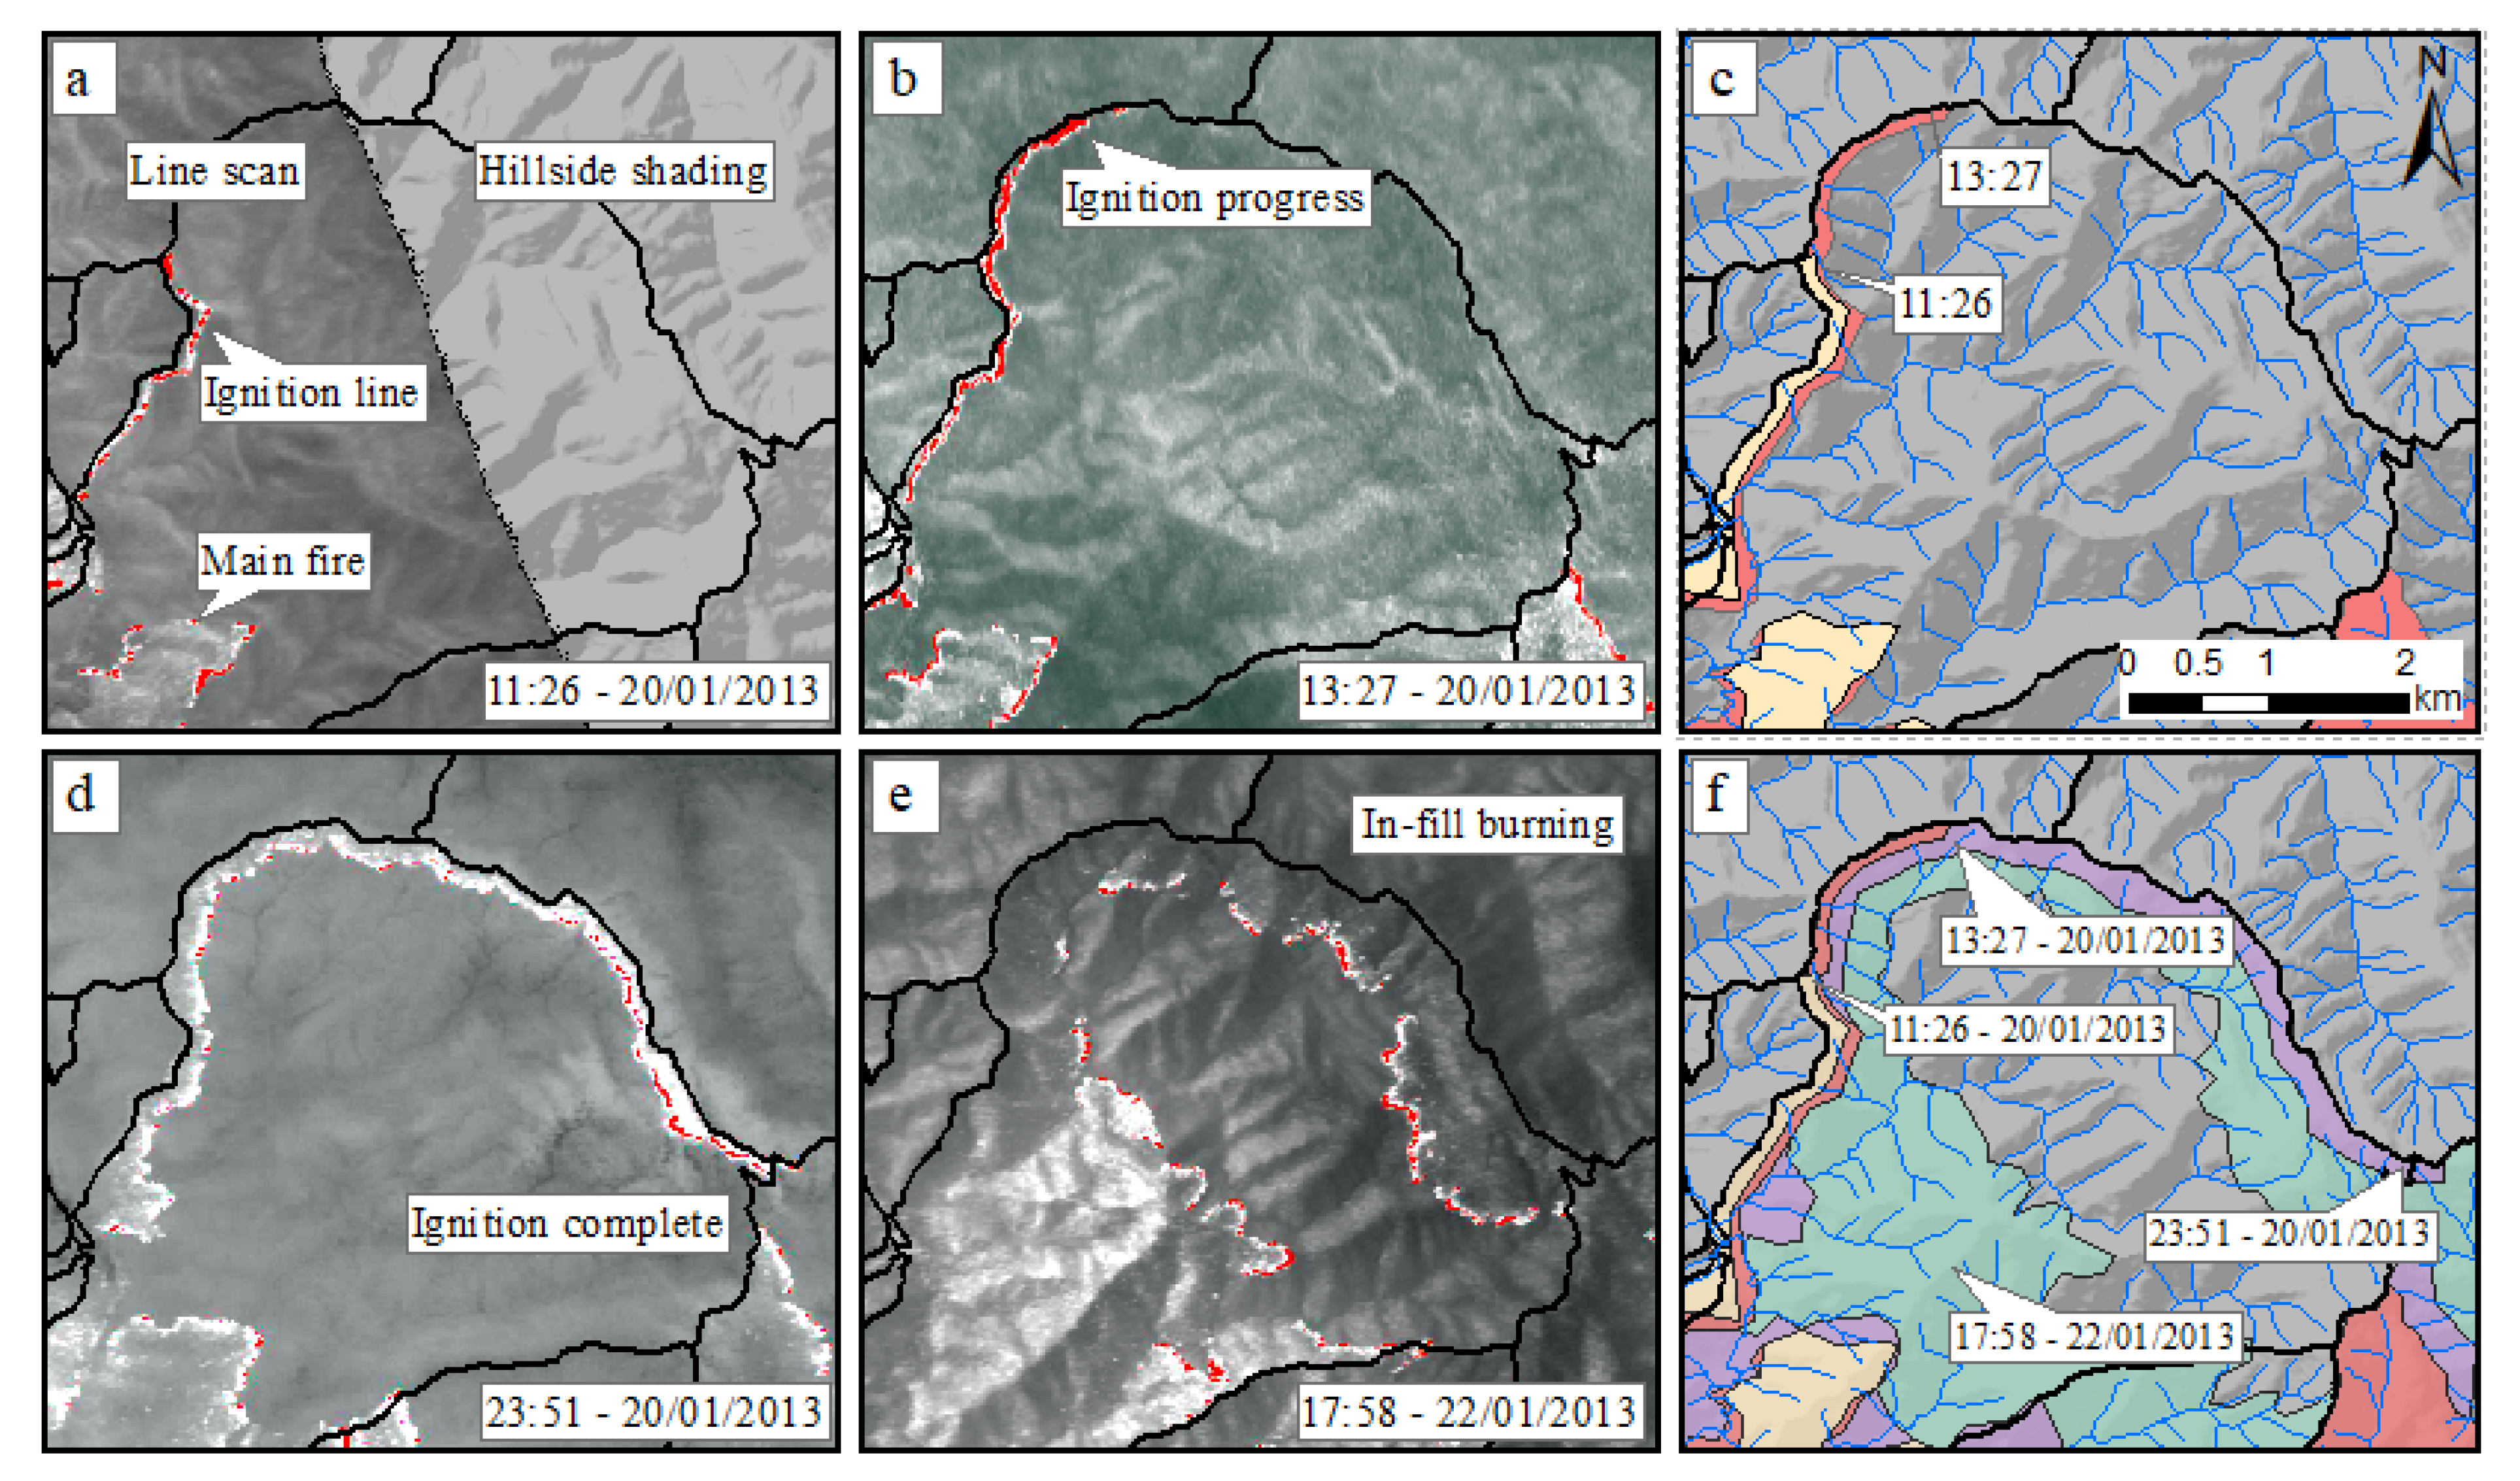
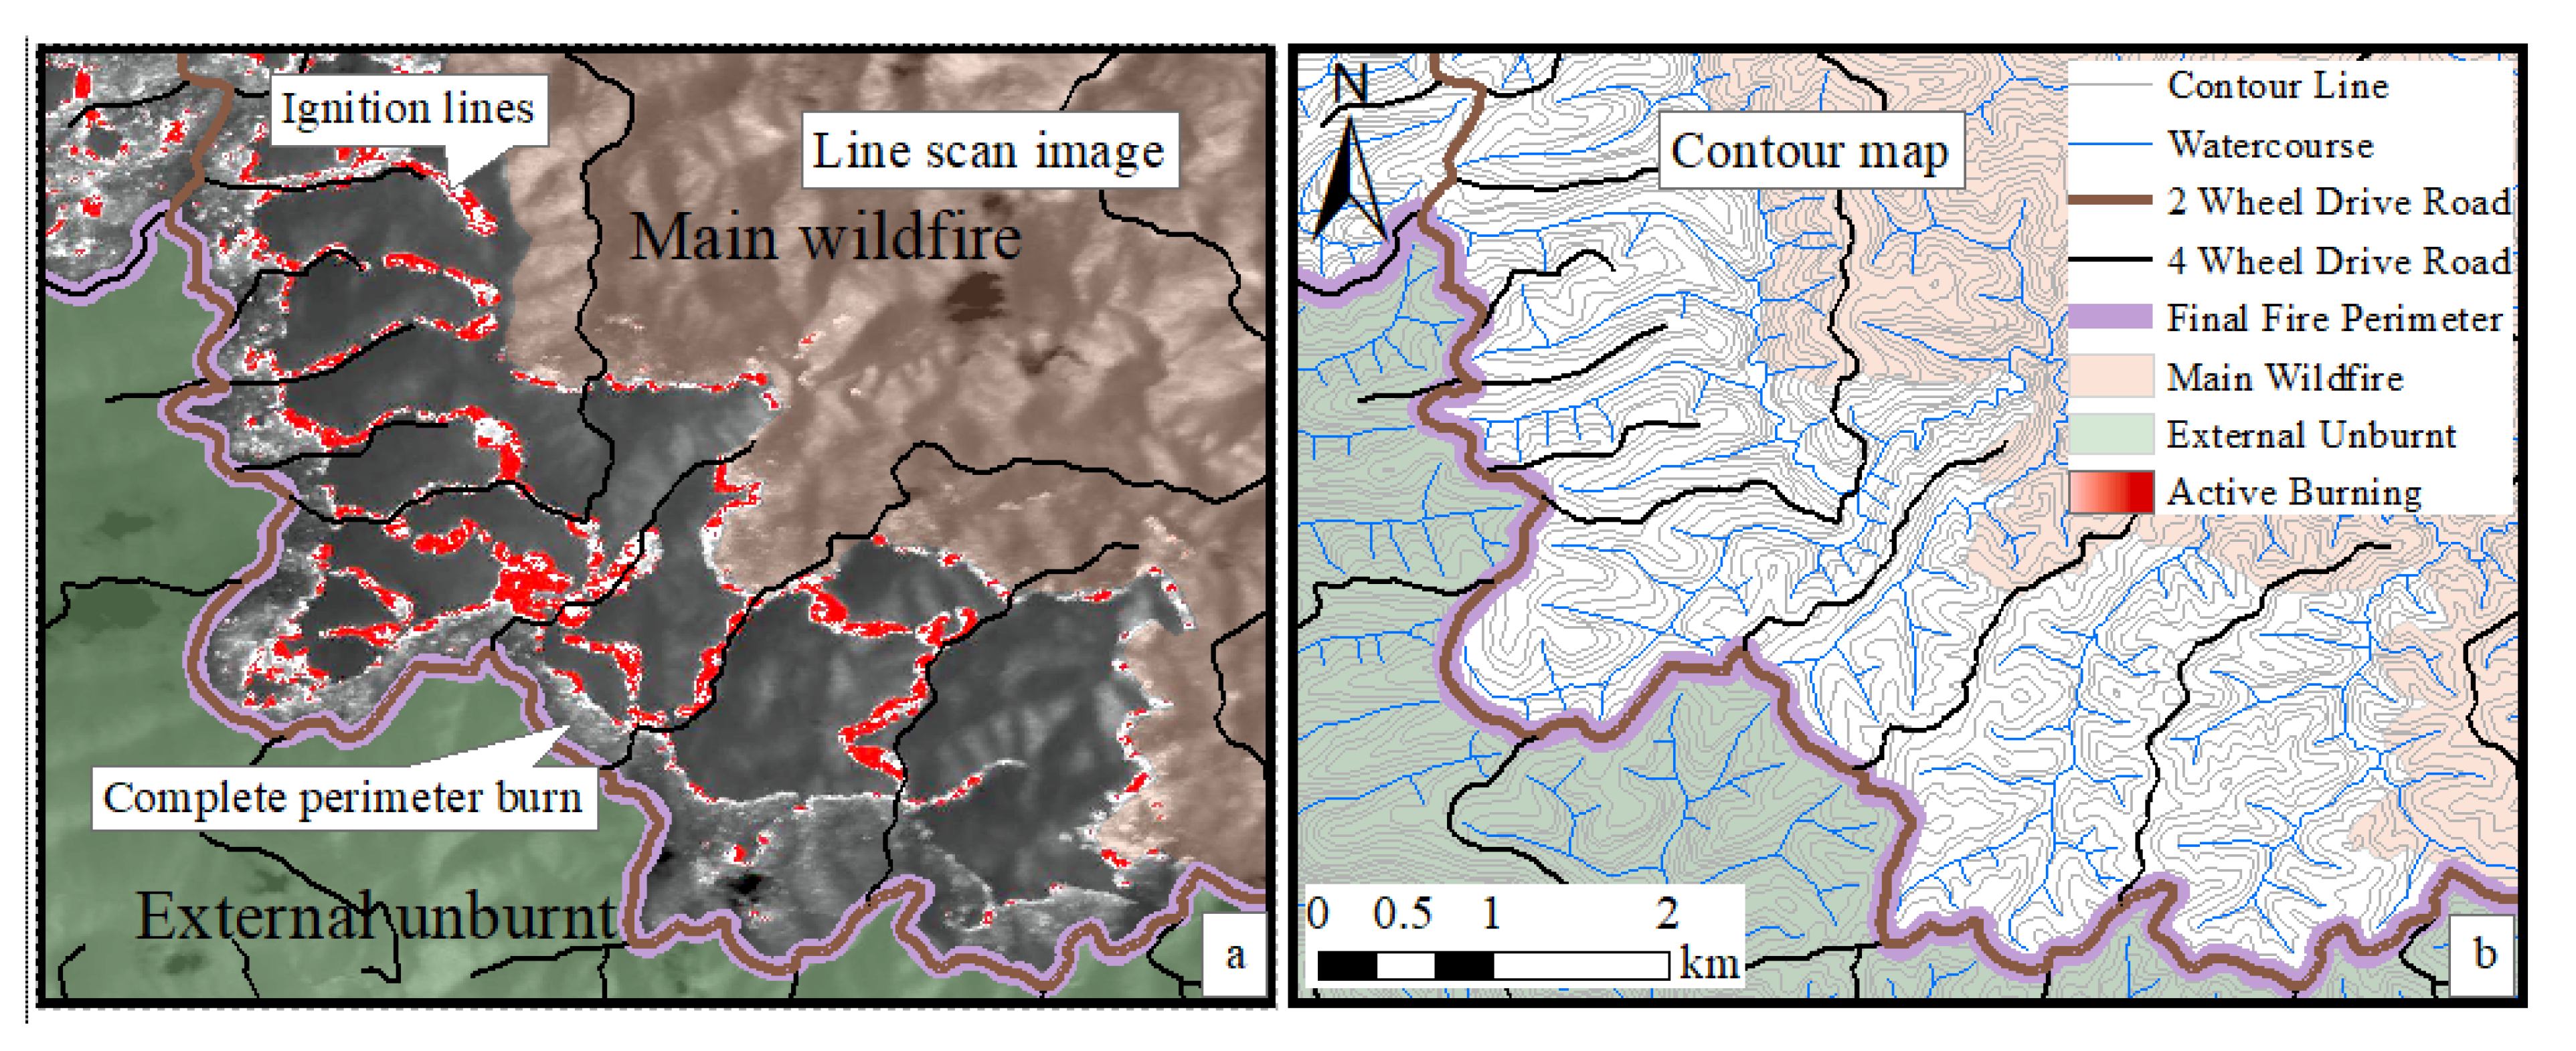
Figure 5.
(a) A burnout in-progress is captured in a line scan image that has been overlaid with GIS layers of the final fire perimeter, roads, and burn areas (see legend). A backburn was completed along the road to form the final fire perimeter. This ~1000-ha burnout encompasses the area of unburnt (greyscale) fuel and active fire (red) intervening the backburn and main fire, east of the brown two-wheel-drive road. (b) The ignition pattern of this burnout followed the existing road network and terrain features visible with the contour map. The aim was for the intervening fuel to burnout in a controlled manner with a low intensity backing fire burning downhill from the ridgelines.


Table 1.
Suppression firing definitions.
| Term | Definition |
|---|---|
| Suppression Firing 1 | The intentional application of fire for containment or control purposes during an unplanned fire event. Suppression firing used as an overarching term to encompass all firing operations (e.g., backburns, burnouts, and counter-fires). |
| Backburn 2 | “A fire started intentionally from a prepared line or other barrier to burn an area of flammable material in the path of an advancing fire in order to control that fire.” |
| Burnout 2 | “A fire set to consume islands of unburnt fuel inside the fire perimeter and between the fire edge and fireline.” |
| Counter-fire 1 | Suppression fire that: (a) occurs in the path, or near the projected path of a rapidly spreading fire, and; (b) results in a purposeful interaction to draw the counter-fire into the primary fire, or; (c) causes a significant interaction that changes the primary fire’s direction of spread. |
Table 2.
Examples of the variation in suppression firing definitions: Australia and the USA.
| Source | Term | Definition |
|---|---|---|
| Australia [12] | Backburn | “1. A fire started intentionally along the inner edge of a fireline during indirect attack operations to consume fuel in the path of a bushfire (Australia).” 2. “A counterfire commenced from within continuous fuel for the purpose of fighting a fire (New Zealand).” |
| Back burn | “A fire started intentionally from a prepared line or other barrier to burn an area of flammable material in the path of an advancing fire in order to control that fire.” | |
| Burn out | “1. A fire set to consume islands of unburnt fuel inside the fire perimeter and between the fire edge and fireline (Australia). 2. A counterfire commenced from a natural or previously constructed firebreak for the purpose of fighting a fire (New Zealand).” | |
| USA [17] (current) | Suppression firing | “The intentional application of fire to speed or strengthen control action on free-burning fires. Types of suppression firing include burning out, counter firing, and strip burning.” |
| Burning out | “Setting fire inside a control line to consume fuel between the edge of the fire and the control line.” | |
| Counter fire | “(1) Fire set between main fire and backfire to hasten spread of backfire. (2) Emergency firing to stop, delay, or split a fire front, or to steer a fire.” | |
| Strip burning | “Burning by means of strip firing.” | |
| Strip firing | “Setting fire to more than one strip of fuel and providing for the strips to burn together. Frequently done in burning out against a wind where inner strips are fired first to create drafts which pull flames and sparks away from the control line.” | |
| Backfire | “A fire set along the inner edge of a fireline to consume the fuel in the path of a fire or change the direction of force of the fire’s convection column.” | |
| Backfiring | “A tactic associated with indirect attack, intentionally setting fire to fuels inside the control line to slow, knock down, or contain a rapidly spreading fire. Backfiring provides a wide defense perimeter and may be further employed to change the force of the convection column.” | |
| USA [13] (p. 1) (1969) | Suppression firing | “The intentional application of fire to speed or strengthen control action on free-burning fires, suppression firing includes the following classifications: (1) counter firing, (2) burning out, (3) mopup burning.” |
| Counter firing | “Emergency firing in or near the projected path of a steady, high-intensity fire for the purpose of splitting or delaying the fire front, or to steer the fire in a desired direction.” | |
| Burning out | “The use of fire to widen control lines and to remove islands or wide strips of unburned fuel within control lines.” | |
| Mop-up burning | “The use of fire during the final stages of control efforts to remove islands of unburned fuel or extend the ‘black line’ of control.” |
Table 3.
Excerpt examples of SitRep comments that describe suppression firing.
| Activity | SitRep Excerpt | Fire Name |
|---|---|---|
| Preparation | “Machines tasked to brush up control lines to the north and south of fire ahead of expected backburning operations [32].” | Powelltown |
| Status | “Crews continuing to patrol and black out, Several hot spots are showing up around the area, with the main fire becoming more active—though not threatening lines—backburn and main fire are yet to converge—they should meet during today [33].” | Timbarra |
| Progress | “Crews have burnt out along the Eustace Gap Tk to the north to keep in front of active edge. Burning continued to approx. EV667442. South along Eustace Gap Tk burning extended to EV652411 [34].” | Corryong |
| Extent | “Cobboboonee Division Indirect attack involves completion of a backburn along Inkpot Rd, Heath Rd and South Kentbruck Tk a distance of approximately 20 km [35].” | Kentbruck |
Table 4.
Descriptive statistics of fire size by suppression firing category.
| Category | Count | Min (ha) | Max (ha) | Mean (ha) | Median (ha) | StdDev (ha) | Sum (ha) |
|---|---|---|---|---|---|---|---|
| SF-Map | 26 | 544 | 165,811 | 17,431 | 2850 | 36,506 | 453,208 |
| SF-NoGeo | 11 | 684 | 5518 | 2438 | 1818 | 1709 | 26,823 |
| No-SF | 37 | 508 | 56,544 | 5190 | 1210 | 10,732 | 192,022 |
| Total | 74 | 508 | 165,811 | 9082 | 1566 | 23,511 | 672,053 |
Table 5.
Count of fires by fuel type and suppression firing category.
| Fuel Type | SF-Map | SF-No-Geo | No-SF | Total |
|---|---|---|---|---|
| Forest | 13 | 3 | 1 | 17 |
| Heath | 6 | 0 | 1 | 7 |
| Woodland | 4 | 2 | 5 | 11 |
| Grassland | 3 | 4 | 12 | 19 |
| Mallee | 0 | 2 | 18 | 20 |
| Total | 26 | 11 | 37 | 74 |
Publisher’s Note: MDPI stays neutral with regard to jurisdictional claims in published maps and institutional affiliations. |
© 2021 by the authors. Licensee MDPI, Basel, Switzerland. This article is an open access article distributed under the terms and conditions of the Creative Commons Attribution (CC BY) license (https://creativecommons.org/licenses/by/4.0/).
Share and Cite
MDPI and ACS Style
Simpson, H.; Bradstock, R.; Price, O. Quantifying the Prevalence and Practice of Suppression Firing with Operational Data from Large Fires in Victoria, Australia. Fire 2021, 4, 63. https://0-doi-org.brum.beds.ac.uk/10.3390/fire4040063
AMA Style
Simpson H, Bradstock R, Price O. Quantifying the Prevalence and Practice of Suppression Firing with Operational Data from Large Fires in Victoria, Australia. Fire. 2021; 4(4):63. https://0-doi-org.brum.beds.ac.uk/10.3390/fire4040063
Chicago/Turabian StyleSimpson, Heather, Ross Bradstock, and Owen Price. 2021. "Quantifying the Prevalence and Practice of Suppression Firing with Operational Data from Large Fires in Victoria, Australia" Fire 4, no. 4: 63. https://0-doi-org.brum.beds.ac.uk/10.3390/fire4040063