
Analysis of Trends in the FireCCI Global Long Term Burned Area Product (1982–2018)


1
Grupo de Investigación en Teledetección Ambiental, Departamento de Geología, Geografía y Medio Ambiente, Universidad de Alcalá, Colegios 2, 28801 Alcalá de Henares, Spain
2
Forest Research Centre, School of Agriculture, University of Lisbon, Tapada da Ajuda, 1349-017 Lisbon, Portugal
*
Author to whom correspondence should be addressed.
Fire 2021, 4(4), 74; https://0-doi-org.brum.beds.ac.uk/10.3390/fire4040074
Submission received: 17 August 2021
/
Revised: 13 October 2021
/
Accepted: 14 October 2021
/
Published: 17 October 2021
Abstract
:We present an analysis of the spatio-temporal trends derived from long-term burned area (BA) data series. Two global BA products were included in our analysis, the FireCCI51 (2001–2019) and the FireCCILT11 (1982–2018) datasets. The former was generated from Moderate Resolution Imaging Spectroradiometer (MODIS) 250 m reflectance data, guided by 1 km active fires. The FireCCILT11 dataset was generated from Land Long-Term Data Record data (0.05°), which provides a consistent time series for Advanced Very High Resolution Radiometer images, acquired from the NOAA satellite series. FireCCILT11 is the longest time series of a BA product currently available, making it possible to carry out temporal analysis of long-term trends. Both products were developed under the FireCCI project of the European Space Agency. The two datasets were pre-processed to correct for temporal autocorrelation. Unburnable areas were removed and the lack of the FireCCILT11 data in 1994 was examined to evaluate the impact of this gap on the BA trends. An analysis and comparison between the two BA products was performed using a contextual approach. Results of the contextual Mann-Kendall analysis identified significant trends in both datasets, with very different regional values. The long-term series presented larger clusters than the short-term ones. Africa displayed significant decreasing trends in the short-term, and increasing trends in the long-term data series, except in the east. In the long-term series, Eastern Africa, boreal regions, Central Asia and South Australia showed large BA decrease clusters, and Western and Central Africa, South America, USA and North Australia presented BA increase clusters.
1. Introduction
Fire is a global phenomenon that affects ecosystems and the atmosphere [1,2,3,4]. It is a critical component of the Climate System and therefore it has been identified as one of the Essential Climate Variables (ECVs) by the Global Climate Observing System [1]. Consequently, Fire Disturbance was selected as one of the projects of the Climate Change Initiative (CCI) Programme of the European Space Agency (ESA). FireCCI aims to produce consistent, long-term and global Burned Area (BA) datasets, mostly oriented towards climate modellers [5]. This BA information is critical to assess the environmental impacts of biomass burning, as well as to analyse fire regime characteristics and temporal changes.
During the last two decades, several global BA datasets have been produced and made available to the international community [6]. The most reliable ones are based on the Moderate Resolution Imaging Spectroradiometer (MODIS) sensor, including the MCD64A1 (NASA’s official product: [7]) and the FireCCI51 (ESA CCI’s official product: [8]). The spatial resolution of these datasets is 500 m and 250 m, respectively, and they cover a time span of 20 years (2001 up to date).
Despite the interest of short time series products, several authors have indicated the convenience of generating a longer time series to extend the analysis of global fire-environment relationships [1]. Climate modellers [6,9] recommended extending the BA datasets backwards, using historical data, to improve their knowledge on climate dynamics [10]. The obvious choice for a long-term product would be based on the Advanced Very High Resolution Radiometer (AVHRR) sensor, on board the National Oceanic and Atmospheric Administration (NOAA) satellites since 1979. However, the lack of a global and consistent archive of AVHRR-NOAA data at its full original resolution (approx. 1 km2) was preventing the community from undertaking this effort. An alternative was to use a coarser resolution dataset, based on the Global Area Coverage (GAC: 4 × 4 km) format of the AVHRR sensor. NASA delivered a corrected time series, named Land Long-Term Data Record (LTDR, [11]), which assembles GAC data at 0.05-degree resolution from 1981 to 2021 (although after 2018 the dataset is quite noisy).
In spite of the challenges of detecting BA from this coarse resolution, with the limited spectral resolution of AVHRR and lacking active fire information, a BA product based on this time series has been recently released within the FireCCI project. The product is named FireCCILT11 [12], and covers the period from 1982 to 2018. It was based on a previous beta version published in 2019 [13], trying to mitigate its temporal inconsistencies.
Trend analyses have been quite common in the remote sensing literature, including for temperature [14] and vegetation [15,16,17]. The trend analysis of global BA datasets has been conducted at a regional [18,19,20] and global [21,22,23] scale. These studies aimed to detect regional variations of trends, to identify contrasting temporal changes. For instance, Andela, et al. [21] analysed global trends in BA, showing regions with increasing and decreasing trends, linked mainly to regional land use changes.
Regarding BA analysis, regional studies used long-term data but global studies used short-term data, although they were not limited geographically. Silva, et al. [18] analysed the spatial and temporal trends of BA in the Iberian Peninsula and Urbieta, et al. [19] studied spatio-temporal changes in fire frequency and size in Spain. Both of these studies dealt with time series for over 30 years. Zubkova, et al. [20] analysed changes in fire activity in Africa from 2002 to 2016, while Andela, et al. [21] analysed long-term trends in burned area for the period 1998–2015, based on the fourth version of Global Fire Emissions Database (GFED4, [24]). Earl and Simmonds [23] studied global and regional spatiotemporal fire trends from 2001 to 2016 using active fires of MODIS (MOD14A1), and Forkel, et al. [22] analysed global and regional BA trends from 1996 to 2015 with GFED4 and FireCCI50 data [5].
The objective of this study was to analyse global trends in BA using the FireCCILT11 long-term BA product, which extends almost 20 years (1982–2018) backwards from the other available BA datasets. The introduction of FireCCILT11 is a novelty in this kind of analysis. We aimed to detect areas where BA time series displayed significant positive or negative trends, and evaluate whether trends were consistent at different time spans and spatial resolutions.
2. Materials and Methods
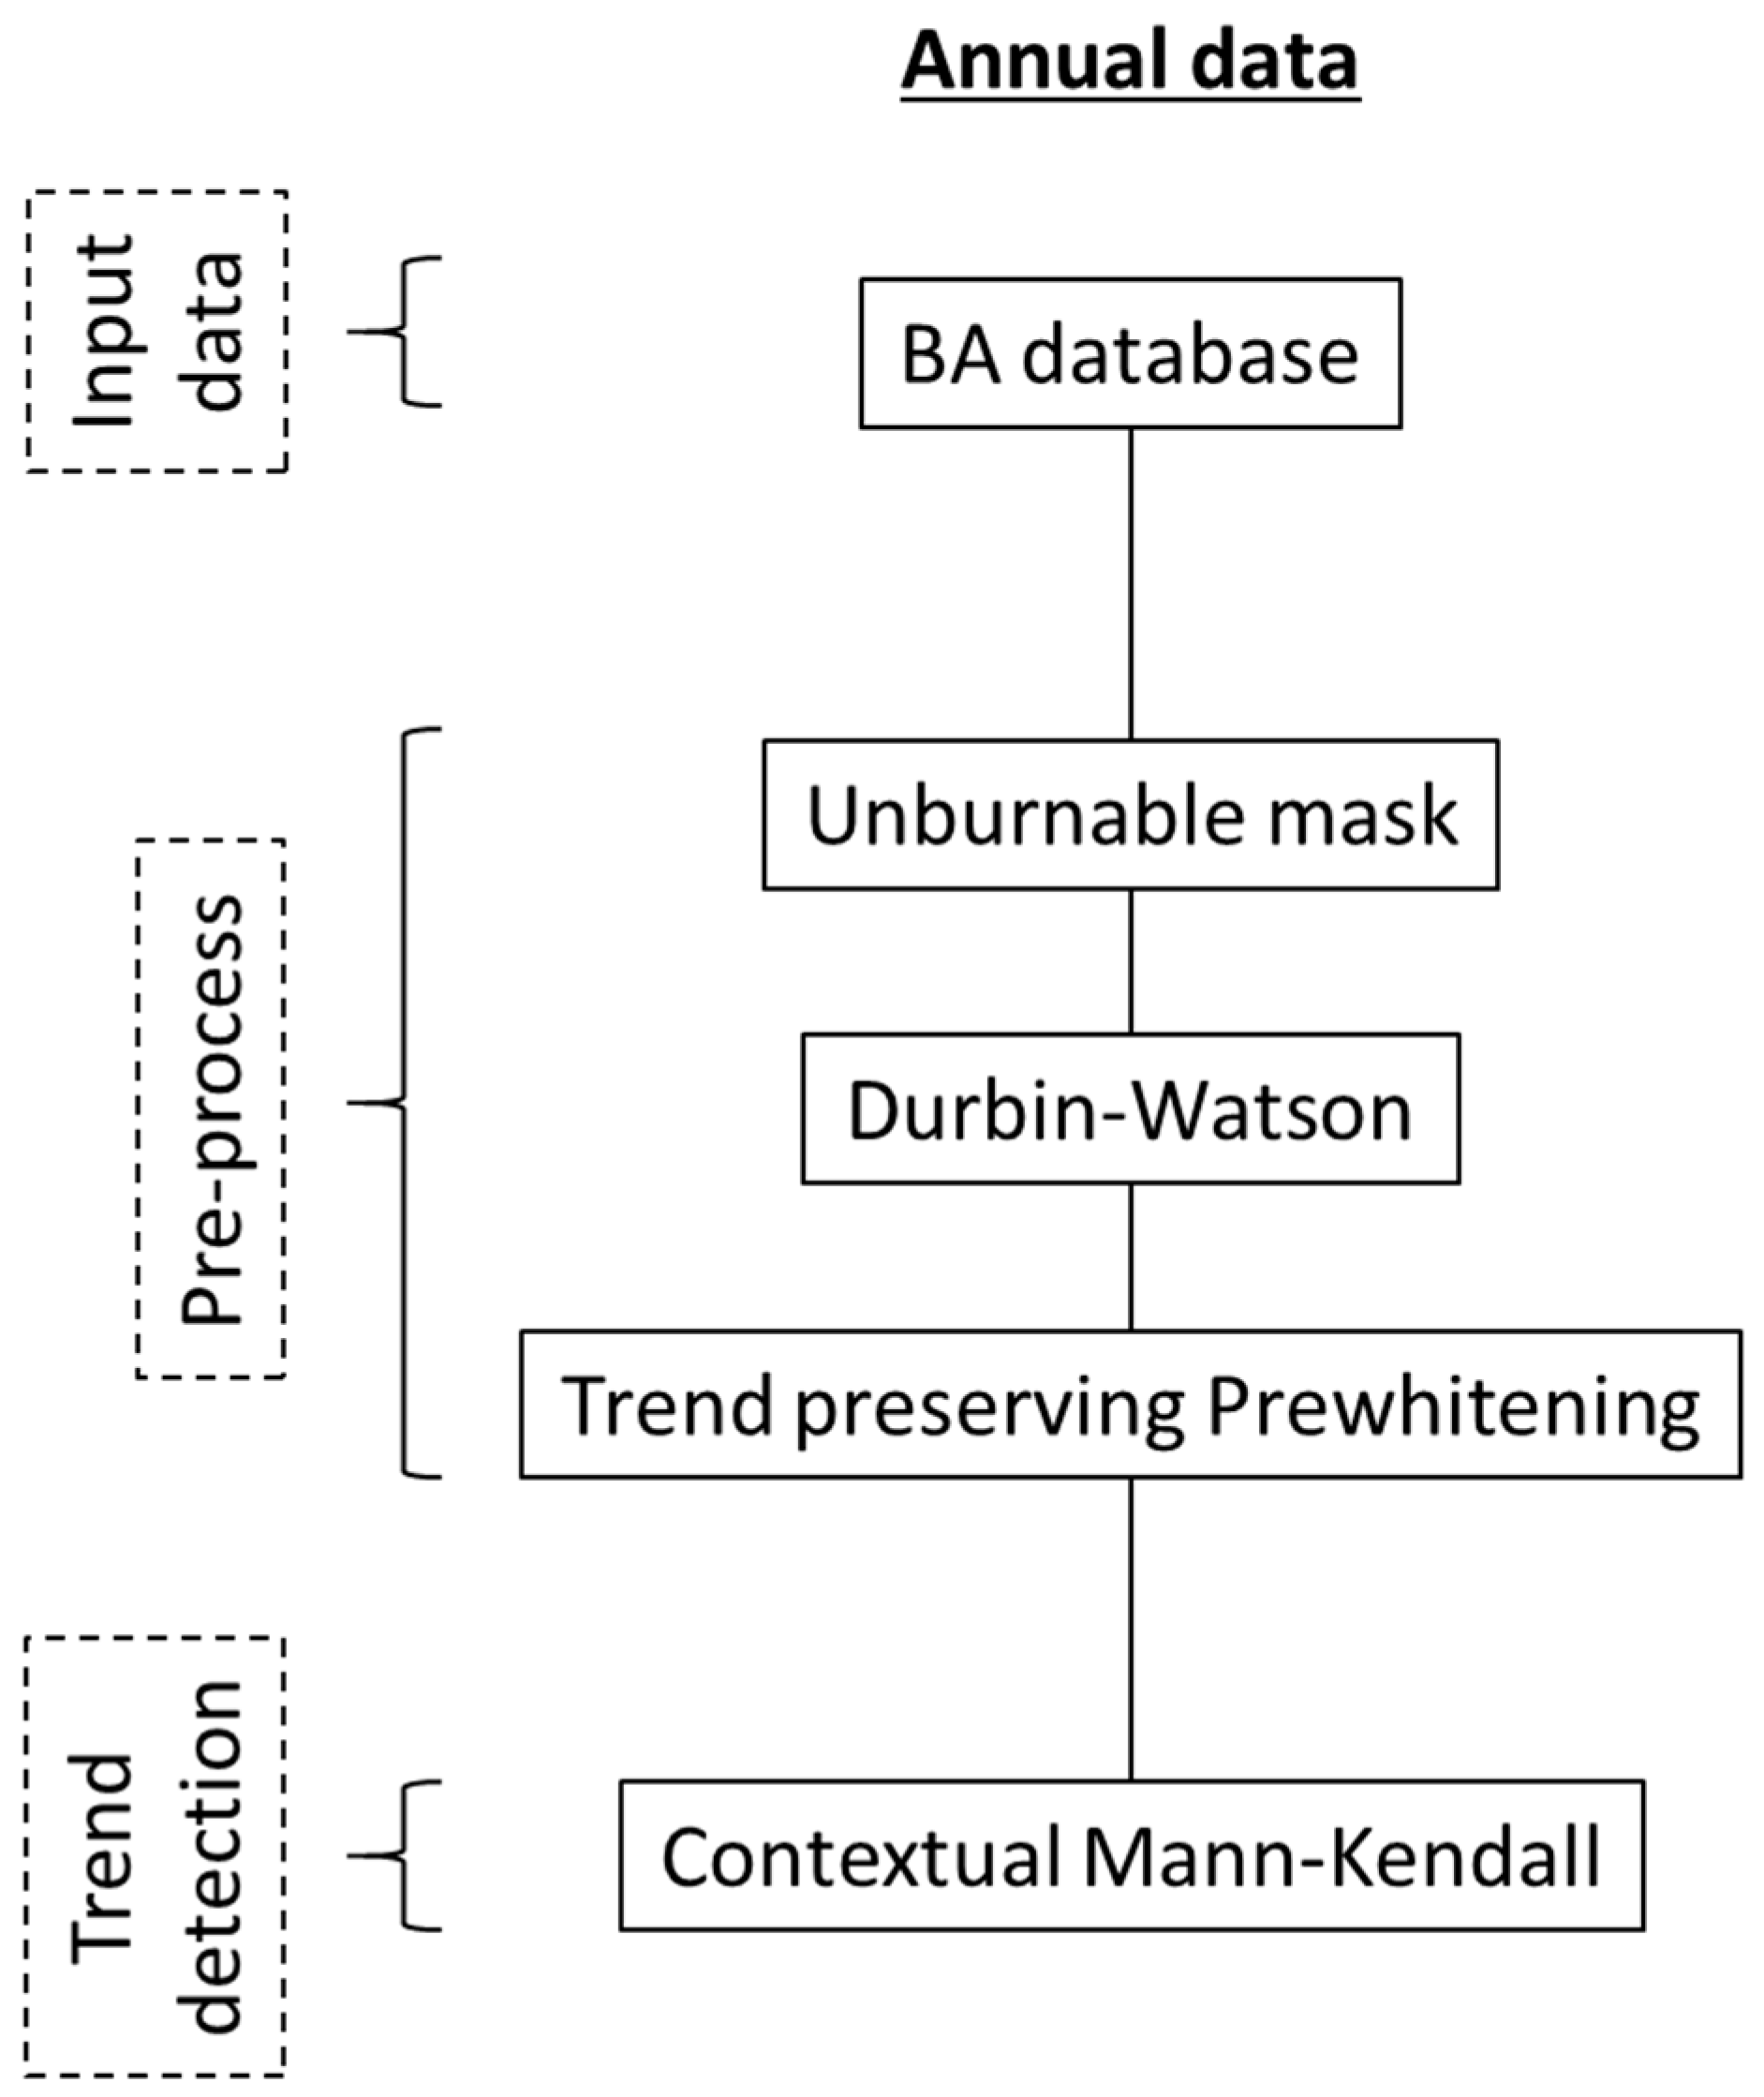
The three main steps of our trend mapping methodology are shown in Figure 1.
2.1. Data
First, the temporal and spatial series of two global burned area products, FireCCILT11 [12] and FireCCI51 [8] were obtained. Both products were included in the trend analysis to clarify the impact of spectral and spatial resolution, on one hand, and the length of the time series, on the other, in the significance of the detected trends.
2.1.1. FireCCILT11
Global long-term BA information was obtained from the FireCCILT11 product [12], which is the longest (1982–2018) global BA dataset currently available based on satellite images. The FireCCILT11 product does not include the year 1994 due to a long gap of ten months caused by the extended noise and sensor degradation of the original AVHRR images, which makes the LTDR data useless for BA mapping. FireCCILT11 includes monthly BA data estimates at 0.05° cell resolution, although the formatted product also offers monthly BA summaries at 0.25° resolution. BA detection was based on the LTDR-AVH09 product, generated by NASA from the AVHRR 2/3 sensors using seven NOAA satellites. Although the coarse resolution of the LTDR data hampers accurate detection of burned pixels, the FireCCILT11 product has shown consistent trends with other global BA products, as well as with national fire perimeters [25,26,27] of those regions where long-term fire statistics exist [12]. In addition, FireCCILT11 was long-term validated [28] and both AVHRR periods presented similar accuracy.
2.1.2. FireCCI51
The second global BA product used in our trend analysis was the FireCCI51 [8] dataset, also developed within the CCI programme. The product covers the period 2001–2019, and offers monthly BA data at 250 m and 0.25° resolution. This dataset was used to calibrate the classification algorithm used to generate the FireCCILT11 product, and therefore both products are quite consistent in the common temporal period. The FireCCI51 dataset was generated from MODIS 250 m reflectance data, guided by 1 km active fires images. Both products are freely downloadable from the ESA CCI data portal [29].
2.1.3. Analysis of Burned Area Datasets
Several factors were considered to analyse the impact of the datasets on the detection of trends. First, the impact of spatial resolution was tested by running the process on each product at several resolutions: the original detail of the FireCCILT11 product (0.05°), the summary BA provided by the official formatted product at 0.25°, and the commonly used climate modelling grid at 0.5° resolution.
Another important issue was the potential effect of the 1994 gap of the FireCCILT11 product. To test the effect of this gap, in addition to the original FireCCILT11 dataset (used as control), three BA products were created using several criteria to fill the 1994 gap by means of: (a) the maximum value of BA at each grid cell in the time series, (b) the minimum value of BA at each grid cell in the time series, (c) the mean value of BA at each grid cell in the time series.
2.2. Pre-Processing
Second, the input data were pre-processed according to the previous dataset analysis (Section 2.1.3). Unburnable areas were discarded using a global Land Cover (LC, [30,31]) product. Temporal autocorrelation was detected using the Durbin-Watson statistic [32], and was removed using trend-preserving prewhitening [33].
2.2.1. Unburnable Mask
Global and annual LC information is available from the ESA’s CCI Land Cover v2.0.7 (CCI-LC, [30]) product and the Copernicus Climate Change Service (C3S) Global Land Cover (C3S-LC, [31]) products v2.1.1. These products are annual, CCI-LC from 1992 to 2015 and C3S-LC from 2016 to 2020, and the combination of both extends from 1992 to 2020. They have a spatial resolution of 300 m and are fully consistent with each other [34]. We generated a burnable land mask [12], reclassifying the land cover information into burnable and unburnable binary classes, and resampling it to the AVH09 resolution (0.05 degrees) using the criteria that if any pixel is burnable then the whole grid cell is classified as burnable. Unburnable areas correspond to the land cover classes bare soil, water, urban areas, and permanent snow and ice, while the burnable areas are all the vegetated classes in the land cover products. After that process, a single land cover mask was created, keeping only the grid cells that were burnable during the whole time series, to avoid no-data issues in the dataset.
2.2.2. Temporal Autocorrelation
Trend analysis requires pre-processing to mitigate the effects of temporal autocorrelation [33,35]. Temporal autocorrelation is the absence of independence between observations in a time series. It may lead to false rejections of the null hypothesis (type I error) and to overestimation of trend significance [36], and affects the variance of the Mann-Kendall test statistic [35]. We relied on the Durbin-Watson test [32] to assess temporal autocorrelation and on the pre-whitening procedure of Wang and Swail [33] to remove it. The pre-whitened time series displays the same trend as the original series, but their data are free of temporal autocorrelation [33].
2.3. Trend Detection
After addressing the spatial resolution, unburnable areas and temporal autocorrelation in both datasets, and the 1994 data gap issue in the long-term dataset, annual BA spatiotemporal trends were analysed.
Contextual and temporal trends were generated with the contextual Mann-Kendall (CMK) approach [15] and the slope estimation for annual data. The Mann-Kendall test [37,38] is a classic non-parametric test to assess monotonic trends [39], which addresses each cell independently, assuming independent data. Neeti and Eastman [15] developed the contextual Mann-Kendall (CMK) test, a version of the original test that assesses trends in a 3 × 3 cell spatial neighbourhood centred at each cell in a regular grid. The rationale for the CMK test is to rely on local spatial autocorrelation, which takes into account a cluster of neighbour pixels, reducing the noise contributed by remote trends of individual pixels and producing more reliable trend significance estimates [40]. However, the CMK test also assumes data independence, but reliance on a local spatial window reduces the data variance, resulting in increased likelihood of false trend detection [35]. This effect was taken into account by adjusting the variance, following the approach of Douglas, et al. [36].
The slope of the BA trend in each grid cell was estimated with the non-parametric Theil-Sen (TS) regression [41,42]. This slope estimator is given by the median of the slopes calculated between observations at all pair-wise time steps. The TS estimator is very robust to the presence of outliers, such that it can tolerate up to 29.3% (breakdown point) bad observations in its input data-points without degradation of its slope estimation accuracy. This estimator is recommended for time series with large inter-annual variability such as annual BA, or data gap such as 1994 in the FireCCILT11 product. The significance of CMK trend was tested using the Z-score, selecting a confidence level of 95% (p ≤ 0.05), with the Z test statistic following standard normal distribution.
3. Results
3.1. Burned Area Dataset Analysis
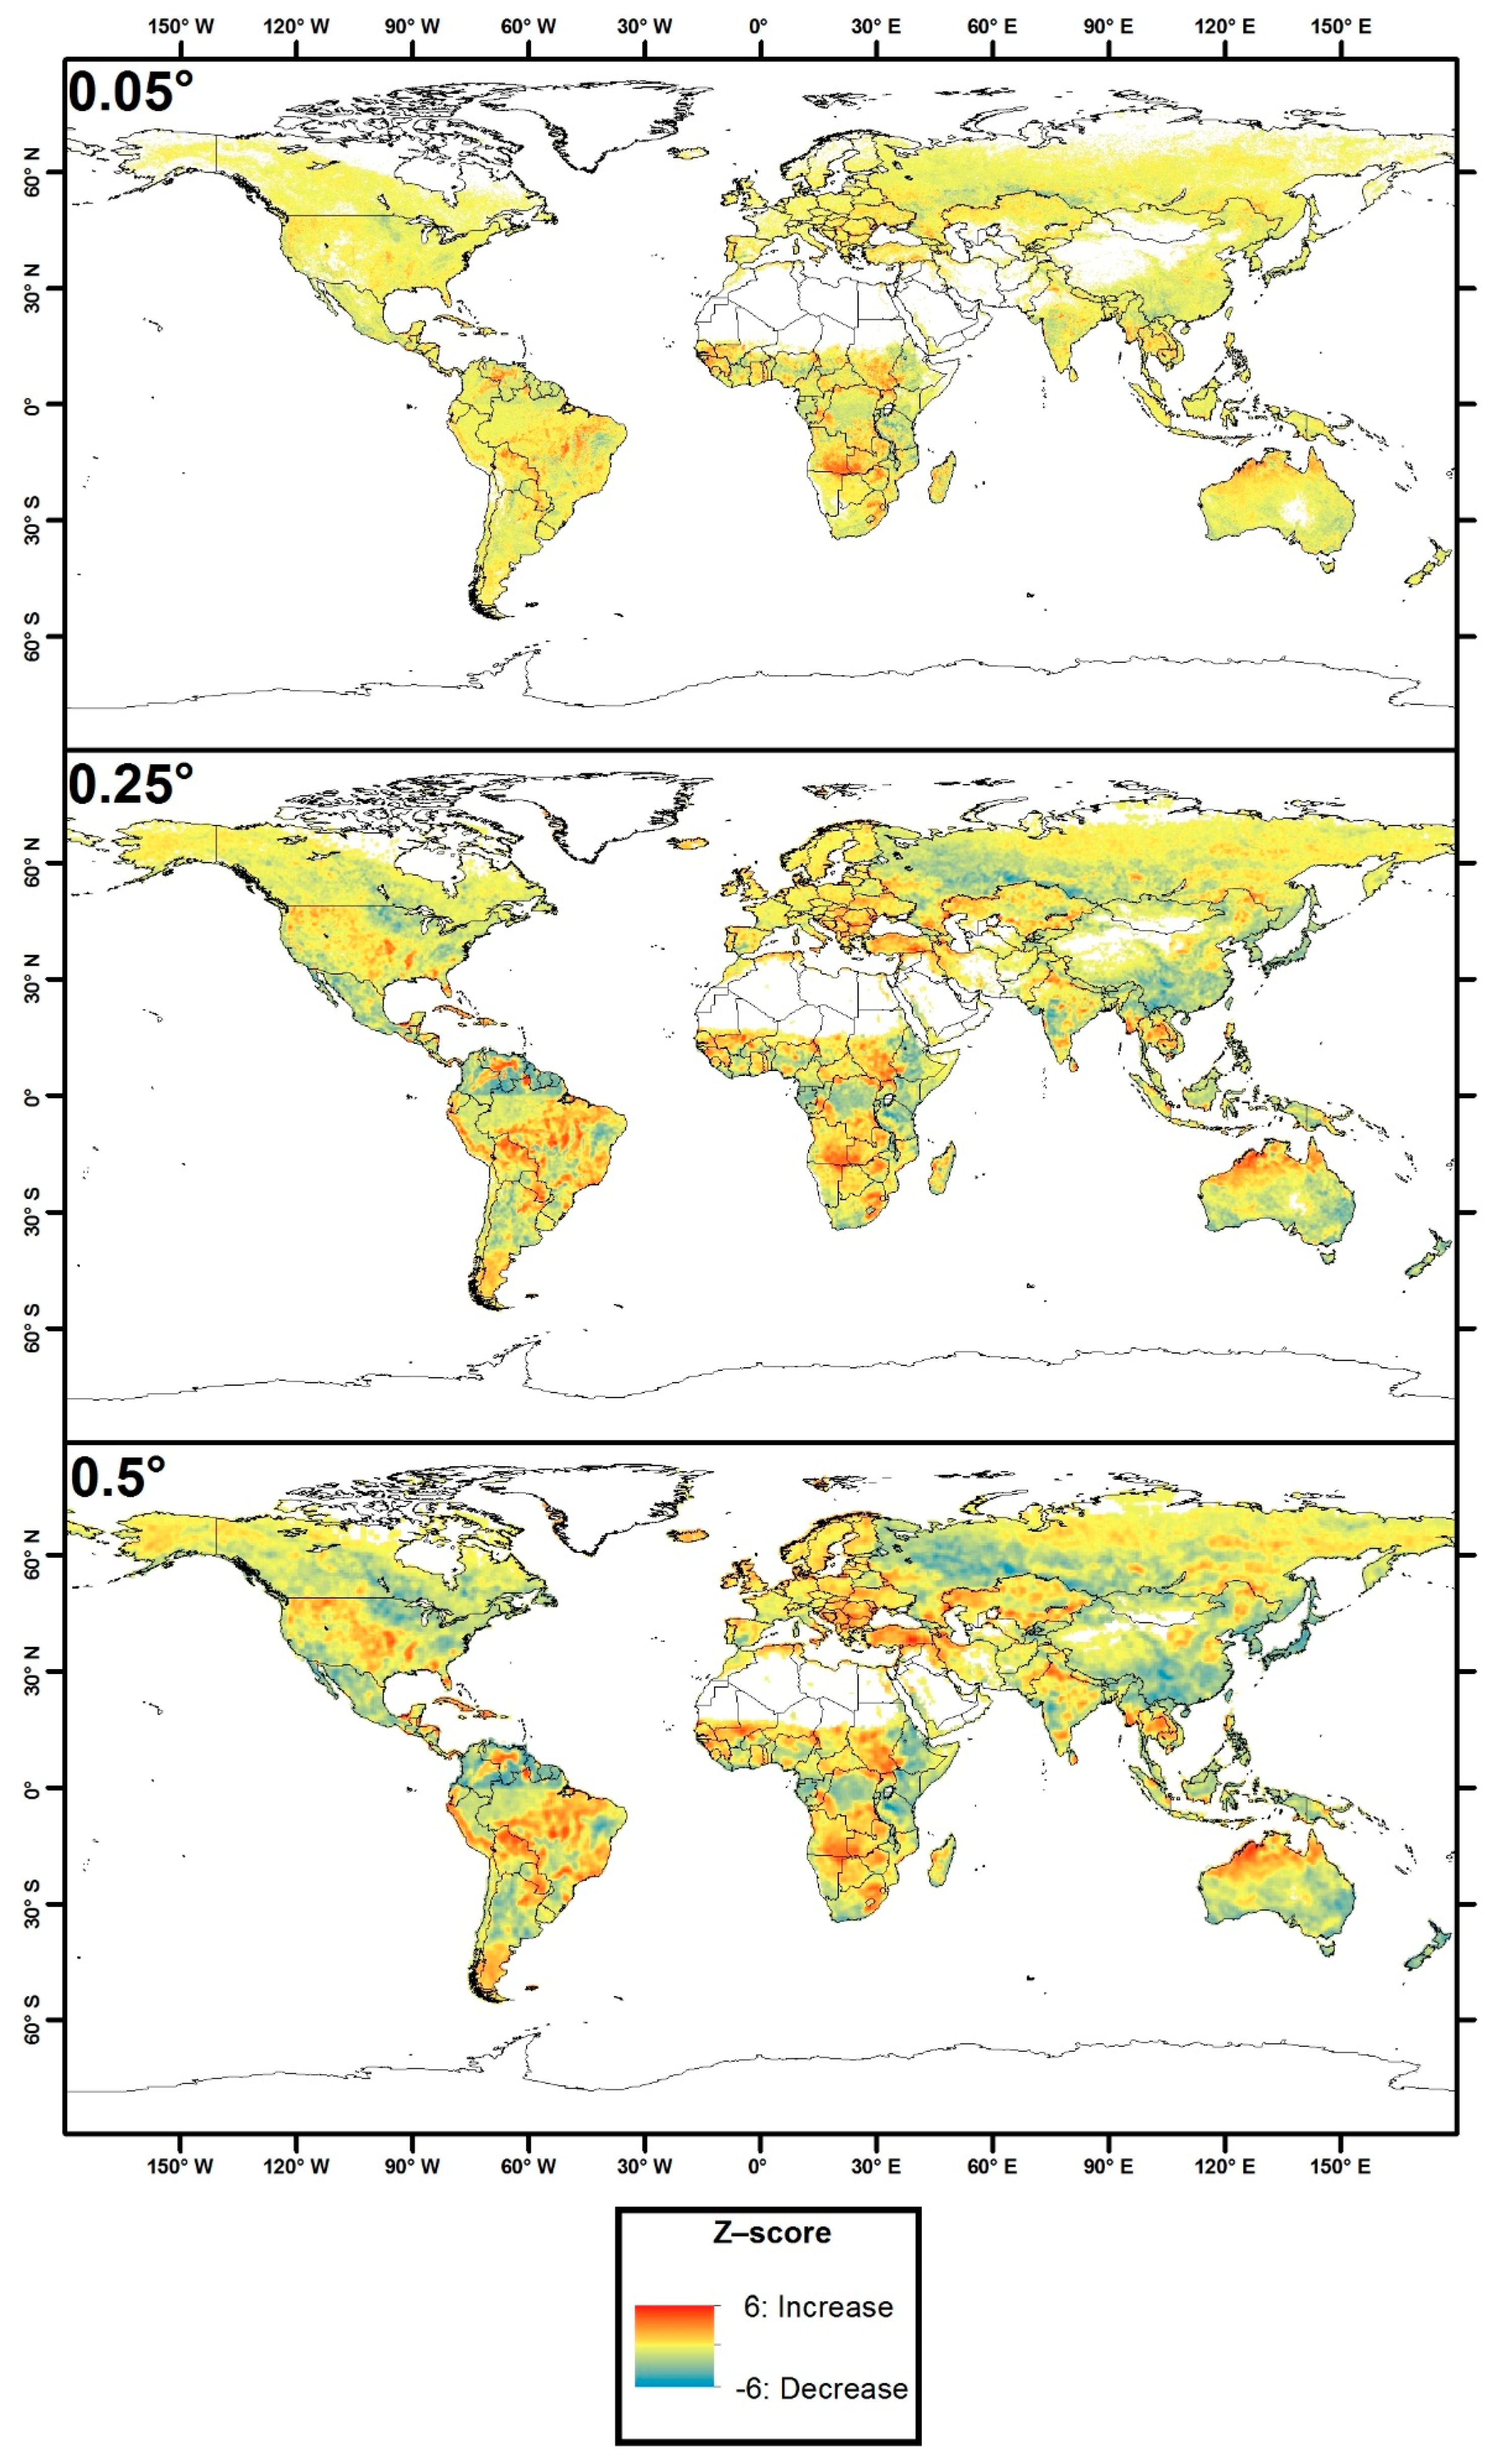
As explained in Section 2.1.3, the BA datasets (FireCCILT11 and FireCCI51) were resampled individually to three spatial resolutions (0.05°, 0.25°, 0.5°) to learn which one was more consistent to detect BA trends on a global scale. CMK was calculated for each resolution of each product, as shown in Figure 2 in the case of FireCCILT11. The 0.5° resolution maintained a high trade-off between spatial detail and trend detection in order to study global patterns. In addition, the 0.5° spatial process was faster than higher resolutions and required less computational power. Higher resolutions (0.05° and 0.25°) presented slight trends and were more disaggregated than the lowest resolution. For these reasons it was decided to perform the analysis at 0.5° spatial resolution.
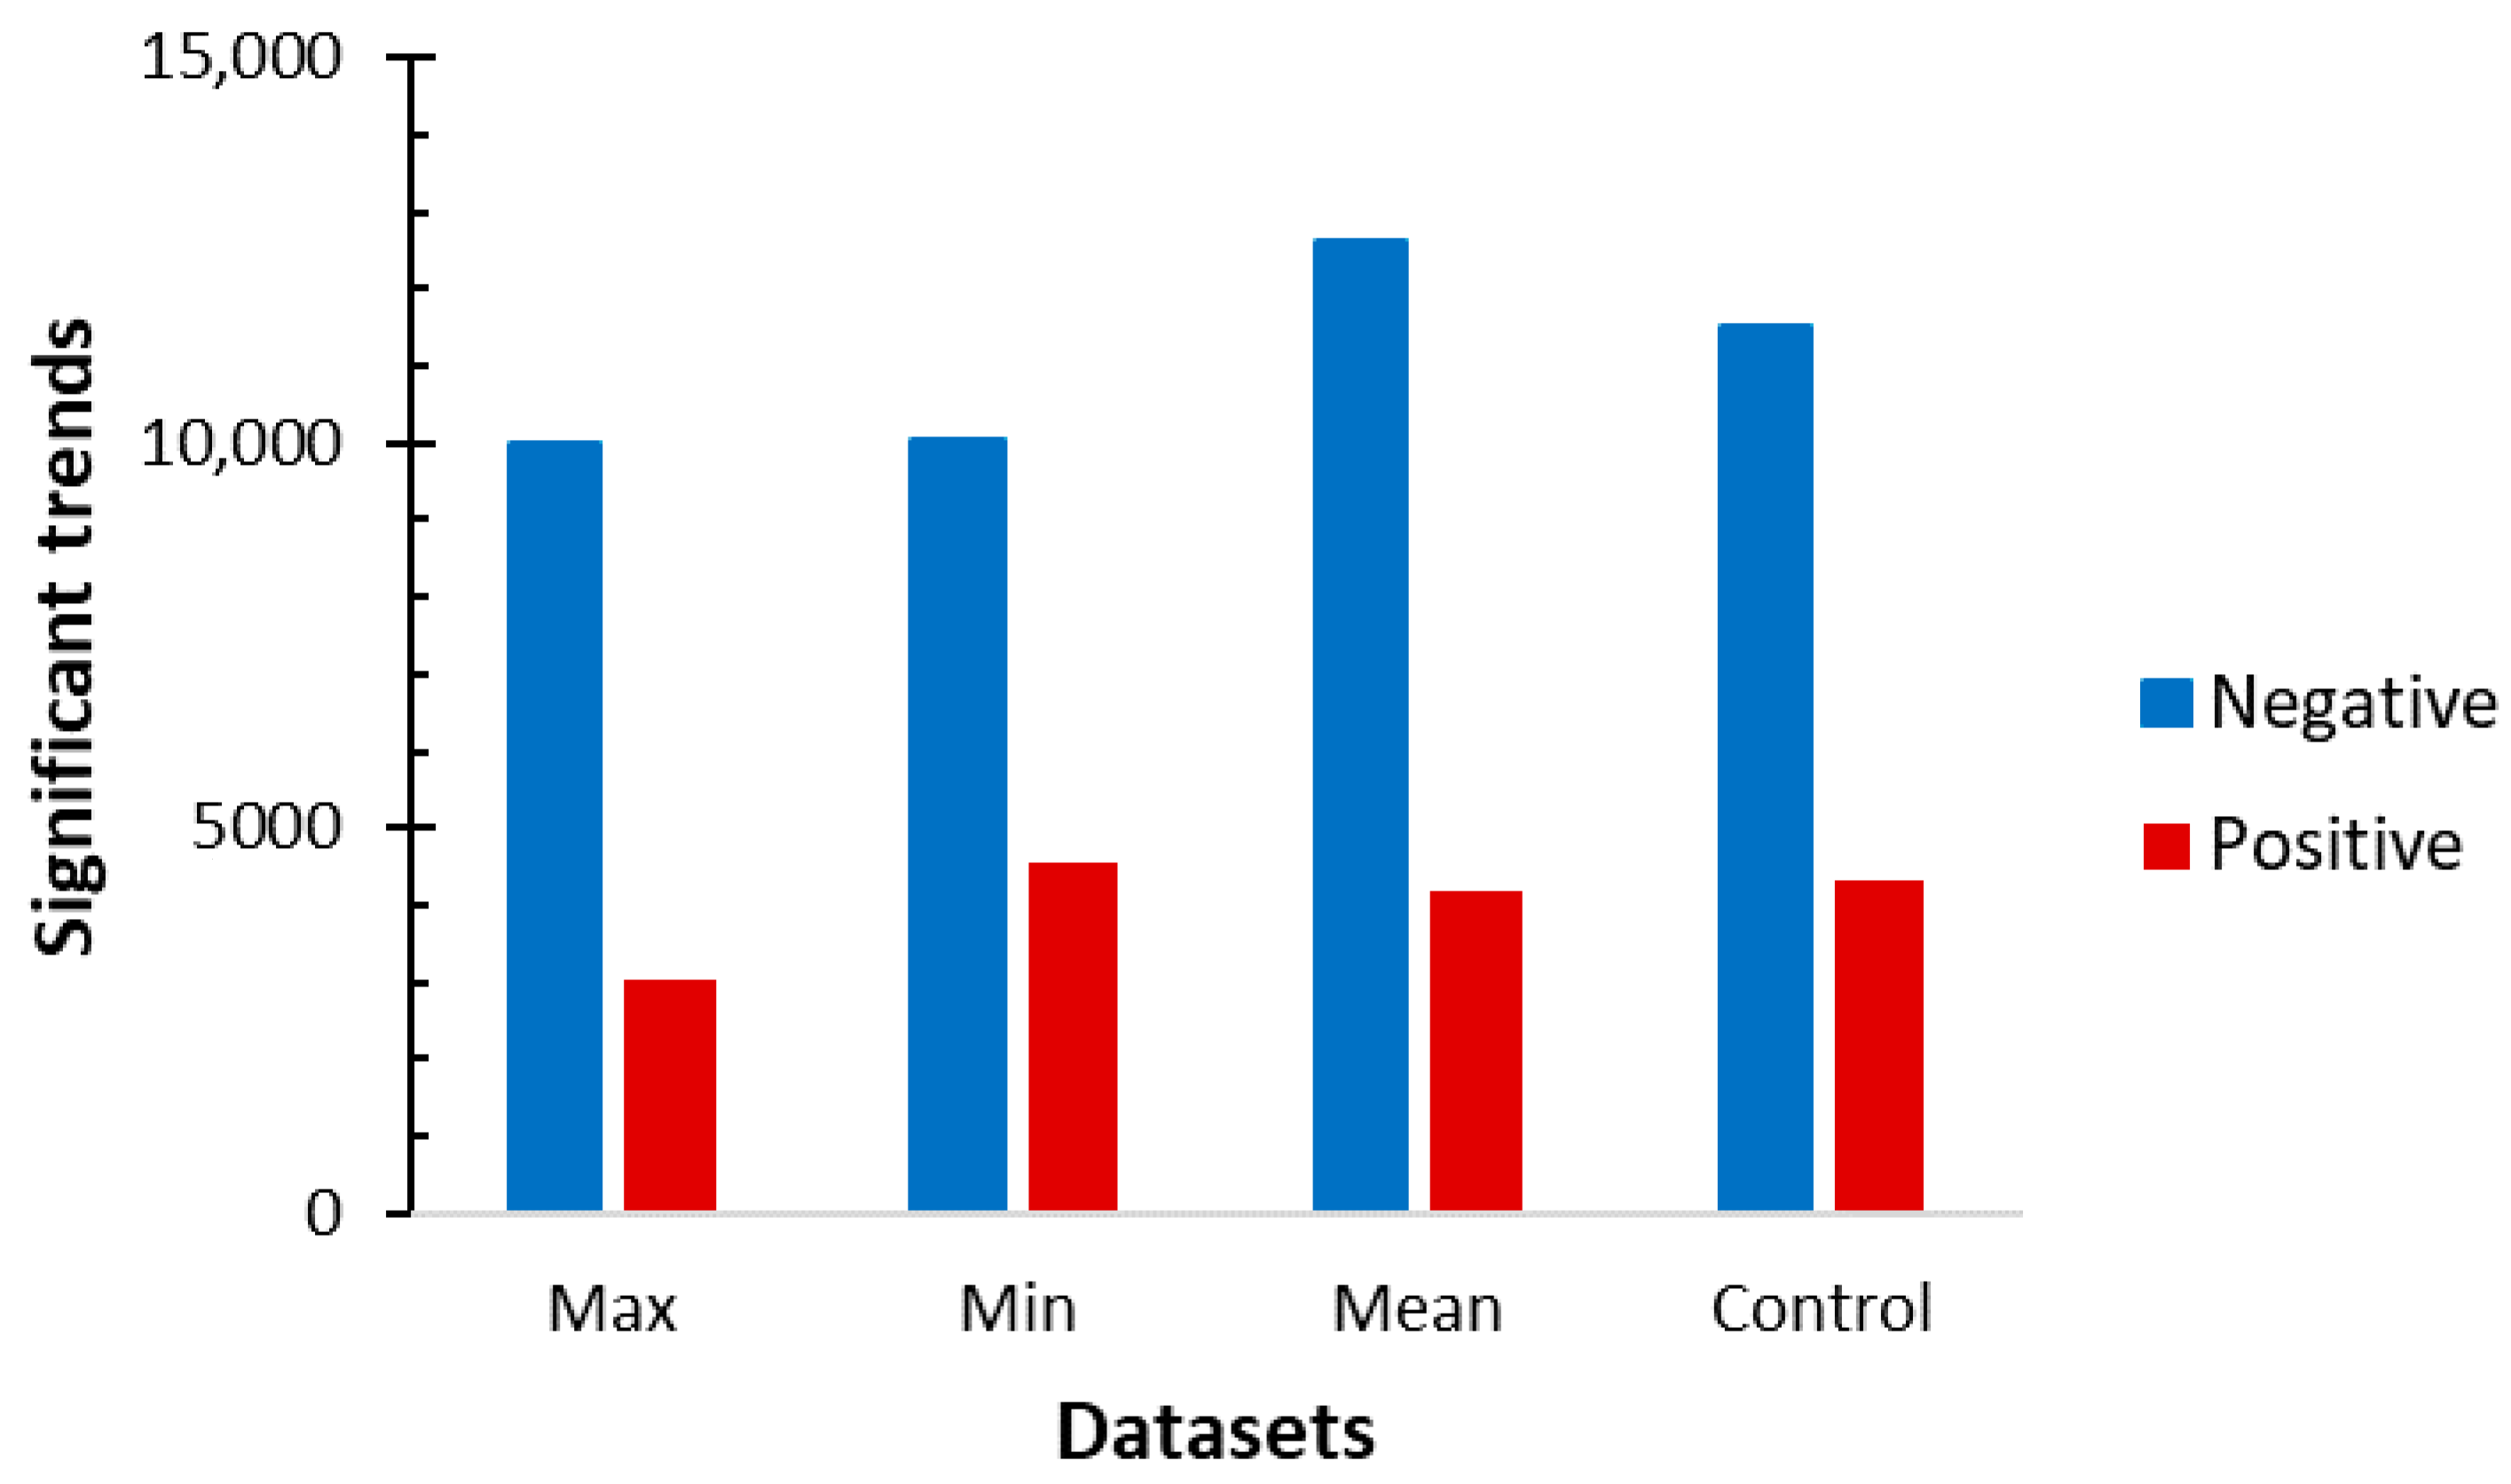
Additionally, the effect of the 1994 gap was analysed for the four datasets (control, max, min, and mean). These datasets were generated at 0.5° and CMK was performed. Figure 3 shows the comparison among the significant trends, with a confidence level of 95%, in the different datasets. The three datasets created showed values with differences of less than 30% from the control dataset in negative significant trends and less than 15% in positive significant trends. The max and the min datasets obtained 13% less negative trends than the control dataset, while the mean dataset had a 10% more. Regarding positive trends, the maximum dataset obtained 29% less trends, the minimum dataset 6% more and the mean dataset 3% less than the control dataset.
These results showed that CMK and the Theil-Sen estimator are very robust to the presence of outliers, since they can tolerate a substantial fraction of bad observations without losing accuracy. The results were not much affected when the missing observations for 1994 were replaced with either the maximum, the minimum or the mean of all observed values. Due to the consistent trends, the dataset was generated with the control approach, without the year 1994.
Despite choosing the most consistent dataset according to previous analyses, limitations were found in the dataset. The trend detection procedure reflected all these imperfections contained in the products. First, continental regions [24] were used for computing the BA data for the FireCCILT11 product. This regional adaptation has the potential to introduce discontinuities in trends between regions. For instance, a strong border effect was found in South America. In particular, this effect occurs at the border of two continental regions [24] Northern Hemisphere South America (NHSA) and Southern Hemisphere South America (SHSA). This border effect was more evident at lower spatial resolution because the aggregation of pixels and trends makes it more visible. When the resolution was higher, such as the original resolution (0.05°), this border effect was smoother, as well as in the remaining trends (Figure 2). Second, some anomalous trends or discontinuities were found in the FireCCILT11 product in the year 2000, when there was a change in the sensor, namely from AVHRR-2 (1982–2000) to AVHRR-3 (2001–2018). This type of problem affected 5% of clusters (30 out of 594) with significant trends, and corresponding to BA commission errors in the FireCCILT11 product. Those clusters were visually identified and excluded from further analysis. Despite that, FireCCILT11 got a consistent BA in NHSA and the remaining continental regions. No other anomalies were found in FireCCI51.
3.2. Contextual Mann-Kendall Test and Slope Estimation
3.2.1. Short-Term Series
In the case of the short-term (2001–2018) dataset, spatial trends are shown in Figure 4. Significant trends (with a confidence level of 95%) are shown in Figure 5. Large decrease clusters were predominant with respect to smaller increase clusters. Burned area change trends vary regionally. Northern tropical Africa presented decreasing trends, while Equatorial Africa showed a combination of decreasing (East) and increasing (West) trends. The traditional fire regions of South America (Los Llanos and El Gran Chaco) had negative trends, while the new fire areas in the Central and North East showed positive trends. In North America, mostly positive trends were observed, particularly in the SE of USA. Asia presented decreasing trends in Central Asia, and increasing trends in India and Central Siberian Plateau. Finally, Australia presented decreasing BA clusters in the North, and increasing trends in the South.
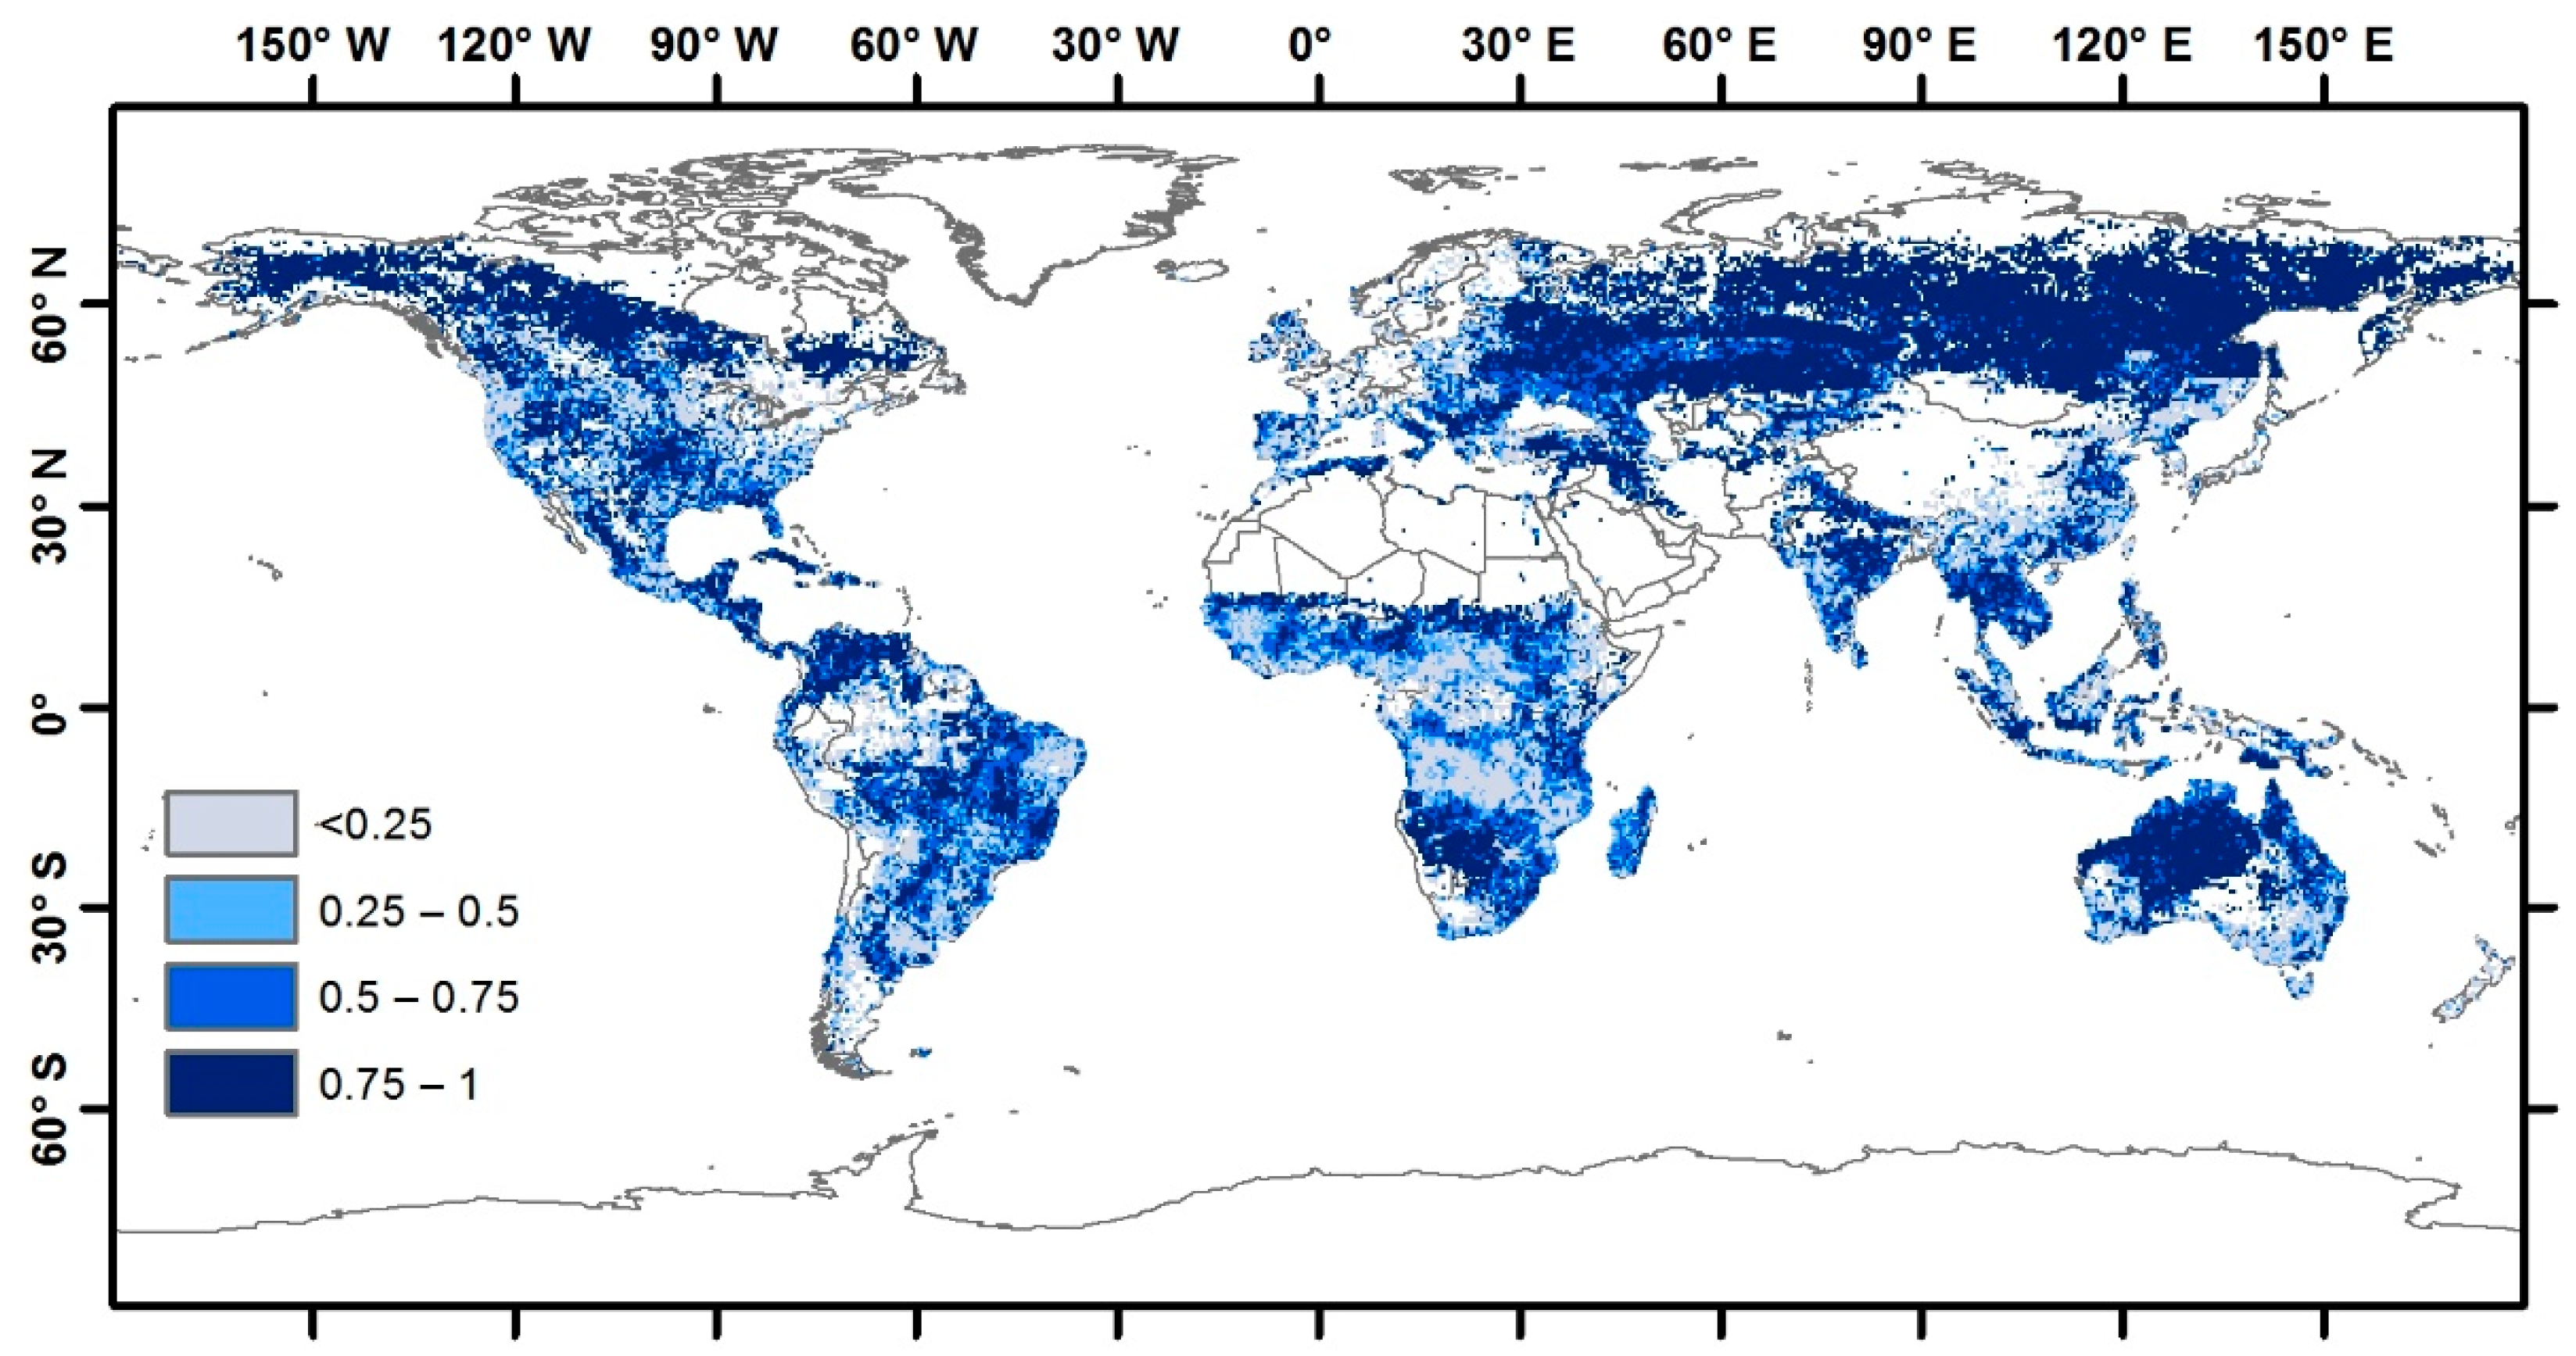
The common time series of FireCCILT11 (Figure 6) with FireCCI51 was analysed and it showed similar trends, although the short-term series of FireCCILT11 presented smaller clusters. The detection resolution of FireCCI51 allowed more accurate measures and trends. Despite that, both products in the common time series showed mostly high spatial similarities. Figure 7 shows the spatial correlation between FireCCI51-FireCCILT11 in the period 2001–2018. High spatial correlations are displayed with Pearson correlation (r) > 0.75 in pixels of all regions.
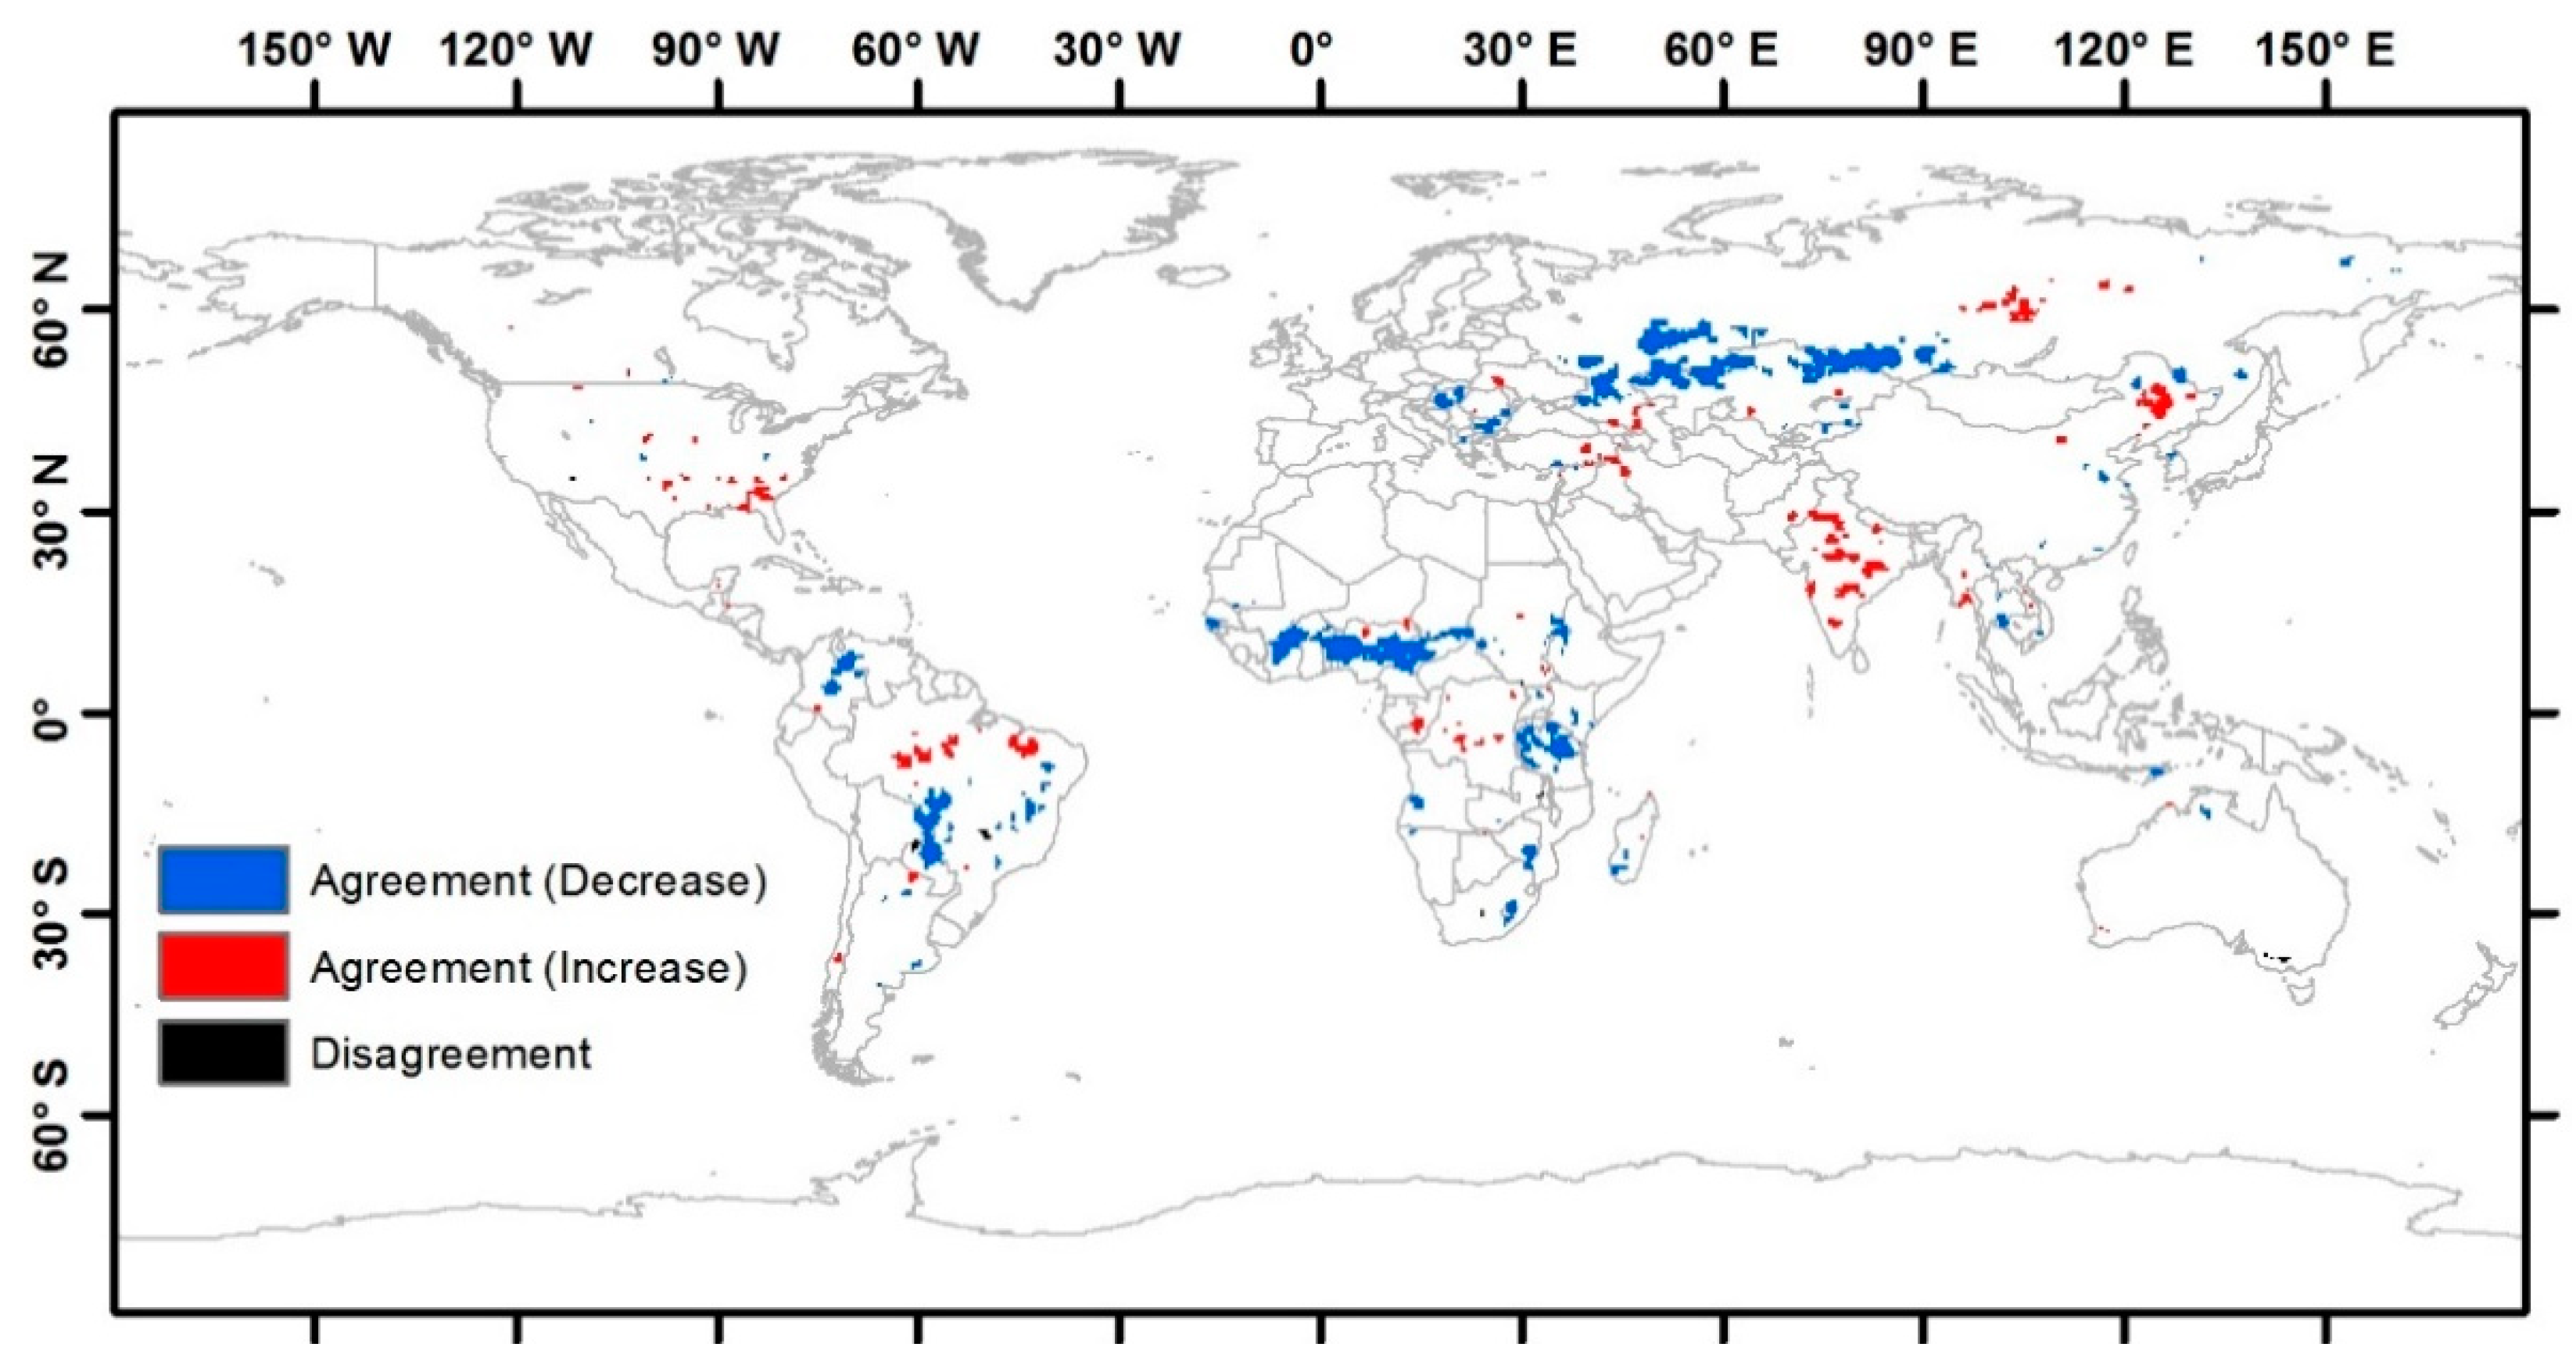
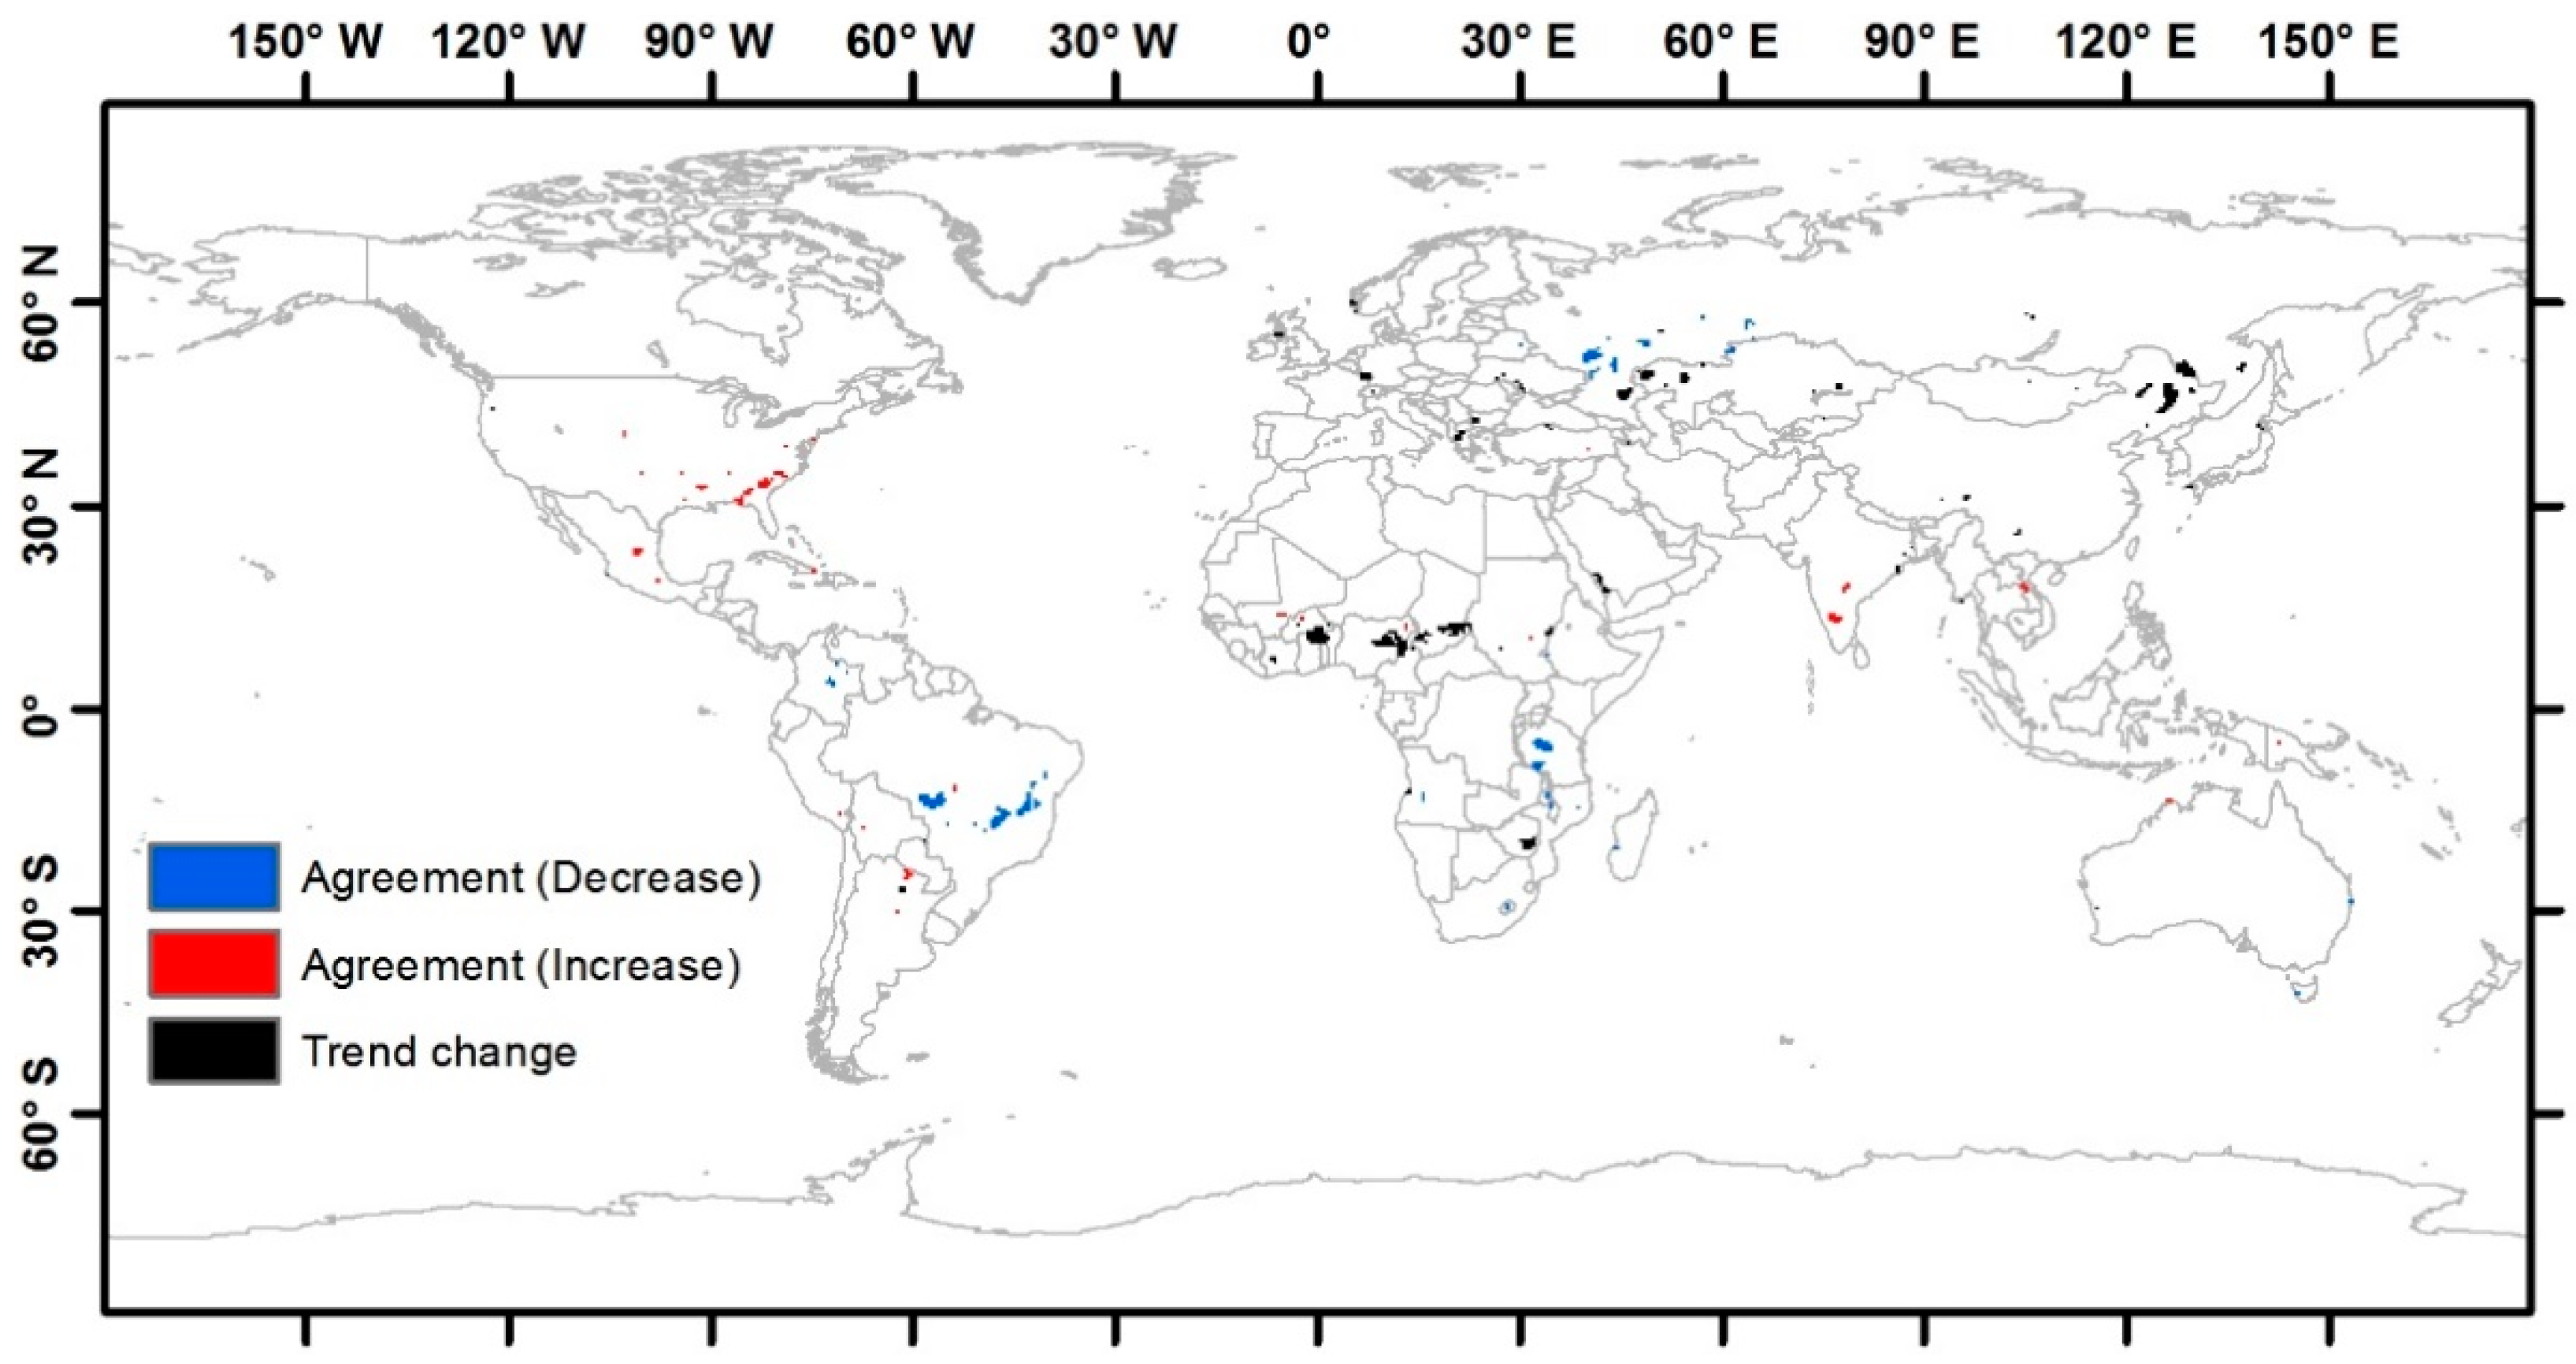
Comparing significant trends in both products in the common time series, Figure 8 shows the agreement and disagreement in the significant patterns. Agreement is where the same significant trends are located in the same place in both products. Disagreement showed where each product had a significant opposite trend in the same location. Agreement was widely predominant in all regions, with decreasing trends predominating over increasing trends, and disagreement was minor. Agreement in decreasing trends were present in Africa, South America (Los Llanos and El Gran Chaco) and Asia (central region). Agreement in increasing trends appeared in Africa (central region), America (USA and centre of Brazil) and Asia (Siberia and India). Australia did not present spatial agreement in significant tends.
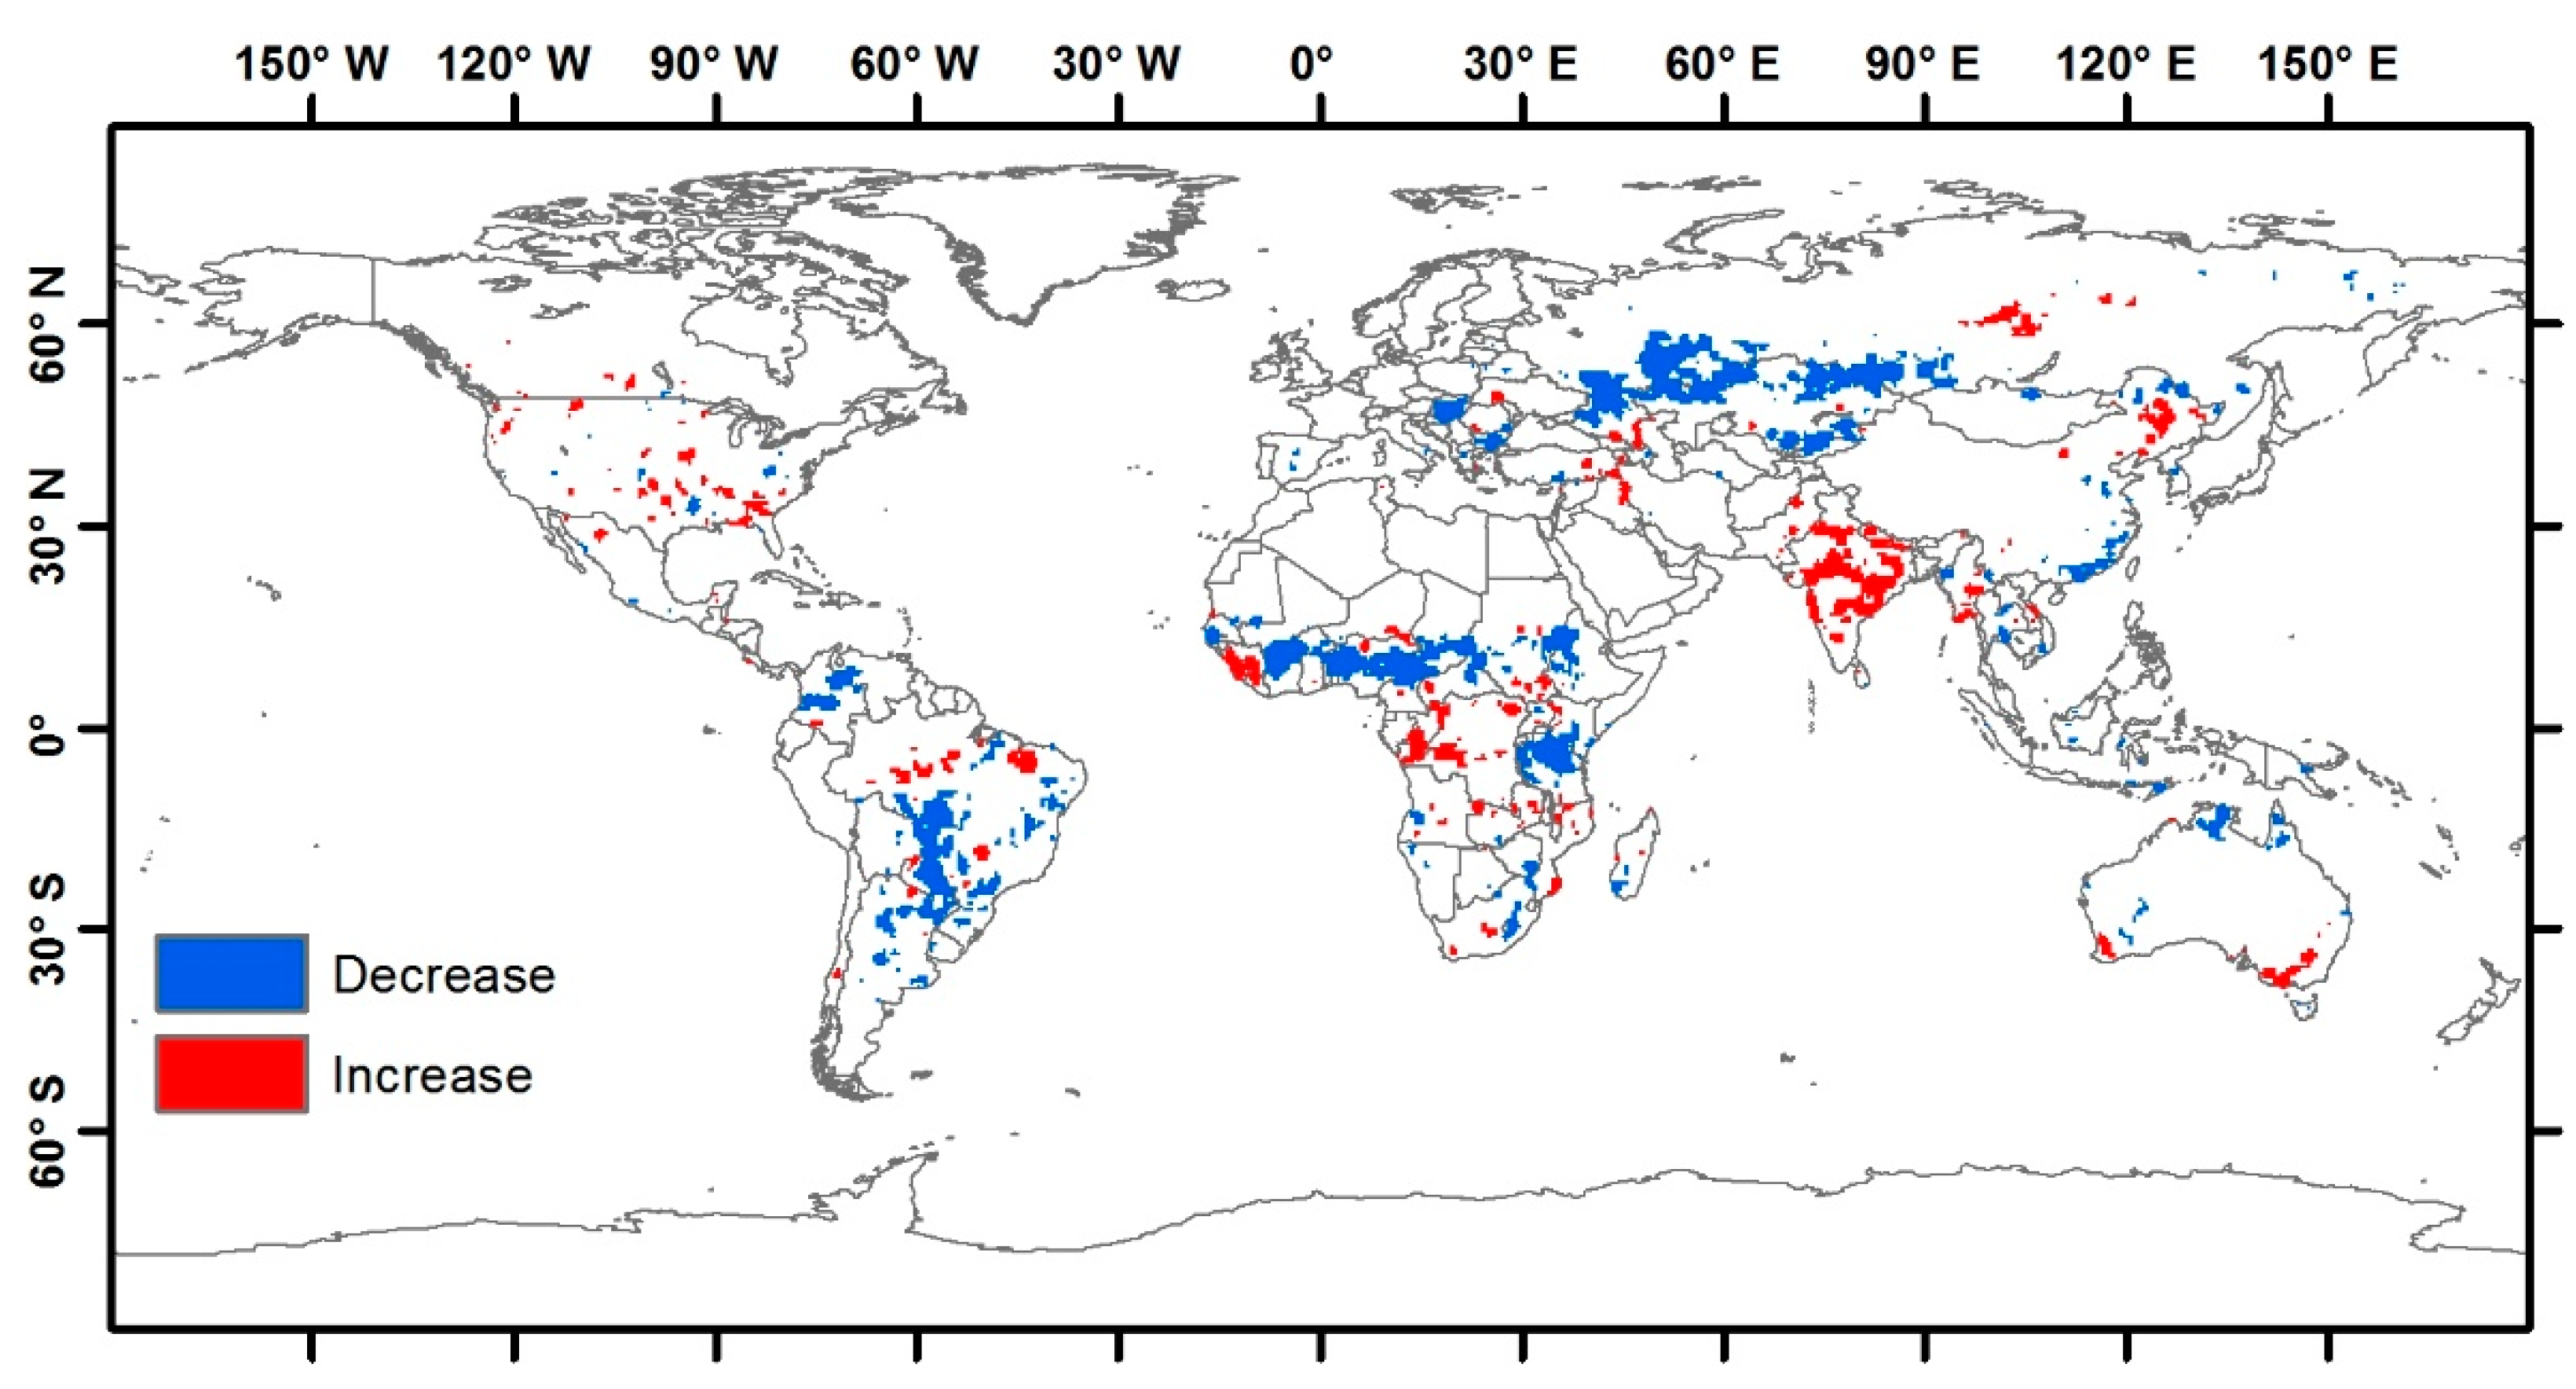
The long time series analysis was only feasible with the low-resolution product (FireCCILT11). We first analysed the non-common period, covering from 1982 to 2000 (Figure 9). Small increase clusters were predominant with respect to large decrease clusters, although increase and decrease trend patterns were found regardless of the region. Africa (Northern tropical and SE), North America, Central South America, and West and Central Europe presented mostly positive trends, although in small regions and scattered, showing an increase of BA in this period. Eastern Europe, South America and Australia had large significant change in a few areas with negative trends. Asia presented both trends in Central, and increase trends in India.
Comparing between periods of FireCCILT11, the first period (1982–2000) showed smaller clusters than the second period (2001–2018). The former period had more uncertainty than the latter period due to the AVHRR2 sensor had less quality than AVHRR3. The first period had more increase than decrease clusters, while in the second period the opposite occurred. The agreement and change of trend in the significant patterns are shown in Figure 10. The significant trends between periods did not coincide in the same places, although where those patterns concurred, a change of trend was widely predominant. Therefore, opposite trends between periods are found in Africa (Northern tropical and SE) and Central Asia (East and West). Small clusters of agreement in decrease trends are present in Central Africa (East), South America (Central) and Asia (East), and small clusters of agreement in increase trends are found in America (South and SE) and India. Europe and Australia did not present spatial disagreement in significant tends.
3.2.2. Long-Term Series
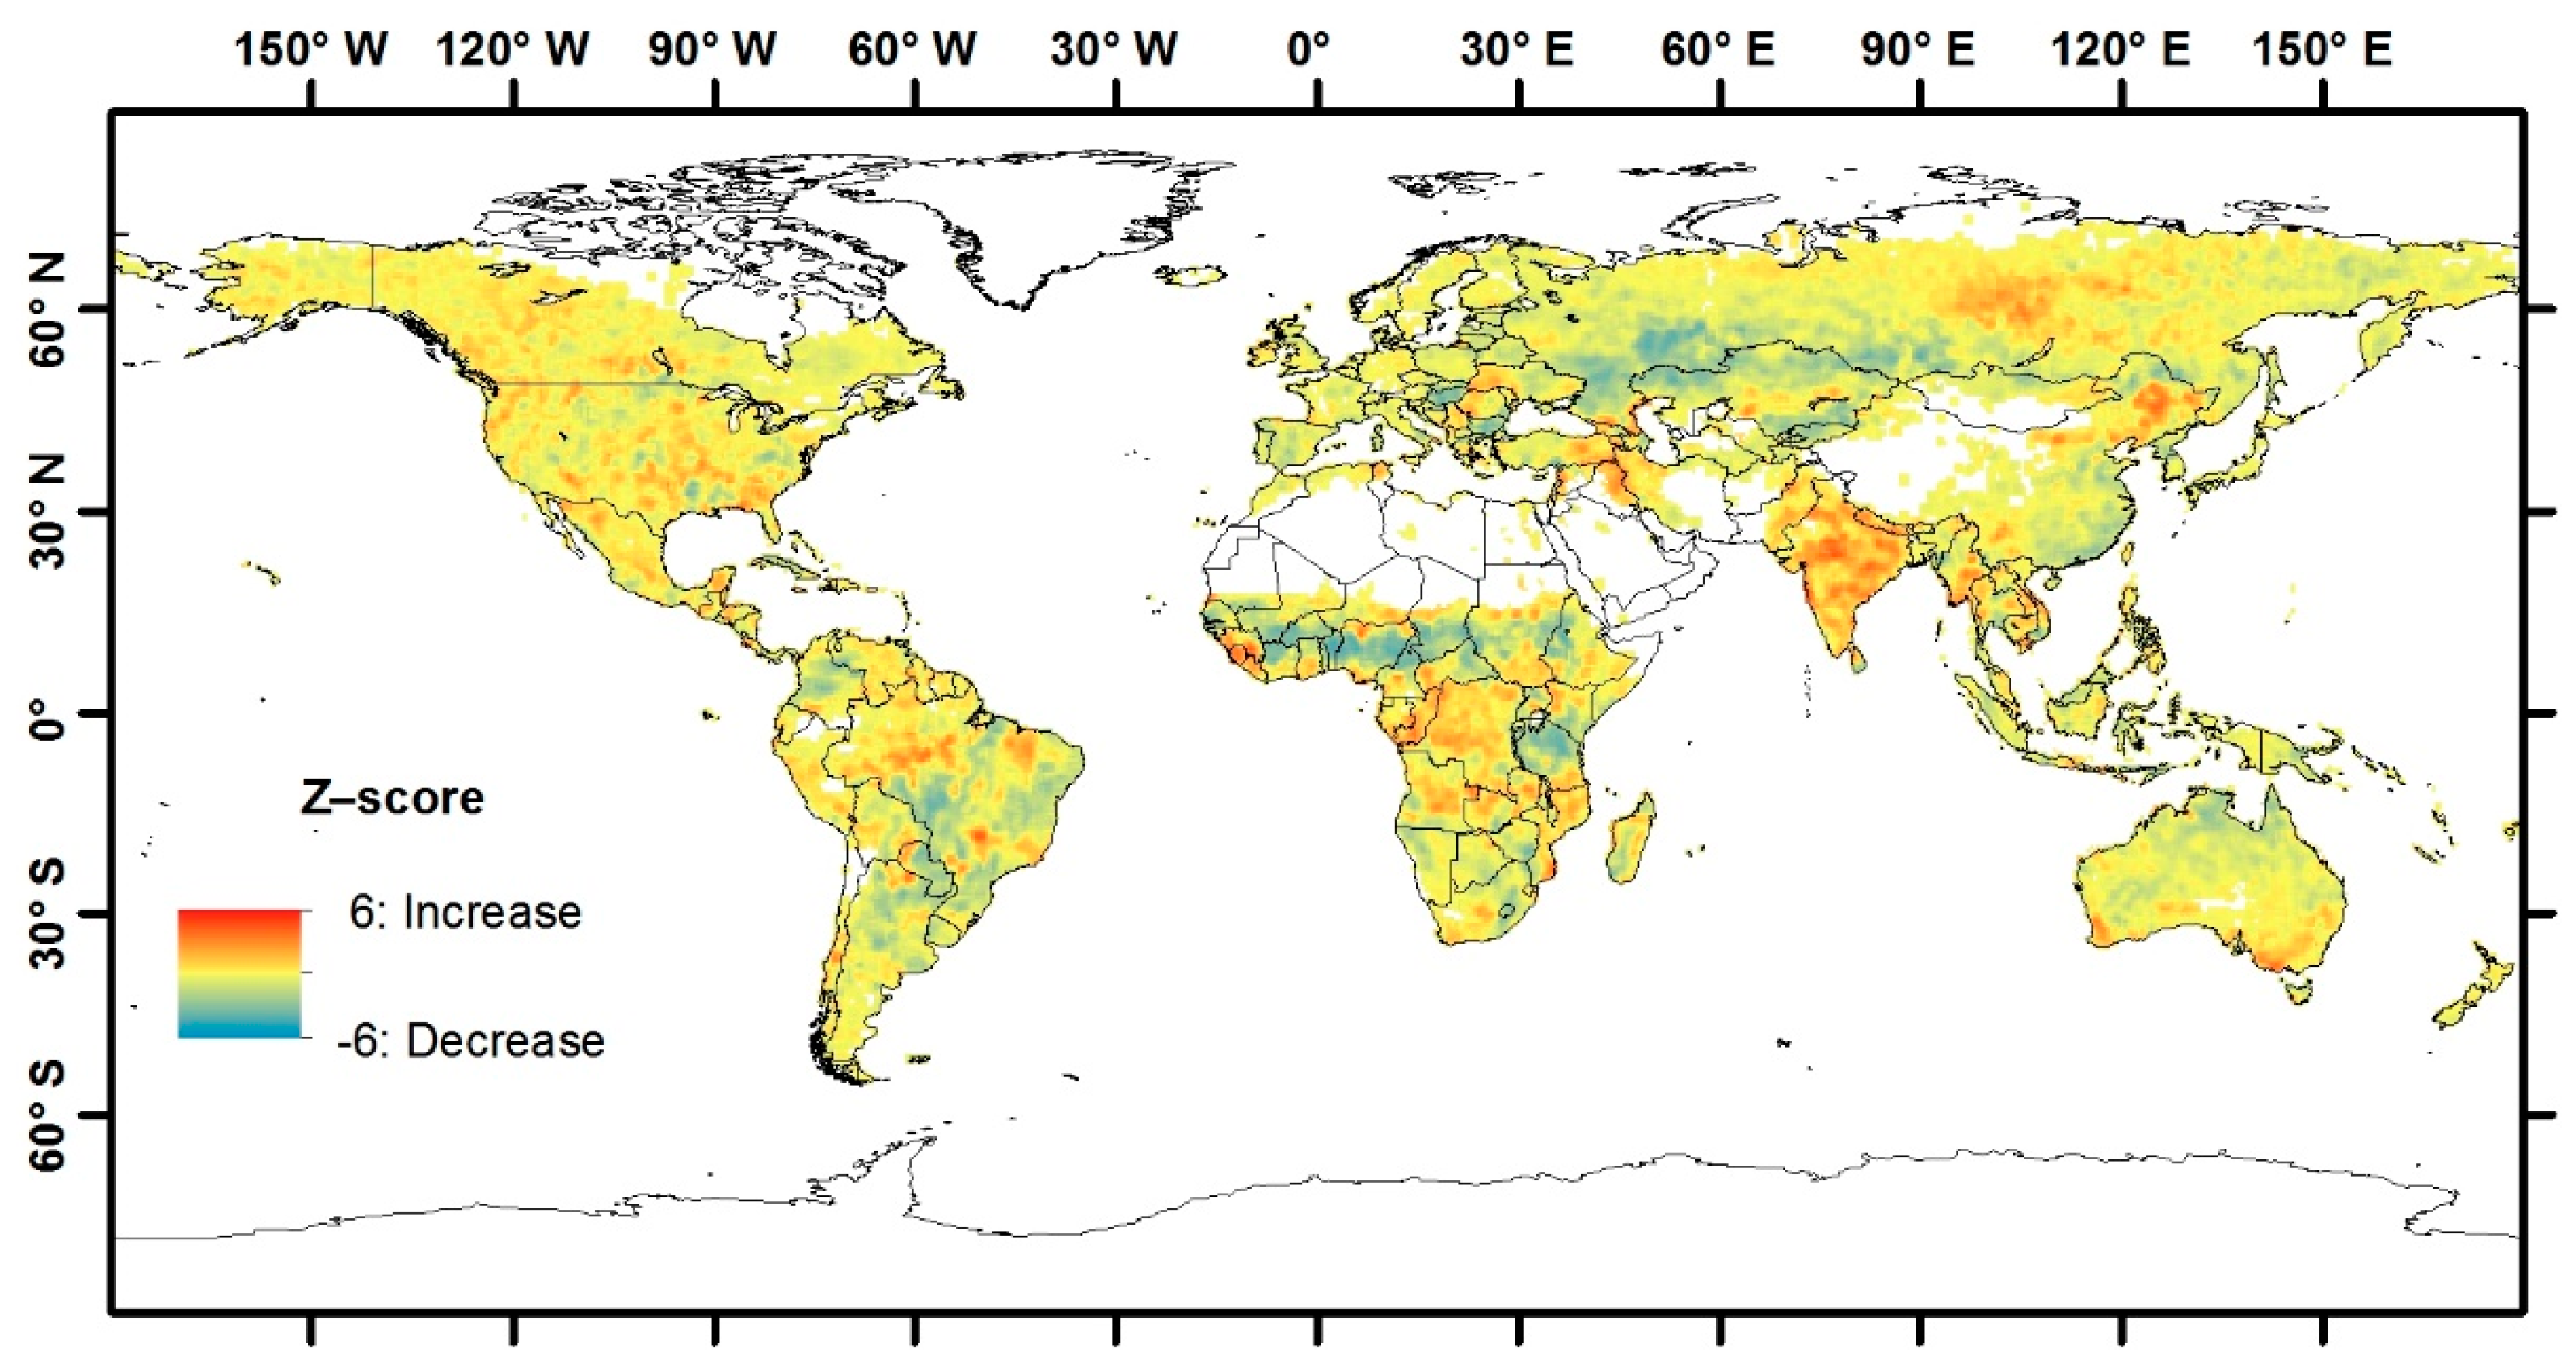
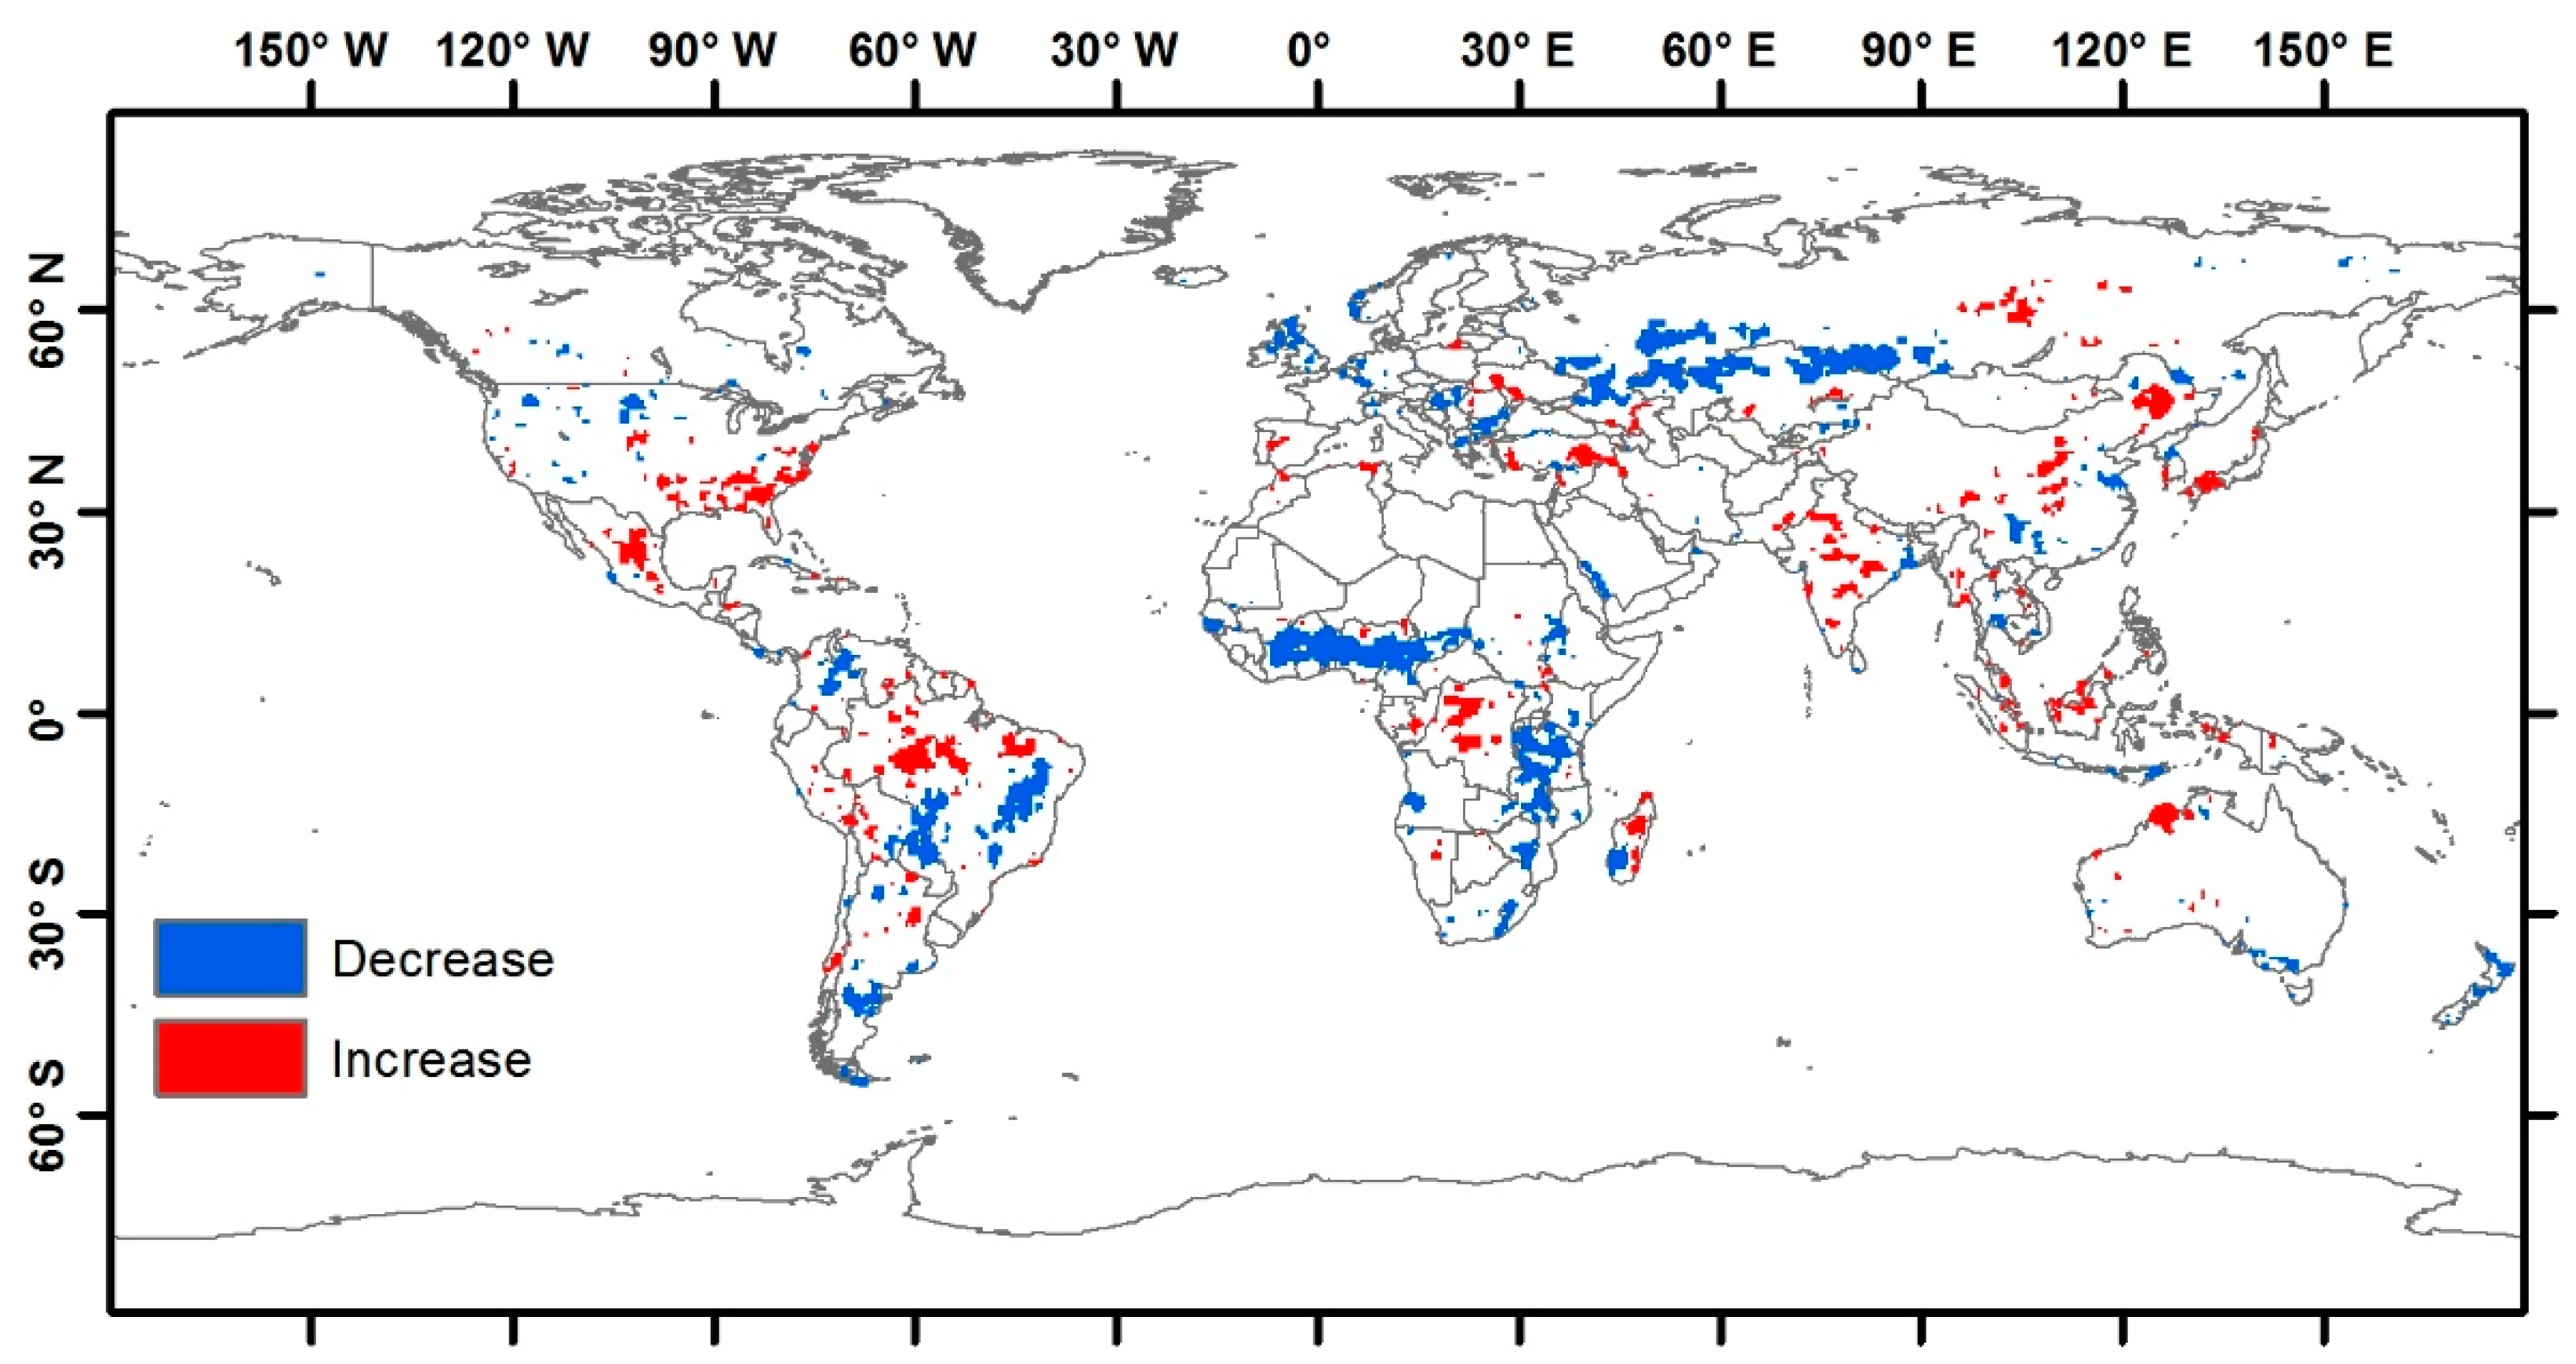
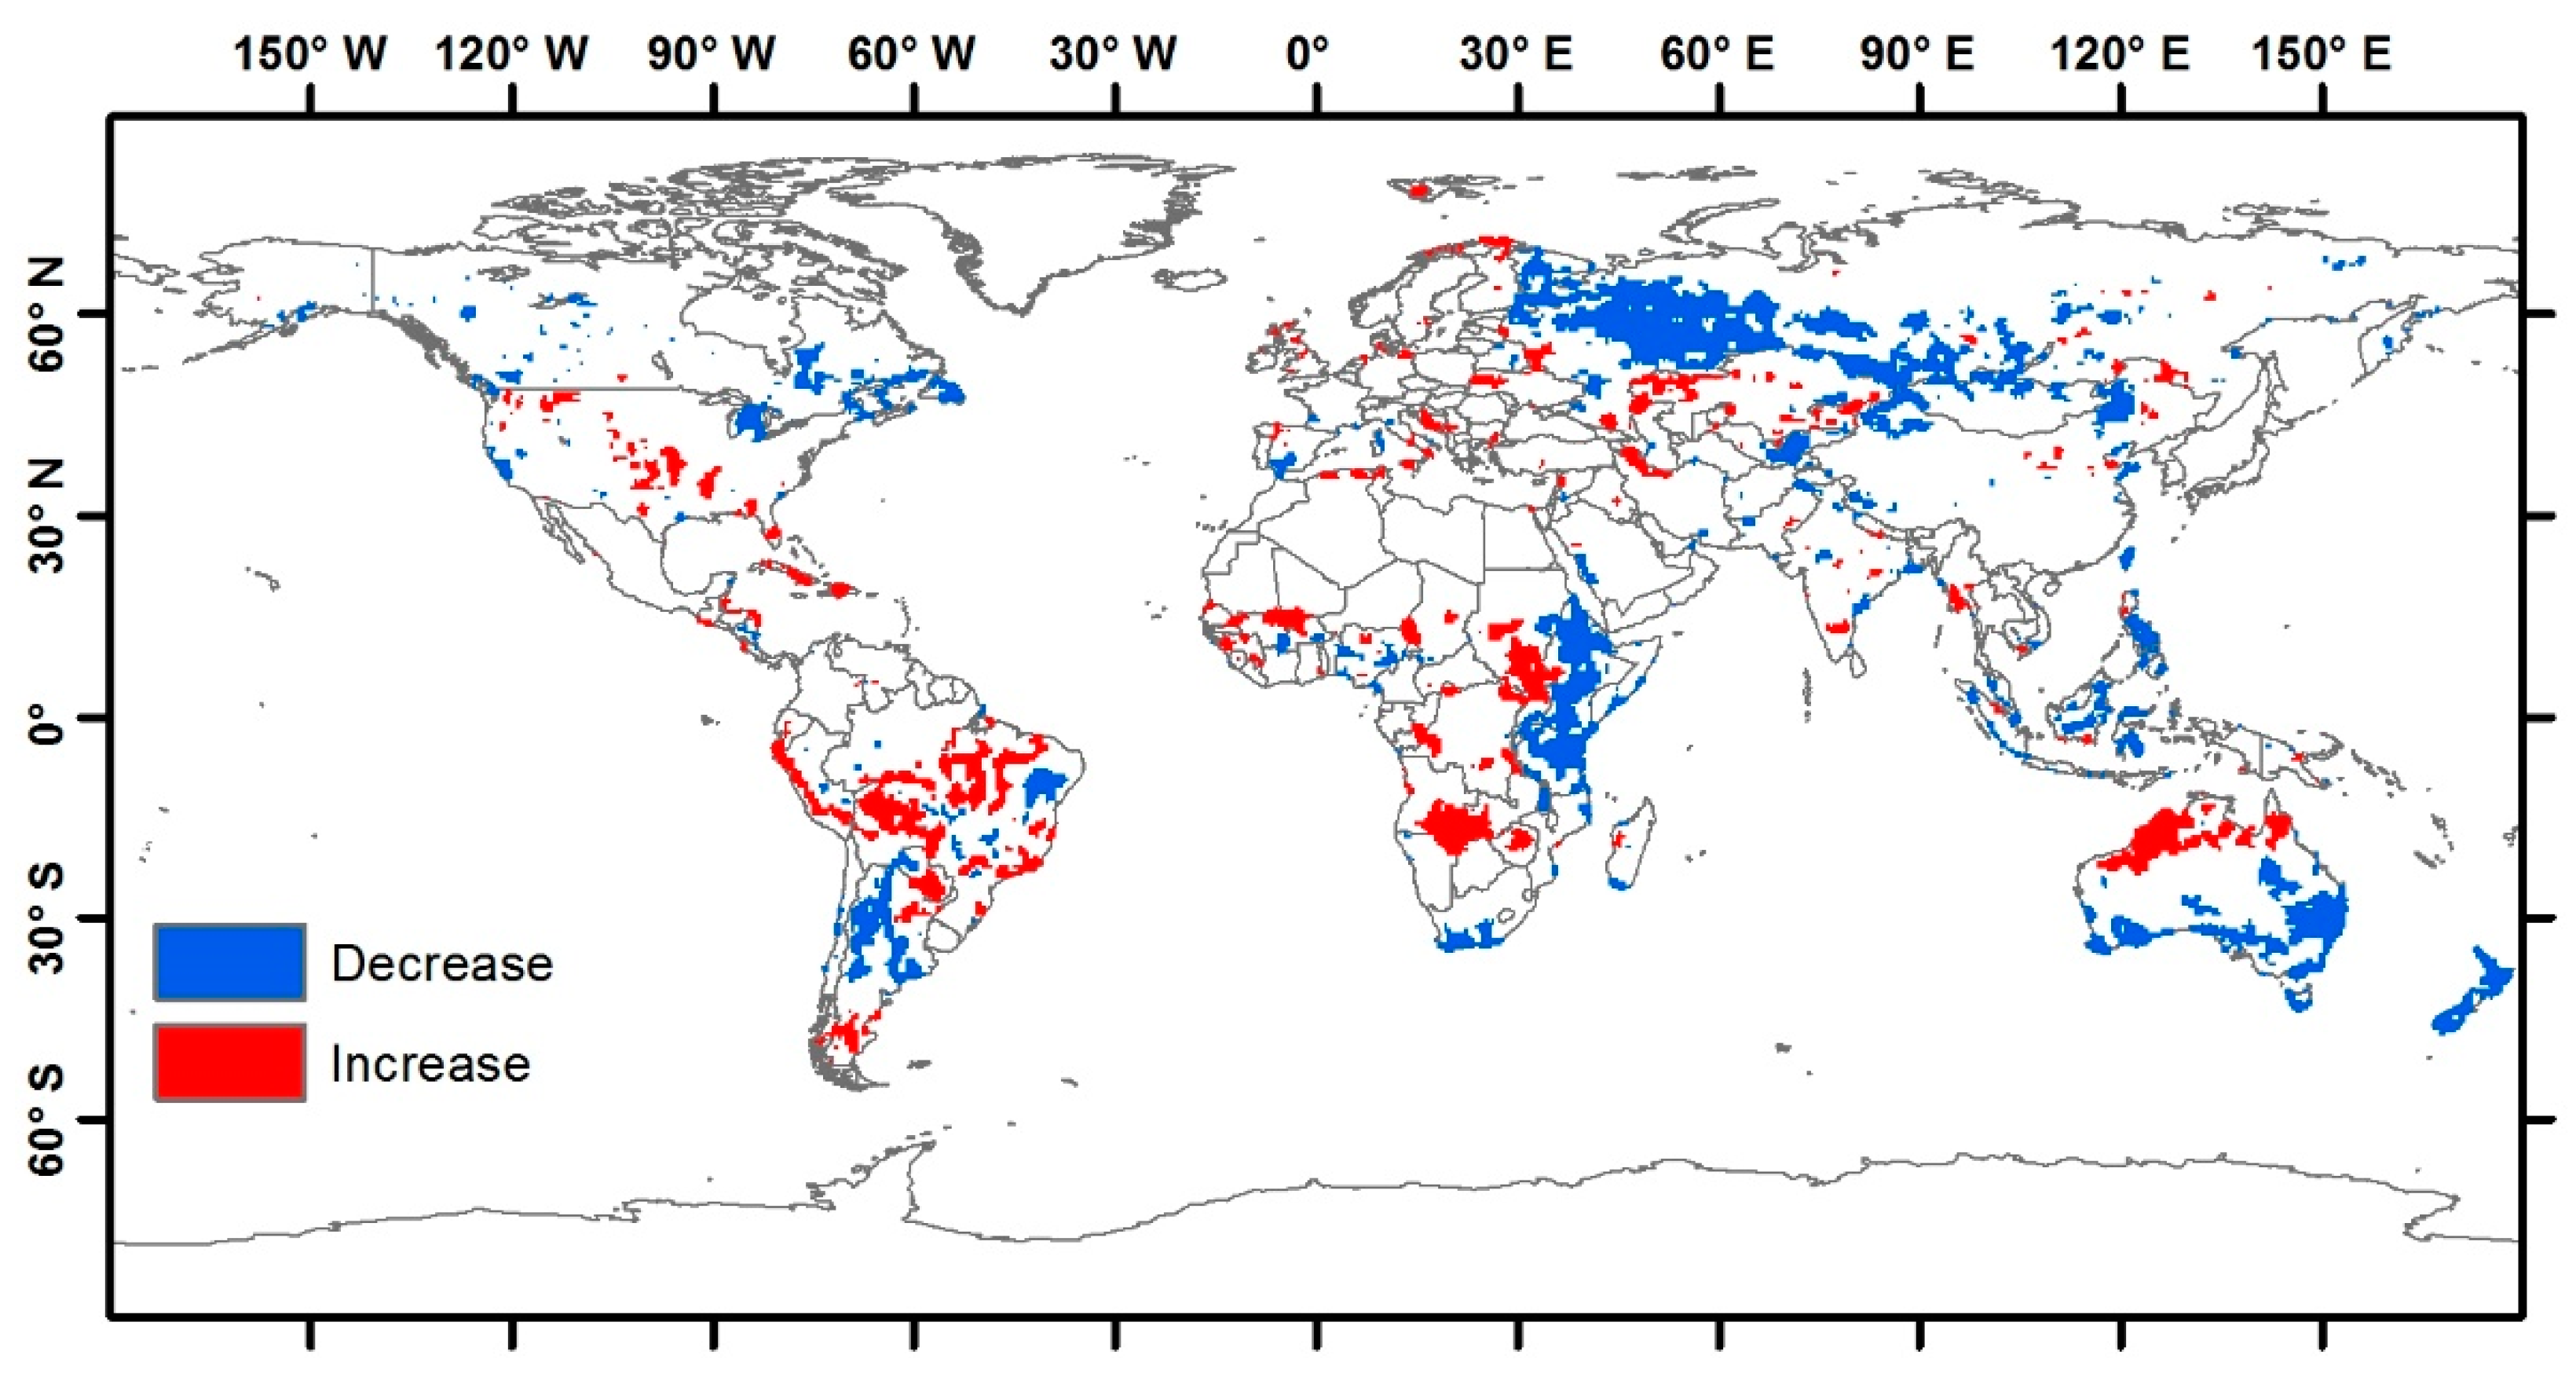
BA spatiotemporal trends in the full times series (1982–2018) of the BA dataset (FireCCILT11) showed larger regions with significant trends (Figure 11), which is related to the longer period.
Increase and decrease trends were found in every continent and region. Africa presented significant trends, mostly positive in the Northern Tropical (East, North and West) and Central region, and negative in the Northern Tropical (Centre), Eastern and South ones (Figure 11). South America had significant increase clusters in the borders of the Amazon basin (Central and Southern Brazil), Peruvian Andes, the Chaco region and Southern Argentina, while regions with negative trends were found in Eastern Brazil, and Central and Northern Argentina. Central America areas (Petén, South of the Yucatan Peninsula in Guatemala, Central and Northeast Honduras) displayed significantly increasing trends. North America presented small clusters of BA increase in the North-West, Central and South-East regions, and decrease trends in Western regions and Eastern Canada. Europe showed significant BA increase (Northern and Eastern regions) and decrease (Southern Spain). Western and Central Asia presented predominant decreasing trends and small increase clusters in the Southwest and east. Australia displayed increase clusters in the North and decreases in the South.
4. Discussion
This study developed a spatiotemporal analysis of global BA trends. The analysis was performed with two BA databases that include short-term (18 years) and long-term (37 years) time series.
FireCCILT11 presented a border effect [12], and the AVHRR2 period showed anomalous trends or discontinuities, because the BA estimates from the 1982–2000 period had more uncertainty than those of the 2001–2018 period, since the AVHRR2 sensor had less quality than AVHRR3, although both periods are consistent [28].
The spatial resolution of this study was 0.5°, common in other analysis [43,44], which implied a good balance between coverage and internal change. The lack of 1994 BA data was not relevant, because the database had many years of data and the methodology is robust against outliers. The corrections to remove temporal autocorrelations mitigated the impact of it, giving consistency to the datasets, and were applied in other trends [15,16] and BA studies [18]. CMK were consistent methods that took into consideration a contextual approach to analyse spatiotemporal patterns. The contextual approach offered a significant cluster of trends, which are easier to detect than with other time series approaches [15,18].
The use of two databases with different spatial resolution and temporal extent gives consistency to the study and results [8,12] because this has allowed us to compare the results in common. This paper has illustrated the use of a long-term BA dataset, not previously available (FireCCILT11) including 37 years. The higher resolution product (FireCCI51) had a shorter time series, which has been analysed in previous studies [45,46,47]. We observed that both higher and lower resolution BA datasets showed similar trends in all regions for the common observation period (2001–2018) except in Australia, which may be due in large part to spatial resolution. However, significant changes in trends were observed when comparing this period with the previous two decades, only available in the FireCCILT11 product. Finally, when using the long-term series (37 years), many more significant trends were observed than in the short periods (18 years).
Previous global analyses have shown a global decrease in BA [21,22,23]. However, these studies are generally based on large continental regions, rather than on smaller regions (cells), being therefore affected by smoothing effects. In fact, regional analysis [19] have suggested that global analysis may be biased by the most burned regions, therefore blurring regional temporal trends. Moreover, it is well known that global BA datasets underestimate BA, particularly in regions with smaller fire patches [48,49,50] because they are more capable to detect large fires. The difference in fire sizes detection could also affect the type of BA trends studied.
In both the short and the long time series analysed in this study, Africa presented the most important temporal trends, with a larger tendency to BA decrease, particularly in the most recent decades. A controversy was recently observed on whether those changes are related to increased cropland activity or to changes in precipitation patterns [20]. However, when considering the longer time series, increases in BA trends were observed in several regions of Northern and Southern tropical Africa, while Eastern Africa shows the most significant decreases (Figure 11).
In South America, the decrease in BA was predominant in our short-term series (2001–2018), likewise in Andela, et al. [21] and Forkel, et al. [22] studies, but when analysing the full time series, significant increases were observed in Central South America, which has been the most deforested region in the last decades [51]. North America showed a BA increase in both time series [21,22], except in boreal regions which presented BA decrease in the long-term series.
Central Asia displayed a decrease in BA in both time series like Andela, et al. [21], Giglio, et al. [24], Hao, et al. [52] and Forkel, et al. [22], due to a wetter climate and increased grazing [52]. In Northwest Asia, a change in forest use practices caused a BA decrease in long-term series [53]. Finally, the Australian BA decreased in the north within the first years [21,22] and increased in the long-term series, while the opposite happened in the south, although Andela, et al. [21] suggested BA decrease in the short time series (1998–2015).
Development of the global FireCCILT11 product relied on a spatial stratification based on the GFED regions, which has the potential to cause discontinuities in spatio-temporal BA patterns at the border between those regions. However, such effects are absent at the great majority of borders. In a few cases, it is possible that the exact location of a border effect will have been determined by the transition between GFED regions (most notably between Europe (EURO) and Boreal Asia (BOAS). However, we believe this is just the sharpening of actual, non-artefactual changes in trends, because there is evidence of steep gradients in fire drivers, not only at the Europe/Boreal Asia border, but also at the border between Boreal and Temperate North America. In the latter case, Jolly, et al. [54] found a rather abrupt change in trends of fire season length between the Western USA and Canadian sides of the border, with a strong increase in season length on the American side and no trend on the Canadian side, similarly to the BA trends we detected. Two recent studies support our detection of a decreasing BA trend in Western Russia, although not exactly overlapping the large patch shown in Figure 11. Wu, et al. [55] detected significantly negative BA trends, based on data from GFED4, which accounts for small fires (unlike the MODIS MCD64A1 and the FireCCI51 products). Ryzhkova, et al. [53] performed a dendrochronological study in Karelia, near the border with Finland and reported a decrease in BA, albeit over the period 1930–2000, much longer than those covered by satellite data. Drobyshev, et al. [56] provide additional indirect evidence, in the form of contrasting fire weather severity trends (1901–2017) during the fire season, which decreased in Scandinavia and increased in Western Russia. It is also worth noting that the patch with significantly decreasing BA trend detected in Western Russia, although very large, occurs in a region that does not burn extensively. We acknowledge that most of this evidence is circumstantial, but our analysis is unique in mapping BA annually stretching back to the early 1980 and, therefore, no independent BA data set is available for comparison with of our results.
5. Conclusions
This spatiotemporal analysis has shown the BA global trends and patterns in a long-term series. Understanding global BA trends and regional patterns is very important to elucidate the dynamics of fire occurrence and the effect of climate change. Mann-Kendall analysis showed BA trends in a contextual approach, displaying consistent patterns and clusters. Although the spatiotemporal analysis was robust and the patterns were consistent across products and other studies, the results must be carefully analysed, considering the abovementioned limitations of the FireCCILT11 product.
Spatiotemporal trends showed significant differences in the short and long-term series. The short-term series presented smaller significant clusters, and more scattered patterns, and the long-term series displayed larger significant clusters. The common time series in both products showed similar trends and high correlation, although FireCCI51 trends were more consistent and larger due to the original resolution. Comparing significant trends between both short periods (1982–2000 and 2001–2018) of the FireCCILT11 product, small agreement clusters were found and trend changes were common. Different trends in short-term periods and long-term periods were found due to different patterns present in the time series.
Future research will seek to interpret the causes of the BA trends detected. An analysis that relates BA trends with different variables, such as land cover, land use change and climate change, will improve understanding of fire regimes and their dynamics.
Author Contributions
Conceptualization, G.O., J.M.C.P. and J.M.N.S.; Data curation, G.O.; Formal analysis, G.O.; Funding acquisition, E.C.; Investigation, G.O.; Methodology, G.O., J.M.C.P. and J.M.N.S.; Project administration, E.C.; Resources, E.C.; Software, G.O.; Supervision, J.M.C.P.; Visualization, G.O.; Writing—original draft, G.O.; Writing—review & editing, G.O., J.M.C.P., J.M.N.S. and E.C. All authors have read and agreed to the published version of the manuscript.
Funding
This research was funded by the ESA Climate Change Initiative (CCI) programme’s Fire_cci project, contract number 4000126706/19/I-NB (https://climate.esa.int/en/projects/fire/, last accessed on 15 October 2021). J.M.C.P. and J.M.N.S. were supported by the Forest Research Centre, a research unit funded by Fundação para a Ciência e a Tecnologia I.P. (FCT), Portugal (UIDB/00239/2020), and by the Associated Laboratory TERRA.
Data Availability Statement
The data analysed is freely available through the CCI Open Data Portal (https://climate.esa.int/en/odp/#/dashboard, last accessed on 15 October 2021).
Conflicts of Interest
The authors declare no conflict of interest. The funders had no role in the design of the study; in the collection, analyses, or interpretation of data; in the writing of the manuscript, or in the decision to publish the results.
References
- GCOS. The Global Observing System for Climate: Implementation Needs; GCOS-200; World Meteorological Organization: Geneva, Switzerland, 2016. [Google Scholar]
- Granier, C.; Bessagnet, B.; Bond, T.; D’Angiola, A.; van Der Gon, H.D.; Frost, G.J.; Heil, A.; Kaiser, J.W.; Kinne, S.; Klimont, Z. Evolution of anthropogenic and biomass burning emissions of air pollutants at global and regional scales during the 1980–2010 period. Clim. Chang. 2011, 109, 163–190. [Google Scholar] [CrossRef]
- Urbanski, S.P.; Hao, W.M.; Baker, S. Chemical composition of wildland fire emissions. Dev. Env. Sci. 2008, 8, 79–107. [Google Scholar]
- Ward, D.; Kloster, S.; Mahowald, N.; Rogers, B.; Randerson, J.; Hess, P. The changing radiative forcing of fires: Global model estimates for past, present and future. Atmos. Chem. Phys. 2012, 12, 10857–10886. [Google Scholar] [CrossRef] [Green Version]
- Chuvieco, E.; Lizundia-Loiola, J.; Pettinari, M.L.; Ramo, R.; Padilla, M.; Tansey, K.; Mouillot, F.; Laurent, P.; Storm, T.; Heil, A. Generation and analysis of a new global burned area product based on modis 250 m reflectance bands and thermal anomalies. Earth Syst. Sci. Data 2018, 10, 2015–2031. [Google Scholar] [CrossRef] [Green Version]
- Chuvieco, E.; Mouillot, F.; van der Werf, G.R.; San Miguel, J.; Tanasse, M.; Koutsias, N.; García, M.; Yebra, M.; Padilla, M.; Gitas, I. Historical background and current developments for mapping burned area from satellite earth observation. Remote Sens. Environ. 2019, 225, 45–64. [Google Scholar] [CrossRef]
- Giglio, L.; Boschetti, L.; Roy, D.P.; Humber, M.L.; Justice, C.O. The collection 6 modis burned area mapping algorithm and product. Remote Sens. Environ. 2018, 217, 72–85. [Google Scholar] [CrossRef] [PubMed]
- Lizundia-Loiola, J.; Otón, G.; Ramo, R.; Chuvieco, E. A spatio-temporal active-fire clustering approach for global burned area mapping at 250 m from modis data. Remote Sens. Environ. 2020, 236, 111493. [Google Scholar] [CrossRef]
- Mouillot, F.; Schultz, M.G.; Yue, C.; Cadule, P.; Tansey, K.; Ciais, P.; Chuvieco, E. Ten years of global burned area products from spaceborne remote sensing—A review: Analysis of user needs and recommendations for future developments. Int. J. Appl. Earth Obs. Geoinf. 2014, 26, 64–79. [Google Scholar] [CrossRef] [Green Version]
- Hantson, S.; Arneth, A.; Harrison, S.P.; Kelley, D.I.; Prentice, I.C.; Rabin, S.S.; Archibald, S.; Mouillot, F.; Arnold, S.R.; Artaxo, P. The status and challenge of global fire modelling. Biogeosciences 2016, 13, 3359–3375. [Google Scholar] [CrossRef] [Green Version]
- Pedelty, J.; Devadiga, S.; Masuoka, E.; Brown, M.; Pinzon, J.; Tucker, C.; Vermote, E.; Prince, S.; Nagol, J.; Justice, C.; et al. Generating a long-term land data record from the avhrr and modis instruments. In Proceedings of the IEEE International Geoscience and Remote Sensing Symposium, Barcelona, Spain, 23–28 July 2007; pp. 1021–1025, IGARSS 2007. [Google Scholar]
- Otón, G.; Lizundia-Loiola, J.; Pettinari, L.; Chuvieco, E. Development of a consistent global long-term burned area product (1982–2018) based on avhrr-ltdr data. Int. J. Appl. Earth Obs. Geoinf. 2021, 103, 102473. [Google Scholar] [CrossRef]
- Otón, G.; Ramo, R.; Lizundia-Loiola, J.; Chuvieco, E. Global detection of long-term (1982–2017) burned area with avhrr-ltdr data. Remote Sens. 2019, 11, 2079. [Google Scholar] [CrossRef] [Green Version]
- Eastman, J.R.; Sangermano, F.; Ghimire, B.; Zhu, H.; Chen, H.; Neeti, N.; Cai, Y.; Machado, E.A.; Crema, S.C. Seasonal trend analysis of image time series. Int. J. Remote Sens. 2009, 30, 2721–2726. [Google Scholar] [CrossRef]
- Neeti, N.; Eastman, J.R. A contextual mann-kendall approach for the assessment of trend significance in image time series. Trans. GIS 2011, 15, 599–611. [Google Scholar] [CrossRef]
- Neeti, N.; Rogan, J.; Christman, Z.; Eastman, J.R.; Millones, M.; Schneider, L.; Nickl, E.; Schmook, B.; Turner, B.L.; Ghimire, B. Mapping seasonal trends in vegetation using avhrr-ndvi time series in the yucatán peninsula, mexico. Remote Sens. Lett. 2012, 3, 433–442. [Google Scholar] [CrossRef]
- Mishra, N.B.; Crews, K.A.; Neeti, N.; Meyer, T.; Young, K.R. Modis derived vegetation greenness trends in african savanna: Deconstructing and localizing the role of changing moisture availability, fire regime and anthropogenic impact. Remote Sens. Environ. 2015, 169, 192–204. [Google Scholar] [CrossRef]
- Silva, J.M.; Moreno, M.V.; Le Page, Y.; Oom, D.; Bistinas, I.; Pereira, J.M.C. Spatiotemporal trends of area burnt in the iberian peninsula, 1975–2013. Reg. Env. Chang. 2019, 19, 515–527. [Google Scholar] [CrossRef]
- Urbieta, I.R.; Franquesa, M.; Viedma, O.; Moreno, J.M. Fire activity and burned forest lands decreased during the last three decades in spain. Ann. For. Sci. 2019, 76, 1–13. [Google Scholar] [CrossRef]
- Zubkova, M.; Boschetti, L.; Abatzoglou, J.T.; Giglio, L. Changes in fire activity in africa from 2002 to 2016 and their potential drivers. Geophys. Res. Lett. 2019, 46, 7643–7653. [Google Scholar] [CrossRef] [Green Version]
- Andela, N.; Morton, D.C.; Giglio, L.; Chen, Y.; van der Werf, G.R.; Kasibhatla, P.S.; DeFries, R.S.; Collatz, G.; Hantson, S.; Kloster, S. A human-driven decline in global burned area. Science 2017, 356, 1356–1362. [Google Scholar] [CrossRef] [PubMed] [Green Version]
- Forkel, M.; Dorigo, W.; Lasslop, G.; Chuvieco, E.; Hantson, S.; Heil, A.; Teubner, I.; Thonicke, K.; Harrison, S.P. Recent global and regional trends in burned area and their compensating environmental controls. Env. Res. Commun. 2019, 1, 051005. [Google Scholar] [CrossRef]
- Earl, N.; Simmonds, I. Spatial and temporal variability and trends in 2001–2016 global fire activity. J. Geophys. Res. Atmos. 2018, 123, 2524–2536. [Google Scholar] [CrossRef]
- Giglio, L.; Randerson, J.T.; Werf, G.R. Analysis of daily, monthly, and annual burned area using the fourth generation global fire emissions database (gfed4). J. Geophys. Res. Biogeosciences 2013, 118, 317–328. [Google Scholar] [CrossRef] [Green Version]
- Canadian Forest Service. Canadian National Fire Database—Agency Fire Data. Natural Resources Canada, Canadian Forest Service, Northern Forestry Centre, Edmonton, Alberta. 2017. Available online: http://cwfis.cfs.nrcan.gc.ca/ha/nfdb, (accessed on 15 October 2021).
- North Australia; Rangelands Fire Information. Fire Scars. 2021. Available online: www.firenorth.org.au/nafi2, (accessed on 15 October 2021).
- Alaska Interagency Coordination Center. Alaska Fire History Perimeters 1940–2020. 2021. Available online: https://fire.ak.blm.gov/predsvcs/maps.php, (accessed on 15 October 2021).
- Otón, G.; Franquesa, M.; Lizundia-Loiola, J.; Chuvieco, E. Validation of low spatial resolution and no-dichotomy global long-term burned area product by pareto boundary. In Earth Resources and Environmental Remote Sensing/GIS Applications XII, Proceedings of the SPIE 1186312; Online, 12 September 2021, Volume 1186313, pp. 293–299.
- European Space Agency and Fire_cci Project Team. Fire. 2021. Available online: https://climate.esa.int/en/odp/#/dashboard (accessed on 15 October 2021).
- ESA. Land cover cci: Algorithm Theoretical Basis Document Version 2; ESA: Louvain, Belgium, 2013; p. 191. Available online: https://climate.esa.int/media/documents/Land_Cover_CCI_ATBDv2_2.3.pdf, (accessed on 15 October 2021).
- Copernicus. Algorithm Theoretical Basis Document, ICDR Land Cover 2016; Copernicus Climate Change Service: Louvain, Belgium, 2019; p. 62. Available online: https://cds.climate.copernicus.eu/ (accessed on 15 October 2021).
- Durbin, J.; Watson, G.S. Testing for serial correlation in least squares regression: I. Biometrika 1950, 37, 409–428. [Google Scholar] [PubMed]
- Wang, X.L.; Swail, V.R. Changes of extreme wave heights in northern hemisphere oceans and related atmospheric circulation regimes. J. Clim. 2001, 14, 2204–2221. [Google Scholar] [CrossRef]
- Copernicus Programme. Land Cover Classification Gridded Maps from 1992 To Present Derived from Satellite Observations. 2021. Available online: https://cds.climate.copernicus.eu/cdsapp#!/dataset/satellite-land-cover (accessed on 15 October 2021).
- Yue, S.; Wang, C.Y. Regional streamflow trend detection with consideration of both temporal and spatial correlation. Int. J. Climatol. A J. R. Meteorol. Soc. 2002, 22, 933–946. [Google Scholar] [CrossRef]
- Douglas, E.; Vogel, R.; Kroll, C. Trends in floods and low flows in The United States: Impact of spatial correlation. J. Hydrol. 2000, 240, 90–105. [Google Scholar] [CrossRef]
- Kendall, M.G. Rank Correlation Methods; Charles Griffin: London, UK, 1975. [Google Scholar]
- Mann, H.B. Nonparametric tests against trend. Econom. J. Econom. Soc. 1945, 13, 245–259. [Google Scholar] [CrossRef]
- Chandler, R.; Scott, M. Statistical Methods for Trend Detection and Analysis in the Environmental Sciences; John Wiley & Sons: Chichester, UK, 2011. [Google Scholar]
- Fuller, D.O.; Wang, Y. Recent trends in satellite vegetation index observations indicate decreasing vegetation biomass in the southeastern saline everglades wetlands. Wetlands 2014, 34, 67–77. [Google Scholar] [CrossRef]
- Theil, H. A rank-invariant method of linear and polynomial regression analysis. Indag. Math. 1950, 12, 173. [Google Scholar]
- Sen, P.K. Estimates of the regression coefficient based on kendall’s tau. J. Am. Stat. Assoc. 1968, 63, 1379–1389. [Google Scholar] [CrossRef]
- Carmona-Moreno, C.; Belward, A.; Malingreau, J.P.; Hartley, A.; Garcia-Alegre, M.; Antonovskiy, M.; Buchshtaber, V.; Pivovarov, V. Characterizing interannual variations in global fire calendar using data from earth observing satellites. Glob. Chang. Biol. 2005, 11, 1537–1555. [Google Scholar] [CrossRef]
- Yang, J.; Tian, H.; Tao, B.; Ren, W.; Kush, J.; Liu, Y.; Wang, Y. Spatial and temporal patterns of global burned area in response to anthropogenic and environmental factors: Reconstructing global fire history for the 20th and early 21st centuries. J. Geophys. Res. Biogeosci. 2014, 119, 249–263. [Google Scholar] [CrossRef]
- Lizundia-Loiola, J.; Pettinari, M.L.; Chuvieco, E. Temporal anomalies in burned area trends: Satellite estimations of the amazonian 2019 fire crisis. Remote Sens. 2020, 12, 151. [Google Scholar] [CrossRef] [Green Version]
- Chuvieco, E.; Pettinari, M.L.; Koutsias, N.; Forkel, M.; Hantson, S.; Turco, M. Human and climate drivers of global biomass burning variability. Sci. Total Env. 2021, 779, 146361. [Google Scholar] [CrossRef] [PubMed]
- Bowman, D.; Williamson, G.; Yebra, M.; Lizundia-Loiola, J.; Pettinari, M.L.; Shah, S.; Bradstock, R.; Chuvieco, E. Wildfires: Australia Needs National Monitoring Agency. Nature 2020, 584, 188–191. [Google Scholar] [CrossRef]
- Roteta, E.; Bastarrika, A.; Padilla, M.; Storm, T.; Chuvieco, E. Development of a sentinel-2 burned area algorithm: Generation of a small fire database for sub-saharan africa. Remote Sens. Environ. 2019, 222, 1–17. [Google Scholar] [CrossRef]
- Laris, P.S. Spatiotemporal problems with detecting and mapping mosaic fire regimes with coarse-resolution satellite data in savanna environments. Remote Sens. Environ. 2005, 99, 412–424. [Google Scholar] [CrossRef]
- Ramo, R.; Roteta, E.; Bistinas, I.; Van Wees, D.; Bastarrika, A.; Chuvieco, E.; Van der Werf, G.R. African burned area and fire carbon emissions are strongly impacted by small fires undetected by coarse resolution satellite data. Proc. Natl. Acad. Sci. USA 2021, 118, 1–7. [Google Scholar] [CrossRef]
- Song, X.-P.; Hansen, M.C.; Stehman, S.V.; Potapov, P.V.; Tyukavina, A.; Vermote, E.F.; Townshend, J.R. Global land change from 1982 to 2016. Nature 2018, 560, 639–643. [Google Scholar] [CrossRef] [PubMed]
- Hao, W.M.; Reeves, M.C.; Baggett, L.S.; Balkanski, Y.; Ciais, P.; Nordgren, B.L.; Petkov, A.; Corley, R.E.; Mouillot, F.; Urbanski, S.P. Wetter environment and increased grazing reduced the area burned in northern eurasia from 2002 to 2016. Biogeosciences 2021, 18, 2559–2572. [Google Scholar] [CrossRef]
- Ryzhkova, N.; Pinto, G.; Kryshen, A.; Bergeron, Y.; Ols, C.; Drobyshev, I. Multi-century reconstruction suggests complex interactions of climate and human controls of forest fire activity in a karelian boreal landscape, north-west russia. For. Ecol. Manag. 2020, 459, 117770. [Google Scholar] [CrossRef]
- Jolly, W.M.; Cochrane, M.A.; Freeborn, P.H.; Holden, Z.A.; Brown, T.J.; Williamson, G.J.; Bowman, D.M. Climate-induced variations in global wildfire danger from 1979 to 2013. Nat. Commun. 2015, 6, 1–11. [Google Scholar] [CrossRef]
- Wu, C.; Venevsky, S.; Sitch, S.; Mercado, L.M.; Huntingford, C.; Staver, A.C. Historical and future global burned area with changing climate and human demography. One Earth 2021, 4, 517–530. [Google Scholar] [CrossRef]
- Drobyshev, I.; Ryzhkova, N.; Eden, J.; Kitenberga, M.; Pinto, G.; Lindberg, H.; Krikken, F.; Yermokhin, M.; Bergeron, Y.; Kryshen, A. Trends and patterns in annually burned forest areas and fire weather across the european boreal zone in the 20th and early 21st centuries. Agric. For. Meteorol. 2021, 306, 108467. [Google Scholar] [CrossRef]
Figure 1.
Outline of the methodology used to process the FireCCILT11 and FireCCI51 data.

Figure 2.
Comparison of Z–score, obtained by the CMK approach, between the three different spatial resolution in the FireCCILT11 (1982–2018) dataset.
Figure 2.
Comparison of Z–score, obtained by the CMK approach, between the three different spatial resolution in the FireCCILT11 (1982–2018) dataset.

Figure 3.
Comparison between the significant trends in the four datasets (confidence level of 95%).

Figure 4.
Spatial representation (0.5°) of Z–score of the increase and decrease trends of BA in the short-term series (FireCCI51, 2001–2018).
Figure 4.
Spatial representation (0.5°) of Z–score of the increase and decrease trends of BA in the short-term series (FireCCI51, 2001–2018).

Figure 5.
Significant trends of BA in the short-term series (2001–2018) for the high-resolution BA product (FireCCI51), selecting a confidence level of 95%.
Figure 5.
Significant trends of BA in the short-term series (2001–2018) for the high-resolution BA product (FireCCI51), selecting a confidence level of 95%.

Figure 6.
Significant trends of BA (with a confidence level of 95%) in the short-term series (2001–2018) for the low-resolution BA product (FireCCILT11).
Figure 6.
Significant trends of BA (with a confidence level of 95%) in the short-term series (2001–2018) for the low-resolution BA product (FireCCILT11).

Figure 7.
Spatial correlation between the common time series (2001–2018) of both BA datasets.

Figure 8.
Spatial comparison (Agreement-Disagreement) of significant trends between the common time series (2001–2018) of the burned area datasets.
Figure 8.
Spatial comparison (Agreement-Disagreement) of significant trends between the common time series (2001–2018) of the burned area datasets.

Figure 9.
Significant trends of BA (with a confidence level of 95%) in the short-term series from 1982 to 2000 (FireCCILT11).
Figure 9.
Significant trends of BA (with a confidence level of 95%) in the short-term series from 1982 to 2000 (FireCCILT11).

Figure 10.
Spatial comparison (Agreement-Trend change) of significant trends between the 1982–2000 period and the 2001–2018 period of the FireCCILT11 BA product.
Figure 10.
Spatial comparison (Agreement-Trend change) of significant trends between the 1982–2000 period and the 2001–2018 period of the FireCCILT11 BA product.

Figure 11.
Significant trends of BA (with a confidence level of 95%) in the long-term series from 1982 to 2018 (FireCCILT11) at 0.5° resolution.
Figure 11.
Significant trends of BA (with a confidence level of 95%) in the long-term series from 1982 to 2018 (FireCCILT11) at 0.5° resolution.

Publisher’s Note: MDPI stays neutral with regard to jurisdictional claims in published maps and institutional affiliations. |
© 2021 by the authors. Licensee MDPI, Basel, Switzerland. This article is an open access article distributed under the terms and conditions of the Creative Commons Attribution (CC BY) license (https://creativecommons.org/licenses/by/4.0/).
Share and Cite
MDPI and ACS Style
Otón, G.; Pereira, J.M.C.; Silva, J.M.N.; Chuvieco, E. Analysis of Trends in the FireCCI Global Long Term Burned Area Product (1982–2018). Fire 2021, 4, 74. https://0-doi-org.brum.beds.ac.uk/10.3390/fire4040074
AMA Style
Otón G, Pereira JMC, Silva JMN, Chuvieco E. Analysis of Trends in the FireCCI Global Long Term Burned Area Product (1982–2018). Fire. 2021; 4(4):74. https://0-doi-org.brum.beds.ac.uk/10.3390/fire4040074
Chicago/Turabian StyleOtón, Gonzalo, José Miguel C. Pereira, João M. N. Silva, and Emilio Chuvieco. 2021. "Analysis of Trends in the FireCCI Global Long Term Burned Area Product (1982–2018)" Fire 4, no. 4: 74. https://0-doi-org.brum.beds.ac.uk/10.3390/fire4040074