Frequency Masking Effects for Vertical Whole-Body Vibration for Seated Subjects


1
Centre for Tactile Internet with Human-in-the-Loop (CeTI), Technische Universtät Dresden, 01062 Dresden, Germany
2
Chair of Acoustical and Haptic Engineering, Technische Universtät Dresden, 01062 Dresden, Germany
*
Author to whom correspondence should be addressed.
Vibration 2020, 3(4), 357-370; https://0-doi-org.brum.beds.ac.uk/10.3390/vibration3040024
Submission received: 24 September 2020
/
Revised: 9 October 2020
/
Accepted: 16 October 2020
/
Published: 20 October 2020
Abstract
:Masking occurs when the perception of a stimulus is affected or covered by the presence of another signal in close proximity either in time or frequency. This study investigated frequency masking effects across a wide frequency range for whole-body vibration (WBV). The hypothesis that masking effects for WBV might be caused by sub-channels within the Pacinian channel was explored in two experiments. One experiment explored the masking effects of narrow band noise (NBN) on the perception threshold of sinusoidal vibrations; another explored the effect of different widths of NBN on the shift of the perception threshold for vertical vibration of seated subjects. The results show distinct masking effects for WBV based on frequency, albeit they do not support the existence of sub-channels within the Pacinian channel. Neither the typical masking effects associated with critical bands nor threshold shifts dependent on the bandwidth of the narrow band noise can be shown. Thus, the hypothesis does not appear to hold for WBV, but frequency masking must be considered for future studies and tactile applications.
1. Introduction
Whole-body vibration (WBV) is an integral part of everyday life. It occurs in numerous situations of professional and private life, e.g., at industrial sites, while moving in vehicles or during music events. Studies on the effect of WBV on occupational health have helped to drive technical development that has significantly reduced vibration and noise levels that humans experience in many situations today. In the early 20th century, studies on occupational health examined the influence of WBV on humans. Reiher and Meister [1] and Meister [2] studied human sensitivity of shocks and vibration and their influence on health in the 1930s.
Although research on occupational health remains important today, newer research, especially in the automotive industry, also focuses on comfort and quality [3,4,5,6]. However, the perception of comfort and quality is dependent on the overall context of the evaluation. For example, the comfort of the same vibration might be rated differently depending on the car in which the test subject is sitting. Different measures that are independent of situation and context can be a solution for this problem. Examples from the auditory domain for measures that are not context-sensitive are loudness, sharpness, and harshness. Psychoacoustics studied and modeled these measures [7,8,9] using masking patterns among other psychophysical effects. Apart from describing and evaluating the human perception of auditory signals, these models are used for audio codecs and compression algorithms as well, such as mp3 [10]. Two kinds of masking are exploited in codecs: temporal masking and frequency masking. Temporal masking for WBV has already been covered by Schwendicke et al. [11]; this study focuses on frequency masking. Although the receptors involved in the perception of sound and WBV differ, research has shown many parallels between auditory and WBV perception. These findings lead to the implementation of similar experiment designs for both modalities. Based on the historic focus on occupational health, modeling for WBV focuses on discomfort [12,13], health effect and biodynamic models [14]. The description of tactile perception has been built on results of experiments using the thenar eminence [15,16] and index fingers [17]. These results are the basis for predicting the perception of whole-body vibration. However, hairy skin slightly differs in tactile perception from glabrous skin and additionally the perception of WBV is influenced by a variety of additional factors both inter- and intra-individually, such as body size, body dynamics, posture, and gender [3].
The perception of whole-body vibration is the result of a complex system of multiple mechanoreceptors. Four different classes can be distinguished: two kinds of slowly adapting receptors (SA), rapidly adapting receptors (RA), and Pacinian corpuscles (PC). In glabrous skin, SA-I receptors are associated with Merkel disks, SA-II with Ruffini endings, RA receptors with Meissner corpuscles. In hairy skin, Meissner corpuscles are missing instead, hair follicle afferent (HFA) fibers are present. Only the PCs function as spatial and temporal integrators [18]. The frequency ranges of the individual mechanoreceptors overlap. They react by displacement (SA), velocity (RA), or acceleration (PC). Historically the afferent classes are associated with only one function for each, but recent studies show that while different afferents respond to different aspects of skin deformation, in naturalistic contexts all kinds are activated during most tactile interactions [19]. The overall perception consists of the combination of the input from all afferent classes. In part, because of the different afferents, hairy and glabrous skin partially differ in vibration perception. For instance, there is a marked difference in detection threshold between both sites, while vibrotactile discriminative performance is very similar [20].
Different two-channel [21] and four-channel models [22] have been proposed for tactile perception based on mechanoreceptors or groups thereof. Bensmaïa et al. [23] proposed a model with a set of minichannels within the Pacinian channel characterizing the Pacinian representation of stimulus waveforms. Previous WBV experiments by Stamm [24], and Stamm et al. [25] suggest that sub-channels for the perception of WBV, similar to critical bands in auditory perception, might exist within the frequency range of Pacinian corpuscles. Chaudhari et al. [26] show similar masking curves for holding a vibrating pen in the dominant hand in the frequency range from 80 to 360 Hz.
This study focuses on measuring masking curves for whole-body vibration with the intent to verify whether they could stem from sub-channels of the Pacinian channel. In the past, psychoacoustics used different methods to determine critical bandwidth. One of the easiest methods is the measuring of frequency masking curves, but other methods include notched noise, band-widening or psychophysical tuning curves. This study uses two different kinds of experiments, i.e., frequency masking and band-widening. The first set of experiments explores the effects of narrow band noise (NBN) maskers on the perception threshold for WBV across a wide range of frequencies up to 500 Hz. These results are complemented by a second set of experiments using band-widening. This kind of experiment was first used in auditory perception by Gässler [27]. He found that while increasing the number of equidistant tones, or equally by increasing the bandwidth of a noise-signal, the threshold in quiet drops as long as all tones are within the critical bandwidth, but remains constant once parts are outside that bandwidth. In this study, we use varying widths of NBN with the same center frequency to determine differences in perception threshold.
2. Experiments
Previous studies [28,29] of WBV perception thresholds for seated subjects document large inter-individual differences in perception threshold for single frequencies. Thus, all threshold shift measurements in this study are based on individual perception thresholds.
2.1. Threshold Shift Caused by Narrow Band Maskers
2.1.1. Setup
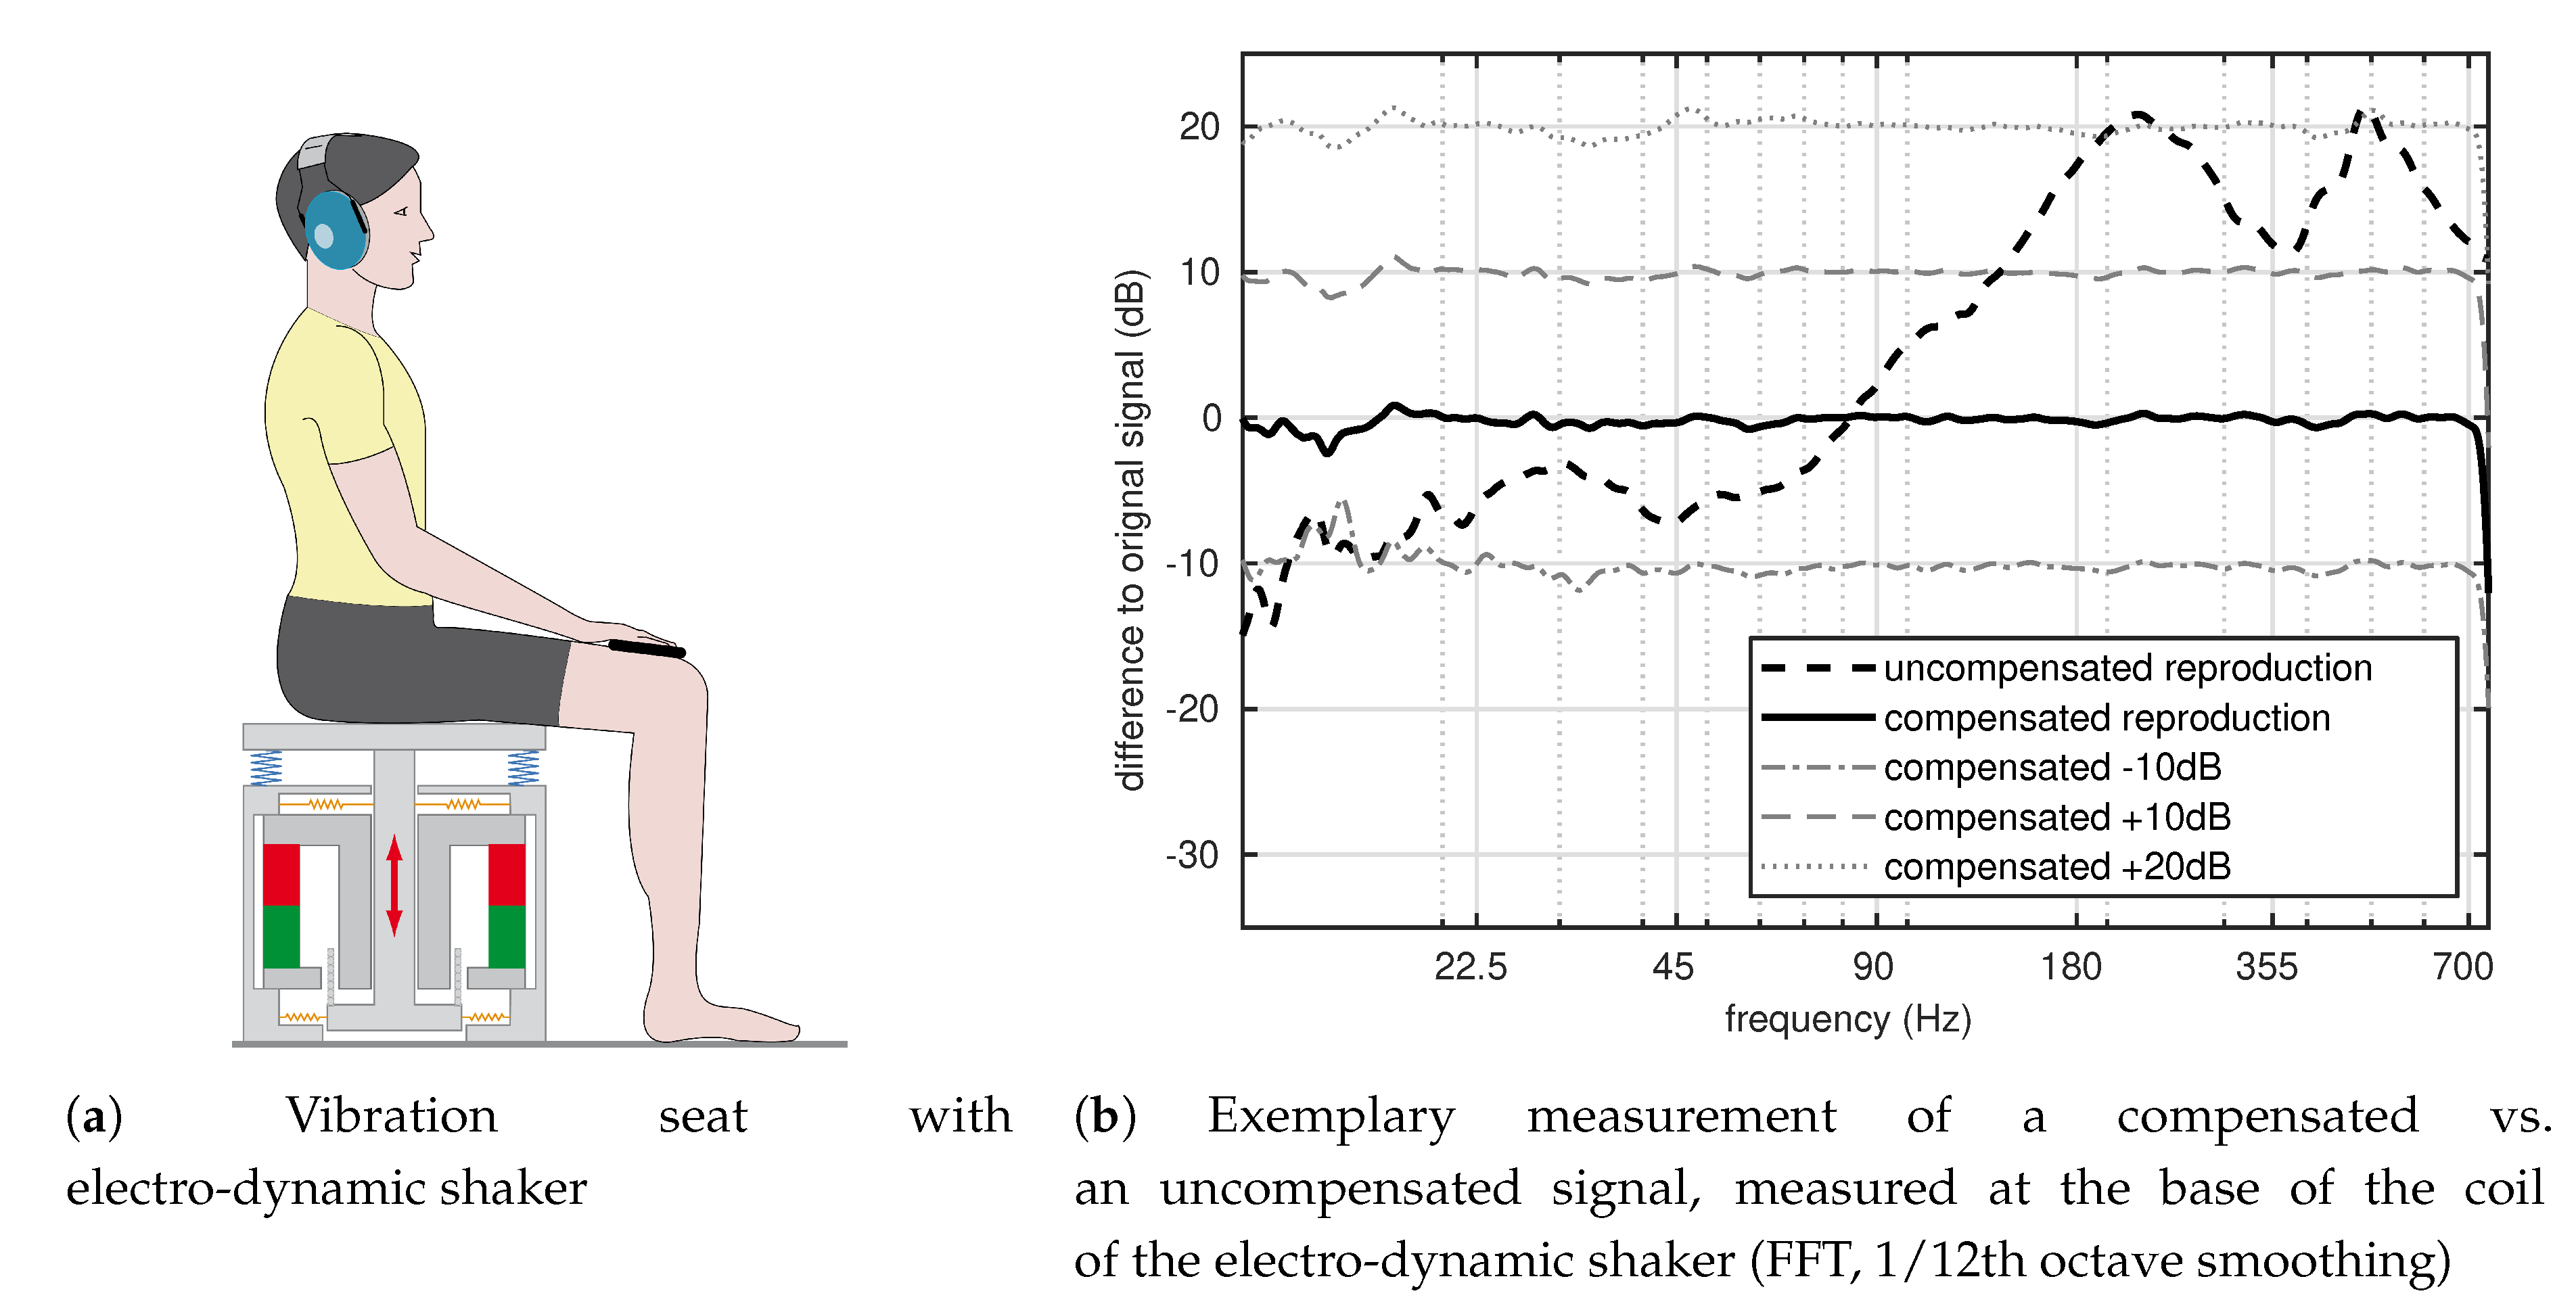
The subjects were sitting upright on a vibration seat without a backrest. The vibration seat’s construction is based on an electro-dynamic shaker (VEB Schwingungstechnik und Akustik WIB Dresden Type 201) with a flat wooden surface (460 × 460 mm) mounted on top. Strong springs between the shaker chassis and the wooden plate balance the weight of the subject and keep the coil of the shaker approximately in the middle position, as shown in Figure 1a. The shaker is fixed to allow only vertical vibrations. During the experiments, the subjects were asked to have both feet on the floor and their hands in their lap holding an external number pad to provide feedback during alternative forced choice (AFC) trials. To ensure that the subjects’ thighs are approximately horizontal and level with the seat, additional spacing plates were placed between the subjects’ feet and the floor for short persons. During the experiment, the experiment leader made sure that the test persons were sitting straight and, if necessary, reminded them to straighten up again.
The transfer characteristic of the shaker and subject is not linear and strongly dependent on the individual subject [30]. This effect is known as body related transfer function (BRTF), comparable to the head related transfer function (HRTF) for audio reproduction. To compensate for the transfer characteristic, the BRTF was measured for every subject and session using an acceleration sensor (Kistler 8692C10) read via a Sinus Harmonie quadro measuring card. The sensor is securely fastened to the base of the piston which is connected to the moving wooden surface. All vibration signals were compensated individually before playback using inverse filters. Based on the recorded BRTF, these FIR-filters were constructed using the filtfilt command in Matlab for zero-phase filtering, in order to compensate inter-individual differences in the transfer function within a 2 dB range. Figure 1b illustrates the compensation effect for one subject measured with a White Noise. In addition to the compensated original signal, the compensated version of amplified and attenuated white noise signals are shown as well. This demonstrates that the setup works quite linearly and can achieve deviations of 2 dB or less over a large dynamic range. Subjects wore closed headphones (Sennheiser HDA 200) during the experiment. These were used to attenuate sounds from the surroundings and to play back pink noise at 69 dB(A) simultaneously with each vibration signal to mask any noise emitted acoustically at higher frequencies by the vibration chair. Auditory masking is a precaution, as WBV can induce faint hearing perception at the frequency of the vibration, independently from acoustically transmitted sound [31]. Audio and vibration signal were played back using an external sound card (Hammerfall DSP Multiface II); vibration signals were additionally amplified using an Alesis RA 150 amplifier.
2.1.2. Stimuli and Experimental Design
The experiment is split into two parts, examining different frequency ranges. Part A investigates frequencies from 100 Hz to 500 Hz using 1/3 octave steps, focusing on the frequency range of Pacinian corpuscles only. Part B investigates frequencies from 22.5 Hz to 250 Hz using 1/2 octave steps, thus covering the frequency ranges of multiple mechanoreceptor types: SA, RA and PC. During the first individual session for each subject, the individual WBV perception threshold was determined for each of the eight sinusoidal vibrations of the respective frequency range. In the following session(s), the threshold shift caused by a masker was measured. Both measures were determined using an adaptive 1up-2down 3 AFC method with 3 reversals at the final step size [32,33]. To prevent beating effects, narrow band noise was chosen as a masker instead of pure tones. Three masking frequencies were tested in each part of the experiment: 160 Hz, 200 Hz, and 315 Hz with a bandwidth of 25 Hz for part A, 45 Hz with a bandwidth of 9 Hz, and 90 Hz and 125 Hz with a bandwidth of 25 Hz for part B. To account for the strong inter-individual differences of the perception threshold of up to 35 dB for single frequencies, the level for the masker was set at 22 dB sensation level (SL), based on the individual threshold of each participant. This ensures that all subjects perceive the masker at approximately the same strength. The testing order of the frequencies was randomized for each subject and non-interleaved. Individual stimuli had a duration of one second and were separated by a 0.5 s pause from the next stimulus. All signals were faded in and out using 50 ms 1/2-Hanning window flanks. The experiment was split into multiple sessions for each subject, one for the threshold determination of pure tone, and additional sessions for each masking frequency tested. Each session lasted approximately 40 to 50 min, with a minimum 15-min pause in-between sessions.
2.1.3. Subjects
A total of 43 subjects (22 male, 21 female) participated in part A of the experiment. Some subjects participated in all three masking frequencies, the majority only for one or two masking frequencies. All participants voluntarily took part in the study, the majority being students at the Technische Universität Dresden. Most subjects were between 22 and 30 years old (median age was 25 years old), their heights were between 1.54 m and 1.94 m (median = 1.76 m), and their weights ranged from 49 kg to 107.5 kg (median = 70 kg). Their respective body mass indexes (BMIs) were between 18.22 and 31.75 (median = 22.21). All subjects indicated they did not have spinal disorders. The threshold shift for each masking frequency was measured with 20 subjects each. These groups were different, partially overlapping subgroups of the total group of 43 subjects (for fc = 160 Hz: 11 male, and 10 female; for fc = 200 Hz: 9 male, and 11 female; and for fc = 315 Hz: 11 male, and 9 female).
Part B was executed with a total of 41 subjects (21 male, 20 female). As in the first part, some of the subjects participated for all three masking frequencies, while others only participated for one or two masking frequencies. Most of the subjects were students at the university, and they were getting paid on an hourly basis. The group of subjects was slightly younger. Most of the subjects were between 22 and 25 years old, median age was 25 years old. Their heights were between 1.56 m and 1.96 m (median = 1.75 m), and their weights ranged from 48 kg to 120 kg (median = 68 kg). The corresponding BMIs were between 17.93 and 39.74 (median = 22.15). The threshold shift for each masking frequency was measured with approximately 20 subjects each. These groups were different, partially overlapping subgroups of the total group of 41 subjects (for fc = 45 Hz: 10 male, 11 female; for fc = 90 Hz: 14 male, 9 female; for fc = 125 Hz 10 male, 10 female). All procedures performed in these experiments involving human participants were approved by the ethics committee of the Technische Universität Dresden.
2.1.4. Results
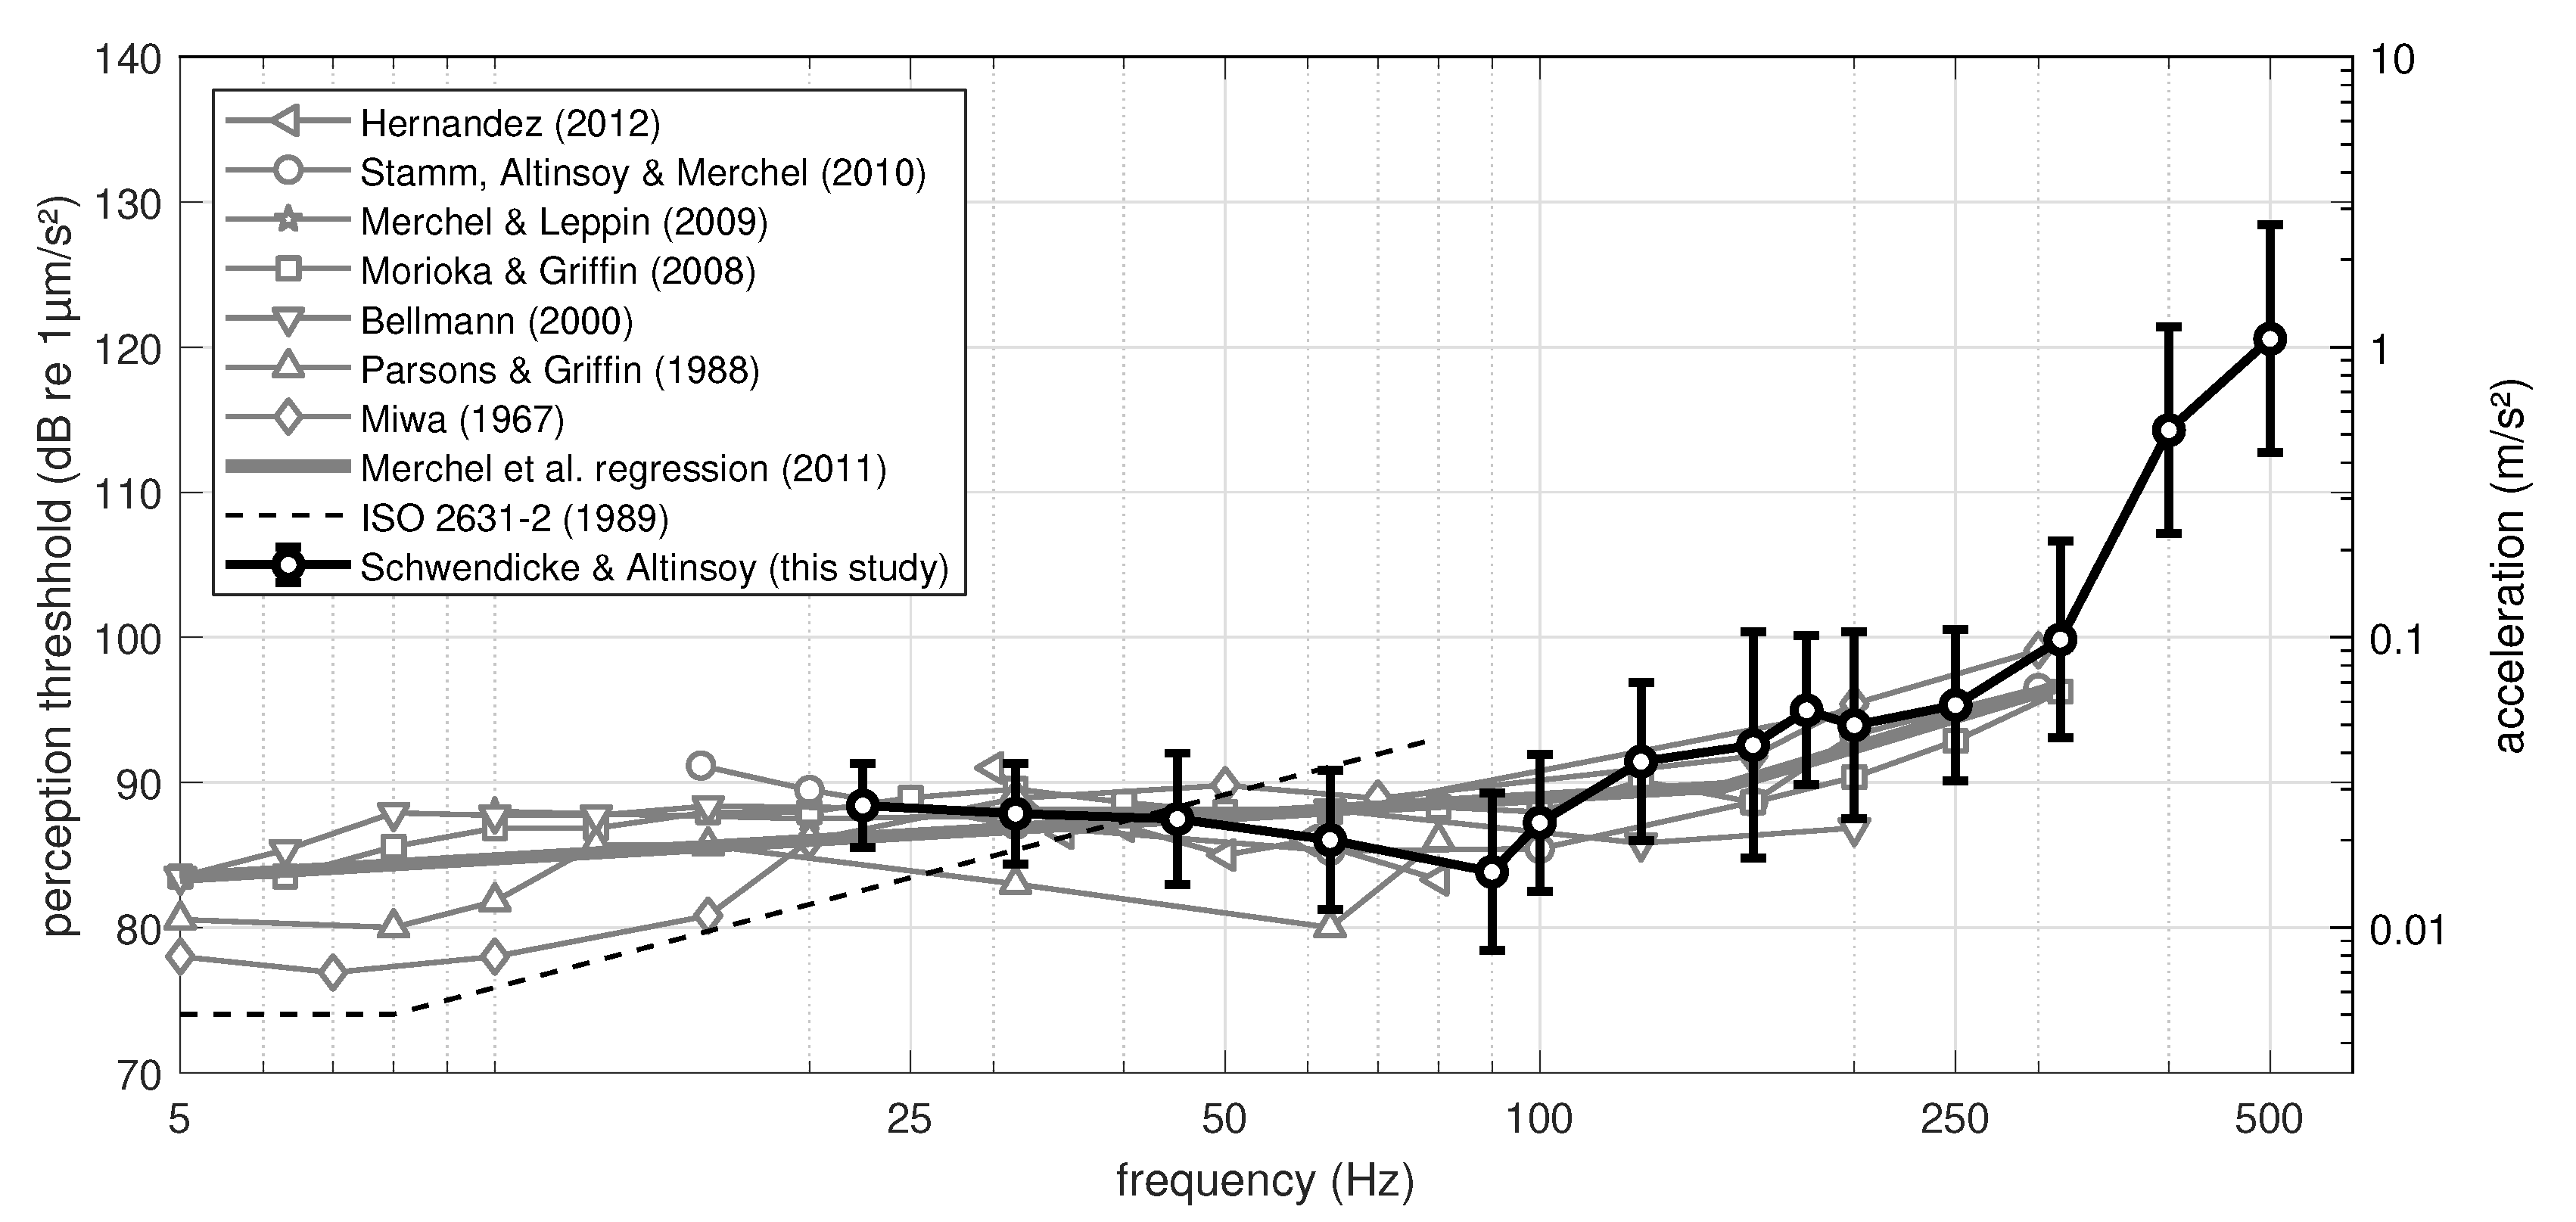
Figure 2 gives an overview of perception thresholds for seated WBV measured by different laboratories [4,25,28,34,35,36,37], including a first order regression by Merchel et al. [38] for the data up to 315 Hz, as well as the means and standard deviations from this study. The mean data of this study fits well into the range of reported means across different laboratories up to 315 Hz. Above 315 Hz, however, the threshold rises significantly steeper than expected by a pure interpolation from the data known previously. This steep climb is reminiscent of the steep rise of the listening threshold at the upper end of the frequency hearing range. The standard deviation increases with increasing frequency. Overall, the standard deviation of five to eight decibels is very large and substantially bigger than the just noticeable difference in frequency (JNDF) of about 1 to 1.5 dB. There are large inter-individual differences with individual outliers whose thresholds deviate by several decibels from the interquartile range of the test persons. In contrast to the large inter-individual differences, intra-individual differences were low and the medium standard deviation for perception threshold for an individual person for a single frequency is only 1.2 dB.
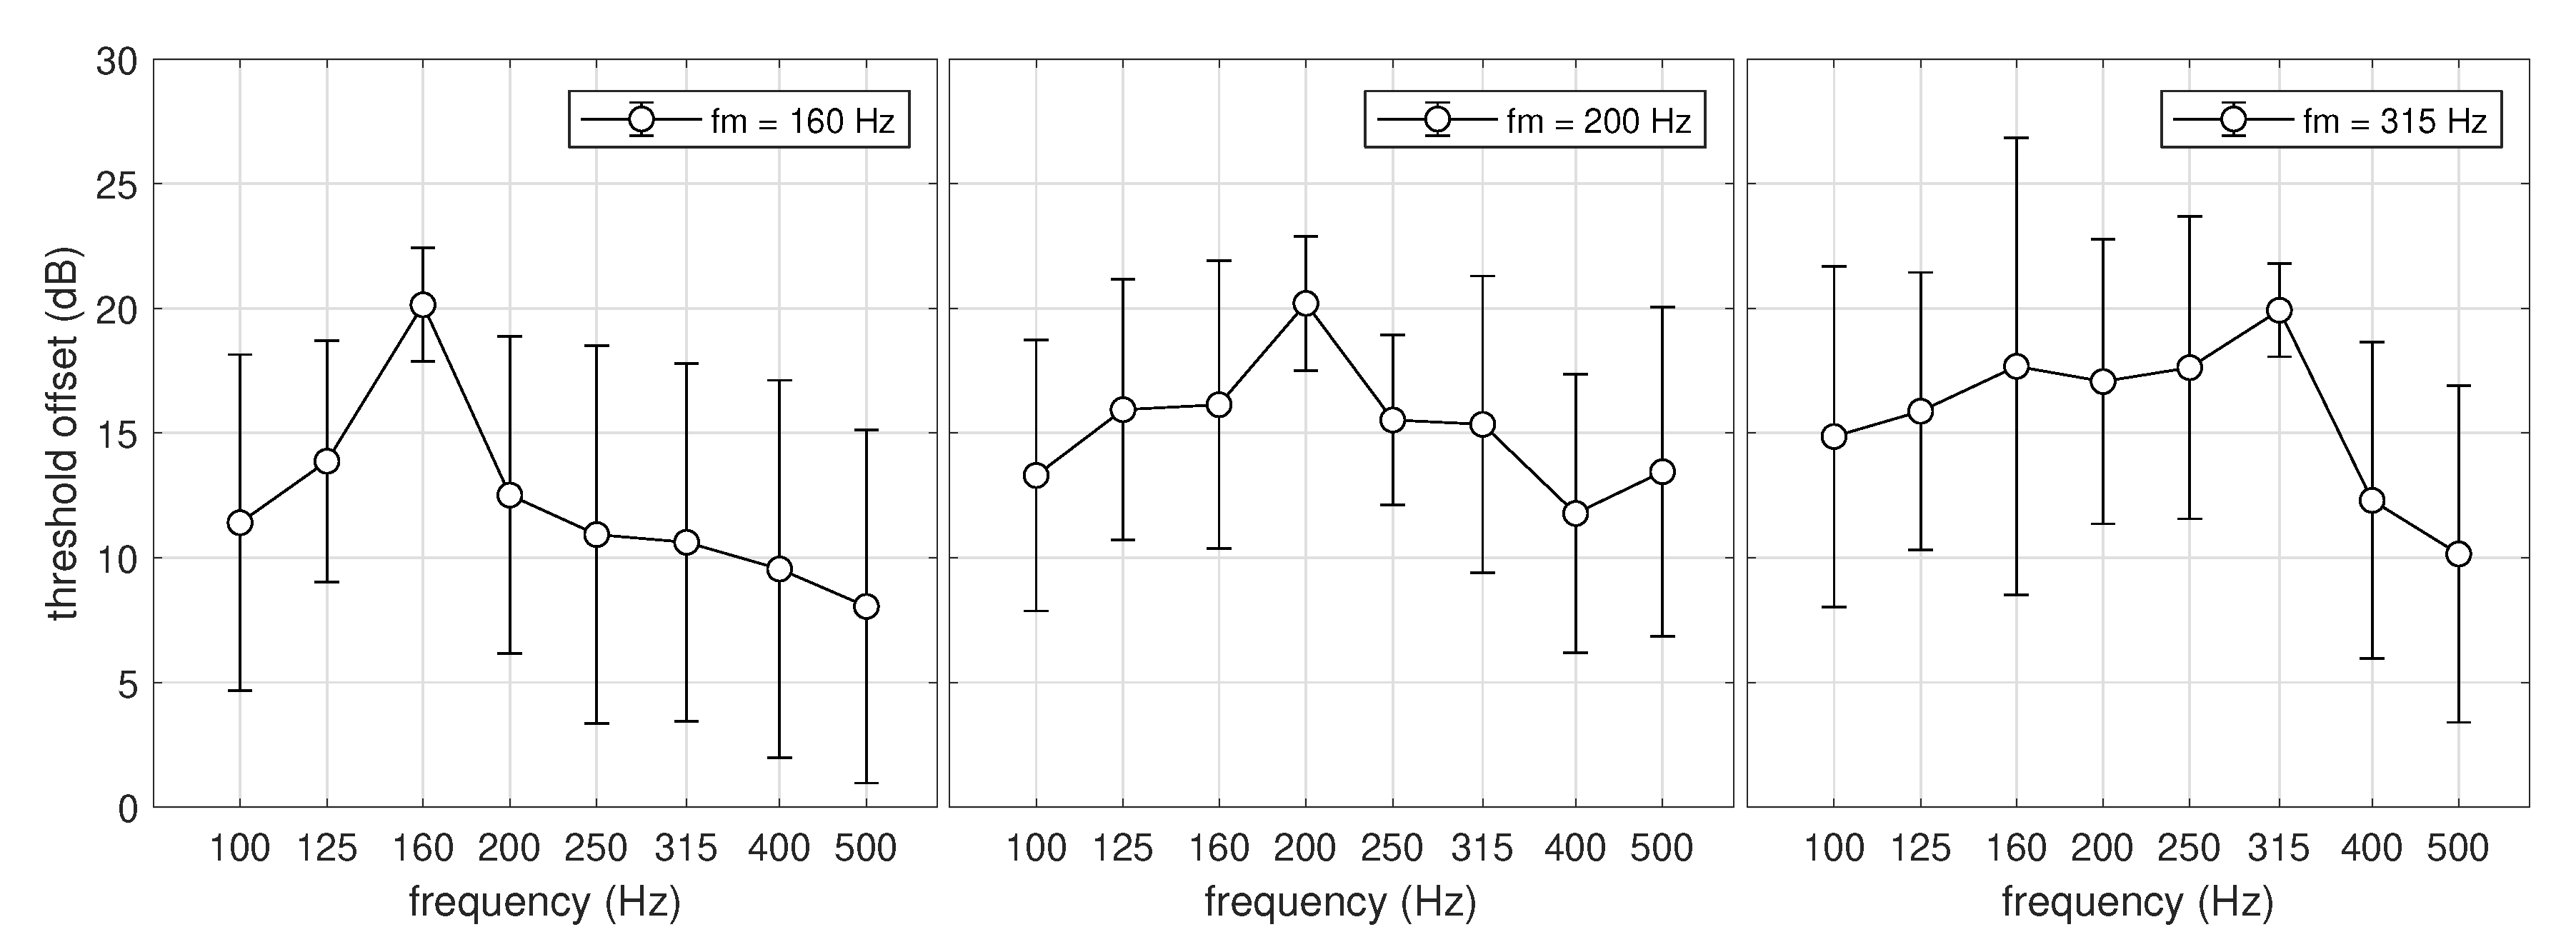
Figure 3 shows the results of the threshold shifts caused by NBN maskers of part A of the experiment. For each of the three masking frequencies of 160 Hz, 200 Hz, and 315 Hz, the threshold shift is shown across the frequency range of 100 Hz to 500 Hz. As for the WBV perception threshold, the standard deviations across subjects are large, on average 5.0 dB. However, individual results are consistent, and the average standard deviation of threshold shifts for individual subjects is 1.3 dB. A repeated measure ANOVA and pairwise comparison using Bonferroni is used to evaluate the data. Table 1 shows the results of testing the data for normal distribution using an Anderson-Darling test. Most of the data passes the test, but variances differ across frequencies. A Levene’s test for equality of variance rejects the null hypothesis for all three masking frequencies (), but keeps the null hypothesis if the masker frequency is excluded. Thus, the threshold shift is evaluated for frequencies other than the masking frequency only.
For fc = 160 Hz, Mauchly’s test indicated that the assumption of sphericity has been violated: , therefore the degrees of freedom were corrected using Greenhouse–Geisser estimate of sphericity . The results show that there is no significant effect of the threshold shift caused by masking for different frequencies: . The amount of masking is approximately the same for all frequencies other than the frequency of the masker. For fc = 200 Hz, Mauchly’s test indicated that the assumption of sphericity has not been violated: . The results show that there is a significant effect of the threshold shift caused by masking for different frequencies: . However, the pairwise comparison using Bonferroni does not indicate significant differences with . For fc = 315 Hz, Mauchly’s test indicated that the assumption of sphericity has not been violated: . The results show that there is a significant effect of the threshold shift caused by masking for different frequencies: . The pairwise comparison using Bonferroni indicates that the threshold shift for 500 Hz is significantly different () from the threshold shift for 200 Hz and 250 Hz.
Thus, Part B of the experiment aims to investigate the lower edge of the masking effect. Figure 4 shows the results of the second part of the experiment. For each of the three masking frequencies of 45 Hz, 90 Hz and 125 Hz, the threshold shift is shown for the frequency range of 22.5 Hz to 250 Hz. Contrary to the results of the first part, where the threshold shift seemed to stay constant across the whole frequency range investigated, there is a decrease of the masking effect towards lower frequencies. As in the previous part inter-subject variability is large, leading to high standard deviations across subjects (mean 5.5 dB), but again, individual results are consistent, and the average standard deviation of threshold shifts for individual subjects is 1.3 dB.
Again, a repeated measure ANOVA and pairwise comparison using Bonferroni is used to evaluate the data. Table 2 shows the results of the p-values of testing the data for normal distribution using an Anderson-Darling test. Values below 0.05 have been marked with an asterisk, indicating that the null hypothesis and that data is from a population with a normal distribution has to be rejected. Most of the data passes the test, but variances differ across frequencies. A Levene’s test for equality of variance rejects the null hypothesis for the masking frequencies of 90 Hz and 125 Hz () but keeps the null hypothesis for 45 Hz and if the masker frequency is excluded for the other frequencies tested. Thus, the threshold shift is evaluated for frequencies other than the masking frequency only.
For fc = 45 Hz, Mauchly’s test indicated that the assumption of sphericity has been violated: ,therefore the degrees of freedom were corrected using Greenhouse–Geisser estimate of sphericity . The results show that there is a significant effect of the threshold shift caused by masking for different frequencies: . For fc = 90 Hz, Mauchly’s test indicated that the assumption of sphericity has not been violated: , The results show that there is a significant effect of the threshold shift caused by masking for different frequencies: . For fc = 125 Hz, Mauchly’s test indicated that the assumption of sphericity has not been violated: , The results show that there is a significant effect of the threshold shift caused by masking for different frequencies: . For all three maskers tested, pairwise comparison using Bonferroni correction shows no significant difference between the effect of the masking of different frequencies above the masking frequency (). Depending on the difference of the masking effect below and above the masker tested, frequencies below the masker differ significantly from frequencies above the masker. Even though the masking effect decreases with increasing difference between masker and test frequency, there is neither a sharp edge visible, nor does the threshold shift drop to zero.
2.2. Threshold Shift with Varying Width of Narrow Band Noise
2.2.1. Setup
The basic setup of the experiment was similar to the masking experiment, but a second vibration seat with different signal reproduction hardware was used, notably the same as in Schwendicke et al. [11] The vibration seat was built in the same manner as the one for the masking experiment, using a VEB Robotron Type 11076 as a shaker. Attached to the base of the piston was an acceleration sensor (Kistler 8636C10) which measured the acceleration in vertical direction. Using the same inverse filtering approach based on each subject’s individual BRTF leads to comparable results to those shown in Figure 1b. Audio and vibration signals were delivered through the sound card of the PC. The ibration signal was amplified separately using a Pioneer A-301 amplifier before being reproduced on the shaker. As in the first experiment, the audio signal was solely used to play back a masking pink noise through a set of closed headphones (Sennheiser eH2200) simultaneously with each vibrational stimulus.
2.2.2. Stimuli and Experimental Design
Based on preliminary experiments, three center frequencies of 90 Hz, 125 Hz and 180 Hz were chosen and all were measured with three different band widths (pure tone, 12.5 Hz, and 50 Hz). Additionally, perception thresholds for the center frequency of 125 Hz with bandwidths of 100 Hz and 200 Hz were measured. Again, an adaptive 1up-2down 3AFC method was used to determine the threshold for each kind of vibrational stimulus. The testing order of the frequencies was randomized for each subject. Each individual stimulus had a duration of 1 s and was separated by a 0.5 s pause from the following stimulus. All signals were faded in and out using 50 ms 1/2-Hanning window flanks. The experiment was split into multiple sessions for each subject, testing only three to four frequency/bandwidth combinations in one session to prevent fatigue. Each session lasted approximately 20 to 30 min. As in the masking experiment, a pink noise was played back via headphones simultaneously with each vibrational stimulus, to mask any sound potentially emitted by the vibration chair.
2.2.3. Subjects
Overall, 19 subjects (13 male and 6 female) participated in the experiment. All participants were students at the Technical University Dresden and voluntarily took part in the study. The ages of the participants were between 18 and 31 years old (median = 23 years old), their heights were between 1.56 m and 1.9 m (median = 1.73 m), and their weights ranged from 47.5 kg to 107 kg (median = 84 kg). The respective BMIs of the subjects were between 18.01 and 29.01 (median = 22.23). All subjects indicated that they did not have spinal disorders.
2.2.4. Results
The left panel of Figure 5 shows the result of the WBV threshold shift based on the width of the NBN compared to the perception threshold for a sinusoidal vibration with the same center frequency. The acceleration level is based on the overall root mean square (rms) of each signal. The perception threshold for the bandwidth of 12.5 Hz is consistently lower than the perception threshold for the bandwidth of 50 Hz, but the standard deviations overlap. Differences between the thresholds for the different bandwidths are up to 2 dB, which is more than the JNDL of 1.5 dB. However, compared to the reference threshold measured with pure tones, there is no clear tendency of a threshold shift to depend on the bandwidth of the noise. A repeated measure ANOVA and pairwise comparison using Bonferroni is used to evaluate the data. The data is tested for normal distribution using an Anderso–Darling Test and for equal variances using Levene’s test. Both tests do not reject the null hypothesis at . Pairwise comparison with Bonferroni correction does not detect any significant differences, except for the bandwidths of 12.5 Hz and 50 Hz for fc = 125 Hz.
The right panel of Figure 5 illustrates the results of the measurement of the perception threshold for fc = 125 Hz over a wider range of bandwidths. As the bandwidth increases, the threshold increases. A repeated measure ANOVA and pairwise comparison using Bonferroni is used to evaluate the data. The data is tested for normal distribution using an Anderso–Darling Test and for equal variances using Levene’s test. Both tests do not reject the null hypothesis at . Mauchly’s test indicated that the assumption of sphericity has not been violated: . The results show that there is a significant effect of the threshold shift caused by different bandwidths of the stimuli: . Table 3 shows the results for the p-values of the paired comparison with Bonferroni correction. Both minimum and maximum of the mean threshold have significant differences to all other bandwidths, except their lower neighbor. The threshold of the stimuli with a bandwidth of 200 Hz has a significant difference to all bandwidths except 100 Hz, and the bandwidth of 12.5 Hz has significant difference to all other bandwidths except the sinusoidal stimuli.
3. Discussion
The results of the frequency masking alone do not allow a definite statement on the existence of possible sub-channels in the Pacinian channel. Although there is a clear maximum at the masker frequency, there is also a significant shift for all frequencies measured. The maximum offset is approximately 20 dB for the masker frequency. This would be expected, assuming intensity summation within one channel. Although the masking curves for critical bands in auditory perception drop to a 0 dB threshold shift once the test frequency is outside of the critical band, a similar effect cannot be observed here. On the contrary, apart from the masking frequency itself, all other frequencies tested seem to be masked by an equal amount of 10 to 15 dB.
If the critical band theory were to apply, all frequencies tested are within one critical band. Compared to previous results from Stamm et al. [25], who also tested with a masker at the center frequency of 160 Hz, the results are congruent. They measured the threshold shift for frequencies between 15.75 Hz and 300 Hz in the presence of three maskers at 31.5 Hz, 63 Hz and 160 Hz. Although the masker at fc = 31.5 Hz masked high and low frequencies, the other two noise signals masked only higher frequencies effectively. The lack of data above 300 Hz does not allow a prediction of the masking behavior towards the high end of WBV that are still perceived. In the frequency range between 100 Hz and 300 Hz, Stamm et al. [25] showed an offset between 10 dB and 15 dB with a peak at the masker, while the threshold offset drops to zero below 31.5 Hz, marking the edge of the critical band. Within the frequency range studied during this experiment such an edge could not be shown for high frequencies. Data from Chaudhari et al. [26], who measured frequency masking with 25 dB SL while holding a vibrating pen for maskers with 120, 200 and 280 Hz covers approximately one octave each, putting the masker in the middle of the frequency range. Threshold shift at borders of the frequency range tested is approximately 15 dB SL for all masking conditions with slight asymmetry towards the higher end which they attribute to asymmetric bandpass filter used to generate the masking stimulus. Results from the Hernandez [34] for masking of vertical WVB of sitting subjects indicate the same broadband masking character as this study. A NBN masker between 10 and 20 Hz with approximately 20 dB SL still generates a threshold shift of 10 dB at 80 Hz, which was the highest frequency tested.
One interesting phenomenon is that inter-individual differences between the off- and on-frequency condition differ a lot; the former being on average 5.7 dB, the latter 2.7 dB. A closer look into the individual data the standard deviation for individual data points for the on-frequency condition does not reveal significant differences to the off-frequency condition. To a certain extent, a similar pattern can be seen in the literature. Data from Chaudhari et al. [26], which were obtained with 5 subjects only, show smaller standard deviation for on-frequency masking compared to off-frequency masking, too. A lot of research in the auditory domain has been carried out with only very few and experienced subjects but data from Sonntag [39], who measured frequency masking for six subjects with two repetitions, exhibit similar large differences in variances across frequencies, although they are not discussed any further. Another noteworthy phenomenon is that the masking peak caused by the masker centered at 125 Hz is approximately 3 dB higher compared to the other maskers tested. This might be attributed to resonances of the human body. Ford et al. [40] measured a strong resonant behavior with peaks at 70, 116 and 210 Hz when WBV were induced into the torso by low frequency sounds. They also used anthropomorphic data for the average adult to model the human body as a Helmholtz resonator which predicted the fundamental resonance at 115 Hz, too. The stimulation of a body resonance might have increased the masking effect compared to a non-resonant condition leading to the higher than average threshold shift. The masker level chosen in this study is rather high in respect to the small dynamic range of WBV perception with approximately 30 dB between imperceivable and very strong perception [41]. Hernandez [34] tested different lower masker levels, but only for on-test frequency, not allowing a prediction about the change of slope of the masking curve with masker intensity. The asymmetry could, at least in part, be caused by the relatively strong masker, as an increase in masker intensity in the auditory domain is known to lead to an effect known as “upward spread of masking”, as demonstrated by Egan and Hake [42]. Thus, the second experiment using band-widening can provide additional insight as to whether an equivalent to critical bandwidths exists in tactile perception or not.
There are no significant differences between the perception thresholds for different signal types centered at 90 and 180 Hz. In contrast to Stamm [24], there is no general trend of the threshold for NBN signals below the threshold for pure tones. The slight increase of the perception threshold for 125 Hz in Figure 5 can be explained by the rising threshold for whole-body vibration at higher frequencies. For similar experiments on the hearing threshold, uniform excited noise is used. This noise takes into account the shape of the hearing threshold, exciting all frequencies at approximately the same rate. For WBV, there is no generally accepted shape of the perception threshold. Although a general shape with an increase towards higher frequencies is consistent across publications, the individual results differ. One factor influencing the results are strong inter-individual differences between subjects, while another is the difference in measuring setups. Merchel et al. [38] collected multiple studies [4,25,28,35,36,37] on WBV perception thresholds and approximated them using first order regression. Based on these approximations of up to 150 Hz, the perception threshold for sinusoidal signals increases by approximately 1.3 dB per octave, and above 150 Hz by 6.5 dB per octave. As these are rough estimations, White Noise was used during this experiment, and filtered using a bandpass with the desired bandwidth. Taking into account the rise of the perception threshold with increasing frequency, the rise of the perception threshold of narrow band noises at 125 Hz with increasing bandwidths can be explained by a relatively higher content of high frequencies. The overall rms of the vibration signal was kept constant across the different bandwidths tested in this experiment. This implies that the perception threshold depends mainly on the overall rms of the vibration signal, regardless of the signal type, whether it is a NBN or sinusoidal vibration. Equal intensity contours for vertical WBV rise approximately by 10 dB over the frequency range from 10 to 100 Hz [38]. The weighting for the perception of vertical WBV in ISO2631-1 decreases by about 20 dB in the same frequency range. In combination with the results of this study that the overall rms of the signal is the main driver for the perception threshold, it seems that leads to results that might underestimate the influence of frequency content above 10 Hz on WBV perception.
4. Conclusions
Based on the results of this study, the initial hypothesis that there are sub-channels within the Pacinian channel, must be rejected. Although the first experiment does not yield conclusive results, the band-widening experiment does not support sub-channels within the Pacinian channel. Frequency masking in the frequency range of the perception of Pacinian corpuscles does not show the characteristic masking curves observed in audition, where masking is strongly confined to the bandwidth of the critical band. NBN maskers mask whole-body vibration efficiently over a wide frequency range. In particular, frequencies higher than the masker are masked to a large extent. The masking effect for lower frequencies than the masker declines only for frequencies lower than 100 Hz. This might be due to the relatively high masker levels considering the smaller dynamic range of WBV compared to audition, as high masker levels lead to asymmetric effects in the auditory domain as well. The band-widening experiment clearly opposes the thesis of sub-channels. The perception threshold for vertical WBV does not decrease with increasing bandwidth of the test signal, which would indicate intensity summation within a critical band. Although the initial hypothesis does not hold, two important results remain from these studies. First, frequency masking is highly efficient for WBV across a wide range of frequencies. Secondly, the perception threshold for un-masked WBV is dependent on the overall rms of the signal only. Within a relatively wide frequency band the perception threshold of a NBN with a certain center frequency is the same as that of a sinusoidal signal with the same frequency.
Author Contributions
Conceptualization, A.S. and M.E.A.; Data curation, A.S.; Formal analysis, A.S.; Funding acquisition, M.E.A.; Investigation, A.S.; Methodology, A.S.; Resources, M.E.A.; Software, A.S.; Supervision, M.E.A.; Validation, A.S.; Visualization, A.S.; Writing—original draft, A.S.; Writing—review & editing, A.S. and M.E.A. All authors have read and agreed to the published version of the manuscript.
Funding
This research was funded by DFG AL1473/2-1.
Acknowledgments
We thank Juncal Lapuente Vera for the acquisition of the data on the influence of NBN on threshold shift, Margitta Lachmann for creating the image of the schematic setup of the vibration seat in Figure 1a, and Sebastian Merchel for the permission to use his collection of threshold data as base for Figure 2.
Conflicts of Interest
The authors declare that there is no conflict of interest.
Abbreviations
The following abbreviations are used in this manuscript:
| AFC | Alternative forced choice |
| ANOVA | Analysis of variance |
| dB | Decibel |
| JNDF | Just noticeable difference in frequency |
| NBN | Narrow band noise |
| PC | Pacinian corpuscles |
| RA | Rapidly adapting receptors |
| rms | root mean square |
| SA-I | Slowly adapting receptors I |
| SA-II | Slowly adapting receptors II |
| SL | Sensation level |
| WBV | Whole-body vibration |
References
- Reiher, H.; Meister, F. Die Empfindlichkeit des Menschen gegen Erschütterungen. Forsch. Ingenieurwes. 1931, 2, 381–386. [Google Scholar] [CrossRef]
- Meister, F. Die Empfindlichkeit des Menschen gegen Erschütterungen. Forsch. Ingenieurwes. 1935, 6, 116–120. [Google Scholar] [CrossRef]
- Griffin, M.J. Handbook of Human Vibration; Academic Press: London, UK, 1990. [Google Scholar]
- Bellmann, M.A. Perception of Whole-Body Vibrations: From Basic Experiments to Effects of Seat and Steering-Wheel Vibrations on the Passenger’s Comfort Inside Vehicles. Ph.D. Thesis, Universität Oldenburg, Oldenburg, Germany, 2002. [Google Scholar]
- Morioka, M.; Griffin, M.J. Magnitude-dependence of equivalent comfort contours for fore-and-aft, lateral and vertical whole-body vibration. J. Sound Vib. 2006, 298, 755–772. [Google Scholar] [CrossRef] [Green Version]
- Howarth, H.V.C.; Griffin, M.J. The frequency dependence of subjective reaction to vertical and horizontal whole-body vibration at low magnitudes. J. Acoust. Soc. Am. 1988, 83, 1406–1413. [Google Scholar] [CrossRef]
- Fastl, H.; Zwicker, E. Psychoacoustics—Facts and Models, 3rd ed.; Springer: Berlin, Germany, 2007. [Google Scholar]
- Moore, B. An Introduction to the Psychology of Hearing, 5th ed.; Emerald Group Publishing: Bentley, UK, 2003. [Google Scholar]
- Helmholtz, H. Die Lehre von den Tonempfindungen Als Physiologische Grundlage für Die Theorie Der Musik; Friedr. Vieweg & Sohn: Braunschweig, Germany, 1913. [Google Scholar]
- Zwicker, T. Psychoacoustics as the basis for modern audio signal data compression. J. Acoust. Soc. Am. 2000, 107, 2875. [Google Scholar] [CrossRef]
- Schwendicke, A.; Dou, J.; Altinsoy, M.E. Temporal Masking Characteristics of Whole Body Vibration Perception. In Proceedings of the 2017 IEEE World Haptics Conference (WHC), Munich, Germany, 6–9 June 2017. [Google Scholar] [CrossRef]
- Parsons, K.C.; Griffin, M.J. Methods for Predicting Passenger Vibration Discomfort. SAE Trans. 1983, 92, 474–492. [Google Scholar] [CrossRef]
- Griffin, M.J.; Whitham, E.M. Discomfort produced by impulsive whole-body vibration. J. Acoust. Soc. Am. 1980, 68, 1277–1284. [Google Scholar] [CrossRef]
- Fairley, T.E.; Griffin, M.J. The apparent mass of the seated human body: Vertical vibration. J. Biomech. 1989, 22, 81–94. [Google Scholar] [CrossRef]
- Gescheider, G.A.; Hoffman, K.E.; Harrison, M.A.; Travis, M.L.; Bolanowski, S.J. The effects of masking on vibrotactile temporal summation in the detection of sinusoidal and noise signals. J. Acoust. Soc. Am. 1994, 95, 1006–1016. [Google Scholar] [CrossRef]
- Verrillo, R.T. A duplex mechanism of mechanoreception. Ski. Sens. 1968, 1968, 139–159. [Google Scholar]
- Makous, J.; Friedman, R.; Vierck, C. A critical band filter in touch. J. Neurosci. 1995, 15, 2808–2818. [Google Scholar] [CrossRef] [PubMed]
- Bensmaïa, S.J.; Hollins, M. Complex tactile waveform discrimination. J. Acoust. Soc. Am. 2000, 108, 1236–1245. [Google Scholar] [CrossRef] [PubMed]
- Saal, H.P.; Bensmaia, S.J. Touch is a team effort: Interplay of submodalities in cutaneous sensibility. Trends Neurosci. 2014, 37, 689–697. [Google Scholar] [CrossRef]
- Mahns, D.A.; Perkins, N.; Sahai, V.; Robinson, L.; Rowe, M. Vibrotactile frequency discrimination in human hairy skin. J. Neurophysiol. 2006, 95, 1442–1450. [Google Scholar] [CrossRef] [PubMed]
- Hamer, R.; Verrillo, R.; Zwislocki, J. Vibrotacile masking of Pacinian and non-Pacinian channels. J. Acoust. Soc. Am. 1983, 73, 1293–1303. [Google Scholar] [CrossRef]
- Gescheider, G.; Bolanowski, S.; Verrillo, R. Some characteristics of tactile channels. Behav. Brain Res. 2004, 148, 35–40. [Google Scholar] [CrossRef] [Green Version]
- Bensmaïa, S.; Hollins, M.; Yau, J. Vibrotactile intensity and frequency information in the Pacinian system: A psychophysical model. Atten. Percept. Psychol. 2005, 67, 828–841. [Google Scholar] [CrossRef] [Green Version]
- Stamm, M. Frequenzwahrnehmung von Ganzkörperschwingungen. Diploma Thesis, TU Dresden, Dresden, Germany, 2009. [Google Scholar]
- Stamm, M.; Altinsoy, M.E.; Merchel, S. Frequenzwahrnehmung von Ganzkörperschwingungen im Vergleich zur auditiven Wahrnehmung I. In Proceedings of the DAGA 2010—36th German Annual Conference on Acoustics, Berlin, Germany, 15–18 March 2010; pp. 867–868. [Google Scholar]
- Chaudhari, R.; Schuwerk, C.; Danaei, M.; Steinbach, E. Perceptual and bitrate-scalable coding of haptic surface texture signals. IEEE J. Sel. Top. Signal Process. 2015, 9, 462–473. [Google Scholar] [CrossRef]
- Gässler, G. Über die Hörschwelle für Schallereignisse mit verschieden breitem Frequenzspektrum. Acta Acust. United Acust. 1954, 4, 408–414. [Google Scholar]
- Merchel, S.; Leppin, A.; Altinsoy, M.E. Hearing with your body: The influence of whole-body vibrations on loudness perception. In Proceedings of the ICSV 16, Krakow, Poland, 5–9 July 2009. [Google Scholar]
- Schwendicke, A.; Altinsoy, M.E.; Merchel, S. Was fühlen wir noch? —Ganzkörperschwingungsfühl- schwellen für hohe Frequenzen. In Proceedings of the DAGA 2015—41st German Annual Conference on Acoustics, Nürnberg, Germany, 16–19 March 2015; pp. 1208–1211. [Google Scholar]
- Altinsoy, M.E.; Merchel, S. BRTF—Body Related Transfer Functions for Whole-Body Vibration Reproduction Systems. In Proceedings of the International Conference on Acoustics (NAG/DAGA 2009), Rotterdam, The Netherlands, 23–26 March 2009; pp. 1318–1319. [Google Scholar]
- Schwendicke, A.M.; Reichmann, F.; Altinsoy, M.E. Vibroacoustical Beats – Inducing Auditory Perception Through Whole-Body Vibration. In Proceedings of the INTER-NOISE and NOISE-CON Congress and Conference Proceedings, Madrid, Spain, 16–19 June 2019. [Google Scholar]
- Levitt, H. Transformed Up-Down Methods in Psychoacoustics. J. Acoust. Soc. Am. 1971, 49, 467–477. [Google Scholar] [CrossRef]
- Hansen, M. PsyLab—Documentation, Version 2.0; Institut für Hörtechnik + Audiologie Fachhochschule Oldenbur: Oldenburg, Germany, 2007. [Google Scholar]
- Hernandez, C.R. Effet de Masquage Fréquentiel Dans les Vibrations du Corps Pour un Sujet Assis. Ph.D. Thesis, INSA de Lyon, Lyon, France, 2012. [Google Scholar]
- Morioka, M.; Griffin, M.J. Absolute thresholds for the perception of fore-and-aft, lateral, and vertical vibration at the hand, the seat, and the foot. J. Sound Vib. 2008, 314, 357–370. [Google Scholar] [CrossRef] [Green Version]
- Parsons, K.; Griffin, M. Whole-body vibration perception thresholds. J. Sound Vib. 1988, 121, 237–258. [Google Scholar] [CrossRef]
- Miwa, T. Evaluation Methods for Vibration Effects Part 1: Measurements of Threshold and Equal Sensation Contours of Whole-Body for Vertical and Horizontal Vibrations. Ind. Health 1967, 5, 183–205. [Google Scholar] [CrossRef] [Green Version]
- Merchel, S.; Altinsoy, M.E.; Stamm, M. Equal Intensity Contours for Whole-Body Vibrations Compared with Vibrations Cross-Modally Matched to Isophones. In Haptic and Audio Interaction Design; Cooper, E., Kryssanov, V., Ogawa, H., Brewster, S., Eds.; Springer: Berlin/Heidelberg, Germany, 2011; Volume 6851, pp. 71–80. [Google Scholar] [CrossRef] [Green Version]
- Sonntag, B. Zur Abhängigkeit der Mithörschwellen-Tonheitsmuster maskierender Sinustöne von deren Tonheit. Acta Acust. United Acust. 1983, 52, 95–97. [Google Scholar]
- Ford, A.; Ausiello, L.; Barlow, C. Characteristics of Whole-body Vibration Induced Through Low-frequency Sound Exposure. In Proceedings of the Audio Engineering Society Conference: 2019 AES International Conference on Immersive and Interactive Audio, York, UK, 27–29 March 2019. [Google Scholar]
- ISO 2631-1:1997. Mechanical Vibration and Shock—Evaluation of Human Exposure to Whole-Body Vibration; International Organization for Standardization: Geneva, Switzerland, 1997. [Google Scholar]
- Egan, J.P.; Hake, H.W. On the Masking Pattern of a Simple Auditory Stimulus. J. Acoust. Soc. Am. 1950, 22, 622–630. [Google Scholar] [CrossRef]
Figure 1.
Vibration seat with electro-dynamic shaker

Figure 2.
Perception threshold of vertical sinusoidal WBVs for seated subjects from various laboratories [4,25,28,34,35,36,37,38] in comparison to means and standard deviations from this study.

Figure 3.
Mean and standard deviation of the threshold shift for the maskers with different center frequencies in the frequency range of 100 to 500 Hz.
Figure 3.
Mean and standard deviation of the threshold shift for the maskers with different center frequencies in the frequency range of 100 to 500 Hz.

Figure 4.
Mean and standard deviation of the threshold shift for the maskers with different center frequencies in the frequency range of 22.5 to 250 Hz.
Figure 4.
Mean and standard deviation of the threshold shift for the maskers with different center frequencies in the frequency range of 22.5 to 250 Hz.

Figure 5.
Mean and standard deviation of the results for perception thresholds of WBV for seated subjects using narrow band noises (n = 19) compared to pure sine, the graphs are slightly shifted for better visibility.
Figure 5.
Mean and standard deviation of the results for perception thresholds of WBV for seated subjects using narrow band noises (n = 19) compared to pure sine, the graphs are slightly shifted for better visibility.


Table 1.
Results of the p-Value of the Anderso–Darling Test for normal distribution of the threshold shift of each frequency per masking frequency for experiment 1A; significant differences are marked with an *.
Table 1.
Results of the p-Value of the Anderso–Darling Test for normal distribution of the threshold shift of each frequency per masking frequency for experiment 1A; significant differences are marked with an *.
| f in Hz | 100 | 125 | 160 | 200 | 250 | 315 | 400 | 500 |
|---|---|---|---|---|---|---|---|---|
| 160 Hz | 0.72 | 0.95 | 0.37 | 0.31 | 0.62 | 0.32 | 0.00 * | 0.35 |
| 200 Hz | 0.72 | 0.14 | 0.98 | 0.11 | 0.23 | 0.75 | 0.27 | 0.56 |
| 315 Hz | 0.04 * | 0.11 | 0.06 | 0.82 | 0.16 | 0.20 | 0.09 | 0.28 |
Table 2.
Results of the p-Value of the Anderso–Darling Test for normal distribution of the threshold shift of each frequency per masking frequency for experiment 1B; significant differences are marked with an *.
Table 2.
Results of the p-Value of the Anderso–Darling Test for normal distribution of the threshold shift of each frequency per masking frequency for experiment 1B; significant differences are marked with an *.
| f in Hz | 22.5 | 31.5 | 45 | 63 | 90 | 125 | 180 | 250 |
|---|---|---|---|---|---|---|---|---|
| 45 Hz | 0.69 | 0.42 | 0.65 | 0.10 | 0.18 | 0.01 * | 0.94 | 0.44 |
| 90 Hz | 0.02 * | 0.05 | 0.13 | 0.17 | 0.03 * | 0.46 | 0.75 | 0.83 |
| 125 Hz | 0.35 | 0.01 * | 0.08 | 0.09 | 0.17 | 0.24 | 0.09 | 0.19 |
Table 3.
Results of the p-values of the paired comparison test across bandwidth (bw) for f = 125 Hz; significant differences are marked with an *.
Table 3.
Results of the p-values of the paired comparison test across bandwidth (bw) for f = 125 Hz; significant differences are marked with an *.
| bw in Hz | 0 | 12.5 | 50 | 100 | 200 |
|---|---|---|---|---|---|
| 0 | – | 1.00 | 1.00 | 0.23 | 0.00 * |
| 12.5 | 1.00 | – | 0.01 * | 0.00 * | 0.00 * |
| 50 | 1.00 | 0.01 * | – | 1.00 | 0.03 * |
| 100 | 0.23 | 0.00 * | 1.00 | – | 0.06 |
| 200 | 0.00 * | 0.00 * | 0.03 * | 0.06 | – |
Publisher’s Note: MDPI stays neutral with regard to jurisdictional claims in published maps and institutional affiliations. |
© 2020 by the authors. Licensee MDPI, Basel, Switzerland. This article is an open access article distributed under the terms and conditions of the Creative Commons Attribution (CC BY) license (http://creativecommons.org/licenses/by/4.0/).
Share and Cite
MDPI and ACS Style
Schwendicke, A.; Altinsoy, M.E. Frequency Masking Effects for Vertical Whole-Body Vibration for Seated Subjects. Vibration 2020, 3, 357-370. https://0-doi-org.brum.beds.ac.uk/10.3390/vibration3040024
AMA Style
Schwendicke A, Altinsoy ME. Frequency Masking Effects for Vertical Whole-Body Vibration for Seated Subjects. Vibration. 2020; 3(4):357-370. https://0-doi-org.brum.beds.ac.uk/10.3390/vibration3040024
Chicago/Turabian StyleSchwendicke, Anna, and M. Ercan Altinsoy. 2020. "Frequency Masking Effects for Vertical Whole-Body Vibration for Seated Subjects" Vibration 3, no. 4: 357-370. https://0-doi-org.brum.beds.ac.uk/10.3390/vibration3040024