Frequency-Adaptable Tuned Mass Damper Using Metal Cushions


1
Fraunhofer Institute for Structural Durability and System Reliability, 64289 Darmstadt, Germany
2
School of Engineering, University of Warwick, Coventry CV4 7AL, UK
*
Author to whom correspondence should be addressed.
Vibration 2021, 4(1), 77-90; https://0-doi-org.brum.beds.ac.uk/10.3390/vibration4010007
Submission received: 22 December 2020
/
Revised: 12 January 2021
/
Accepted: 21 January 2021
/
Published: 27 January 2021
Abstract
:A frequency-adaptable tuned mass damper (FATMD) using metal cushions as tuneable stiffness components is presented. The dynamic properties of the cushions with respect to stiffness and damping are investigated experimentally in this context. The natural frequency of the experimental FATMD is found to be dependent on the precompression of the metal cushions, which behave like nonlinear springs, yielding an adjustable frequency range from 67 to 826 Hz. As the precompression is increased, the stiffness increases while the damping characteristics decrease, the effect of which was quantified using a viscous mass damper model as a first approximation. Measurements have been carried out under five different excitation amplitudes to investigate the amplitude dependency of the resonance frequency. The FATMD was largely unaffected by changes in input amplitude. It was concluded that metal cushions show great potential for use in FATMDs, surpassing the utility of elastomers, especially with respect to their temperature stability.
1. Introduction
Tuned mass dampers (TMDs) are a well-established means of passive vibration reduction. Used in many areas of civil and mechanical engineering, they consist of an oscillator, the mass, stiffness and damping properties of which are carefully chosen to tune the device to supress the vibrations of the base structure the oscillator is attached to. Correct selection of the tuned resonant frequency is essential for achieving optimal dynamic behaviour and an analytical solution to this end has been known for decades [1]. Since the first analytical description of the effect, TMDs have been studied in more detail both for structures with a single degree of freedom (SDOF) and multiple degrees of freedom (MDOF), and various optimisation strategies for their tuning and placement have been examined, using various numerical methods like genetic algorithms and swarm optimisation [2]. A broad overview on the optimal tuning of tuned mass dampers both for conventional and parametric pendulum TMDs is given in [3]. The robust optimal design of a TMD is presented in [4] using sequential quadratic programming for optimisation. Frequency-adaptable tuned mass dampers (FATMDs) have been developed as a useful tool for the identification of optimal absorber parameters in an experimental environment, or to account for structures with altering resonances due to system kinematics, changing loads, or ageing. These use a means of adjusting the characteristics of the TMD to alter its frequency tuning, allowing the same device to target different frequencies. In a novel approach, the present work will investigate the use of metal cushions as adjustable spring elements by taking advantage of their nonlinear behaviour.
Various concepts for FATMDs (also known as ‘adjustable vibration absorbers’) have been published. Whereas only a few comprise a variable mass (e.g., by pumping water [5] or using inerter mass effects [6]), most concepts use a variable stiffness element. Some are based on the geometric change of bending elements or the pre-stressing of beams [7]; good results have also been achieved with a ring-shaped spring element with variable support points [8]. Other works have studied the use of smart materials for the realisation of adjustable vibration absorbers: shape-memory alloys [9], magneto-rheological elastomers [10,11], magneto-rheological gels [12], dielectric elastomers [13] and shunted piezoelectric transducers [14] have all been applied to FATMD concepts. The precompression of elastomeric elements like low-cost O-rings has also been used to realise the adjustable vibration absorbers [15]. However, metal cushions are yet to be used in this application although recent works have been published investigating their use in dynamic applications, studying their potential as high-speed railway pads [16,17].
Metal cushions, also known as ‘metal rubber’, ‘compressed knitted wire mesh’ and ‘tangled metal wire cushions’ are elastic elements made by compressing tangled metal wire into round or square ‘cushions’ [18,19,20,21,22]. Though being made of steel, they have a low, rubber-like stiffness that predestines them for applications in the field of vibration technology. The many internal contact points within the knitted wire fabric lead to high internal friction and energy dissipation, which result in characteristic curves with distinct hysteresis. This hysteretic behaviour is beneficial for all applications where high damping is required. Moreover, metal cushions have a highly nonlinear stiffness because of the rising number of contact points with increasing compression or density [18,21,23,24,25], an effect that can be used for the realisation of adjustable devices. Metal cushions are commonly used for vibration damping in machinery and are preferred over their elastomeric counterparts because of their high relative resistance to degradation in harsh environments and the wide temperature range they can work in [26,27]. The same benefits, among others, apply to the use of metal cushions in FATMDs. The thickness of the wire used, their compression density and their microscopic structure influence the cushions’ mechanical behaviour; previous works have begun to investigate these complex effects on an analytical level [23,28]. If compressed, the cushions’ stiffness and damping properties change significantly—it is this characteristic which offers potential for their use as the adjustable spring element in an FATMD. This new application requires further investigation as little research is available on the dynamic characteristics of metal cushions. The purpose of this work is to show the dynamic behaviour of metal cushions under compression as used in an FATMD.
Hence the main aim of the present work is to demonstrate the potential benefits of using metal cushions in an FATMD. In contrast to other works [25] that investigate the feasibility of tangled metal wire particles in the application of adaptive vibration absorbers, the presented work focusses on metal cushions that offer practical advantages in terms of determined geometry and ease of fixation. In the present work, the damping effects are investigated deeply as well as the nonlinear behaviour in dependence on the excitation amplitude.
2. Materials and Methods
2.1. Experimental Set-Up
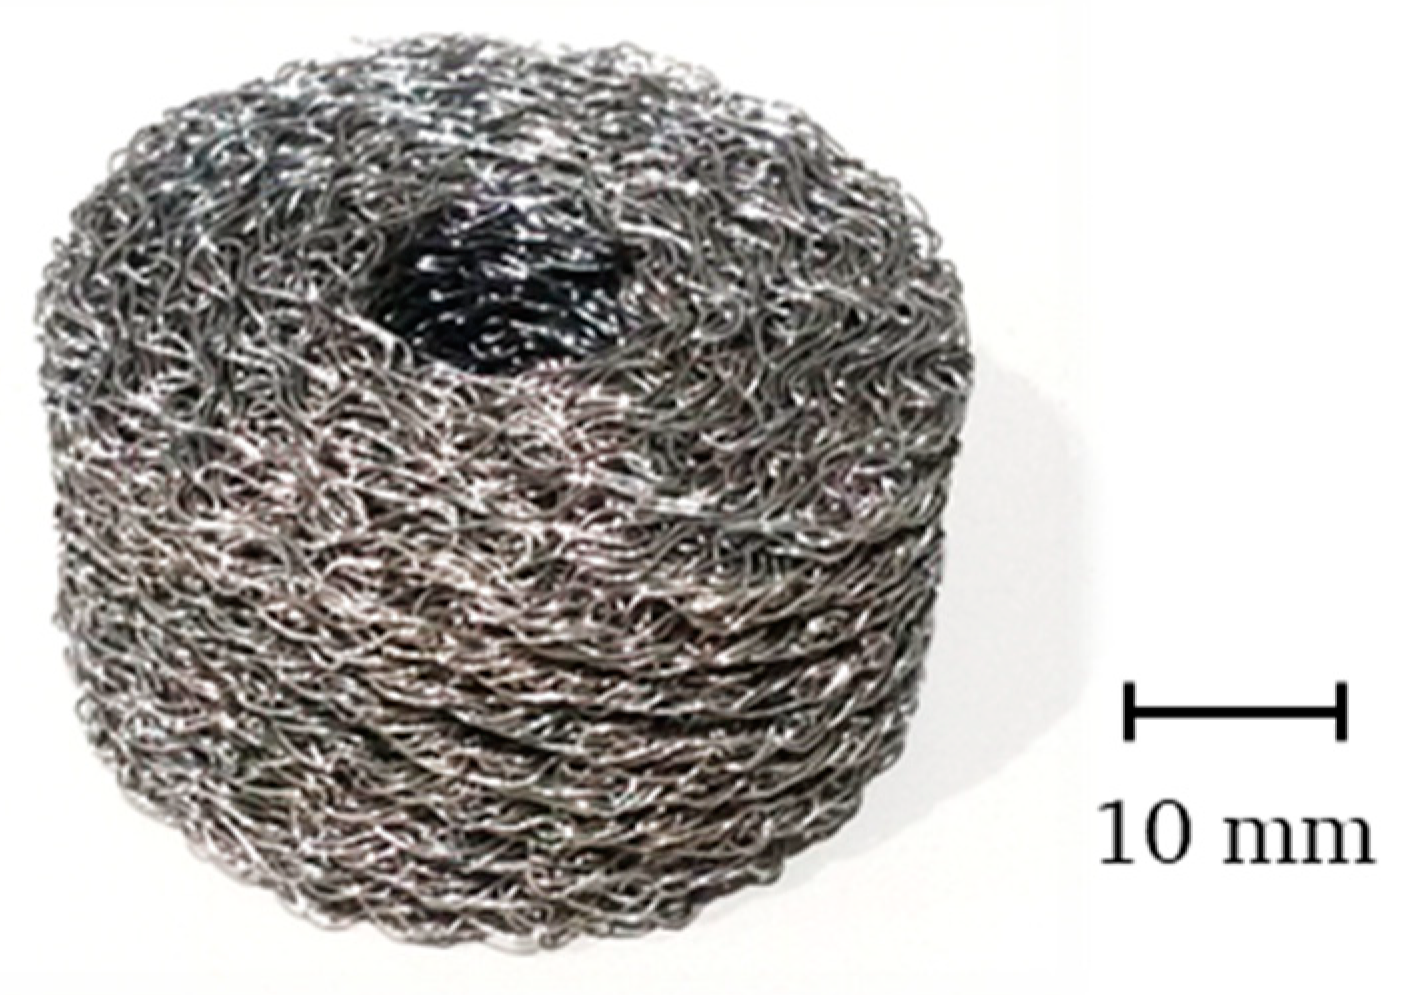
The metal cushions used in the experimental FATMD were provided by Hutchinson Stop-Choc (Renningen, Germany) and are cylindrical in shape. Their properties are listed in Table 1. Figure 1 shows a photo of one of the cushions used.
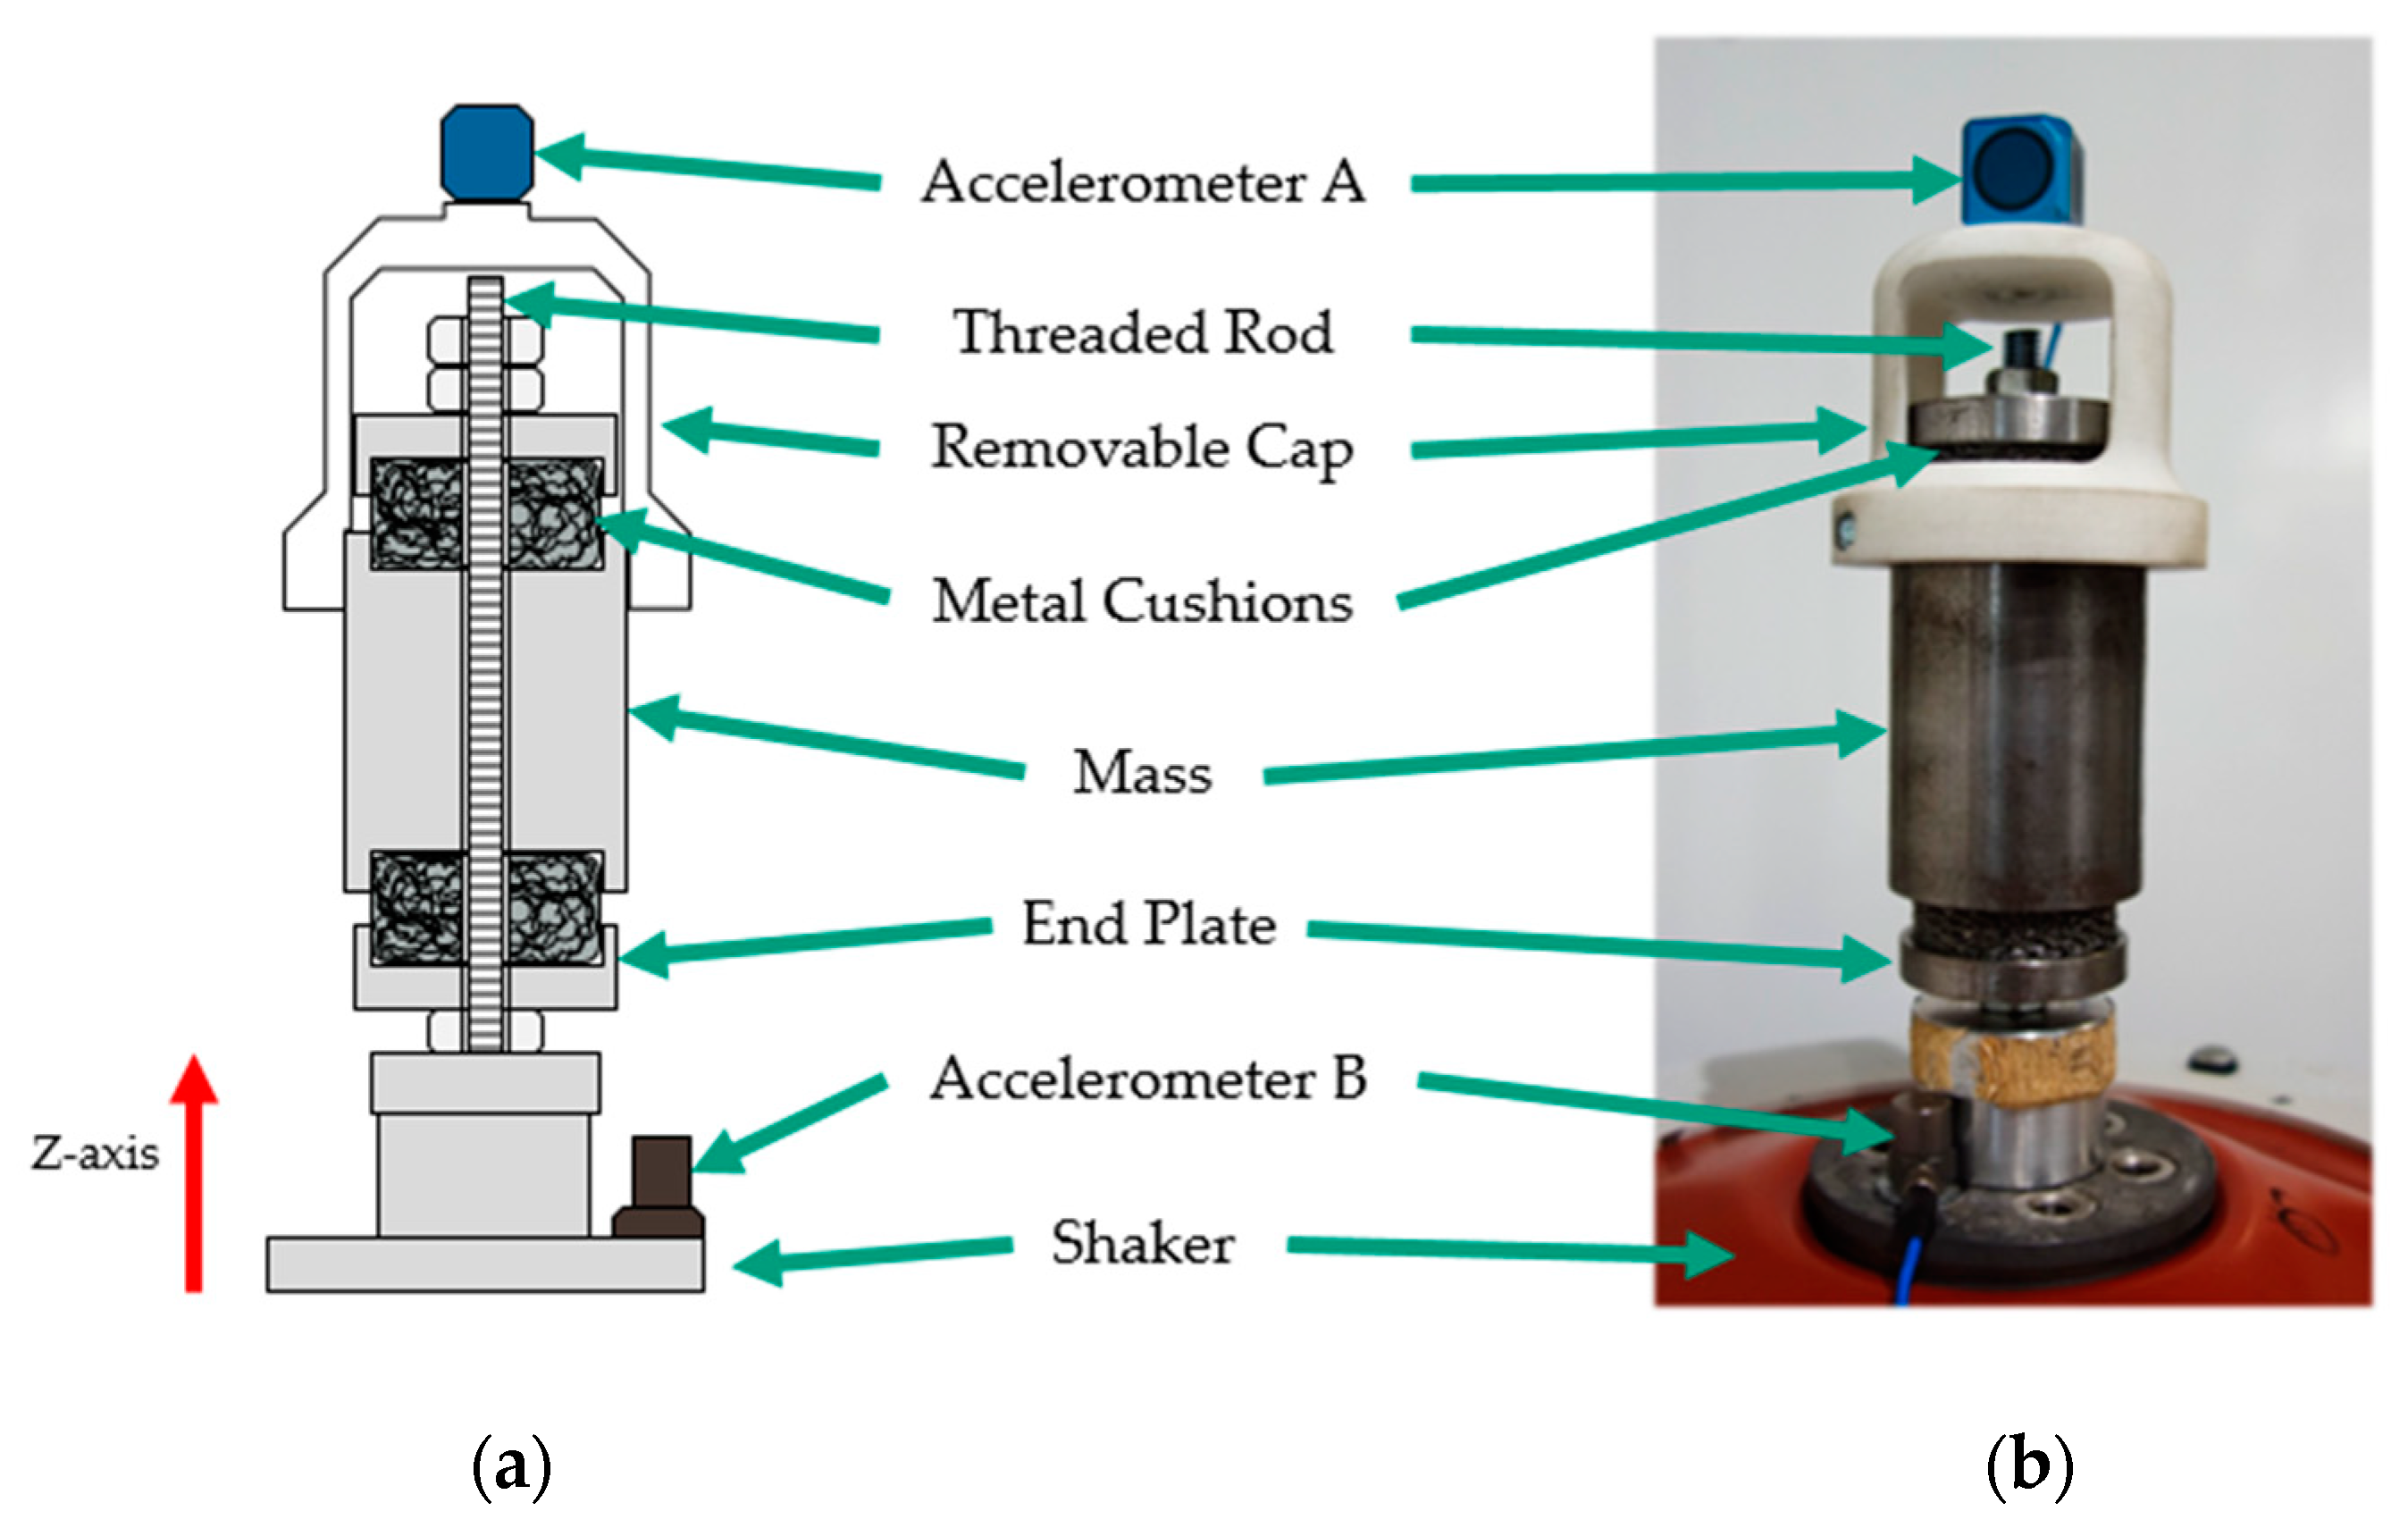
The experimental FATMD uses two metal cushions; its structure is shown in Figure 2. A cylindrical mass of 1 kg is suspended between two identical cushions, each held in place by an end plate, mounted on a threaded rod. The rod is in turn rigidly attached to a shaker for excitation. Accelerometers measure the acceleration in the Z-direction due to the input force at the base of the FATMD and the resulting acceleration in the Z-direction of the suspended mass. The latter accelerometer is fixed to the mass by a removable 3D printed cap (made of polyamide by selective laser sintering), the purpose of which is to minimise the lateral movement of the mass by maintaining a centric centre of gravity; this would be lost were the accelerometer attached directly to the side of the mass. A dynamic simulation of the cap showed its fundamental mode of vibration in the Z-direction (at 1415 Hz) to lie sufficiently above the range of input frequencies for this experiment (5 to 1000 Hz), ensuring its inclusion in the set-up would not affect the measurements taken.
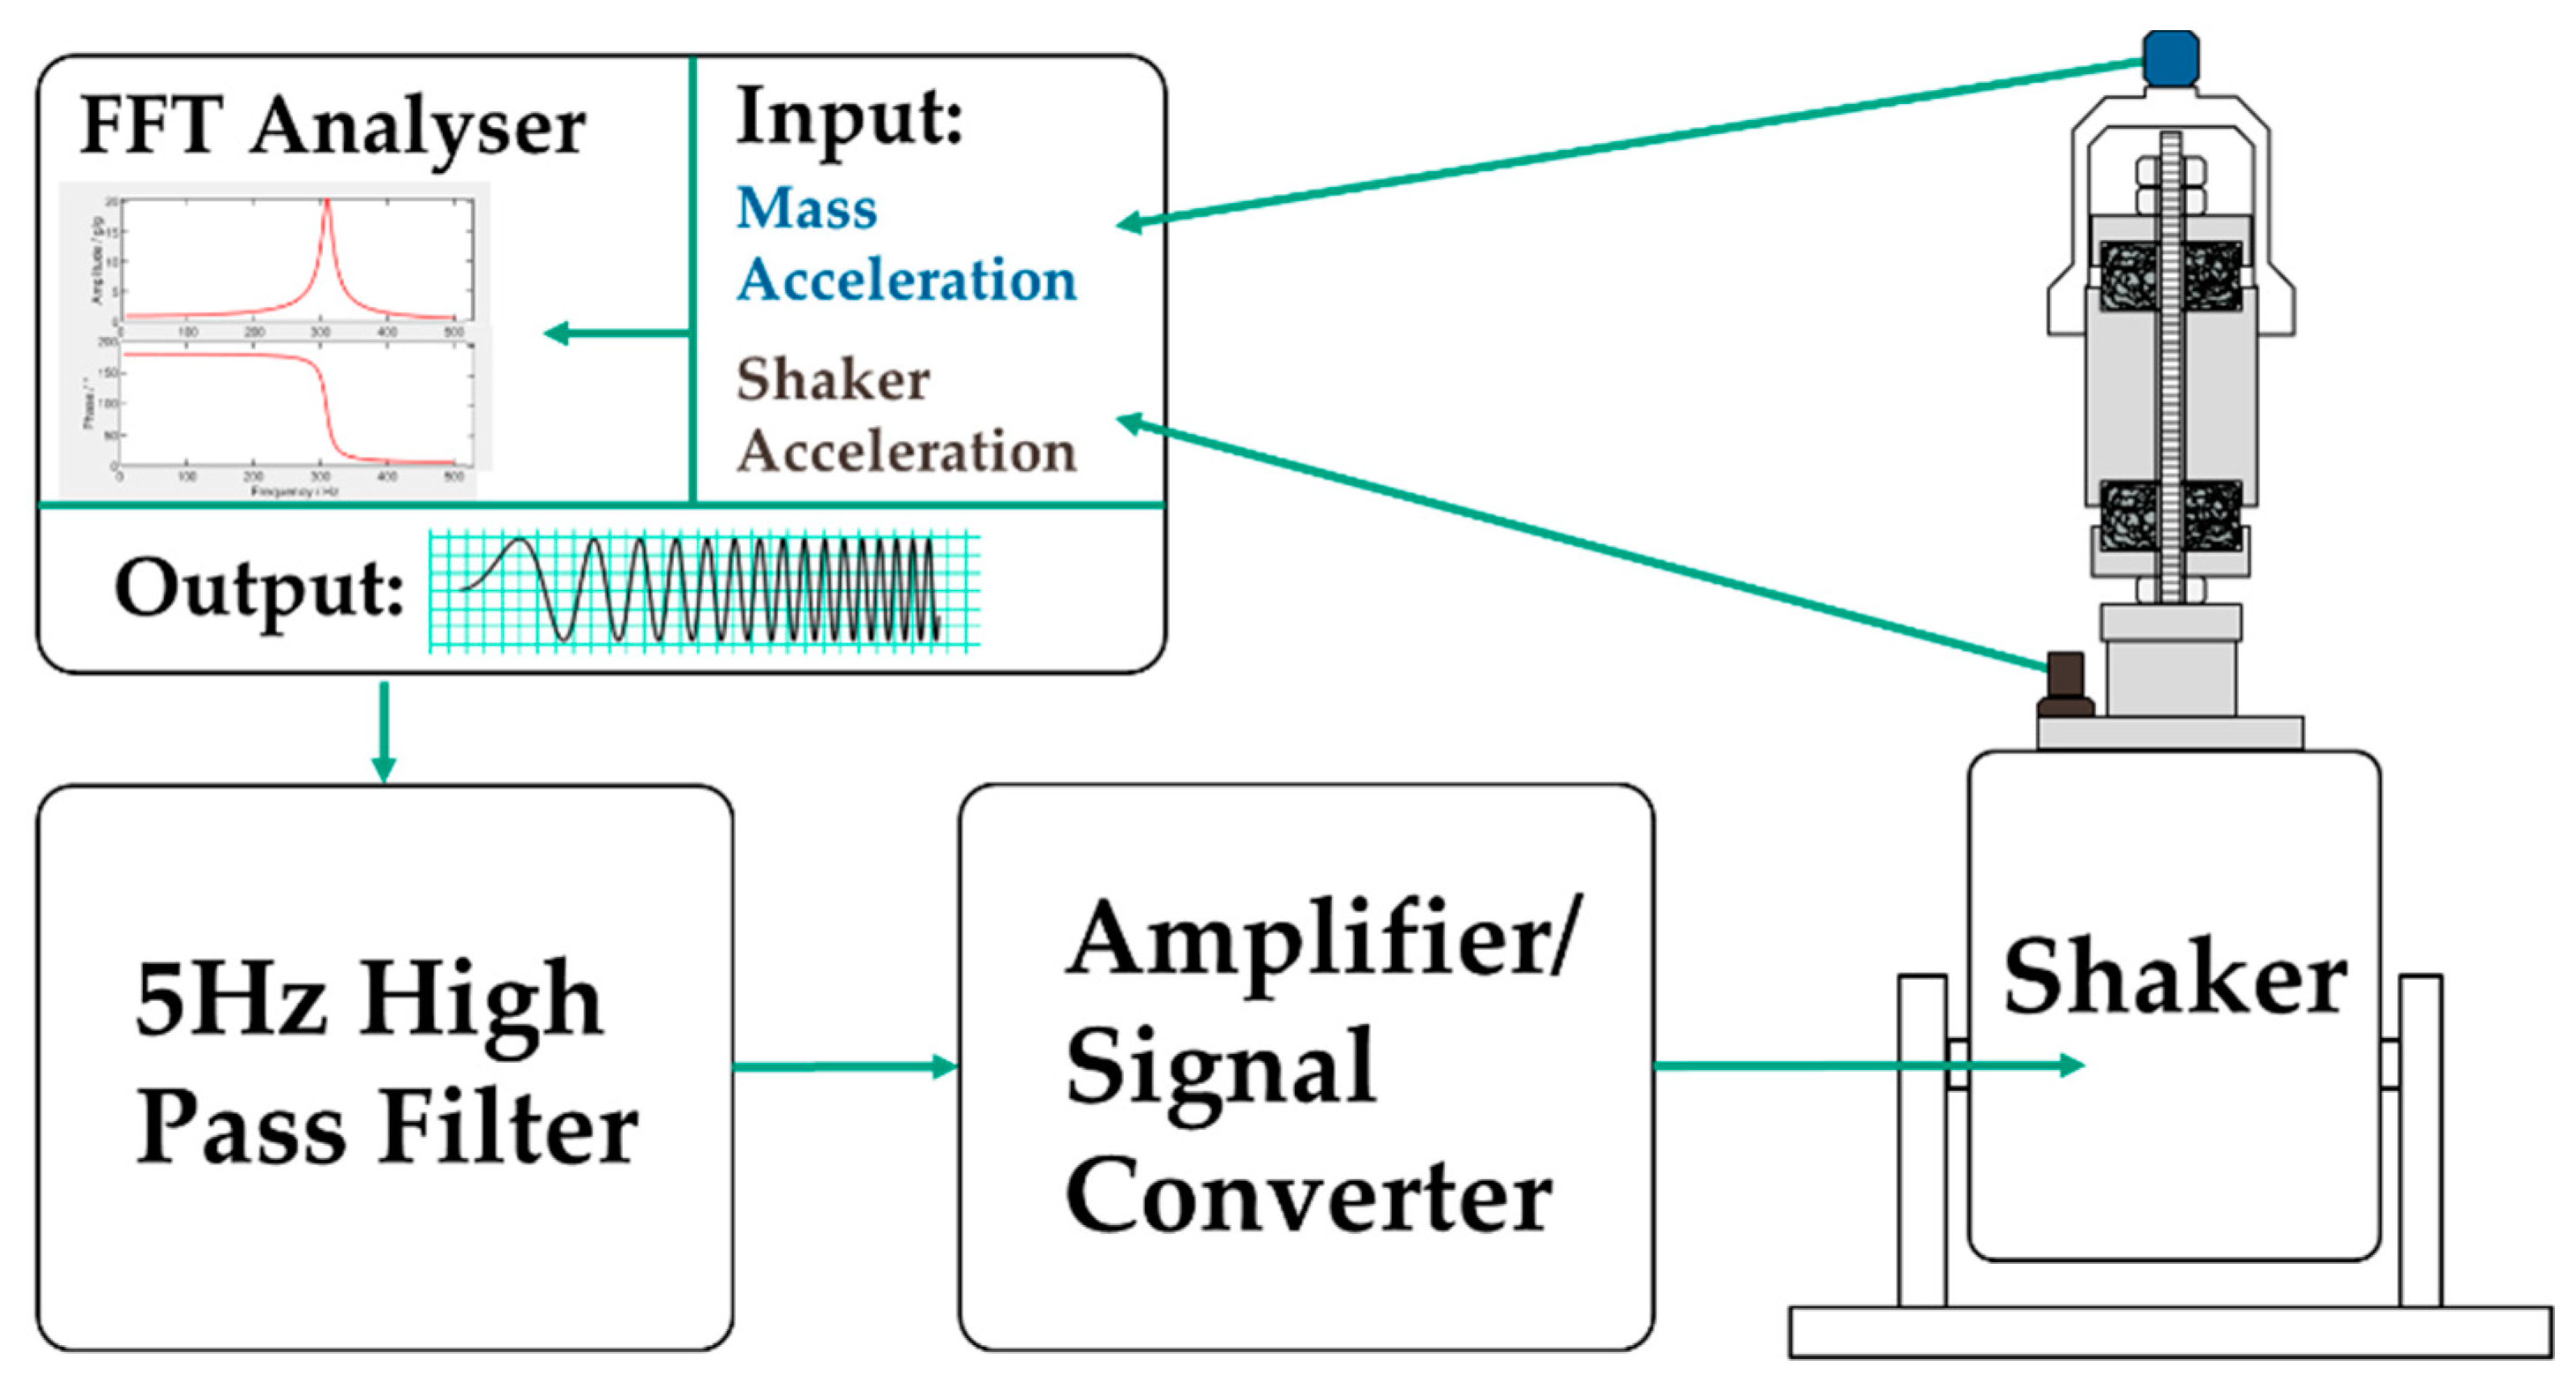
A schematic of the signal path is shown in Figure 3. A frequency-swept sine wave was used as the excitation signal for the shaker. This was prepared by passing it through a high pass filter to avoid high-stroke amplitudes (5 Hz corner frequency), thus preventing damage to the shaker, followed by an amplifier and a signal converter before it reached the shaker (these by TIRA, Schalkau, Germany). The shaker has a maximum force of 650 N and a maximum acceleration of 42 g for sine excitation and allows for a maximum vibration displacement of 40 mm (peak-peak). Since much smaller amplitudes are used for the tests, unwanted effects due to hardware limitations can be excluded. A fast Fourier transform analyser (Ono Sokki CF-3600AT, Yokohama, Japan) was used to process the measured accelerations in real time, allowing live monitoring of the transfer function and subsequent data collection.
2.2. Experimental Method
Before being added to the FATMD assembly, a previously unused pair of metal cushions were broken in by undergoing three cycles of compression and relaxation using a compression-tension machine (Zwick/Roell BT1-FR10THW.A50, Ulm, Germany), up to the maximal experimental compression of 40%. Their thickness was recorded and used to check for plastic deformation throughout the experiment, which did not occur. When the assembled FATMD was mounted to the shaker, the precompression of the metal cushions could be set. This was done with an uncertainty of ±0.25 mm, which equates to ±1.25% of a cushion’s thickness.
A series of experiments was carried out at various cushion precompressions and input signal amplitudes. Starting at 5%, the precompression was increased in steps of 5% up to a maximal 40% compression per cushion (a total of eight pre-sets) and at each precompression, data were collected at five input signal amplitudes by altering the shaker’s input voltage amplitude in steps of 0.1 V from 0.1 V to 0.5 V, resulting in an average input amplitude range of 0.01 g to 0.05 g.
Each data set recorded the power sum average across 15 frequency-swept sine cycles of the magnitude and phase of the frequency response as well as raw acceleration data in the time domain, at a sample rate of 4096 per cycle. Each cycle swept from 0 Hz to 1000 Hz with a period of 1.6 s, resulting in a transfer function with 1601 data points with a frequency step width of 0.625 Hz. The sweeps were performed with increasing frequency.
2.3. Analytical Modelling
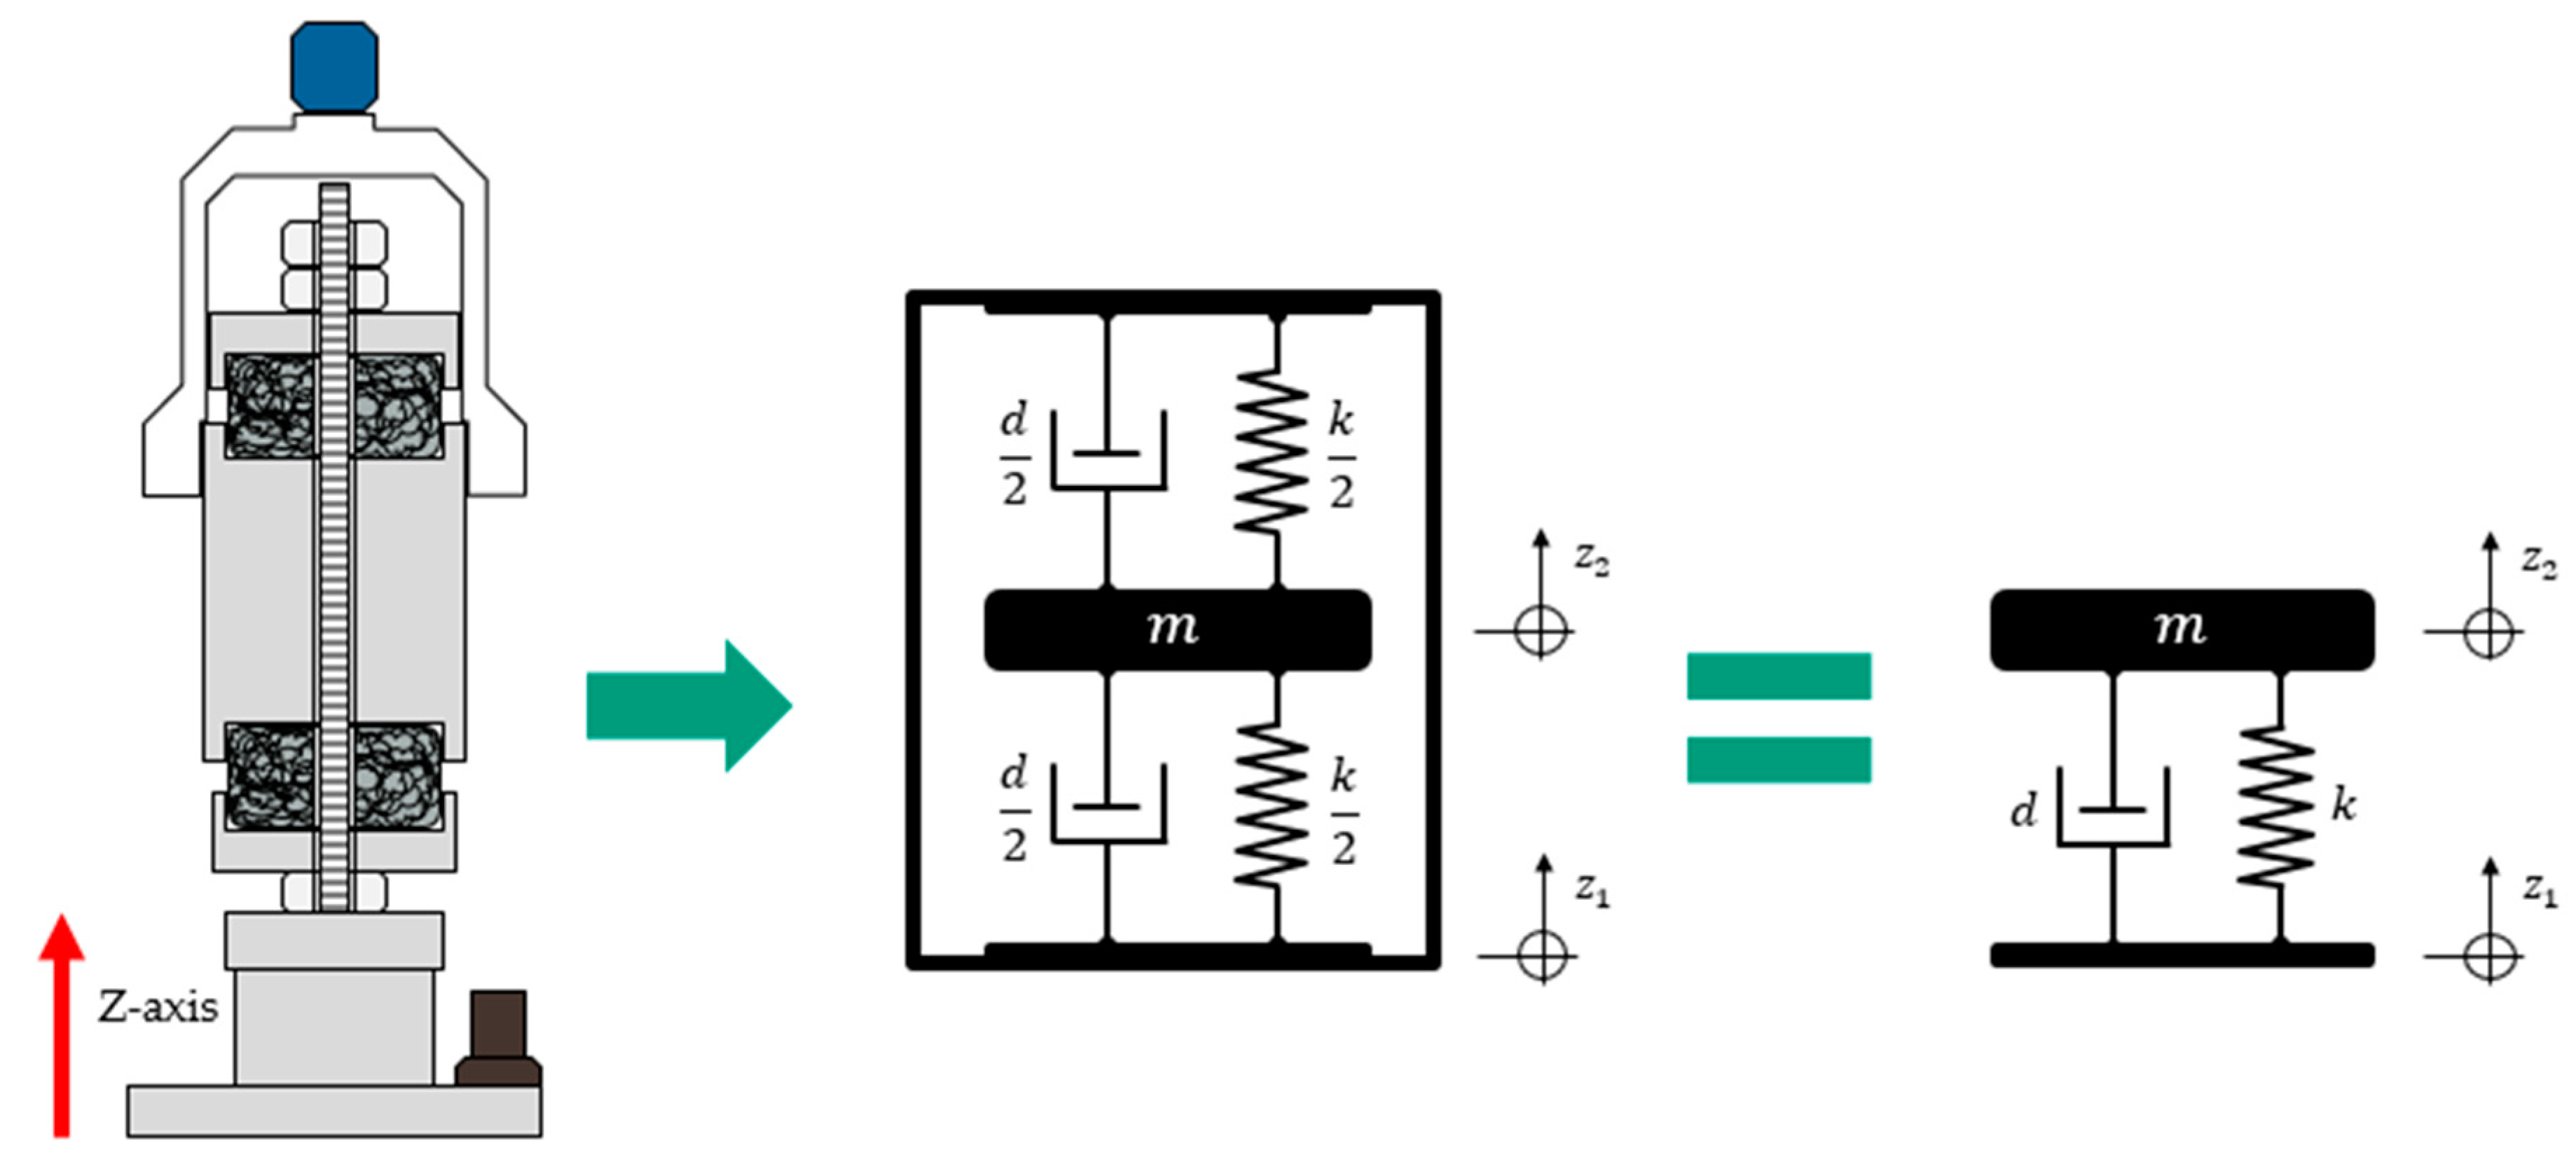
Accurately modelling the dynamic behaviour of metal cushions has proven to be difficult because of the frequency and amplitude dependency for both the dynamic stiffness and damping [19,20]. For simplicity, the experimental FATMD in the present work was assumed to follow the behaviour of a single degree of freedom system, or ‘simple oscillator’, comprising a concentrated mass for which movement is limited to the Z-direction, a linear massless spring and a viscous massless damper. The model is shown in Figure 4. In terms of damping this modelling approach is inaccurate, since damping mainly results from friction of the wires rubbing against each other. However, assuming the damping as purely viscous shows good agreement between the model and the measurement data, as can be seen in Section 3. Furthermore the use of a viscous damping model provides the possibility of quantifying the FATMD damping performance in terms of the damping ratio D, which is most commonly used for qualifying TMDs.
This model yields the complex transfer function , which is defined as the ratio between mass amplitude and base amplitude (both being expressed either as displacement, velocity, or acceleration) and is independent of the input force.
where is the stiffness of the system, is the damping factor, is the frequency and is the mass in the FATMD. The real element of the transfer function corresponds to the magnitude of vibrations while the imaginary part corresponds to the phase. The damping factor, , is expressed in Nsm−1 but a more useful quantity (practically speaking) is the damping ratio, . This is a dimensionless quantity related to the former by the equation
As it is better suited for characterising a system, the damping ratio, rather than the damping factor, was used throughout the analysis.
2.4. Methods of Analysis
To ascertain the stiffness and damping properties of the FATMD system, the following methods were applied with the aim of maximising the similarity between the model and the measured data. As the model does not perfectly represent the FATMD system’s behaviour, an error between the model and the measurements was always observed. Quantification of this error is described below.
The model is described by three independent parameters (, and ), however, the mass is assumed to be independent of the precompression and directly related to the physical mass. Therefore, it is determined by weighing the inner mass (and the attached cap and sensor) and was found to be 1.082 kg. The two remaining parameters are determined in the following way for each measurement:
- (1)
- First, the damping ratio of the system is determined by regarding the magnitude of the measured frequency response and identifying the peak. Its value is evaluated according to the equation
This equation [29] is a very close approximation of the full analytical solution of the transfer function given in Equation (1).
An alternative method, based on half-power points, takes the damping ratio to be given by the equation
where and are the frequencies corresponding respectively to the two points below and above (left and right of) the peak on the magnitude curve at which the magnitude is at a factor of its value at resonance, i.e., at half power of the maximal magnitude. However, this method was deemed unfavourable as the resulting model curve did not always fit the measured curve as well as the curve produced using the former method, which provided clearer, more consistent results.
- (2)
- Second, the stiffness is evaluated using the equation
- (3)
- Third, the damping factor is evaluated by rearranging Equation (2). All components necessary to produce the model curves using the transfer function (Equation (1)) are now at hand.
2.5. Methods of Error Calculation
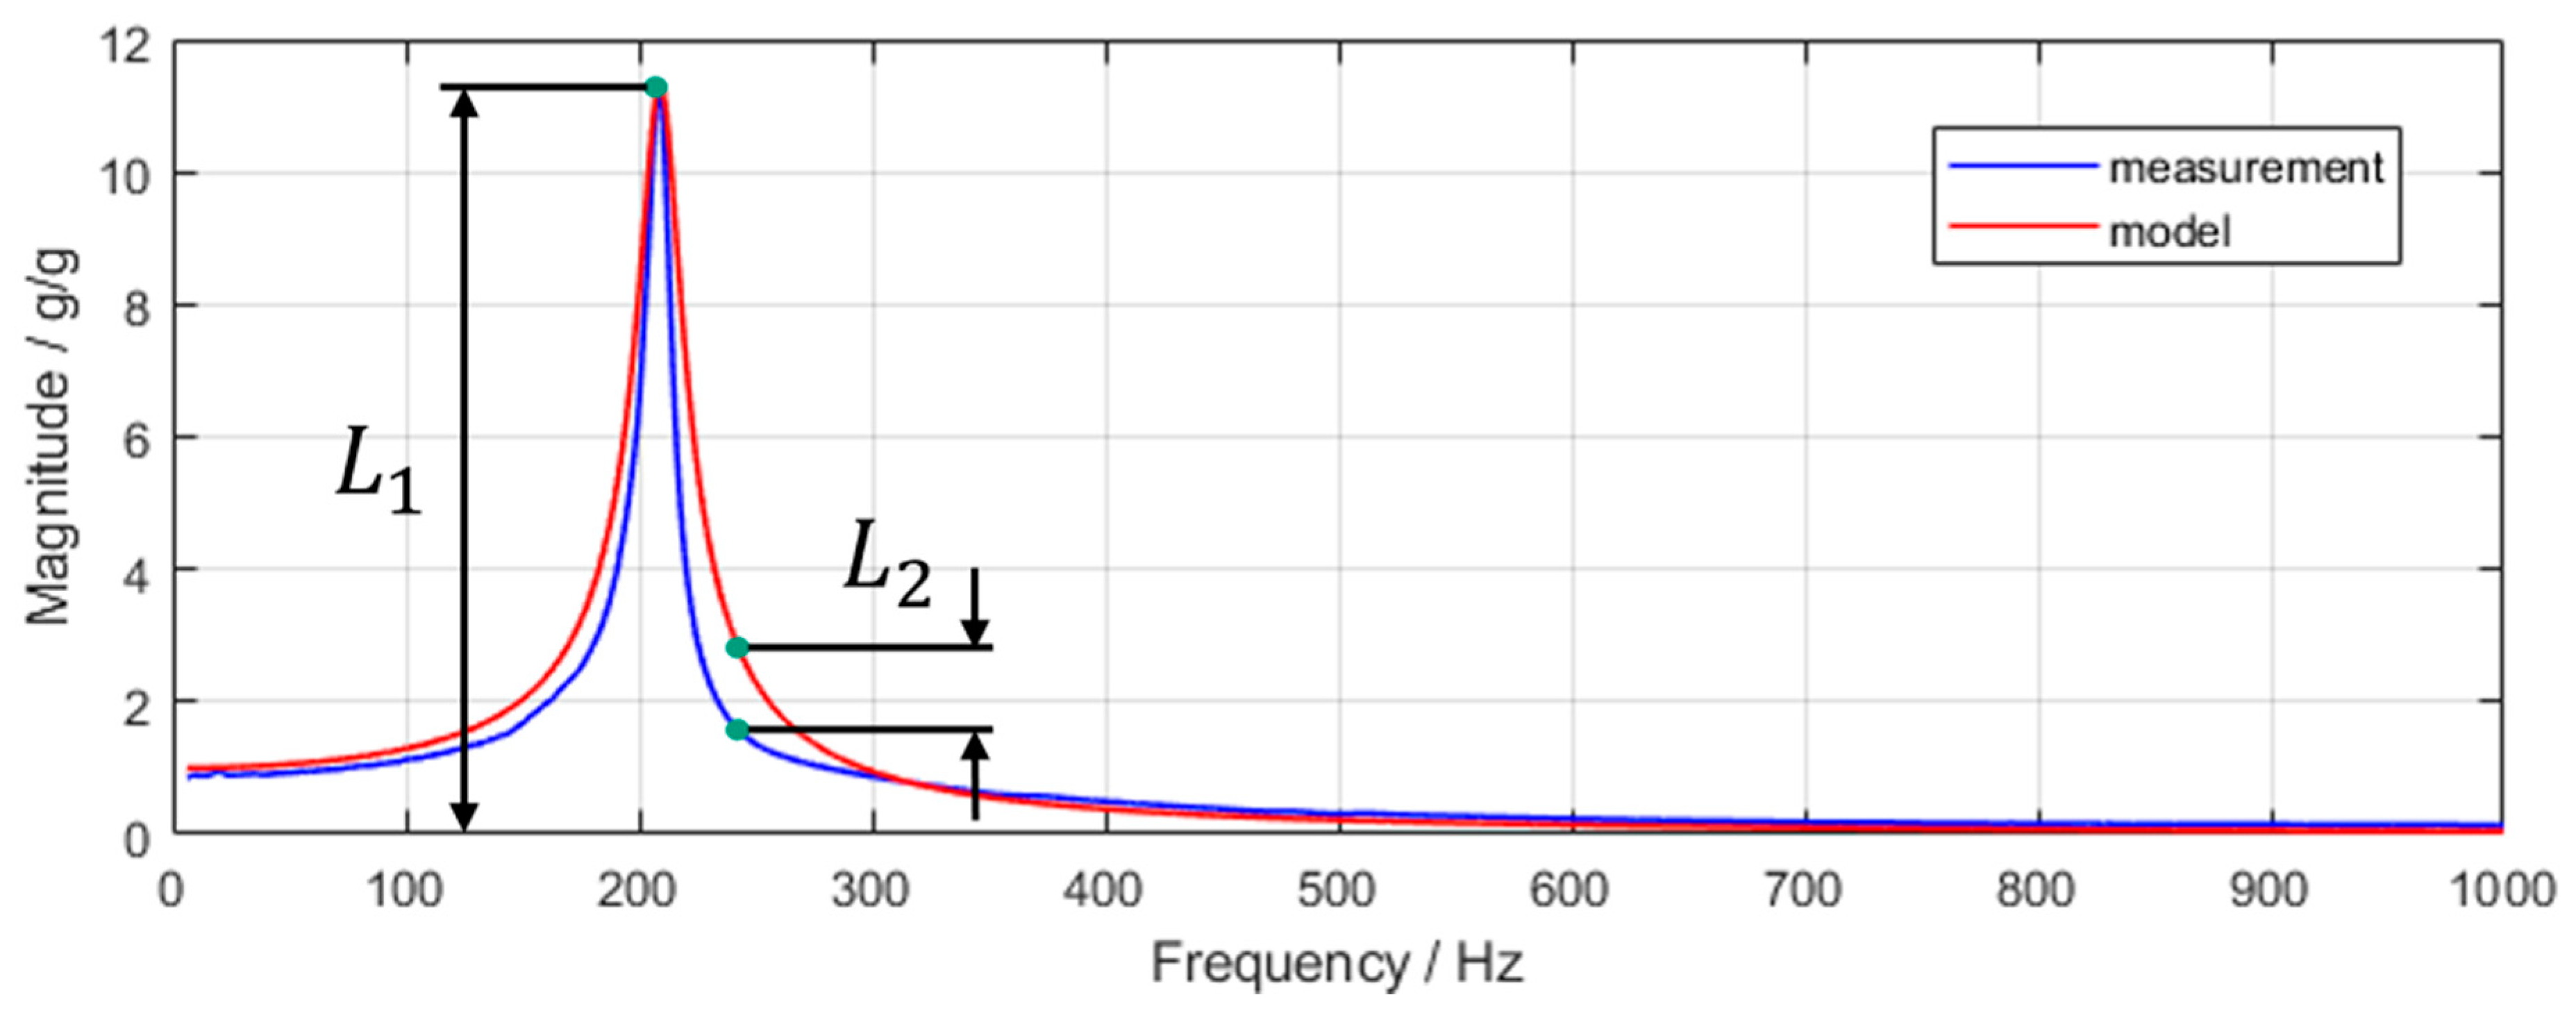
The approach described above will yield a model curve with a peak that always fits perfectly with that of the measured curve. However, either side of the peak the model and results deviate from one another for various reasons. This deviation is quantified in the error as a percentual value, derived from the average normalised discrepancy between the measured and the model data points, as described by the following equation:
where is the difference between the measured data point and the corresponding model data point, is the maximal measured amplitude and is the number of data points across the frequency range measured. The values that and correspond to are illustrated in Figure 5.
The error can be attributed to the failure of the model to fully encompass the FATMD’s behaviour due to certain assumptions made. While the model assumes the damping to be purely viscous, the damping in the physical system is comprised of a mixture of viscous and nonlinear frictional (Coulomb) damping with additional higher-order effects such as those due to component elasticities. A model that can completely describe the behaviour of the system presented here has not yet been created [19] and developing one with the necessary complexity is beyond the scope of the present work. Hence the simplified model shown in Figure 4 is used and consideration is given to the associated error.
3. Results and Discussion
3.1. Effect of Precompression on Resonant Frequency, Stiffness and Damping Ratio
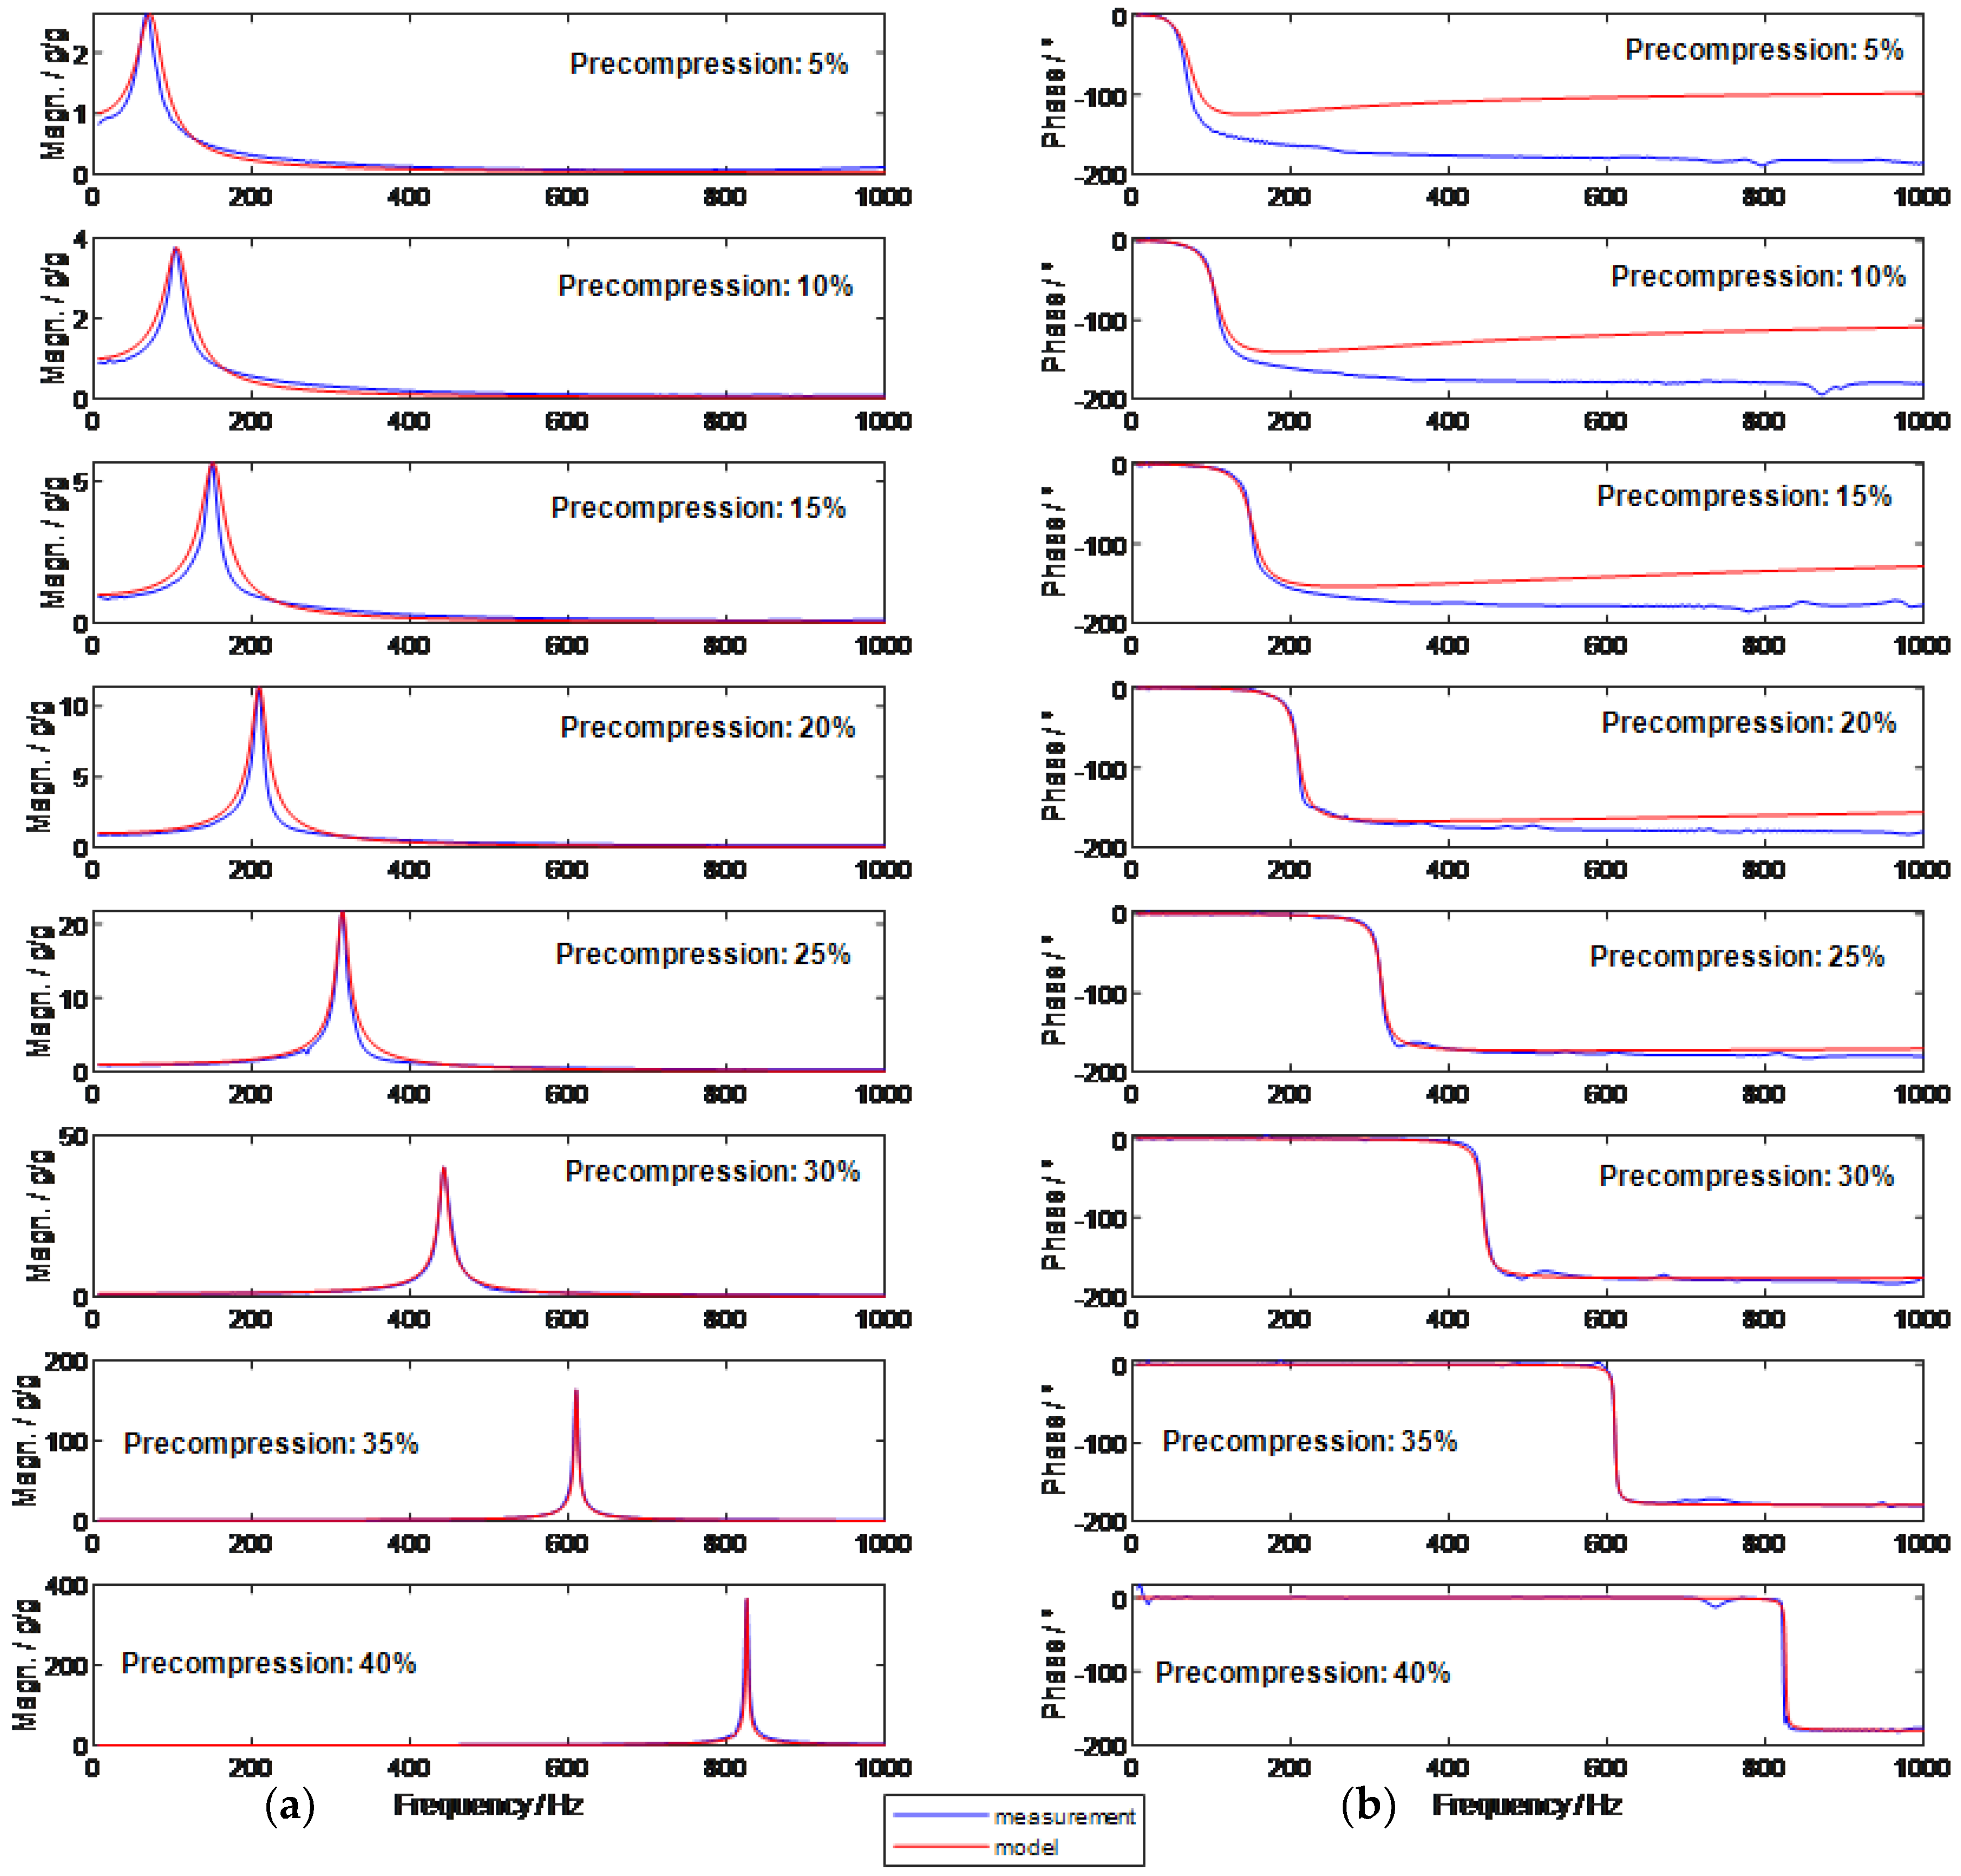
The precompression of the cushions was found to affect the stiffness and damping properties of the FATMD in such a way that its resonant frequency could be precisely controlled. Figure 6 shows one set of transfer function curves produced by the experiment, these at an input amplitude of 0.03 g. The left and right sides show the curves of magnitude and corresponding phase, respectively, and both the measured and the model data are displayed. The precompression increases from top to bottom of the figure.
The model parameters for the dataset displayed in Figure 6 are given in Table 2. Evidently, a higher precompression results in a higher resonant frequency. By adjusting the precompression , a desired resonance can be set, the bandwidth of adjustment being limited by the cushions’ compression threshold. This behaviour speaks for the suitability of the metal cushions for use in frequency-adjustable tuned mass dampers.
While the error for modelling the magnitude () is always below 3%, the error of the phase () rises above 30% for low precompressions. Reasons for these errors are prosed in Section 3.3. As can be seen from Figure 6, this error mainly results from discrepancies at frequencies higher than the resonance frequency. Because of this, the validity of the applied model around the resonance frequency remains unaffected.
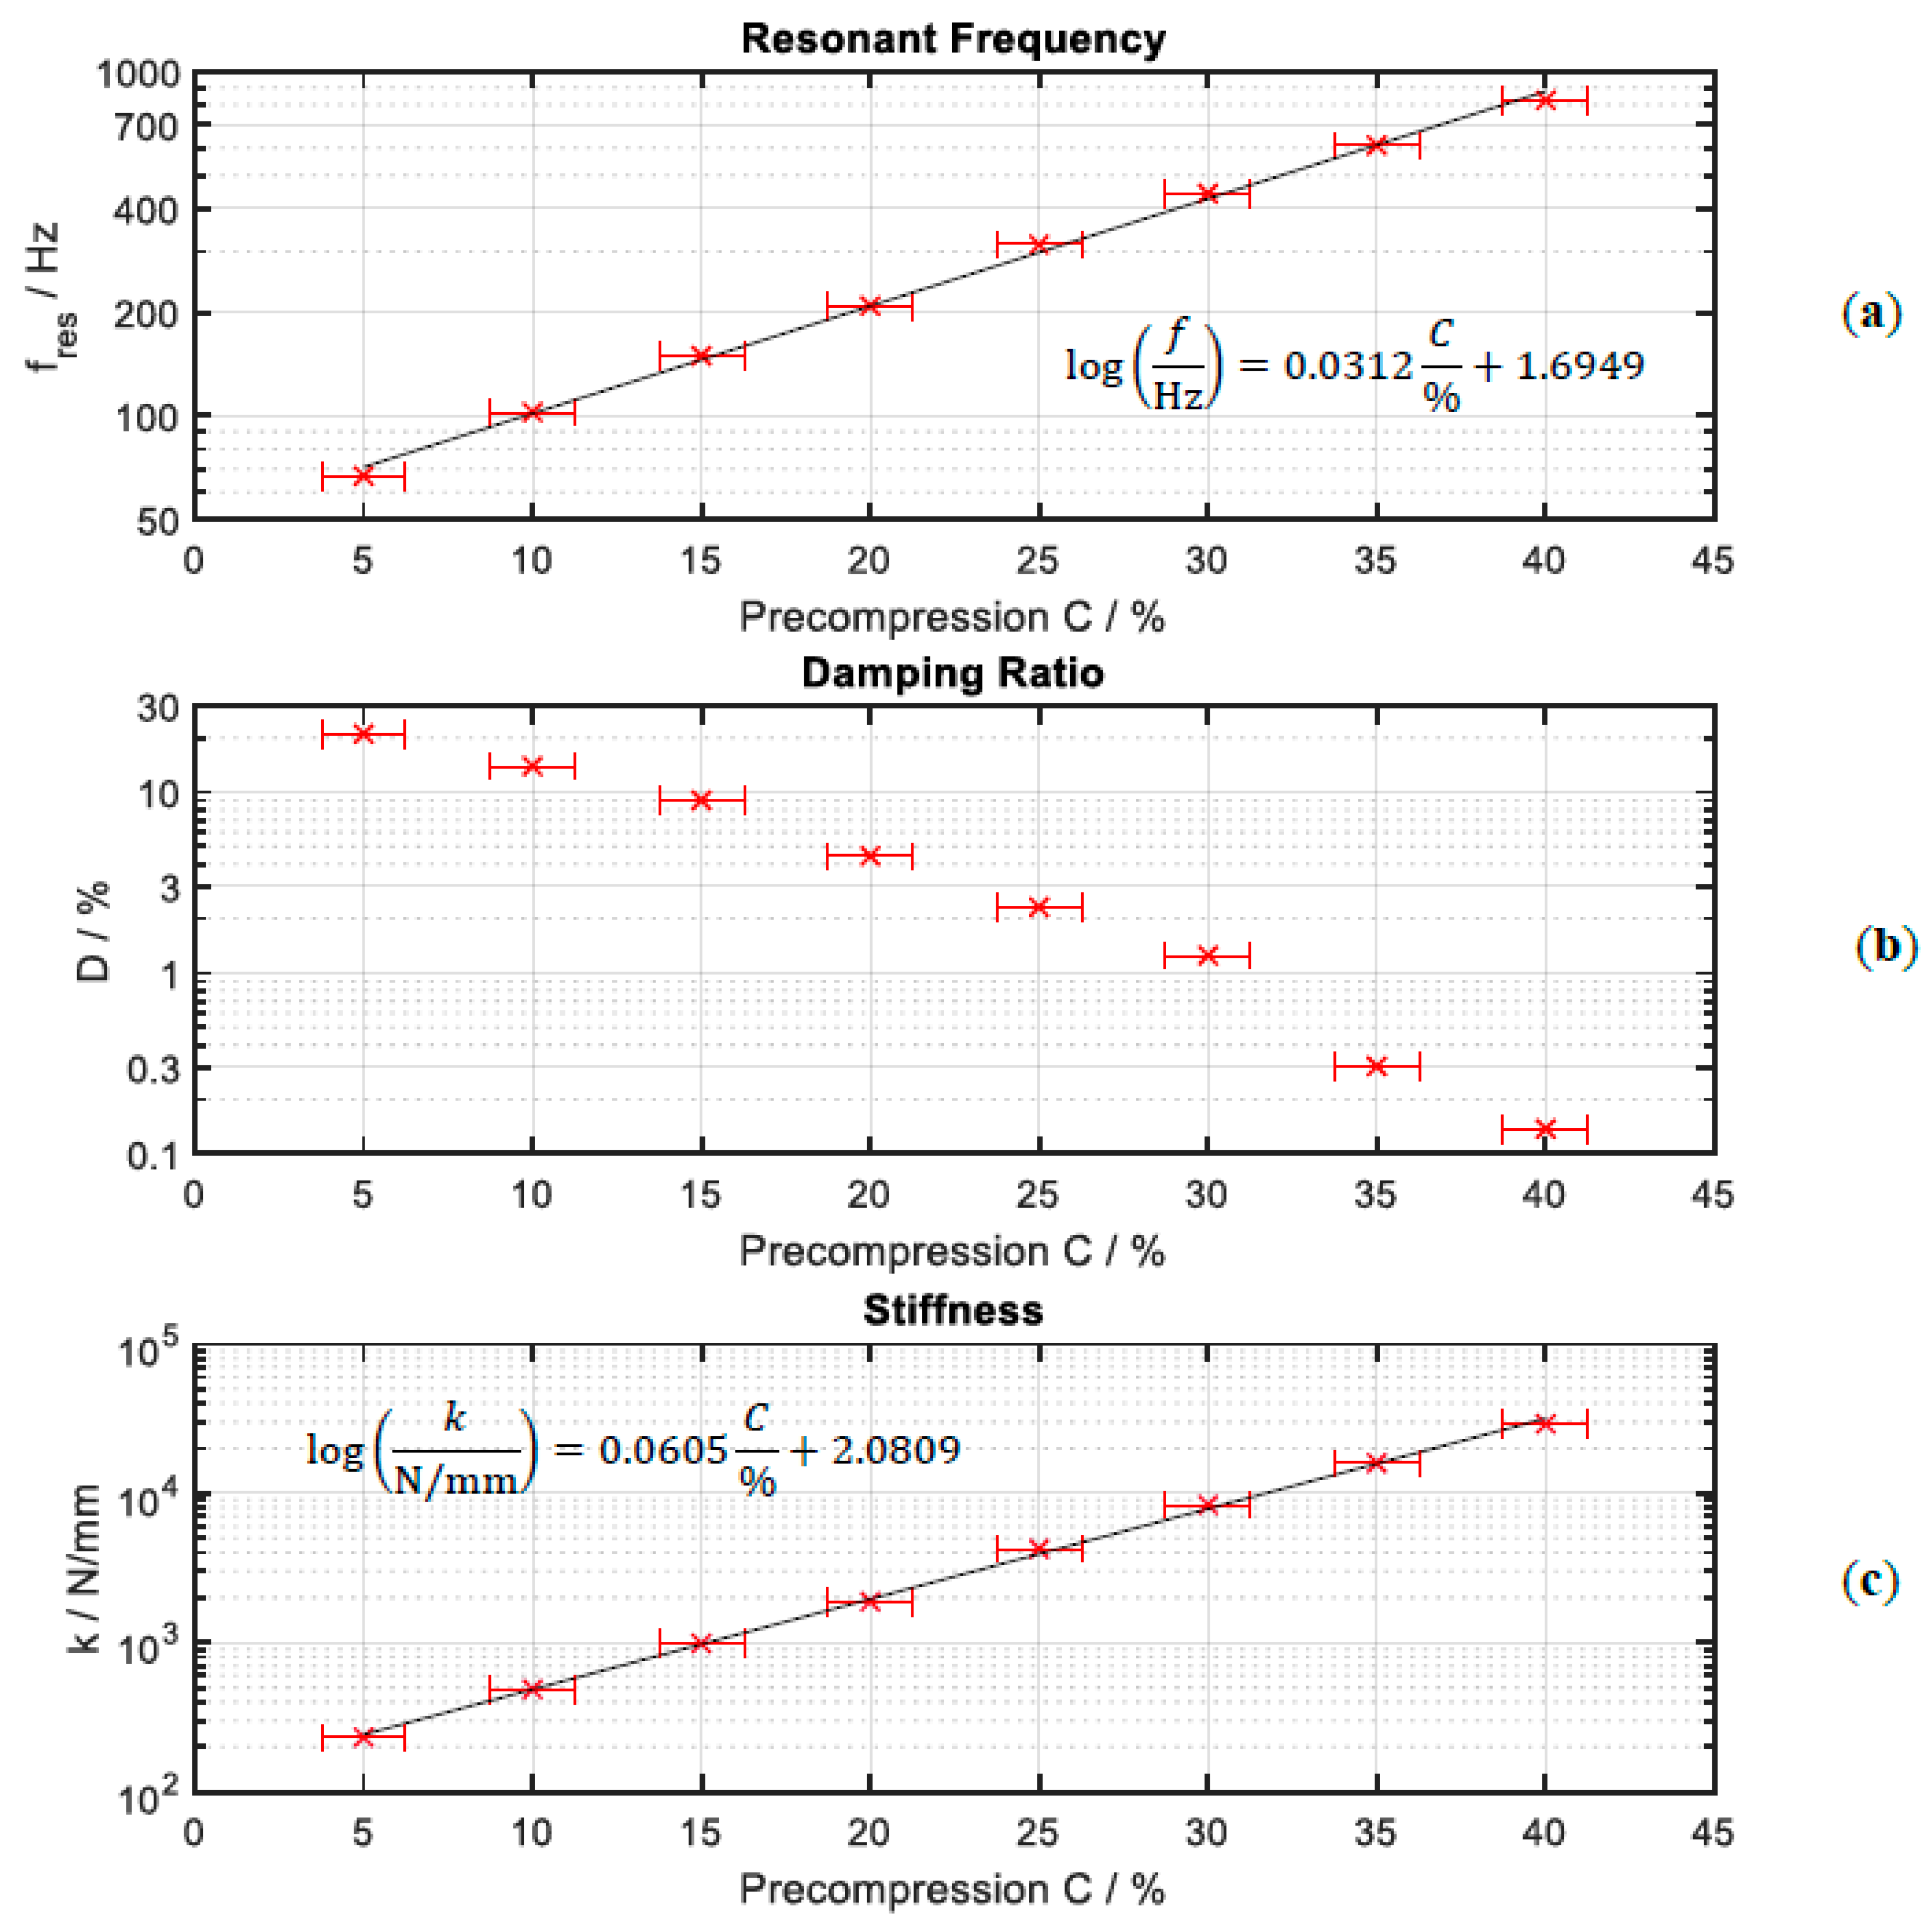
The FATMD’s resonant frequency is influenced by the stiffness and damping ratio of the cushions and how they change with precompression. Figure 7 displays plots of the resonant frequency (7a), damping ratio (7b) and stiffness (7c) against precompression for the dataset introduced above. The damping and stiffness parameters are from the model, calculated in accordance with the method presented in Section 2.4.
It was found that the change of both the resonance frequency and the dynamic stiffness with precompression can be approximated well by a linear curve on a logarithmic scale. Therefore, lines of best fit and their corresponding equations are shown in Figure 7a,c. The increase of stiffness with precompression can be explained by the structure of the metal cushions.
When uncompressed, the density of wire in a cushion is at a minimum and there exist some air gaps within the cushion, with fewer contact points between wires. At low precompressions, a force applied to the cushion serves mainly to reduce this space by pushing the wires closer together, into contact with one another, such that the number of contact points increases. At higher precompressions most of the air gaps in the cushion have already been removed and the number of contact points is at a maximum. With increasing precompression, the number of contact nodes increases and their average free wire length decreases. According to basic mechanics, both effects serve to increase the overall stiffness.
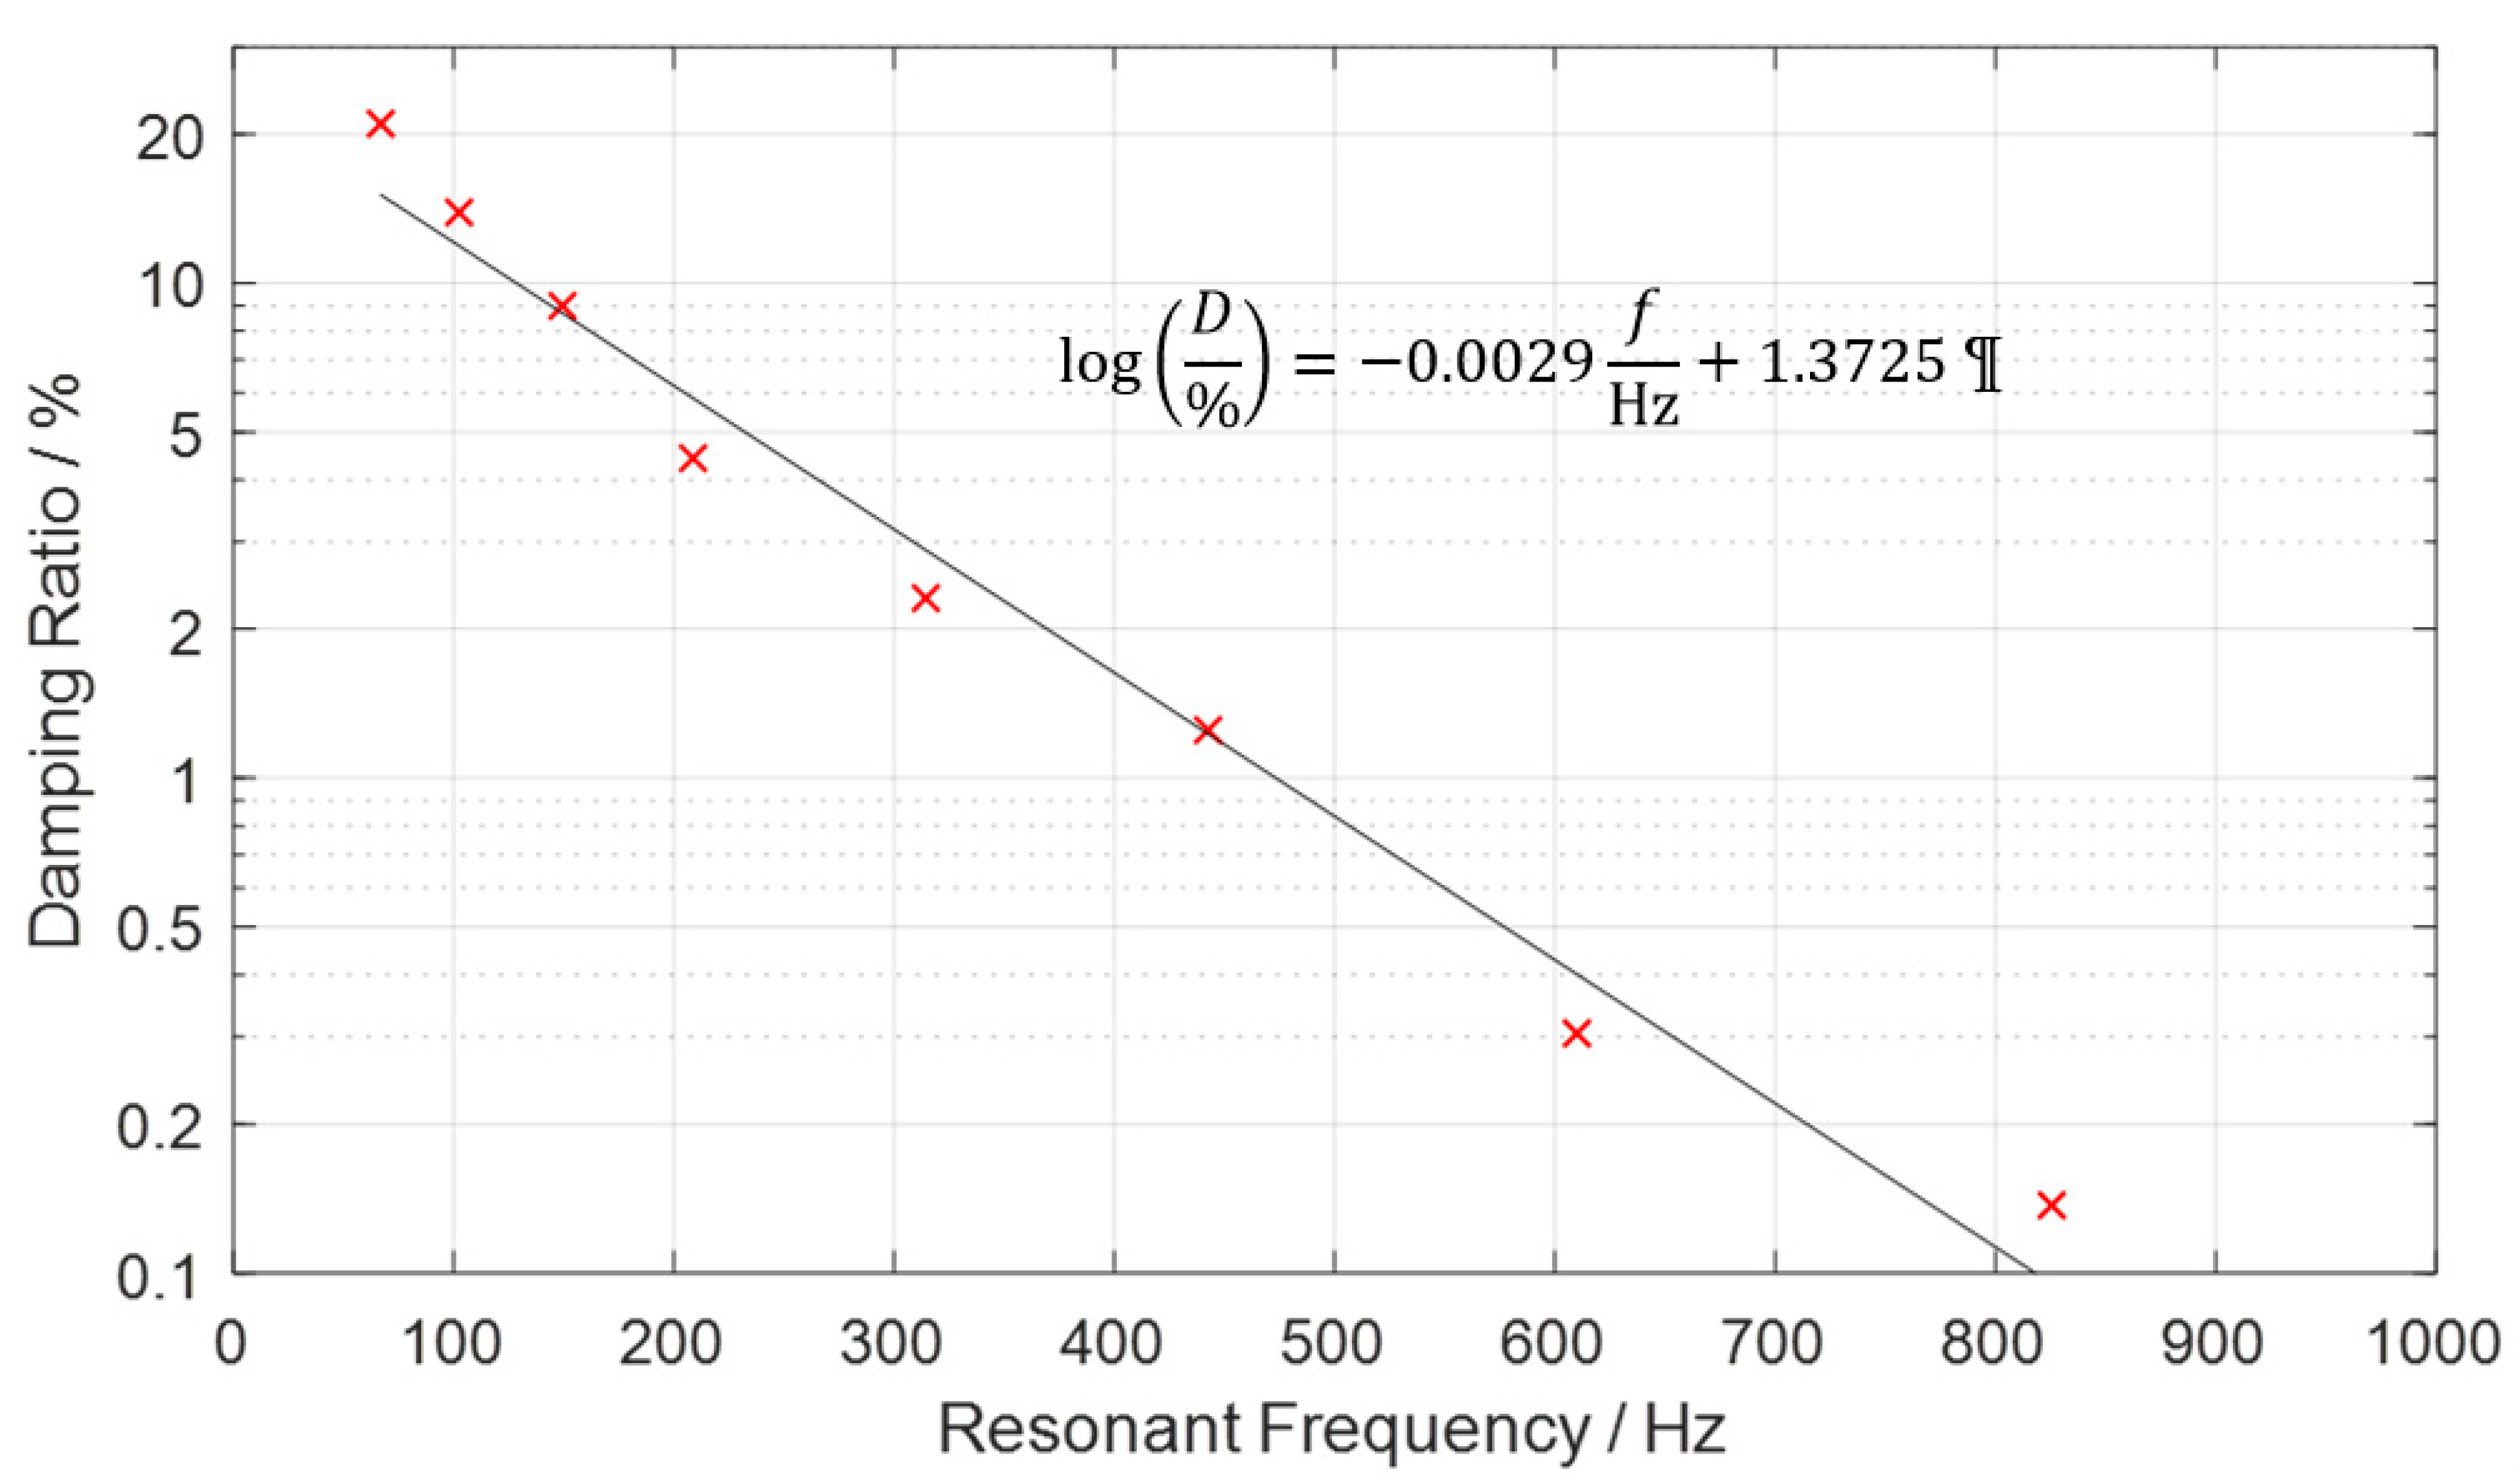
Contrarily to the stiffness, Figure 7b shows the damping ratio decreasing nonlinearly as the precompression is increased. Knowledge of damping characteristics is essential when tailoring an FATMD’s design to a given application and can help decide whether the inherent damping of the metal cushions is sufficient or whether additional damping mechanisms such as eddy current damping need to be included. In some FATMD applications, such as TMDs designed to reduce vibrations at structural resonances, a higher damping ratio is preferable whereas in others, such as in TMDs designed to reduce narrowband vibrations caused by a harmonic excitation (also called neutralisers), less so. For this reason, the damping ratio of the experimental FATMD is investigated below by considering a graph more useful for this purpose. It plots the damping ratio against the resonant frequency on a logarithmic axis, revealing how large a role the damping plays at each resonance. Figure 8 shows this graph for one input amplitude.
At lower resonant frequencies, the experimental FATMD is found to have a high damping effect. The measurement values can be well approximated by an exponential function, showing a linear curve on the logarithmic axis. The equation of the line of best fit shown in Figure 8 can be used for further analysis. As with the increase in stiffness, this behaviour can be attributed to the way the structure of a cushion changes with its precompression.
Damping occurs when energy is dissipated through heat loss caused by friction within the damper. Here, sliding friction is caused by wires rubbing against each other as the metal cushion compresses and expands. At low precompressions there is more relative movement between wires within the cushion because the stiffness is lower, resulting in a greater displacement for the same force. This results in more so-called ‘slip’ between wires that are in contact, hence more sliding friction. At higher precompressions the stiffness is higher as there are less air gaps in the cushion. More wires are already in contact with each other and there is insufficient space and movement for wires to rub together, hence there is little slip. Instead, the wires ‘stick’ and where there are no wires rubbing together, there is no damping. Slip and stick have previously been used to describe the behaviour of compressed wire mesh material [26].
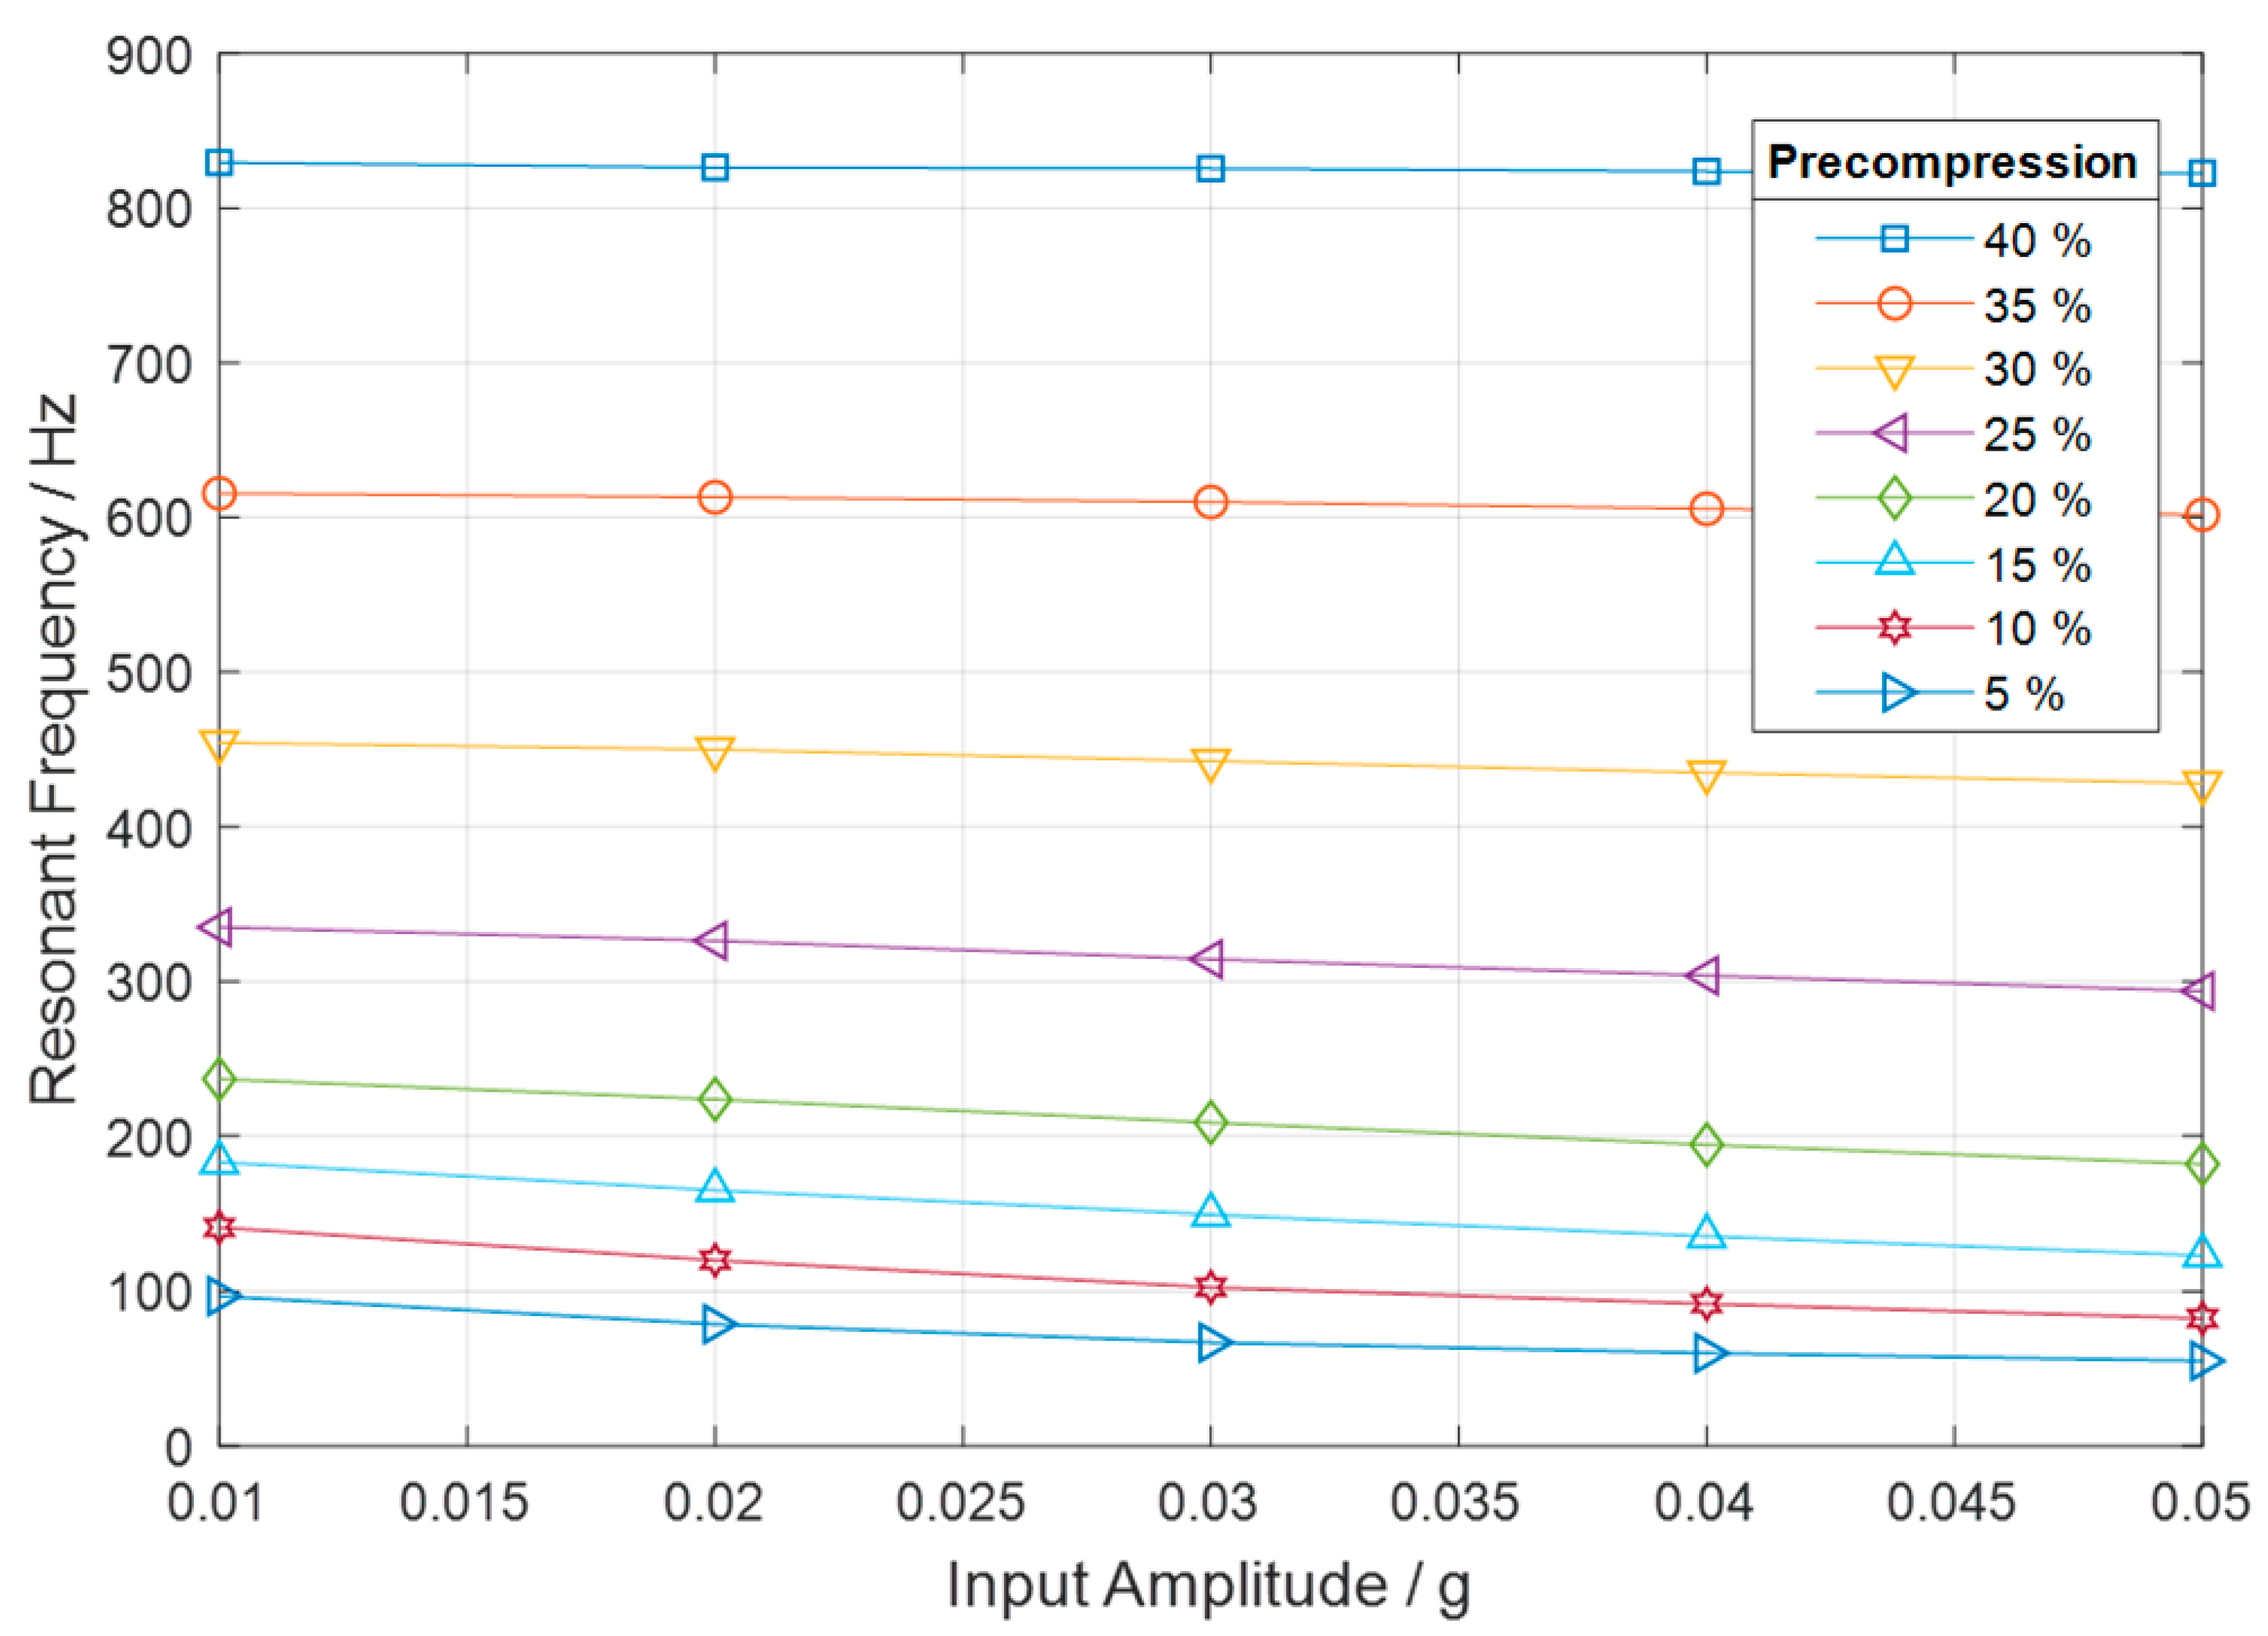
3.2. Effect of Input Amplitude on Resonant Frequency
To study the effect of the input amplitude on the behaviour of the FATMD, data were collected at five input amplitudes for each precompression. The resonant frequency for each dataset has been plotted at its corresponding input amplitude in Figure 9.
The curves of the graph show that changing the input amplitude has a slight effect on the FATMD’s resonant frequency. There is a small decrease in resonant frequency at higher amplitudes, caused by a decrease in the stiffness of the cushions as the input amplitude increases. At lower precompressions this effect is significantly greater than at higher ones, with a maximal reduction of 43% at a precompression of 5%. The reduction in stiffness at higher amplitudes seems to be due to the structure of the cushion, as dictated by the manufacturing process, however further work is required to understand which factors influence the amplitude dependency and how.
When using the FATMD in real applications, the comparatively large shift in resonance frequency due to the size of the excitation amplitude for small precompressions is of low relevance since damping is always well above 10% for small precompressions. Damping makes the FATMD performance robust against shifts in resonance frequency. Therefore, and because of the low resonance shift at higher frequencies, the presented FATMD qualifies well for vibration reduction in real applications.
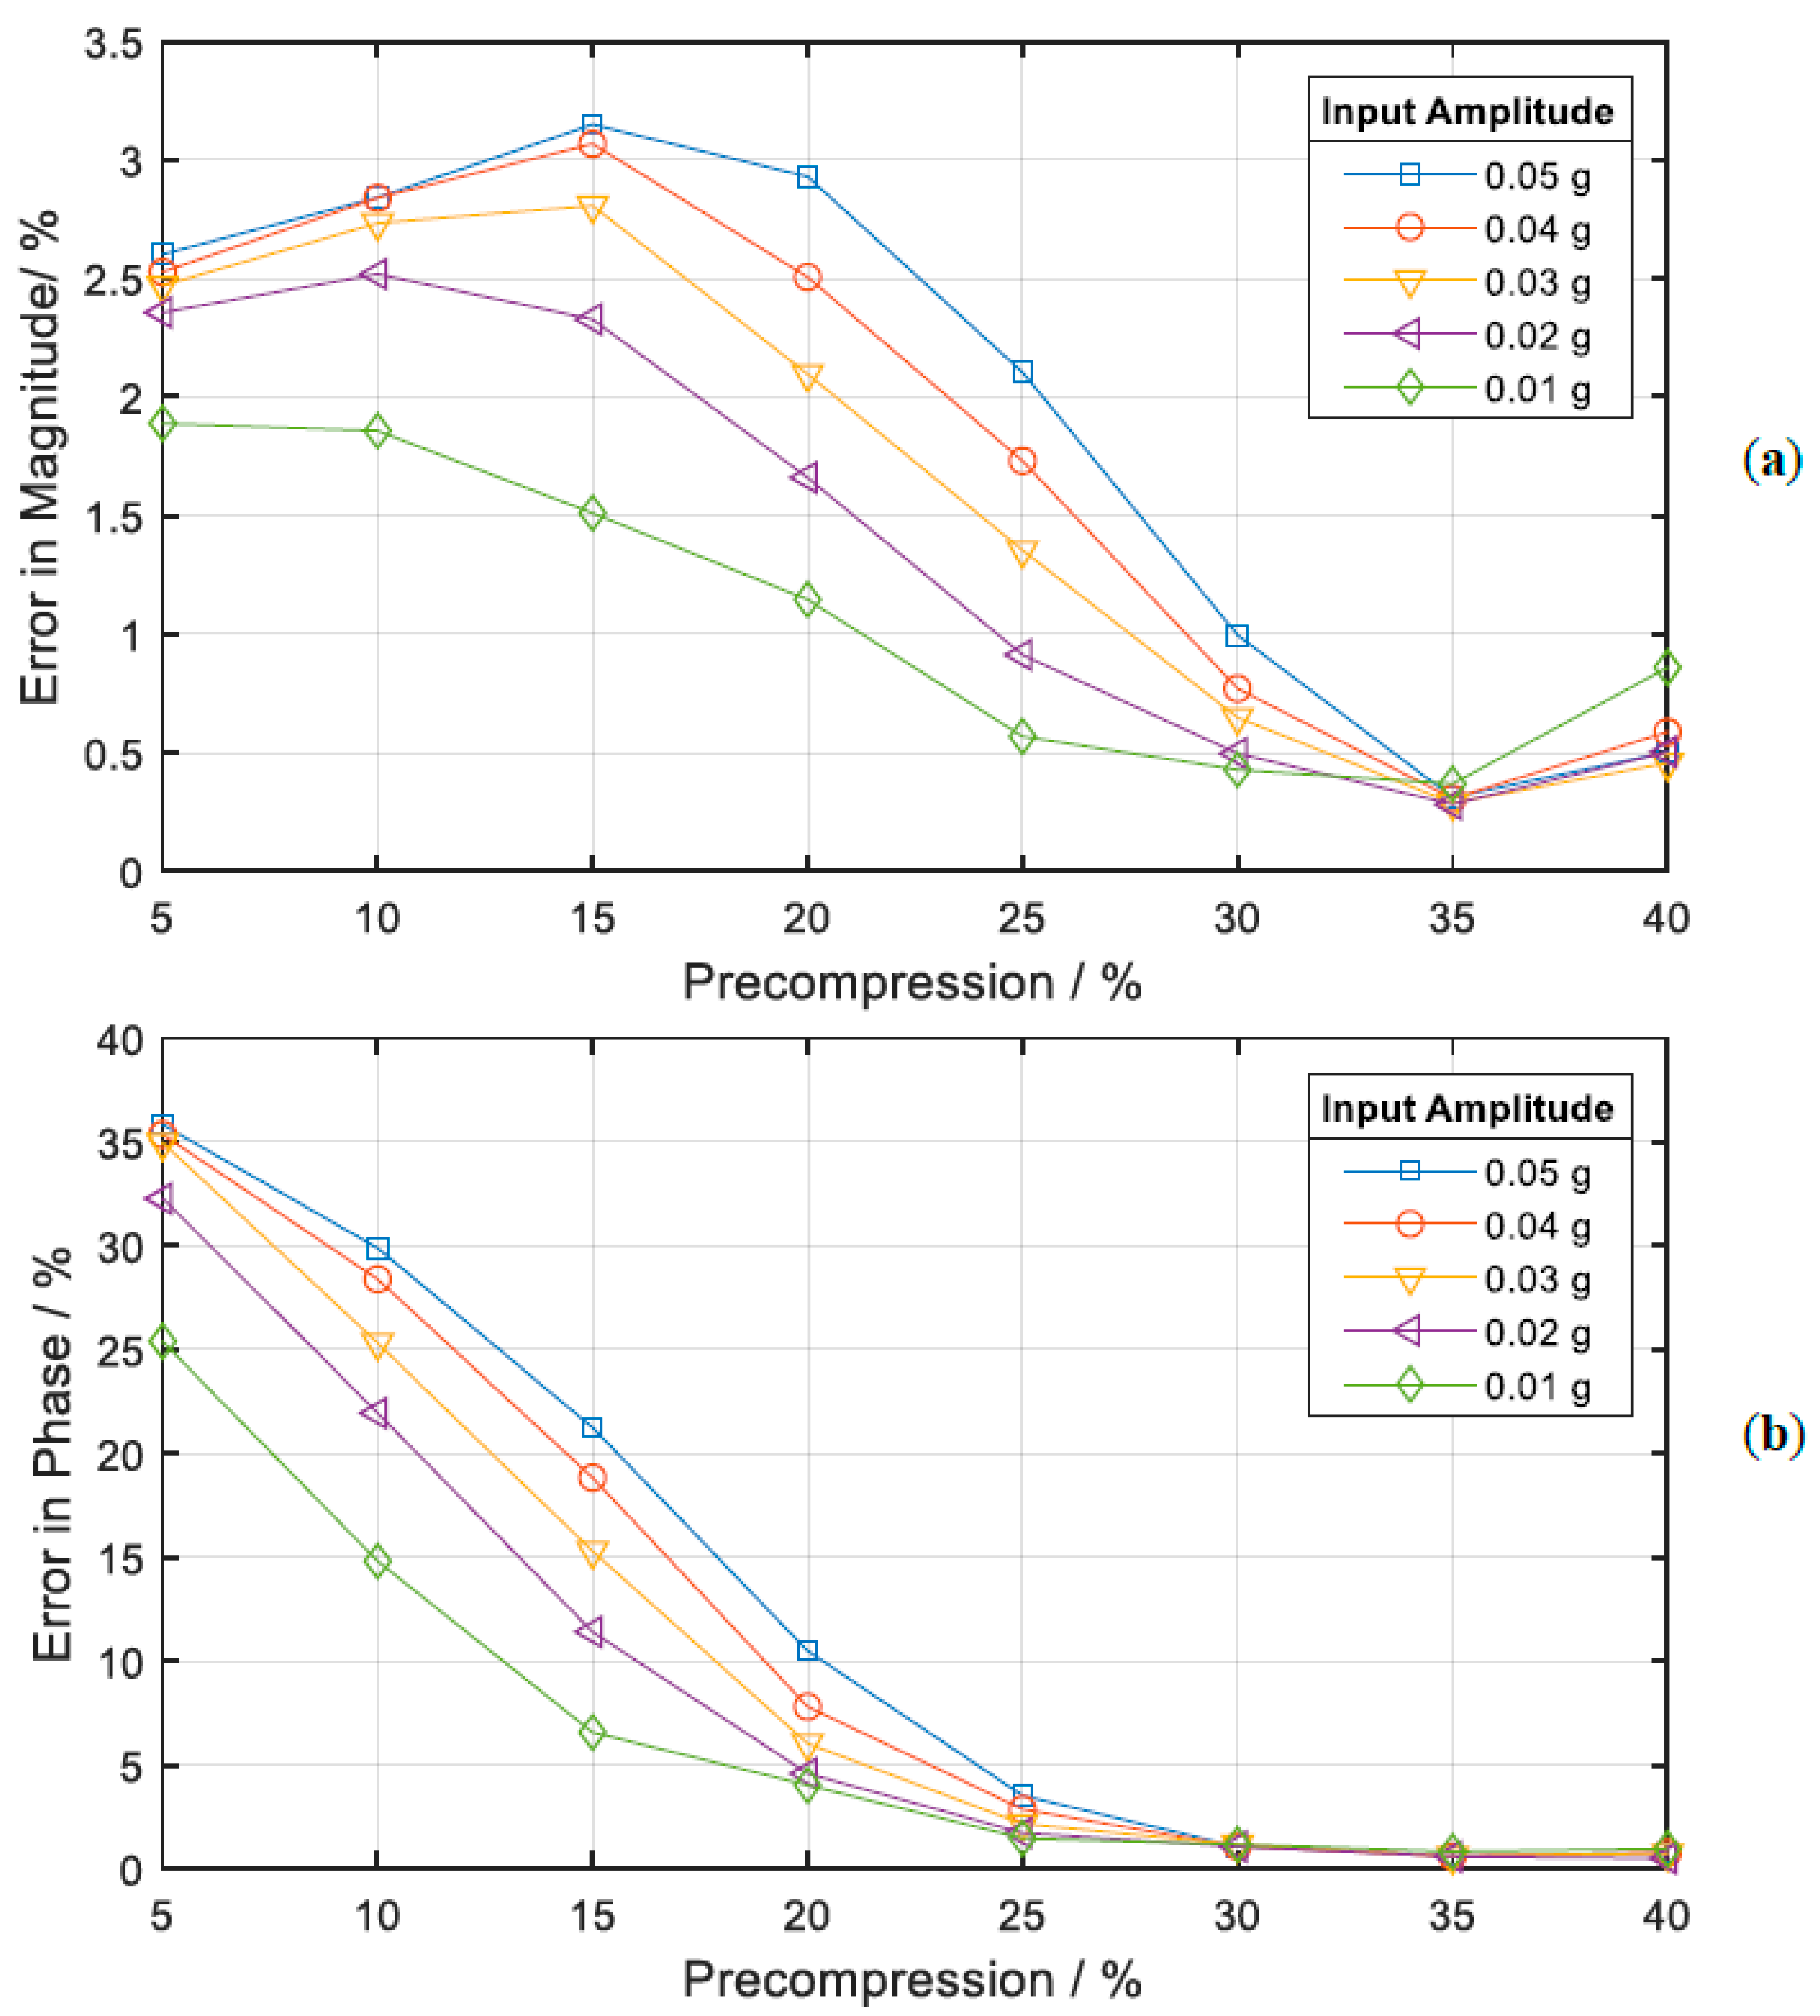
3.3. Effect of Precompression and Amplitude on Error between Data and Model
For reasons previously given, there exists a certain error between the model and the measured results. The method for quantifying the error is described in Section 2.5 and was applied to the experimental results. The errors at every precompression are shown separately for the magnitude and phase curves in Figure 10a,b, respectively.
Both plots show a general downward trend of the error as the precompression increases. However, the order of magnitude of the phase curve error is greater than that of the magnitude curve error at low precompressions. This is due to the large deviation between the model and measured phase curves which occurs above the resonant frequency at low precompressions, as observable on the right-hand side of Figure 6. This deviation is due to the decreasing damping of the cushions at high frequencies, which has a large influence on the phase above the resonance.
The general reduction in error in both the magnitude and the phase at higher precompressions suggest that the model, based on a simple oscillator (see Figure 4), becomes a more accurate description of the actual system when the stiffness is higher and the damping is lower. This can be explained by the decreasing influence of friction damping and increasing influence of material damping and airflow damping, which have more viscous characteristics, at higher precompressions.
Moreover, it can be observed that the error is generally smaller for small amplitudes, since small amplitudes better fit with the linear model assumption.
4. Conclusions
Metal cushions can be used to realise easy-to-adapt tuneable vibration absorbers due to the way their stiffness and damping properties can be altered by adjusting their precompression. As the precompression is increased, stiffness increases and damping decreases. The adjustment can be realised either in a purely mechanical way using standard tools as in the configuration presented in this paper, or using an electrical motor and position control, which could easily be integrated into the FATMD design. The latter option is ideal for vibration control of fast changing dynamic systems or for the automatised experimental identification of optimal parameters for TMDs.
The experimental FATMD was sufficiently well described by a spring-damper simple oscillator. Discrepancies between model and measurements can be explained by the model’s disregard of complex internal damping mechanisms within the metal cushions as it assumes purely viscous damping. At higher precompressions, the FATMD behaved more like a simple oscillator as friction-based damping occurred less, resulting in a smaller error between the model and the measured data. Further research dedicated to the development of an accurate mathematical model describing the metal cushion behaviour is recommended.
The presented FATMD can be used to practically identify the optimal TMD parameters for a given vibration problem that should be addressed with the use of a passive TMD. The FATMD was largely unaffected by changes in input amplitude and features an average resonance frequency bandwidth of 754 Hz across the five input amplitudes measured at. The low amplitude dependency, especially at high frequencies, the large frequency range and the high damping ratio, especially at low frequencies, show the potential for the creation of a highly versatile FATMD using metal cushions. The amplitude dependency observed at low precompressions needs to be studied in more detail. For this, experiments with different excitation signals (e.g., decreasing frequency swept sine, step sine, noise) should be carried out. Moreover, further experiments with other metal cushions made of different types of wire or using other manufacturing processes are recommended in order to study the observed effects in more detail.
Author Contributions
Conceptualisation: S.R. and W.K.; methodology, K.H.; writing—original draft preparation, K.H. and W.K.; writing—review and editing, S.R.; visualisation, K.H. All authors have read and agreed to the published version of the manuscript.
Funding
This research received no external funding.
Institutional Review Board Statement
Not applicable.
Informed Consent Statement
Not applicable.
Data Availability Statement
The data presented in this study are available on request from the corresponding author.
Acknowledgments
The metal cushions used were provided by Hutchinson Stop-Choc GmbH & Co. KG. Their support is greatly appreciated.
Conflicts of Interest
The authors declare no conflict of interest.
References
- Ormondroyd, J.; Den Hartog, J. The theory of the vibration absorber. Trans. Am. Soc. Mech. Eng. 1928, 49, A9–A22. [Google Scholar]
- Leung, A.Y.T.; Zhang, H.; Cheng, C.C.; Lee, Y.Y. Particle swarm optimization of TMD by non—stationary base excitation during earthquake. Earthq. Eng. Struct. Dyn. 2008, 37, 1223–1246. [Google Scholar] [CrossRef]
- Yurchenko, D. Tuned Mass and Parametric Pendulum Dampers under Seismic Vibrations. In Encyclopedia of Earthquake Engineering; Michael, B., Kougioumtzoglou, I.A., Patelli, E., Ivan Siu-Kui, A., Eds.; Springer: Berlin/Heidelberg, Germany, 2014; pp. 1–22. [Google Scholar]
- Lopez, R.H.; Miguel, L.F.F.; Beck, A.T. Tuned Mass Dampers for Passive Control of Structures under Earthquake Excitations. In Encyclopedia of Earthquake Engineering; Kougioumtzoglou, I.A., Patelli, E., Beer, M., Siu-Kui, A., Eds.; Springer: Berlin/Heidelberg, Germany, 2013; pp. 3814–3823. [Google Scholar]
- Shi, W.; Wang, L.; Lu, Z. Study on self-adjustable tuned mass damper with variable mass. Struct. Control Health Monit. 2018, 25, e2114. [Google Scholar] [CrossRef]
- Wang, Z.; Gao, H.; Wang, H.; Chen, Z. Development of stiffness-adjustable tuned mass dampers for frequency retuning. Adv. Struct. Eng. 2019, 22, 473–485. [Google Scholar] [CrossRef]
- Brennan, M.J. Some Recent Developments in Adaptive Tuned Vibration Absorbers/Neutralisers. Shock Vib. 2006, 13, 531–543. [Google Scholar] [CrossRef]
- Hansmann, J.; Kaal, W.; Seipel, B.; Melz, T. Tuneable Spring Element for an Adaptable Vibration Absorber. Atz Worldw. 2012, 114, 36–39. [Google Scholar] [CrossRef]
- Williams, K.; Chiu, G.; Bernhard, R. Adaptive-Passive Absorbers Using Shape-Memory alloys. J. Sound Vib. 2002, 249, 835–848. [Google Scholar] [CrossRef]
- Deng, H.X.; Gong, X.L.; Wang, L.H. Development of an adaptive tuned vibration absorber with magnetorheological elastomer. Smart Mater. Struct. 2006, 15, N111–N116. [Google Scholar] [CrossRef]
- Sun, S.; Deng, H.; Yang, J.; Li, W.; Du, H.; Alici, G.; Nakano, M. An adaptive tuned vibration absorber based on multilayered MR elastomers. Smart Mater. Struct. 2015, 24, 45045. [Google Scholar] [CrossRef]
- Shin, B.-C.; Yoon, J.-H.; Kim, Y.-K.; Kim, K.-S. Vibration suppression using tunable vibration absorber based on stiffness variable magneto-rheological gel. Rev. Sci. Instrum. 2015, 86, 106106. [Google Scholar] [CrossRef]
- Karsten, R.; Schlaak, H.F. Adaptive absorber based on dielectric elastomer stack actuator with variable stiffness. In Proceedings of the Electroactive Polymer Actuators and Devices (EAPAD), San Diego, CA, USA, 12–15 March 2012; p. 834020. [Google Scholar]
- Heuss, O.; Salloum, R.; Mayer, D.; Melz, T. Tuning of a vibration absorber with shunted piezoelectric transducers. Arch. Appl. Mech. 2016, 86, 1715–1732. [Google Scholar] [CrossRef] [Green Version]
- Tang, N.; Rongong, J.A.; Sims, N.D. Design of adjustable Tuned Mass Dampers using elastomeric O-rings. J. Sound Vib. 2018, 433, 334–348. [Google Scholar] [CrossRef] [Green Version]
- Carrascal, I.A.; Pérez, A.; Casado, J.A.; Diego, S.; Polanco, J.A.; Ferreño, D.; Martín, J.J. Experimental study of metal cushion pads for high speed railways. Constr. Build. Mater. 2018, 182, 273–283. [Google Scholar] [CrossRef]
- Pérez, A.; Ferreño, D.; Carrascal, I.A.; Polanco, J.A.; Casado, J.A.; Diego, S. Metal cushion dampers for railway applications: A review. Constr. Build. Mater. 2020, 238, 117711. [Google Scholar] [CrossRef]
- Wang, H.; Rongong, J.A.; Tomlinson, G.R.; Hong, J. Nonlinear Static and Dynamic Properties of Metal Rubber Dampers. Proc. ISMA 2010, 10, 1301–1315. [Google Scholar]
- Chandrasekhar, K.; Rongong, J.A.; Cross, E.J. Frequency and amplitude dependent behaviour of tangled metal wire dampers. In Proceedings of the International Conference on Noise and Vibration Engineering and International Conference on Uncertainty in Structural Dynamics, Heverlee, Belgium, 15–17 September 2014; pp. 559–572. [Google Scholar]
- Chandrasekhar, K.; Rongong, J.; Cross, E. Mechanical behaviour of tangled metal wire devices. Mech. Syst. Signal Process. 2019, 118, 13–29. [Google Scholar] [CrossRef] [Green Version]
- Cheng, H.Z.; Hu, S.Y.; Zou, G.P. Research on Vibration Characteristic of Metal Rubber by Wire Mesh. AMM 2014, 633–634, 242–245. [Google Scholar] [CrossRef]
- Wu, Y.; Jiang, L.; Bai, H.; Lu, C.; Li, S. Mechanical Behavior of Entangled Metallic Wire Materials under Quasi-Static and Impact Loading. Materials 2019, 12, 3392. [Google Scholar] [CrossRef] [Green Version]
- Xue, X.; Ruan, S.; Bai, H.; Chen, X.; Shao, Y.; Lu, C. An enhanced constitutive model for the nonlinear mechanical behavior of the elastic-porous metal rubber. Mech. Mater. 2020, 148, 103447. [Google Scholar] [CrossRef]
- Hong, J.; Chen, L.; Ma, Y.; Tomlinson, G.R.; Rongong, J.A. Hysteretic properties of metal rubber particles. Proc. Inst. Mech. Eng. Part C J. Mech. Eng. Sci. 2013, 227, 693–702. [Google Scholar] [CrossRef]
- Tang, N.; Rongong, J.A. Feasibility study on the use of tangled metal wire particles as the adjustable elements in tuned mass dampers. J. Sound Vib. 2019, 457, 1–14. [Google Scholar] [CrossRef]
- Hou, J.F.; Bai, H.B.; Li, D.W. Damping capacity measurement of elastic porous wire-mesh material in wide temperature range. J. Mater. Process. Technol. 2008, 206, 412–418. [Google Scholar] [CrossRef]
- Ding, Z.; Bai, H.; Wu, Y.; Ren, Z.; Shao, Y. A Constitutive Model of Plate-Like Entangled Metallic Wire Material in Wide Temperature Range. Materials 2019, 12, 2538. [Google Scholar] [CrossRef] [PubMed] [Green Version]
- Yuyan, L.; Xieqing, H.; Wenxiong, M. A Theoretical Model and Experimental Investigation of a Nonlinear Constitutive Equation for Elastic Porous Metal Rubbers. Mech. Compos. Mater. 2005, 41, 303–312. [Google Scholar] [CrossRef]
- Markert, R. Strukturdynamik; Shaker-Verlag: Aachen, Germany, 2013. [Google Scholar]
Figure 1.
Metal cushion by Hutchinson Stop-Choc used in the FATMD.

Figure 2.
Diagram (a) and photo (b) of the FATMD with sensors attached.

Figure 3.
Schematic of the experimental set-up.

Figure 4.
Development of a simplified analytical model with one degree of freedom () and excitation ().
Figure 4.
Development of a simplified analytical model with one degree of freedom () and excitation ().

Figure 5.
Error calculation method, exemplarily shown for the magnitude curve at 20% precompression and 0.03 g input amplitude.
Figure 5.
Error calculation method, exemplarily shown for the magnitude curve at 20% precompression and 0.03 g input amplitude.

Figure 6.
Magnitude (a) and phase (b) of frequency response at increasing precompressions.

Figure 7.
Precompression vs. resonant frequency (a), damping ratio (b) and stiffness (c) at an input amplitude of 0.03 g. Error bars account for the uncertainty in setting the precompression, described in Section 2.2.
Figure 7.
Precompression vs. resonant frequency (a), damping ratio (b) and stiffness (c) at an input amplitude of 0.03 g. Error bars account for the uncertainty in setting the precompression, described in Section 2.2.

Figure 8.
Resonant frequency vs. damping ratio for an input amplitude of 0.03 g. The red marked values, obtained from the experiment, are approximated by the line of best fit, the equation of which is given in the diagram.
Figure 8.
Resonant frequency vs. damping ratio for an input amplitude of 0.03 g. The red marked values, obtained from the experiment, are approximated by the line of best fit, the equation of which is given in the diagram.

Figure 9.
Comparison of resonant frequency vs. input amplitude for different precompressions.

Figure 10.
Magnitude error (a) and phase error (b) for various input amplitudes.


Table 1.
Experimental metal cushion properties.
| Parameter | Value | Unit |
|---|---|---|
| Outer diameter | 40 | mm |
| Inner diameter | 15 | mm |
| Height | 20 | mm |
| Mass | 32 | g |
| Relative density | 19 | % |
Table 2.
Model parameters and error values for all precompressions at an input amplitude of 0.03 g.
| % | Hz | − | kg | N/mm | Ns/m | % | % | % |
|---|---|---|---|---|---|---|---|---|
| 5 | 66.9 | 2.62 | 1.082 | 232 | 210 | 21.0 | 2.47 | 33.6 |
| 10 | 102.5 | 3.76 | 1.082 | 486 | 202 | 13.9 | 2.73 | 23.8 |
| 15 | 149.4 | 5.66 | 1.082 | 985 | 186 | 9.0 | 2.81 | 15.0 |
| 20 | 208.8 | 11.3 | 1.082 | 1880 | 126 | 4.4 | 2.10 | 5.97 |
| 25 | 314.4 | 21.7 | 1.082 | 4230 | 98.8 | 2.3 | 1.35 | 2.17 |
| 30 | 442.5 | 40.2 | 1.082 | 8370 | 74.9 | 1.25 | 0.65 | 1.17 |
| 35 | 610.0 | 163.7 | 1.082 | 15900 | 25.3 | 0.31 | 0.29 | 0.60 |
| 40 | 825.6 | 365.8 | 1.082 | 29100 | 15.3 | 0.14 | 0.46 | 0.80 |
| Bandwidth | 758.7 |
Publisher’s Note: MDPI stays neutral with regard to jurisdictional claims in published maps and institutional affiliations. |
© 2021 by the authors. Licensee MDPI, Basel, Switzerland. This article is an open access article distributed under the terms and conditions of the Creative Commons Attribution (CC BY) license (http://creativecommons.org/licenses/by/4.0/).
Share and Cite
MDPI and ACS Style
Rieß, S.; Kaal, W.; Herath, K. Frequency-Adaptable Tuned Mass Damper Using Metal Cushions. Vibration 2021, 4, 77-90. https://0-doi-org.brum.beds.ac.uk/10.3390/vibration4010007
AMA Style
Rieß S, Kaal W, Herath K. Frequency-Adaptable Tuned Mass Damper Using Metal Cushions. Vibration. 2021; 4(1):77-90. https://0-doi-org.brum.beds.ac.uk/10.3390/vibration4010007
Chicago/Turabian StyleRieß, Sebastian, William Kaal, and Kristian Herath. 2021. "Frequency-Adaptable Tuned Mass Damper Using Metal Cushions" Vibration 4, no. 1: 77-90. https://0-doi-org.brum.beds.ac.uk/10.3390/vibration4010007