1. Introduction
Vibration is a phenomenon caused by the effect of dynamic and cyclic loading. Excessive vibrations are a severe problem that can compromise the safety and the serviceability of civil structures, by causing discomfort or increasing the stresses and the number of cycles and consequently affecting the ultimate design or fatigue life.
The general recommendation to avoid vibration problems is to move the structural natural frequencies away from the range of typical load frequencies, by changing structural stiffness or mass. However, this solution often leads to onerous structural interventions and may be unfeasible. As an alternative, a practical method for excessive vibration mitigation is the installation of damper devices to work as control mechanisms.
One of the most widely used control mechanism in civil structures is the tuned mass damper (TMD), firstly idealized by Frahm [
1], and later mathematically described by Den Hartog [
2], who obtained the first expressions for its optimal tuning. The classical TMD is a mechanical device composed of a mass-spring-damper system installed on the structure to reduce its dynamic response and acceleration amplitudes.
The main advantages of using a TMD include its simplicity and easy installation. Moreover, it does not require any external energy source, being one of the most cost-efficient vibration control solutions [
3]. However, the classical TMD is a purely passive mechanism, and it must be designed to tune with only one of the structural natural frequencies, and is not capable of adapting itself into another frequency range according to the external actions over the structure.
There are other types of semi-active and active TMDs (generally denoted as SATMDs [
4,
5] and ATMDs [
6]) that overcome the limitations of the purely passive classic device. These other types of TMD achieve a high efficiency by applying an adequate control force in the structure, depending on the vibration mode being excited. They are suitable for structures whose vibration response is governed by many vibration modes. Moreover, they require a vibration monitoring system, power supply, and considerably high maintenance costs. The present paper will not address SATMDs and ATMDs, but rather the classic system, denoted here simply as TMD.
The TMD is limited to controlling the excitation of one chosen frequency and others close to it, and is sensitive to any structural modifications over the time which can considerably compromise its efficiency. Despite this, some examples of the successful application of TMD control systems include tall buildings [
7,
8], bridges [
9,
10], and towers [
11] under wind load effects, factories floors [
12] effected by machinery vibration, floating vessels [
13] subjected to wave loads, and especially floors [
14,
15] and footbridges [
3,
16] under the action of pedestrian loading.
Footbridges are generally designed to be lightweight and cross large spans to cover obstacles in urban environments, such as rivers and large avenues. The dynamic response of these structures is usually governed by few modes of vibration, generally excited by the human walking load. Therefore, the installation of TMD systems is one of the most affordable solutions applied for solving the vibration problems that occur in footbridges [
17].
The typical methodologies for simulating the walking load are based on a deterministic periodic force model (FM). In this approach, the structure is analyzed under the action of a periodic force. However, some pedestrian models propose the analysis of the coupled human-structure system by simulating each pedestrian with a biodynamic model (BM). The BM intends to simulate vertical and lateral interaction forces of the pedestrian body being accelerated by the structural vibrations. For this purpose, one of the main assumptions made by the BM is the consideration of pedestrians as a mechanical arrangement with individual dynamic properties, such as in single degree of freedom (SDoF) [
18,
19,
20] or multiple degrees of freedom (MDoF) [
21,
22] mass-spring-damper systems and inverted-pendulum models [
23]. A literature review about the BM and human–structure interaction can be found in [
24].
In general, the BM tends to achieve more representative results than the FM [
24,
25], since it considers the pedestrian dynamic parameters in the coupled human-structure system. However, introducing the pedestrian’s modal parameters can change the system frequencies and overall damping, influencing the TMD efficiency.
Human walking is a periodic movement given by each step cycle, but it is not perfectly regular. Walking parameters may vary from one individual to another and within the same individual. In fact, the walking load depends on inter-subject parameters such as posture, stride length, height, weight, and age, among others [
26]. The human walking force is also influenced by intra-subject variability, given by the difficulty of people to repeat the same step length and frequency at every step [
27]. Just as in the BM, these slight irregularities in the walking cycle can lead to modifications in the dynamic excitation, and, therefore, may influence the TMD efficiency.
In both walking models, the BM and FM, there is a major limitation in simulating the walking variability. The irregularities that occur during walking may suggest that these deterministic approaches can lead to non-realistic results when compared to real walking scenarios. In addition, the use of these deterministic models can result in misinterpreted conclusions about the TMD’s real efficiency. In that sense, a probabilistic approach seems to be more suitable in these situations, for the better modelling of the effect of human walking.
In the present work, the TMD efficiency is assessed in probabilistic walking models, based on the FM and BM, with inter- and intra-subject variabilities. The inter-subject variability is modelled with proper probability density functions and the intra-subject is simulated by means of the random walk (RW) method. As a case study, the analyses are performed in a model of a real footbridge. The structure is an inverted-queen-post-trust steel footbridge with a long span of 68.6 m, low damping, and a frequency of 1.85 Hz for the first vertical bending mode. The work focuses on modelling the vertical behavior of the structure and the vertical modelling of the walking force, aiming at a TMD efficiency assessment under several probabilistic scenarios.
2. Human Walking Models
To analyze the TMD efficiency in footbridges, a proper description of the most used walking models is necessary, i.e., the force model (FM) and the biodynamic model (BM).
The FM consists of representing the pedestrian’s excitation load as a moving force
, whose intensity is given by a Fourier series. However, during walking, the human body may interact with lightweight structures by applying an excitation force to them at the same time as they are being accelerated by the structural motions. The human–structure interaction [
24] can be more or less relevant depending on the mass relation between the occupants and the structural mass. The effects of the human–structure interaction generally include an increase in the total system damping, variations in the system dynamic properties, and even the appearance of new vibration modes [
22].
In this matter, the FM does not the consideration of these effects because the pedestrian is simulated only by a simple external force being applied at the structure. To overcome this limitation, the development of the BM has been proven to be an adequate way to consider the human–structure interaction. In the BM, the pedestrian is simulated as a moving mechanical arrangement like a SDoF, MDoF, or pendulum systems. That way, the pedestrian excitation force comes along with individual dynamic properties and additional DoFs.
Considering a TMD, the use of a BM may lead to interaction effects, such as changes in overall coupled pedestrians–structural system stiffness, damping, and mass. This could move the structural modal frequencies away from the TMD frequency, reducing the vibration control efficiency. For a better assessment of the TMD efficiency, this paper addresses the FM as well as two BMs which will be briefly described in the following sections.
2.1. Force Model
Human walking is characterized by a cyclic movement starting from one foot touching the ground until the same foot touches the ground again. As previously mentioned, the most usual approaches used to model the human walking are based on a dynamic time-dependent force model (FM).
The pedestrian FM consists in a summation of a static force
with a dynamic portion of the force
, i.e.,:
The static portion of the FM is usually assumed to be the pedestrian weight
, as per Equation (2). The dynamic portion is defined by a summation of the Fourier series that varies accordingly to the pedestrian pacing frequency, the phase angles, and the dynamic load factors (DLFs).
In Equation (3),
is the number of considered Fourier series harmonics,
is the pedestrian pacing frequency,
is the DLF of the
j-th harmonic of the Fourier series, and
is the phase angle for the
j-th harmonic of the Fourier series in relation to first harmonic. The
and
parameters are usually experimentally determined. Some reasonable values can be found in the literature [
26,
28].
2.2. Biodynamic Models
Other approach to modelling human walking is based on simulating the pedestrian’s parameters with calibrated biodynamic models (BM). In the present work, two biodynamic models are being considered, and are described herein. In these models, pedestrians are assumed to be SDoF mass-spring-damper systems subjected to the dynamic forces described in
Section 2.1, and their modal parameters are evaluated with experimentally fitted expressions. The BM tends to lead to more realistic results than the FM due to a better modelling of the coupled system modal parameters.
One of the BMs used in this work was proposed by Silva et al. [
18,
29]. Some expressions for the pedestrian’s modal parameters of mass, damping, and stiffness (
,
, and
, respectively) were fitted based on an experimental campaign performed by fixing accelerometers on the waists of pedestrians. These expressions are a function of the pedestrian total mass
and the pacing frequency
, as follows:
Another recently developed model analyzed in this work was proposed by Varela et al. [
19] and Costa [
30], which also defined expressions for the pedestrian’s dynamic properties:
In Equations (9) and (10),
is the pedestrian damping ratio and
is the pedestrian damped frequency.
and
should be determined iteratively, as one depends on the another. In addition to the expression definitions for the pedestrian’s parameters (
,
,
), this model also provides expressions for step length
, and for the first and second DLFs (
and
) [
19,
30].
In Equations (11) and (12),
is the pedestrian height. The expressions above highlight the dependency on pedestrian height, a topic observed by Kerr [
26], but neglected by several BM formulations.
3. Walking Variability
Human walking is a cyclic process characterized by some slight variabilities. Different people may walk following multiple patterns that depends on inter-subject parameters such as velocity, cadence, and stride length. There is also the intra-subject variability, given by the inability of a pedestrian to walk in the same walking pattern in every step [
27].
Both previously described walking models, the FM and BM, are deterministic approaches that do not consider walking variability. To overcome these limitations, the analysis proposed in this work relies on probabilistic methodologies combined with the FM and BM to consider the walking inter- and intra-subject variabilities.
3.1. Inter-Subject Variability
The inter-subject variability study is crucial as it allows us to comprehend the relation between one person’s characteristic within his/her own walking. The knowledge of the typical range values for the DLF, step length, step frequencies, and walking phase angle is essential for proper walking modelling, avoiding ultra-conservative and non-representative models.
Due to this, inter-subject variability has attracted attention of researchers. In the present paper, the work of Živanović et al. [
27] and Kerr [
26] were used as main references for the probabilistic density functions of the walking parameters.
The pacing frequency
is an important variable because it defines the walking force frequency, and its likelihood to become resonant with the structure natural frequency. The pacing frequency is defined as a normally distributed variable with a mean equal to 1.87 Hz and a coefficient of variation (CoV) of 10%, i.e.,
[
27].
The step length
is also important for defining the time required for crossing the path defined in the walking analyses. The step length is also defined as a normally distributed variable, with a mean equal to 0.71 m and a CoV of 10%, i.e.,
[
27].
The harmonic phase angles of the Fourier series harmonics also play an important role in defining the walking force. In this work, three harmonics are considered in the force definition. The first phase angle is defined to be equal to zero since it is the reference to the others. The second phase angle is assumed to be uniformly distributed between the range of ). Finally, the third phase angle is considered equal to the second .
Based on [
26], the three DLFs of the Fourier series can be modelled as normally distributed variables. The first DLF normal distribution has a CoV or 16% and the mean
is assumed to be a function with the step frequency
, as follows:
The second and third harmonic mean values are considered as 0.07 and 0.05, respectively [
26]. Both variables are assumed to have a CoV of 25%, based on the charts from the experimental test results presented in [
26].
Table 1 presents the summary of the inter-subjective variabilities previously described.
One key aspect to note is that the BM model from [
19,
30] specifies proper equations for the values of
,
, and
, as per Equations (11)–(13). In the simulations, considering the inter-subject variability of this BM (further presented in
Section 5.3.5, denoted as BM2), these parameters are not sampled from the probabilistic density functions presented in
Table 1, but instead Equations (11)–(13) are used.
3.2. Intra-Subject Variability
The intra-subject variability defines the modifications of one parameter along the analysis, and it is given by the human difficulty to keep the same pacing pattern in every step. As well as in the inter-subject variability, a proper definition of the intra-subject variability of pedestrians is equally important for the TMD analysis, since these slight variations during pacing can detune the excitation force frequency.
However, there is a lack of studies addressing the intra-subject parameters probabilistic distributions. Most part of the studies addressing the subject are concerned with the synchronization behavior of crowds and groups of people [
31,
32]. In this matter, the intra-subject variability can be influenced by social and psychological factors, and also the effect of adapting to the structural vibration [
32]. The present work does not aim to investigate the intra-subject phenomena, but only to analyze its influence on the TMD efficiency. The effect of crowd synchronization is not being considered. Therefore, a simplification is assumed that the walking parameters will vary as a stochastic process and a random walk (RW) algorithm is implemented with the purpose of simulating the intra-subject walking variability.
A RW is a Markov chain sequence of independent events. The probability of a subsequent event to occur relies only in the previous event: this is denoted as Markov property. The RW problem was initially proposed by Pearson [
33]. The subsequent development based on the RW method has applications in many fields of knowledge related to random processes, random noises, and stochastic equations, such as describing the movement of animals, cells, and micro-organisms [
34], wave propagation problems [
35], and air particles movements [
36], among others.
A RW is defined by a series of many steps in a d-dimensional domain. Every step has the probability to modify the series in a specified direction in the domain. The slight modifications are denoted transitions, and the probability of being modified is the transition probability or the probability of jumps. In the present paper, a one-dimensional domain is used for the human RW method because the analyses are performed in a plane beam model.
The complete description of RW requires the definition of the transition probability and the transition law, i.e., the probability of the series being modified and by how much the chain series will be modified. There are no available references for these values in the literature, therefore, in this paper, they are chosen aiming a human-like walking force patterns.
Firstly, it is assumed that a pedestrian has equal chances of increasing or decreasing their pacing rate. This statement is considered reasonable due to the great variety of events that may cause a human to accelerate or to slow down. Therefore, the transition probability is defined with the same chances of an increasing transition or a decreasing transition. Moreover, given the inability of a pedestrian to keep the same pacing, it can be supposed that the pacing transition will assume different values for subsequent steps. It is reasonable to assume that, in most of the events, a pedestrian pacing transition will be smooth, but eventually in some events, it will be a drastic acceleration or a drastic deacceleration. In other words, the pedestrians also have the inability to keep the same pacing transitions. For this reason, the transition law assumed in the present work is governed by a Gaussian probabilistic distribution.
A parametric study was performed for defining proper values for the transition probability and the Gaussian transition law parameters. The walking parameter signals generated were visually observed for some values of transition probabilities and Gaussian transition parameters. Aiming a human-like walking force patterns, this work uses a transition probability of 10%. This means that in every step the walking parameters have a 10% probability of being modified (equally probabilities of increase and decrease), and the jump value will be randomly sampled from a Gaussian distribution. It was observed that a Gaussian with mean of 0.001 and a CoV of 50% would result in acceleration levels very close to the experimental signal of one-person induced vibration presented in [
25], and these are the values effectively used in the analyses herein. Proper values for these parameters could be someway determined experimentally, but this is out of the scope of the present work.
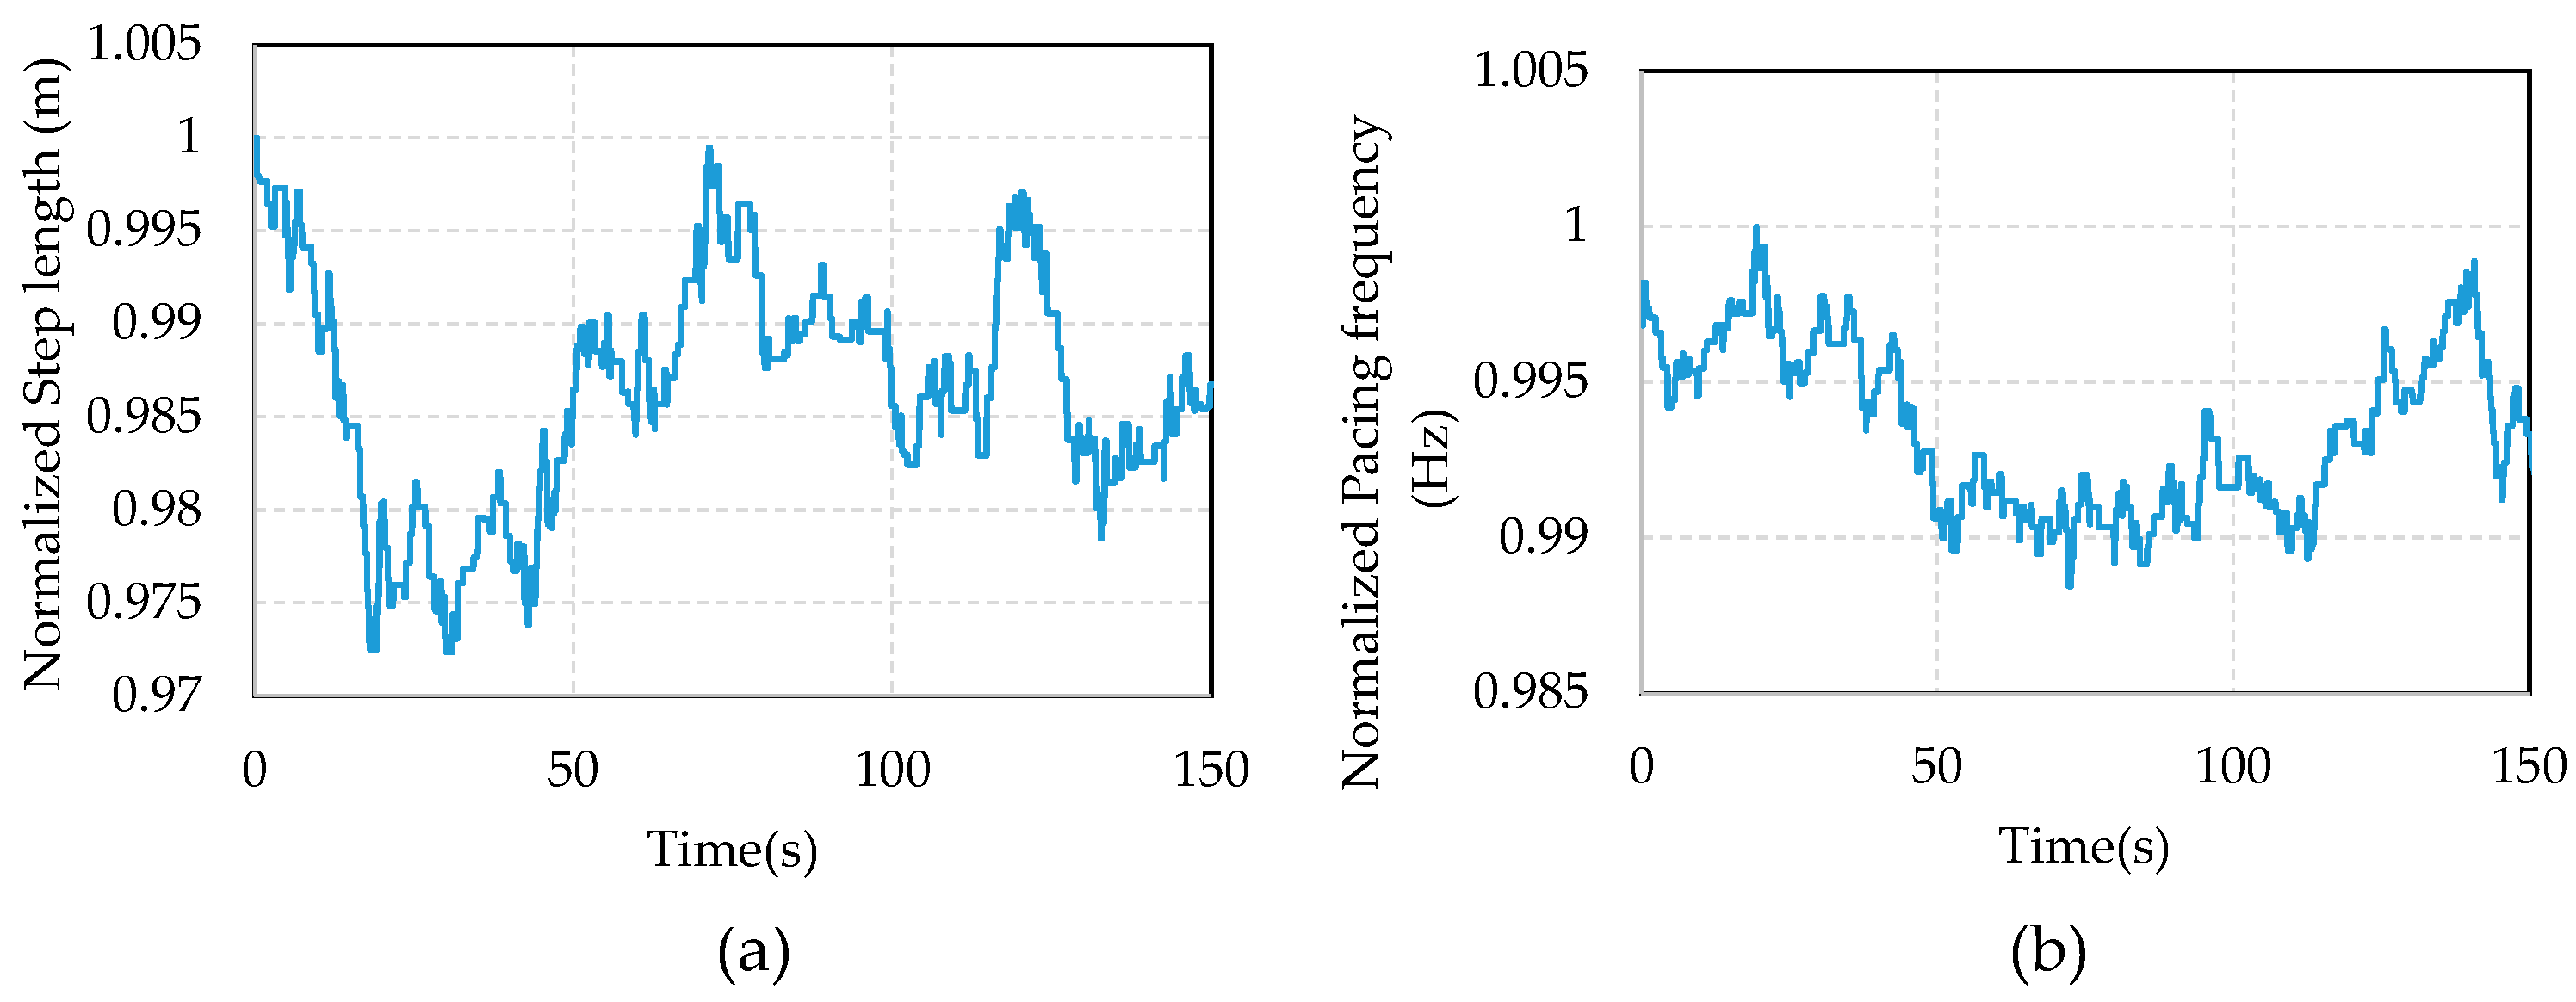
Moreover, the RW is only applied in the pacing frequency and step length parameters. The phase angles and DLFs are not included because, according to preliminary tests, the effects of their variations over time are negligible.
Figure 1 shows an example of step length and pacing frequency series generated from the proposed RW method.
4. Dynamic Equations of the Coupled Human-Structure-TMD System
In this section, the dynamic equations of a single degree of Freedom (DoF) system representative of the vibration modes of the structure, a structure-TMD coupled system, and a pedestrian-structure-TMD coupled system are presented. These dynamic arrangements are illustrated in
Figure 2, assuming vertical direction vibrations. In the case study section, only the vertical vibrations are of interest, and the system equations will be solved aiming to obtain the TMD efficiency considering scenarios with inter- and intra-subject variabilities.
Firstly, a usual single DoF equation is presented for clarity. This system represents one of the vibration modes of the uncontrolled structure and it is denoted here as the “primary system” with sub-index
s. The dynamic equation that governs the motion of a single DoF mass-spring-damper primary system is a well know expression, given by:
In Equation (15),
,
, and
are the primary system displacement, velocity, and acceleration for the
i-th mode of vibration, respectively;
is the modal force,
is the coordinate in which the excitation force is applied within the mode shape
;
,
, and
are the primary system modal mass, damping coefficient, and stiffness, respectively, as indicated in
Figure 2a.
The footbridge used as case study in this work has a dynamic response governed by just one mode. Therefore, it can be solved in an efficient manner like a single DoF system, once the modal shape is provided.
Now, suppose the installation of a TMD at a coordinate
, with a mass
, damping coefficient
and a stiffness
. The TMD incorporates an additional DoF to the problem, as illustrated in
Figure 2b. Considering the
i-th mode, the equations for a two-DoF system with a TMD can be written as:
where,
The addition of
n pedestrians as biodynamic models will add other DoFs to the problem, as illustrated in
Figure 2c. For better clarity, the system of equations with one additional pedestrian for the
i-th mode of vibration is:
An analogous process can be performed to obtain the equations for the system with more pedestrians. This process is not shown here for conciseness.
5. Case Study
A case study is proposed to verify the relevance in considering the inter- and intra-subject variabilities in the TMD efficiency assessment. The structure analyzed is a built footbridge, located in Rio de Janeiro. Pedestrians usually complain about excessive vibrations when walking across the analyzed footbridge. An experimental campaign was carried out on the footbridge in order to identify the vibration modes and it confirmed the pedestrian complains [
25], resulting in the first vertical vibration mode within the range of maximum risk of resonance according to the Sétra guidelines [
28].
A 3D finite element model (FEM) was updated based on the free vibration experimental tests. This refined 3D model was further simplified into a plane equivalent beam model [
25]. All the analyses presented in this case study are performed on the equivalent beam model of the structure.
No TMD was installed in the built footbridge. However, in this case study it is proposed that a TMD should be installed in the mid-span of the footbridge as a solution for the vibration problems. The TMD efficiency will be assessed for many load cases, progressively increasing the number of pedestrians.
5.1. Structure and Numerical Model Description
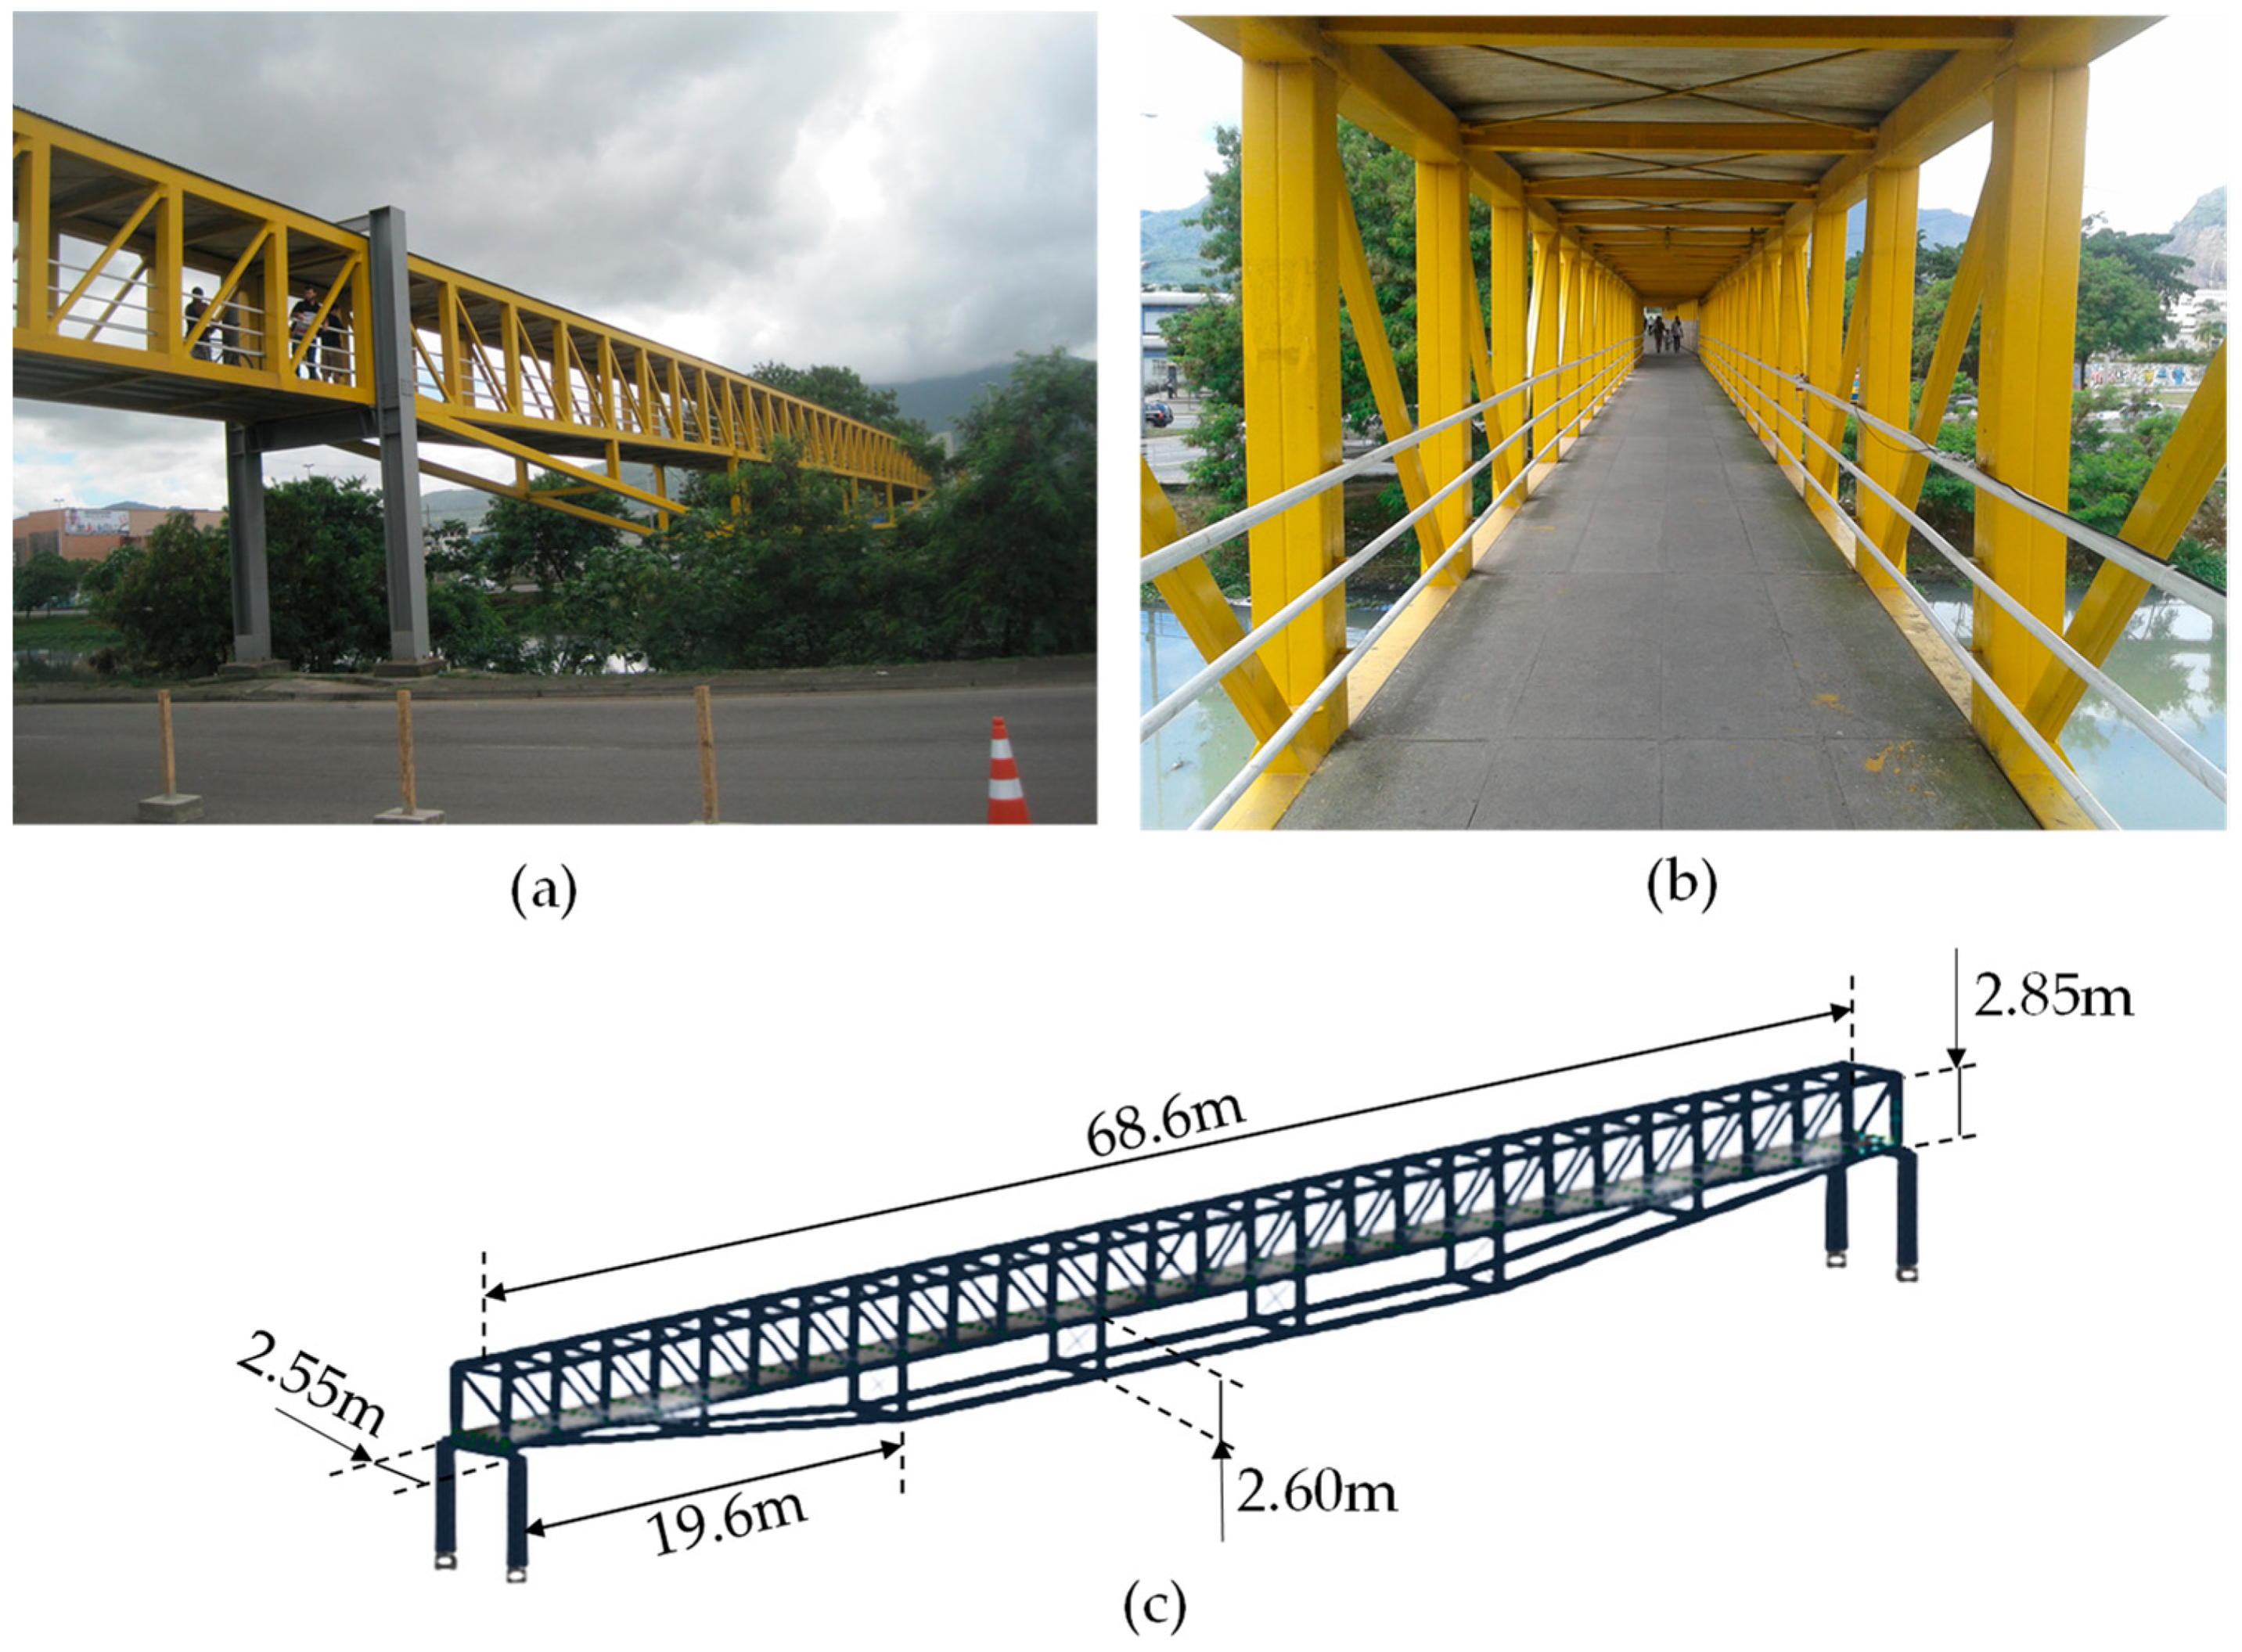
The structure is an inverted-queen-post-truss footbridge with a span of 68.6 m. All the main structural elements of type beams and columns are from steel profiles. Only the slab is made of precast concrete.
Figure 3a,b presents some photos of the footbridge.
Free vibration tests were carried out in the referred structure [
25]. The resulted spectrum in the vertical direction highlighted the frequencies of 1.85 Hz and 4.20 Hz for the first and second modes of vibration, respectively. The mode with frequency of 1.85 Hz is the most excited and it is within the range of maximum risk of resonance for footbridges according to Sétra [
28], confirming the tendency of the structure in presenting excessive vibrations. The damping ratio of the first mode of vibration was evaluated by logarithm decrement of the filtered free vibration tests signals, obtaining the value of 0.23%. The structural damping may vary according to the environmental conditions during the tests [
37,
38]. However, the tests were performed in steady environmental conditions where drastic variations on structural damping are not expected. Despite this, the value of 0.23% is within the typical range of steel footbridges [
39,
40].
The numerical model shown in
Figure 3c was updated based on the experimental results. The first vertical bending mode parameters were identified in the 3D FEM numerical model, presenting the first vertical bending mode frequency and modal mass of 1.87 Hz and 39490 kg, respectively. The vibration modal shapes
were extracted from the 3D FEM and used in an equivalent beam model to represent the vertical response of the structure. Details of the methodology are presented in [
25]. In the present case study, the analyses of the TMD assessment are performed in the equivalent beam model of the structure. Moreover, only the first vertical bending mode is relevant in the total structural response. The use of a simplified model that describes the vertical behavior of the footbridge is convenient for reducing computational costs and for allowing the simulation of more load cases. Using a simplified model is especially useful for the probabilistic analyses, which require several runs to reach convergence.
5.2. TMD Design Parameters
Some authors address the optimal TMD design. As previously stated in the introduction, Den Hartog [
2] introduced the first expressions of the optimal TMD. Many optimal TMD formulations were further developed. However, in this work, none of these theoretical formulations are used.
Instead, a typical TMD is designed with the selected parameters of mass, damping, and frequency based on the authors’ practical experience. These parameters are not optimal values, but they have been proven to result in an excellent structural acceleration reduction [
9,
14]. Moreover, this paper does not aim to propose or to prove an optimal formulation or parameter selection, but it focuses on verifying the influence of the walking variability on the TMD efficiency.
Generally, the three parameters that must be selected for a TMD design are the damping, the frequency ratio, and the mass ratio. The higher the damping, the lesser the efficiency of the TMD, due to the loss of kinetic energy. In this work, the TMD is assumed to have a damping ratio of 5%. In this case, a damping ratio of 5% is related to a damping coefficient of .
The frequency ratio is the relation between the TMD natural frequency and the structure’s natural frequency. This parameter plays an important role in tuning the TMD, because it will determine the excitation mode that will be damped. A detuning of the frequency ratio drastically decreases the TMD efficiency because a passive system is not self-adjustable. Ideally, the frequency ratio should be 100%, i.e., with the TMD frequency being equal to the structural natural frequency of interest. However, in this case, the TMD would be extremely sensitive to any structural modifications in stiffness or mass that are common over the lifetime of a structure. For this reason, a frequency ratio of 97% is adopted.
The mass ratio is the relation between the TMD mass and the modal mass of the vibration mode of interest of the structure. A higher TMD mass indicates higher inertial forces, and, hence, a gain in the vibration reduction capacity. However, a heavy TMD may be unfeasible in some situations. Moreover, the reduction in vibration amplitudes of the structure does not increase at the same rate as the mass ratio increases. Thus, there is an optimal value for the mass ratio, which balances vibration reduction and the mass of the TMD. In this paper, the mass ratio is assumed to be 1%.
Another issue of the TMD design is its location. The installed TMD needs to be in a position with relevant amplitudes of vibration. For instance, if the modal shape is zero in a certain coordinate (such as at the extremity, the supports, or at the mid-span), the installation of a TMD in this position would not result in any effect in the vibration reduction. Ideally, the TMD must be located in the maximum amplitude of the modal shape. The structure analyzed in this case study has a vibration response governed by the first vertical bending mode similar to a simply supported beam, which is maximized at the mid-span. Therefore, the TMD is designed to be installed at the mid-span as well.
Table 2 presents the TMD design parameters along with the first vertical bending mode.
5.3. TMD Efficiency Assessment
In this section, the TMD efficiency assessment results will be presented for the walking models selected in several loading cases. The loading models selected for the study are the FM and the two BMs described in
Section 2 The loading cases are scenarios where the pedestrian numbers continuously increased from 1 to 80.
The TMD efficiency is understood here as the percentage difference between the amplitudes of response of the uncontrolled (without TMD) and the controlled structure (with TMD) in terms of displacement, acceleration, or velocity. For this purpose, maximum, minimum, mean, and root mean square (RMS) values can be used in the TMD efficiency assessment. In the present paper, the TMD efficiency will be evaluated by the difference between the maximum acceleration RMS of the uncontrolled and the controlled structure, as indicated:
In Equation (18), is the TMD efficiency, is the maximum RMS acceleration of the uncontrolled structure and is the maximum RMS acceleration of the controlled structure.
Initially, the TMD efficiency will be studied applying only the intra-subject variability during walking. Then, the analyses are run again, considering the combined intra- and inter-subject variabilities. This process aims to investigate which variable is the most important in the TMD efficiency.
In the probabilistic approaches, every analysis is different from the subsequent, as different samples of walking parameters are generated by the intra- and inter-subject distributions. Thus, several runs are required in order to achieve a stability in the response for the general assessment of the TMD efficiency combined with these probabilistic approaches.
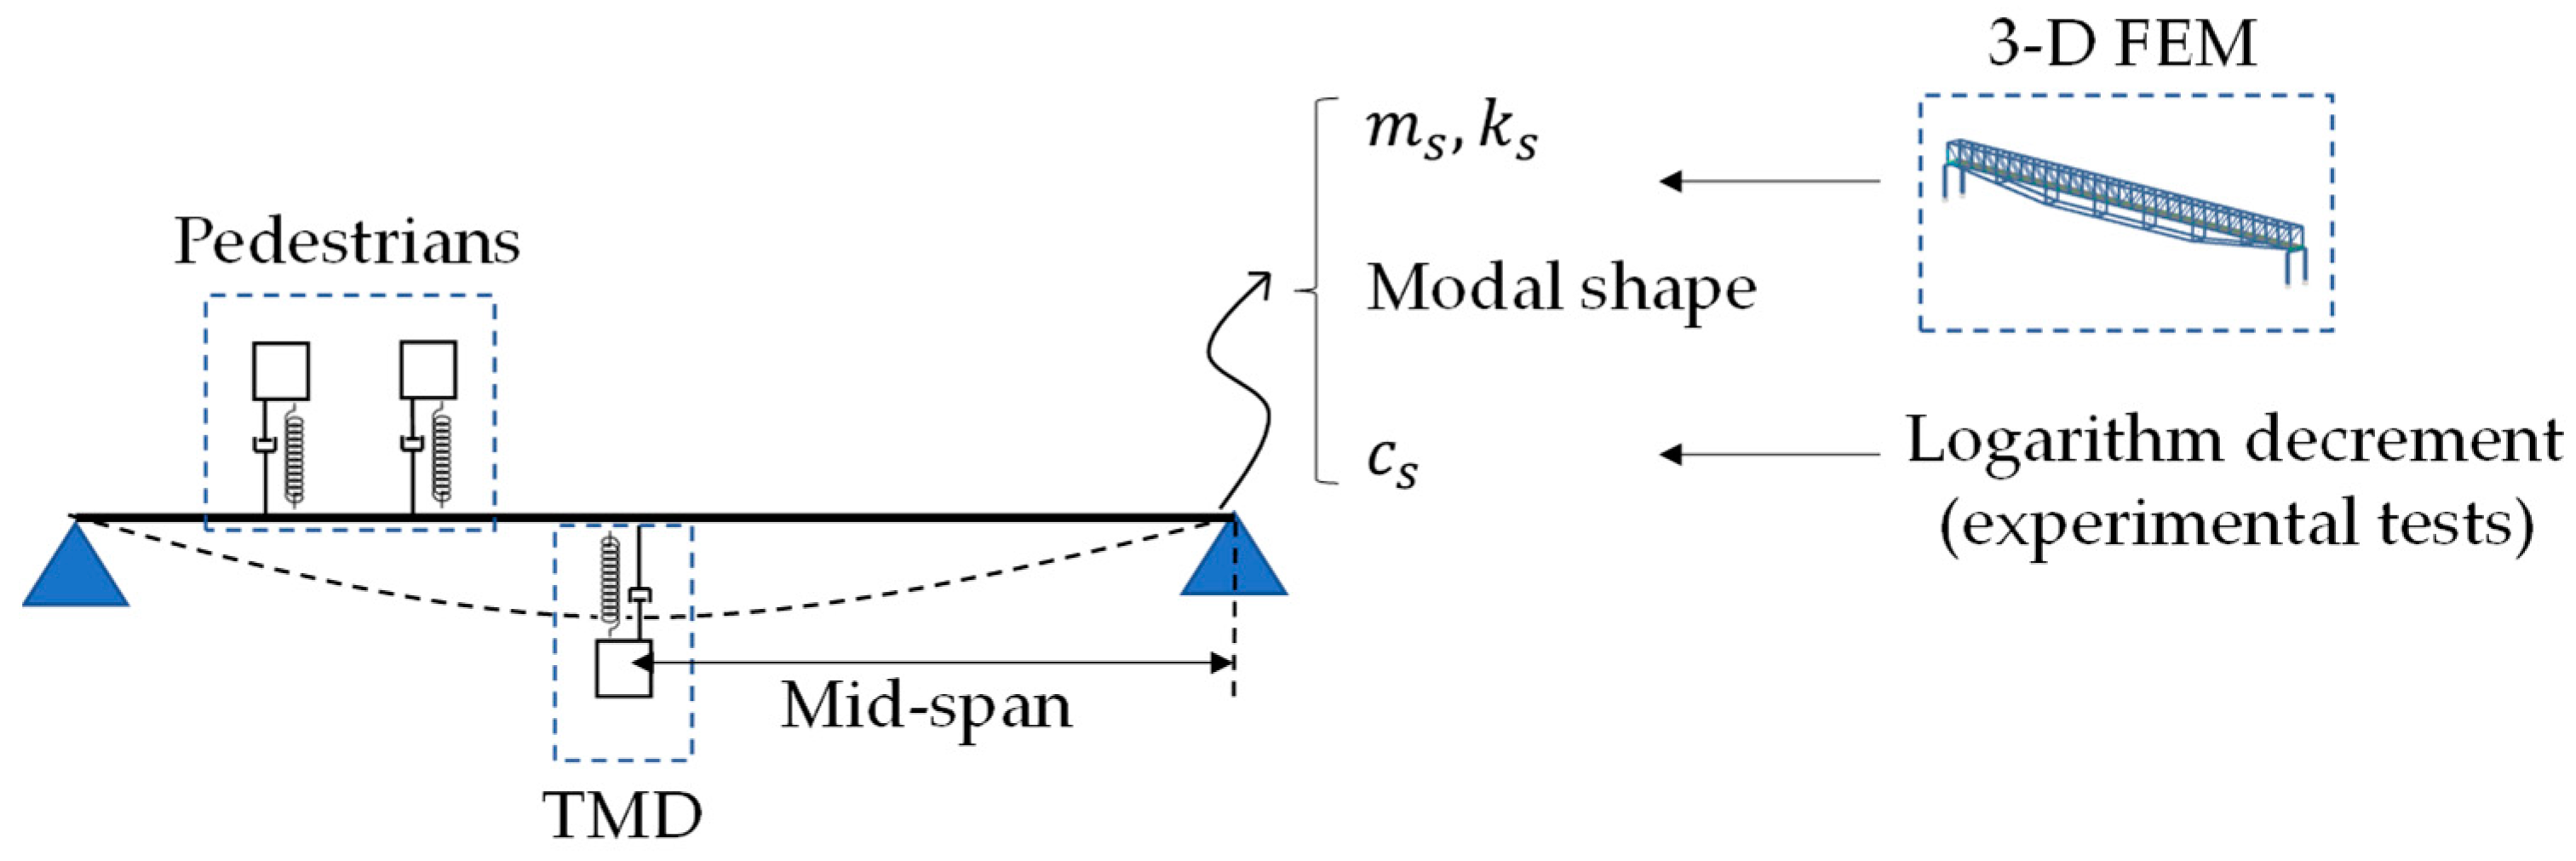
As previously stated, all the analyses are performed in a plane model that describes the vertical directional behavior of the built structure. The total response of the footbridge is governed almost entirely by the first vertical bending mode. Therefore, using mode superposition assumption, a plane model is achieved by importing the modal shape of the most energetic vibration mode of the updated 3D FEM, as per [
25]. The dynamic properties of mass and stiffness (
,
) are imported from the 3D FEM as well. Only the structural damping
is obtained by means of the logarithm decrement technique applied on the experimental test results.
Figure 4 presents a schematic overview of the plane beam model.
5.3.1. Load Cases
The list of basic load cases of the analysis comprehends 80 scenarios. Each scenario is defined by pedestrians, varying from 1 to 80 people walking in a unique row along the footbridge span. Initially, the pedestrians are spaced by 0.5 m when entering the footbridge, but this distance changes according to the inter- and intra-subject pacing variabilities.
The maximum number of
pedestrians was chosen because the structure is a class III footbridge according to the criteria from Sétra [
28]. A class III footbridge corresponds to a crowd load of 0.5 pedestrians/m². In this case, evaluating the area of the walking platform and multiplying by the pedestrian density, the crowd load for the referred footbridge is a total of 79 pedestrians. Therefore, assuming
aims to cover the entire range of loading scenarios across the footbridge.
The 80 load cases are applied to the structure in each one of the three different walking models. To simplify the notation, the force model is denoted by the initials FM, the biodynamic model from Silva et al. [
18,
29] is identified by BM1, and the biodynamic model from Costa [
30] and Varela et al. [
19] by BM2.
The probabilistic analysis is performed by simulating the intra-subject variability and the combined intra- plus inter-subject variabilities separately for each pedestrian scenario (load case vs. walking model) and comparing their results with the results of the deterministic analyses (Det.). Moreover, each probabilistic analysis requires a minimum number of simulations to achieve convergence. The analysis considering only the intra-subject variability is described in
Section 5.3.2,
Section 5.3.3 and
Section 5.3.4. In these sections, 100 simulations were sufficient for each scenario to reach an acceptable convergence. The analysis considering both intra- and inter-subject variabilities is described in
Section 5.3.5 A higher uncertainty requires additional simulations to converge. Therefore, 800 simulations were performed in these cases.
Finally, all the scenarios are simulated for the uncontrolled and the controlled structure for a proper efficiency assessment of the TMD control system.
Table 3 presents a summary of the load cases and the number of simulations.
5.3.2. TMD Efficiency with Intra-Subject Variability
Firstly, the TMD efficiency is assessed only with the intra-subject variability. In other words, in these simulations all the pedestrians enter the footbridge with a given walking frequency/step length, specified as 1.85 Hz/0.71 m, to guarantee a response close to the resonance. However, the walking frequency and the step length are slightly modified along the footbridge crossing, following the RW patterns such as the examples illustrated in
Figure 1.
In this section, two responses are compared. The first one (“Det.”) is the simple deterministic acceleration response, without RW. The second one (“RW-intra”) is the acceleration responses considering RW with intra-subject variability.
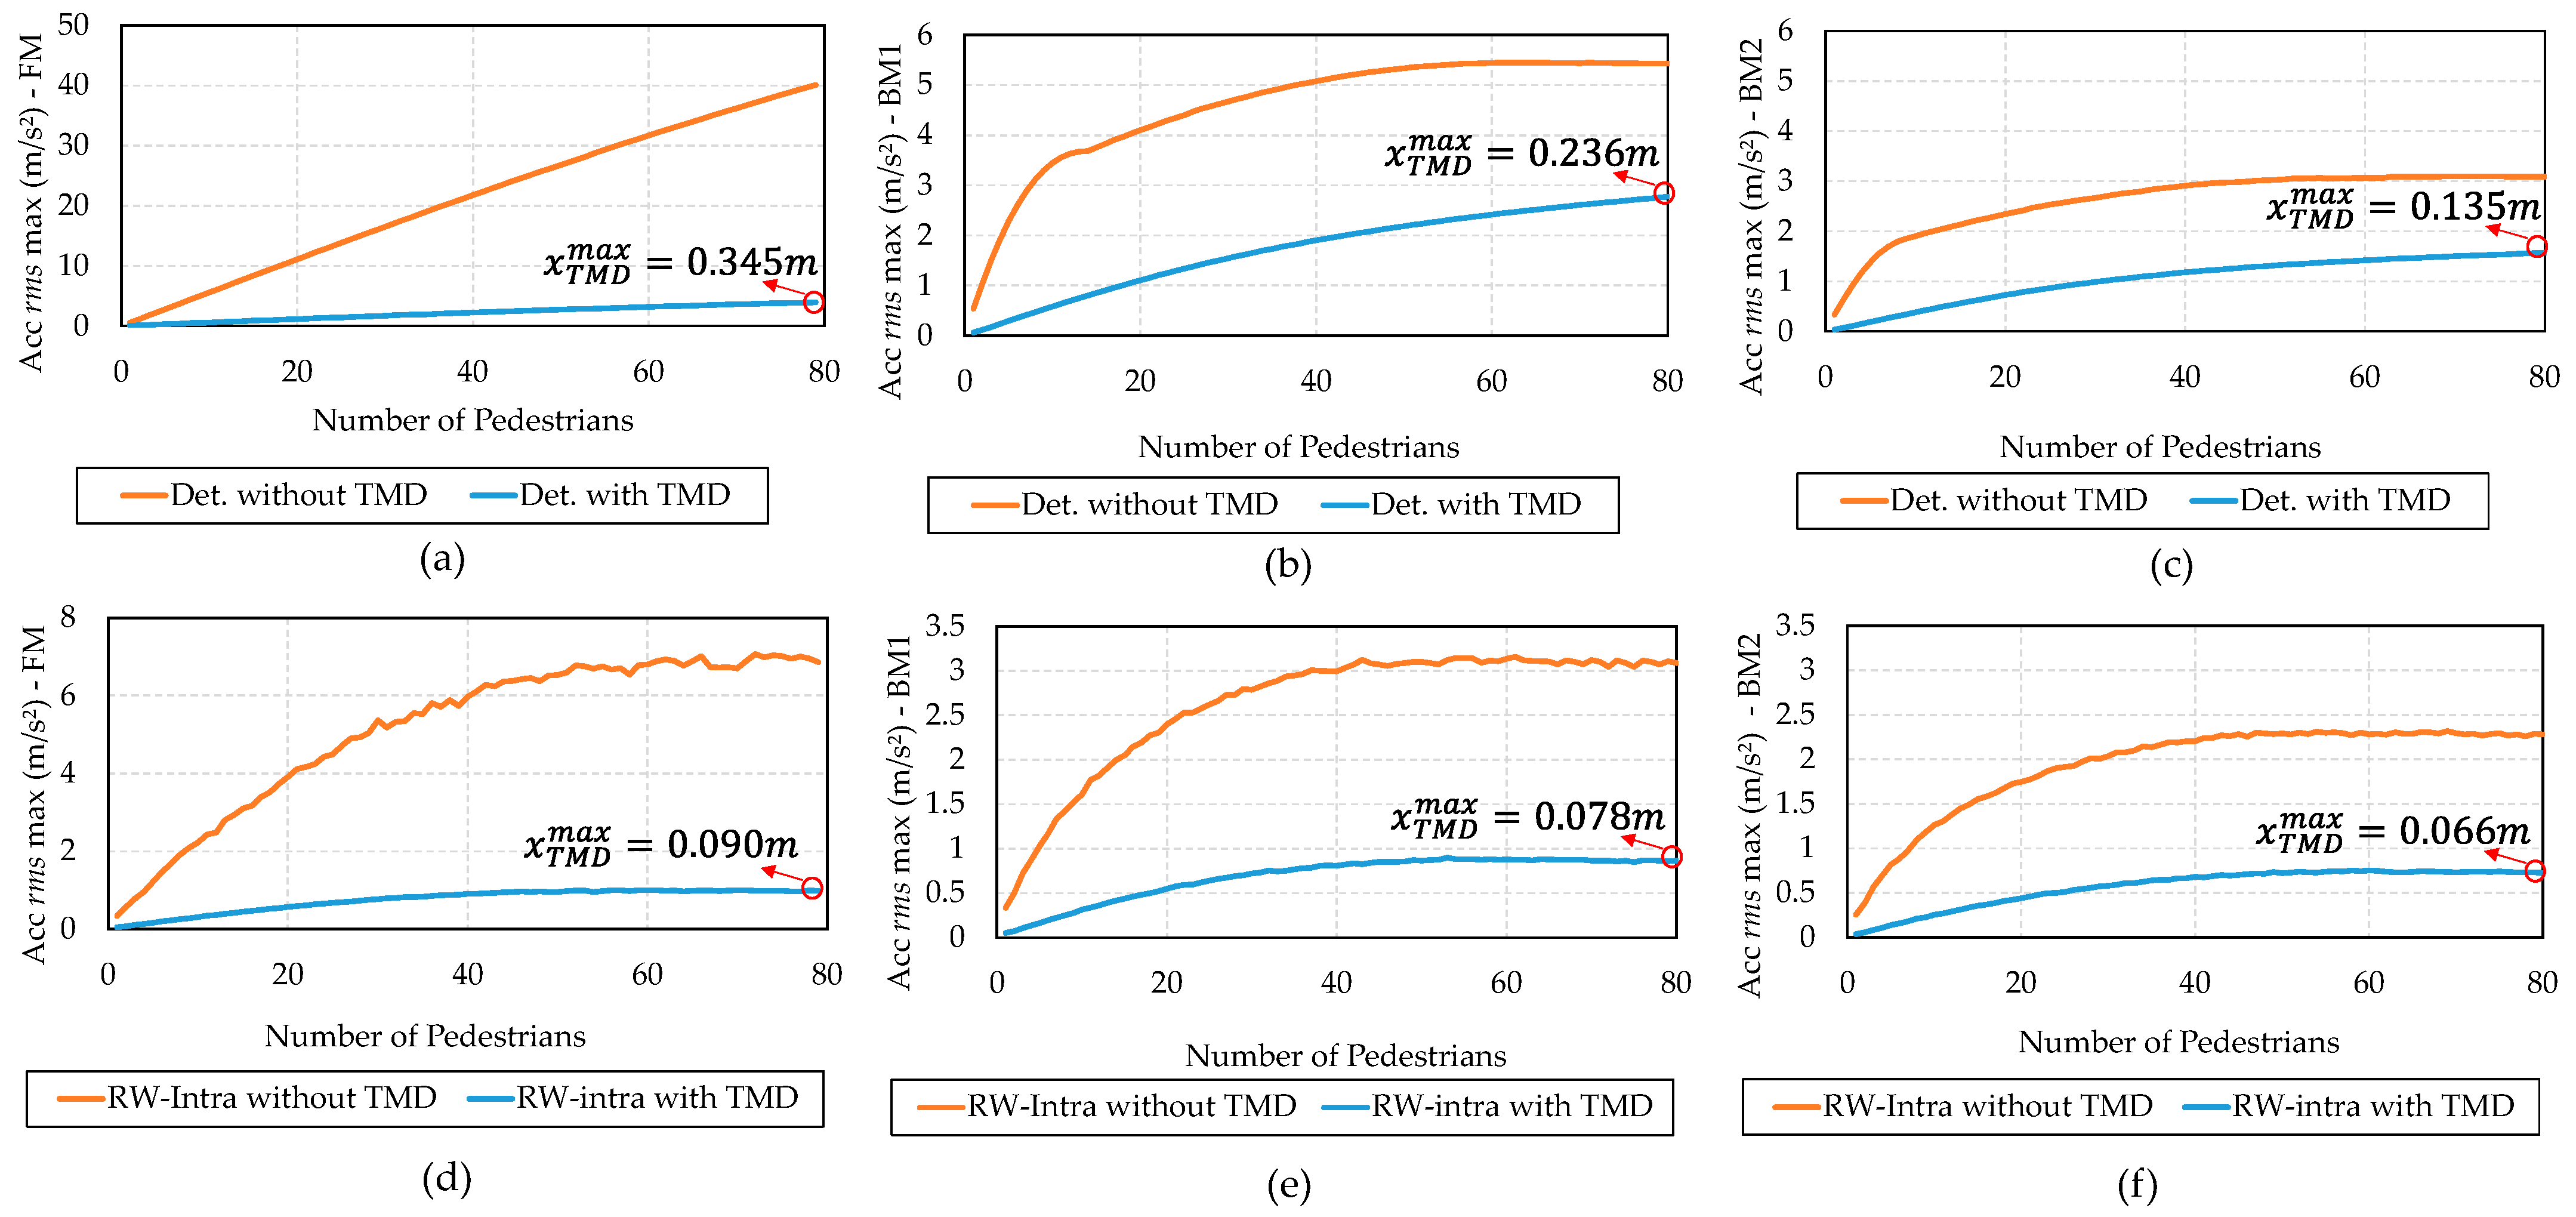
The acceleration amplitudes obtained in all the 48,480 simulations are shown in
Figure 5 Additionally, the maximum displacement of the TMD in the scenario with 80 pedestrians is presented, denoted as
. The extremely high acceleration values in the deterministic signal without TMD can be noted from
Figure 5a. These accelerations of 30–40 m/s² are far higher from would be expected in a real structure. In fact, any real structure under these accelerations levels would probably fail or collapse. These acceleration values were obtained assuming an extreme condition that all the pedestrians are resonant with the footbridge during the whole simulation. Therefore, the results from
Figure 5a are expected under these analysis conditions and can be considered valid only in the scope of a theoretical approach. The results from
Figure 5a highlight the limitation of the FM in simulating crowds, leading to non-representative results. Even the standards [
28] that proposes the FM for describing the behavior of a pedestrian recommends a specific formulation for crowds. Considering this, the values of accelerations and TMD displacements obtained in
Figure 5a are unreal, because the pure FM does not consider the human–structure interaction and is not suitable for crowd simulations where the coupling effects are relevant.
However, the present paper is concerned with the TMD efficiency, and for this purpose the difference between the controlled and the uncontrolled structural response is depended upon (Equation (18)). In this vein, the results for the deterministic model from
Figure 5a, despite being physically non-representative, can be applied for this assessment.
The acceleration amplitudes obtained by the BM are considerably lower than those obtained by the FM. This can be observed by comparing
Figure 5a–c. BM2 had the lowest amplitudes of the walking models.
The effect of the RW in detuning the pedestrians from resonance is remarkable. This effect can be observed by the acceleration reduction comparing
Figure 5a,d. The RW-intra also detuned the pedestrians of the BM1 and BM2, reducing the accelerations amplitudes.
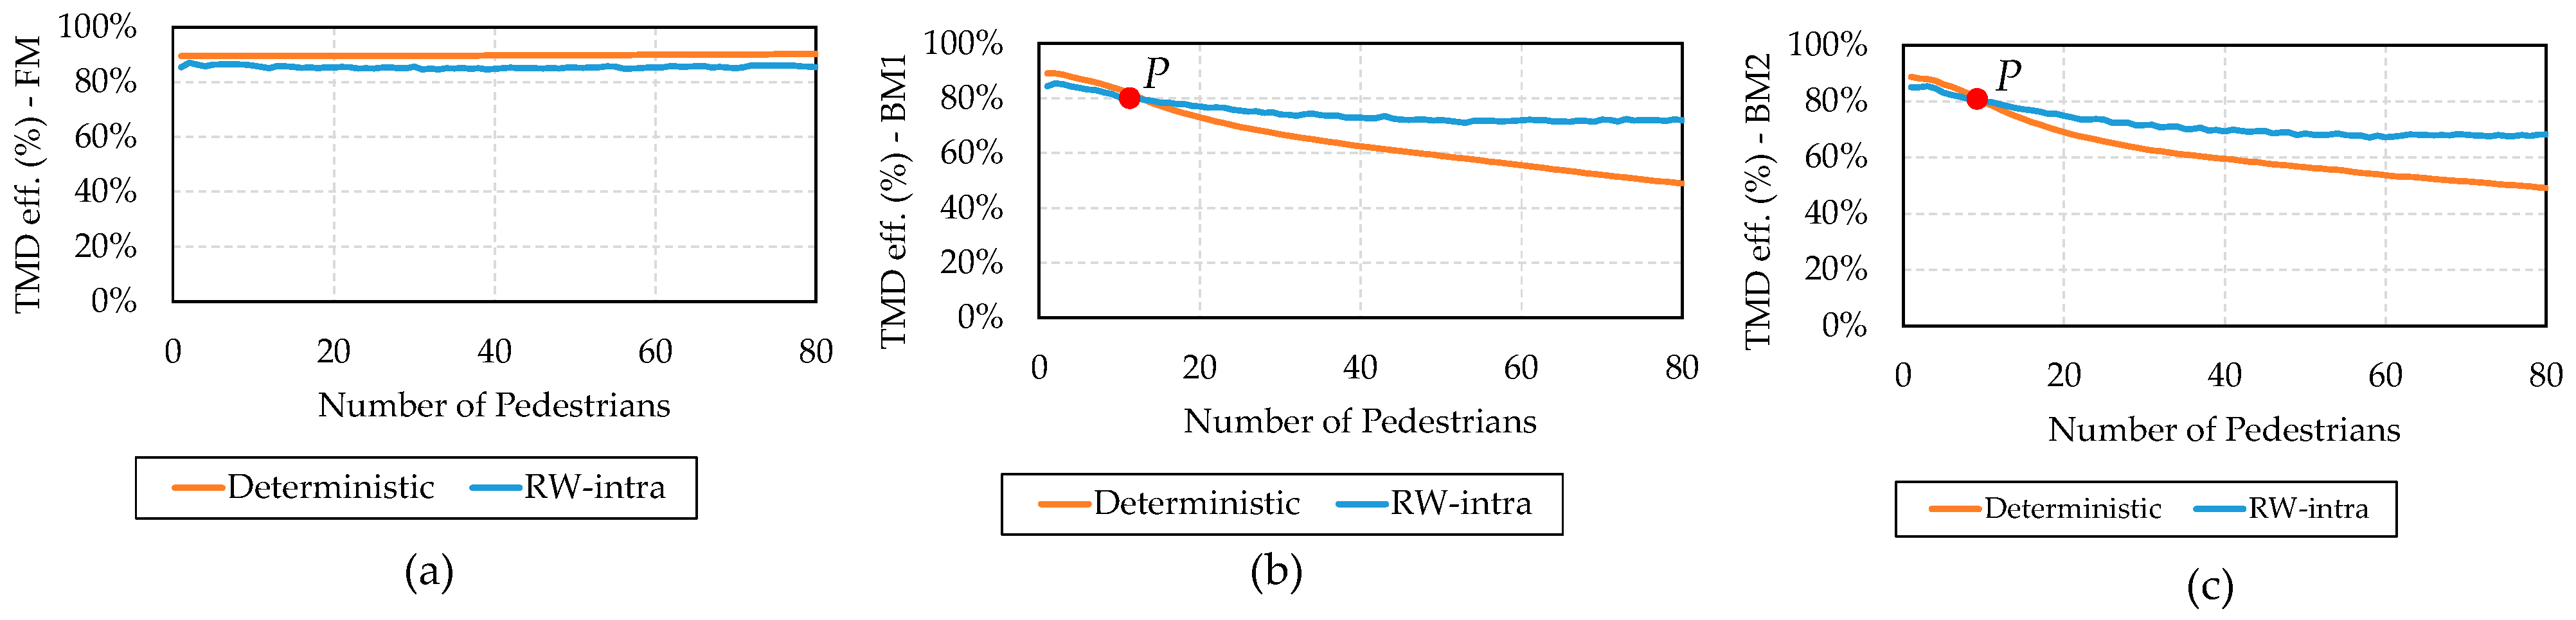
Figure 6 presents the TMD efficiency in reducing the maximum RMS acceleration for the deterministic and RW-intra responses. The TMD efficiency in reducing accelerations with the FM (
Figure 6a) remains constant despite the value of
. Additionally, the TMD efficiency of the RW-intra response is 5% lower than that of the deterministic response. Despite being a small difference, this statement shows that considering the RW-intra is important for the TMD efficiency assessment.
The TMD efficiency differences are more remarkable in the BM models. For few pedestrians, the RW-intra responses presented a lower TMD efficiency. After a certain point
P, highlighted in
Figure 6b,c, the deterministic TMD efficiency became lower than the RW-intra TMD efficiency. It is important to note that the BM formulations consider the pedestrian dynamic properties in the analysis, increasing the overall system damping, stiffness, and mass. Therefore, the higher the number of pedestrians of the BM, the more detuned the TMD becomes. As a consequence, the TMD efficiency is lowered according to the increased number of pedestrians in
Figure 6b,c.
The point
P of the crossing curves at
Figure 6b,c is located at approximately 17 and 12 pedestrians. This means that, for more usual occupation scenarios of the footbridge, with a sparse density of pedestrians, the use of the RW-intra is more conservative than the deterministic when comparing the TMD efficiency. In contrast, the use of a deterministic analysis is more conservative in terms of TMD efficiency for higher pedestrians densities. It is important to note that this is valid for the conditions simulated specifically in this analysis.
Considering this, it is possible to imagine that the point
P and the TMD efficiency decrease depends on the TMD parameters (from
Table 2) and/or on the RW-intra parameters (from
Section 3.2).
Section 5.3.3 and
Section 5.3.4 will address these topics.
5.3.3. Sensitivity of the TMD Parameters
In the previous section, a TMD detuning was observed due to the RW-intra when compared to the deterministic analysis. A sensitivity analysis of the TMD design parameters is proposed to assess their influence on the TMD efficiency.
The TMD parameters from
Section 5.2 were selected based on the practical experience of the authors. However, these parameters may vary according to the design preference, requirements, or even if the designer is following another optimal parameters rule. The TMD efficiency is very sensitive to its tuning with the excited vibration mode. For this reason, different TMD parameters may change the efficiency considerably.
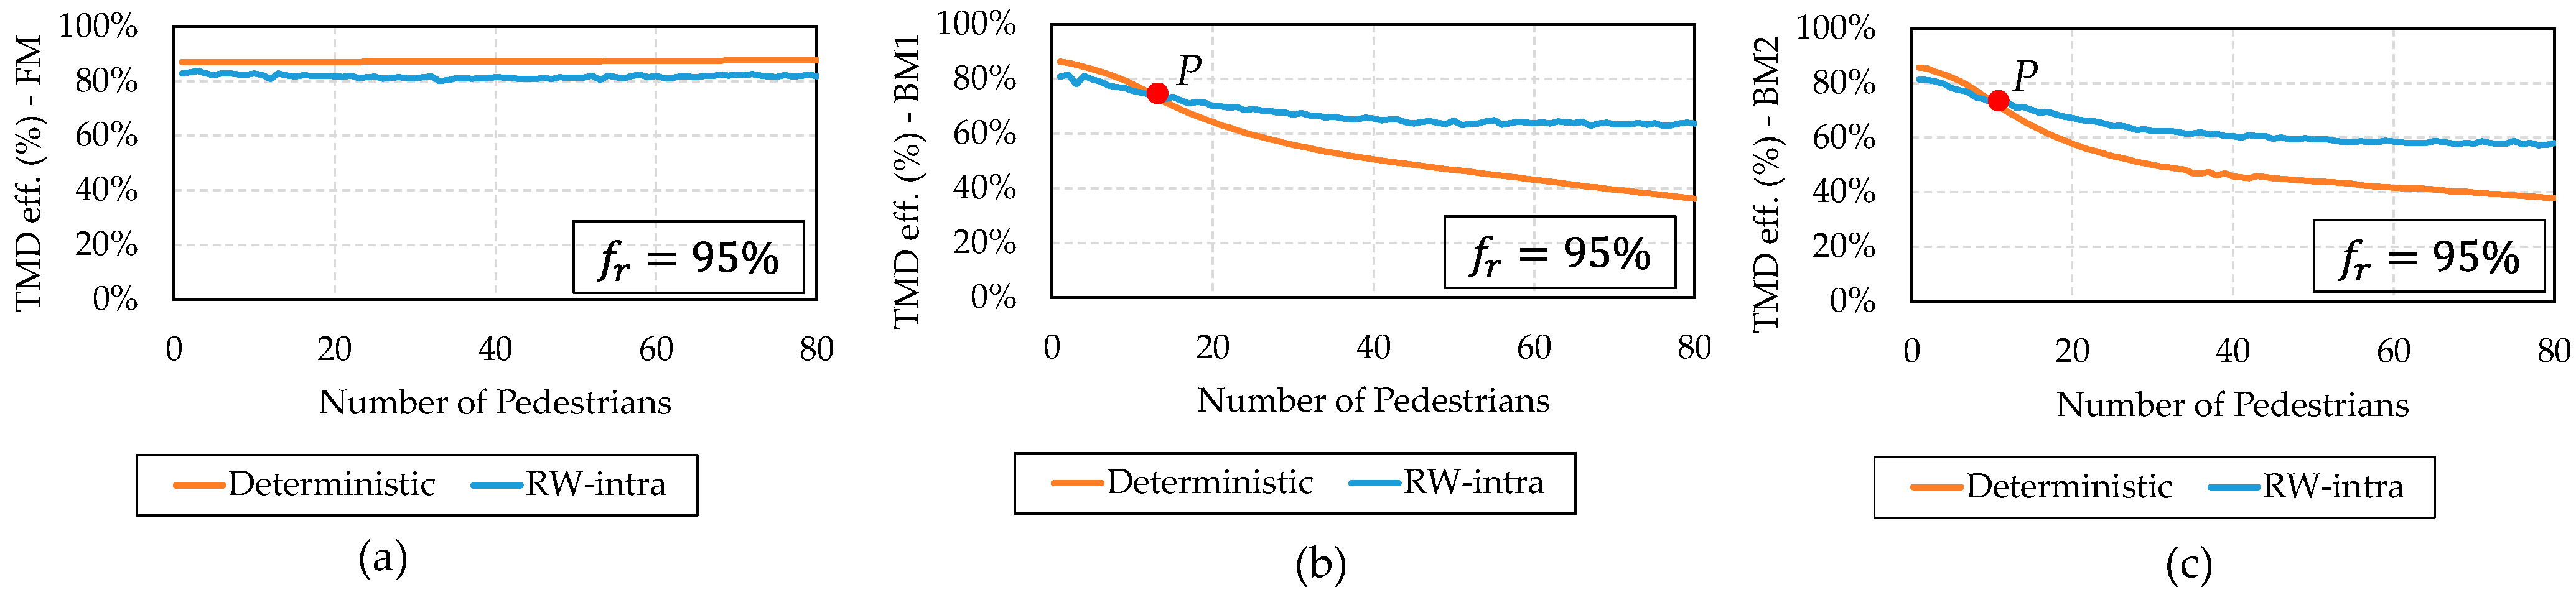
In this section, a frequency ratio
of 95% is adopted, instead of the 97% assumed in
Table 2. This sensitivity scenario intends to simulate a hypothetical situation of a slightly structural modification, or an adapted/modified TMD. The results obtained are presented in
Figure 7. Comparing
Figure 6 and
Figure 7, the main observation is an overall reduction in the TMD efficiency for all the three walking models. The response pattern for the FM and the two BMs are the same from
Figure 6. This highlights that the TMD frequency ratio of 95% increased the detuning with the most excited vibration mode for all the three models.
5.3.4. Sensitivity on the Intra-Subject Variability
In this section, an additional sensitivity analysis is performed by changing the RW-intra transition law parameters. The TMD parameters are the same as those from
Section 5.3.3, i.e.,
.
In
Section 3.2, the transition law was set as a Gaussian distribution with mean
and a
. These values are responsible for the walking variability during the footbridge crossing and they were chosen aiming a realistic human walking signal, such as the ones illustrated in
Figure 1. Additionally, the
and
values conducted showed a good correlation between a one pedestrian simulation and the induced vibration experimental signals from [
25], as previously stated in
Section 3.2.
However, the transition law parameters may assume different values according to each pedestrian. The walking variation may be more intense in some pedestrians than in others. In this regard, a value of could be inappropriate in a situation where there is a higher level of uncertainty surrounding the pedestrian walking parameters. As previously stated, proper values for the parameters of the intra-variability uncertainty could be somewhat experimentally determined, but this is not the scope of the present work.
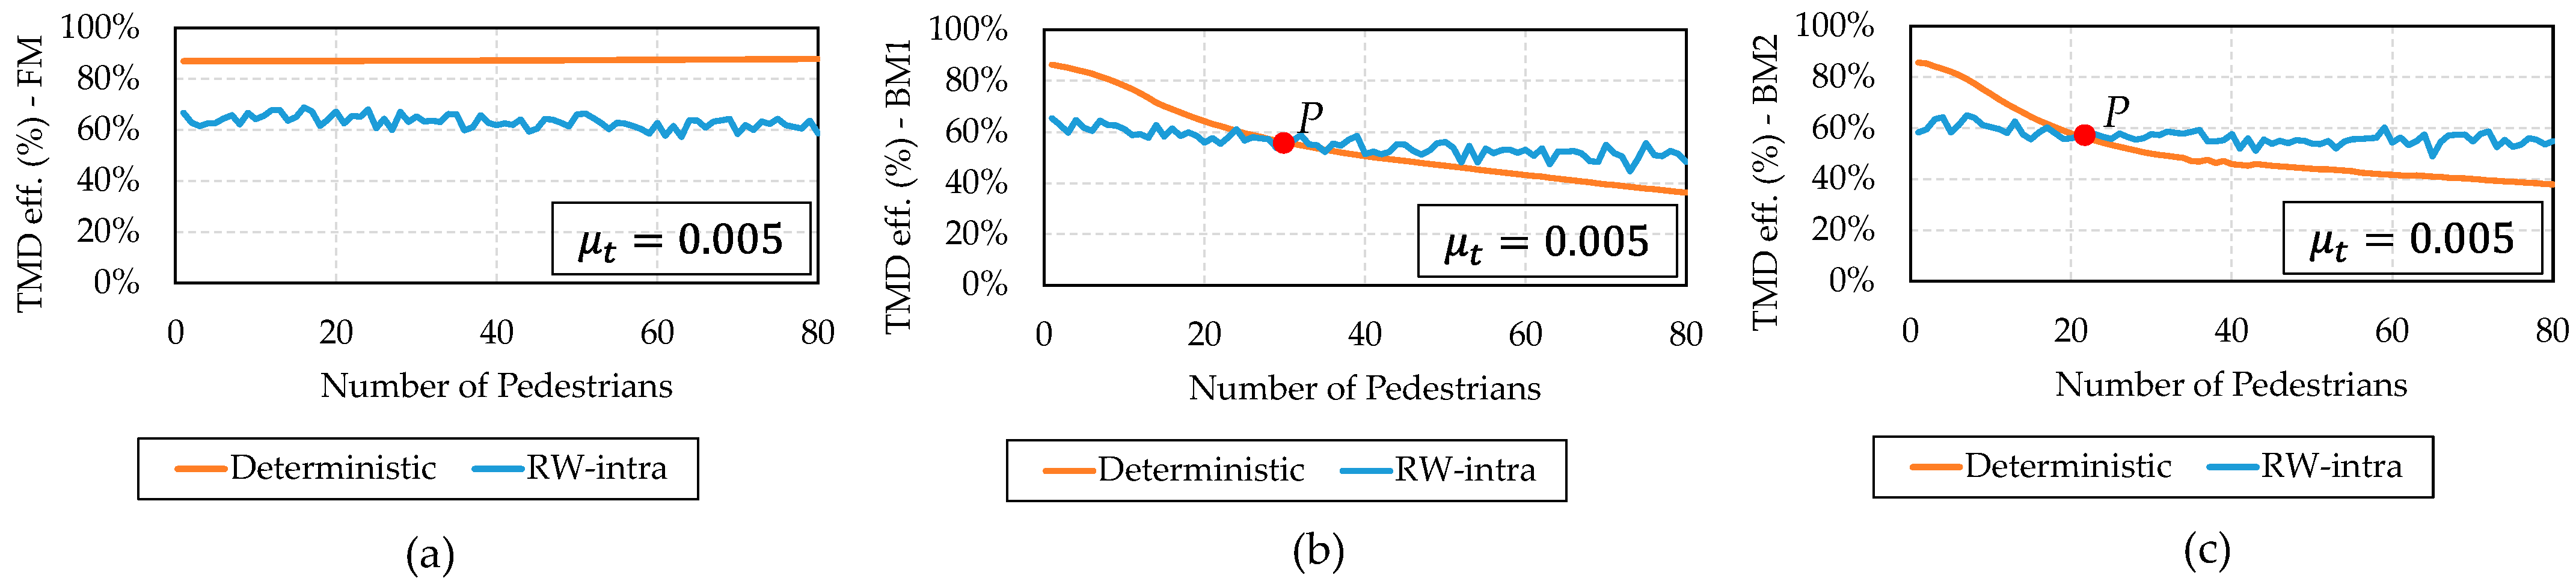
In the present sensitivity analysis, the RW-intra transition is modified to
and
for observing the difference in the TMD efficiency. This consists of a scenario with higher walking parameter uncertainty, with the pedestrians changing pace more drastically. The results are presented in
Figure 8.
Comparing
Figure 7 and
Figure 8, there is a considerable decrease in the TMD efficiency. This is expected because the value of
increased. Therefore, the RW transitions increased as well, and the TMD became more detuned with the excitation walking force.
Comparing the FM response, the TMD efficiency reduction changed from 5% in
Figure 7a to more than 15% in
Figure 8a. For the BM models, the pattern is the same as presented in
Figure 7: the RW-intra starts with a lower TMD efficiency for a small number of pedestrians, and the deterministic TMD efficiency become lower from a point
P, after some number of pedestrians walk over the footbridge. However, the point
P location changed considerably from 10 pedestrians in
Figure 7b to almost 30 in
Figure 8b and 20 in
Figure 8c.
The RW-intra curves from
Figure 8 also presented more instability than
Figure 6 and
Figure 7. This is justified by the increasing uncertainty that was added on the probabilistic simulations by changing the Gaussian distribution of the transition law.
5.3.5. The TMD Efficiency with Combined Intra- and Inter-Subject Variability
The analyses presented previously the comparison of the results of several load cases of human walking over footbridges using deterministic analyses with the intra-subject variability load cases. The results allow the evaluation of the influence of the intra-subject variability in the response of the uncontrolled and controlled structures. In this section, the inter-subject probabilistic analyses are introduced in the simulations. The analyses are performed with the TMD design parameters specified in
Table 2 and the RW transition law indicated in
Section 3.2.
Instead of a deterministic load case, the results compared herein both utilize probabilistic approaches. The first one is a signal considering only the inter-subject variability (“inter”), i.e., where the pedestrians start the simulations and the parameters are sampled from specified distributions (
Table 1), and these parameters remain unchanged during each simulation. The other scenario includes simulations which combine intra- and inter-subject variabilities (“RW-intra-inter”). In this case, the pedestrians start the simulations with the walking parameters sampled from the probabilistic distributions, but these parameters change during the simulation according to the RW transitions. With these scenarios, the evaluation of the influence of inter-subject variability on the TMD efficiency is expected.
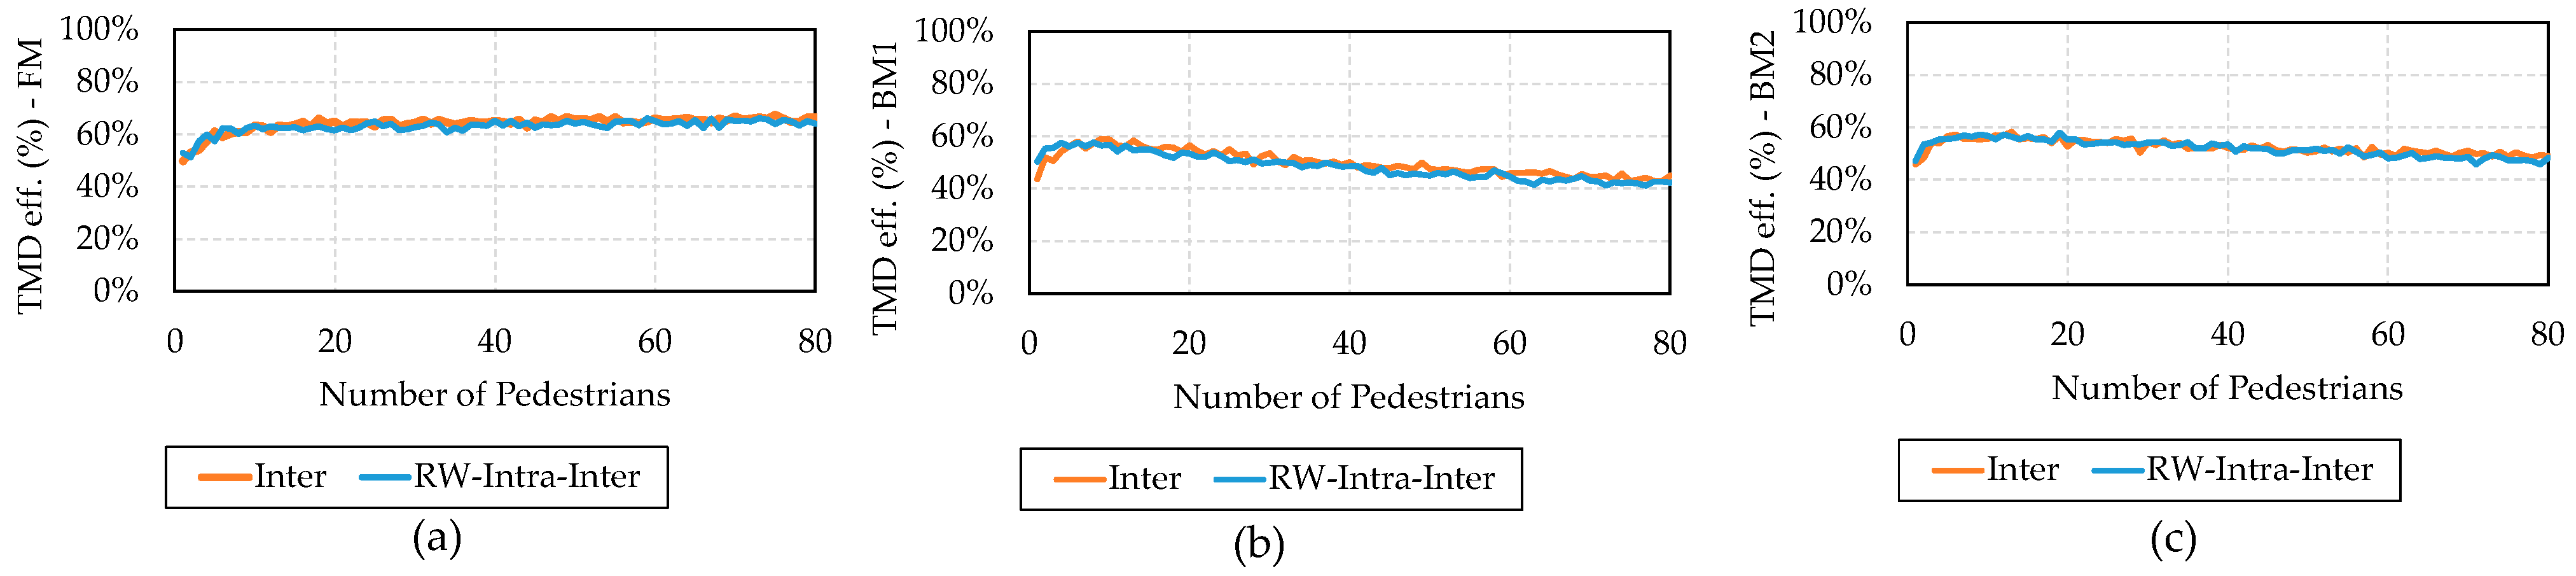
The results of the TMD efficiency are presented in
Figure 9 for all the three walking models. A small difference between the two curves can be noted. The RW-intra-inter curve is positioned just a little bit below the inter-subject curve. However, it can be stated that the scenarios generated similar responses. This is an indication that the inter-subject variability is more relevant in the TMD efficiency assessment with the RW-intra transition law specified. Additionally, the TMD efficiency considering only the inter-subject variability is lower than that considering only the RW-intra response presented in
Figure 6.
Considering the walking models, the TMD efficiency behavior under the FM is different from the BM, and similar to the previous analyses. The TMD efficiency starts with the same pattern in all models, but after the number of pedestrians is increased, the behavior of the response is modified: the FM remaining practically constant and the BMs having a steady decrease, as expected.
6. Conclusions
In this paper, a TMD efficiency assessment is presented in several loading scenarios considering the walking intra- and inter-subject variabilities and three loading models over a footbridge: one force model and two biodynamic models (FM, BM1, and BM2).
As a passive system, the TMD efficiency in reducing structural vibrations tends to be very sensitive to the correct tuning related to the most excited vibrations modes, being influenced by any structural modification. In this way, the TMD efficiency on numerical simulations can be modified depending on the walking model and the number of pedestrians due to the effects of human–structure interactions. Moreover, inherent walking variabilities may contribute to the detuning of the TMD with the structure.
In this work, the inter-subject variability was considered by sampling walking parameters from specific probabilistic distributions presented in the literature [
26,
27]. The intra-subject variability was modelled with a random walk (RW) algorithm. Many scenarios with the three different human walking models (FM, BM1, and BM2), varying from one to eighty pedestrians and with/without walking variabilities, were simulated to observe the influence on the TMD efficiency. As a general conclusion, the inter- and intra-subject variabilities and the BM models modified the pacing and the TMD tuning, confirming the expectations of the study.
Firstly, the intra-subject variability is analyzed separately. Results considering only the intra-subject variability showed a great influence on the TMD efficiency. It was observed that the higher the intra-subject variability, the lesser the TMD efficiency. This is because a higher uncertainty is related to a higher TMD detuning. In the simulations of this paper, scenarios with lesser intra-subject variabilities () generated a slight reduction of 5% in the TMD efficiency, while scenarios with a higher uncertainty () were associated with a TMD efficiency 15–20% lower than the deterministic cases.
Considering the three walking models analyzed, FM had the higher RMS accelerations, followed by BM1 and then BM2. The TMD efficiency using the FM is constant in deterministic scenarios, independent of the number of pedestrians. However, deterministic FM is a simplified simulation that does not consider the effects of the walking variabilities of pedestrians and human–structure interactions, and it is not the best model for a proper TMD assessment.
Results regarding the BM models are sensitive to the selected model (BM1 and BM2), the structural dynamic properties, and the chosen RW transition law. In this paper, the TMD efficiency of the deterministic BM models decreases with the increasing number of pedestrians. In the BM with intra-subject variability (RW-intra), the TMD efficiency is lower than the deterministic one for few pedestrians. After a certain number of pedestrians, the RW-intra results in a higher TMD efficiency than the deterministic one. This number of pedestrians may be influenced by the RW transition law and the TMD parameters, with the potential for different values to be presented in other case studies.
The inter-subject variability has proven to be more influential in the final TMD efficiency assessment than the intra-subject. The minimum TMD efficiency was obtained in the scenario considering the BM1 walking model with the combined intra- and inter-subject variabilities. Therefore, for a more accurate TMD efficiency assessment, the pedestrian dynamic properties should be considered as well as the walking variability.
It is important to highlight that the results presented in this paper show the influence of the BM and the walking variabilities on the TMD efficiency. The TMD efficiency assessment is highly influenced by the TMD parameters, the number of pedestrians, the walking model used in numerical simulations, and the uncertainty level of the walking parameters. Despite confirming the initial hypothesis, the results presented herein should not be necessarily extended to other structural conceptions with different dynamic properties, because they were obtained for a specific case study. However, the methodology presented in this paper can be used in the assessment of TMD efficiency for different case studies.
For the continuity of the research, we intend to obtain more accurate parameters to be used in the RW method, for better modelling the intra-subject variability. This can be done with an extensive parametric study.


 ,
, 


