
Human Response to Vehicle Vibrations and Acoustics during Transient Road Excitations


1
Karlsruhe Institute of Technology, Institute of Vehicle System Technology, 76131 Karlsruhe, Germany
2
Dr. Ing. h.c. F. Porsche AG, 71287 Weissach, Germany
*
Authors to whom correspondence should be addressed.
Vibration 2021, 4(2), 357-368; https://0-doi-org.brum.beds.ac.uk/10.3390/vibration4020023
Submission received: 23 January 2021
/
Revised: 1 April 2021
/
Accepted: 3 April 2021
/
Published: 8 April 2021
(This article belongs to the Special Issue Human Response to Vibration)
Abstract
:Driving over rising and falling edges on roads and pavements, rails, manhole covers, or transverse joints can influence the driving impression regarding the driver’s perception of vibrations and acoustics. To be able to describe this, objective parameters are used to make the subjective ride comfort measurable and scalable. Previous studies have already contributed to the investigation of the subjective perception regarding the interaction of vibrations and acoustics. However, the results were individual. Aimed at improving the quality of objective analysis methods, driving maneuvers were performed in a real vehicle to investigate the interaction of vibrations and acoustics due to transient road excitations. For this purpose, a sound reproduction system was used, which could provide the acoustic environment for the driver to adapt to while driving. With this method, subjective ratings by varying vibrations and acoustics were collected and with reference to objective parameters statistically evaluated. The results showed that both tactile and audible vibrations under transient influences had no significant interactive effects on the driver’s perception.
1. Introduction
In the acoustic and vibration design of vehicles, modifications during the vehicle development process are evaluated according to the predefined NVH (Noise, Vibration, and Harshness) objectives. Subjective evaluations must consider both vibration and acoustic phenomena [1]. Especially in the development of electrically driven vehicles, the aspect of ride comfort is becoming increasingly important, as the typical masking properties of the combustion engine exists no more. Furthermore, road surfaces are constantly being improved, and the input of stochastic and harmonic short-wave excitations into the vehicle are being minimized. Consequently, the demands of the vehicle user on the comfort behavior of the vehicle increase, and individual obstacles such as transverse joints, railway crossings, or manhole covers are perceived more disturbing [2] than before. Therefore, these differences in the vibration behavior of a vehicle can have a significant influence on the subjective perception of ride comfort and thus on the purchase nature of customers. Thus, for vehicle development, it is necessary to know the relationship between objectively quantifiable and measurable comfort parameters and the subjective perception of the vehicle user.
The effect of sound and vibration on subjective perception has been investigated in various studies such as [1,2,3,4,5,6]. In addition, Amman et al. gave in [7] a general research overview of the perception and interaction of vibrations and acoustics. They discuss in particular the scientific studies performed by the Institute of Sound and Vibration Research (ISVR) [8,9] in Southampton (UK), National Institute of Industrial Health in Japan [10], NASA’s Langley Research Center [11,12], Chalmers University (Sweden) [13,14], or the Ford Scientific Research Lab [15]. The studies generally examined the impact of sound on tactile perception and the influence of vibration on audible perception for different experimental environments. The comparison of the studies mentioned above showed that both vibration and noise can generally influence ride comfort in vehicles i.e., they can result in discomfort. However, no consistent trend was apparent about their interactions. Some findings indicated an interaction between the two modes of perception, while others did not. Moreover, the studies have investigated the interaction of sounds and vibrations and their summation as an overall event and have focused primarily on the annoyance aspect of the comfort-relevant vibrations. However, experimental studies that investigated the effect of noise on the perception of vibration or the effect of vibration on the perception of noise have only been the focus of a few studies such as [2,16,17,18].
For example, Merchel et al. [17] investigated the influence of vibrations on loudness perception in a frequency band between 10 and 200 Hz. The test persons were first given a reference noise through headphones without vibration input. Afterwards, vibrations were induced for the test persons to readjust the sound level they have just perceived by means of a control wheel. The influence of acoustic stimuli on the intensity perception of whole-body vibrations could be shown. In a second experiment, the influence of sound on the intensity perception of whole-body vibrations was examined. The test person was required to adjust the intensity of a test vibration with acoustic sound to a reference vibration without acoustic sound. The adjustment showed that at low frequencies (10 Hz and 20 Hz), a test person perceived vibrations with auditory stimulation less intensively than vibrations without auditory stimulation. Therefore, an interaction of auditory and tactile events seemed obvious.
In these studies, Merchel et al. [17] explicitly pointed out that the test persons should assess the respective modality (feeling or hearing) and not the perceived intensity of the overall event. An influence of vibrations on loudness perception as well as an influence of acoustic stimuli on the perception of vibrations could be shown in the studies by tendency. Both the acoustic and the vibrational stimuli had the same frequency. However, the resulting excitation during the vehicle passing over an edge has a different frequency range for the vibrational stimulus than for the acoustical stimulus. The study did not provide any findings as to whether an interaction of the perceptual modalities exists for this boundary condition.
A contribution to this question was made by Stamm et al. [16] or Schwendicke and Altinsoy [18], who investigated the influence of acoustic noise signals on the sensing thresholds of vertical whole-body vibrations. They determined tactile perception thresholds on a vibrating chair under varying background noises. Especially in an experiment performed by Stamm et al. [16], the influence of acoustic noise signals on a shift of the perception threshold of tactile sinusoidal vibrations in a frequency band between 15.75 and 300 Hz was investigated. The results showed that there are masking effects in the perception of tactile whole-body vibrations under variation of acoustic stimuli. The lower the center frequencies (31.5, 63, 160 Hz), the broader the observed masking effect. The strength of masking was additionally dependent on the level of the narrowband noise. In the case of an acoustic narrowband noise with a center frequency of 160 Hz, no shift of the sensing threshold at low frequencies could be observed. However, the extent to which this effect can be transferred to transient vibrations in a vehicle remains unclear in this study.
Fülbier [2], on the other hand, evaluated the subjective perception when driving over real individual obstacles in a vehicle environment. In that study, an acoustic influence on the intensity perception of tactile vibrations by varying the type of obstacle, vehicle speed, as well as the suspension parameterization was not confirmed. The focus of his observation was between the frequencies 10 and 150 Hz. Based on the results, it was deduced that the tactile vibrational sensation is independent of an acoustic environment. The acoustic reduction was achieved passively by using earmuffs and hearing protection. However, from a methodological point of view, expectation effects (source of error investigations: subjects unconsciously adapted their behavior to their own expectations and, in doing so, change the result), on account of the suppression of the acoustic environment, could not be ruled out. Therefore, investigations with an adaptation through a defined reproduction of real noise patterns can minimize these effects.
Hence, the aim of this series of investigations was the evaluation of vibrations and acoustics, by experts experienced in the evaluation of tactile and audible vibrations, as well as their interaction in the context of transient road excitation in a vehicle environment. By means of an acoustic reproduction system (see Section 2) and defined suspension parameterizations, vehicle vibrations and acoustics were to be systematically varied within the framework of road tests. From the results, it had to be derived whether and to what extent acoustics influence the perception of whole-body vibrations during transient road excitation and vice versa. As per the findings in previous studies, it was hypothesized that both tactile and audible vehicle vibrations under transient road influences had no significant interactive effects on the driver’s perception.
2. Methodology and Test Design
In vehicle development, in addition to the tactile impression of vibrations, the vehicle acoustics are a decisive aspect for the subjective evaluation of driving comfort. An adaptation or reduction of the acoustic environment is usually achieved by passive approaches such as the individual design of the suspension parameters of a vehicle or by sound insulation measures such as the use of insulating materials. Active noise cancellation analyses analyze the current background noise with the help of microphones or by taking into account auxiliary variables such as road conditions, speed, engine speed, or accelerator pedal position, and they compensate for disturbing noise components through anti-noise.
In this study, a sound reproduction system was used that utilized a sensor to analyze the road surface in advance and, if necessary, actively adjusted the acoustic environment for the driver during driving. In the specific case, the system detected an edge and enabled a defined sound (sound reproduction from a sound database) in the case of transient vibration input. This ensured that a defined acoustic test environment was provided by a controlled reproduction of audible vibrations. With additionally defined parameterization of the suspension, the two sensory modalities feeling and hearing as well as their interaction in a real environment could be investigated together in a differentiated manner.
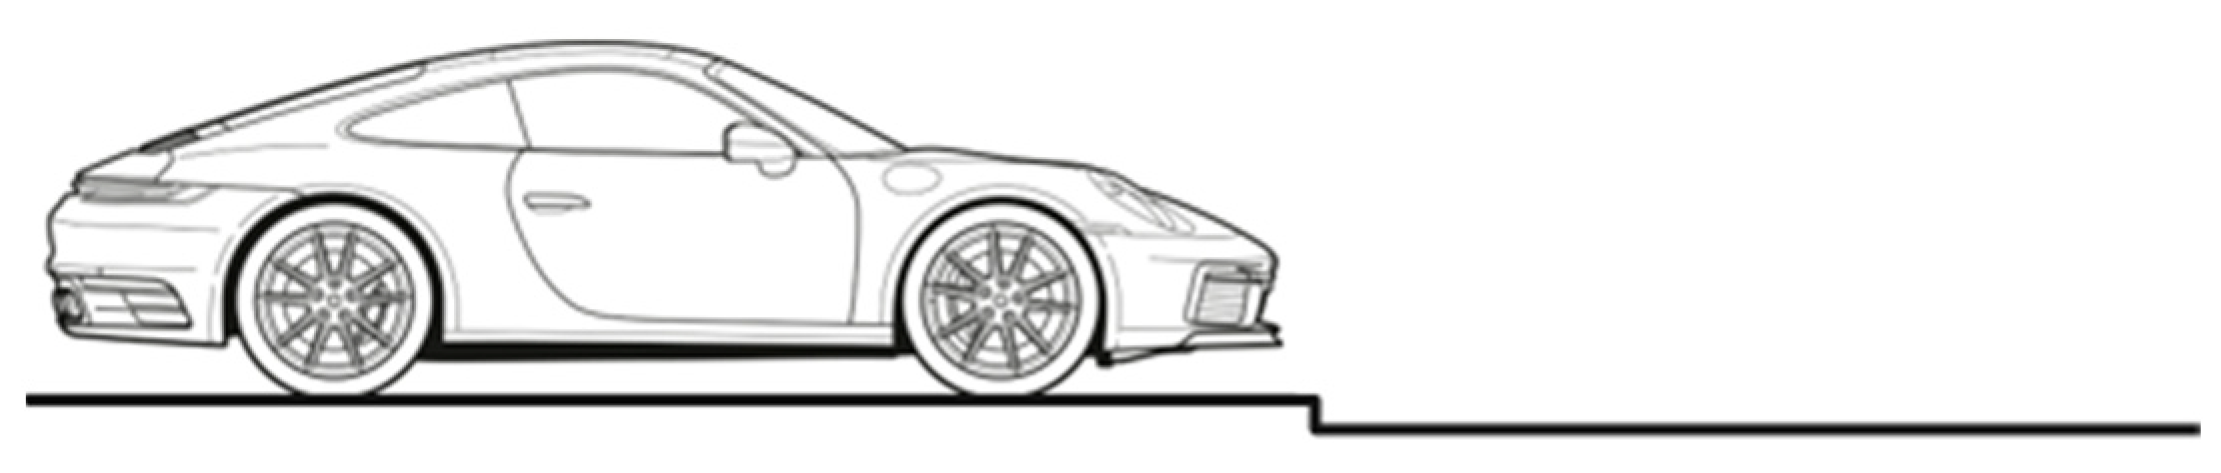
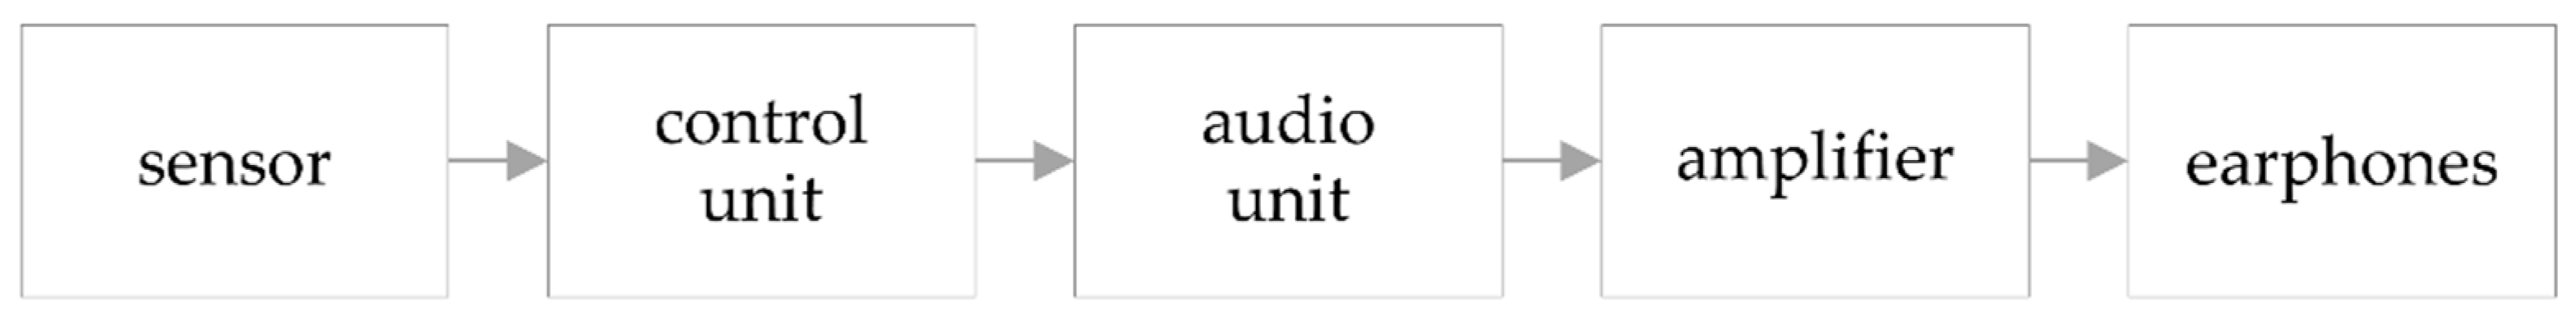
The sound reproduction unit consisted of a Lasersensor (OPTImessMC OMS 4140, Dr. D. Wehrhahn, Hannover, Germany) that provided information about the road surface directly to a central control unit (Arduino Uno R3, Elegoo Inc., Shenzhen, China). It controlled an element that contained sound signals in a database (WAV Trigger, robertsonics, Los Angeles, USA). Using a preamplifier (XU09, Dongguan Hua Kun Jidian Co., Ltd, Dongguan, China), the sound was reproduced through earphones (SE315, Shure Inc., Niles, USA). These had a high passive isolation (up to 37 dB) and, for the test, they were used in combination with hearing protection (SNR 31 dB, 3 M Optime II H520A, 3 M Deutschland GmbH, Neuss, Germany) (see Appendix A for additional information). A potential interaction of the tactile and auditory impulse perception when driving over a transient obstacle in a vehicle environment was tested on 15 subjects (see Appendix B for additional information). With the assistance of the sound reproduction system described above, audible impulses were reproduced with a reference volume 1. The volume 2 was perceived to be significantly louder than the reference volume 1 when driving over a falling edge of 30 mm at 20 ± 1 km/h (Figure 1).
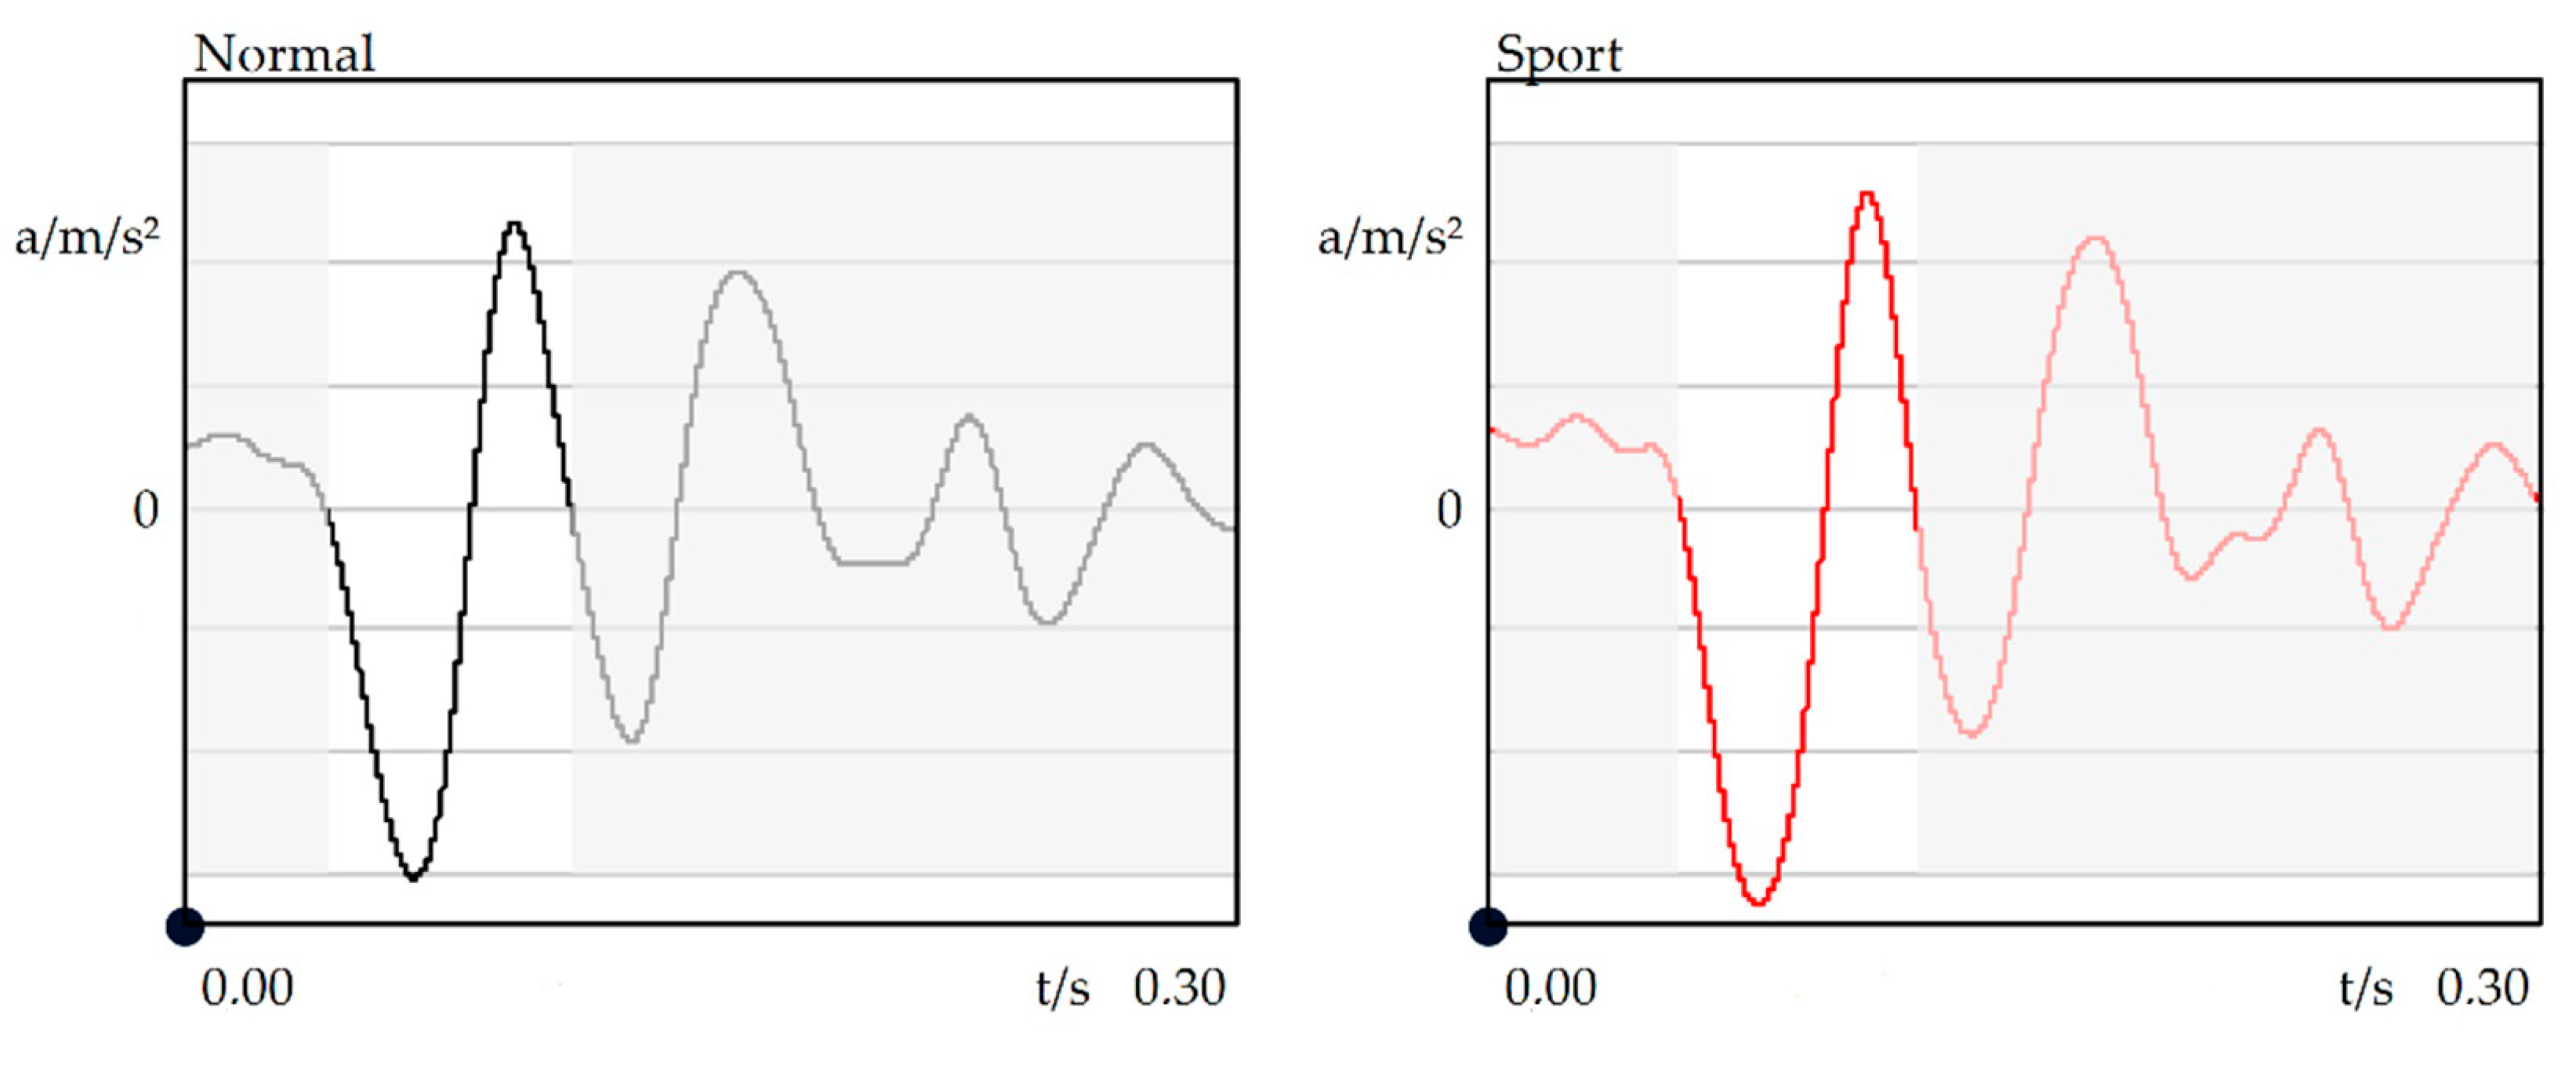
For variation of the tactile impulse, the suspension variants normal (low damping) and sport (high damping) were mapped by a defined damper parameterization (Active Suspension Management). Figure 2 shows the resulting accelerations (filtered) at the driver’s seat in the vertical direction for the respective suspension parameterizations when driving over obstacles with the rear wheels. The objective evaluation resulted in about a +12.5% (standard deviation SD < 4%, see Appendix B) increased impulse input (peak-to-peak value) in the sport suspension mode (Table 1), which could be distinguished subjectively (see Appendix B for additional information regarding data acquisition and data analysis).
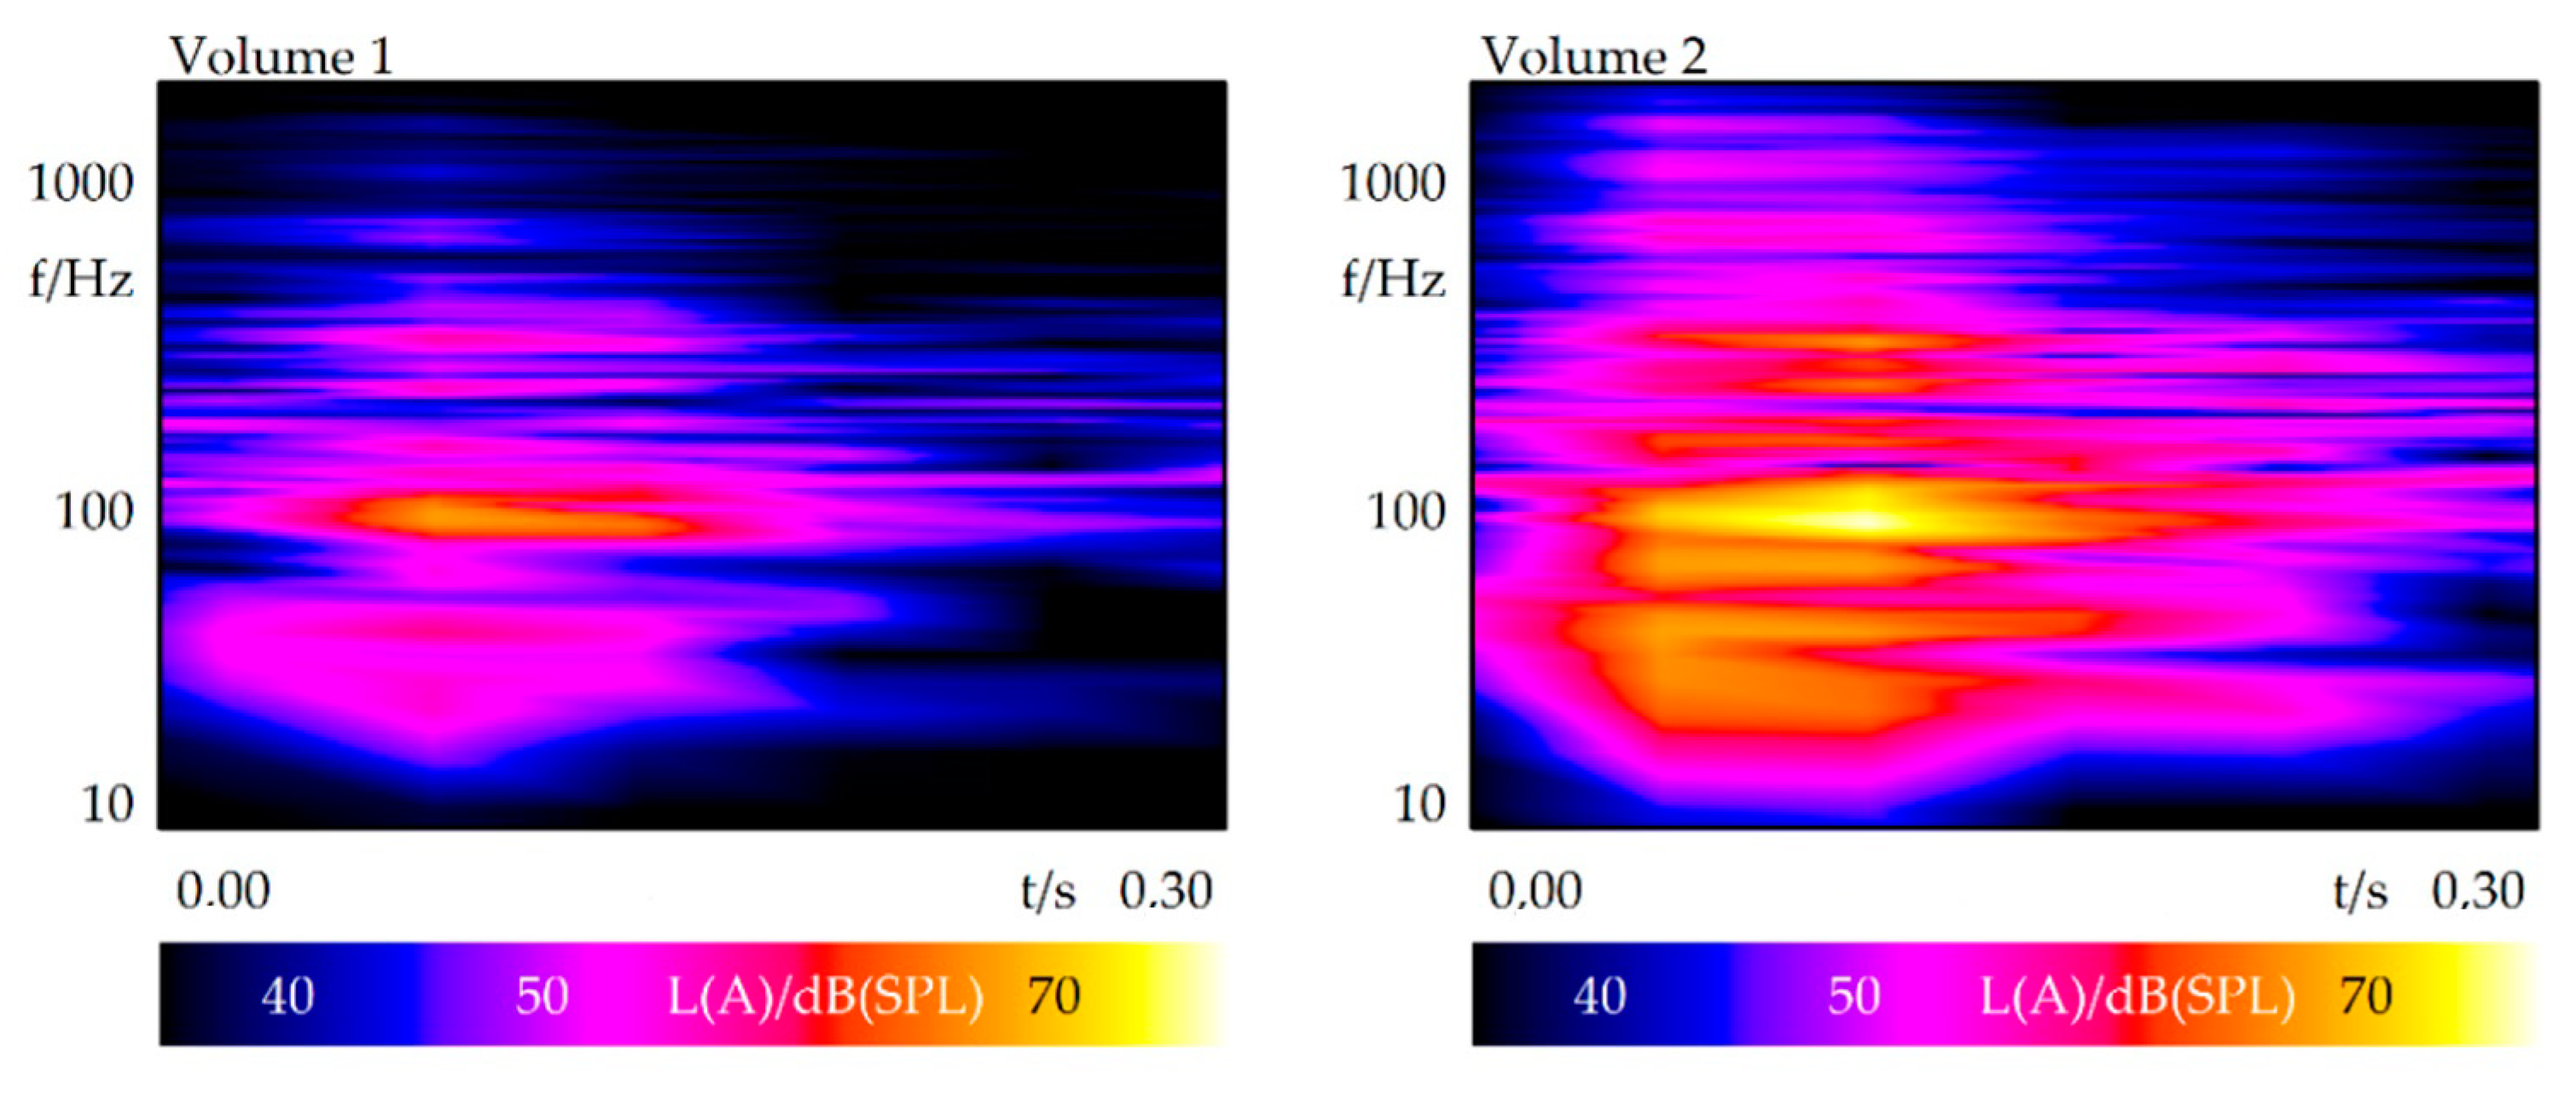
Two sound signals (Figure 3) were provided for variation of the audible impulses. A reference signal (volume 1) presented a sound that was typical of the vehicle when driving over a falling edge. Another signal (volume 2) was modified in relation to the sound pressure level so that it was subjectively perceived to be significantly louder than the reference signal (Table 2).
Two experimental sessions were considered in this study. In the first session, the subjects evaluated the tactile impulse input and in the second session, the subjects evaluated the audible impulse input under variation of the tactile and audible vibrations. The test vehicle (Porsche 911 Carrera Type 991) was prepared according to normal operating temperature (e.g., engine, dampers, suspension mounts, tires) with a full tank filled to maximum capacity. Before each driving maneuver, the subjects adjusted the seat and the steering system in accordance with their ergonomic requirements. During the driving maneuver, the subject had to drive over a sequence of three consecutive falling edges of 30 mm (the distance between the edges was 7.5 m). After each driving maneuver, the evaluation was carried out using an absolute rating scale ranging from 0 “not perceptible” to 5 “very strongly perceptible”. Tactile and audible impulses were assessed exclusively when driving over a falling edge with the rear wheels. The test leader was seated on the front passenger seat and varied the vehicle configuration with respect to the tactile and audible impulses. Additionally, he made sure that the subjects performed the test series fully focused.
Each experimental session contained of four conditions, and each condition was presented up to three times (repetitions). One test series (= 2 sessions) took about 60 min including a training drive for each subject. Two test sessions were carried out with a short break of five minutes to recover the senses in between the sessions. Furthermore, the presentation sequence of the auditory and tactile stimuli was randomized.
3. Results
The results are summarized below in Section 3.1 and Section 3.2 in boxplot diagrams (subjective ratings of the same condition were taken into account as arithmetic average). The dash in each box shows the median of the distribution, which is also given as a numerical value. The outliers are defined as greater than 1.5 times the interquartile range (IQR) and are additionally shown. The statistical analysis of the data (SPSS) was based on a Wilcoxon sign-rank test (more than one dataset was not normally distributed, Shapiro–Wilk: p < 0.05). The resulting significance value of each paired comparison was adjusted using the Bonferroni procedure (padj = p × 6, number of paired comparisons = 6) so that it could be compared with the significance level of α = 0.05. The approach according to Cohen [20] was used to interpret the effect size (G*Power). Further information can be found in [21].
3.1. Influence of Audible Impulses on the Intensity Perception of Tactile Impulses
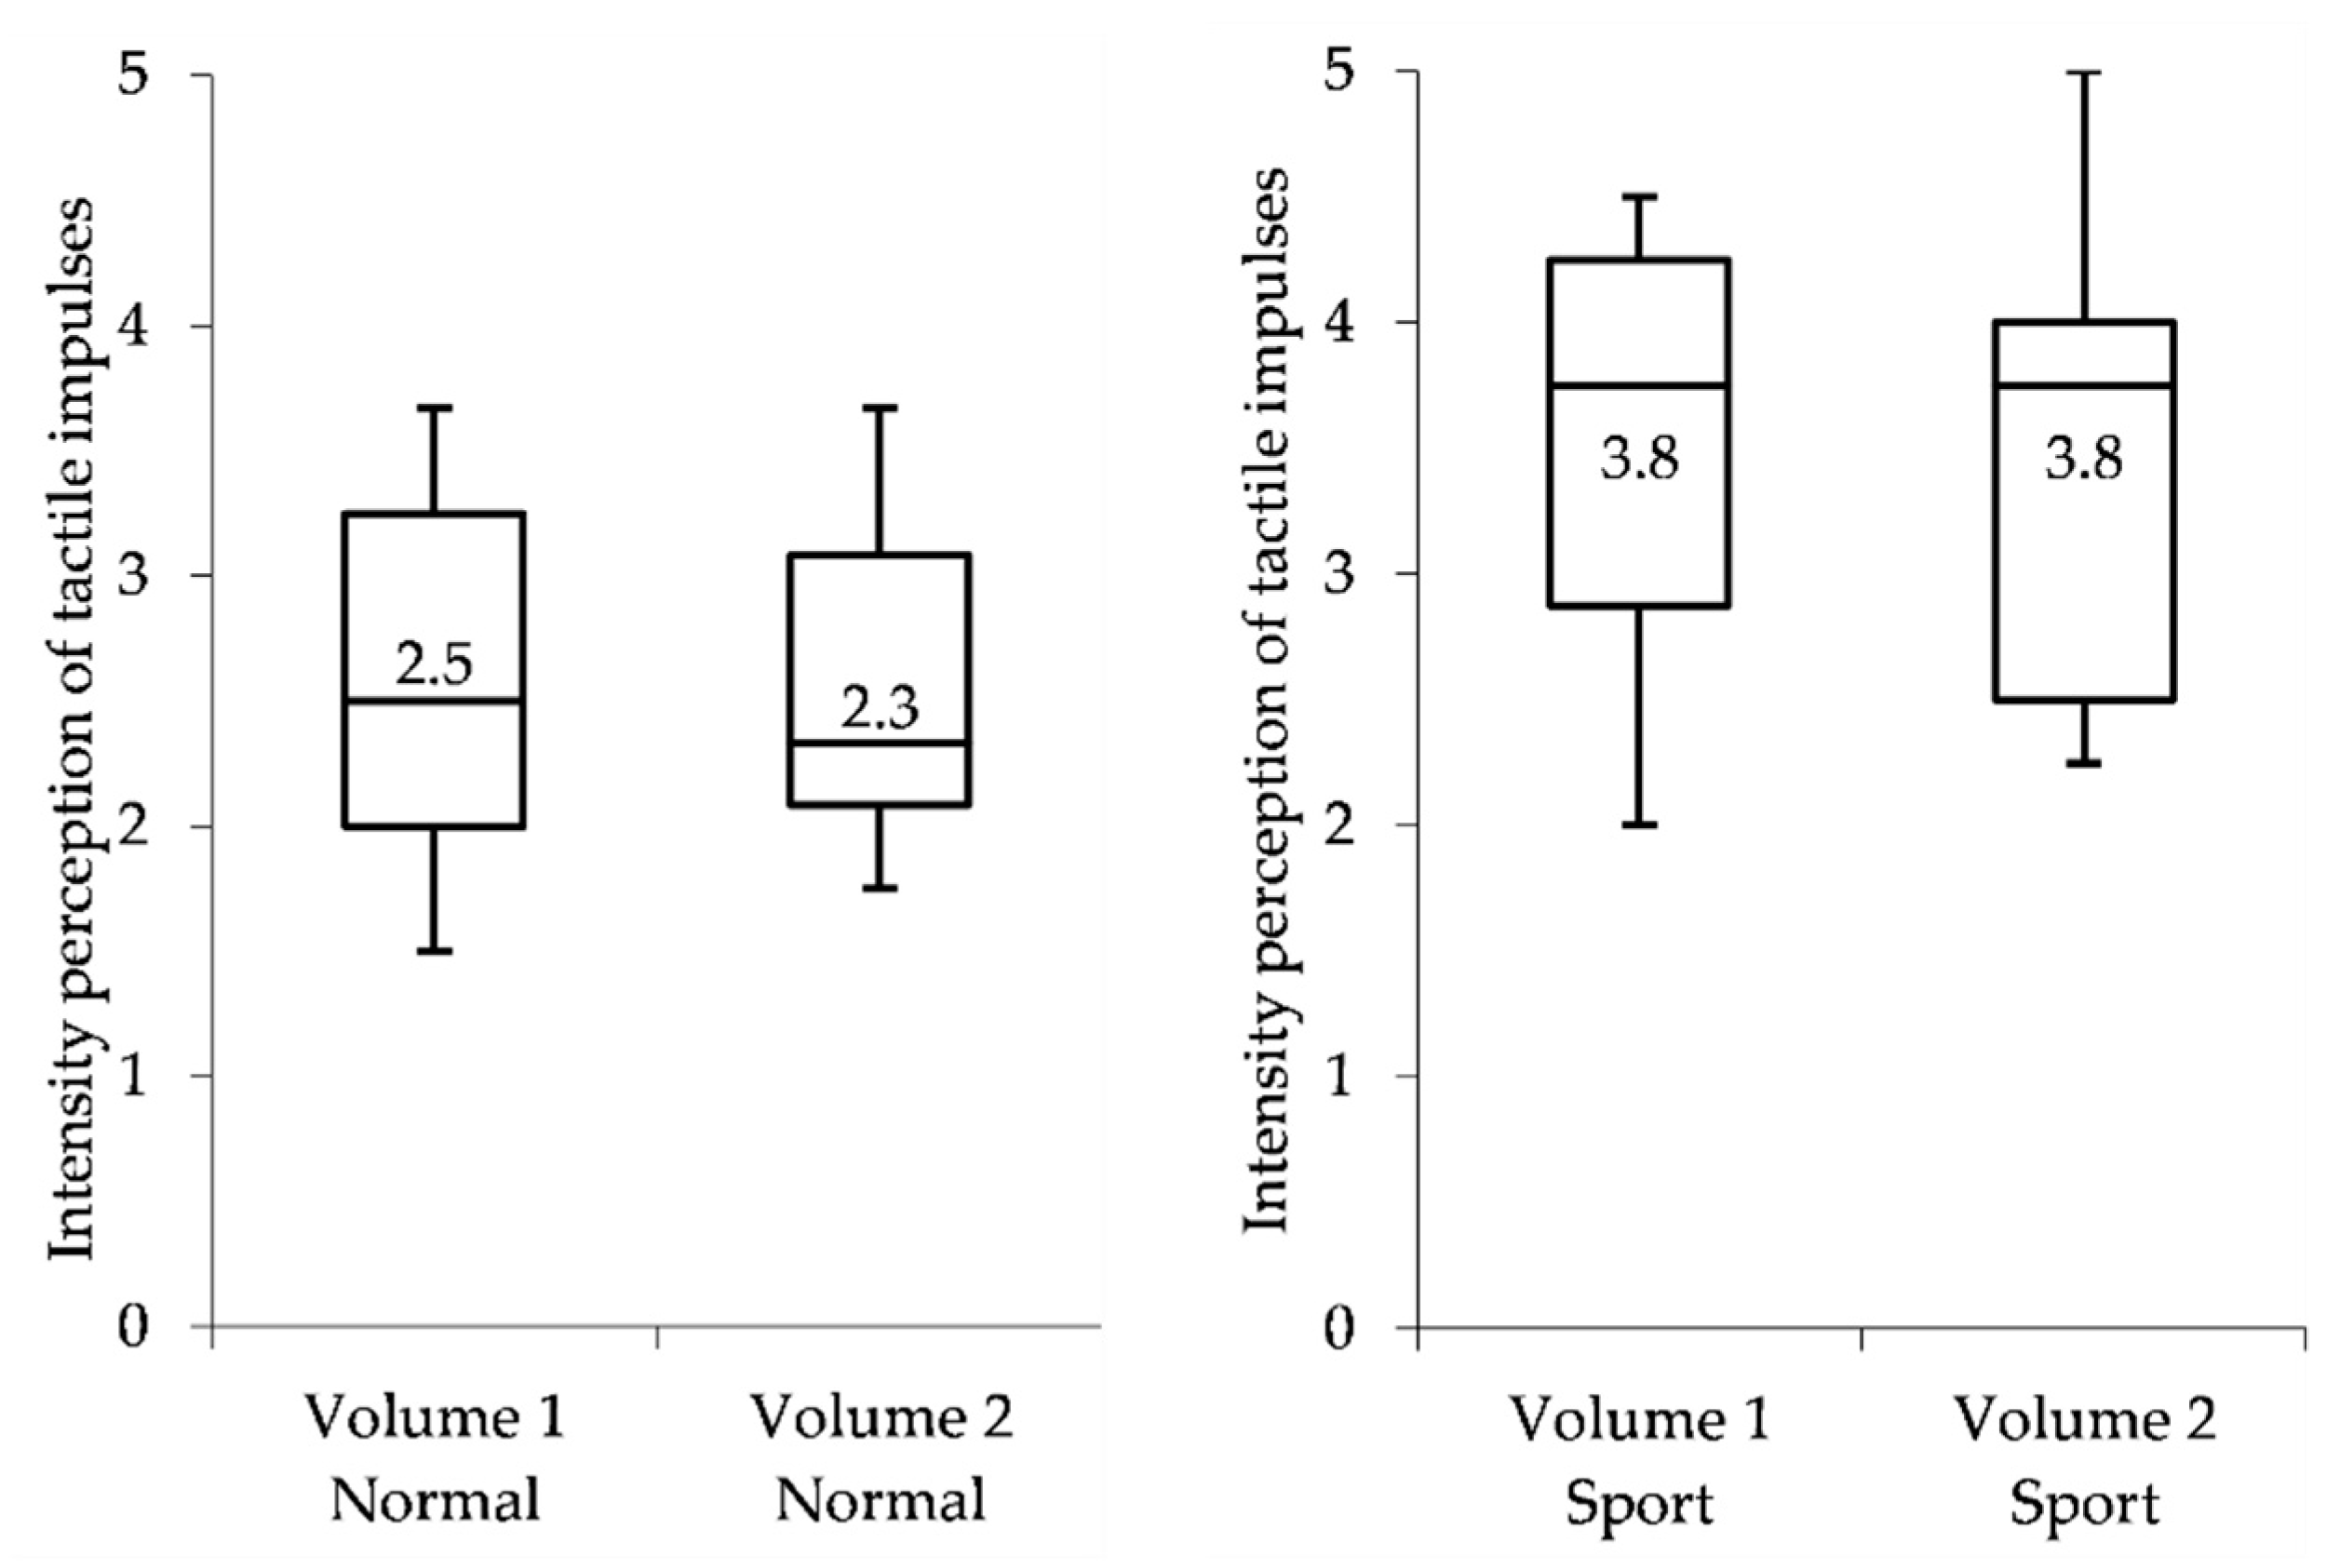
This part of the study investigated the influence of audible impulses on the intensity perception of tactile impulses. Figure 4 shows the subjective evaluations in the normal suspension mode and the subjective evaluations in the sport suspension mode plotted over the variants of volume 1 and volume 2. Table 3 shows the derived statistical parameters of each paired comparison.
When varying the volume (1→2) in the normal suspension parameterization, the subjective evaluations did not differ significantly with regard to the tactile impulse (p > 0.05, comparison 1 in Table 3). In the sport suspension parameterization, the result was equivalent. However, when varying the suspension parameterization from normal to sport and while maintaining the volume level (1 or 2), the subjective evaluations with regard to the tactile impulse differed significantly (p < 0.05, comparisons 3 and 6 in Table 3). The resulting effect size according to Cohen [20] was > 1.0 and corresponds to a large effect. If both the suspension parameterizations and the volume levels were varied, the subjective evaluations also showed a statistically significant difference with p < 0.05 (comparisons 4 and 5 in Table 3). The resulting effect sizes were > 1.0 and also corresponded to a large effect.
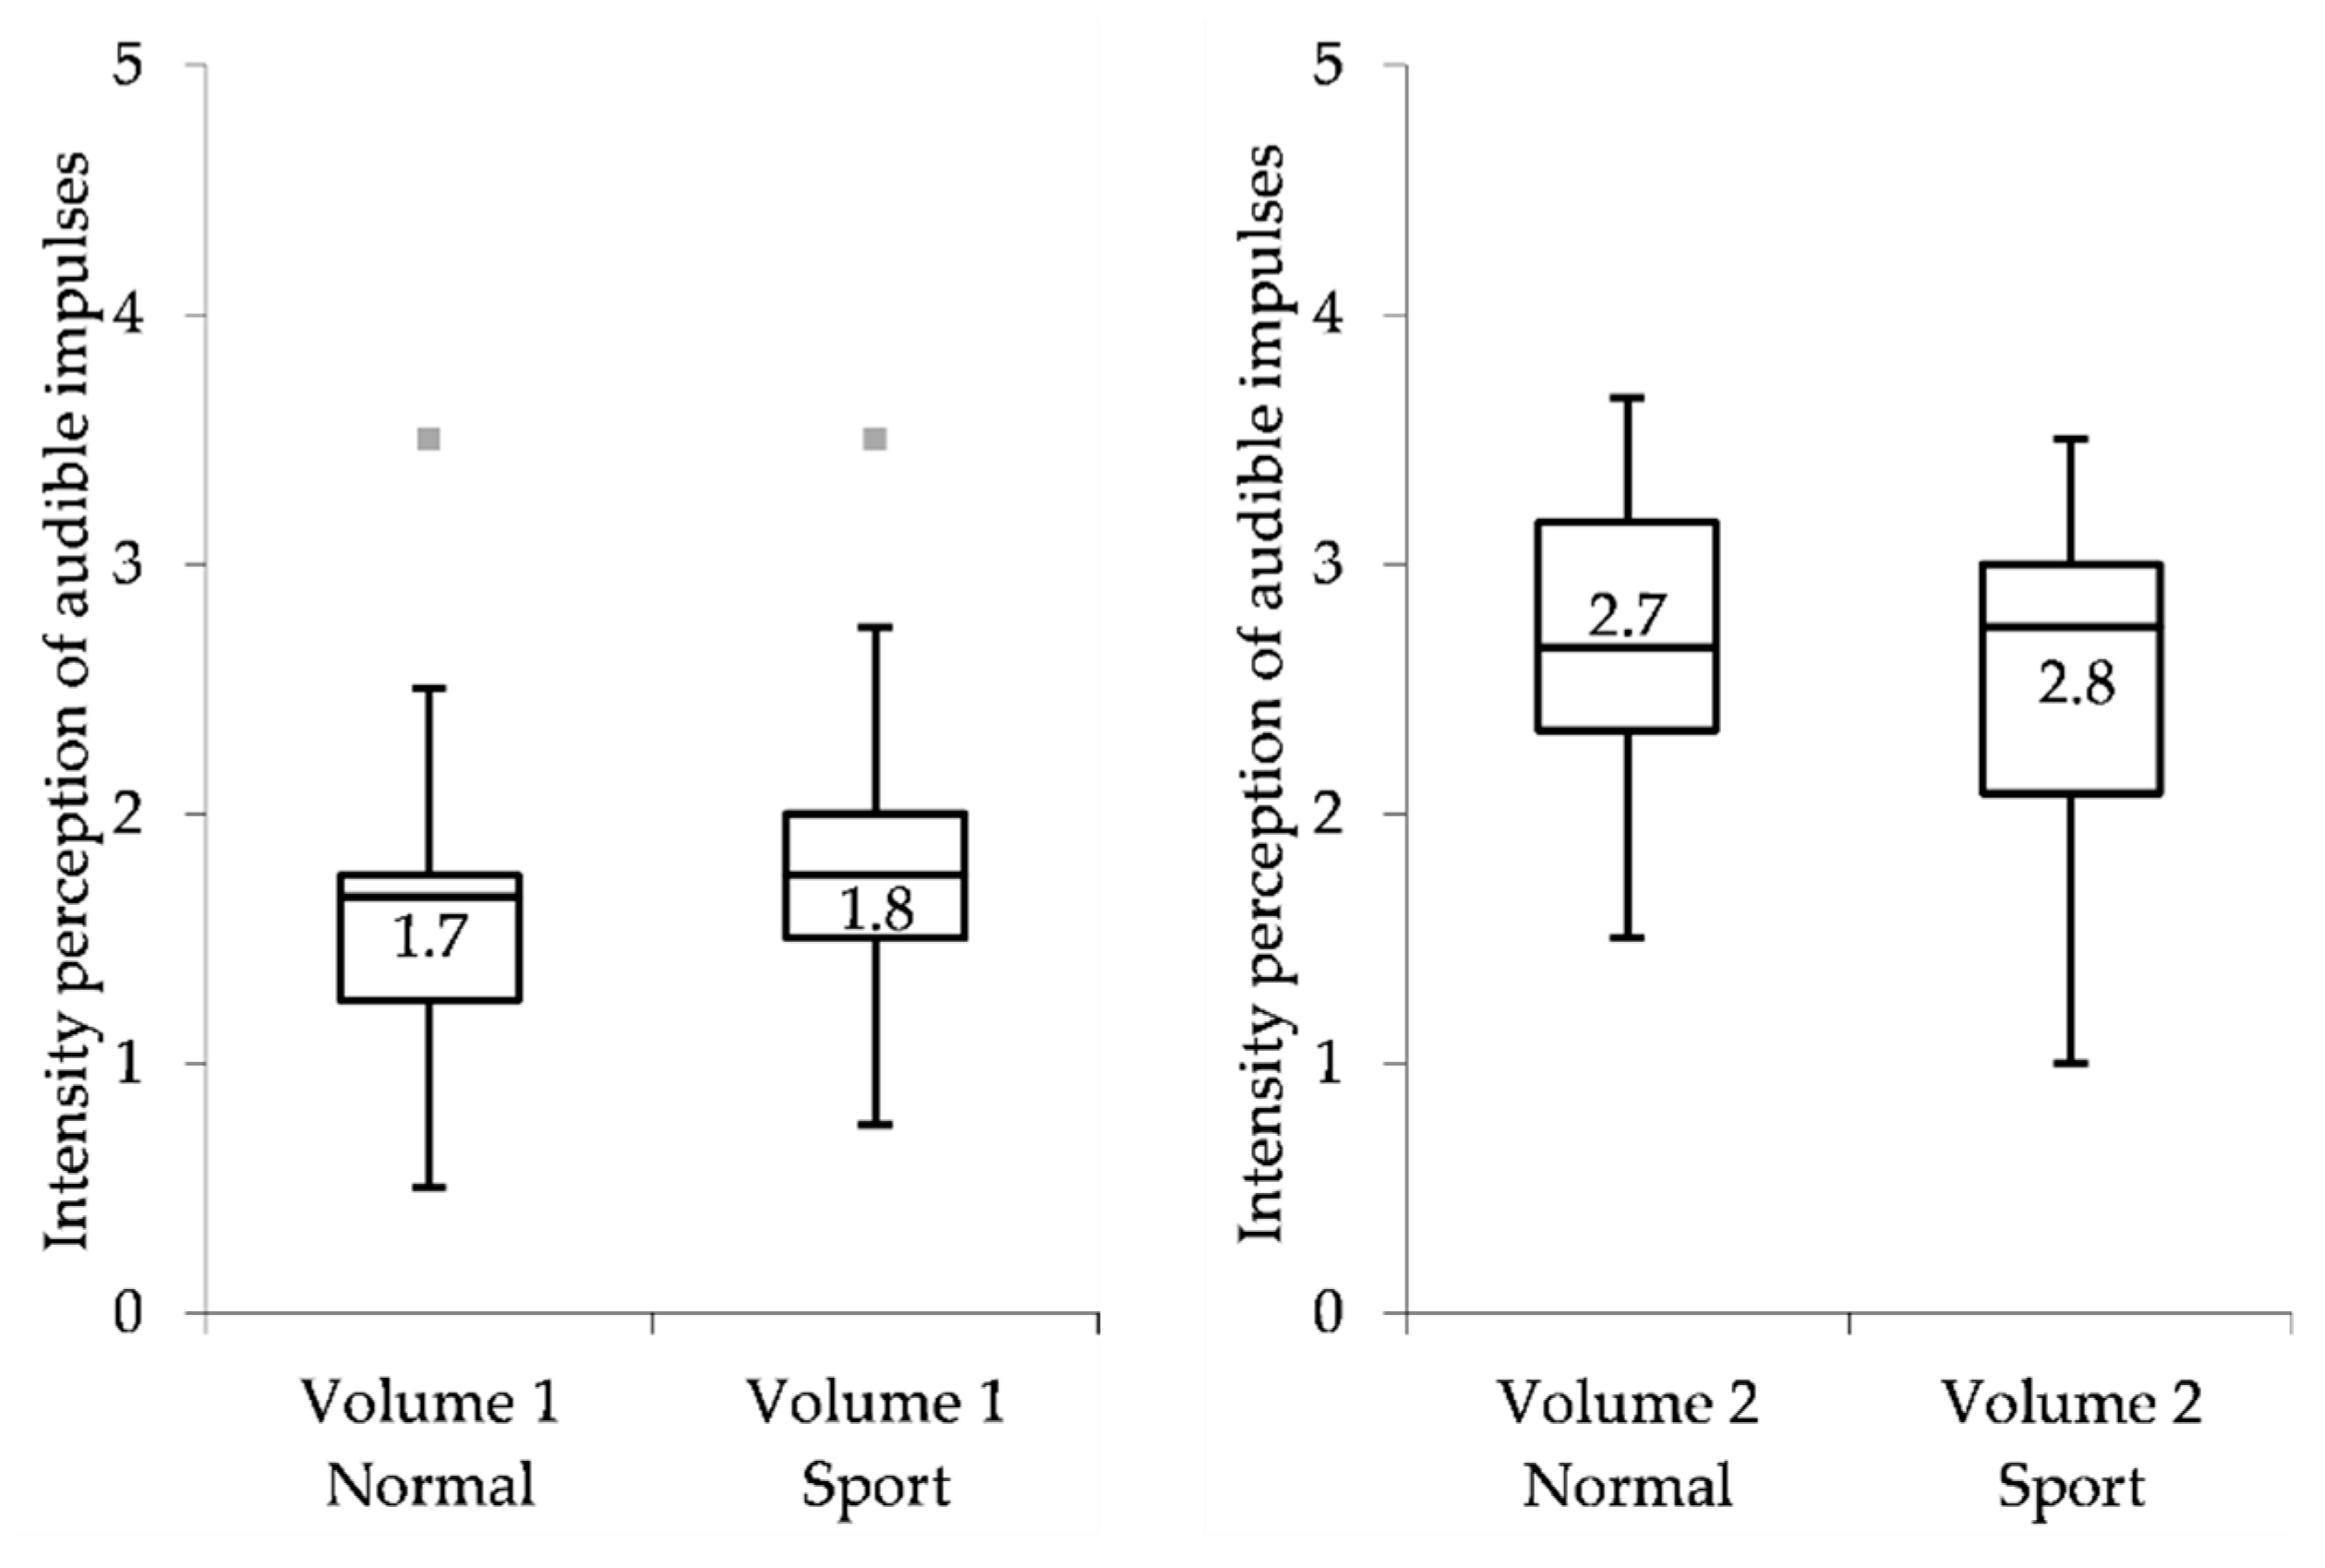
3.2. Influence of Tactile Impulses on the Perception of Audible Impulses
This part of the study investigated the influence of tactile impulses on the intensity perception of audible impulses. Figure 5 shows the subjective evaluations in both volume 1 and volume 2 plotted over the normal and the sport suspension mode. Table 4 shows the derived statistical parameters of each paired comparison.
When varying the suspension parameterization (normal↔sport) and maintaining the volume (1 or 2), the subjective evaluations with regard to the audible impulse did not differ significantly with p > 0.05 (comparisons 1 and 2 in Table 4). If, on the other hand, only the volume (1↔2) varies, and the respective suspension parameterization is kept constant as normal or sport, the subjective evaluations differ significantly (comparisons 3 and 6 in Table 4). The resulting effect sizes according to Cohen [20] were >1.0 and corresponded to a large effect. If both modes of perception were varied, the subjective ratings with p < 0.05 (comparisons 4 and 5 in Table 4) were also statistically significantly different. The resulting effect sizes according to Cohen [20] were >1.0 and corresponded to a large effect.
4. Discussion
The influence of volume on the tactile perception of an impulse was examined in Section 3.1 for two amplitude levels (suspension parameterization normal and sport). The results showed that the subjective evaluations did not exhibit any significant difference with regard to the variation of the volume (Table 3, comparisons 1 and 2). Therefore, the evaluations of the tactile impulse were independent of the volume of an impulse, and the results were comparable with the investigations in [2]. Furthermore, the investigations showed that a change in amplitude of about 12.5% can be distinguished by the subjects (Table 3, comparisons 3–6). Regarding difference thresholds determined for transient vertical whole-body vibrations, no findings have so far emerged. However, experimental work by [22,23] have shown difference thresholds determined for sinusoidal vertical whole-body vibrations in ranges from 6.7% to 11.0% and from 8.2% to 12.3% (for an overview, see [22]). Hence, the observation in this study may be an indication that just noticeable differences in perception of transient whole-body stimuli are similar to just-noticeable differences of sinusoidal whole-body stimuli.
The influence of tactile vibrations on the evaluation of audible impulses was examined for two volume levels in Section 3.2. The results showed that the subjective ratings do not reveal a significant difference in terms of the variation of the amplitude level (normal and sport) (Table 4, comparisons 1 and 2). Therefore, the evaluation of an audible impulse was equally independent of the intensity of a tactile impulse. Moreover, the results confirmed that an increase in sound pressure level of about 9 dB could be perceived significantly by the subjects (Table 4, comparisons 3–6).
Experimental investigations by Merchel et al. [17] have shown the trend that an acoustic stimulus was perceived louder if there was a vibratory stimulus of the same frequency range at the same time. On average, a test sound was set 1 dB lower than a reference sound in the investigations and was in the range of a barely perceptible difference. In addition, a further investigation has shown the trend that a tactile stimulus with acoustic sound was set lower in amplitude than a tactile stimulus without acoustic sound. Especially at the frequencies 10 Hz and 20 Hz, a reduction of the tactile amplitudes of 1 dB (12%) and 1.5 dB (19%), which are above the barely perceptible difference of sinusoidal vibrations, could be observed. According to [17], the described effects indicate an interaction of auditory and tactile stimuli and in addition imply the assumption that different channels of perception are important for frequency selectivity. Therefore, an existing interaction of auditory and tactile stimuli may be due to stimuli with the same frequency range. In the case of transient stimuli (occurring e.g., when driving over an edge), auditory stimuli had significantly different frequency ranges than tactile stimuli (see Figure 3 and Appendix B). Therefore, for this stimulation condition, an unobserved interaction of tactile and audible vibrations (see Section 3) can be assumed.
Further evidence for the thesis just described is provided by the investigations by Stamm et al. [16], where the influence of narrowband acoustic noise signals on a potential shift of the sensing threshold of sinusoidal vibrations in a frequency band between 15.75 and 300 Hz was examined. The results showed the largest displacement of the sensing threshold was at the center frequencies (31.5, 63, 160 Hz) of the corresponding narrowband acoustic noise. The lower the center frequency, the more broadband was the observed masking effect. If, on the other hand, there was a narrowband acoustic noise with a center frequency of 160 Hz, no shift of the sensing threshold at 15.75 Hz could be observed.
Possible reasons for this effect may be found in different human sensory organs (mechanical receptors), which are relevant to the human overall perception of vibration. In physiological research, it is generally known that four groups of mechanical receptors exist in different layers of the skin. In particular, the Merkel cell responds to pressure in an optimum frequency range from 0.4 to 3 Hz [24]. The Meissner corpuscles respond to velocity in an optimum frequency range from 3 to 35 Hz [24] (from 3 to 40 Hz according to [25]) as well as the Ruffini corpuscles in a frequency range from 80 to 500 Hz [24] (from 15 to 400 Hz according to [25]), whereas the Paccini corpuscles respond to acceleration in an optimum frequency range from 35 to 500 Hz [24] (from 10 to 500 Hz according to [25]). In addition, the cells differ in the adaption of speed, in stimulus detection and size of the receptor field (for additional information, see [24,25,26,27,28]). The combined stimulation of these mechanical receptors results finally in an overall perception of tactile vibrations (further information regarding the ability and limitation of tactile or of auditory perception can be found in [29]).
Basically, the investigations presented in this study showed that both tactile and audible vibrations under transient influences had no significant interactive effects on the subjective evaluation. Thus, experts were able to give a differentiated or uninfluenced evaluation about the respective perception modality. This fact could be attributed to the dominant participation in a perception of the Meissner and Ruffini as well as the Paccini corpuscles, which have an optimum response in frequency corresponding to a frequency range of tactile impulses observed in this study (≈14.5 Hz, see Appendix B for more information).
5. Summary and Conclusions
The study investigated the interaction of the perception modalities feeling and hearing under the influence of transient vibrations. The focus of the study is on impulse perception, which was investigated by varying tactile and audible stimuli in a vehicle environment. For this purpose, a sound reproduction unit was used that employed a sensor to analyze the road surface in advance and reproduced a defined driver’s sound during driving. With parameterization of the suspension, tactile impulses were additionally varied.
In addition to previous studies, the results showed that audible impulses had no significant influence on the intensity perception of tactile impulses and that tactile impulses had no significant influence on the perception of audible impulses. Therefore, experts were able to give an uninfluenced assessment with respect to the sensory modality for the stimulation conditions presented in this study. The initial hypothesis that both tactile and audible vehicle vibrations under transient road influences had no significant interactive effects on the driver’s perception can be consequently confirmed to the stimuli used in this study.
Author Contributions
Conceptualization, M.F., F.S. and A.T.; methodology, M.F., F.S. and A.T.; software, M.F., F.G. and A.T.; validation, M.F., F.S. and A.T.; formal analysis, M.F.; investigation, M.F., F.S. and A.T.; writing—original draft preparation, M.F.; writing—review and editing, M.F., F.S., A.T. and F.G.; visualization, M.F.; supervision, F.G.; project administration, M.F. and F.S. All authors have read and agreed to the published version of the manuscript.
Funding
This research received no external funding.
Institutional Review Board Statement
The study was conducted according to the principles of research ethics, and approved by Dr. Ing. h.c. F. Porsche AG.
Informed Consent Statement
Informed consent was obtained from all subjects involved in the study.
Data Availability Statement
The data are not publicly available due to legal restrictions.
Acknowledgments
We acknowledge support by the KIT-Publication Fund of the Karlsruhe Institute of Technology. We are grateful for the NVH-Department of Dr. Ing. h.c. F. Porsche AG supporting this work in collaboration with the Institute of Vehicle System Technology of the Karlsruhe Institute of Technology (KIT). The authors thank A. Winandi from the Karlsruhe Institute of Technology and L. Liebke for valuable input and support.
Conflicts of Interest
The authors declare no conflict of interest. M.F. and F.S. are from Dr. Ing. h.c. F. Porsche AG, the company had no role in the design of the study; in the collection, analyses, or interpretation of data; in the writing of the manuscript, and in the decision to publish the results. Portions of this research were done while A.T. (Arm Tavornmas) was a master’s student at Dr. Ing. h.c. F. Porsche AG in 2017 in collaboration with the Audio Communication Group of the TU Berlin.
Abbreviations
The following abbreviations are used in this manuscript:
| A | A-weighting |
| dB | Decibel |
| f | Frequency |
| Hz | Hertz |
| IQR | Interquartile range |
| N | Suspension mode Normal |
| NVH | Noise, Vibration, Harshness |
| S | Suspension mode Sport |
| SD | Standard deviation |
| SPL | Sound pressure level |
| T | Impulse duration |
Appendix A. Figures and Tables
Figure A1.
Sound reproduction unit.


Table A1.
Overview of intensity perception of tactile impulses determined in this study (%).
| Figure | 4 (Left) | 4 (Left) | 4 (Right) | 4 (Right) |
|---|---|---|---|---|
| Variant | Volume 1 | Volume 2 | Volume 1 | Volume 2 |
| Mean | 2.6 | 2.6 | 3.6 | 3.5 |
| Standard deviation | 0.7 | 0.7 | 0.9 | 0.9 |
| Median value | 2.5 | 2.3 | 3.8 | 3.8 |
| Upper quartile | 3.3 | 3.1 | 4.3 | 4.0 |
| Lower quartile | 2.0 | 2.1 | 2.9 | 2.5 |
| IQR | 1.3 | 1.0 | 1.4 | 1.5 |
Table A2.
Overview of intensity perception of audible impulses determined in this study (%).
| Figure | 5 (Left) | 5 (Left) | 5 (Right) | 5 (Right) |
|---|---|---|---|---|
| Variant | Normal | Sport | Normal | Sport |
| Mean | 1.7 | 1.9 | 2.7 | 2.6 |
| Standard deviation | 0.7 | 0.8 | 0.7 | 0.7 |
| Median value | 1.7 | 1.8 | 2.7 | 2.8 |
| Upper quartile | 1.8 | 2.0 | 3.2 | 3.0 |
| Lower quartile | 1.3 | 1.5 | 2.3 | 2.1 |
| IQR | 0.5 | 0.5 | 0.8 | 0.9 |
Appendix B
B1: A total of 15 experts (1 female, 14 male) from Dr. Ing. h.c. F. Porsche AG, very experienced in subjective rating of ride comfort. All participants were aged between 25 and 50 years with stature from 165 to 195 cm, weighing between 65 and 95 kg. They were healthy and without any existing complaints (e.g., discomfort in the area of the backbone). All experts were authorized to perform driving tests on special proving grounds (e.g., proving ground Dr. Ing. h.c. F. Porsche AG). In addition, informed consent to participate in the studies was given by all experts.
B2: The objective evaluation of various driving maneuvers resulted in about a +12.5% (mean value) increased impulse input (peak-to-peak value, vertical acceleration at seat reference point) in the sport suspension mode with an observed standard deviation of SD < 4 %. In addition, an impulse duration of 0.069 s (mean value) with a corresponding standard deviation of SD < 0.003 s was observed.
B3: The data acquisition was supported by the software HEAD Recorder (HEAD acoustics) in combination with the hardware DataRec4 modules (Heim Zodiac). Acceleration data were recorded by means of triaxial PCB sensors (e.g., 354C03) at a sampling rate of 8 kHz. Sound pressure data were recorded using calibrated equipment from HEAD acoustics (e.g., binaural head microphone for recordings inside the vehicle, artificial head for recordings regarding the sound reproduction system) at a sampling rate of 48 kHz. Both vibration and sound data were analyzed using the software ArtemiS Suite (HEAD acoustics).
B4: The inverse of the tactile impulse duration (T = 0.069 s, Table 1) describes the tactile impulse frequency (f = 1/T; ≈14.5 Hz).
References
- Genuit, K. Vehicle Interior Noise—Combination of Sound, Vibration and Interactivity. Sound Vib. 2009, 43, 8–12. [Google Scholar]
- Fülbier, K.-P. Systemansatz zur Untersuchung und Beurteilung des Abrollkomforts von Kraftfahrzeugen bei Überfahrt von Einzelhindernissen. Ph.D. Thesis, Technische Hochschule Aachen, Aachen, Germany, 2001. [Google Scholar]
- Bellmann, M.A. Perception of Whole-Body Vibrations: From Basic Experiments to Effects of Seat and Steering-Wheel Vibrations on the Passenger’s Comfort Inside Vehicles; Dissertation Uni Oldenburg; Shaker Verlag GmbH: Düren, Germany, 2002; ISBN 978-3832208578. [Google Scholar]
- Sköld, M. Vibration Influence on Product Sound Quality in Cars. Forum Akust. 2005, 5, 1731–1734. [Google Scholar]
- Amman, S.; Mouch, T.; Meier, R.; Gu, P. Sound and vibration perceptual contributions during vehicle transient and steady-state road input. Int. J. Veh. Noise Vib. 2007, 3, 157–171. [Google Scholar] [CrossRef]
- Fleming, D.B.; Griffin, M.J. A study of the subjective equivalence of noise and whole-body vibration. J. Sound Vib. 1975, 42, 453–461. [Google Scholar] [CrossRef]
- Amman, S.; Meier, R.; Mouch, T.; Gu, P. A Survey of Sound and Vibration Interaction; SAE Techical Paper Series No. 2005-01-2472; SAE International: Warrendale, PA, USA, 2005. [Google Scholar]
- Howarth, H.V.; Griffin, M.J. Subjective response to combined noise and vibration: Summation and interaction effects. J. Sound Vib. 1990, 147, 443–454. [Google Scholar] [CrossRef]
- Howarth, H.V.; Griffin, M.J. The annoyance caused by simultaneous noise and vibration from railways. J. Acoust. Soc. Am. 1991, 89, 2317–2323. [Google Scholar] [CrossRef]
- Miwa, T.; Yonekawa, Y. Measurement and evaluation of environmental vibrations Part2: Interaction of sound and vibration. Ind. Health 1973, 11, 177–184. [Google Scholar] [CrossRef] [Green Version]
- Dempsey, T.; Leatherwood, J.; Drezek, A. Development of noise and vibration ride comfort criteria. J. Acoust. Soc. Am. 1979, 65, 124–132. [Google Scholar] [CrossRef] [PubMed]
- Leatherwood, J.; Clevenson, S.; Stephens, D. The development of interior noise and vibration criteria. In NASA Technical Memorandum 102736; NASA: Washington, DC, USA, 1990. [Google Scholar]
- Ingvarsson, A.; Vastfjall, D. A study on the human response to aircraft vibrations in flight. In Proceedings of the 5th AIAA/CEAS Aeroacoustics Conference and Exhibit, Bellevue, WA, USA, 10–12 May 1999. [Google Scholar]
- Vastfjall, D.; Larsson, P.; Kleiner, M. Cross-modal interaction in sound quality evaluation: Some experiments using the virtual aircraft. Internoise Sound Qual. Symp. Proc. 2002, 2002, 24–28. [Google Scholar]
- Amman, S.; Gu, P.; Mouch, T.; Greenberg, J. Sound and Vibration Contributions to the Perception of Impact Harshness; SAE Techical Paper Series No. 2005-01-1499; SAE International: Warrendale, PA, USA, 2005. [Google Scholar]
- Stamm, M.; Altinsoy, E.; Merchel, S. Frequenzwahrnehmung von Ganzkörperschwingungen im Vergleich zur auditiven Wahrenhmung I. In Proceedings of the DAGA 2010—36th German Annual Conference on Acoustics, Berlin, Germany, 15–18 March 2010; pp. 867–868. [Google Scholar]
- Merchel, S.; Leppin, A.; Altinsoy, E. Multisensorische Interaktion im Fahrzeug: Audio-Taktile Intensitätswahrnehmung. In Proceedings of the DAGA 2010—36th Annual Conference on Acoustics, Berlin, Germany, 15–18 March 2010; pp. 871–872. [Google Scholar]
- Schwendicke, A.; Altinsoy, M.E. Frequency Masking Effects for Vertical Whole-Body Vibration for Seated Subjects. Vibration 2020, 3, 357–370. [Google Scholar] [CrossRef]
- Dr. Ing. h.c. F. Porsche AG. Internal Illustration; Dr. Ing. h.c. F. Porsche AG: Stuttgart, Germany, 2020. [Google Scholar]
- Cohen, J. Statistical Power Analysis for the Behavioral Sciences, 2nd ed.; Lawrence Erlbaum: Hillsdale, NJ, USA, 1988. [Google Scholar]
- Bühner, M.; Ziegler, M. Statistik für Psychologen und Sozialwissenschaftler; Pearson: München, Germany, 2009; ISBN 978-3-8273-7274-1. [Google Scholar]
- Festa, M.; Durm, T.; Lünebach, M.; Gauterin, F. Difference Thresholds for the Perception of Sinusoidal Vertical Stimuli of Whole-Body Vibrations in Ranges of Amplitude and Frequency Relevant to Ride Comfort. Vibration 2020, 3, 116–131. [Google Scholar] [CrossRef]
- Morioka, M.; Griffin, M.J. Difference thresholds for intensity perception of whole-body vertical vibration: Effect of frequency and magnitude. J. Acoust. Soc. Am. 2000, 107, 620–624. [Google Scholar] [CrossRef] [PubMed] [Green Version]
- Jones, L.A.; Lederman, S.J. Human Hand Function; Oxford University Press: New York, NY, USA, 2006; ISBN 9780195173154. [Google Scholar]
- Goldstein, E.B. Wahrnehmungspsychologie; Spektrum Akademischer Verlag: Heidelberg, Germany, 1997; ISBN 3-8274-0189-5. [Google Scholar]
- Gescheider, A.; Bolanowski, A.J.; Hardick, K.R. The frequency selectivity of information-processing channels in the tactile sensory system. Somatosens. Mot. Res. 2001, 191–201. [Google Scholar] [CrossRef] [PubMed]
- Gescheider, G.A.; Bolanowski, S.J.; Pope, J.V.; Verrillo, R.T. A four-channel analysis of the tactile sensitivity of the fingertip: Frequency selectivity, spatial summation, and temporal summation. Somatosens. Mot. Res. 2002, 19, 114–124. [Google Scholar] [CrossRef] [PubMed]
- Morioka, M.; Griffin, M.J. Independent responses of Pacinian and Non-Pacinian systems with hand-transmitted vibration detected from masked thresholds. Somatosens. Mot. Res. 2005, 22, 69–84. [Google Scholar] [CrossRef] [PubMed] [Green Version]
- Merchel, S.; Altinsoy, M.E. Psychophysical comparison of the auditory and tactile perception: A survey. J. Multimodal User Interfaces 2020, 14, 271–283. [Google Scholar] [CrossRef]
- Lenhard, W.; Lenhard, A. Berechnung von Effektstärken. Available online: https://www.psychometrica.de/effektstaerke.html (accessed on 12 March 2021).
Figure 1.
Vehicle before driving over a falling edge of 30 mm [19].
Figure 1.
Vehicle before driving over a falling edge of 30 mm [19].

Figure 2.
Representative vertical acceleration (filtered) at seat reference point in suspension mode normal (Left) and in suspension mode sport (Right) when driving over 30 mm falling edge with the rear wheels, visualized with Artemis Suite (HEAD acoustics).
Figure 2.
Representative vertical acceleration (filtered) at seat reference point in suspension mode normal (Left) and in suspension mode sport (Right) when driving over 30 mm falling edge with the rear wheels, visualized with Artemis Suite (HEAD acoustics).

Figure 3.
Representative sound pressure level at the driver’s ear, volume 1 (Left) and volume 2 (Right), when driving over 30 mm falling edge with the rear wheels; visualized with Artemis Suite (HEAD acoustics).
Figure 3.
Representative sound pressure level at the driver’s ear, volume 1 (Left) and volume 2 (Right), when driving over 30 mm falling edge with the rear wheels; visualized with Artemis Suite (HEAD acoustics).

Figure 4.
Intensity perception of tactile impulses in the suspension mode normal (Left) and in the suspension mode sport (Right) for two volumes, rating scale ranging from 0 “not perceptible” to 5 “very strongly perceptible”.
Figure 4.
Intensity perception of tactile impulses in the suspension mode normal (Left) and in the suspension mode sport (Right) for two volumes, rating scale ranging from 0 “not perceptible” to 5 “very strongly perceptible”.

Figure 5.
Intensity perception of audible impulses for volume 1 (Left) and for volume 2 (Right) in the two suspension modes normal and sport, rating scale ranging from 0 “not perceptible” to 5 “very strongly perceptible”.
Figure 5.
Intensity perception of audible impulses for volume 1 (Left) and for volume 2 (Right) in the two suspension modes normal and sport, rating scale ranging from 0 “not perceptible” to 5 “very strongly perceptible”.

Table 1.
Parameters of the tactile impulse.
| Tactile Impulse | Figure 2 (Left) | Figure 2 (Right) |
|---|---|---|
| Suspension mode | Normal | Sport |
| Δ Peak-to-peak value | Reference | +12.5% (SD < 4%) |
| Duration | 0.069 s (SD < 0.003 s) | 0.069 s (SD < 0.003 s) |
Table 2.
Parameters of the audible impulse.
| Audible Impulse | Figure 3 (Left) | Figure 3 (Right) |
|---|---|---|
| Sound volume | 1 | 2 |
| Δ Sound pressure level (Level vs. Time, A-Weighting, Fast) | Reference | +9 dB |
| Dominant frequency | ≈100 Hz | ≈100 Hz |
Table 3.
Statistical evaluation: Influence of audible impulses on the perception of tactile impulses (N: Normal, S: Sport).
Table 3.
Statistical evaluation: Influence of audible impulses on the perception of tactile impulses (N: Normal, S: Sport).
| No. | Suspension | Volume | Statistical Power | Significance | Effect Size | Interpretation |
|---|---|---|---|---|---|---|
| padj | d | acc. to Cohen [20] | ||||
| 1 | N↔N | 1↔2 | <0.8 | >0.05 | - | - |
| 2 | S↔S | 1↔2 | <0.8 | >0.05 | - | - |
| 3 | N↔S | 1↔1 | >0.8 | <0.05 | >1.0 | Large |
| 4 | N↔S | 1↔2 | >0.8 | <0.05 | >1.0 | Large |
| 5 | N↔S | 2↔1 | >0.8 | <0.05 | >1.0 | Large |
| 6 | N↔S | 2↔2 | >0.8 | <0.05 | >1.0 | Large |
Table 4.
Statistical evaluation: influence of tactile impulses on the perception of audible impulses (N: Normal, S: Sport).
Table 4.
Statistical evaluation: influence of tactile impulses on the perception of audible impulses (N: Normal, S: Sport).
| No. | Volume | Suspension | Statistical Power | Significance | Effect Size | Interpretation |
|---|---|---|---|---|---|---|
| padj | d | acc. to Cohen [20] | ||||
| 1 | 1↔1 | N↔S | <0.8 | >0.05 | - | - |
| 2 | 2↔2 | N↔S | <0.8 | >0.05 | - | - |
| 3 | 1↔2 | N↔N | >0.8 | <0.05 | >1.0 | Large |
| 4 | 1↔2 | N↔S | >0.8 | <0.05 | >1.0 | Large |
| 5 | 2↔1 | N↔S | >0.8 | <0.05 | >1.0 | Large |
| 6 | 1↔2 | S↔S | >0.8 | <0.05 | >1.0 | Large |
Publisher’s Note: MDPI stays neutral with regard to jurisdictional claims in published maps and institutional affiliations. |
© 2021 by the authors. Licensee MDPI, Basel, Switzerland. This article is an open access article distributed under the terms and conditions of the Creative Commons Attribution (CC BY) license (https://creativecommons.org/licenses/by/4.0/).
Share and Cite
MDPI and ACS Style
Festa, M.; Stalter, F.; Tavornmas, A.; Gauterin, F. Human Response to Vehicle Vibrations and Acoustics during Transient Road Excitations. Vibration 2021, 4, 357-368. https://0-doi-org.brum.beds.ac.uk/10.3390/vibration4020023
AMA Style
Festa M, Stalter F, Tavornmas A, Gauterin F. Human Response to Vehicle Vibrations and Acoustics during Transient Road Excitations. Vibration. 2021; 4(2):357-368. https://0-doi-org.brum.beds.ac.uk/10.3390/vibration4020023
Chicago/Turabian StyleFesta, Maurizio, Frank Stalter, Arm Tavornmas, and Frank Gauterin. 2021. "Human Response to Vehicle Vibrations and Acoustics during Transient Road Excitations" Vibration 4, no. 2: 357-368. https://0-doi-org.brum.beds.ac.uk/10.3390/vibration4020023