
Sensor Networks for Structures Health Monitoring: Placement, Implementations, and Challenges—A Review


1
Mechanical Engineering, American University of Beirut, Beirut 1107 2020, Lebanon
2
Civil Engineering, Monash University, Melbourne 3800, Australia
3
School of Civil, Environmental and Mining Engineering, University of Adelaide, Adelaide 5005, Australia
4
Institute of Fluid Flow Machinery, Polish Academy of Sciences, 80-231 Gdańsk, Poland
*
Author to whom correspondence should be addressed.
Vibration 2021, 4(3), 551-585; https://0-doi-org.brum.beds.ac.uk/10.3390/vibration4030033
Submission received: 23 May 2021
/
Revised: 7 July 2021
/
Accepted: 8 July 2021
/
Published: 10 July 2021
(This article belongs to the Special Issue Health Monitoring and Non-Destructive Evaluation of Structures)
Abstract
:The development of structural health monitoring (SHM) systems and their integration in actual structures has become a necessity as it can provide a robust and low-cost solution for monitoring the structural integrity of and the ability to predict the remaining life of structures. In this review, we aim at focusing on one of the important issues of SHM, the design, and implementation of sensor networks. Location and number of sensors, in any SHM system, are of high importance as they impact the system integration, system performance, and accuracy of assessment, as well as the total cost. Hence we are interested in shedding the light on the sensor networks as an essential component of SHM systems. The review discusses several important parameters including design and optimization of sensor networks, development of academic and commercial solutions, powering of sensors, data communication, data transmission, and analytics. Finally, we presented some successful case studies including the challenges and limitations associated with the sensor networks.
1. Introduction
Continuous structural health monitoring (SHM) systems for aerospace, mechanical and civil structures have great potential to form a major area in the field of damage detection, life assessment, and failure prediction. Knowing the integrity of in-service structures on a continuous real-time basis is crucial for manufacturers, maintenance teams, and operators. SHM is an area of growing interest and worthy of new and innovative approaches. Continuous monitoring requires the constant collection of data from sensors that are mounted or embedded in the structure. The collected data is then analyzed to detect the presence of any possible flaws; moreover, the remaining life of the monitored system can be predicted. The advancement in sensor technology, in its various forms (wired and wireless), as well as the complementary hardware, has led to major developments of smart systems in many fields such as the automotive, aerospace, and civil industries [1]. The presence of a wide range of sensors at a reduced cost resulted in significant work in the real-time monitoring of components and structures in the last two decades. They aimed at extending the lifetime, reducing the associated maintenance costs, and ensuring a high level of public safety [2].
Figure 1 shows the basic components of an SHM system, which combines many elements under one umbrella and each of these elements requires a major development towards a successful and robust implementation. This includes sensor selection, sensor placement, data acquisition and communication, data analytics, and visualization [3].
The selection of a wired or wireless sensor needs to meet certain criteria before classifying it as viable for SHM applications. Many factors contribute to the selection process of a sensor node including, but not exclusively, the application, operational environment, the measurement type (strain, vibration, temperature, ultrasonic, etc.), sensor size and range, power consumption, robustness, and the lifetime of the sensing element [4]. Moreover, for wireless sensors, each node must contain several components for efficient and reliable usage that includes power management/source system, a sensing unit, a signal processing unit, and a microcontroller [5].
The number and locations of sensors needed to provide full coverage of a structure require a deep knowledge about the nature of operation of the structure to be monitored and the type of readings to be collected [6,7]. This may require the development of optimization algorithms to be implemented or spontaneous decisions based on experience from similar structures. Although unnecessary or redundant sensors within an SHM system increase the total cost due to the installation, maintenance, and additional weight on sensitive structures [6], spare sensors mounted on a structure may make the system more robust, in case of failure of critical sensing nodes.
Data acquisition depends on the trigger of the sensing element and the rate needed to capture the physical behavior of the monitored structure. Communication between sensors and whether this is wired or wireless depending on the complexity and nature of the monitored structure. For instance, with complex steel structures, wireless communication may not be viable. Data, in this case, can then be stored onboard or sent remotely to a server for storing and processing [2].
Signal processing of the data collected, after being stored, is of high importance. This allows extraction of the damage-sensitive features for identifying the presence of damage within the structure, as well as provide an assessment of its current condition. Various methods have been developed including frequency domain analysis, wavelet decomposition, and Hilbert transforms [8]. In the last three decades, many researchers developed and adopted artificial neural networks [8], machine learning models [9,10], probabilistic models [11,12], and auto-regression [13] algorithms for data processing and flaw detection and identification.
The main objective of this review paper is to highlight the key components that must be considered during the design of a sensor network, taking into account the impact that they may have on the overall design of an SHM system. In the following sections, we will discuss several important parameters including the design and optimization of sensor networks, development of academic and commercial solutions, powering of sensors, data communication, transmission, and data analytics. Finally, we present some successful case studies including the challenges and limitations associated with the presented sensor networks.
2. Design Requirements for Sensor Networks
Regardless of the technique used to monitor a structure, whether it is vibration-based, strain-based, ultrasonic-based, etc. [6], or combined, there are some common criteria that must be followed when designing a sensor network. In this section, we will identify the basic requirements and challenges, and further, we will present a short case study.
The selection of the type and the size of the sensor elements/nodes in the network is a major component that needs to be decided upon before considering other design requirements within a sensor network. The type of sensors highly depends on the application and the structure to be monitored. For instance, when using an accelerometer to measure the level of vibration, the interest will be more on understanding the global behavior of the structure [14], i.e., the shift in the modal frequencies that may be used to identify the presence of damage. Vibration-based methods have been implemented already on many structures, mainly civil structures, albeit their lack in providing a qualitative assessment about the health state of the structure [2]. On the other hand, when strain sensors (using strain gauges or fiber optic sensors) or ultrasonic transducers are considered, the focus will be more on the local assessment of any damage that may be present within the structure [15,16]. These techniques can detect small surface and embedded defects such as corrosion, fatigue cracking, impact damage, etc. [16].
Energy supply for the sensors in the network is mandatory for its reliable and efficient operation. With the presence of an energy source, powering the sensor will not be an issue despite the level of energy needed and the operation time. However, in the absence of an energy source, in particular when monitoring structures in rural areas, an alternative energy source must exist. Internal batteries may be an option, keeping in mind the limited lifetime that the batteries have before needing to be replaced. The energy consumption of the node, when an internal battery is used, brings several challenges such as the duration and frequency of data collection. A microcontroller can regulate the sleep and wake-up time for the sensor during or when an incident happens such as traffic or crowd loading on a bridge, wind load on a high-rise building, or a bird strike on an aircraft nose. An alternative source for powering sensors, that has attracted the attention of many researchers working in the area of SHM, relied on the harvesting of various forms of green energy such as light using photovoltaic cells and kinetic energy using piezoelectric materials or electromagnetic devices [17].
When it comes to data communication, sensors can be wired or wireless depending on the need. Normally wired sensors acquire data using an acquisition system and the data is transmitted to an on-site PC through the LAN. Later the data can be transmitted to a central server [18]. The onsite computers may use standard TCP/IP communication protocols and therefore can communicate across a wide area network such as the internet using standard equipment including routers and secure VPNs. Onsite can be an optional network services computer to provide NTP services (if very accurate time synchronization between sensing nodes is required) and onsite data caching.
Wired sensors may not be ideal when dealing with large structures such as pipelines due to the complexity of the wiring system. The development in wireless sensing technologies led to a major advancement in the field of SHM in particular when instrumenting large and complex structures, due to their advantages related to the ease of deployment and the ability to do local processing. Many hardware has been developed to satisfy the needs for SHM systems (such as NI, HBM, LORD Sensing MicroStrain, etc.). Besides, many communication protocols have been developed and proven to be reliable for SHM applications based on the IEEE 802.15.4 communication standard [19]. This will be elaborated on more in the later sections.
Data transmission relies highly on the type of sensors used. Continuous data transmission is plausible when wired sensors are used, yet the challenge becomes in the data management and storage, as well as the ability to extract the indicative features that can be used for structural or operational assessments. On the other hand, wireless sensors are often powered using embedded small batteries, and therefore, energy consumption should be minimized. This is usually achieved by reducing radio communication via controlling the duty cycle, as well as the in-network processing. Duty cycles focus on the sleep and wake-up time of the sensors, while in-network processing focuses on the amount of data to be transmitted that may be achieved through data compression [20]. Data loss during transmission, resulting from data compression, is a common issue and must be well thought of [21]. Various types of lossless data compression algorithms are available including Huffman’s coding, Run Length encoding, Dictionary coders (LZW), etc. [22].
Data transmitted is classified as confidential, and therefore, security issues with wireless sensor network (WSN)-based SHM systems must be addressed. Many research scientists and engineers have tackled the issues of eavesdropping, traffic analysis, disruption of the sensor application, or hijacking [23]. ZigBee has proven to be an effective, feasible, and reliable wireless sensor technology for the application in SHM [24]. In terms of security, ZigBee incorporates all the security mechanisms proposed by the IEEE 802.15.4 (such as message encryption) [25]. Moreover, given that ZigBee has been developed to support lower data rates and low power transmission, the increase in the number of nodes can be successfully implemented and devices run for years on inexpensive batteries.
Once the data has been transmitted to the servers, it must be stored efficiently for ease of access when queries are executed. Therefore, an appropriate database tool must be selected. Relational database management systems (RDBMS) and structures query language (SQL) have been widely used and implemented in many SHM systems due to their reliability and extensive user base. RDBMS may suffer in term of writing and reading, and scalability, hence NoSQL (not only SQL) have been proposed. NoSQL is known for its advanced performance and ability to support more data schema [26].
Finally come the data analytics and interpretation of data, various techniques, and methods based on signal processing and data-driven models have been developed for this purpose. This component of the SHM system highly depends on the nature of the structure, the type of data collected, and most importantly the sensitivity of the measurements to a given fault or malfunction in the operation of the system monitored.
The designer of a sensor network needs to pay attention to the main requirements of a robust network which mainly involves the sensor selection, placement of sensors, methods to power sensors, data transmission, storage, and data analytics. The integration of existing technology is a major challenge to achieve an efficient sensing system, hence efforts are required to develop sensor nodes that can provide different types of measurements, also nodes that are self-powered and can withstand severe weather conditions.
3. Modelling and Optimization for Sensor Network Design
Deciding about the number and locations of the selected sensors are two factors of high importance as this will significantly impact the robustness of the monitoring system and the cost associated with data transmission, data management, and storage. These should be taken into account when both wired and wireless sensors are used. The main focus in this section is the placement of ultrasonic transducers towards embedding or bonding them on structures of interest for SHM applications. Also, the placement of other types of sensors including accelerometers and strain gauges will be briefly touched on.
3.1. Sensors for Measuring Vibration
One vibration sensor (single or multi-axis accelerometer) in some cases may provide the information needed, for instance, in the case of determining the global modal frequencies and damping on a bridge structure. However, more sensors are needed when trying to construct the mode shapes. The main requirement for a successful application of the vibration-based methods is the ability to identify the range of the targeted natural frequencies and mode shapes, as well as the ability to overcome spatial aliasing [6]. Kammer was one of the first researchers to look at sensor placement for modal identification on large structures [27]. The method developed by Kammer relies on ranking the sensor location according to the linear independence of the target modal partitions. Through an iterative process, sensors with minimum contribution are eliminated from the network, ultimately aiming to maximize the trace and determinant and minimize the condition number of the Fisher information matrix (FIM). After solving the eigenvalue problem, the effective independence (EFI) may be calculated. The major shortcoming with the EFI-based approach is that the sensor location might be associated with little energy content, hence a high signal-to-noise ratio. To minimize this effect, the kinetic energy (KE)-based approach is proposed. The KE approach is defined as the selection of the candidate based on modal KE distribution that leads a measure of the dynamic contribution of each physical degree of freedom to each of the target mode shapes.
Besides, many approaches were developed for this purpose based on the information theory, including the information entropy metrics [28]. Another metric that can be used to assess spatial aliasing in the mode shape measurement is based on the modal assurance criterion (MAC) or the condition number of the mode shape matrix, which measures the extent of linear dependence between mode shape vectors [29].
3.2. Sensors for Measuring Strain
When trying to monitor a fatigue crack on a critical component, strain gauges, fiber optic sensors (FOS) or other types of sensing devices can provide rich information about the local behavior within the component. The sensors are mounted directly to the region of interest, presuming access is feasible. The number of sensors, in this case, depends on engineers, who must decide the locations to be monitored on the structure. When the access is impossible, the strain in the area of interest can be approximated by measuring the strain in a close neighborhood. The approximation can be based on the numerical model updating using experimental data. The mean square error or the mean absolute error between the actual and the predicted strain level can provide a qualitative description of the quality of the estimation.
3.3. Sensor for Measuring Ultrasonic Wave
One of the main problems that appear when elastic waves are applied for monitoring structures involves placing the transducers that will generate and record the waves. Designing a correct network is the first step for accurate damage detection and localization. Methods of SHM using elastic waves can be classified as either pulse-echo or pitch-catch. The first type takes advantage of damage-reflected waves. A wave propagating from the actuator reflects from the damage site and is recorded by the receiver. Pitch-catch methods look into changes of wave characteristics (e.g., propagation velocity, attenuation, mode conversion) on the direct path between actuator and receiver. Tomography is one of the well-known examples of the pitch-catch approach. Pulse-echo methods are used successfully with both distributed and concentrated networks. Conversely, pitch-catch methods require a distributed configuration. Both concentrated and distributed sensor systems have a common drawback. They are unable to locate damage in the close vicinity of the transducer or just under it. The solution for this is the electromechanical impedance (EMI) method. It uses the same piezoelectric transducers and the local damage information is extracted from the analysis of the sensor electrical characteristics [30,31].
When planning to use sensors in an active mode, which applies to ultrasonic sensors and piezoelectric (PZT) wafers, in particular, providing full coverage while maintaining a minimum number of sensors is critical. Many scholars have focused on determining the minimum number of PZT wafers required to achieve full structure coverage by developing algorithms that follow an information-based approach that depends on the experimental conditions of each PZT wafer.
Starting with iterative optimization, it is also known as the “trial and error” optimization approach. The process starts with a fixed number of PZT wafers distributed over the entire network. Then it eliminates one PZT wafer at a time and assesses the new coverage. An opposite approach for the iterative optimization method starts by finding the optimal 1-PZT wafer patterns over the plate surface and evolves by adding PZT wafers and evaluating the optimal coverage in each case [29]. Evaluation of the effectiveness of the iterative optimization approach is defined by a measure of fitness that can be considered as the normalized mean square error (MSE) between the desired network responses and the initial network training responses.
Further, combinatorial optimization is usually expressed in the forms of quadratic non-linear programs. A traditional information-based approach for a PZT wafer placement problem places PZT wafers near the anti-nodes of the low-frequency vibration modes of the system. The distribution of PZT wafers is assessed in terms of the covariance matrix [C], which is the inverse of the FIM [F]. Usually, minimizing [C] maximizes [F], and the outcome is the determinant of the matrix [F]. PZT wafer location process is guided by a finite element (FE) model, and they are located according to their average driving point residue (ADPR) [32]. Sequential deletion of the PZT wafers leaves behind the wafers that produce the highest off-diagonal matrix. A third information-based approach for the PZT wafer optimization problem is effective independence (EI) [27]. It is based on the EI distribution vector E. The optimization process is iterative; terms in E are sorted and the least important PZT wafer is deleted, and the determinant of the FIM is maintained.
Moreover, genetic algorithms (GA) have demonstrated a high potential for sensor placement. Genetic algorithms are optimization algorithms that work by encoding the sets of possible parameters in a solution space as a gene [29]. An effective method based on genetic algorithms has been presented by Jin et al. [33] to minimize the total distance between the sensors, of a wireless sensor network, and the sink (data collector). This would allow for energy efficiency and a longer living sensor network. The authors have used the GA-based approach to determine both the number and locations of the cluster-heads, to minimize the communication distance within the sensor network. Also, they have proposed an improved GA, in which a two-gene-bit crossover and a two-gene-bit mutation are applied to the parent strings.
Mallardo et al. [34] have presented a passive sensing algorithm based on GA and artificial neural network (ANN) techniques, to optimize sensor positions for impact detection on composite structures. The optimization process took into consideration the uncertainty due to environmental conditions and the possibility of malfunctioning of one or more sensors. Flynn and Todd [35] proposed an approach for optimal actuator and sensor placement for active sensing-based SHM. Using a detection theory framework, they established the optimum configuration as the one that minimizes Bayes risk. The detector incorporates a statistical model of the active sensing process that accounts for both reflection and attenuation features and implements pulse-echo and pitch-catch schemes, further taking into account the line-of-sight. The optimization space was searched using GA with a time-varying mutation rate.
Worden and Burrows [29] compared different optimization approaches for fault detection in a rectangular plate. The objective function used in the optimization was selected for a fault detection procedure based on ANN. A similar approach based on GA was proposed for passive sensing [36]. The proposed optimization algorithm for passive sensing maximizes a fitness function that is based on the probability of detection (POD) of the proposed impact detection method [37]. In a study by Croxford et al. [38], the effect of the pattern of sensor layout (i.e., triangle, rectangle, trapezoid) was investigated, and it was found that a square or hexagon configuration provided a close to optimum performance. Guo et al. [39] presented an improved GA for optimal sensor placement of a metallic truss structure. Yi et al. [40] proposed a novel optimal triaxial sensor placement approach and a novel distributed wolf algorithm to improve the optimization performance in identifying the best sensor locations. Thiene et al. [41] proposed a sensor placement optimization approach for fault detection and localization techniques using guided waves based on maximum area coverage (MAC) within a sensor network. The advantage of this approach is that it is independent of the details of the damage detection algorithm and does not require the determination of a POD function for a vast number of damage scenarios. Moreover, it can be applied to geometrically complex structures with pitch-catch configuration and any active sensing procedure based on time of flight (ToF) of damage reflected waves. A full probabilistic method based on the Bayesian inverse problem was proposed by Cantero-Chinchilla et al. [42] to rigorously provide a robust estimate of ToF for each sensor independently. Then, the prediction was introduced as an input to the Bayesian inverse problem of damage localization. Manohar et al. [43] explored optimized sensor placement for signal reconstruction based on a tailored library of features extracted from training data. Zhang et al. [44] explored the fundamental limits of sensor network lifetime and Salmanpour et al. [45] proposed a genetic algorithm to determine the optimal locations of transducers leading to a coverage index map.
Chinchilla et al. [46,47] used the value of information and the relative expected information gain as a criterion to optimize the number and position of sensors based on a set of potential sensor configurations. An objective function was also introduced which combined a measure of parameter uncertainty, the expected information entropy, and the cost of the sensing elements. Moreover, Shoja et al. [48] proposed an algorithm to design an array of actuating transducers on any arbitrary shaped domain, to provide a uniform energy distribution, and it was validated on an aluminum structure.
The optimization of the sensor network is associated with boundary conditions and constraints that are mainly imposed by the type of sensors and their mode of operation. For instance, PZT wafers communicating in a pulse-echo mode can propagate for a specific distance depending on the attenuation, furthermore a limited coverage around the sensing path, hence this should be taken into account while developing an algorithm for sensor optimization.
Also, it would be an advantage to keep in mind the algorithm to be implemented for damage detection and assessment as this will also impose some additional inputs. For instance, the use of intersecting sensing paths will assist in damage localization. Ultimately, it is important to think of both the sensor type and the algorithm to be used to process the data when designing a sensor network [7,49].
An additional dimension that should be thought of is the robustness of the network and the performance of the algorithm in case of a failing sensor and how this will impact the overall performance. Hence, it is recommended to identify the most critical sensors within the network and ensure that there is a redundant sensor in their neighborhood. Moreover, having multiple sensor networks covering the same region will provide extra, however, the networks should work independently. In this case, coverage is maintained when one of the networks fails.
Researchers should focus on the development of simple and feasible optimization approaches to help designers of sensor networks decide about the location and number of sensor networks, in particular over large structures. Communication between multiple sensor networks will have a major effect on the overall robustness of the network, also will minimize the number of sensor nodes to provide coverage, and last but not least minimize the impact of failing sensors within the network.
3.4. A Case Study for Sensor Network Optimization—PZT Wafers
A recent study by Ismail et al. [7] developed a model for sensor network optimization based on genetic algorithms. The algorithm mainly focuses on the placement of PZT wafers that are operating in a pitch-catch mode. The model discretizes the area under study into a finite number of control points, also defines the level of coverage (number of sensing paths intersecting at every control point), and defines a preliminary solution. Feeding the optimizer with a good initial solution will ensure that the optimizer will not get stuck on a local optimum with poor coverage. The main input parameters are the propagation distance of the waves and the coverage around the sensing path. The optimization algorithm was packaged in an open-source graphic user interface—https://drive.google.com/drive/folders/1yg130-HqyIKL00k1xk1LXLQtZnAdw50I (accessed date: 9 July 2021, Figure 2).
The model was also validated on a large metallic structure, the cargo compartment door of an Airbus A330 aircraft, shown in Figure 3. The cargo door is about 2740 mm by 2385 mm and a total weight of 182.2 kg. Based on the experimental analysis, it was demonstrated that the guided waves in this particular structure, excited at a relatively high frequency between 150 kHz and 300 kHz, can propagate with a minimum distance of 1–1.5 m and has a coverage of 30 mm around the sensing path.
Starting with the 70 sensors, the PZTs were uniformly distributed on the surface of the cargo door. The preliminary coverage was calculated to be 81%, as shown in Figure 4a. After performing the optimization (Figure 4b), the coverage was improved by about 10% to 90.35%.
Experimental validation on a part of the cargo door was performed using ultrasonic excitations at different frequencies. Artificial damages were detected and localized with an error not exceeding 4% of the maximal distance in the geometry [7].
Data Fusion—data collected from a sensor network can be fused to identify the location and extent of the damage. Several approaches have been developed and can be found in the literature. Zhou et al. [51] developed probability-based diagnostic imaging (PDI). Using both pitch-catch and pulse-echo configurations in an active sensor network, hybrid signal features were determined. The hybrid image fusion was shown to enhance damage detection by reducing inaccurate perceptions and noise from individual sensing paths. Wang et al. [12] adopted a reconstruction algorithm for probabilistic inspection of damage (RAPID) for localizing damages in aluminium plates. Applying the Shannon entropy optimization, the most relevant and optimal mother wavelet for signal processing was calibrated. In the context of PDI, Wu et al. [52] determined empirically the parameters including the frequency, the elliptical size of the distribution area, the selection of certain damage indexes, and the sensing paths of the network. This results in limitations when applying the method for real-life damage localization practices. To eliminate the effect of selecting the frequency, multiple frequencies were considered in a fusion image approach. The robustness of this fusion was evaluated in a histogram plot showing the effect of the fusion as compared to the individual behavior.
4. Commercial and Academic Sensor Systems
4.1. Commercial Systems
Many non-destructive testing (NDT) techniques have been developed and are commonly used to control the quality of structural components after manufacturing, also to check structural integrity during the life of service. GE measurement and control, Olympus, M2M (Eddyfi), and Advanced OEM solutions, besides others, have developed general ultrasonic techniques for flaw detection/sizing in addition to advanced methods like the time-of-flight diffraction (TOFD), total focusing method (TFM) and the phased array systems. Ashtead, Oceanscan, Olympus, and GE have further developed solutions, which are also commercially available, based on magnetic particle inspection, eddy current tools, and x-ray tools [53]. Table 1 summarizes some of the most common technology benchmark techniques and solutions available in the market, including IT (infrared thermography), EM (electromagnetic), ECT (eddy current testing), UFD (ultrasonic flaw detection).
The key players in the SHM market such as Sixense and COWI A/S (and others such as Geocomp Corporation, Geokon Inc., Hottinger Baldwin Messtechnik GmbH (HBM), Sodis Lab, Strainstall UK Ltd., Digitexx Data Systems Inc., Geosig Ltd., Acellent Technologies, Inc.), provide solutions (wired and wireless) for monitoring the integrity of structures to complement NDT techniques. The main solutions provided consist of sensors, hardware, and software. Processing and interpretation of abnormal behavior are structure-dependent which demands notable efforts to complete.
The industry, over the past two decades, has developed many commercial wireless systems for the application in SHM and other purposes such as communication. National Instruments (NI) offers two products known as the DAC which is based on IEEE 802.11 and the WSNs that are based on IEEE 802.15.4. The main difference between the two is the specifications in terms of bandwidth, power requirement, and security. Both solutions can be integrated into LabVIEW for ease of customization. Various types of sensors can be integrated into the wires nodes for humidity, temperature, pressure, water quality measurements, etc. [54]. LORD MicroStrain has developed a wide range of wireless sensor nodes and wireless gateways for a fully integrated wireless SHM system. Their sensing units range from a single channel to a multi-channel and they are used for the measurement of acceleration, strain, temperature, pressure, torque, etc. [55]. Moreover, similar products can be found at OMEGA [56] and ADVANTECH [57].
4.2. Prototypes—Academics’ Contribution
A vast amount of sensor network solutions has been developed in academia. Some of them are further developed and are commercially available. One of the well-known examples is the Stanford Multiactuator-Receiver Transduction (SMART) layer concept that was developed at Stanford University (Stanford, CA, USA) and later commercialized by Acellent Technologies, Inc. [58]. The thickness of the SMART layer ranges from 0.050 to 0.25 mm determined mostly by the type of piezoelectric transducers used. The layer itself is made of flexible printed circuit material with an etched copper circuit on a polyimide substrate with a cover layer. The copper circuit connects the piezoelectric sensors, allowing to have only one localized site where the layer is connected to the signal generation/acquisition device. The SMART layer concept allows the deployment of a sensor network on a surface as well as embedding it in a layered composite. Generally, the surface mounting can be made at any stage of structure lifetime while the integration into composite structures needs to be made at the manufacturing stage providing a built-in non-destructive assessment of the structure allowing for both impact and damage detection since the sensor network can work both in passive (sensing only) and active modes (excitation and sensing). Such a network layer gives the ability to monitor the structure condition while the structure is in-service with advantages such as ease of installation, signal consistency, sensor reliability, and electromagnetic shielding.
What is also worth noticing is that this sensor layer approach is open and besides piezoelectric transducers allow for other types of sensors such as fiber optic sensing to be integrated, extending the monitoring capabilities of the layer. Such a hybrid network combining piezoelectric sensors and fiber Bragg grating (FBG) sensors was proposed in [59]. This network was tested for debonding detection in composite plates. Such an approach has some advantages over using only piezoelectric sensors since there is no coupling between sensors (FBG) and actuators (piezoelectric). The employment of FBG allows for long-distance sensor signal transmission which helps to overcome long-distance transmission loss that is a drawback in most electronic-based signals. Moreover, the fiber optic-based approach allows for the multiplexing of a large number of sensors on a single optical fiber and is immune to electromagnetic interference. The embedding of the hybrid layer into composite structures is even less intrusive since fiber optics can be thinner than the piezoelectric sensors, so the degradation of structural mechanical performance should have less impact.
Another approach for a sensor network was proposed—the stretchable sensor network [60]. The leading idea behind it is to have a network that can be deployed on a large area but before deployment, it has compact dimensions (Figure 5a). The developed stretchable network [60] was based on a polymer film with distributed sensors that can be stretched and then embedded into composite materials spanning an area several orders of magnitude greater than its original size Figure 5b). While developing the concept, one of the goals was to make the embedding process robust by preventing the failure that can be caused by the strains occurring during the stretching process and avoid out-of-plane deformations of the layer. The method of manufacturing was based on nonstandard CMOS and MEMS processes in which resistance temperature detectors (RTDs), electrodes, organic diodes, and dielectrics are integrated into the network on a spin-coated polyimide substrate. Such a prepared stretchable network can survive the composite curing process (177 °C and 186.2 kPa for 10 h). Moreover, the network ensures electrical insulation allowing for embedding not only in non-conductive but also conductive materials such as carbon fiber reinforced polymers (CFRP). The stretchable sensor network was tested by embedding it into glass fiber reinforced polymer material (GFRP) [60].
Having a sensor network is only a part of success. There is a need to effectively process the data gathered by the sensors. In the traditional approach, damage influence is sought by comparing the test data with the baseline data. Unfortunately, there are some drawbacks to such an approach. The baseline data could be unavailable or already contain damage scattered signals if the damage was there before the deployment of the sensor network. Moreover, such a process can also be affected by environmental and operational variability. So the authors of [61] proposed the development of a baseline-free damage diagnosis technique based on time-reversal theory. They introduced an improved piezoelectric actuators/sensor array arrangement to separate the scattered signals from the sensing signals. This new arrangement places one actuator very close to one sensor (Figure 6). This helps to overcome the problem that the excitation signal overlaps with the signals reflected from the scatters and it is impossible to separate them from each other. Since in the new approach the distance between the actuator and the sensor is very short, the wave directly from the actuator only travels a very short time. It appears almost at the very beginning of the sensing signal and what is important is that the propagation distances of the scattered waves do not change too much. In this way, the time separation of the wave signals is achieved. The arrangement takes advantage of the time-reversal method to detect and visualize the damage location. This method focuses the scattered waves at their sources. Such a source is the damage of course but also boundaries that cause strong wave reflections, so the algorithm output is dealt with care to avoid focusing on the waves at the boundaries. The research to validate the proposed method was conducted experimentally with quasi-isotropic composite plates [61].
Another innovative approach for determining the position as well as the severity of the damage was introduced based on a dual-sensor network [62]. The proposed approach employs two linear sensor arrays supported by a novel transmitter beam-forming and weighted image fusion (TB-WIF)-based MUltiple SIgnal Classification (MUSIC) algorithm. The network was successfully applied for corrosion monitoring at five levels. The localization error was below 2 cm in length and 2° in angle. The authors underlined that not only the dual network approach is precise but it is compact so the sensors do not need to be deployed in the form of a dense mesh.
Distributed sensor systems are also used not only for damage location but in damage identification for crack reconstruction [63]. The other kind of distributed network is the tomography approach in which a localized area surrounded by sensors is monitored [64]. The image with damage information is generated using signals from all possible transducer pairs. The tomography is computationally and experimentally intensive because it is desirable to employ a large number of transducers to obtain a satisfactory result. This makes the method most appropriate for monitoring hot spots particularly endangered by damage occurrence. The threat may involve the debonding of stiffening elements from the skin [65]. It should be underlined that most of these academic solutions for sensor networks were proven to be effective for rather simple and idealized structural parts. Appling them to the real parts full of rivets, bolts, stiffeners, etc. is still an open research subject.
5. Sensor Networks—Testing, Fault, and Robustness
The testing of sensor arrangement and dedicated signal processing algorithms are crucial issues at the initial stage. This is mainly done in a controlled laboratory environment. If the developed solution is working at this stage, then it should be further tested and developed as the goal is to have a real structure with the sensor network exploited under its normal working conditions. In the case of the SMART layer, the appropriate tests were conducted. The composite specimens with and without embedded SMART layer underwent mechanical tests [58]. These testing should give an insight into the assessment of the integrity of a structure with such an embedded sensor network. The SMART layer (0.15 mm thick) was located at the lower 0/90 interface. The test conducted on three samples showed that the presence of the SMART layer does not noticeably affect the strength of the host composite structure. The sample cross-section was examined as well revealing that delamination in the specimens without the embedded layer occurs at the lower 0/90 interface as expected, due to the high interfacial shear stresses at the ply-group interface. While in the specimens with an embedded layer there is no delamination at the before-mentioned location. The actual delamination occurs one or two plies away from this interface, so the SMART layer is not causing the delamination. Moreover, the SMART layer was applied to in-service aircraft [66]. Acellent Technologies (Sunnyvale, CA, USA), the US Army Research Laboratory (ARL, Adelphi, MD, USA), and the Aero-Flight Dynamics Directorate (AFDD, Moffett Field, CA, USA) are exploiting the layer on an H-60 Blackhawk helicopter metal structures since 2010 to validate their integration and long-term operation and survivability on the rotorcraft. Acellent also realized small business innovation research (SBIR) projects with the US Navy for SHM systems on composites, which are supported by H-60 manufacturer, Sikorsky (Stratford, CT, USA), for future implementation on the more composites-intensive CH-53K [66].
Apart from the mechanical load influences on the sensor networks, the proposed solutions should also cope with the changing temperature conditions that occur during the use of a structure. A two-stage strategy of damage detection was proposed followed by localization and characterization in a variable temperature environment [67]. Damage detection was based on the long-time behavior, while damage localization utilizes changes in the early time regime. Both were based on the same time signals. What is important is that the baseline data was gathered for a range of temperatures taking into consideration the fact that temperature change can significantly influence the damage detection outcome. An aluminum plate was studied with artificial defects under different temperatures. Comparison of such a signal to a baseline allows for the extraction of the slope of the time shift versus transit time curve from the short-time cross-correlation and then this can be related to the temperature difference leading to temperature monitoring from the ultrasonic signals without additional sensors. Having a set of baselines for a range of temperatures allows for the selection of the optimal baseline that matches the analyzed signal. As it was shown a match within about ±2 °C is sufficient for the detection of damage [67]. The obtained optimal match allows for the calculation of the differential signals that are further processed with a delay-and-sum algorithm which results in elliptical shapes representing the damage reflected waves. The effective localization required at least ±0.5 °C temperature match, while the damage size correlated with the image amplitude rather than with the planar dimensions of the indication.
The crucial issue in operating a sensor network is the way how the sensor faults are dealt with. Rao et al. proposed a null subspace-based approach for sensor fault detection and isolation and tested it on a scaled-down 7.7 m bridge model [68]. The sensor fault detection comprises of three phases. The first phase is the learning phase allowing to gather data and learn about its variability under the condition that the sensors are fully operational. The second phase is the detection phase. The acceleration data is analyzed to determine whether it corresponds to a structure with faulty or healthy sensors. Once the faulty case is identified, the third phase is started to isolate the faulty sensors. Each time one sensor is isolated, and the rest of the current time history data set is used to form the Hankel matrix and compare it with the healthy data sets to obtain the residuals. Depending on if the set level is exceeded or not the sensor is classified as faulty or not. The conducted investigations indicate that the proposed null subspace-based sensor validation algorithm is robust in identifying all types of faults, that is, both additive and multiplicative faults [68]. What is important is that the proposed method does not require prior knowledge of a probable number of faults while the major limitation of the algorithm is the computational time involved. As a result, it is difficult to use it in large sensor networks for online SHM.
The reported results on the robustness of the sensor network solutions highlight that the developed approaches allow for effective use in real structures under changing ambient conditions. The level of maturity is high enough to say that the mentioned approaches can be used in the normal operation of existing aircraft (e.g., H-60 Blackhawk).
6. Hardware Development for Sensor Integration
Having the sensor network and robust signal processing algorithms require signal hardware that will handle the signal generation and acquisition processes under the set parameters (the type of excitation signal, frequency, sampling rate, etc.). One of such solutions dedicated to the SMART layer is the ScanGenie (Acellent Technologies, Inc., Sunnyvale, CA, USA). The other solution is the PAMELA SHM™ system [69,70] developed by AERNNOVA (city, Spain) as a commercial product. It provides a solution to automated structural integrity inspection utilizing the SHM technique employing guided ultrasonic waves similar to the Acellents’s ScanGenie. This development was funded by the European Union’s Seventh Framework Programme for research, technological development, and demonstration under grant agreement No. 284562. The PAMELA SHM™ is not only a standalone device. It is expandable because it consists of several portable autonomous units that communicate with each other and can be easily managed by one operator. Using such a set of hardware units gives the flexibility to monitor continuously large structures. It is possible to configure each device to perform different test sequences at different time instants. The system allows for embedding a variety of signal processing algorithms that can be run in real-time. The PAMELA III device can generate any type of excitation signal for up to 12 piezoelectric sensors. Concurrently, it can acquire the signals from the sensors placed on the structure being tested and also perform the signal processing for damage detection in-situ. The processor module configures and controls the remaining modules in PAMELA III and performs the signal processing required for each analysis algorithm. This module is based on an embedded PowerPC processor, which is inside a Virtex 5 field-programmable gate array (FPGA) device from Xilinx Inc. (Hyderabad, India). A more academic prototype was described in [71], where the custom-made electronic system includes: signal generator, multiplexer, data acquisition system, which allows registering signals from 12 measurement channels. However, the registration is made sequentially rather than simultaneously in each channel selected for acquisition. The system is connected to the computer via a USB connector to control its parameters and to receive measured signals and store them on the hard disk. The software controlling the unit is prepared in a MATLAB environment allowing for setting of the measurement parameters as well as for quick processing because the measured data is available in MATLAB Workspace. This also provides an advantage of easy modification of the control software.
The PAMELA approach employs a concentrated network of transducers. Researchers analyze various sensor placements to identify the optimum solutions. One of the most popular solutions has a circular shape and there are examples with 13 [72] or 16 [73] sensors forming the circle. The concentrated network used in PAMELA involves phased arrays. The phased array approach uses a special method of signal processing to simulate wave interference. Concurrently the interference can be also achieved by wave generation in multiple transducers with precisely chosen phase delays. This effect allows for amplifying waves reflected from damage [74]. The simple phased array is linear in shape and was successfully used for locating damage in the aluminum specimen with curvature [75] or without curvature [76] as well as in composites [77,78]. The linear array was used for visualizing the growth of fatigue cracks in the aluminum panel [78]. Also, attempts were made to compare traditional concentrated systems and phased array systems [79]. The main disadvantage of the linear array is the ambiguity in damage location—the result is symmetrical to the array so only 0–180° area scanning is possible. In contrast, two-dimensional arrays are more beneficial [79]. Their scanning characteristics depend on the spatial placement of the sensors as well as the number of used sensors [74,79,80]. As for traditional concentrated systems, circular phased array layouts are used here. The damage localization effectiveness is improved if a dense concentrated array is used [81]. Using more transducers in the circular arrays produces a significant improvement in localization results. This is also confirmed by the investigation of square arrays which were successfully used for detecting many types of damage [82].
Another system is known as Lamb Wave Detection System (LWDS) has been developed and manufactured by Cedrat Technology [83]. The main feature of the system is that it allows using of each piezoelectric element in an array either in emission or reception mode. That means each sensor can be used in not only the conventional pitch-catch mode but also the pulse-echo mode where the sensor can emit Lamb wave signals and then acquire the echo reflected from damage or boundary. Such a feature will dramatically improve PZT network efficiency for SHM, facilitating the use of advanced signal analysis and processing methods.
The hardware review indicates that there are already solutions available in the market. This indicates that the technology evolved from the laboratories of the research institutes and universities is mature enough for real applications.
7. Data Communication and Acquisition Systems
Both wired and wireless sensor networks require an acquisition system and data communication so that the data can be measured and transmitted to engineers for carrying out analyses of the information. There are different applications of wired sensor networks for SHM [84,85]. In general, a wired sensor network acquires and transmits data through the wired link, e.g., optical cable, to a site workstation/storage. A typical earlier form of the wired sensor network is to connect a number of sensors to a multiplexer, which gathers the data from the sensors into a transmission line. The data is then transmitted to a central server/control center. Examples of wired sensor networks include the one implemented on Tsing Ma Bridge, which uses a local wired network to connect the data acquisition unit and sensors and a global wired network to transmit the data to the control center [86]. However, there are challenges in applying the wired sensor network in real structures, especially large infrastructure. The noise increases with the cable length, and the environmental and unexpected site condition may damage the cables. Therefore, wireless sensors have attracted significant attention.
Recent developments have enabled low cost, small size, and energy efficiency of wireless sensors [87,88,89]. This provides a solution to the aforementioned drawbacks of wired sensor networks. The initial development of the wireless sensor networks relies on wired transmission to collect the data from the sensors connected to a sensor node. The data is then transmitted to the control center through wireless transmission by the sensor node [90]. With the development of technology, wireless sensors can have sensing, communication, and computing capability in a single device [91]. This allows the data of each wireless sensor to be first transmitted wirelessly to a sink node and then to the control center. This significantly improves the flexibility of installing the wireless sensor network as the wireless sensors can avoid the high cost of the cabling with a higher flexibility of deploying sensors and adding new sensors to the sensor network. Figure 7 shows the key components of the wireless sensor, which consists of a processing system, an acquisition system, a communication system, and a power unit. The sections below will focus on the acquisition system and the communication technologies of the sensor network.
7.1. Acquisition System
Data acquisition is a process that converts the analog signal into a digital signal that can be read by the computer. In general, an acquisition system consists of three components, i.e., sensor, signal conditioning circuit, and analog-to-digital converter. A sensor is a device that converts the physical property into corresponding electrical signals. The use of signal conditioning depends on the quality and suitability of the signals. If a signal conditioning circuit is necessary, it is then used to buffer, filter, amplify the signal. In this process, some compensation tasks, e.g., linearization or temperature compensation may be applied. After that, the analog-to-digital converter then converts the conditioned signals to digital values. The digital signals are then transmitted to a data server or control center depending on the sensor network used.
7.2. Data Communication Technologies
One of the important aspects of the wireless sensor network is the wireless communication module because it controls the efficiency of data transmission and limitations on the amount of data that can be handled. Three fundamental aspects need to be considered, (i) transmission distance, (ii) reliability, and (iii) lifetime. In general, wireless communication technologies can be categorized based on the communication protocol. A typical wireless network architecture consists of four layers, i.e., physical, data link, network, and application [93].
The first layer is the physical layer, which represents the electrical and physical representations of the system. It provides modulation and demodulation of digital data to enable digital data transmission and reception. Datalink layer is used to divide the digital bits into a sequence of fixed-length data frames and transfers data between adjacent network nodes. The primary function of the network layer is to transfer the data to the destination while the application layer provides an interface for users to interact by transforming the data into actionable information data.
Different communication technologies are available for the buildup of the wireless network [25,94]. IEEE 802.11 is part of the IEEE 802 protocols commonly known as WiFi. It has been widely used as a computer networking standard, mostly in home and office networks. However, power consumption is relatively high compared to other technologies. This limits its usage for wireless sensor networks.
To date, IEEE 802.15.4 as a low-cost and low-power wireless standard has been specifically designed for battery-powered devices in wireless monitoring applications. It has been widely adopted as the standard for physical and/or data link layers for other communication technologies, such as ZigBee and ISA100.11a [95,96,97]. ZigBee has been widely used in the wireless sensor network for SHM [98,99,100]. ZigBee operates in the band of 868 MHz, 902–928 MHz, and 2.4 GHz, and has a maximum data transmission rate of 250 Kbps. The maximum coverage range is 300 m. It is designed to provide reliable and secure communication for non-critical control and monitoring applications. It operates in a band of 2.4 GHz with a maximum rate of 250 Kbps. It has been used in a wireless sensor network for monitoring structures [101].
Bluetooth is a wireless technology providing data exchange between fixed and mobile devices. An early version of Bluetooth was developed for short-distance communication (10 m). Recently, Bluetooth 5.0 achieves a transmission distance of up to 300 m. Bluetooth has also been used in a wireless sensor network for SHM purposes [102].
Table 2 shows the maximum coverage range, power consumption, data transmission rate, and frequency of these communication technologies.
8. Energy Sources for Sensors
The power supply is one of the key components for sensor networks as sensing, data acquisition, processing, and transmission all require energy. For a wired sensor network, this is usually not an issue as the power supply can be provided by the wired cable. However, if the structure to be monitored is located in a remote area, the energy supply can be a challenging issue. For wireless sensor networks, the energy supply has been recognized as one of the most critical features. In the literature, different approaches have been used to address the power supply issue using energy storage, energy harvesting, and energy management. In the following sections, we will focus on these three approaches. The wireless energy transfer is the other option to provide energy for the sensor network, e.g., inductive coupling, magnetic resonance, laser mechanism.
8.1. Energy Storage
The battery is one of the commonly adopted options to provide power for sensor networks, especially for wireless sensor networks. However, the energy that can be stored in the battery is limited so it requires regular recharge/replacement of the battery. To address this limitation, it requires a careful plan of energy consumption on major operations of a sensor network to develop a scheduling policy of duty cycle, e.g., energy-saving scheme, and/or energy harvesting [98]. Different types of batteries can be used to power the sensor network [103]. In the selection of battery, it needs to consider different factors, such as cost, voltage, lifetime, memory effect, safety, and environmental impact.
8.2. Energy Harvesting
Energy harvesting is a process of collecting energy from the surrounding environment, such as vibration, radiofrequency, and renewable energy sources, etc., converting the energy into electricity and storing the energy in rechargeable batteries [104]. It is one of the feasible options to address the limited energy storage of the battery. With energy harvesting, the battery can be recharged regularly before it gets depleted with use so that it can ensure a continuous energy supply for the sensor network. Energy harvesting from the light source can provide a green and renewable energy supply for sensor networks, where the light is converted into electricity based on photovoltaic techniques [105].
The solar source can provide the most efficient energy harvesting, but the solar source depends on the region and weather. The other option is the artificial light source. But the energy harvesting efficiency is not as good as the energy harvested from solar sources. In general, the maximum energy harvested from the solar source outdoor is around 15 mW/cm2 [94].
Vibration can also provide a mechanical energy source for energy harvesting, by which the mechanical energy can be converted into electrical energy and stored in a battery. Commonly used energy harvesting approaches from vibration sources are based on electromagnetic, electrostatic, and piezoelectric mechanisms. The electromagnetic mechanism uses the change of the magnetic field due to the movement of a permanent magnet or electromagnet during the vibration to harvest the energy [106]. The electrostatic mechanism harvests the energy based on changing the capacitance due to vibration [107]. The piezoelectric mechanism converts mechanical energy, e.g., force, pressure, and vibration into electrical energy [108].
Radio frequency is the other possible source for energy harvesting as the radio frequency waves are everywhere, e.g., from cellular phones, TV and radio towers, etc. Radio frequency can be converted into electrical energy using a rectifying antenna [109]. One of the advantages of harvesting energy from radio frequency is that it is independent on environmental conditions, e.g., climate and weather, so it is more reliable than renewable energy, e.g., solar energy. It has attracted significant attention for research developments and SHM applications in recent years. However, a major disadvantage is that the energy harvesting rate based on radio frequency is on the order of micro-Watts with relatively low efficiency [110].
8.3. Energy Management
Although different technologies have been developed and under investigation for energy storage and energy harvesting, the energy that can be stored is limited and the amount of energy that can be harvested is very small. Different energy management techniques, for example, communication power management, duty cycling, and wake-up receivers, etc., have been developed to effectively use the energy for important operations and minimize the unimportant activities of the sensor network [111,112]. In general, they focus on selectively placing idle components into sleep or low-power mode, and implement autonomous power switching of high-power components in the sensor network.
A potential approach to overcome the challenge of the need for energy for powering sensors is the development of hybrid systems relying on external power sources and harvested green energy. This will extend the lifetime of the batteries, further will enhance the capacity of the energy source.
9. Feature Extraction and Signal Processing
The data obtained from the wired and wireless sensor network usually requires data analysis to convert the measured data into meaningful information for SHM purposes. There are different methods and algorithms available for feature extraction and interpretation. Different approaches have different advantages and disadvantages, and they highly depend on the type of data collected from the sensors, e.g., strain gauges, displacement, velocity, accelerometers, or ultrasonic transducers, and the nature of the structures, e.g., buildings, bridges, aircrafts, or offshore structures, etc. In the literature, several reviews have been carried to provide a state-of-the-art of damage detection methods and data analysis methods for SHM. Most of them focused on particular types of measurements or specific types of structures [8,91,113,114,115]. This section will provide an overview of two commonly used data for SHM, (i) vibration data such as acceleration measurements using accelerometers, and (ii) ultrasonic wave data collected using strain sensors and piezoelectric transducer, or velocity measurements using a laser vibrometer. These two measurements have been used heavily for SHM, and features extraction approaches and signal processing techniques have been well developed. This section will focus on the general aspects rather than providing a comprehensive review of the techniques in these areas.
9.1. Vibration Measurement
Vibration data has been used for SHM for many decades. It is a global SHM approach and is one of the earliest SHM developments in the literature. Most vibration approaches rely on extracting the damage features from vibration data for damage detection. Three approaches that have been commonly used for SHM, are the modal parameter approach, time-domain approach, and frequency-domain approach. The damage features extracted using these approaches can be further used in the advanced damage detection methods, e.g., model updating approach, to provide quantitative identification of the damage. The following subsections provide a brief overview of these approaches and methods:
- (1).
- Modal Parameters
Modal parameters, such as natural frequencies, mode shapes, and damping properties, can be extracted from vibration data. Since these modal parameters can reflect the structural condition, they are used to detect and identify the damage in the structures. The use of modal parameters for damage detection is relatively straightforward. They can be easily interpreted because they are physically meaningful. The damage detection using modal parameters is usually achieved by comparing modal parameters between intact and damaged structures. The changes of the modal parameters can be used to develop damage indicators for further enhancing their robustness in SHM. Different approaches have been proposed to further improve the sensitivity of the modal parameters to the damage, for example, mode shape curvature [116], modal strain energy [117], modal flexibility [118], and Ritz vector [119], etc. Although the modal parameters can provide information of the structural condition for the entire structure being monitored, they are insensitive to local damage in the structure and the extraction of the modal parameters also lose much of the damage-related information from the vibration data.
- (2).
- Time-Domain Data
Time-domain data is the other commonly used feature in SHM. The time-domain vibration data from the sensor without any feature extraction process contains all the damage-related information. The direct application of the time-domain data does not require any frequency transformation. This can avoid associated errors due to leakage and truncation. However, the time-domain data from the sensor usually contains noise, which requires signal processing techniques to minimize the effect of the noise. In literature, different signal processing techniques have been developed to denoise and/or extract damage features from the time-domain vibration data, such as random decrement method [120], wavelet transform [121], empirical modes decomposition [122] and Hilbert-Huang transform [123].
To further enhance the damage detection capability of using time-domain data, data-driven time series analysis methods have been developed based on statistical signal processing techniques. These techniques extract the damage features that change with the onset of damage to minimize the possible individual biases. They are solely based on signal analysis of the vibration data so they do not require a physical model for damage detection. In this respect, different techniques have been developed, such as auto-regressive moving average models [124], auto-regressive moving average vector models [125], vector auto-regressive models [126], and time-frequency autoregressive moving average models [127]. These techniques are to build a model for representing the time-domain vibration data measured from structures. The coefficients of the model are then estimated using statistical methods. After that, the system dynamic parameters are identified, and the damage features are extracted to indicate the damage occurrence.
- (3).
- Frequency-Domain Data
Different from the time-domain approach, the frequency-domain approach relies on Fourier transform to transform the vibration data from the time domain to the frequency domain. The Fourier transform can significantly reduce the volume of data and minimize the noise level of the signals by averaging the data. One of the most commonly used frequency domain approaches is the frequency response function (FRF). FRF is defined as the frequency domain response to the applied excitation, which provides a mathematical representation of the relationship between the input and the output of a structure. This means that most excitation and responses need to be measured to calculate the FRF. In the case that the input force cannot be measured, which is a practical situation in most cases in civil engineering, the FRF can still be computed by the power spectral density or the transmissibility function. Different damage features can be extracted from FRF, e.g., the changes of the amplitude and shift of the resonances and anti-resonance [128]. The curvature of the FRF was also proposed to detect the damage, and it was demonstrated that it can achieve better performance than FRF [129]. One of the advantages of using FRF is that the higher frequency information, which is usually more sensitive to the damage, can be obtained and used in damage detection.
9.2. Ultrasonic Wave Data
Ultrasonic wave has been used for damage detection and SHM in the last few decades. The wave propagation is a local phenomenon, i.e., it can localize defects, unlike vibration measurements that provide information about the global behavior only. The approach has attracted significant interest for damage detection of targeted local sections, and also inspecting a large section of structures by using a network of sensors.
The ultrasonic approach is an active damage detection approach, which relies on exciting an incident wave to propagate in structures. When the incident wave interacts with the damage, scattering occurs. The scattered wave carries the damage information and can be used for damage detection purposes. Early developments in the ultrasonic approach focused on bulk waves. Recently, ultrasonic guided waves have attracted significant research interests in the last three decades [130]. Ultrasonic guided waves are elastic waves propagating in solid materials with excitation frequency in the order above ~20 kHz. The wave propagation characteristics highly depend on the boundary conditions of the structure. In the literature, most of the studies employed the PZT wafers to actuate and sense the guided wave signals. To extract the scattered wave, baseline subtraction was one of the commonly used approaches, where the scattered wave was extracted by subtracting the measured signal by the signals previously measured from the corresponding intact structure.
Laser ultrasonics is in a non-contact system that allows for the generation and detection of the ultrasonic wave using a laser. It is an alternative approach to contact transducers using piezoelectric wafers. Laser ultrasonic found its way into many applications including thickness measurement, flaw detection, and materials characterization. Using laser for ultrasonic wave generation does not allow for wave type selection, i.e., all the waves are simultaneously emitted. Depending on the techniques used to excite the ultrasound wave, however, potential damage may occur on the surface in particular when using the ablation or the vaporization technique. The scattered or the reflected light from the surface of the inspected structure is collected using an optical receiver (optical fiber) which is based on an interferometer-like device. The main advantage of such an approach is the ability to interrogate the structure without making direct contact, carrying the inspection while the structure is in operation mode, and less instrumentation and wired required in comparison with traditional sensing systems [131].
Time-of-flight information can be extracted from the ultrasonic guided waves to determine the location of the damage in structures. The time-of-flight approach relies on the traveling time of the incident wave propagating from the actuator to the damage, and then the scattered wave propagating from the damage to the sensor to estimate the location of the damage. Most of the time-of-flight approaches require the baseline subtraction method to extract the scattered wave information, and they usually use signal processing techniques to improve the resolution and quality of the signals [132,133]. Early developments of the time-of-flight approach focused on the one-dimensional waveguide, such as beam [134,135], cable [136], and pipe [137,138]. Time-domain data has also been used directly to detect and identify the damage by different damage detection algorithms, e.g., imaging approach for determining the damage location [64,139,140,141,142]. Recent studies have shown that the nonlinear guided wave, which is generated due to the contact effect at the damage during the guided wave interaction with the damage, can be used to determine the microdamage and its location [143,144,145,146].
Different signal processing techniques have been developed to extract the damage features from the ultrasonic guided wave signals. Fast Fourier transform has been used to extract the frequency domain data for several damage detection techniques using ultrasonic waves, e.g., Lamb wave diffraction tomography [147,148]. Since the excited ultrasonic guided wave is a narrow band frequency signal and carries the time information that is useful for damage detection, time-frequency analysis has attracted significant research interests. Time-frequency analysis can provide a visualization of the frequency components of ultrasonic guided wave signals related to the time information. Short-time Fourier transform [149], Hilbert-Huang transform [150], wavelet transforms [151] and chirplet transform [152] were commonly used for time-frequency analysis in the literature.
10. Case Studies—Laboratory
Wired and wireless sensor networks are widely applied in SHM for damage detection in metal and composite structures. Laboratory-based testbeds are usually conducted to confirm their efficiency and feasibility before the damage identification systems are brought into the field. Some typical experiment tests carried by several researchers will be introduced as case studies in the following section.
Damage localization in an aluminum panel was conducted experimentally with a guided wave-based sensor network [153]. Piezoelectric transducers were deployed to act as both actuators and sensors. Different circular sensor network configurations, two sorts of piezoelectric transducers, and different excitation frequencies ranging from 10 kHz to 200 kHz were investigated in the experiment. To locate the damage, the damage index for each mesh point on the surface of the panel was calculated based on the amplitude of the excitation frequency peak in the frequency domain of the received signal. By calculating and accumulating the damage index of all the mesh points, a damage map showing the location of damage can be established [154]. Results from this study showed this method can locate the damage accurately and the directivity of the damage map was influenced by the diameter of the circular sensor array. The larger transducer array diameter contributed to better directivity of damage maps. Apart from damage detection on regular shape specimens, similar experiments with piezoelectric sensor networks were also conducted on the train bolsters [155] and aircraft wings [140].
A distributed carbon nanotube (CNT)-based sensor network was utilized for imaging of damage in composite materials through the electrical impedance tomography (EIT) technique [156]. 32-electrode CNT composite sensors were bonded on the boundary of a composite laminate and three different types of damage, i.e., square hole, notch, and impact damage were introduced on three specimens respectively. Since damage directly affects the voltage differences of pairs of the electrode, a DC was applied on each pair of electrodes, and voltage differences were received on all the other electrode pairs, and then a difference imaging-based EIT algorithm was implemented to construct two-dimensional maps of the specimen. Figure 8 shows that the damage location and size can be well evaluated, although the size is typically overestimated for the case of crack. Some other types of sensors were also applied in composites for damage detection. For example, FBG sensors were used to measure the strain in composite-strengthened concretes to assess the bonding condition [157].
Compared to a wired sensor network, a WSN has the advantage of low cost, short deployment time, and long lifespan. WSN-based SHM systems were tested on a laboratory scale before they are applied in the field to guarantee efficiency. A steel cantilever beam and a steel truss were evaluated respectively based on the damage localization assurance criterion (DLAC) technique with WSN [158]. This monitoring system put the execution of portions of the damage localization approach onto each sensor instead of using conventional centralized approaches that send enormous amounts of sensor data to a base station, resulting in significant reductions in communication cost and energy consumption. The cantilever beam is 2.75 m long, 7.6 cm wide, and 0.6 cm thick and fixed to the ground. Steel bars attaching to the beam at three different distances from the support were simulated as damage. Lower-power sensors called Motes collecting raw vibration data from accelerometers were applied for the damage localization procedure. Meanwhile, to test the proposed method in complex structures, a steel truss as in Figure 9 was also tested with the size of one of the beam elements reduced. The results from experiments show that this system was capable of efficiently locating damage at discrete locations on both the cantilever beam and truss. Moreover, compared to centralized systems, this system can contribute to the reduction of latency and energy consumption around 64.8% and 69.5% respectively.
For the composite structures, an innovative multi-response-based WSN was developed to monitor the impact damage in an unmanned aerial vehicle (UAV) wing [96]. A new impact localization algorithm was used to analyze the multi-response from multiple leaf nodes and locate the mid-regions of the specimen. Based on this method, an 84 PZT sensor WSN-based multi-channel monitoring network was set up on the UAV wing and wing box with impact damage. This proposed method achieved online and large-scale monitoring on composite structures with an accuracy of 96%. Other issues concerned currently in WSN-based SHM were detailed in literature in terms of autonomous adaptive sampling [159], energy-efficient clustering [160], sensor deployment [161], and decentralized computing [162].
11. Cases Studies—Implementations in the Field
A project monitoring the new Jindo Bridge built-in 2006 using a state-of-the-art wireless smart sensor network (WSSN) was conducted. This cable-stayed bridge connects Haenam on the mainland with Jindo Island, which is the third-largest island in South Korea. The bridge has three continuous spans, including a 344 m main span and two 70 m spans at sides. The wired sensor network was set up on this bridge after the construction. Sensors as shown in Figure 10 consist of thermometers, strain gauges, biaxial inclinometers, string pots, laser displacement meters, FBG sensors, uniaxial capacitive accelerometers, biaxial force balance type accelerometers, and triaxial seismic accelerometers. During 2009 and 2010 [163], WSSN was applied to the structure and the main components include the Imote2 smart sensor platforms, multimeric sensor boards, base stations, and relevant software. In this system, 70 sensor nodes divided into two sub-networks were deployed to monitor the bridge autonomously. Acceleration, temperature, humidity, and light on most of the modes were measured by SHM-A boards and the SHM-W sensor board was used to receive the signal from the 3D ultrasonic anemometer. To prevent corrosion or damage due to the harsh environment at the site, the electrical components of this SHM system have been hardened and many optimization measures have been taken.
In 2010 and 2011 [164], advanced hardware and software were applied to the SHM system and for the power supply, and energy harvesting was carried out for all sensor nodes. The size of the network was increased from 70 to 113 sensor nodes. Moreover, to analyze the potential for wind energy harvesting, a wind turbine was installed on one of the sensors. Since the bridge is under one of the windiest regions, for a better understanding of wind condition, newly developed SHM-DAQ boards along with two more 3D ultrasonic anemometers were employed. For the decentralized data aggregation (DDA) service used in the network, ten SHM-H boards were applied as cluster heads. Finally, newly developed strain sensor boards (SHM-S) were also implemented on the bridge.
One of the ambient vibration data at the mid-span, quarter span, and at the pylon of the bridge from the WSSN was acquired and shown in Figure 11. Sensors at the mid-span and the quarter show significant power spectral density (PSD) around 0.44, 0.66, and 1.03 Hz, indicating the natural frequencies of the bridge. Compared with the PSD from the existing wired sensor at the same location, the natural frequencies obtained from the WSSN were consistent. Additionally, the installation of the 3D ultrasonic anemometer has successfully measured the wind speed and direction. The deployment of this WSSN showed the capability and efficiency for full-scale, continuous, autonomous SHM on the bridge.
Another typical field test with WSN was conducted on the main span and south tower of Golden Gate Bridge (San Francisco, CA, USA) [165]. Ambient structural vibrations were also reliably measured from this bridge with 64 nodes distributed over the structure, and with an accuracy of 30 μG. The results agreed well with the previous measurements from the wired sensor network of the bridge. A similar technique using accelerometer sensors with WSN nodes was also applied on a concrete bridge [166].
Apart from the bridge and building structure monitoring, WSN can monitor the railway infrastructure such as rail tracks and track equipment as well as the health monitoring of vehicle components such as wheels, bogies, and wagons.
For movable monitoring, researchers have developed systems for analyzing train carriages, wagons, and engines. Both wired and wireless sensor networks were applied to measure the vibration of the carriages via accelerometers and angular rate sensors [167]. Two FBG sensor-based systems were developed for the health monitoring of the rail tracks and train cars in Hong Kong [168]. Through measuring the strain and temperature, the systems provided a practical and effective weight, speed, and integrity assessment of the train and rail components under static and dynamic conditions. Additionally, an onboard WSN based system called sensor-enabled ambient-intelligent telemetry for trains (SEAIT) was used for health monitoring of the freight wagons which were unpowered from the train [169]. Track irregularity was detected by bogies in some field tests [170,171]. Apart from that, it can also be detected by the vertical and lateral acceleration of the car body while the train was moving, and the test showed that corrugation could be identified by analyzing cabin noise [172]. For wheel condition assessment, a wear detection system of the train wheels was developed which can detect the changes of vibration behavior of the wheel due to the surface changes on the rolling contact area [173]. Another method using non-contact gap sensors measuring wheel/rail contact forces has been developed to detect the rail irregularity and wear of wheels [174]. The developed system has performed continuous measurement on in-service trains with sufficient durability and accuracy.
WSN is also widely applied in aircraft SHM due to the lighter weight, easier installation, and lower cost compared to the wired sensor network. A WSN based SHM system was developed for an airplane with sensors placed inside the fuel tank and on the wings, as illustrated in Figure 12 [175]. The sensor in the fuel tank was used to detect the fuel level and the sensor on the wings will monitor the ambient vibration to identify the potential damage in them. This system had a cluster-based three-tiered topology and was tested using OPNET under a simulated environment. The results showed that the proposed model performed efficiently but further development of WSN hardware/software was needed before it was deployed into real-world monitoring.
The further study focuses on autonomous sensor nodes of WSN used on aircraft SHM with an ultra-low-power (ULP) microcontroller-based sensor platform and a thermoelectric energy harvesting system is presented in [176]. An integrated structural health monitoring and reporting (SHMR) system using WSN applied on Navy aircraft is described in [177].
12. Advantages and Challenges of the Technology
Damage in large-scale structures results in changes in the frequencies and mode shapes and therefore, these changes can be measured by sensors. Sensor network-based SHM enables the monitoring of the entire structure through analyzing the acquired vibration data. It required the selection of sensor location at the critical positions since the number of sensors is limited due to the high cost of this sort of system, especially in a real-world field test. Also, from the vibration data, it is difficult to detect the small and local-scale damage and the low spatial density of the sensors makes the system perform at low efficiency.
On the other hand, large-scale or embedded wired sensor networks with numbers of distributed PZT elements are capable of effectively generating and acquiring guided waves for damage identification. This technique is sensitive to local damage compared to using the natural frequency of the structure and more feasible than the others on the detection of multiple damages. However, the guided wave-based technique has unavoidable difficulty in generating pure wave mode and signal interpretation. To identify different types of damage, proper wave mode, waveform, and excitation frequency need to be considered comprehensively [8]. The interpretation of received signals sometimes needs a complex signal processing method to identify the damage.
Furthermore, the monitoring of a building or bridge usually needs hundreds of sensor installation and controlling and the size of the sensor network will influence the accuracy and efficiency of the damage identification. The wired network also has difficulty with the installation of an enormous number of sensors and long-distance transmission with lengthy cable installation, and deploying the wired system usually takes a long time. Meanwhile, the repair and maintenance of such cables are always time-consuming and expensive. The cost of the wire-based sensor network usually is much higher than the WSN. The price of a smart sensor node in a WSN is generally less than $500 while the price per channel for a wired-based sensor network is generally more than $10,000 [178].
Although wired sensor network systems currently play a dominant role in SHM applications, it is believed that WSN systems will take the place of it in the future, since they have enormous advantages over conventional wired systems, including low weight and maintenance cost, the high spatial density of sensors, ease of installation, time-saving and flexibility [96]. Therefore, they have been used widely not only in civil structures but also in aerospace engineering [162,179].
However, to deploy the WSN in SHM, there are still a number of issues to be addressed, such as sensor placement, energy source, hardware/software optimization, communication, and fault tolerance. Similar to the wired sensor network, for the WSN, sensor placement is one of the major concerns in SHM of civil and structural engineering [180]. Sensor placement requires comprehensive consideration to place the sensor at the critical locations, while in the current WSN it is not achieved accurately.
WSN is usually classified into three types according to their energy source: fully battery-powered WSNs (FBP-WSNs), partial energy harvesting WSNs (PEH-WSNs), and full energy harvesting WSNs (FEH-WSNs) [181]. Among them, most of the WSNs at the current stage are FBP-WSNs. Consuming a lot of energy in monitoring and communication, the relay of the batteries usually shortens the lifespan of the network system. Many research work has contributed to reducing the energy consumption through the optimization of the cluster size [160] and utilization of lower-power mode sensor nodes [182], or applying energy harvesting technique to change the power source [183,184].
The sensor network always transmits data at a high rate, which requires high efficiency and reliable signal delivering and processing software [182], or using advanced machine learning models [9,10]. A localization method has been tried to make a balance between the damage localization accuracy and the hardware and software complexity. Instead of locating the specific position of the damage, this method located the impact-occurring sub-region in a digital sensor network for impact damage monitoring in composites [185].
For the communication in a WSN, the conventional centralized approach delivering a large amount of data to the base station is generally low in efficiency and volatile, and also, the noisy wireless environment will influence the reliability of the communication. To deal with this issue, a certain system has been developed to assign portions of the damage localization algorithm onto the sensor nodes, to improve the quality of communication [158].
Furthermore, the WSN system needs to be resilient to reduce the loss due to communication errors, unstable connectivity, and sensor faults. The fault tolerance of a WSN is also a challenge when implementing SHM in practice. To meet this requirement, an approach called fault-tolerance in SHM (FTSHM) was developed to search the repairing points or locations in clusters and place a set of backup sensors at those points [162]. Figure 13 shows the comparison between this proposed method and another two widely used methods known as cluster approach (C-SHM) and a special module of sensor placement (SPEM) using effective independence (EFI) placement method [186] respectively in SHM.
Apart from these major problems in terms of the wired and wireless configuration, the durability and robustness of sensors are also common concerns for both systems. A sensor generally can work reliably 5–10 years, which is much shorter than the service life of civil structures [4]. Therefore, the replaceable sensor technology or development of long-life sensors need to be achieved to solve this problem. Protection of sensors especially the embedded ones is of vital importance when the sensors are in hazardous environments such as high temperature, high humidity, and corrosive conditions. The development of sensors with durability under different extreme environments is necessary.
Moreover, considering the environmental effect on sensor networks, isolation may be required for cables of wired sensor networks operating in high humidity, magnetic field, or high vibration environments. On the contrary, WSN is more practical in hazardous and inaccessible environments while it should be noticed that the reliability and accuracy of data collected in WSN may be disturbed by noises, co-channel interferences, multipath, and other interferers in the environment [187]. Signal acquisition carried out in a factory environment will also be severely influenced by the reflections of walls and floors, and noise generated by equipment or heavy machinery [188]. Meanwhile, since the high temperature will affect the performance of sensors and communication efficiency, sensor placement, enclosure, and proper thermal insulation should be carefully designed to avoid the exposure to the Sun or other heating sources [189].
13. Conclusions
An efficient design of a sensor network for application in structural health monitoring, is a major milestone for a robust and effective system. A successful design must account for many aspects starting with the understanding of the type of measurement needed, the type of sensor required, the number and location of sensors.
Moreover, the energy source for the sensors is a necessity as it impacts their operation, which is the amount of data collected. Providing a continuous source of energy would allow for continuous data collection, yet the large amount of data collected may result in some challenges related to data transmission and data storage.
Redundant sensors in a network may enhance the robustness of the system, however, this is expected to increase the cost of deployment. Further, the ability to assess the current state of the sensors allows for a more accurate prediction of the state of the structure and therefore eliminates fault alarms.
Although there has been a lot of academic and commercial efforts being put towards the development of sensor technologies and the design of sensor networks, yet the implementation is not practical and many of the challenges faced when scaling up the design are not taken into account.
It is apparent that the structural health monitoring community established a strong foundation for continuous online monitoring and advanced the science of sensing and data processing, however, it is important to start thinking of SHM holistically to bridge the gap between instrumentation, sensing, data processing, visualization and ultimately robustness of the system.
Researchers and engineering scientists, in the future, should focus more on the development of non-traditional sensing systems such as that are more effective for practical applications such as smart skins, smart paint, or miniature advanced sensing nodes.
Author Contributions
Given the review nature of the article, all the authors were responsible for conceptualization, methodology development, resources, data analysis and write up review and editing. All the authors have read and agreed to the published version of the manuscript.
Funding
This research received no external funding.
Conflicts of Interest
The authors declare no conflict of interest.
References
- Lynch, J.P.; Loh, K.J. A summary review of wireless sensors and sensor networks for structural health monitoring. Shock Vib. Dig. 2006, 38, 91–130. [Google Scholar] [CrossRef] [Green Version]
- Runcie, P.; Mustapha, S.; Rakotoarivelo, T. Advances in structural health monitoring system architecture. In Proceedings of the Fourth International Symposium on Life-Cycle Civil Engineering, IALCCE, Tokyo, Japan, 16–19 November 2014; pp. 1064–1071. [Google Scholar]
- Sohn, H.; Farrar, C.R.; Hemez, F.M.; Shunk, D.D.; Stinemates, D.W.; Nadler, B.R.; Czarnecki, J.J. A review of structural health monitoring literature: 1996–2001. In Proceedings of the Third World Conference on Structural Control, Como, Italy, 7–12 April 2002. [Google Scholar]
- Ou, J.; Li, H. Structural health monitoring in mainland China: Review and future trends. Struct. Health Monit. 2010, 9, 219–231. [Google Scholar]
- Patil, P.K.; Patil, S.R. Review on structural health monitoring system using WSN for bridges. In Proceedings of the 2017 International Conference of Electronics, Communication and Aerospace Technology (ICECA), Coimbatore, India, 20–22 April 2017; pp. 628–631. [Google Scholar]
- Ostachowicz, W.; Soman, R.; Malinowski, P. Optimization of sensor placement for structural health monitoring: A review. Struct. Health Monit. 2019, 18, 963–988. [Google Scholar] [CrossRef]
- Ismail, Z.; Mustapha, S.; Fakih, M.A.; Tarhini, H. Sensor placement optimization on complex and large metallic and composite structures. Struct. Health Monit. 2020, 19, 262–280. [Google Scholar] [CrossRef]
- Su, Z.; Ye, L.; Lu, Y. Guided Lamb waves for identification of damage in composite structures: A review. J. Sound Vib. 2006, 295, 753–780. [Google Scholar] [CrossRef]
- Mustapha, S.; Braytee, A.; Ye, L. Multisource Data Fusion for Classification of Surface Cracks in Steel Pipes. J. Nondestruct. Eval. Diagn. Progn. Eng. Syst. 2018, 1. [Google Scholar] [CrossRef]
- Anaissi, A.; Khoa, N.L.D.; Mustapha, S.; Alamdari, M.M.; Braytee, A.; Wang, Y.; Chen, F. Adaptive One-Class Support Vector Machine for Damage Detection in Structural Health Monitoring. In Proceedings of the Pacific-Asia Conference on Knowledge Discovery and Data Mining, Jeju, Korea, 23–26 May 2017; pp. 42–57. [Google Scholar]
- Yang, J.; He, J.; Guan, X.; Wang, D.; Chen, H.; Zhang, W.; Liu, Y. A probabilistic crack size quantification method using in-situ Lamb wave test and Bayesian updating. Mech. Syst. Signal Process. 2016, 78, 118–133. [Google Scholar] [CrossRef]
- Dong, W.; Lin, Y.; Zhongqing, S.; Ye, L.; Fucai, L.; Guang, M. Probabilistic Damage Identification Based on Correlation Analysis Using Guided Wave Signals in Aluminum Plates. Struct. Health Monit. 2009, 9, 133–144. [Google Scholar] [CrossRef]
- Mustapha, S.; Hu, Y.; Nguyen, K.; Alamdari, M.M.; Runcie, P.; Dackermann, U.; Nguyen, V.; Li, J.; Ye, L. Pattern Recognition Based on Time Series Analysis Using Vibration Data for Structural Health Monitoring in Civil Structures. Electron. J. Struct. Eng. 2015, 14, 106–115. [Google Scholar]
- Doebling, S.W.; Farrar, C.R.; Prime, M.B. A summary review of vibration-based damage identification methods. Shock Vib. Dig. 1998, 30, 91–105. [Google Scholar] [CrossRef] [Green Version]
- Yeager, M.; Todd, M.; Gregory, W.; Key, C. Assessment of embedded fiber Bragg gratings for structural health monitoring of composites. Struct. Health Monit. 2016, 16, 262–275. [Google Scholar] [CrossRef]
- Mustapha, S.; Ye, L.; Dong, X.; Alamdari, M.M. Evaluation of barely visible indentation damage (BVID) in CF/EP sandwich composites using guided wave signals. Mech. Syst. Signal Process. 2016, 76–77, 497–517. [Google Scholar] [CrossRef]
- Tang, X.; Wang, X.; Cattley, R.; Gu, F.; Ball, D.A. Energy Harvesting Technologies for Achieving Self-Powered Wireless Sensor Networks in Machine Condition Monitoring: A Review. Sensors 2018, 18, 4113. [Google Scholar] [CrossRef] [PubMed] [Green Version]
- Chen, B.; Wang, X.; Sun, D.; Xie, X. Integrated System of Structural Health Monitoring and Intelligent Management for a Cable-Stayed Bridge. Sci. World J. 2014, 2014, 12. [Google Scholar] [CrossRef]
- Gutierrez, J.A.; Callaway, E.H.; Barrett, R. IEEE 802.15.4 Low-Rate Wireless Personal Area Networks: Enabling Wireless Sensor Networks; IEEE Standards: Middlesex County, NJ, USA, 2003. [Google Scholar]
- Marcelloni, F.; Vecchio, M. A Simple Algorithm for Data Compression in Wireless Sensor Networks. IEEE Commun. Lett. 2008, 12, 411–413. [Google Scholar] [CrossRef]
- Zou, Z.; Bao, Y.; Deng, F.; Li, H. An Approach of Reliable Data Transmission with Random Redundancy for Wireless Sensors in Structural Health Monitoring. IEEE Sens. J. 2015, 15, 809–818. [Google Scholar] [CrossRef]
- Mahajan, U.; Prashanth, C. Algorithms for data compression in wireless computing systems. Int. J. Comput. Sci. Issues 2013, 10, 71. [Google Scholar]
- Blilat, A.; Bouayad, A.; Chaoui, N.E.H.; Ghazi, M.E. Wireless sensor network: Security challenges. In 2012 National Days of Network Security and Systems; IEEE: Marrakech, Morocco, 2012. [Google Scholar]
- Jiang, X.; Tang, Y.; Lei, Y. Wireless sensor networks in Structural Health Monitoring based on ZigBee technology. In 2009 3rd International Conference on Anti-counterfeiting, Security, and Identification in Communication; IEEE: Hong Kong, China, 2009. [Google Scholar]
- Alonso, L.; Barbarán, J.; Chen, J.; Díaz, M.; Llopis, L.; Rubio, B. Middleware and communication technologies for structural health monitoring of critical infrastructures: A survey. Comput. Stand. Interfaces 2018, 56, 83–100. [Google Scholar] [CrossRef]
- Jeong, S.; Byun, J.; Kim, D.; Sohn, H.; Bae, I.H.; Law, K.H. A data management infrastructure for bridge monitoring. In Sensors and Smart Structures Technologies for Civil, Mechanical, and Aerospace Systems 2015; International Society for Optics and Photonics: Bellingham, DC, USA, 2015; p. 94350P. [Google Scholar]
- Kammer, D.C. Sensor placement for on-orbit modal identification and correlation of large space structures. J. Guid. Control Dyn. 1991, 14, 251–259. [Google Scholar] [CrossRef]
- Trendafilova, I.; Heylen, W.; Brussel, H.V. Measurement point selection in damage detection using the mutual information concept. Smart Mater. Struct. 2001, 10, 528–533. [Google Scholar] [CrossRef]
- Worden, K.; Burrows, A. Optimal sensor placement for fault detection. Eng. Struct. 2001, 23, 885–901. [Google Scholar] [CrossRef]
- Malinowski, P.H.; Ostachowicz, W.M.; Brune, K.; Schlag, M. Study of electromechanical impedance changes caused by modifications of CFRP adhesive bonds. Fatigue Fract. Eng. Mater. Struct. 2017, 40, 1592–1600. [Google Scholar] [CrossRef] [Green Version]
- Wandowski, T.; Malinowski, P.H.; Ostachowicz, W.M. Temperature and damage influence on electromechanical impedance method used for carbon fibre–reinforced polymer panels. J. Intell. Mater. Syst. Struct. 2017, 28, 782–798. [Google Scholar] [CrossRef]
- Glassburn, R.S.; Smith, S.W. Evaluation of Sensor Placement Algorithms for On-Orbit Identification of Space Platforms. Master’s Thesis, University of Kentucky, Lexington, KY, USA, 1994. [Google Scholar]
- Jin, S.; Zhou, M.; Wu, A.S. Sensor network optimization using a genetic algorithm. In Proceedings of the 7th World Multiconference on Systemics, Cybernetics and Informatics, Orlando, FL, USA, 27–30 July 2003; pp. 109–116. [Google Scholar]
- Mallardo, V.; Sharif Khodaei, Z.; Aliabadi, F.M. A Bayesian approach for sensor optimisation in impact identification. Materials 2016, 9, 946. [Google Scholar] [CrossRef]
- Flynn, E.B.; Todd, M.D. Optimal placement of piezoelectric actuators and sensors for detecting damage in plate structures. J. Intell. Mater. Syst. Struct. 2010, 21, 265–274. [Google Scholar] [CrossRef]
- Mallardo, V.; Aliabadi, M.; Khodaei, Z.S. Optimal sensor positioning for impact localization in smart composite panels. J. Intell. Mater. Syst. Struct. 2013, 24, 559–573. [Google Scholar] [CrossRef]
- Mallardo, V.; Aliabadi, M. Optimal sensor placement for structural, damage and impact identification: A review. Struct. Durab. Health Monit. 2013, 9, 287–323. [Google Scholar] [CrossRef]
- Croxford, A.J.; Wilcox, P.D.; Drinkwater, B.W. Quantification of sensor geometry performance for guided wave SHM. In Health Monitoring of Structural and Biological Systems 2009; International Society for Optics and Photonics: Bellingham, DC, USA, 2009; p. 72951H. [Google Scholar]
- Guo, H.; Zhang, L.; Zhang, L.; Zhou, J. Optimal placement of sensors for structural health monitoring using improved genetic algorithms. Smart Mater. Struct. 2004, 13, 528. [Google Scholar] [CrossRef] [Green Version]
- Yi, T.H.; Li, H.N.; Wang, C.W. Multiaxial sensor placement optimization in structural health monitoring using distributed wolf algorithm. Struct. Control Health Monit. 2016, 23, 719–734. [Google Scholar] [CrossRef]
- Thiene, M.; Khodaei, Z.S.; Aliabadi, M. Optimal sensor placement for maximum area coverage (MAC) for damage localization in composite structures. Smart Mater. Struct. 2016, 25, 095037. [Google Scholar] [CrossRef]
- Cantero-Chinchilla, S.; Chiachío, J.; Chiachío, M.; Chronopoulos, D.; Jones, A. A robust Bayesian methodology for damage localization in plate-like structures using ultrasonic guided-waves. Mech. Syst. Signal Process. 2019, 122, 192–205. [Google Scholar] [CrossRef] [Green Version]
- Manohar, K.; Brunton, B.W.; Kutz, J.N.; Brunton, S.L. Data-Driven Sparse Sensor Placement for Reconstruction: Demonstrating the Benefits of Exploiting Known Patterns. IEEE Control Syst. 2018, 38, 63–86. [Google Scholar]
- Zhang, H.; Hou, J.C. On the upper bound of α-lifetime for large sensor networks. ACM Trans. Sens. Netw. (TOSN) 2005, 1, 272–300. [Google Scholar] [CrossRef] [Green Version]
- Salmanpour, M.; Sharif Khodaei, Z.; Aliabadi, M. Transducer placement optimisation scheme for a delay and sum damage detection algorithm. Struct. Control Health Monit. 2017, 24, e1898. [Google Scholar] [CrossRef] [Green Version]
- Cantero-Chinchilla, S.; Chiachío, J.; Chiachío, M.; Chronopoulos, D.; Jones, A. Optimal sensor configuration for ultrasonic guided-wave inspection based on value of information. Mech. Syst. Signal Process. 2020, 135, 106377. [Google Scholar] [CrossRef]
- Cantero-Chinchilla, S.; Beck, J.L.; Chiachío, M.; Chiachío, J.; Chronopoulos, D.; Jones, A. Optimal sensor and actuator placement for structural health monitoring via an efficient convex cost-benefit optimization. Mech. Syst. Signal Process. 2020, 144, 106901. [Google Scholar] [CrossRef]
- Shoja, S.; Berbyuk, V.; Mustapha, S. Design optimization of transducer arrays for uniform distribution of guided wave energy in arbitrarily shaped domains. Ultrasonics 2020, 103, 106079. [Google Scholar] [CrossRef] [PubMed]
- Tarhini, H.; Itani, R.; Fakih, M.A.; Mustapha, S. Optimization of piezoelectric wafer placement for structural health-monitoring applications. J. Intell. Mater. Syst. Struct. 2018, 29, 3758–3773. [Google Scholar] [CrossRef]
- Airbus, S. Airbus A380 Aircraft Characteristics Airport and Maintenance Planning; Airbus S.A.S: Blagnac, France, 2015. [Google Scholar]
- Zhou, C.; Su, Z.; Cheng, L. Probability-based diagnostic imaging using hybrid features extracted from ultrasonic Lamb wave signals. Smart Mater. Struct. 2011, 20, 125005. [Google Scholar] [CrossRef]
- Wu, Z.; Liu, K.; Wang, Y.; Zheng, Y. Validation and evaluation of damage identification using probability-based diagnostic imaging on a stiffened composite panel. J. Intell. Mater. Syst. Struct. 2014, 26, 2181–2195. [Google Scholar] [CrossRef]
- BINDT—NDT Equipment Providers. Available online: https://www.bindt.org/Buyers-Guide/NDT-Equipment-Providers/ (accessed on 1 July 2021).
- NI. Compatible Sensors and Sensor Suppliers for NI Wireless Sensor Network. 2018. Available online: http://www.ni.com/product-documentation/9998/en/ (accessed on 12 June 2019).
- MicroStrain, L.S. Wireless Sensor Nodes. Available online: https://www.microstrain.com/wireless/nodes (accessed on 12 June 2019).
- OMEGA. Learn More about Wireless Sensors. Available online: https://www.omega.com/en-us/resources/wireless-sensors#section1 (accessed on 13 June 2019).
- ADVANTECH. Wireless Sensing Solutions. Available online: https://www.advantech.com/products/wireless-sensing-network/sub_3f18fa5c-7506-47e1-8043-494956f0aff6 (accessed on 13 June 2019).
- Qing, X.P.; Beard, S.J.; Kumar, A.; Ooi, T.K.; Chang, F.-K. Built-in Sensor Network for Structural Health Monitoring of Composite Structure. J. Intell. Mater. Syst. Struct. 2007, 18, 39–49. [Google Scholar] [CrossRef]
- Wu, Z.; Qing, X.P.; Chang, F.-K. Damage Detection for Composite Laminate Plates with A Distributed Hybrid PZT/FBG Sensor Network. J. Intell. Mater. Syst. Struct. 2009, 20, 1069–1077. [Google Scholar] [CrossRef]
- Guo, Z.; Kim, K.; Salowitz, N.; Lanzara, G.; Wang, Y.; Peumans, P.; Chang, F.-K. Functionalization of stretchable networks with sensors and switches for composite materials. Struct. Health Monit. 2018, 17, 598–623. [Google Scholar] [CrossRef] [Green Version]
- Qiang, W.; Shenfang, Y. Baseline-free Imaging Method based on New PZT Sensor Arrangements. J. Intell. Mater. Syst. Struct. 2009, 20, 1663–1673. [Google Scholar] [CrossRef]
- Bao, Q.; Yuan, S.; Guo, F.; Qiu, L. Transmitter beamforming and weighted image fusion–based multiple signal classification algorithm for corrosion monitoring. Struct. Health Monit. 2019, 18, 621–634. [Google Scholar] [CrossRef]
- Quek, S.T.; Jin, J.; Tua, P.S. Comparison of Plain Piezoceramics and Interdigital Transducers for Crack Detection in Plates; SPIE: Bellingham, DC, USA, 2004; Volume 5390. [Google Scholar]
- Wang, D.; Ye, L.; Lu, Y.; Li, F. A damage diagnostic imaging algorithm based on the quantitative comparison of Lamb wave signals. Smart Mater. Struct. 2010, 19, 065008. [Google Scholar] [CrossRef]
- Fasel, T.R.; Todd, M.D. An adhesive bond state classification method for a composite skin-to-spar joint using chaotic insonification. J. Sound Vib. 2010, 329, 3218–3232. [Google Scholar] [CrossRef]
- Gardiner, G. Structural health monitoring: NDT-integrated aerostructures. In SHM Moves from Structural Testing to an FAA-Qualified Inspection Alternative, to Reduce Cost, Streamline Operations and Mature toward Lighter, More Robust Smart Structures; Composites World: Cincinnati, OH, USA, 2015. [Google Scholar]
- Michaels, J.E. Detection, localization and characterization of damage in plates with anin situarray of spatially distributed ultrasonic sensors. Smart Mater. Struct. 2008, 17, 035035. [Google Scholar] [CrossRef] [Green Version]
- Rao, A.R.M.; Kasireddy, V.; Gopalakrishnan, N.; Lakshmi, K. Sensor fault detection in structural health monitoring using null subspace–based approach. J. Intell. Mater. Syst. Struct. 2015, 26, 172–185. [Google Scholar] [CrossRef]
- Alcaide, A.; Barrera, E.; Ruiz, M.; Aranguren, G. Damage detection on Aerospace structures using PAMELA SHM System. In Proceedings of the 6th International Symposium on NDT in Aerospace, Madrid, Spain, 12–14 November 2014. [Google Scholar]
- Aranguren, G.; Monje, P.M.; Cokonaj, V.; Barrera, E.; Ruiz, M. Ultrasonic wave-based structural health monitoring embedded instrument. Rev. Sci. Instrum. 2013, 84, 125106. [Google Scholar] [CrossRef]
- Ostachowicz, W.; Kudela, P.; Malinowski, P.; Wandowski, T. Damage localisation in plate-like structures based on PZT sensors. Mech. Syst. Signal Process. 2009, 23, 1805–1829. [Google Scholar] [CrossRef]
- Kudela, P.; Ostachowicz, W.; Żak, A. Damage detection in composite plates with embedded PZT transducers. Mech. Syst. Signal Process. 2008, 22, 1327–1335. [Google Scholar] [CrossRef]
- Stepinski, T.; Engholm, M. Piezoelectric Circular Array for Structural Health Monitoring Using Lamb Waves. In Proceedings of the 7th International Workshop on Structural Health Monitoring, Stanford, CA, USA, 9–11 September 2009; Volume 1, pp. 1050–1056. [Google Scholar]
- Giurgiutiu, V. Structural Health Monitoring: With Piezoelectric Wafer Active Sensors; Elsevier: Amsterdam, The Netherlands, 2007. [Google Scholar]
- Yu, L.; Santoni-Bottai, G.; Xu, B.; Liu, W.; Giurgiutiu, V. Piezoelectric wafer active sensors for in situ ultrasonic-guided wave SHM. Fatigue Fract. Eng. Mater. Struct. 2008, 31, 611–628. [Google Scholar] [CrossRef]
- Pena, J.; Melguizo, C.; Martinez-Ona, R.; Ullate, Y.; de Espinosa Freijo, F.; Kawiecki, G. Advanced phased array system for structural damage detection. In Proceedings of the Third European Workshop on Structural Health Monitoring, Granada, Spain, 5–7 July 2006; pp. 244–250. [Google Scholar]
- Sundararaman, S.; Adams, D.E.; Rigas, E.J. Biologically inspired structural diagnostics through beamforming with phased transducer arrays. Int. J. Eng. Sci. 2005, 43, 756–778. [Google Scholar] [CrossRef]
- Criado, A.; Melguizo, C.P.; Macias, J.P.; Martinez–Ona, R.; Kawiecki, G. Proceedings of the III ECCOMAS Thematic Conference on Smart Structures and Materials, Gdańsk, Poland, 9–11 July 2007.
- Yu, L.; Giurgiutiu, V. In situ 2-D piezoelectric wafer active sensors arrays for guided wave damage detection. Ultrasonics 2008, 48, 117–134. [Google Scholar] [CrossRef]
- Malinowski, P.; Wandowski, T.; Trendafilova, I.; Ostachowicz, W.M. Multi-phased array for damage localisation. In Key Engineering Materials; Trans Tech Publications Ltd.: Freienbach, Switzerland, 2007; pp. 77–82. [Google Scholar]
- Wilcox, P.D. Omni-directional guided wave transducer arrays for the rapid inspection of large areas of plate structures. IEEE Trans. Ultrason. Ferroelectr. Freq. Control 2003, 50, 699–709. [Google Scholar] [CrossRef]
- Engholm, M.; Stepinski, T. Using 2-D Arrays for Sensing Multimodal Lamb Waves; SPIE: Bellingham, DC, USA, 2010; Volume 7649. [Google Scholar]
- Jaussaud, G.; Rebufa, J.; Fournier, M.; Logeais, M.; Bencheikh, N.; Rébillat, M.; Guskov, M. Improving Lamb Wave Detection for SHM Using a Dedicated LWDS Electronics; NDT.net: Paris, France, 2019. [Google Scholar]
- Ni, Y.Q.; Xia, Y.; Liao, W.Y.; Ko, J.M. Technology innovation in developing the structural health monitoring system for Guangzhou New TV Tower. Struct. Control Health Monit. 2009, 16, 73–98. [Google Scholar] [CrossRef]
- Wong, K.-Y. Instrumentation and health monitoring of cable-supported bridges. Struct. Control Health Monit. 2004, 11, 91–124. [Google Scholar] [CrossRef]
- Ko, J.M.; Ni, Y.Q. Technology developments in structural health monitoring of large-scale bridges. Eng. Struct. 2005, 27, 1715–1725. [Google Scholar] [CrossRef]
- Mascarenas, D.L.; Todd, M.D.; Park, G.; Farrar, C.R. Development of an impedance-based wireless sensor node for structural health monitoring. Smart Mater. Struct. 2007, 16, 2137. [Google Scholar] [CrossRef] [Green Version]
- Chae, M.J.; Yoo, H.S.; Kim, J.Y.; Cho, M.Y. Development of a wireless sensor network system for suspension bridge health monitoring. Autom. Constr. 2012, 21, 237–252. [Google Scholar] [CrossRef]
- Cho, S.; Yun, C.B.; Lynch, J.P.; Zimmerman, A.T.; Spencer, B.F.; Nagayama, T. Smasrt wireless sensor technology for structural health monitoring of civil structures. Steel Struct. 2008, 8, 267–275. [Google Scholar]
- Park, H.S.; Shin, Y.; Choi, S.W.; Kim, Y. An Integrative Structural Health Monitoring System for the Local/Global Responses of a Large-Scale Irregular Building under Construction. Sensors 2013, 13, 9085–9103. [Google Scholar] [CrossRef] [Green Version]
- Mustapha, S.; Kassir, A.; Hassoun, K.; Modad, B.A.A.; Abi-Rached, H.; Dawy, Z. Joint Crowd Management and Structural Health Monitoring Using Fiber Optic and Wearable Sensing. IEEE Commun. Mag. 2019, 57, 62–67. [Google Scholar] [CrossRef]
- Dener, M. WiSeN: A new sensor node for smart applications with wireless sensor networks. Comput. Electr. Eng. 2017, 64, 380–394. [Google Scholar] [CrossRef]
- Fepeussi, T.V.; Jin, Y.; Xu, Y.; Xiang, D.; Huo, F. Acoustic data communication by wireless sensor network on plate-like structures for autonomous structural health monitoring aerovehicles. In Autonomous Systems: Sensors, Vehicles, Security, and the Internet of Everything; International Society for Optics and Photonics: Bellingham, DC, USA, 2018. [Google Scholar]
- Kane, M.B.; Peckens, C.; Lynch, J.P. Design and selection of wireless structural monitoring systems for civil infrastructures. In Sensor Technologies for Civil Infrastructures; Wang, M.L., Lynch, J.P., Sohn, H., Eds.; Woodhead Publishing: Sawston, UK, 2014; Volume 55, pp. 446–479. [Google Scholar]
- Hung, S.L.; Ding, J.T.; Lu, Y.C. Developing an energy-efficient and low-delay wake-up wireless sensor network-based structural health monitoring system using on-site earthquake early warning system and wake-on radio. J. Civ. Struct. Health Monit. 2019, 9, 103–115. [Google Scholar] [CrossRef]
- Yuan, S.; Ren, Y.; Qiu, L.; Mei, H. A multi-response-based wireless impact monitoring network for aircraft composite structures. IEEE Trans. Ind. Electron. 2016, 63, 7712–7722. [Google Scholar] [CrossRef]
- Chen, J.; Li, P.; Song, G.; Tan, Y.; Zheng, Y.; Han, Y. Systematic development of a wireless snesor netowrk for piezo-based sensing. J. Sens. 2018, 2018, 12. [Google Scholar] [CrossRef]
- Spencer, B.F.; Park, J.W.; Mechitov, K.A.; Jo, H.; Agha, G. Next Generation Wireless Smart Sensors Toward Sustainable Civil Infrastructure. Procedia Eng. 2017, 171, 5–13. [Google Scholar] [CrossRef]
- Wang, H.; Dong, L.; Wei, W.; Zhao, W.; Xu, K.; Wang, G. The WSN Monitoring System for Large Outdoor Advertising Boards Based on ZigBee and MEMS Sensor. IEEE Sens. J. 2018, 18, 1314–1323. [Google Scholar] [CrossRef]
- Zhao, X.; Wei, G.; Li, X.; Qin, Y.; Xu, D.; Tang, W.; Yin, H.; Wei, X.; Jia, L. Self-powered triboelectric nano vibration accelerometer based wireless sensor system for railway state health monitoring. Nano Energy 2017, 34, 549–555. [Google Scholar] [CrossRef] [Green Version]
- Lee, J.-H.; Jung, J.-E.; Kim, N.-G.; Song, B.-H. Industrial Pipe-Rack Health Monitoring System Based on Reliable-Secure Wireless Sensor Network. Int. J. Distrib. Sens. Netw. 2012, 8, 641391. [Google Scholar] [CrossRef]
- Oraczewski, T.; Staszewski, W.J.; Uhl, T. Nonlinear acoustics for structural health monitoring using mobile, wireless and smartphone-based transducer platform. J. Intell. Mater. Syst. Struct. 2016, 27, 786–796. [Google Scholar] [CrossRef]
- Mukhopadhyay, S.C. Power Supplies for Sensors. In Intelligent Sensing, Instrumentation and Measurements; Springer: Berlin/Heidelberg, Germany, 2013; pp. 71–90. [Google Scholar]
- Park, G.; Rosing, T.; Todd, M.D.; Farrar, C.R.; Hodgkiss, W. Energy Harvesting for Structural Health Monitoring Sensor Networks. J. Infrastruct. Syst. 2008, 14, 64–79. [Google Scholar] [CrossRef] [Green Version]
- Sampaio, P.G.V.; González, M.O.A. Photovoltaic solar energy: Conceptual framework. Renew. Sustain. Energy Rev. 2017, 74, 590–601. [Google Scholar] [CrossRef]
- Jung, H.J.; Kim, I.H.; Park, J. Experimental validation of energy harvesting device for cicivl engineering applicaitons. In Sensors and Smart Structures Technologies for Civil, Mechanical, and Aerospace Systems 2012; International Society for Optics and Photonics: Bellingham, DC, USA, 2012; p. 8345C. [Google Scholar]
- Lagomarsini, C.; Kachroudi, A.; Basrous, S.; Jean-Mistral, C.; Sylvestre, A. Autonomous electrostatic generator for energy harvesting applications under inertial load. In Electroactive Polymer Actuators and Devices (EAPAD) XX; International Society for Optics and Photonics: Bellingham, DC, USA, 2018. [Google Scholar]
- Cahill, P.; Mathewson, A.; Pakrashi, V. Experimental Validation of Piezoelectric Energy-Harvesting Device for Built Infrastructure Applications. J. Bridge Eng. 2018, 23, 04018056. [Google Scholar] [CrossRef]
- Farinholt, K.M.; Miller, N.; Sifuentes, W.; MacDonald, J.; Park, G.; Farrar, C.R. Energy harvesting and wireless energy transmission for embedded SHM sensor nodes. Struct. Health Monit. 2010, 9, 269–280. [Google Scholar] [CrossRef]
- Lu, X.; Wang, P.; Niyato, D.; Kim, D.I.; Han, Z. Wireless Networks With RF Energy Harvesting: A Contemporary Survey. IEEE Commun. Surv. Tutor. 2015, 17, 757–789. [Google Scholar] [CrossRef] [Green Version]
- Srbinovski, B.; Magno, M.; Edwards-Murphy, F.; Pakrashi, V.; Popovici, E. An Energy Aware Adaptive Sampling Algorithm for Energy Harvesting WSN with Energy Hungry Sensors. Sensors 2016, 16, 448. [Google Scholar] [CrossRef] [Green Version]
- Dürager, C.; Heinzelmann, A.; Riederer, D. A wireless sensor system for structural health monitoring with guided ultrasonic waves and piezoelectric transducers. Struct. Infrastruct. Eng. 2013, 9, 1177–1186. [Google Scholar] [CrossRef]
- Raghavan, A.; Cesni, K.C.E.S. Review of guided-wavd structural health monitoring. Shock Vib. Dig. 2007, 39, 91–114. [Google Scholar] [CrossRef]
- Ciang, C.C.; Lee, J.R.; Bang, H.J. Structural health monitoring for a wind turbine system: A review of damage detection methods. Meas. Sci. Technol. 2008, 19, 122001. [Google Scholar] [CrossRef] [Green Version]
- Fan, W.; Qiao, P. Vibration-based Damage Identification Methods: A Review and Comparative Study. Struct. Health Monit. 2011, 10, 83–111. [Google Scholar] [CrossRef]
- Shokrani, Y.; Dertimanis, V.K.; Chatzi, E.N.; Savoia, M.N. On the use of mode shape curvatures for damage localization under varying environmental conditions. Struct. Control Health Monit. 2018, 25, e2132. [Google Scholar] [CrossRef]
- Vo-Duy, T.; Ho-Huu, V.; Dang-Trung, H.; Nguyen-Thoi, T. A two-step approach for damage detection in laminated composite structures using modal strain energy method and an improved differential evolution algorithm. Compos. Struct. 2016, 147, 42–53. [Google Scholar] [CrossRef]
- Sung, S.H.; Koo, K.Y.; Jung, H.J. Modal flexibility-based damage detection of cantilever beam-type structures using baseline modification. J. Sound Vib. 2014, 333, 4123–4138. [Google Scholar] [CrossRef]
- Taylor, S.G.; Zimmerman, D.C. Improved Experimental Ritz Vector Extraction with Application to Damage Detection. J. Vib. Acoust. 2010, 132, 011012. [Google Scholar] [CrossRef]
- Kordestani, H.; Xiang, Y.-Q.; Ye, X.-W.; Jia, Y.-K. Application of the Random Decrement Technique in Damage Detection under Moving Load. Appl. Sci. 2018, 8, 753. [Google Scholar] [CrossRef] [Green Version]
- Yi, T.-H.; Li, H.-N.; Zhao, X.-Y. Noise Smoothing for Structural Vibration Test Signals Using an Improved Wavelet Thresholding Technique. Sensors 2012, 12, 11205–11220. [Google Scholar] [CrossRef] [Green Version]
- Zhang, J.; Yan, R.; Gao, R.X.; Feng, Z. Performance enhancement of ensemble empirical mode decomposition. Mech. Syst. Signal Process. 2010, 24, 2104–2123. [Google Scholar] [CrossRef]
- Meng, F.; Mokrani, B.; Alaluf, D.; Yu, J.; Preumont, A. Damage Detection in Active Suspension Bridges: An Experimental Investigation. Sensors 2018, 18, 3002. [Google Scholar] [CrossRef] [Green Version]
- Bao, C.; Hao, H.; Li, Z.-X. Integrated ARMA model method for damage detection of subsea pipeline system. Eng. Struct. 2013, 48, 176–192. [Google Scholar] [CrossRef]
- Lakshmi, K.; Rao, A.R.M.; Gopalakrishnan, N. Singular spectrum analysis combined with ARMAX model for structural damage detection. Struct. Control. Health Monit. 2017, 24, e1960. [Google Scholar] [CrossRef]
- Mosavi, A.A.; Dickey, D.; Seracino, R.; Rizkalla, S. Identifying damage locations under ambient vibrations utilizing vector autoregressive models and Mahalanobis distances. Mech. Syst. Signal Process. 2012, 26, 254–267. [Google Scholar] [CrossRef]
- Fan, X.; Li, J.; Hao, H. Piezoelectric mpedance based damage detection in truss bridges based on time frequency ARMA model. Smart Struct. Syst. 2016, 18, 501–523. [Google Scholar] [CrossRef]
- Shadan, F.; Khoshnoudian, F.; Esfandiari, A. A frequency response-based structural damage identification using model updating method. Struct. Control. Health Monit. 2016, 23, 286–302. [Google Scholar] [CrossRef]
- Shi, J.-Y.; Spencer, B.F., Jr.; Chen, S.-S. Damage detection in shear buildings using different estimated curvature. Struct. Control Health Monit. 2018, 25, e2050. [Google Scholar] [CrossRef]
- Rose, J.L. A Baseline and Vision of Ultrasonic Guided Wave Inspection Potential. J. Press. Vessel Technol. 2002, 124, 273–282. [Google Scholar] [CrossRef]
- Monchalin, J.-P. Laser-ultrasonics: Principles and industrial applications. In Ultrasonic and Advanced Methods for Nondestructive Testing and Material Characterization; World Scientific: Hackensack, NJ, USA, 2007; pp. 79–115. [Google Scholar]
- Park, B.; Sohn, H.; Malinowski, P.; Ostachowicz, W. Delamination localization in wind turbine blades based on adaptive time-of-flight analysis of noncontact laser ultrasonic signals. Nondestruct. Test. Eval. 2017, 32, 1–20. [Google Scholar] [CrossRef]
- Chen, H.; Zuo, M.J.; Wang, X.; Hoseini, M.R. An adaptive Morlet wavelet filter for time-of-flight estimation in ultrasonic damage assessment. Measurement 2010, 43, 570–585. [Google Scholar] [CrossRef]
- Giurgiutiu, V. Lamb Wave Generation with Piezoelectric Wafer Active Sensors for Structural Health Monitoring; SPIE: Bellingham, DC, USA, 2003; Volume 5056. [Google Scholar]
- Mustapha, S.; Lu, Y.; Li, J.; Ye, L. Damage detection in rebar-reinforced concrete beams based on time reversal of guided waves. Struct. Health Monit. 2014, 13, 347–358. [Google Scholar] [CrossRef]
- Schaal, C.; Bischoff, S.; Gaul, L. Damage detection in multi-wire cables using guided ultrasonic waves. Struct. Health Monit. 2016, 15, 279–288. [Google Scholar] [CrossRef]
- Alleyne, D.N.; Cawley, P. The interaction of Lamb waves with defects. IEEE Trans. Ultrason. Ferroelectr. Freq. Control 1992, 39, 381–397. [Google Scholar] [CrossRef] [PubMed]
- Yeung, C.; Ng, C.T. Time-domain spectral finite element method for analysis of torsional guided waves scattering and mode conversion by cracks in pipes. Mech. Syst. Signal Process. 2019, 128, 305–317. [Google Scholar] [CrossRef]
- Wang, C.H.; Rose, J.T.; Chang, F.-K. A synthetic time-reversal imaging method for structural health monitoring. Smart Mater. Struct. 2004, 13, 415–423. [Google Scholar] [CrossRef]
- Zhao, X.; Gao, H.; Zhang, G.; Ayhan, B.; Yan, F.; Kwan, C.; Rose, J.L. Active health monitoring of an aircraft wing with embedded piezoelectric sensor/actuator network: I. Defect detection, localization and growth monitoring. Smart Mater. Struct. 2007, 16, 1208–1217. [Google Scholar] [CrossRef]
- Michaels, J.E.; Michaels, T.E. Guided wave signal processing and image fusion for in situ damage localization in plates. Wave Motion 2007, 44, 482–492. [Google Scholar] [CrossRef]
- Ng, C.T.; Veidt, M. A Lamb-wave-based technique for damage detection in composite laminates. Smart Mater. Struct. 2009, 18, 074006. [Google Scholar] [CrossRef]
- Soleimanpour, R.; Ng, C.-T. Locating delaminations in laminated composite beams using nonlinear guided waves. Eng. Struct. 2017, 131, 207–219. [Google Scholar] [CrossRef] [Green Version]
- Joglekar, D.M.; Mitra, M. Time domain analysis of nonlinear frequency mixing in a slender beam for localizing a breathing crack. Smart Mater. Struct. 2016, 26, 025009. [Google Scholar] [CrossRef]
- He, S.; Ng, C.T. Modelling and analysis of nonlinear guided waves interaction at a breathing crack using time-domain spectral finite element method. Smart Mater. Struct. 2017, 26, 085002. [Google Scholar] [CrossRef]
- Guan, R.; Lu, Y.; Wang, K.; Su, Z. Fatigue crack detection in pipes with multiple mode nonlinear guided waves. Struct. Health Monit. 2019, 18, 180–192. [Google Scholar] [CrossRef]
- Rose, L.R.F.; Wang, C.H. Mindlin plate theory for damage detection: Imaging of flexural inhomogeneities. J. Acoust. Soc. Am. 2010, 127, 754–763. [Google Scholar] [CrossRef]
- Ng, C.T. A two-stage approach for quantitative damage imaging in metallic plates using Lamb waves. Enarthquakes Struct. 2015, 8, 821–841. [Google Scholar] [CrossRef] [Green Version]
- Niethammer, M.; Jacobs, L.J.; Qu, J.; Jarzynski, J. Time-frequency representation of Lamb waves using the reassigned spectrogram. J. Acoust. Soc. Am. 2000, 107, L19–L24. [Google Scholar] [CrossRef] [PubMed] [Green Version]
- Bandara, S.; Rajeev, P.; Gad, E.; Sriskantharajah, B.; Flatley, I. Damage detection of in service timber poles using Hilbert-Huang transform. NDT E Int. 2019, 107, 102141. [Google Scholar] [CrossRef]
- Feng, B.; Ribeiro, A.L.; Ramos, H.G. A new method to detect delamination in composites using chirp-excited Lamb wave and wavelet analysis. NDT E Int. 2018, 100, 64–73. [Google Scholar] [CrossRef]
- Kim, C.-Y.; Park, K.-J. Mode separation and characterization of torsional guided wave signals reflected from defects using chirplet transform. NDT E Int. 2015, 74, 15–23. [Google Scholar] [CrossRef]
- Wandowski, T.; Malinowski, P.; Ostachowicz, W. Circular sensing networks for guided waves based structural health monitoring. Mech. Syst. Signal Process. 2016, 66, 248–267. [Google Scholar] [CrossRef]
- Wandowski, T.; Malinowski, P.; Ostachowicz, W.M. Damage detection with concentrated configurations of piezoelectric transducers. Smart Mater. Struct. 2011, 20, 025002. [Google Scholar] [CrossRef]
- Ma, L.; Du, M.; Wang, Z.; Chung, H.; Li, F.; Cheung, C.A.S. Damage Assessment of High-Speed EMU Train Bolsters via PZT Sensor Network-Based SHM Technology. In Proceedings of the 11th International Workshop on Structural Health Monitoring, Stanford, CA, USA, 12–14 September 2017. [Google Scholar] [CrossRef]
- Dai, H.; Gallo, G.J.; Schumacher, T.; Thostenson, E.T. A Novel Methodology for Spatial Damage Detection and Imaging Using a Distributed Carbon Nanotube-Based Composite Sensor Combined with Electrical Impedance Tomography. J. Nondestruct. Eval. 2016, 35, 26. [Google Scholar] [CrossRef]
- Lau, K.; Chan, C.; Zhou, L.; Jin, W. Strain monitoring in composite-strengthened concrete structures using optical fibre sensors. Compos. Part B Eng. 2001, 32, 33–45. [Google Scholar] [CrossRef]
- Hackmann, G.; Sun, F.; Castaneda, N.; Lu, C.; Dyke, S. A holistic approach to decentralized structural damage localization using wireless sensor networks. Comput. Commun. 2012, 36, 29–41. [Google Scholar] [CrossRef] [Green Version]
- Bhuiyan, M.Z.A.; Wang, G.; Cao, J.; Wu, J. Energy and bandwidth-efficient wireless sensor networks for monitoring high-frequency events. In Proceedings of the 2013 IEEE International Conference on Sensing, Communications and Networking (SECON), New Orleans, LA, USA, 24–27 June 2013; pp. 194–202. [Google Scholar]
- Liu, X.; Cao, J.; Lai, S.; Yang, C.; Wu, H.; Xu, Y.L. Energy efficient clustering for WSN-based structural health monitoring. In Proceedings of the 2011 Proceedings IEEE INFOCOM, Shanghai, China, 10–15 April 2011; pp. 2768–2776. [Google Scholar]
- Bhuiyan, M.Z.A.; Wang, G.; Cao, J. Sensor Placement with Multiple Objectives for Structural Health Monitoring in WSNs. In Proceedings of the 2012 IEEE 14th International Conference on High Performance Computing and Communication & 2012 IEEE 9th International Conference on Embedded Software and Systems, Liverpool, UK, 25–27 June 2012; pp. 699–706. [Google Scholar]
- Bhuiyan, M.Z.A.; Wang, G.; Cao, J.; Wu, J. Deploying wireless sensor networks with fault-tolerance for structural health monitoring. IEEE Trans. Comput. 2015, 64, 382–395. [Google Scholar] [CrossRef]
- Jang, S.; Jo, H.; Cho, S.; Mechitov, K.; Rice, J.A.; Sim, S.-H.; Jung, H.-J.; Yun, C.-B.; Spencer, B.F., Jr.; Agha, G. Structural health monitoring of a cable-stayed bridge using smart sensor technology: Deployment and evaluation. Smart Struct. Syst. 2010, 6, 439–459. [Google Scholar] [CrossRef] [Green Version]
- Spencer, B.; Cho, S. Wireless smart sensor technology for monitoring civil infrastructure: Technological developments and full-scale applications. In Proceedings of the World Congress on Advances in Structural Engineering and Mechanics (ASEM’11), Seoul, Korea, 18–23 September 2011; pp. 1–28. [Google Scholar]
- Kim, S.; Pakzad, S.; Culler, D.; Demmel, J.; Fenves, G.; Glaser, S.; Turon, M. Health monitoring of civil infrastructures using wireless sensor networks. In Proceedings of the 6th International Conference on Information Processing in Sensor Networks, Cambridge, MA, USA, 25–27 April 2007; pp. 254–263. [Google Scholar]
- Ali, S.H.; Zaid, M.; Abdullah, M.; Khan, T.M.R. SHM of Concrete Bridge Structures using Wireless Sensor Networks. In Proceedings of the Smart SysTech 2018; European Conference on Smart Objects, Systems and Technologies, Munich, Germany, 12–13 June 2018; pp. 1–6. [Google Scholar]
- Wolfs, P.J.; Bleakley, S.; Senini, S.T.; Thomas, P. An autonomous, low cost, distributed method for observing vehicle track interactions. In Proceedings of the ASME/IEEE 2006 Joint Rail Conference, Atlanta, GA, USA, 4–6 April 2006; pp. 279–286. [Google Scholar]
- Tam, H.; Lee, T.; Ho, S.; Haber, T.; Graver, T.; Méndez, A.; House, K.; Tin, S. Utilization of fiber optic Bragg Grating sensing systems for health monitoring in railway applications. Struct. Health Monit. Quantif. Valid. Implement. 2007, 1, 2. [Google Scholar]
- Reason, J.M.; Chen, H.; Crepaldi, R.; Duri, S. Intelligent telemetry for freight trains. In Proceedings of the International Conference on Mobile Computing, Applications, and Services, San Diego, CA, USA, 26–29 October 2009; pp. 72–91. [Google Scholar]
- Westeon, P.; Ling, C.; Roberts, C.; Goodman, C.; Li, P.; Goodall, R. Monitoring vertical track irregularity from in-service railway vehicles. Proc. Inst. Mech. Eng. Part F J. Rail Rapid Transit 2007, 221, 75–88. [Google Scholar] [CrossRef]
- Weston, P.; Roberts, C.; Goodman, C.; Ling, C. Condition monitoring of railway track using in-service trains. In Proceedings of the 2006 IET International Conference on Railway Condition Monitoring, Birmingham, UK, 29–30 November 2006; pp. 26–31. [Google Scholar]
- Mori, H.; Tsunashima, H.; Kojima, T.; Matsumoto, A.; Mizuma, T. Condition monitoring of railway track using in-service vehicle. J. Mech. Syst. Transp. Logist. 2010, 3, 154–165. [Google Scholar] [CrossRef] [Green Version]
- Nuffer, J.; Bein, T. Application of piezoelectric materials in transportation industry. In Proceedings of the Global Symposium on Innovative Solutions for the Advancement of the Transport Industry, Donostia-San Sebastian, Spain, 4–6 October 2006. [Google Scholar]
- Matsumoto, A.; Sato, Y.; Ohno, H.; Shimizu, M.; Kurihara, J.; Tomeoka, M.; Saitou, T.; Michitsuji, Y.; Tanimoto, M.; Sato, Y.; et al. Continuous observation of wheel/rail contact forces in curved track and theoretical considerations. Veh. Syst. Dyn. 2012, 50, 349–364. [Google Scholar] [CrossRef] [Green Version]
- Notay, J.K.; Safdar, G.A. A wireless sensor network based structural health monitoring system for an airplane. In Proceedings of the 17th International Conference on Automation and Computing, Huddersfield, UK, 10 September 2011; pp. 240–245. [Google Scholar]
- Becker, T.; Kluge, M.; Schalk, J.; Tiplady, K.; Paget, C.; Hilleringmann, U.; Otterpohl, T. Autonomous sensor nodes for aircraft structural health monitoring. IEEE Sens. J. 2009, 9, 1589–1595. [Google Scholar] [CrossRef]
- Arms, S.; Galbreath, J.; Townsend, C.; Churchill, D.; Corneau, B.; Ketcham, R.; Phan, N. Energy harvesting wireless sensors and networked timing synchronization for aircraft structural health monitoring. In Proceedings of the 2009 1st International Conference on Wireless Communication, Vehicular Technology, Information Theory and Aerospace & Electronic Systems Technology, Aalborg, Denmark, 17–20 May 2009; pp. 16–20. [Google Scholar]
- Cao, J.; Liu, X. Structural Health Monitoring Using Wireless Sensor Networks. In Mobile and Pervasive Computing in Construction; John Wiley & Sons Ltd.: Hoboken, NJ, USA, 2012; pp. 210–236. [Google Scholar] [CrossRef]
- Dos Santos, I.L.; Pirmez, L.; Lemos, É.T.; Delicato, F.C.; Pinto, L.A.V.; de Souza, J.N.; Zomaya, A.Y. A localized algorithm for Structural Health Monitoring using wireless sensor networks. Inf. Fusion 2014, 15, 114–129. [Google Scholar] [CrossRef]
- Beygzadeh, S.; Salajegheh, E.; Torkzadeh, P.; Salajegheh, J.; Naseralavi, S. Optimal sensor placement for damage detection based on a new geometrical viewpoint. Int. J. Optim. Civ. Eng. 2013, 3, 1–21. [Google Scholar]
- Hodge, V.J.; O’Keefe, S.; Weeks, M.; Moulds, A. Wireless sensor networks for condition monitoring in the railway industry: A survey. IEEE Trans. Intell. Transp. Syst. 2015, 16, 1088–1106. [Google Scholar] [CrossRef]
- Chintalapudi, K.; Fu, T.; Paek, J.; Kothari, N.; Rangwala, S.; Caffrey, J.; Govindan, R.; Johnson, E.; Masri, S. Monitoring civil structures with a wireless sensor network. IEEE Internet Comput. 2006, 10, 26–34. [Google Scholar] [CrossRef]
- Cammarano, A.; Spenza, D.; Petrioli, C. Energy-harvesting WSNs for structural health monitoring of underground train tunnels. In Proceedings of the 2013 IEEE Conference on Computer Communications Workshops (INFOCOM WKSHPS), Turin, Italy, 14–19 April 2013; pp. 75–76. [Google Scholar]
- Dilhac, J.-M.; Bafleur, M. Energy harvesting in aeronautics for battery-free wireless sensor networks. IEEE Aerosp. Electron. Syst. Mag. 2014, 29, 18–22. [Google Scholar] [CrossRef] [Green Version]
- Qiu, L.; Yuan, S.; Liu, P.; Qian, W. Design of an all-digital impact monitoring system for large-scale composite structures. IEEE Trans. Instrum. Meas. 2013, 62, 1990–2002. [Google Scholar] [CrossRef]
- Li, B.; Wang, D.; Wang, F.; Ni, Y.Q. High quality sensor placement for SHM systems: Refocusing on application demands. In Proceedings of the 2010 Proceedings IEEE INFOCOM, San Diego, CA, USA, 14–19 March 2010; pp. 1–9. [Google Scholar]
- Low, K.S.; Win, W.N.N.; Er, M.J. Wireless sensor networks for industrial environments. In Proceedings of the International Conference on Computational Intelligence for Modelling, Control and Automation and International Conference on Intelligent Agents, Web Technologies and Internet Commerce (CIMCA-IAWTIC’06), Vienna, Austria, 28–30 November 2005; pp. 271–276. [Google Scholar]
- Werb, J.; Newman, M.; Berry, V.; Lamb, S.; Sexton, D.; Lapinski, M. Improved quality of service in IEEE 802.15.4 mesh networks. In Proceedings of the International Workshop on Wireless and Industrial Automation, San Francisco, CA, USA, 7 March 2005; pp. 1–6. [Google Scholar]
- Bannister, K.; Giorgetti, G.; Gupta, S. Wireless sensor networking for hot applications: Effects of temperature on signal strength, data collection and localization. In Proceedings of the 5th Workshop on Embedded Networked Sensors (HotEmNets’08), Charlottesville, VA, USA, 2–3 June 2008. [Google Scholar]
Figure 1.
Main components of an SHM system.

Figure 2.
Snapshot of the SenOpT optimizer for placement of PZT wafers.

Figure 3.
Airbus A330–200 cargo door position and dimensions [50].
Figure 3.
Airbus A330–200 cargo door position and dimensions [50].

Figure 4.
Design of a sensor network: (a) preliminary and (b) optimized solutions.

Figure 5.
The concept of the stretchable sensor network where the distances between sensors before deployment (a) are short in comparison to the deployed network (b): x << y.
Figure 5.
The concept of the stretchable sensor network where the distances between sensors before deployment (a) are short in comparison to the deployed network (b): x << y.

Figure 6.
The sensor array for baseline-free damage diagnosis—a and b correspond to the horizontal and vertical distances between the sensor pairs, respectively.
Figure 6.
The sensor array for baseline-free damage diagnosis—a and b correspond to the horizontal and vertical distances between the sensor pairs, respectively.

Figure 7.
Schematic diagram of the wireless sensor [92].
Figure 7.
Schematic diagram of the wireless sensor [92].

Figure 8.
(a) CNT composite sensor on the specimen with artificial crack; (b) EIT maps of normalized conductivity change and (c) map from IR thermography [156].
Figure 8.
(a) CNT composite sensor on the specimen with artificial crack; (b) EIT maps of normalized conductivity change and (c) map from IR thermography [156].

Figure 9.
Truss structure in experiment test [158].
Figure 9.
Truss structure in experiment test [158].

Figure 10.
Sensor arrangement on the bridge [163].
Figure 10.
Sensor arrangement on the bridge [163].

Figure 11.
Power spectral density from the deck vibration at mid-span, quarter span, and pylon [164].
Figure 11.
Power spectral density from the deck vibration at mid-span, quarter span, and pylon [164].

Figure 12.
WSN installed in (a) fuel tanks and (b) wings [175].
Figure 12.
WSN installed in (a) fuel tanks and (b) wings [175].

Figure 13.
Data transmission in different WSN-based SHM approaches with 10-sensors deployed on a real structure [162].
Figure 13.
Data transmission in different WSN-based SHM approaches with 10-sensors deployed on a real structure [162].


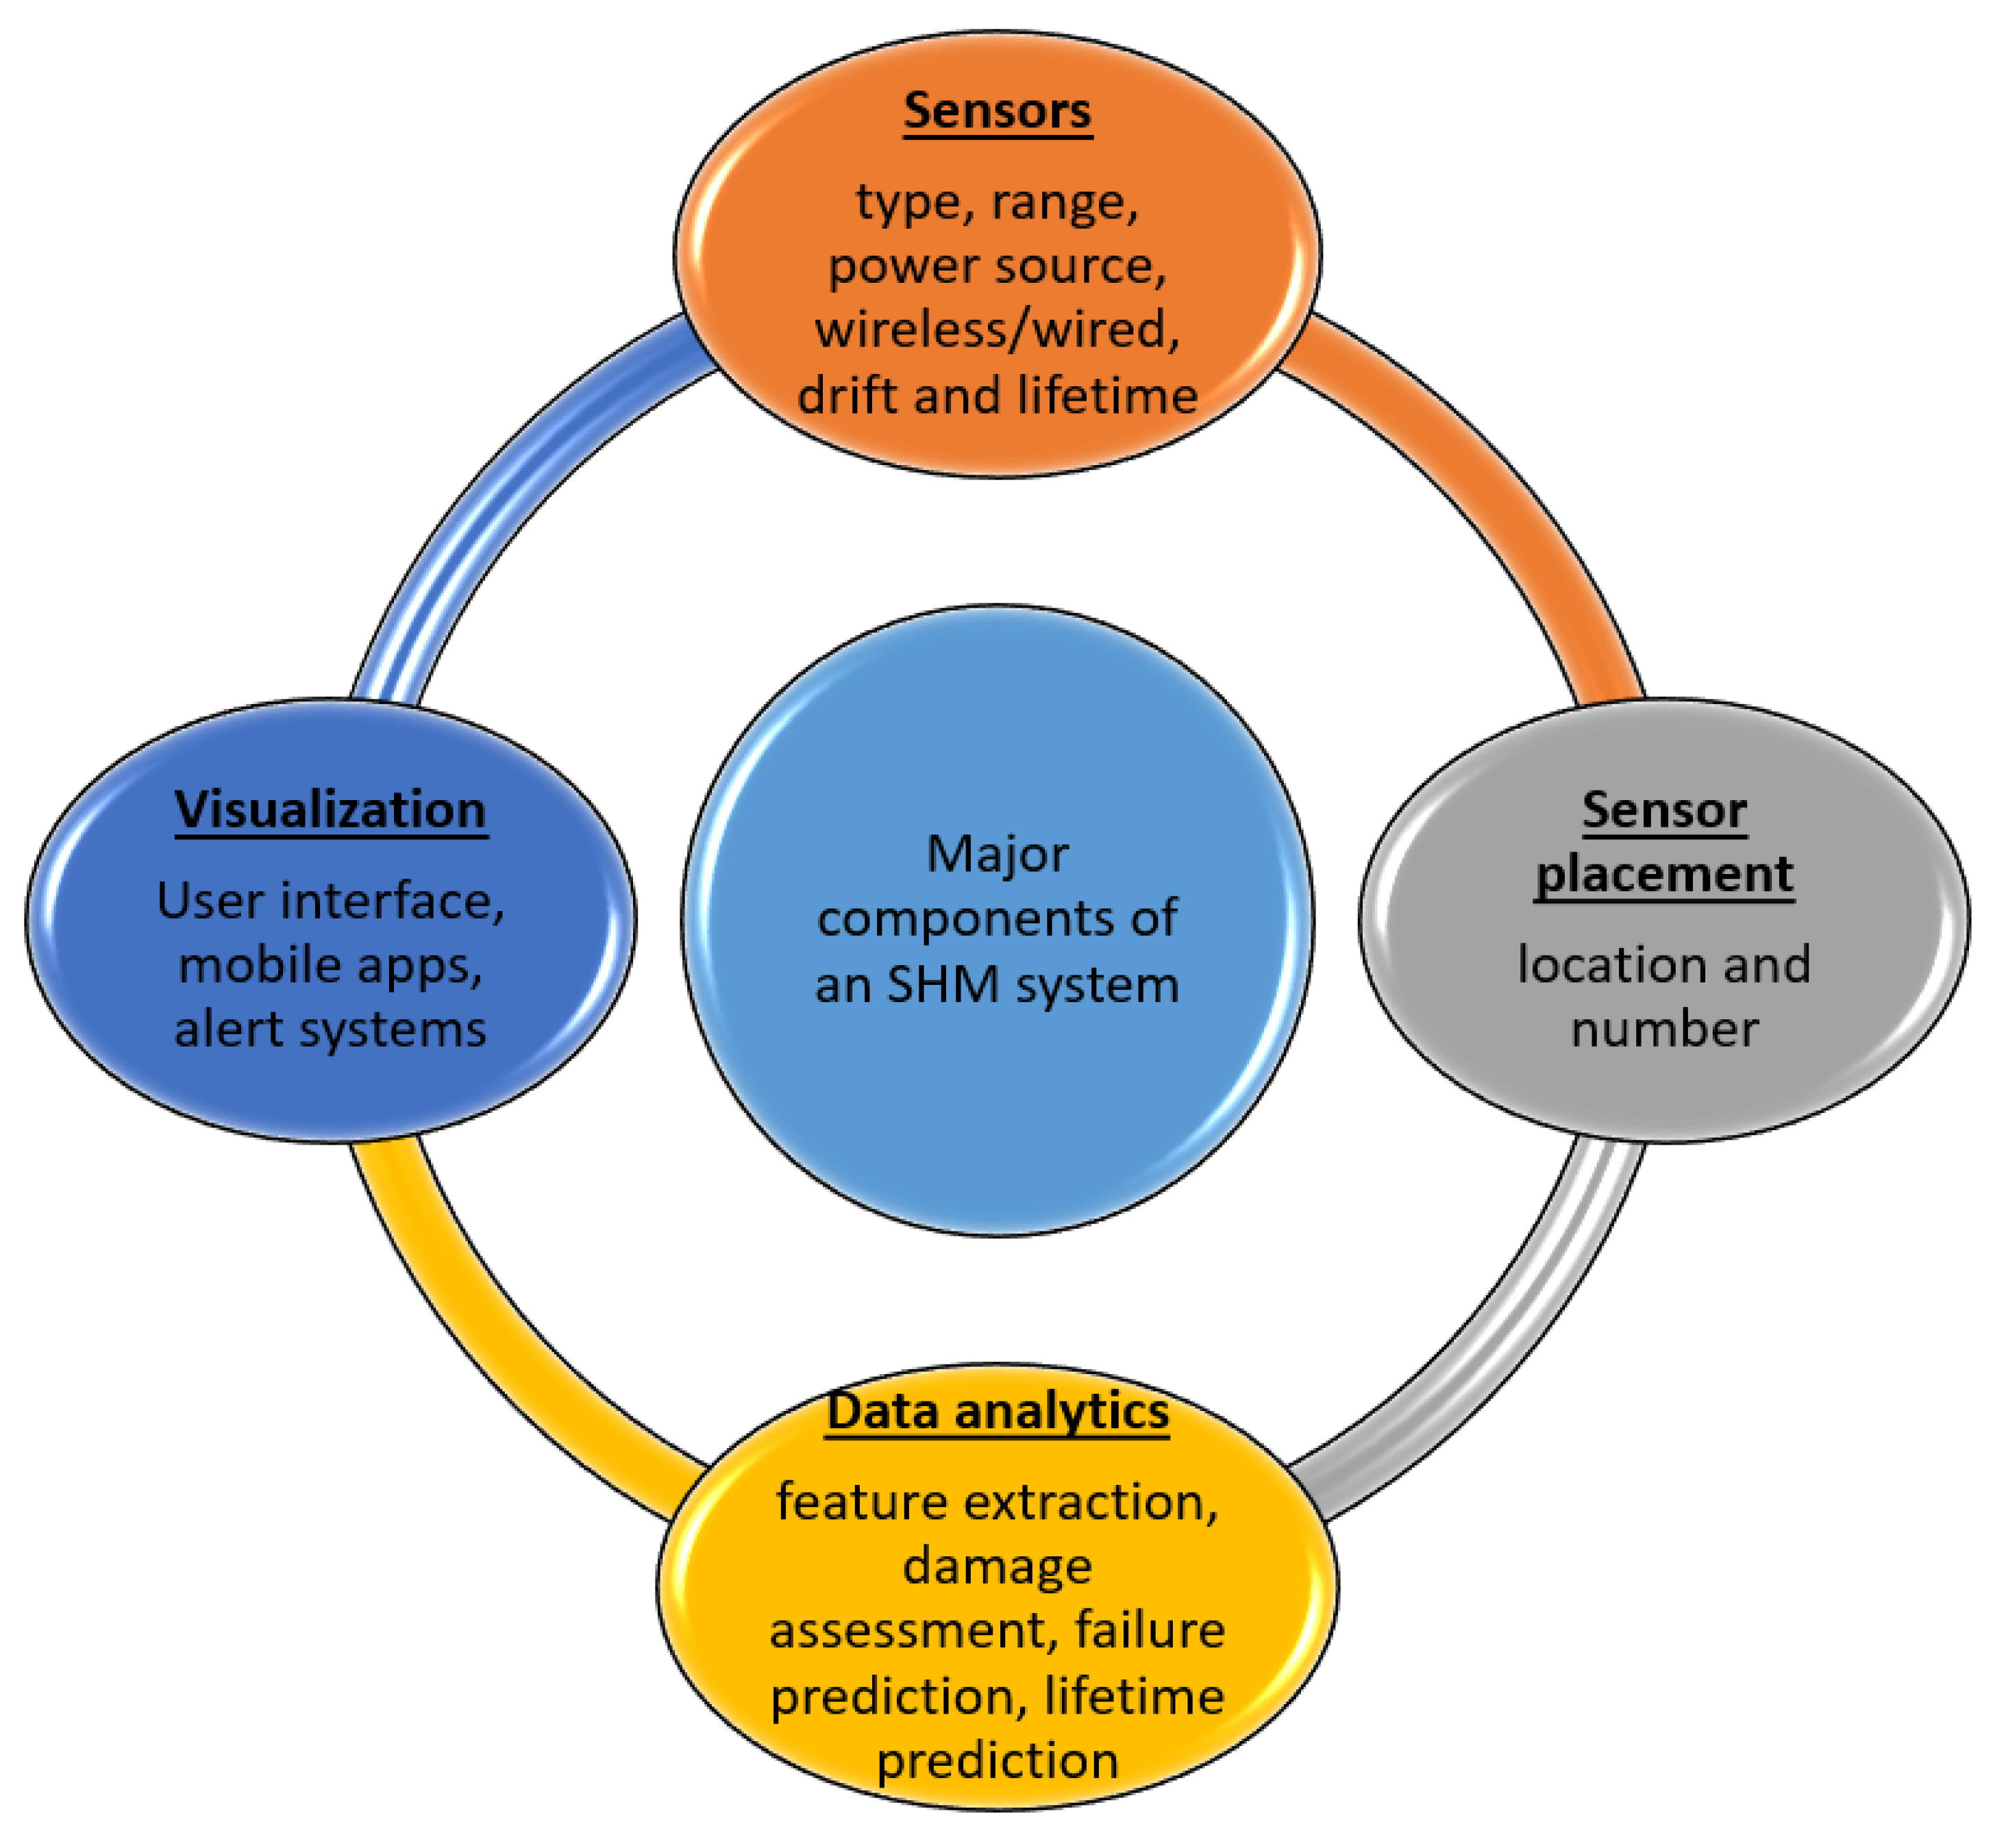
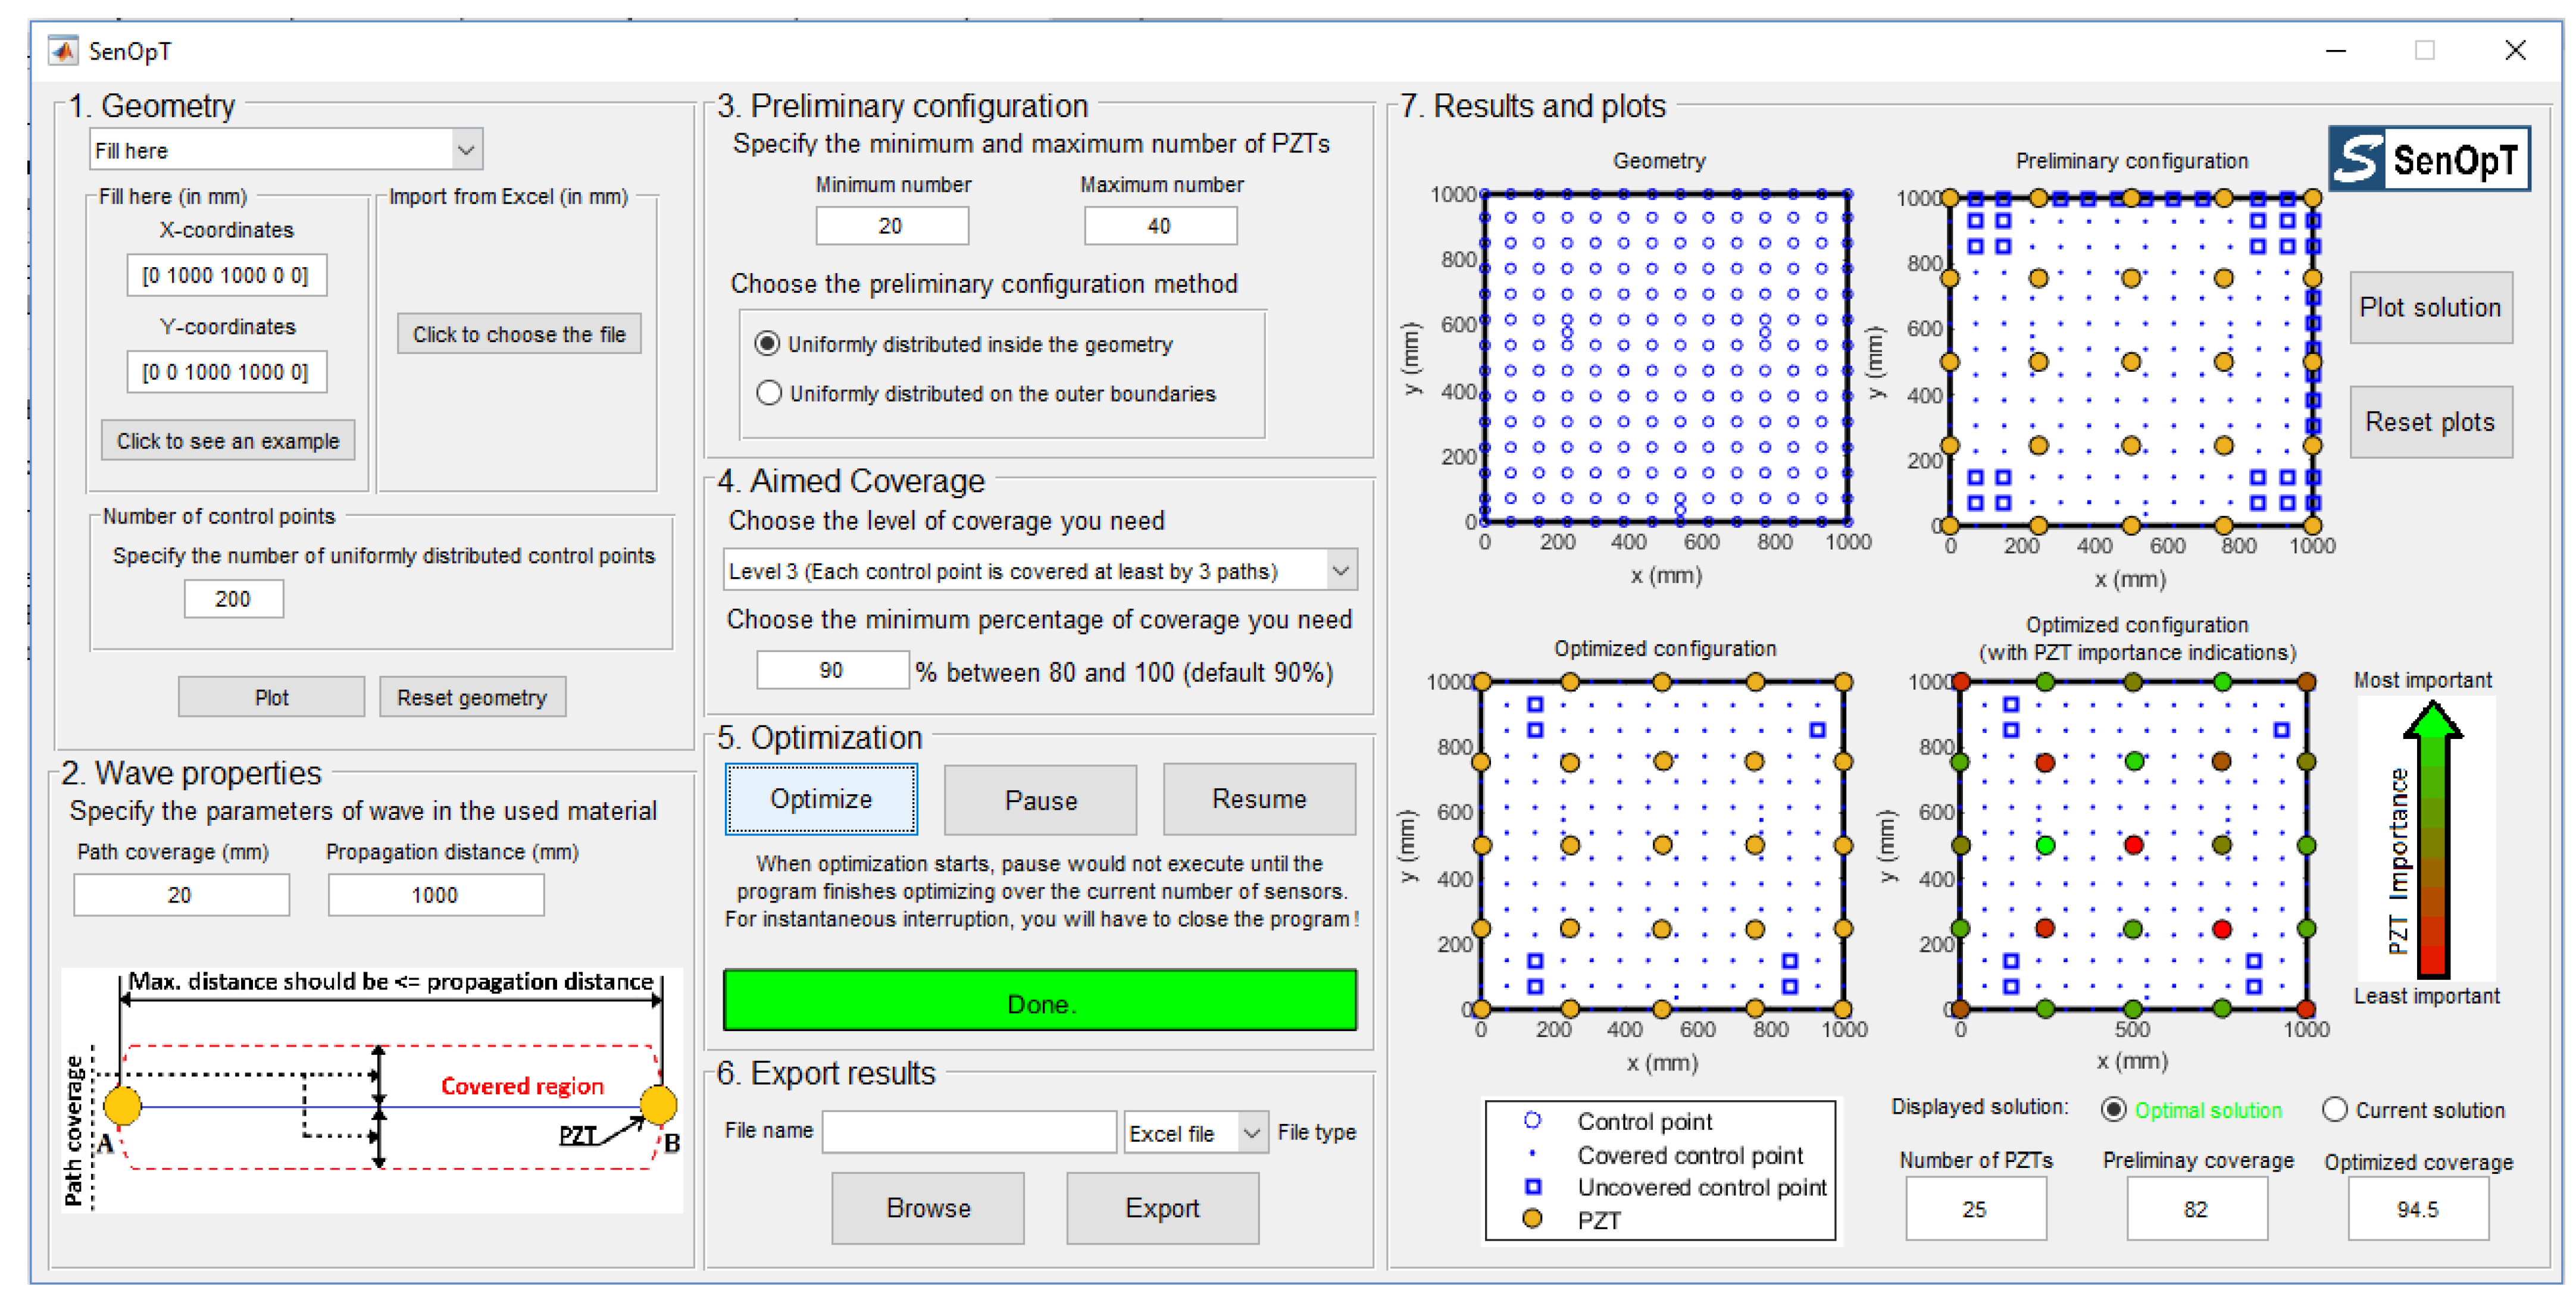
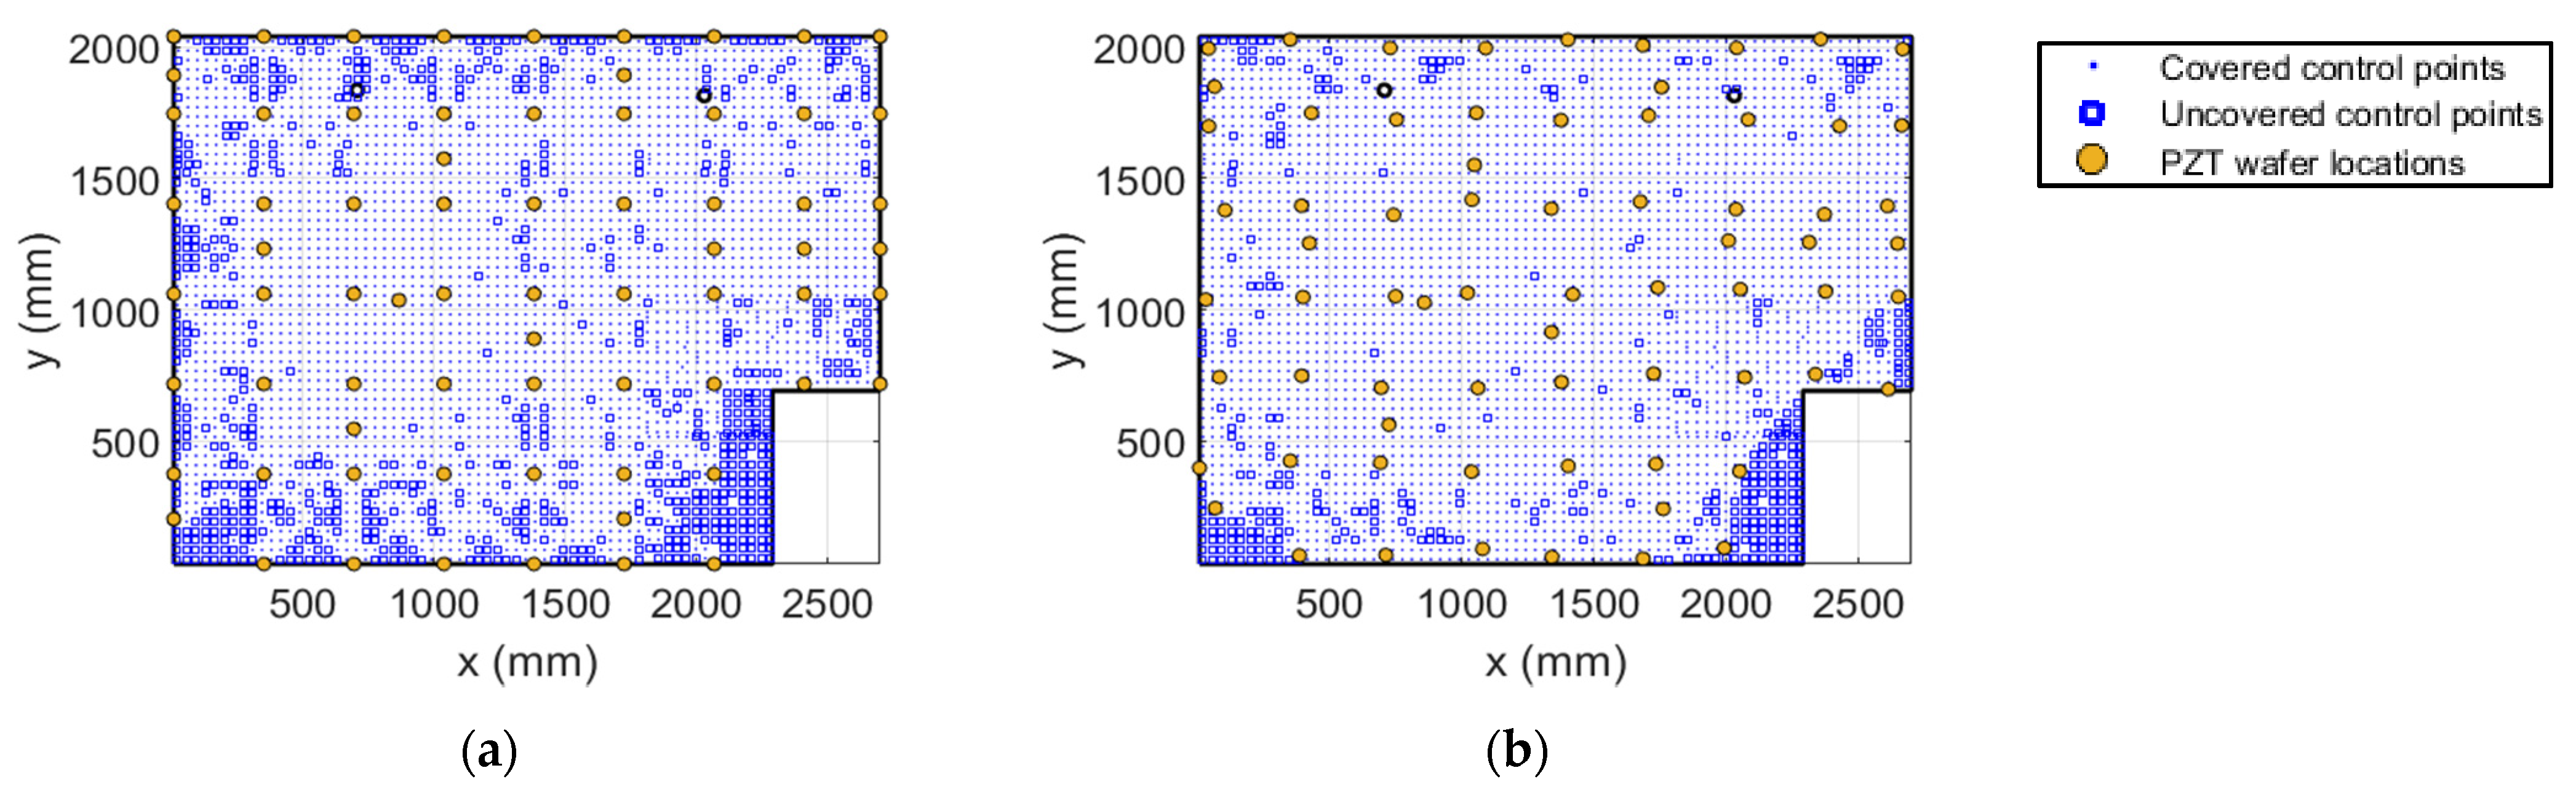
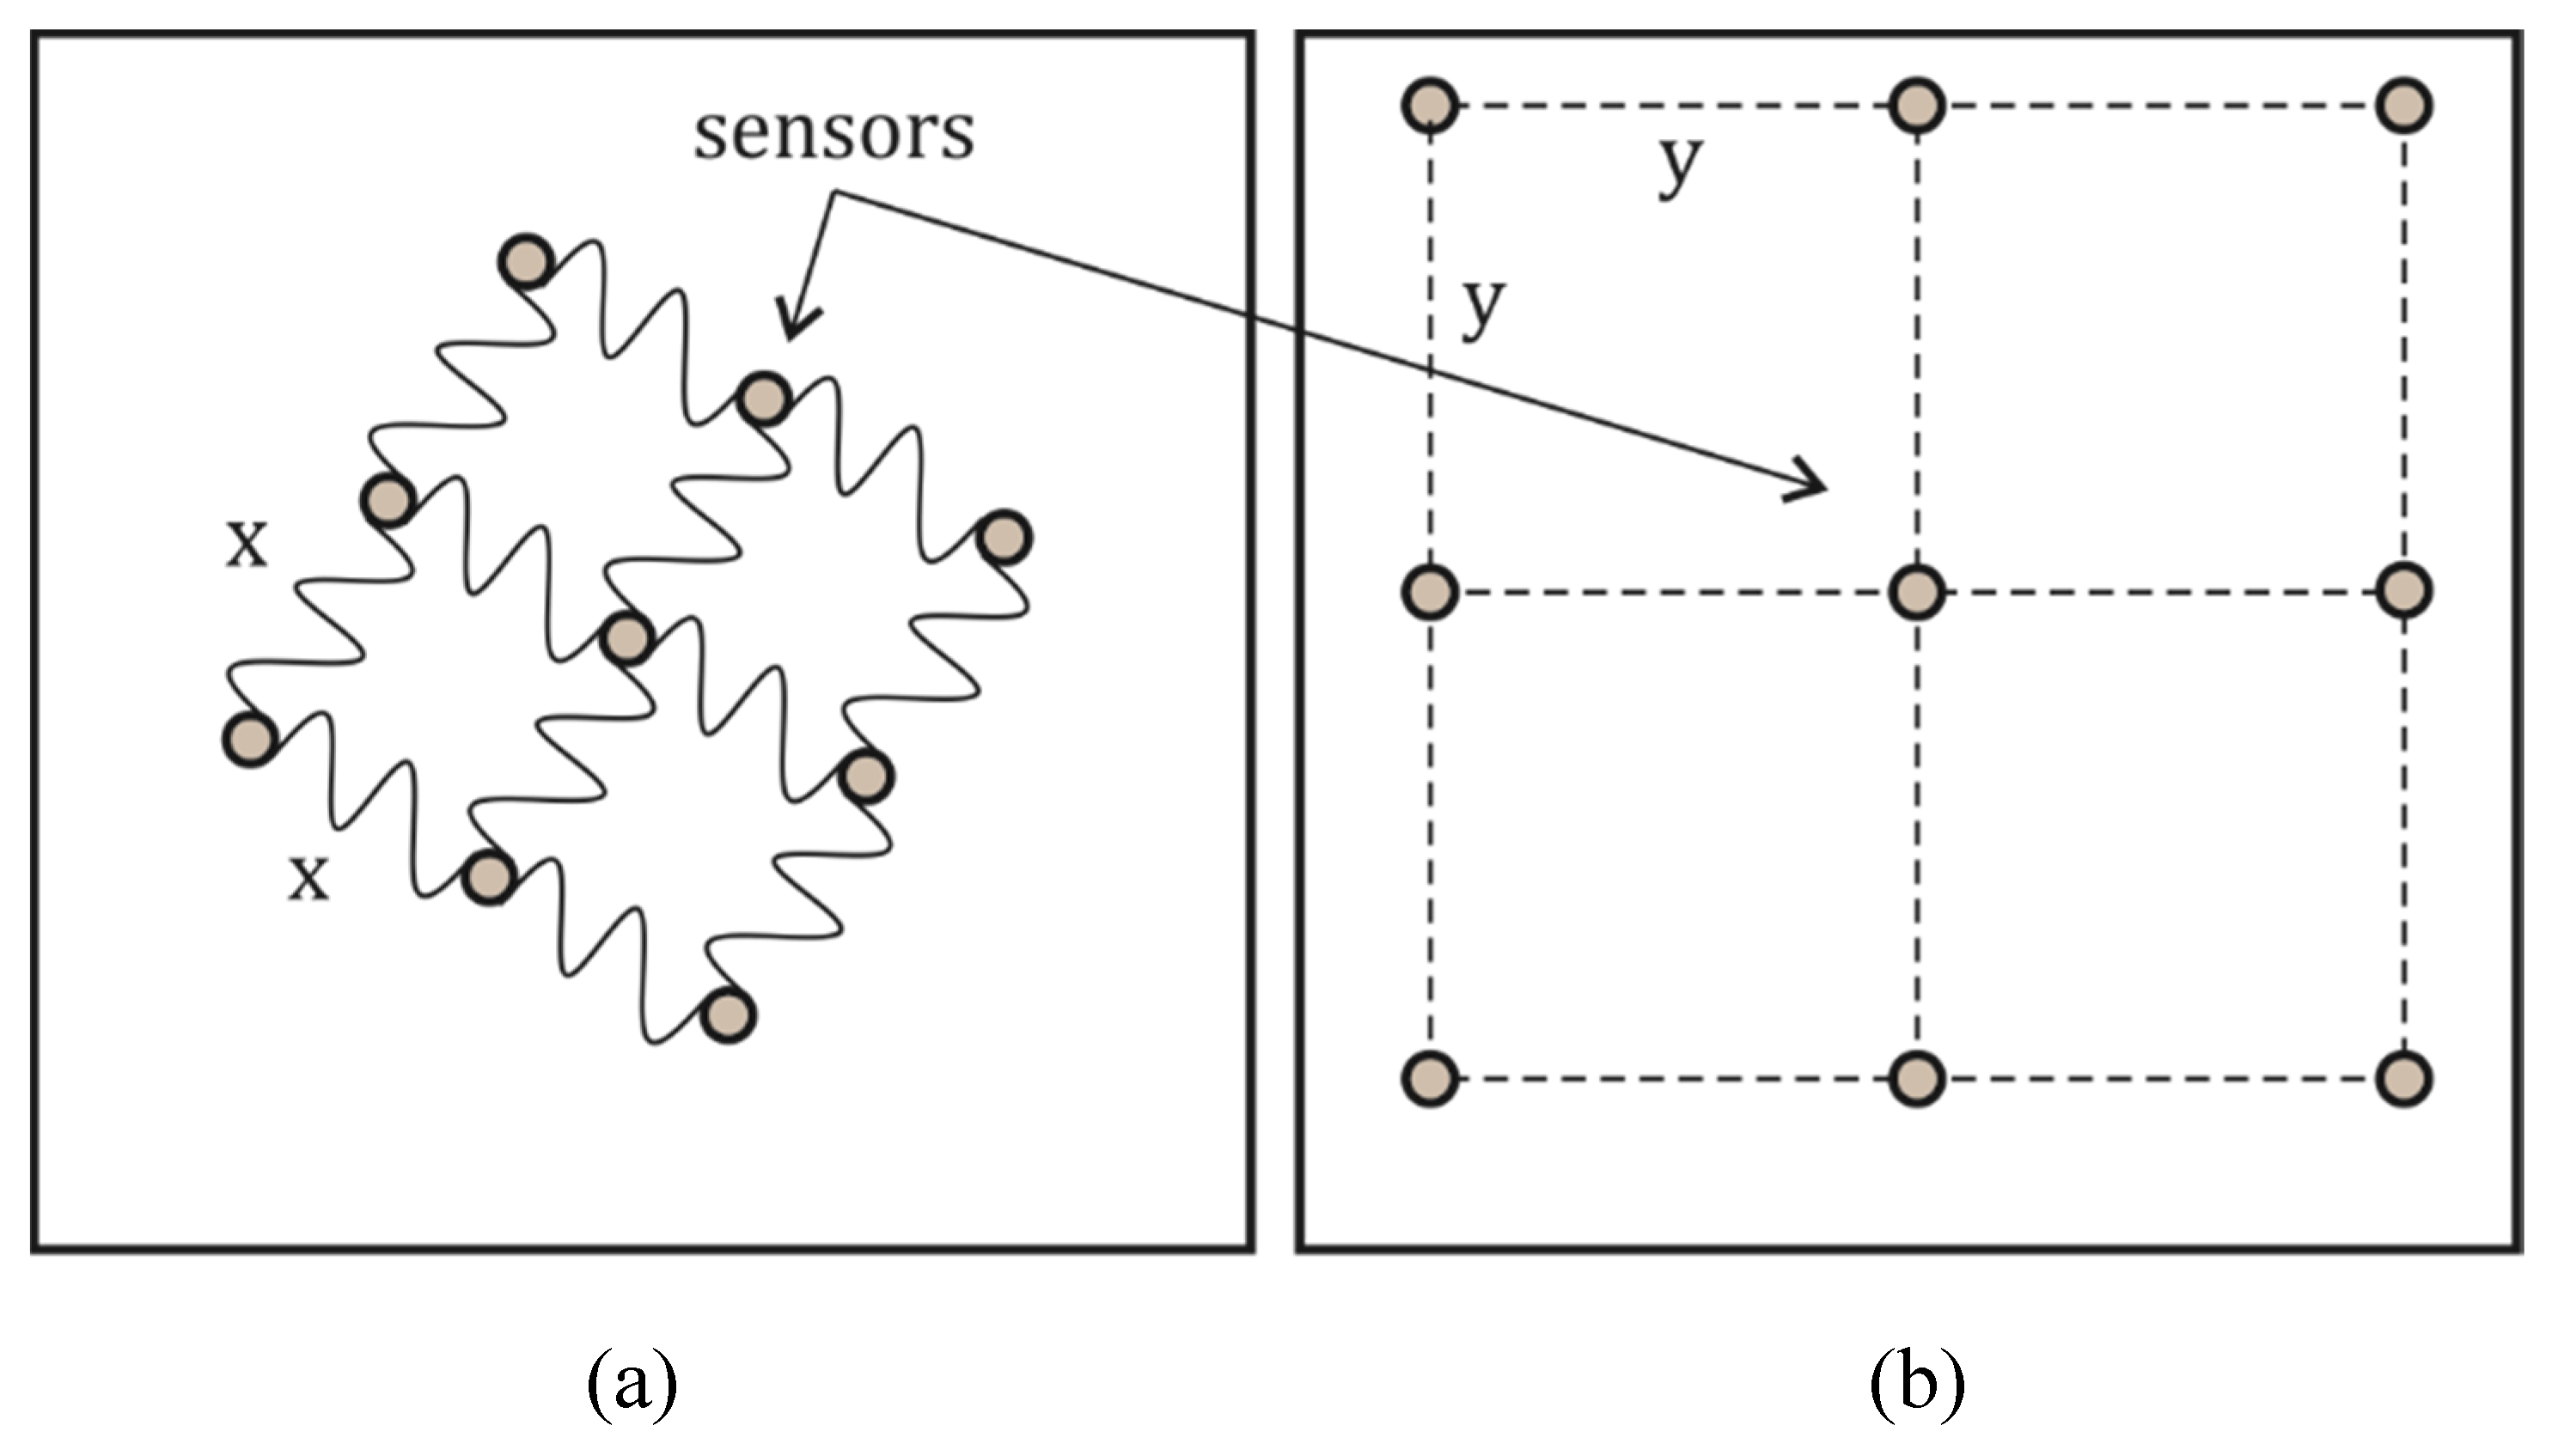
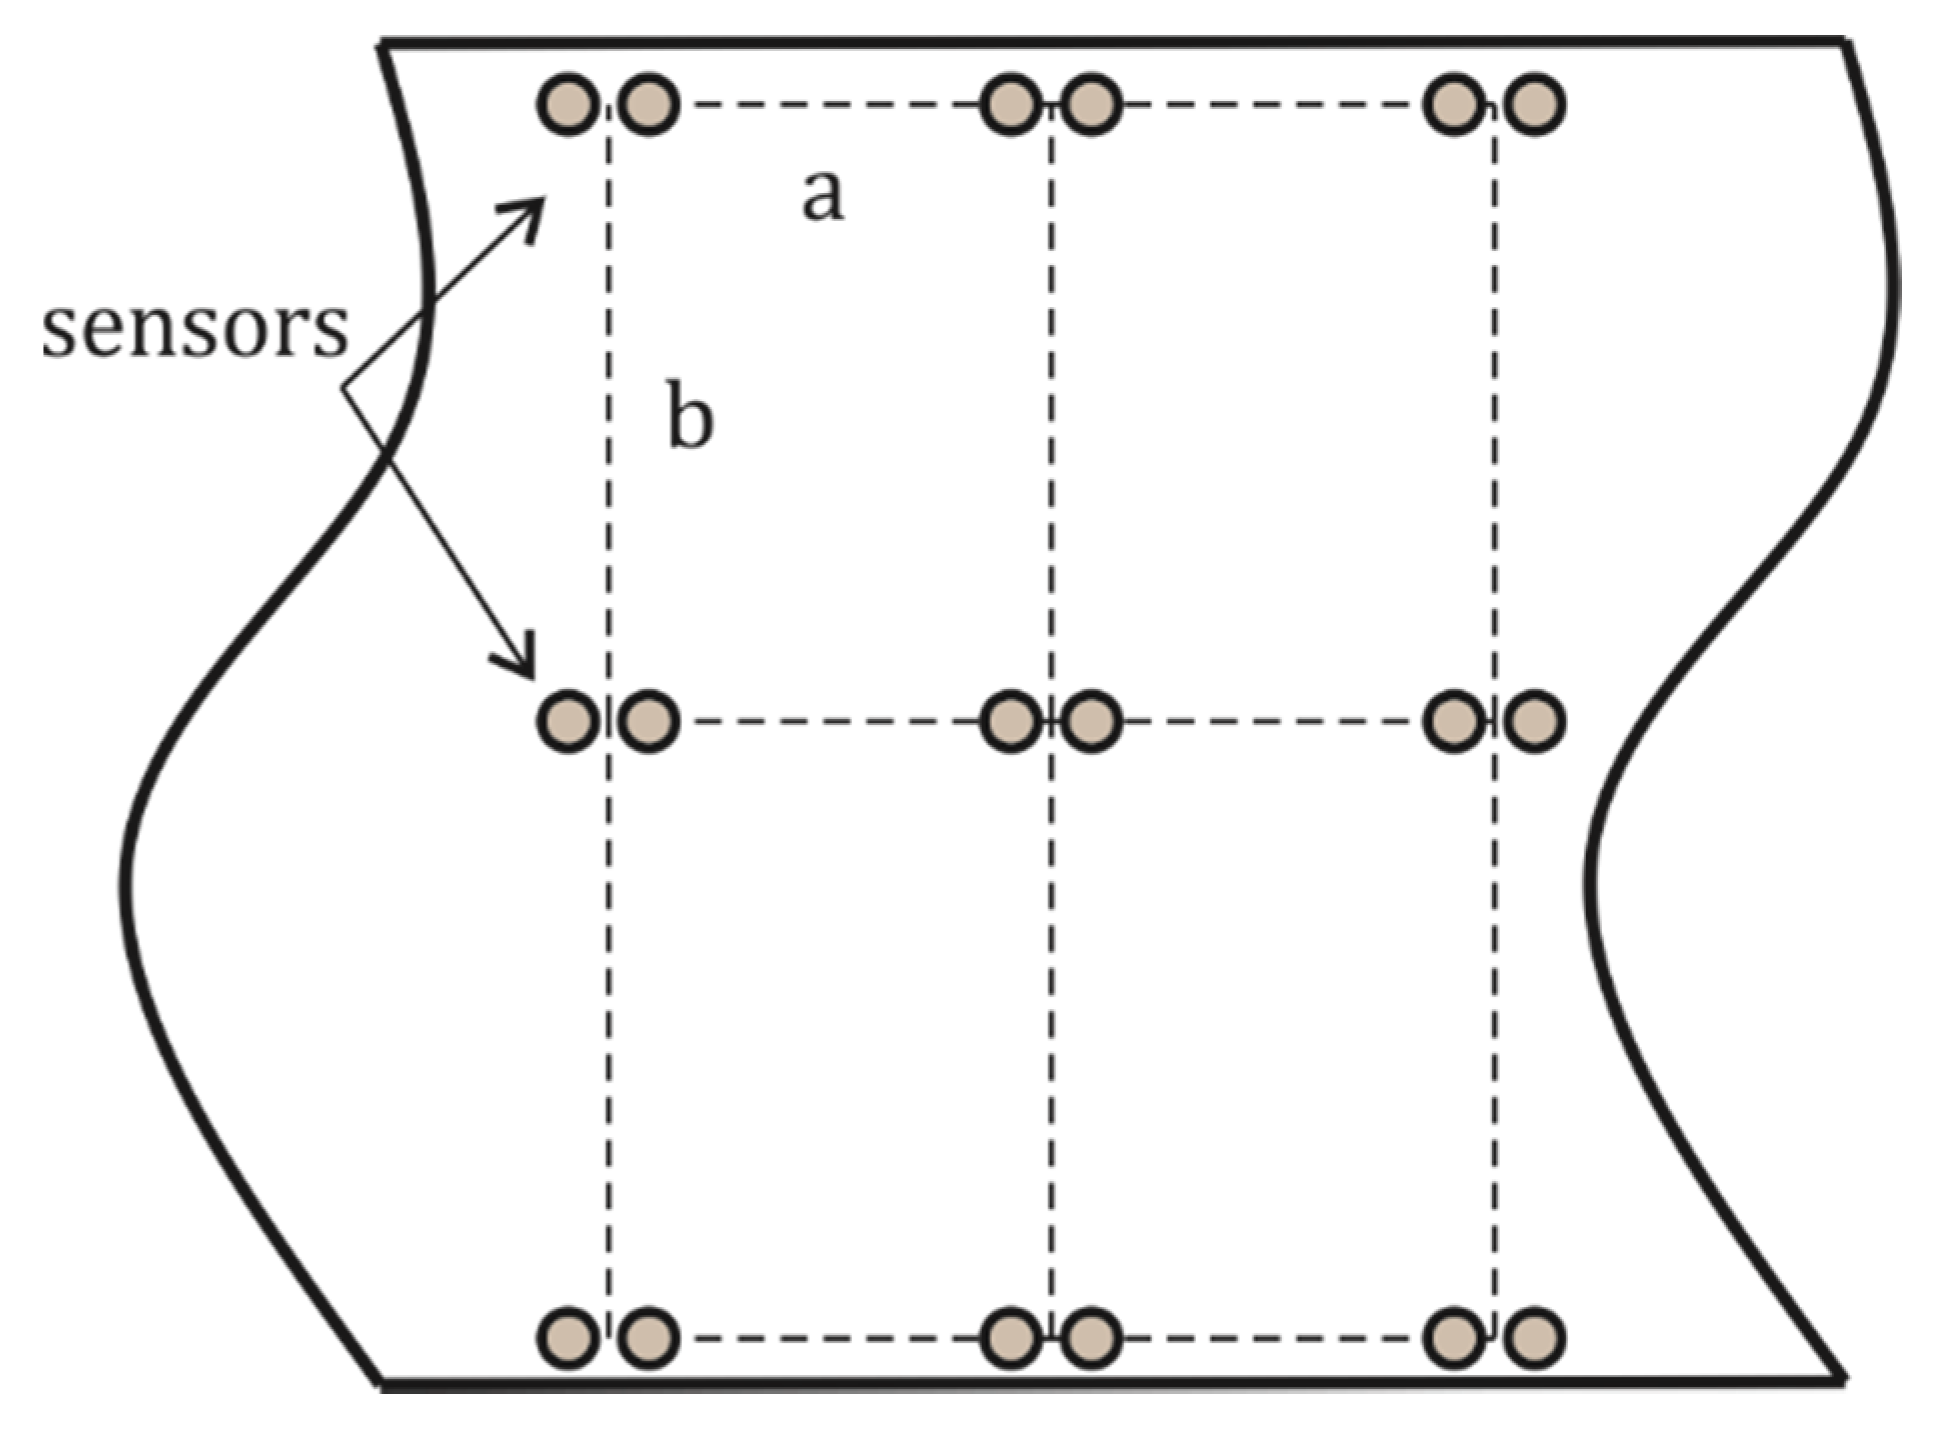
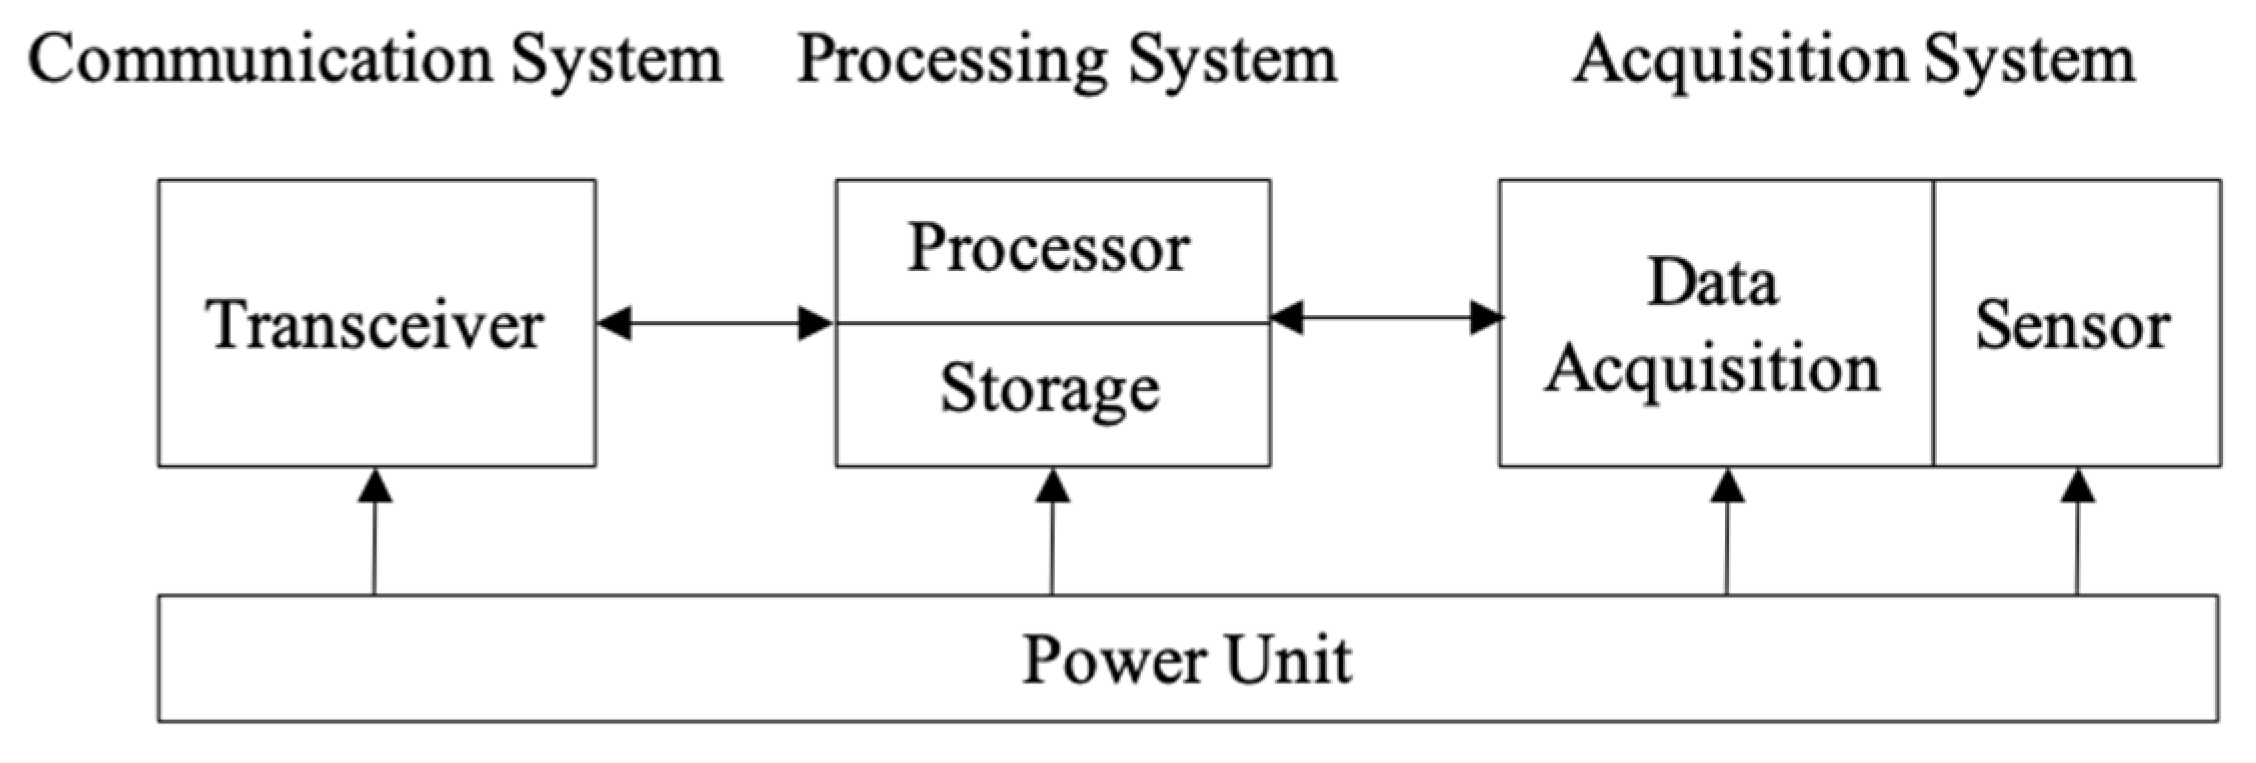
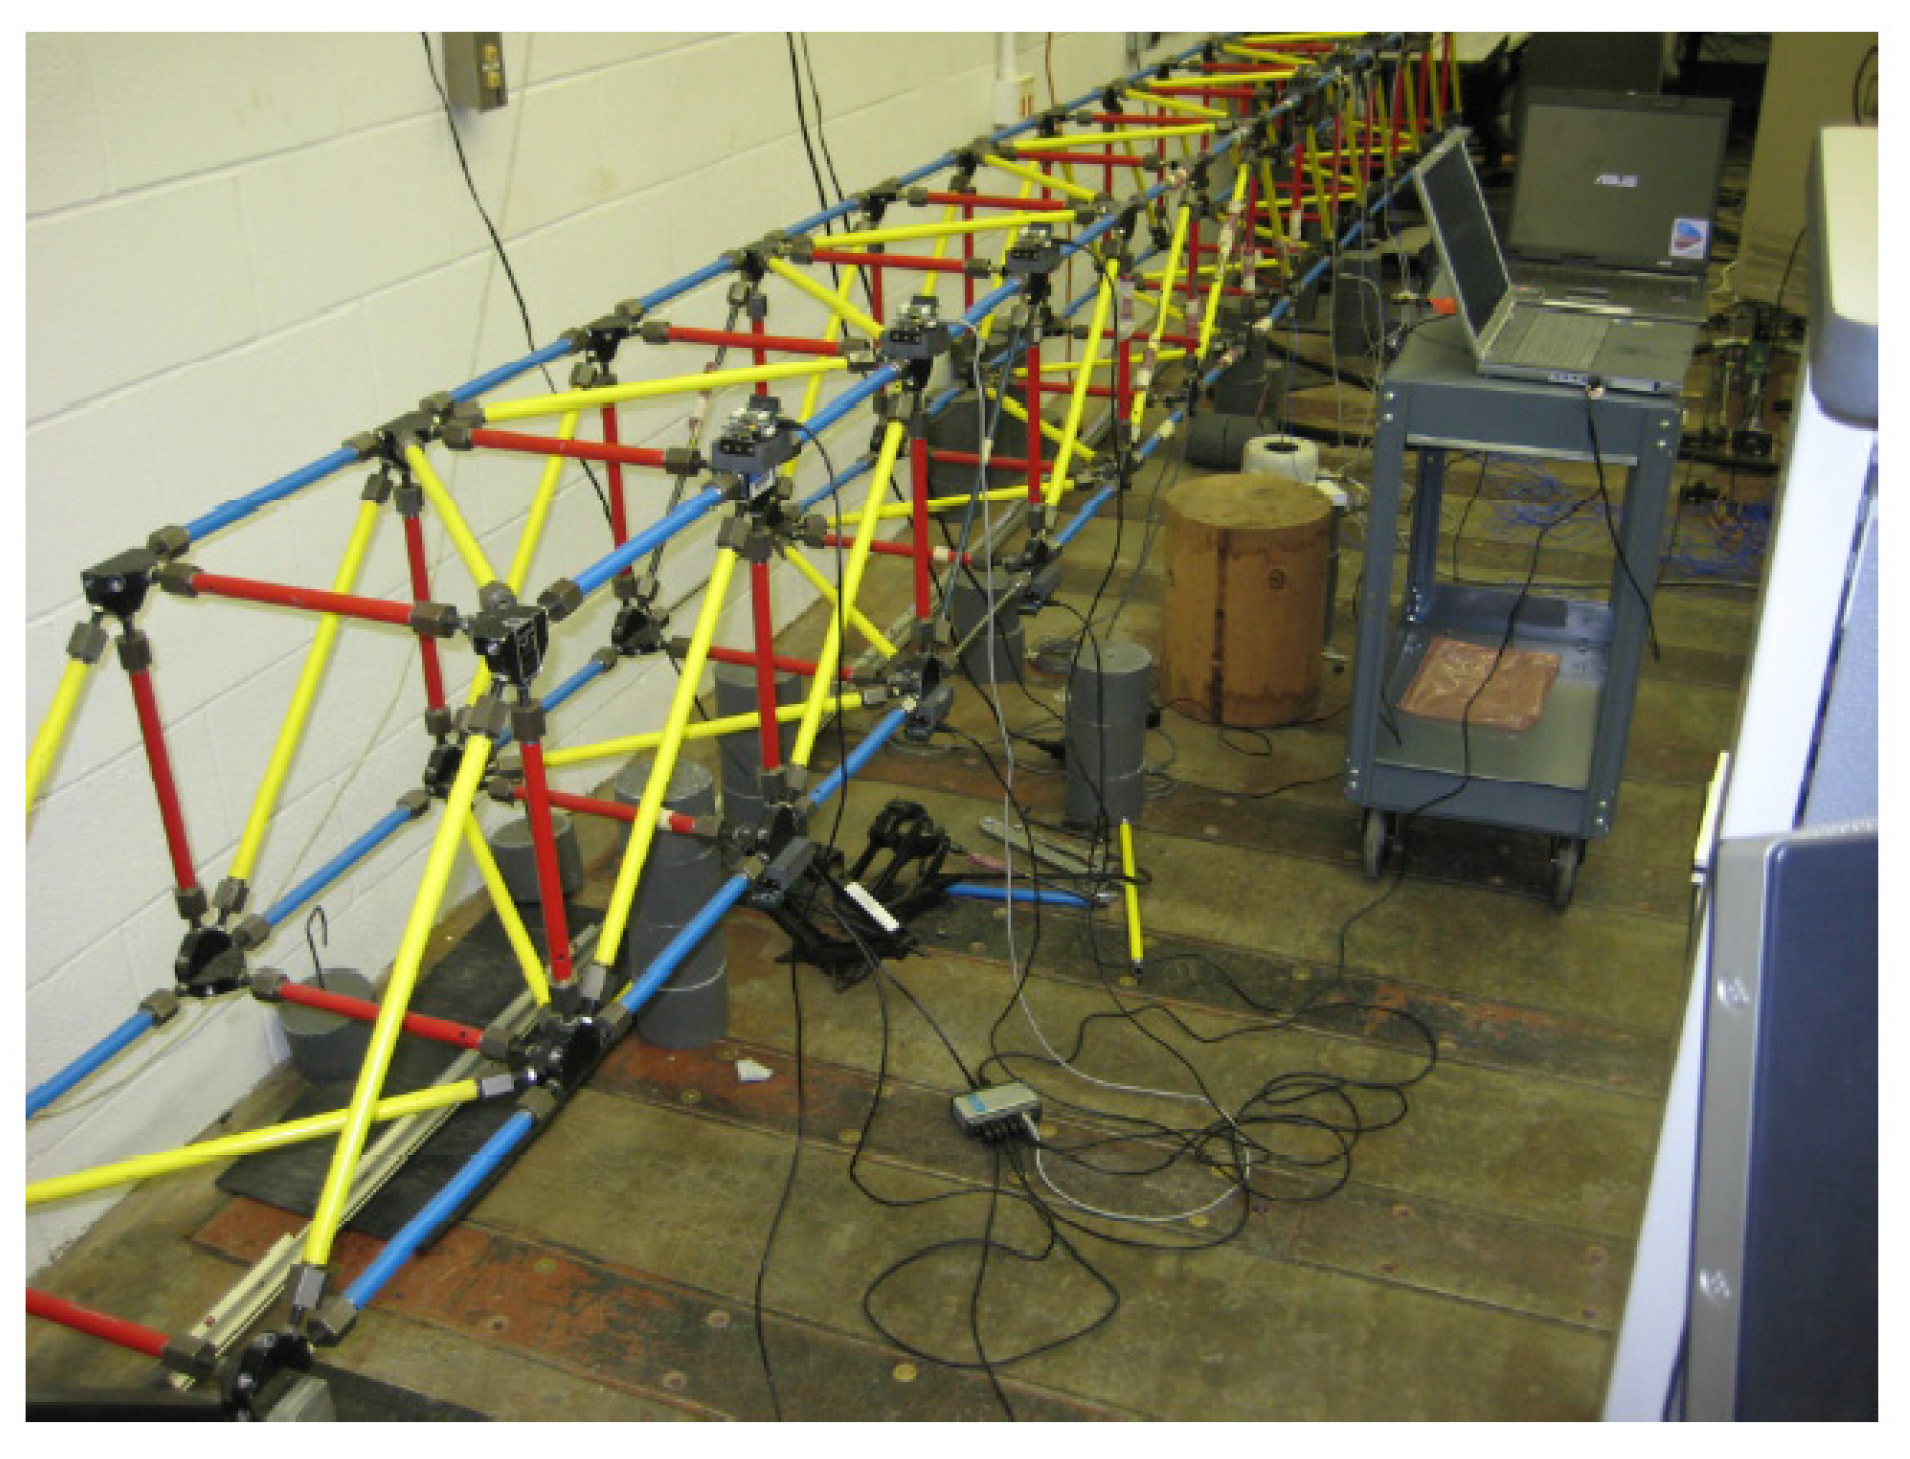
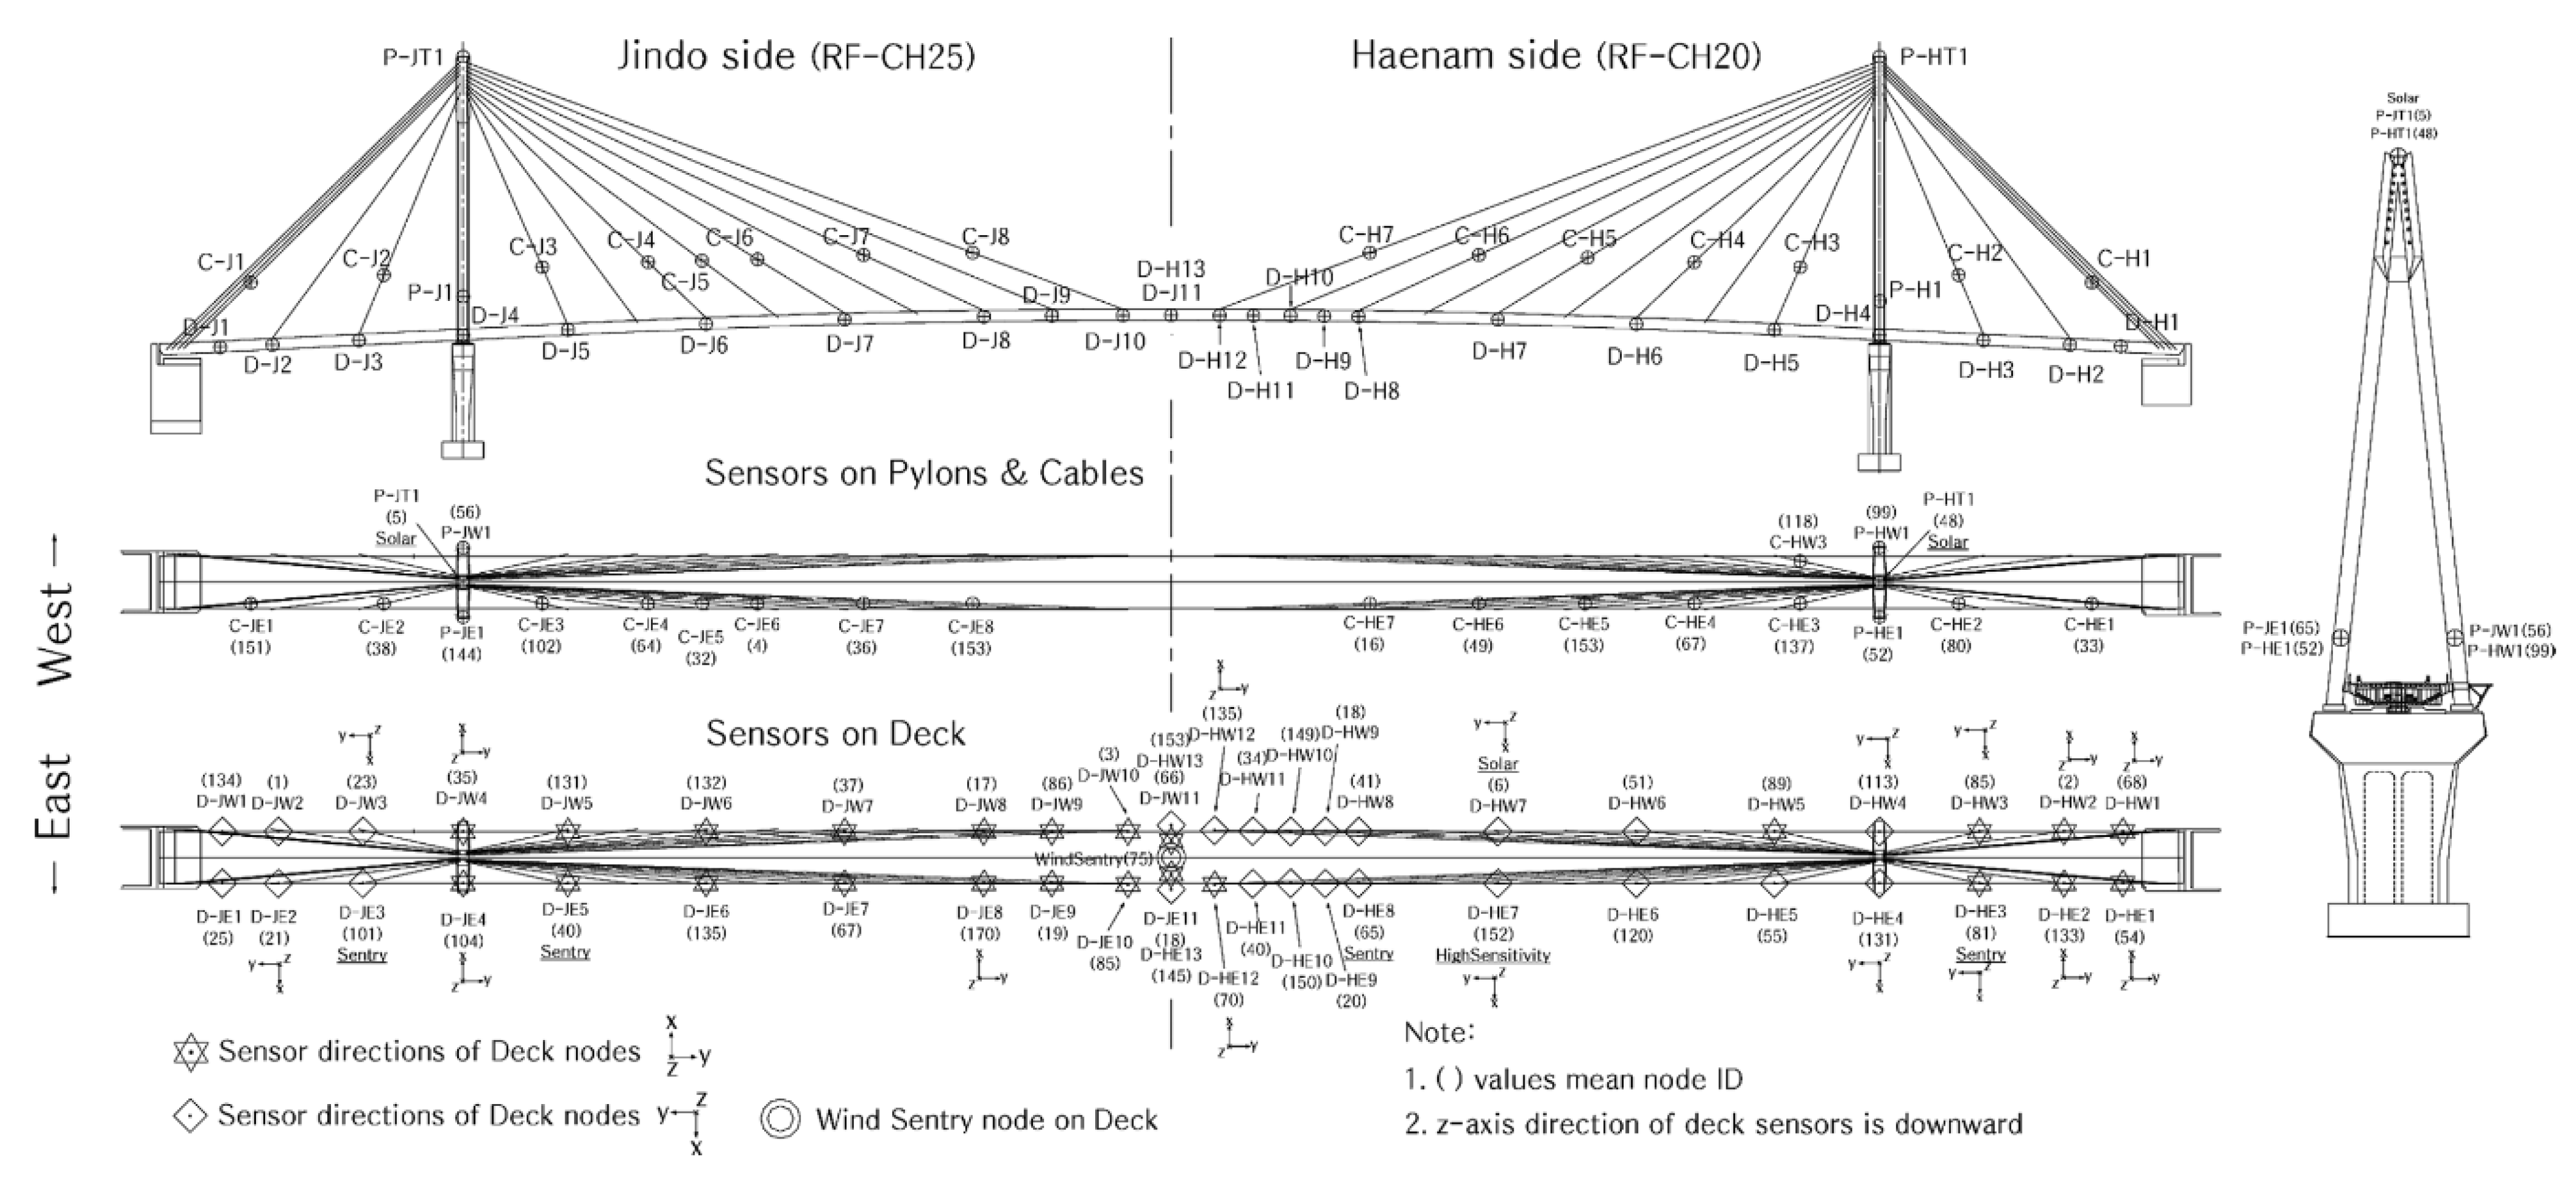
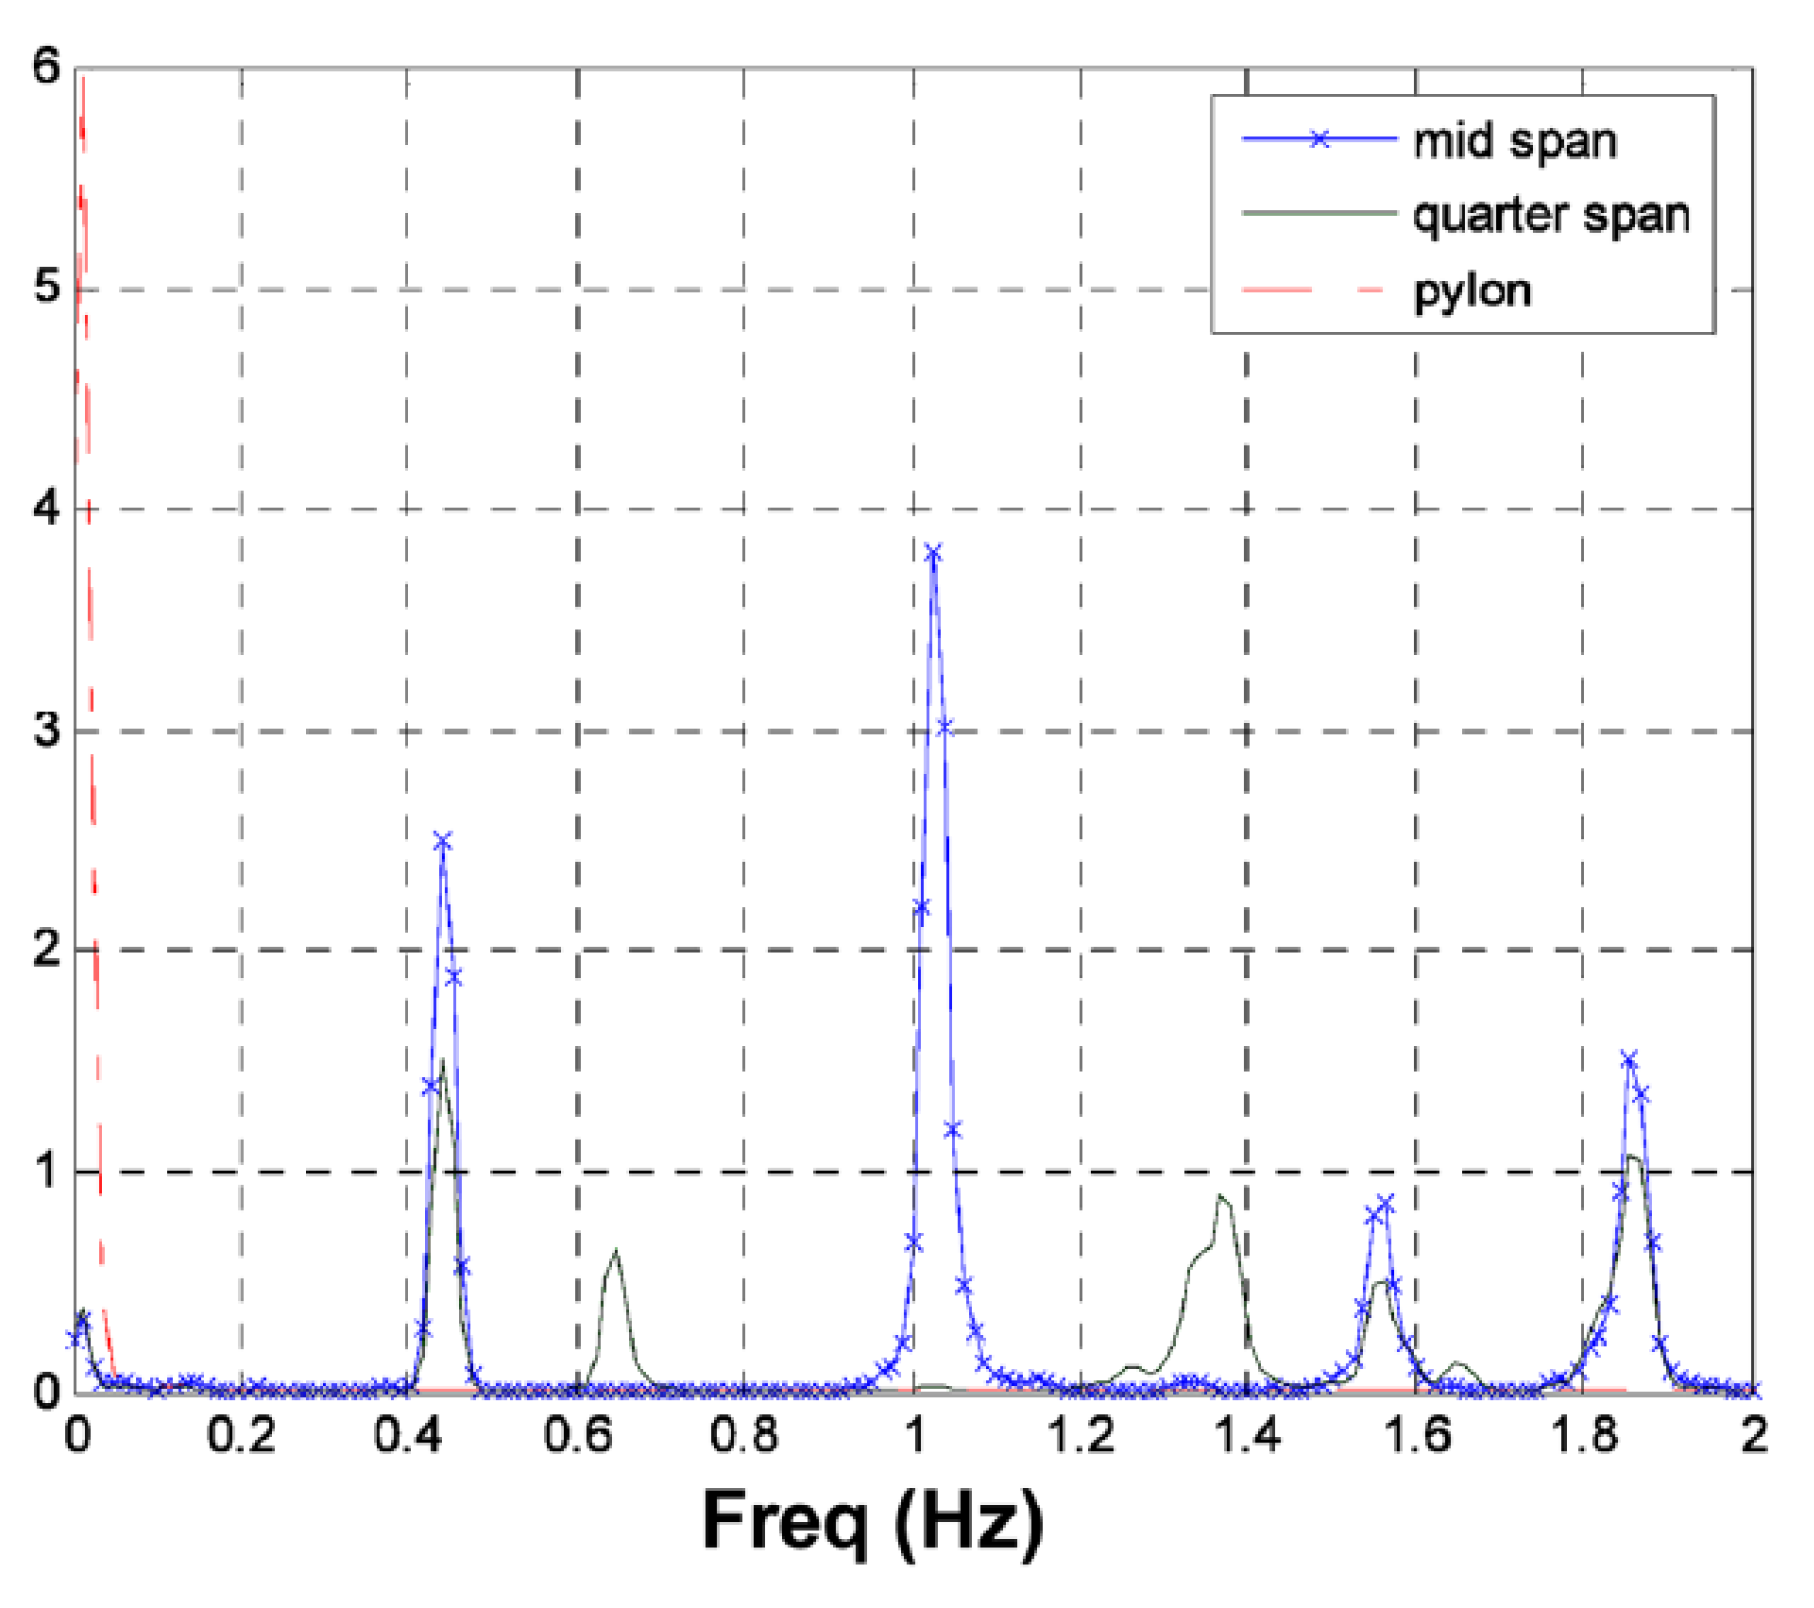
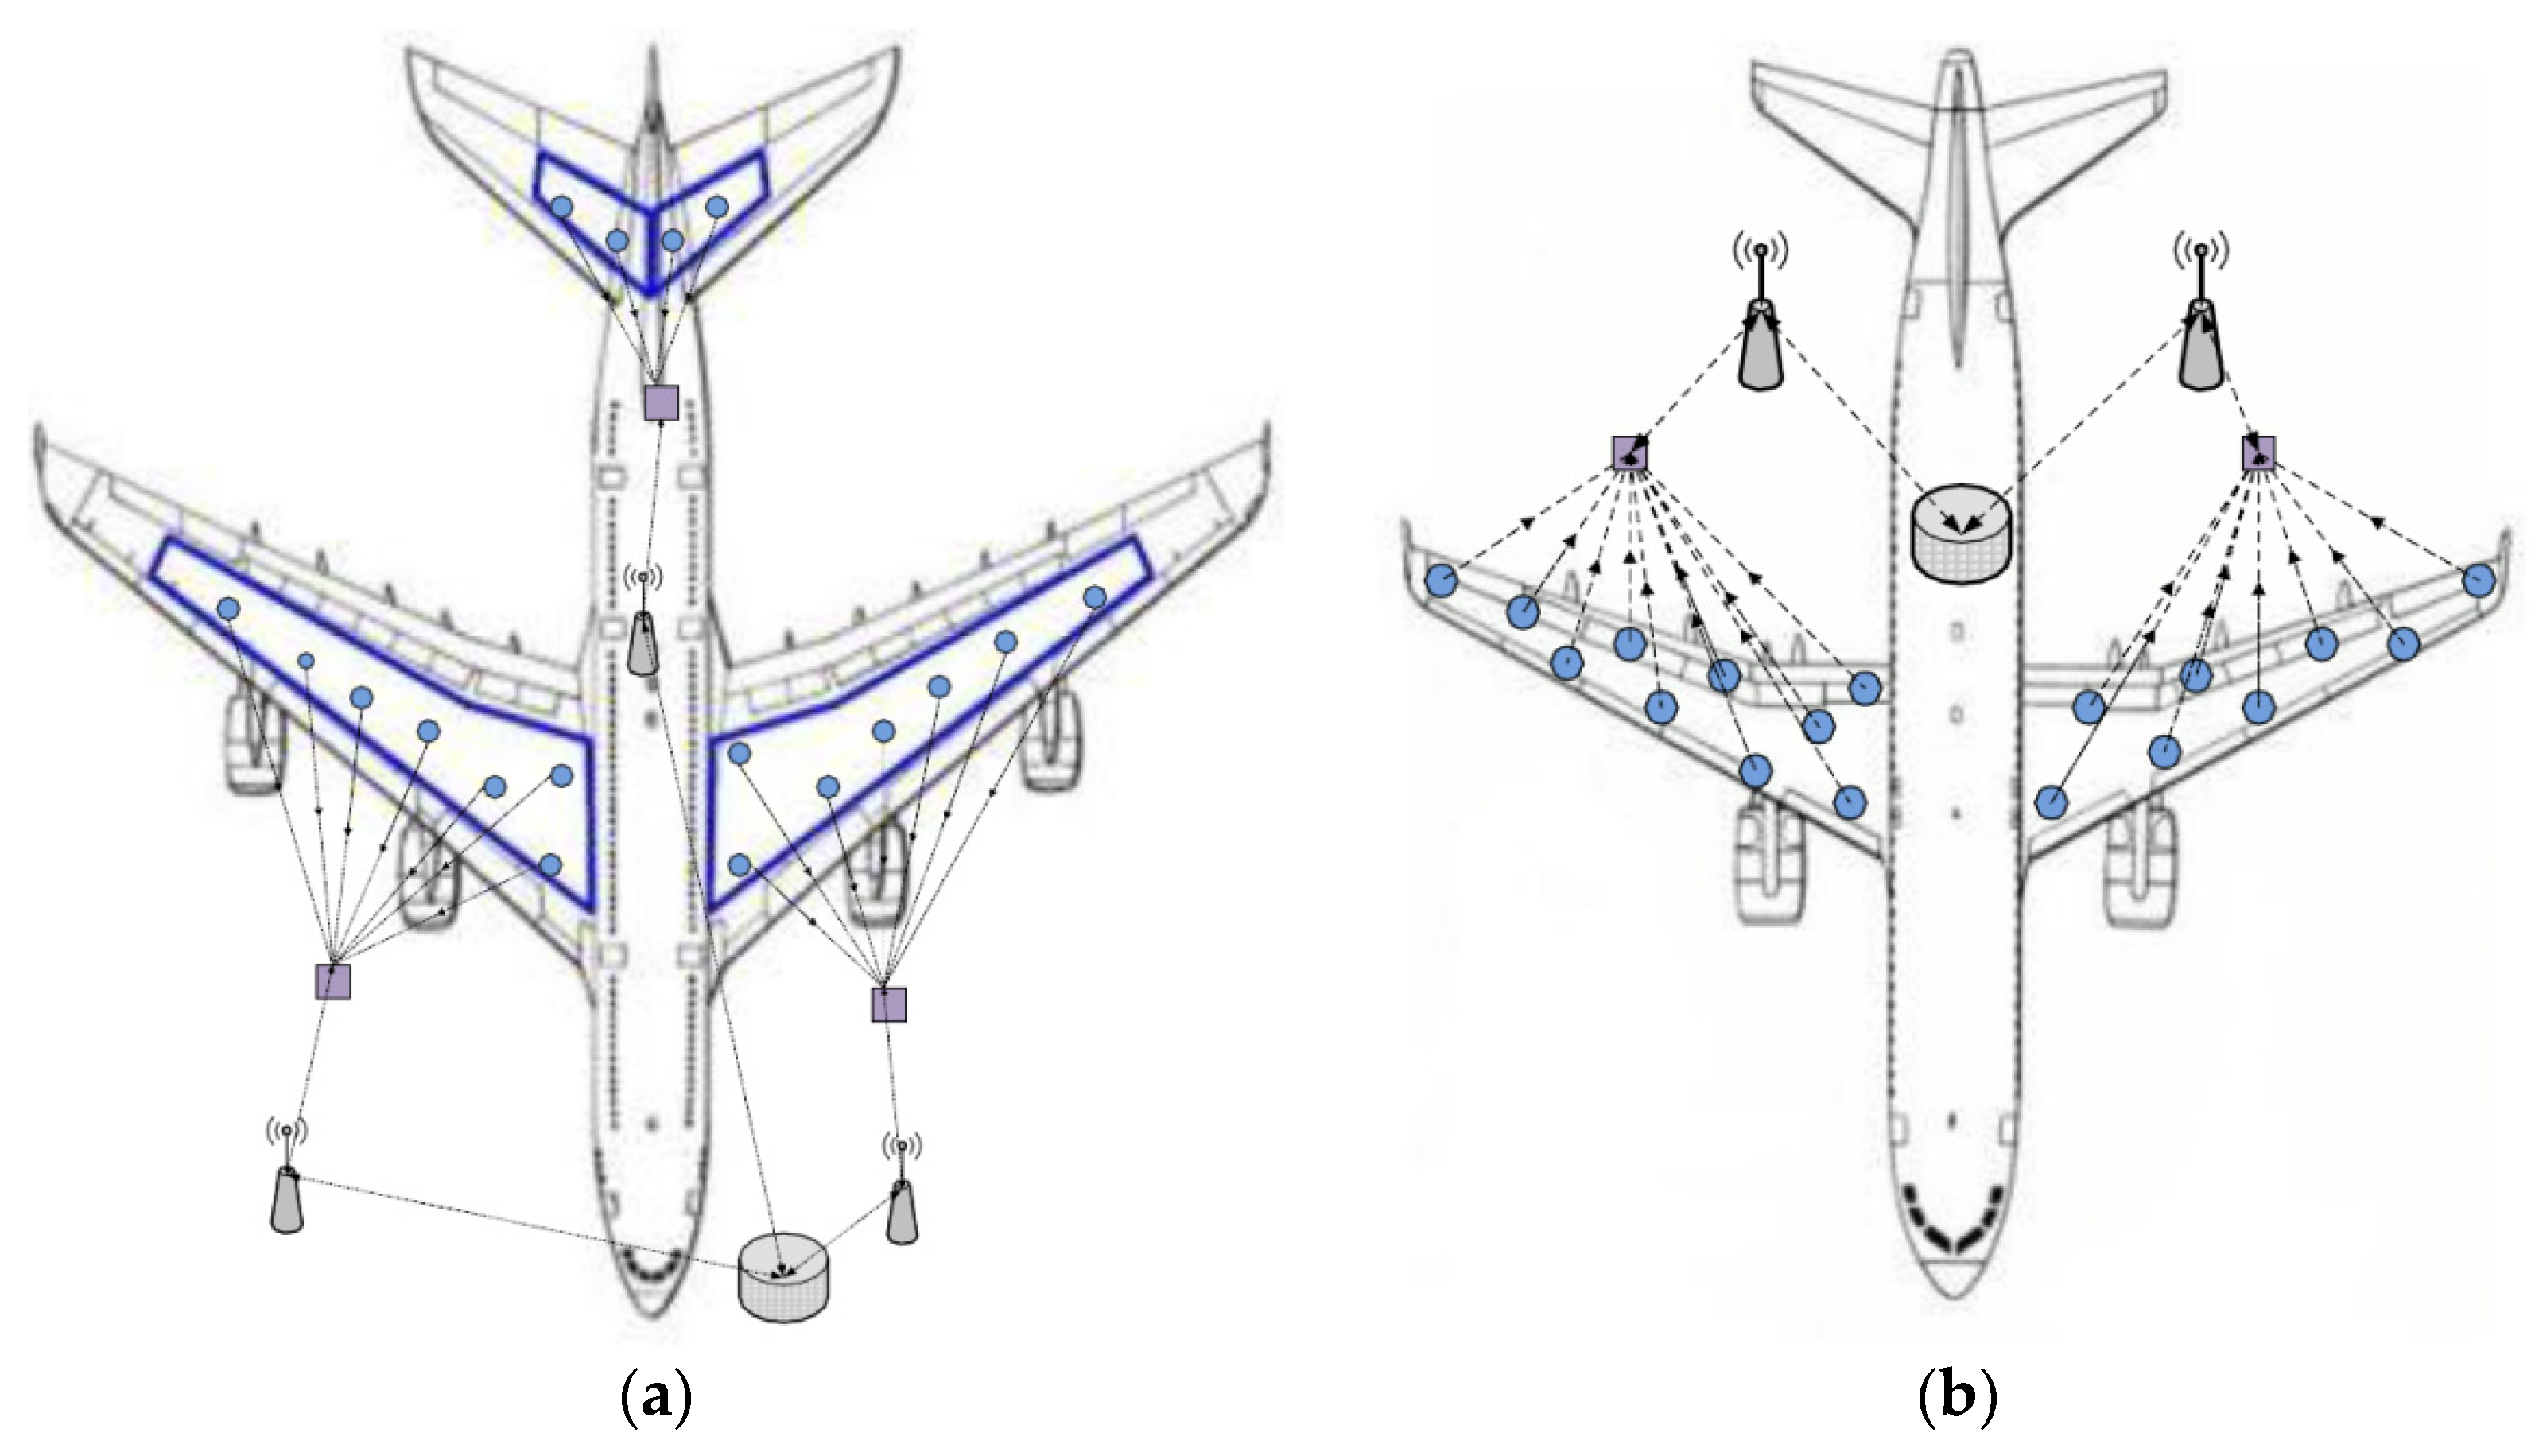
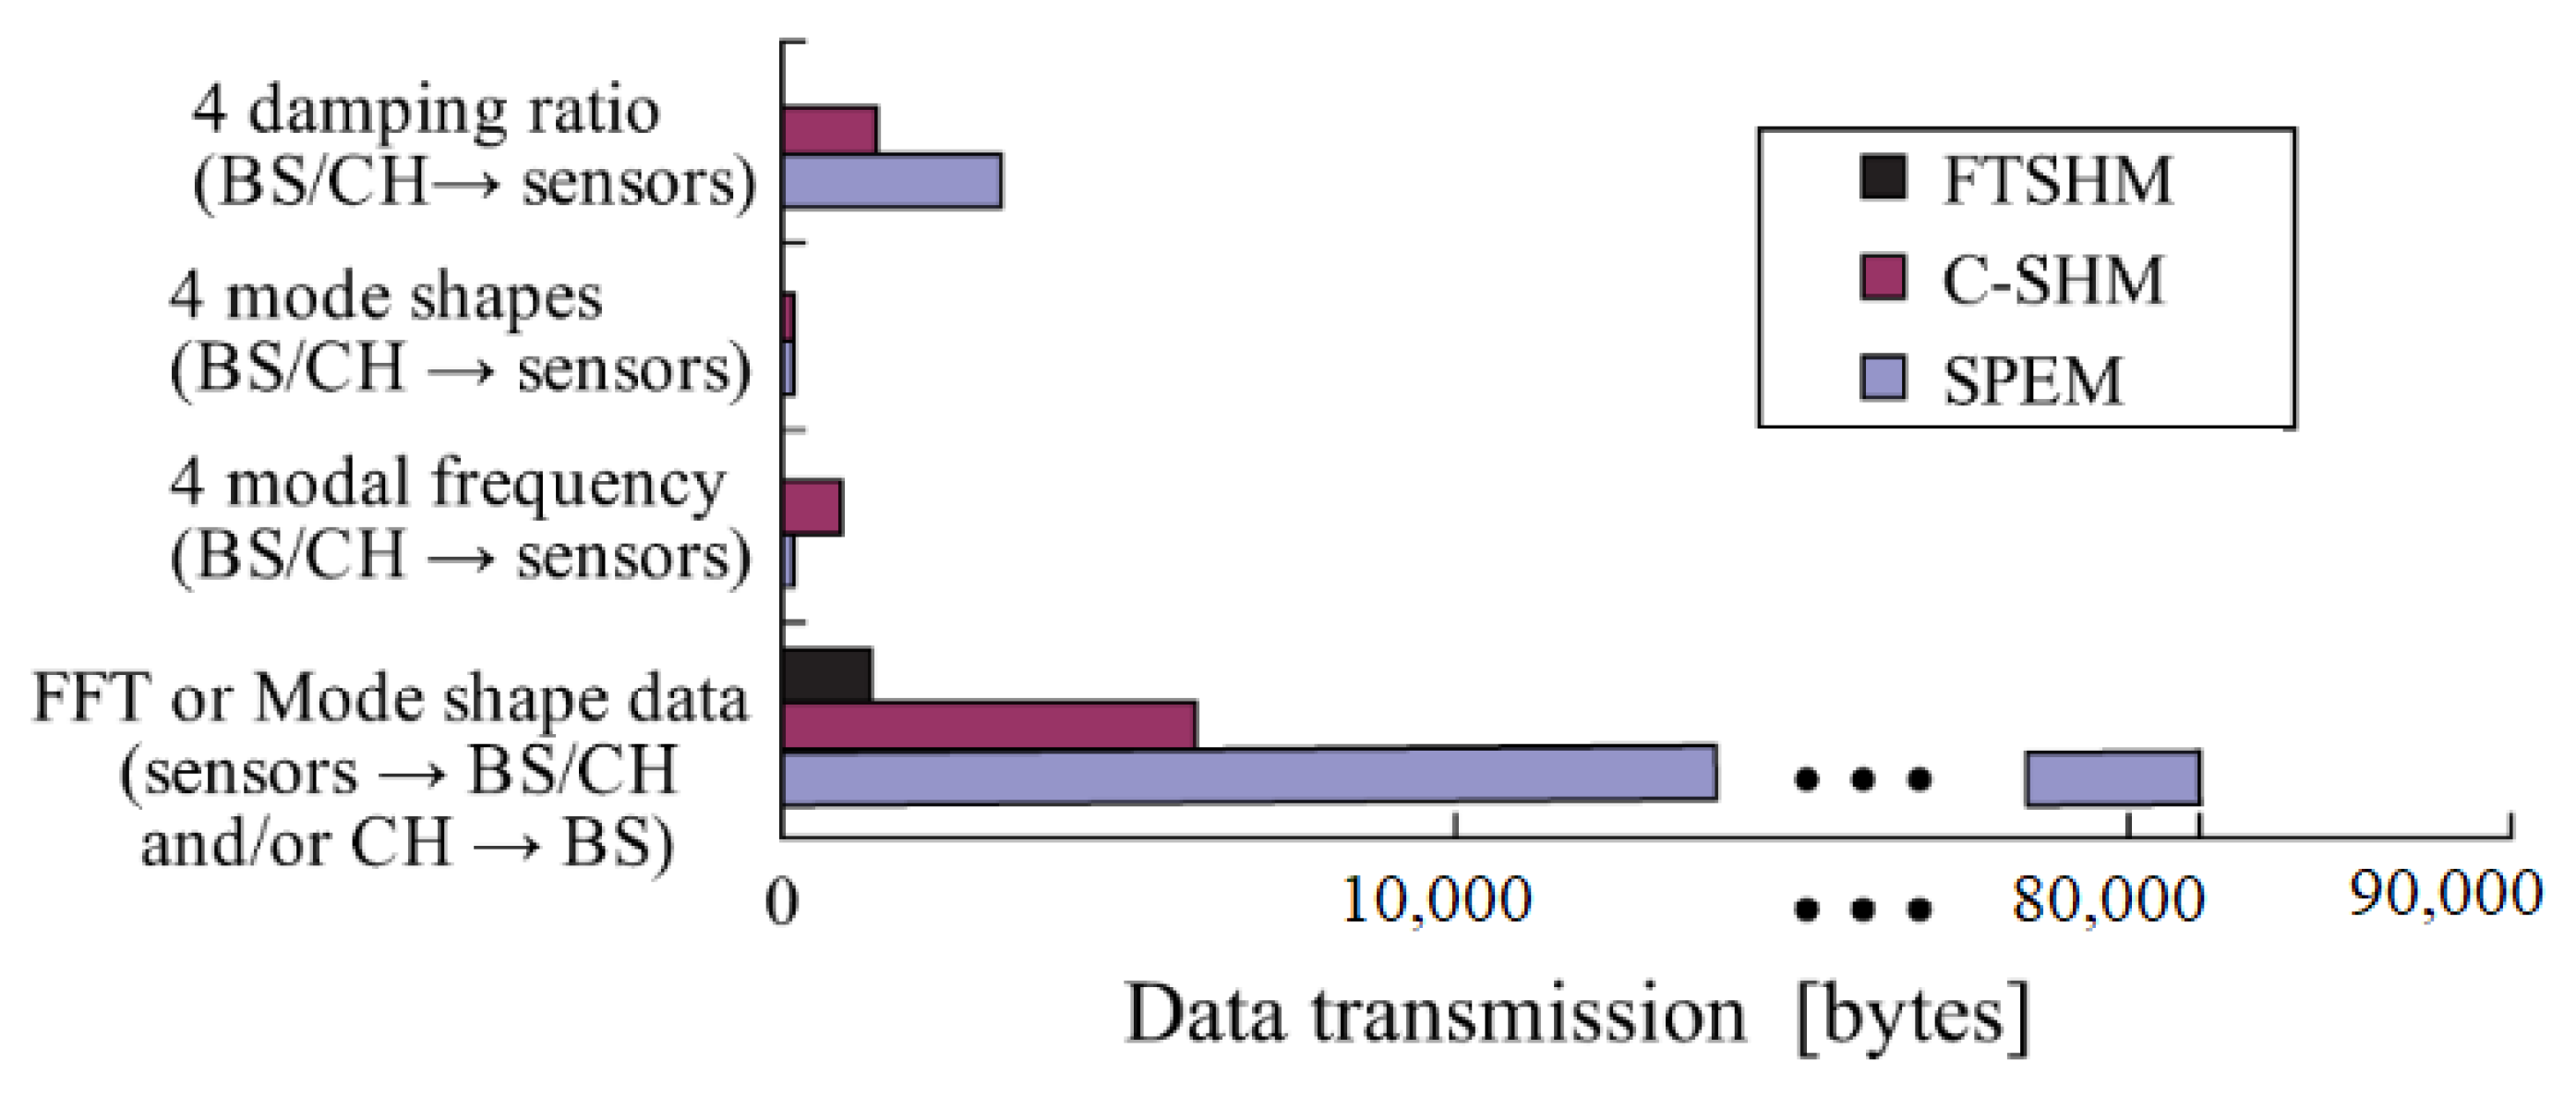
Table 1.
Summary of common NDT methods and solutions available in the market.
| IT | Ashtead Technology, FLIR Systems Ltd., NDT Global Services Ltd., Oceanscan |
| EM | Ashtead Technology, Doosan Babcock, GE M & C, MISTRAS Group Ltd., NDT Consultants Ltd., Olympus |
| ECT | Baugh & Weedon, Bowyer Engineering Ltd., Doosan Babcock, Eddyfi, ETher NDE, Fidgeon Ltd., GB Inspection Systems Ltd., GE M&C |
| UF | Advanced OEM Solutions, Ashtead Technology, Baugh & Weedon, Bowyer Engineering Ltd., GE M&C Inspection Technologies, Labquip NDT Ltd., Oceanscan, Olympus, M2M (Eddyfi), Sonatest Ltd. |
Table 2.
Common wireless data communication technologies.
| Technology | Maximum Coverage Range | Power Consumption | Data Transmission Rate | Frequency |
|---|---|---|---|---|
| IEEE 802.11 | 150 m | High | 54 Mbps | 2.4 GHz |
| ZigBee | 300 m | Low | Max. 250 Kbps | 868 MHz/902–928 MHz/2.4 GHz |
| ISA100.11a | 150 m | Low | Max. 250 Kbps | 2.4 GHz |
| Bluetooth | 300 m | Medium | Max. 2 Mbps | 2.4 GHz |
Publisher’s Note: MDPI stays neutral with regard to jurisdictional claims in published maps and institutional affiliations. |
© 2021 by the authors. Licensee MDPI, Basel, Switzerland. This article is an open access article distributed under the terms and conditions of the Creative Commons Attribution (CC BY) license (https://creativecommons.org/licenses/by/4.0/).
Share and Cite
MDPI and ACS Style
Mustapha, S.; Lu, Y.; Ng, C.-T.; Malinowski, P. Sensor Networks for Structures Health Monitoring: Placement, Implementations, and Challenges—A Review. Vibration 2021, 4, 551-585. https://0-doi-org.brum.beds.ac.uk/10.3390/vibration4030033
AMA Style
Mustapha S, Lu Y, Ng C-T, Malinowski P. Sensor Networks for Structures Health Monitoring: Placement, Implementations, and Challenges—A Review. Vibration. 2021; 4(3):551-585. https://0-doi-org.brum.beds.ac.uk/10.3390/vibration4030033
Chicago/Turabian StyleMustapha, Samir, Ye Lu, Ching-Tai Ng, and Pawel Malinowski. 2021. "Sensor Networks for Structures Health Monitoring: Placement, Implementations, and Challenges—A Review" Vibration 4, no. 3: 551-585. https://0-doi-org.brum.beds.ac.uk/10.3390/vibration4030033