Article

Cooperation between NMDA-Type Glutamate and P2 Receptors for Neuroprotection during Stroke: Combining Astrocyte and Neuronal Protection

by
Philipp Vermehren
1,†,
Melissa Trotman-Lucas
2,†,
Beatrice Hechler
3,4,
Christian Gachet
3,4,
Richard J. Evans
5,
Claire L. Gibson
2 and
Robert Fern
6,*
1
Department of Cell Physiology and Pharmacology, University of Leicester, Leicester LE1 9BH, UK
2
Department of Neuroscience, Psychology & Behaviour, University of Leicester, Leicester LE1 9BH, UK
3
UMR_S949, Institut National de la Santé et de la Recherche Médicale (INSERM), F-67065 Strasbourg, France
4
Établissement Français du Sang-Alsace (EFS-Alsace), F-67065 Strasbourg, France
5
Department of Molecular and Cell Biology, University of Leicester, Leicester LE1 9BH, UK
6
Peninsula School of Medicine and Dentistry, University of Plymouth, John Bull Building, Research Way, Plymouth PL6 8BU, UK
*
Author to whom correspondence should be addressed.
These authors contributed equally to this work.
Submission received: 13 February 2018 / Revised: 6 March 2018 / Accepted: 8 March 2018 / Published: 14 March 2018

Abstract

:
Excitotoxicity is the principle mechanism of acute injury during stroke. It is defined as the unregulated accumulation of excitatory neurotransmitters such as glutamate within the extracellular space, leading to over-activation of receptors, ionic disruption, cell swelling, cytotoxic Ca2+ elevation and a feed-forward loop where membrane depolarisation evokes further neurotransmitter release. Glutamate-mediated excitotoxicity is well documented in neurons and oligodendrocytes but drugs targeting glutamate excitotoxicity have failed clinically which may be due to their inability to protect astrocytes. Astrocytes make up ~50% of the brain volume and express high levels of P2 adenosine triphosphate (ATP)-receptors which have excitotoxic potential, suggesting that glutamate and ATP may mediate parallel excitotoxic cascades in neurons and astrocytes, respectively. Mono-cultures of astrocytes expressed an array of P2X and P2Y receptors can produce large rises in [Ca2+]i; mono-cultured neurons showed lower levels of functional P2 receptors. Using high-density 1:1 neuron:astrocyte co-cultures, ischemia (modelled as oxygen-glucose deprivation: OGD) evoked a rise in extracellular ATP, while P2 blockers were highly protective of both cell types. GluR blockers were only protective of neurons. Neither astrocyte nor neuronal mono-cultures showed significant ATP release during OGD, showing that cell type interactions are required for ischemic release. P2 blockers were also protective in normal-density co-cultures, while low doses of combined P2/GluR blockers where highly protective. These results highlight the potential of combined P2/GluR block for protection of neurons and glia.

1. Introduction

Stroke involves the sudden onset of cerebral ischemia, producing cellular injury and loss of function, leading to permanent disability [1,2]. The principle mechanism underlying acute cell injury is excitotoxicity, involving the toxic build of extracellular neurotransmitters. Work towards an effective prophylactic intervention for patients at stroke risk has focused on ionotropic glutamate receptors (GluRs) and the neuro-protective promise of blocking excitotoxic over-activation of N-methyl-d-aspartate (NMDA)-type GluRs (see [3]). We have recently demonstrated, for example, that many of the contraindications of this approach can be resolved by using a low-dose prophylactic strategy employing the clinically approved drug memantine hydrochloride [4], and that selective targeting of Nr2C/D NMDA subunits is highly protective of both grey and white matter. However, ~50% of the brain parenchymal volume is made of astrocytes, essential neural partner cells that are required for neuronal survival and function. Astrocytes generally express low levels of GluRs (e.g., [5]) but robustly express P2 nucleotide adenosine triphosphate (ATP) receptors (see [6]). ATP can also act as an excitotoxin via activation of P2 receptors [7,8] and extracellular ATP is significantly elevated both in vitro and in vivo under hypoxic and ischemic conditions [9,10,11,12,13,14,15,16]. Prolonged application of ATP or ATP analogues produces necrotic and delayed cell damage in both neurons and astrocytes in vitro and in vivo [17,18,19,20,21]. The harmful effects of ATP may be enhanced during ischemia by a reduced efficiency of ATP-degrading ecto-nucleotidases, which will reduce the capacity of the brain to clear extracellular ATP [22,23].
Astrocytes play important roles in the acute injury and survival of neurons affected by ischemia, including the release/uptake of neurotransmitters, regulation/dysregulation of extracellular ionic homeostasis and the production/buffering of reactive species. In addition to their essential support role in neural function, astrocyte cell death is a prerequisite for the evolution of necrotic stroke infarction [24]. Astrocyte protection may also be directly beneficial to neighbouring neuronal elements; for example, astrocyte glycogen storage can have a powerful influence upon the survival chances of neighbouring axons [25]. In the present study, we use neuron-enriched, astrocyte-enriched and 50/50 co-cultures where the two cell types can be distinguished to probe the effects of P2 receptor block on oxygen-glucose deprivation (OGD)-induced neurotransmitter release and associated cell death. We report that, even at very low concentrations, P2 receptor block is a highly effective pathway to astrocyte protection from acute ischemia which, unlike GluR block, reduces both neuron and glia injury. Combined block of P2 and GluRs effectively prevented cell death, the first time a combined pharmacological strategy has been identified to block acute ischemic cell death in both neurons and glia.

2. Materials and Methods

2.1. Cell Culture

Normal-density primary cortical neuron and astrocyte co-cultures were prepared from the cerebral cortices of C57BL/6 mouse gestation day 15–17 embryos (Charles river, Margate, UK), following humane cervical dislocation under UK Home Office Schedule 1 regulations. Cortices were removed and placed into Hank’s balanced salt solution (HBSS), trypsinised (1% trypsin/DNAse) at 37 °C for 10 min, triturated and then centrifuged (1500 rpm/5 min). Cells were subsequently re-suspended in growth media (Dulbeco’s minimum essential medium (DMEM), containing 4500 mg/L glucose, Glutamax-I, 110 mg/L pyruvate, penicillin/streptomycin and 10% foetal bovine serum (FBS)), and plated onto 175 cm2 flasks. At two days in vitro (DIV), excess microglia were removed by gentle tapping and swirling of the flask prior to 100% DMEM media change. At six DIV, unwanted oligodendrocytes and microglia were removed by multiple agitations and washing steps until the lower-most astrocyte layer remained. Astrocytes were removed from the flask by trypsin action (0.5% Trypsin/5.3 mM EDTA), centrifuged and re-suspended in DMEM. Astrocytes were counted and plated at 0.15 × 10⁶ cells/mL onto previously poly-l-lysine (100 μg/mL) coated coverslips. At eight DIV cortical neurons were prepared from E16 embryos in the same fashion as astrocytes up to the initial re-suspension where the media used was Neurobasal (Neurobasal medium, penicillin/streptomycin, B27 supplement, Glutamax-I). Cells were passed through a 100 μm cell strainer prior to counting. Neurons were plated at 0.15 × 10⁶ cells/mL directly on top of previously plated astrocytes and the media was changed to Neurobasal. Cultures were used from 12 DIV. High-density neuronal-enriched, astrocyte-enriched and 1:1 co-cultures were prepared from BALBc mice in a similar fashion to the above but using higher plating densities (see [4] for details). These high-density cultures were useful for characterising receptor responses and measuring neurotransmitter release.

2.2. Distinguishing Neurons and Astrocytes in Co-Culture

Co-cultured astrocytes and neurons are morphologically distinct under phase contrast. To distinguish between the co-cultured cells, pseudo-fluorescent images were overlaid on the corresponding phase-contrast images for identification. Astrocytes form a continuous layer of flat low phase-contrast cells, whereas neuronal cells are high contrast showing pyramidal, fusiform or multipolar characteristics; these identifying characteristics have recently been confirmed in sister cultures [4]. Unidentifiable cells were excluded from subsequent analysis.

2.3. Cell Imaging (Viability and [Ca2+]i)

For imaging of cell viability, cell death was assessed using an intracellular green CellTrackerTM probe, 5-chloromethylfluorescein diacetate (CMFDA) (Fisher, Loughborough, UK), AM loaded at 2.5 µM. CMFDA-loaded cultures were mounted into an atmosphere perfusion chamber (Warner Instruments, Hamden, CT, USA), perfused at 2 mL/min (artificial cerebro-spinal fluid (aCSF) mM: 153 Na+, 3 K+, 2 Mg2+, 2 Ca2+, 131 Cl, 26 HCO3−, 2 H2PO4− and 10 dextrose (bubbled with O2 95%/CO2 5%), 317–319 milliosmoles) and maintained at 37 °C. Temperature was monitored and regulated via flow-through, objective and room heaters (see [26]). Once mounted onto the stage of an epi-fluorescence microscope (Nikon, Tokyo, Japan), oil immersion ×20 images were collected at 508 nm via appropriate filter sets (Chroma Technology Corporation, Bellows Falls, VT, USA) following excitation at 489 nm (optoscan, Cairn Research, Faversham, UK). Images were captured by a coolSNAP HQ camera (Roper Scientific, Vianen, The Netherlands) controlled via MetaFluor (Molecular Devices, San Jose, CA, USA) with background signal subtracted. OGD conditions were induced by switching from aCSF to aCSF-zero glucose (OGD mM: 153 Na+, 3 K+, 2 Mg2+, 2 Ca2+, 131 Cl, 26 HCO3−, 2 H2PO4− (bubbled with N2 95%/CO2 5%) and switching the chamber atmosphere from 95% O2/5%CO2 to 95%N2/5%CO2. Cultures were perfused with aCSF for 10 min before switching to OGD. Two sets of image data were collected from each CMFDA experiment. Quadrant images were taken at 0 and 100 min of perfusion where initial cell and surviving cell counts were taken in the four complete adjacent fields of view contiguous with the imaged field in the centre. These quadrant images were used to determine total cell death over the whole time-course of the experiment, and also acted as a control to ensure that fluorescent excitation illumination was not affecting cell viability (these cells were not exposed to illumination during the course of the experiment). Fluorescent images were taken every 30 s from the central field of view where cell death was characterised by a sudden collapse of the fluorescent signal as previously described (see [4]). These data were used to calculate cell death rates with time within the field of view. Cell death data are plotted as a time course represent the real time recordings from the central field of view, while total cell death data include the cells from the surrounding quadrants.
For [Ca2+]i imaging during OGD, cultures were loaded with FURA-2FF (Invitrogen, Carlsbad, CA, USA), a low affinity dye that does not affect cell viability during ischemia [27]. The more sensitive FURA-2 was used for agonist responses. In both cases, cells were AM-loaded (see [26] for more details of imaging methods). A rapid exchange perfusion system was used for short application agonist experiments (ValveBank8.2, AutoMate Scientific, Berkeley, CA, USA). Oil immersion ×20 images were collected at 520 nm using appropriate filter sets (Chroma Technology Corporation, Bellows Falls, VT, USA). Cells were illuminated at 340, 360, and 380 nm (Optoscan, Cairn Research, Faversham, UK). For FURA-2 imaging, 340:380 was converted to [Ca2+]i using a calcium calibration kit (Invitrogen). Cell death was characterized by sudden collapse of the fluorescent signal to the background level and this phenomenon was used to calculate cell death rates and precise time points of cell death for all cells within the field of view.

2.4. Biosensors

ATP and glutamate microelectrode biosensors (Sarissa Biomedical, Coventry, UK) [28], amplified via a Duo-Stat ME-200+ potentiostat (Sycopel International Ltd., Tyne & Wear, UK), were used to record real time glutamate or ATP concentration changes in vitro from the unstirred fluid layer surrounding cells in high-density cultures. Signals were recorded differential to a null electrode and both active and null electrodes were carefully inserted into a modified atmosphere chamber until the sensor tips rested directly on the cell layer (see [4]). An Ag/AgCl reference electrode was introduced at a distal site. OGD and control experiments were performed as described above for cell imaging. Sensors were recalibrated in the chamber at the end of the OGD period after retraction from the cell layer. Values from the null, sensor, and sensor-minus-null outputs were recorded at 0.5 Hz and subsequently converted into Δ ATP or Δ glutamate, rather than absolute concentrations. Experiments were repeated a minimum of three times, all values collected for a time point during a specific condition/experiment were averaged using Prism software (GraphPad, Prism Software, Droitwich, UK).

2.5. Statistics

Experiments were repeated a minimum of three times on three separate culture preparations. Results are presented as mean ± standard error of the mean (SEM). Statistical analysis for comparison of experimental groups was undertaken using one-way analysis of variance (ANOVA) with Tukey’s post-hoc test for multiple comparisons. For all data, differences of p < 0.05 were deemed significant.

3. Results

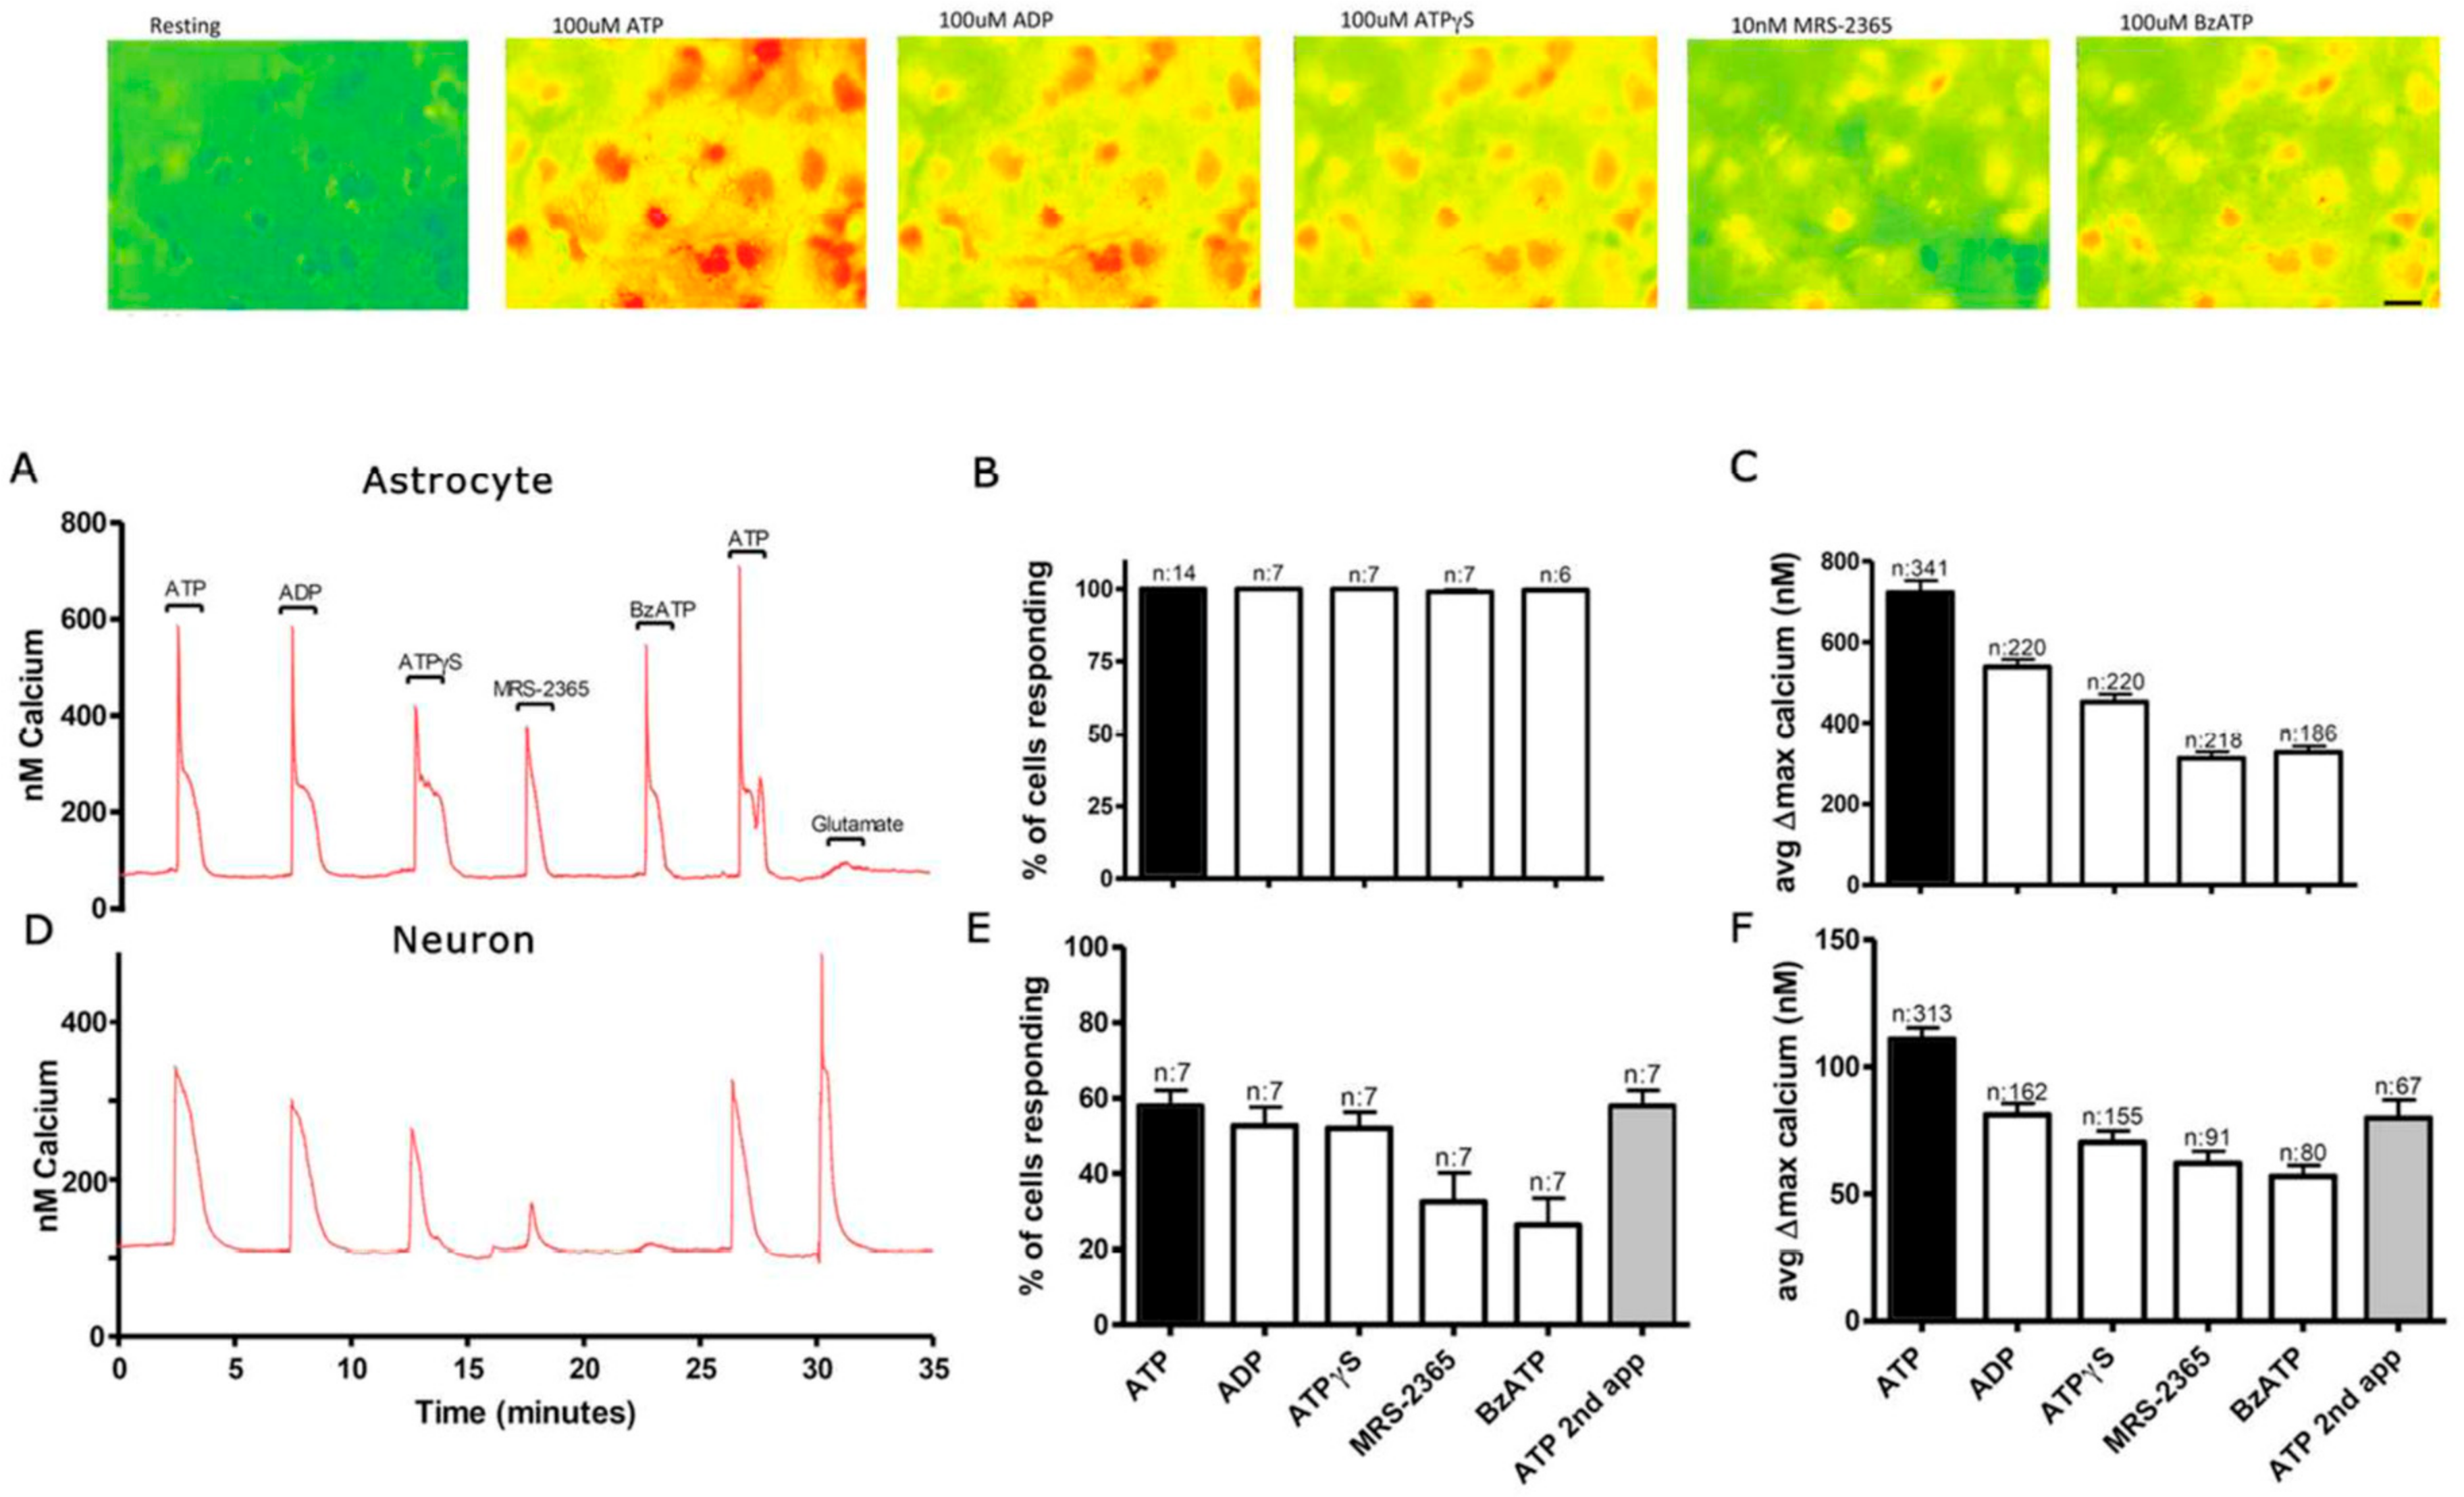
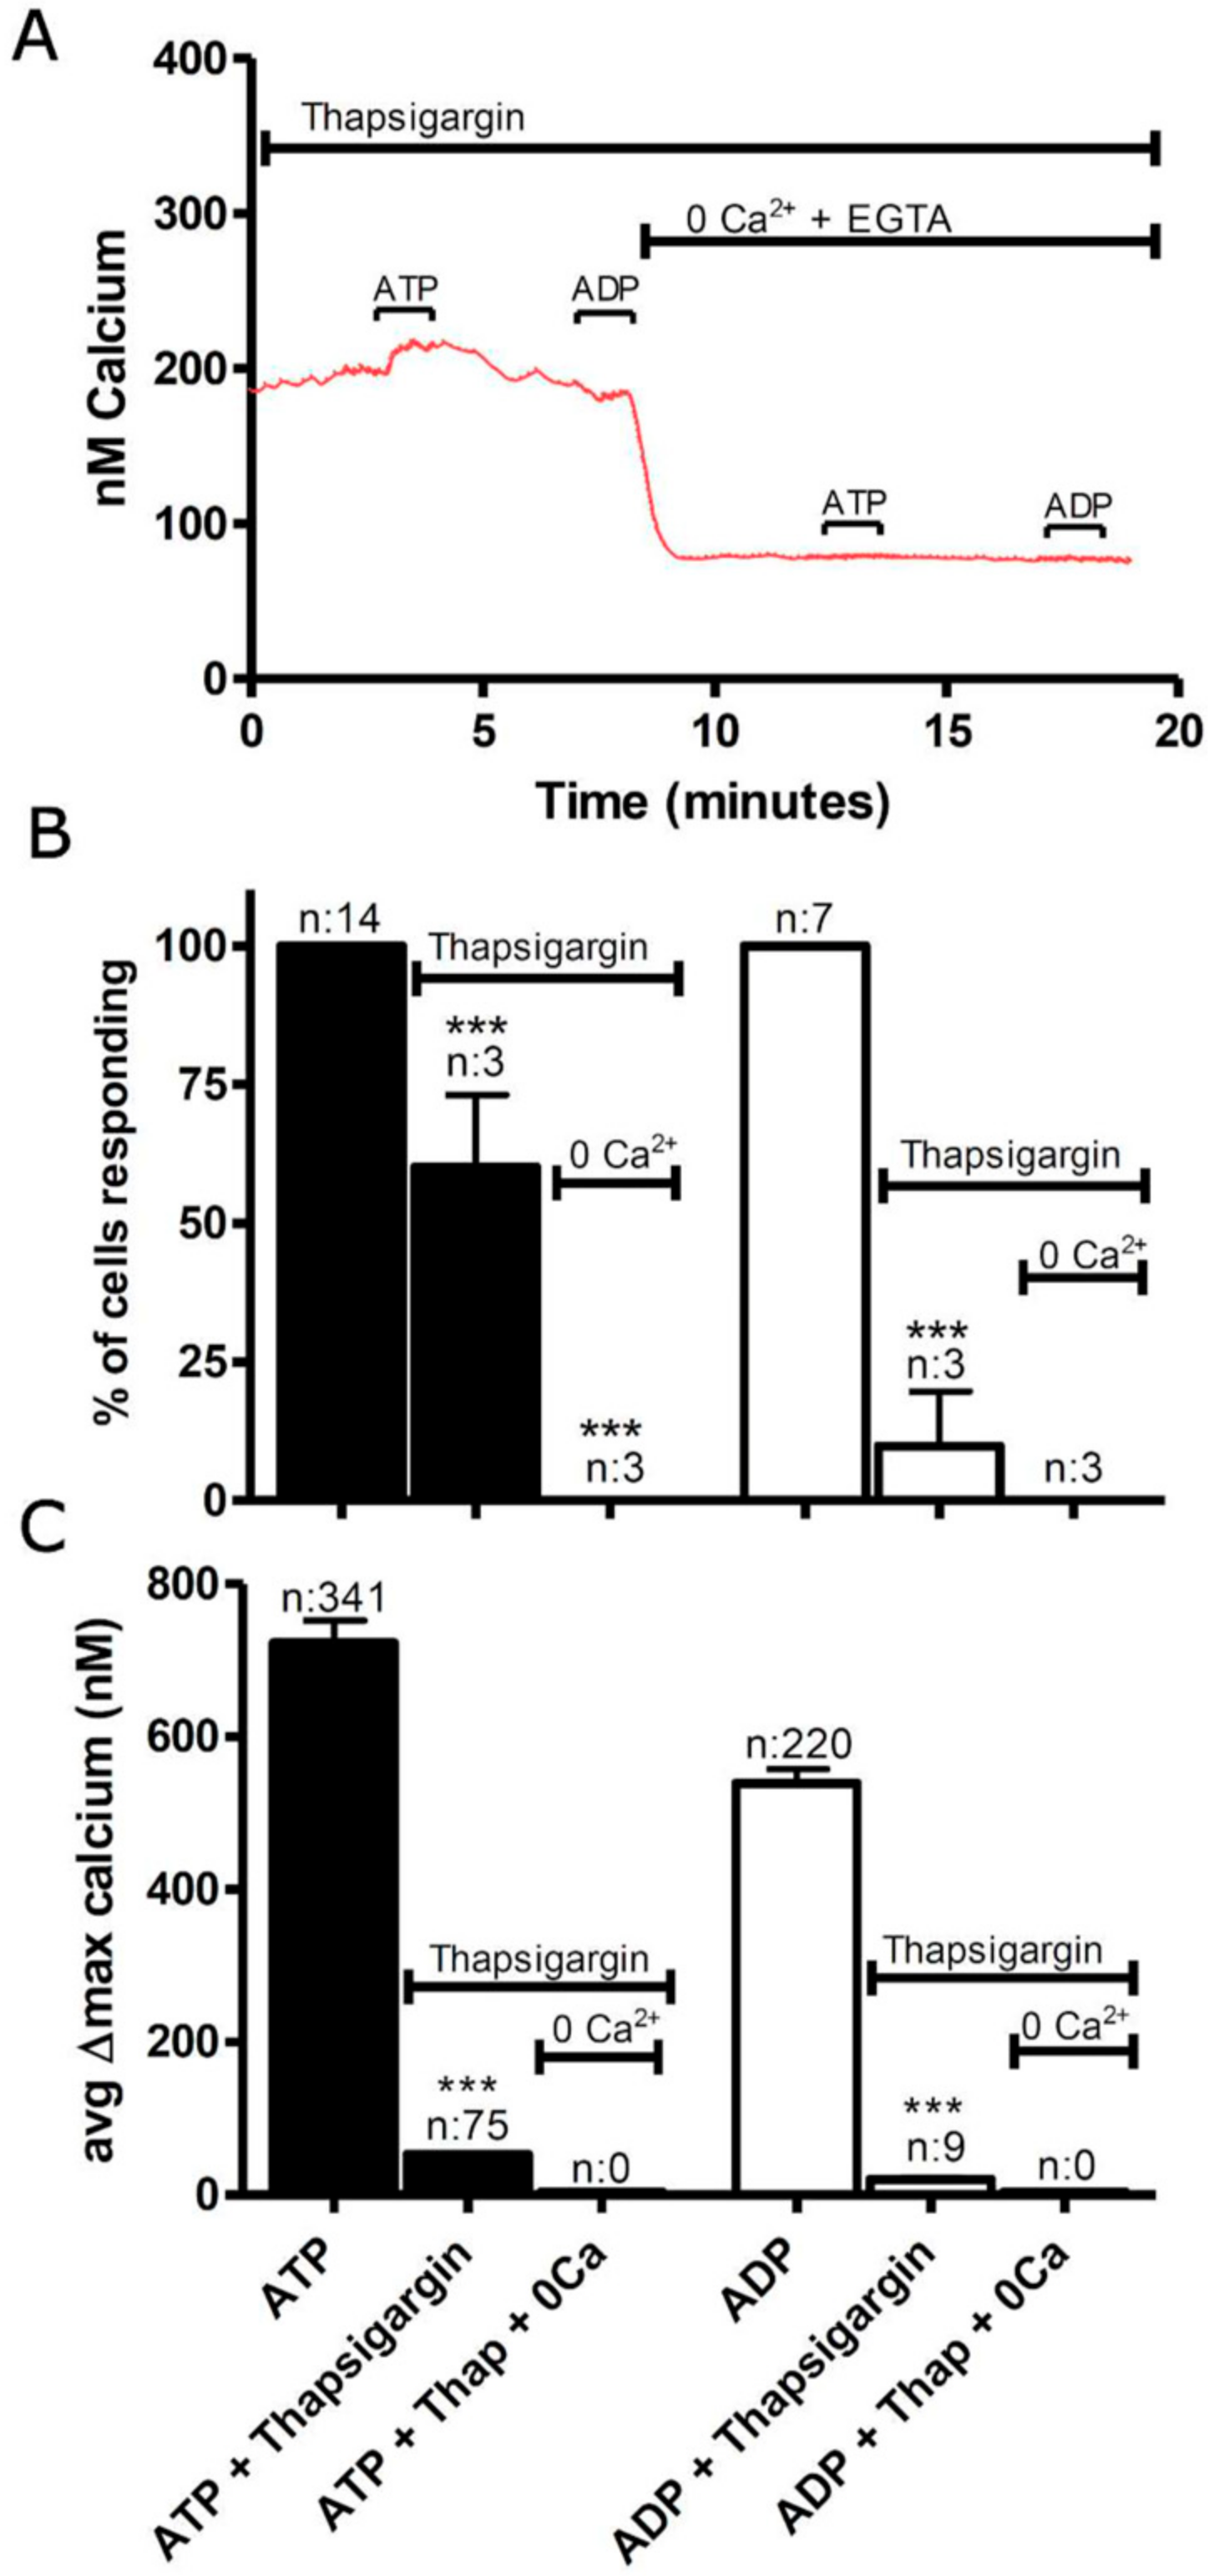
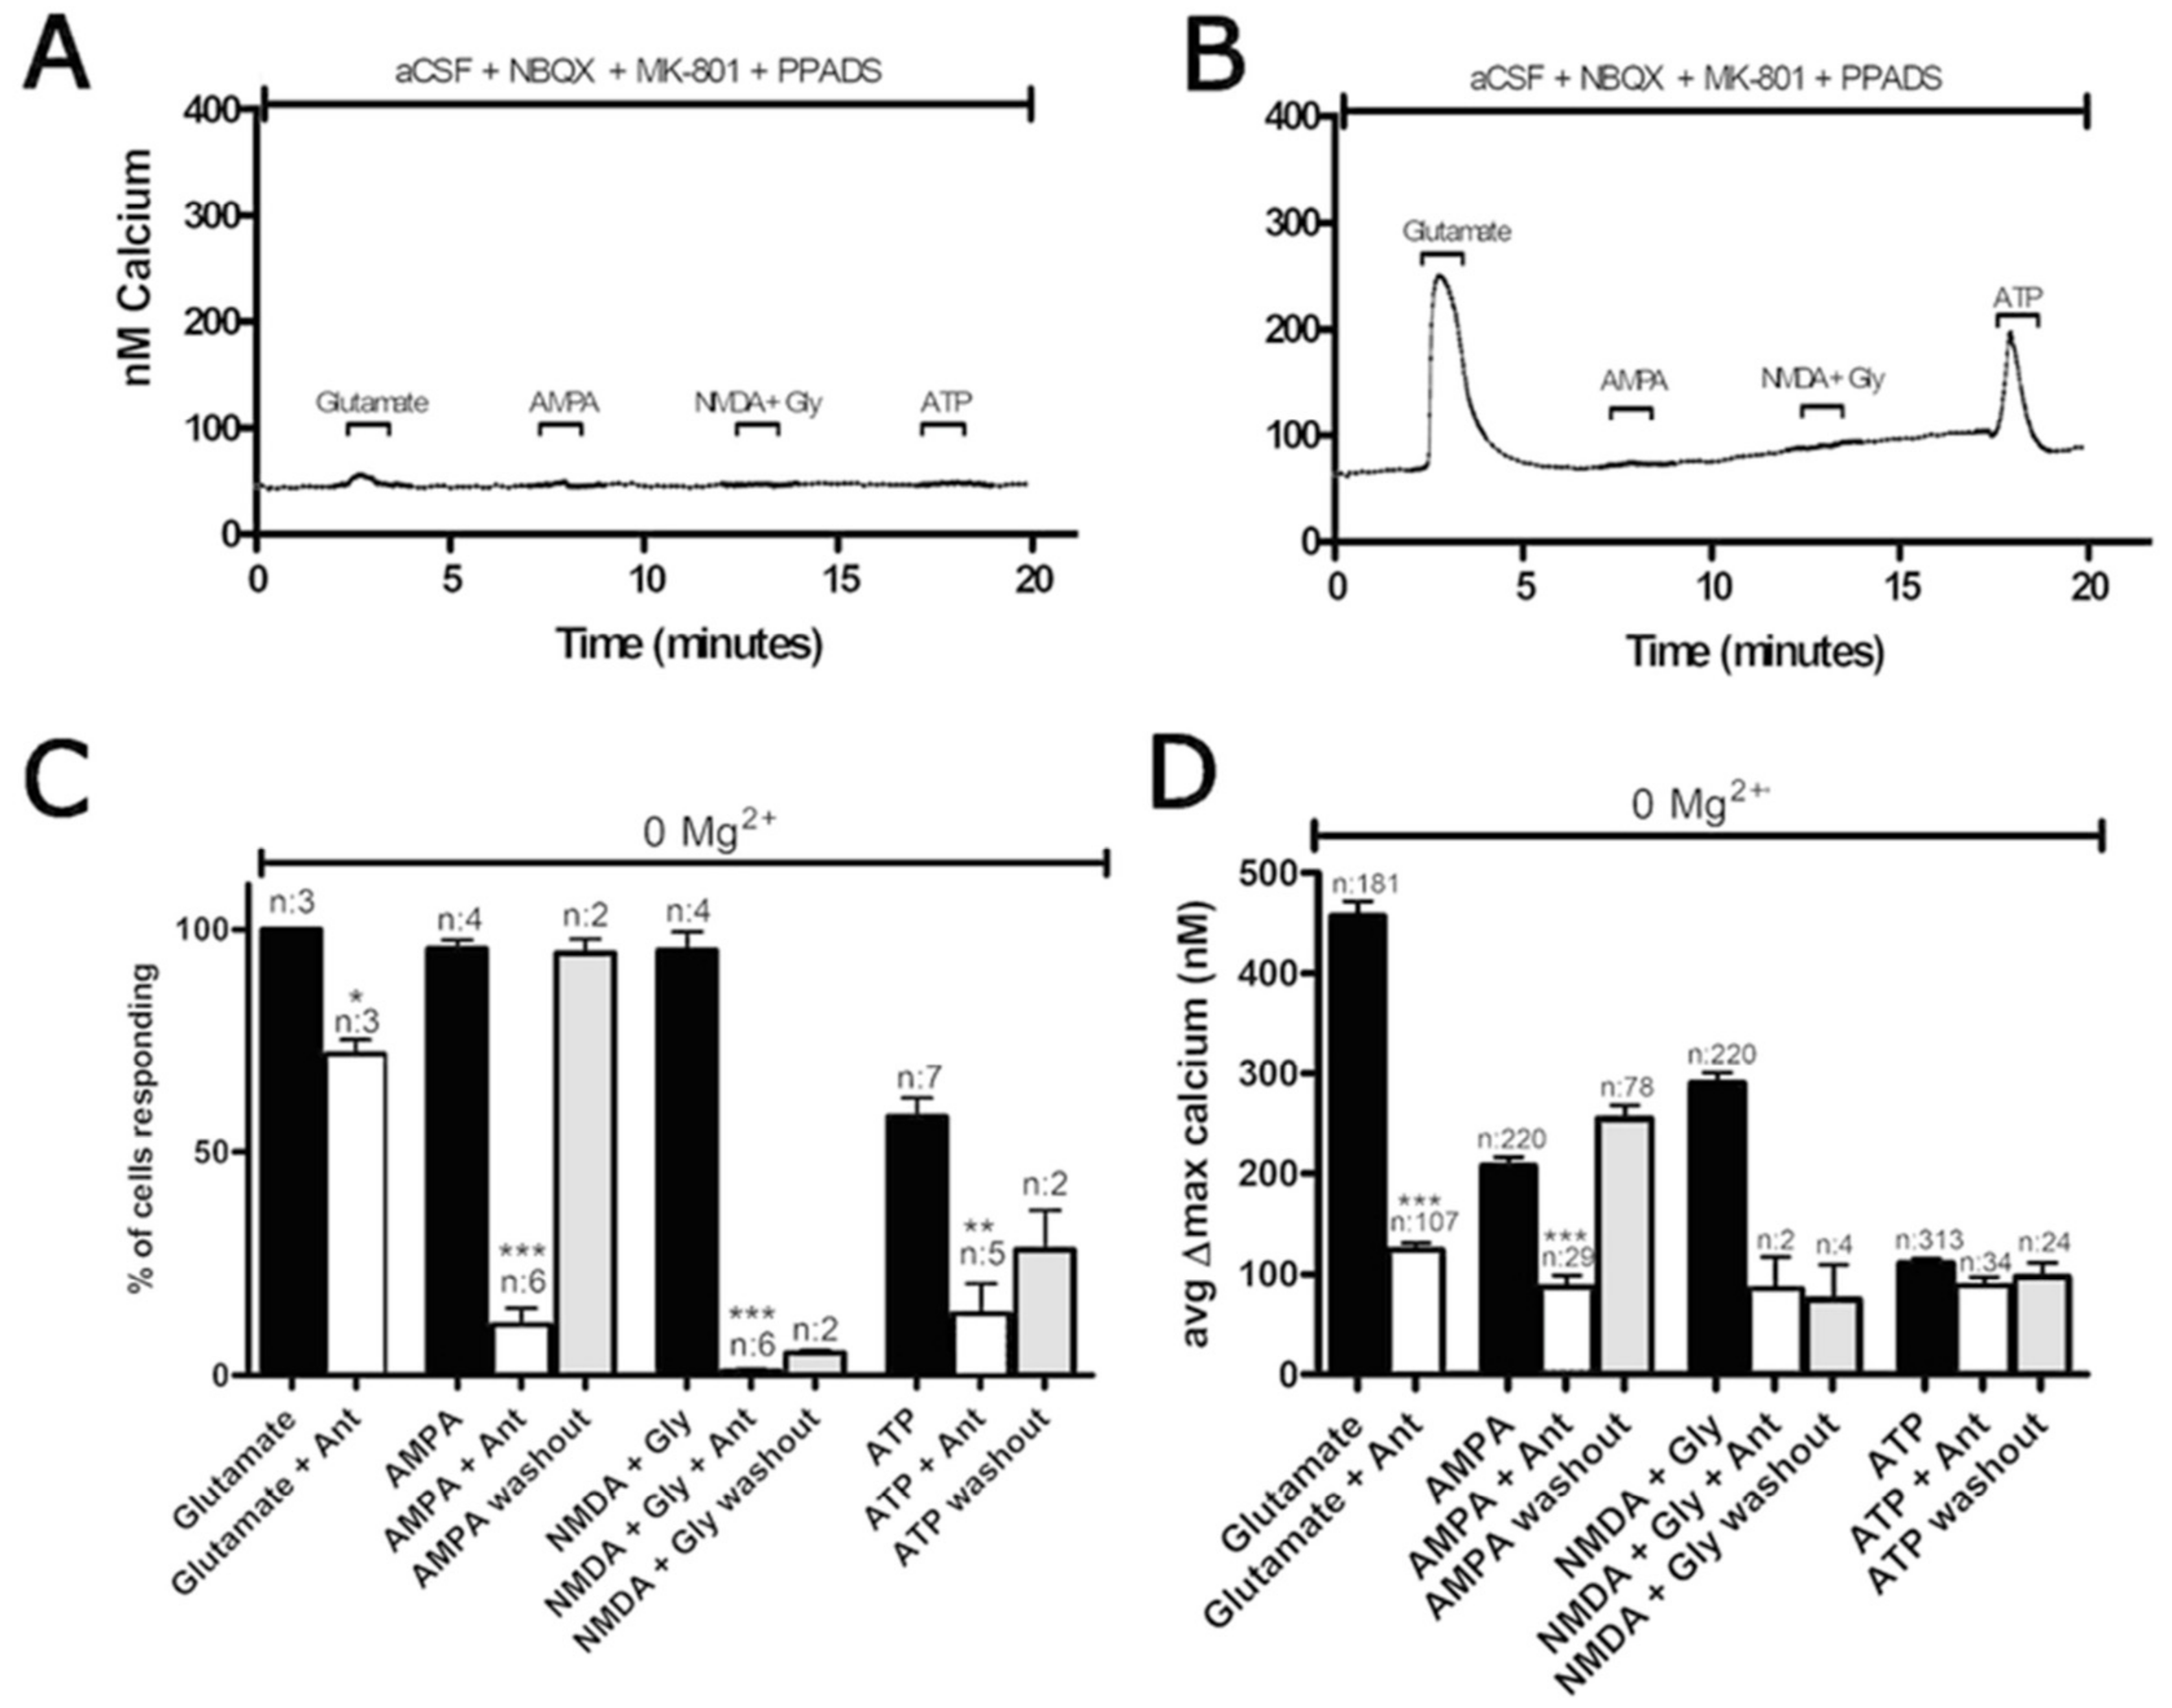
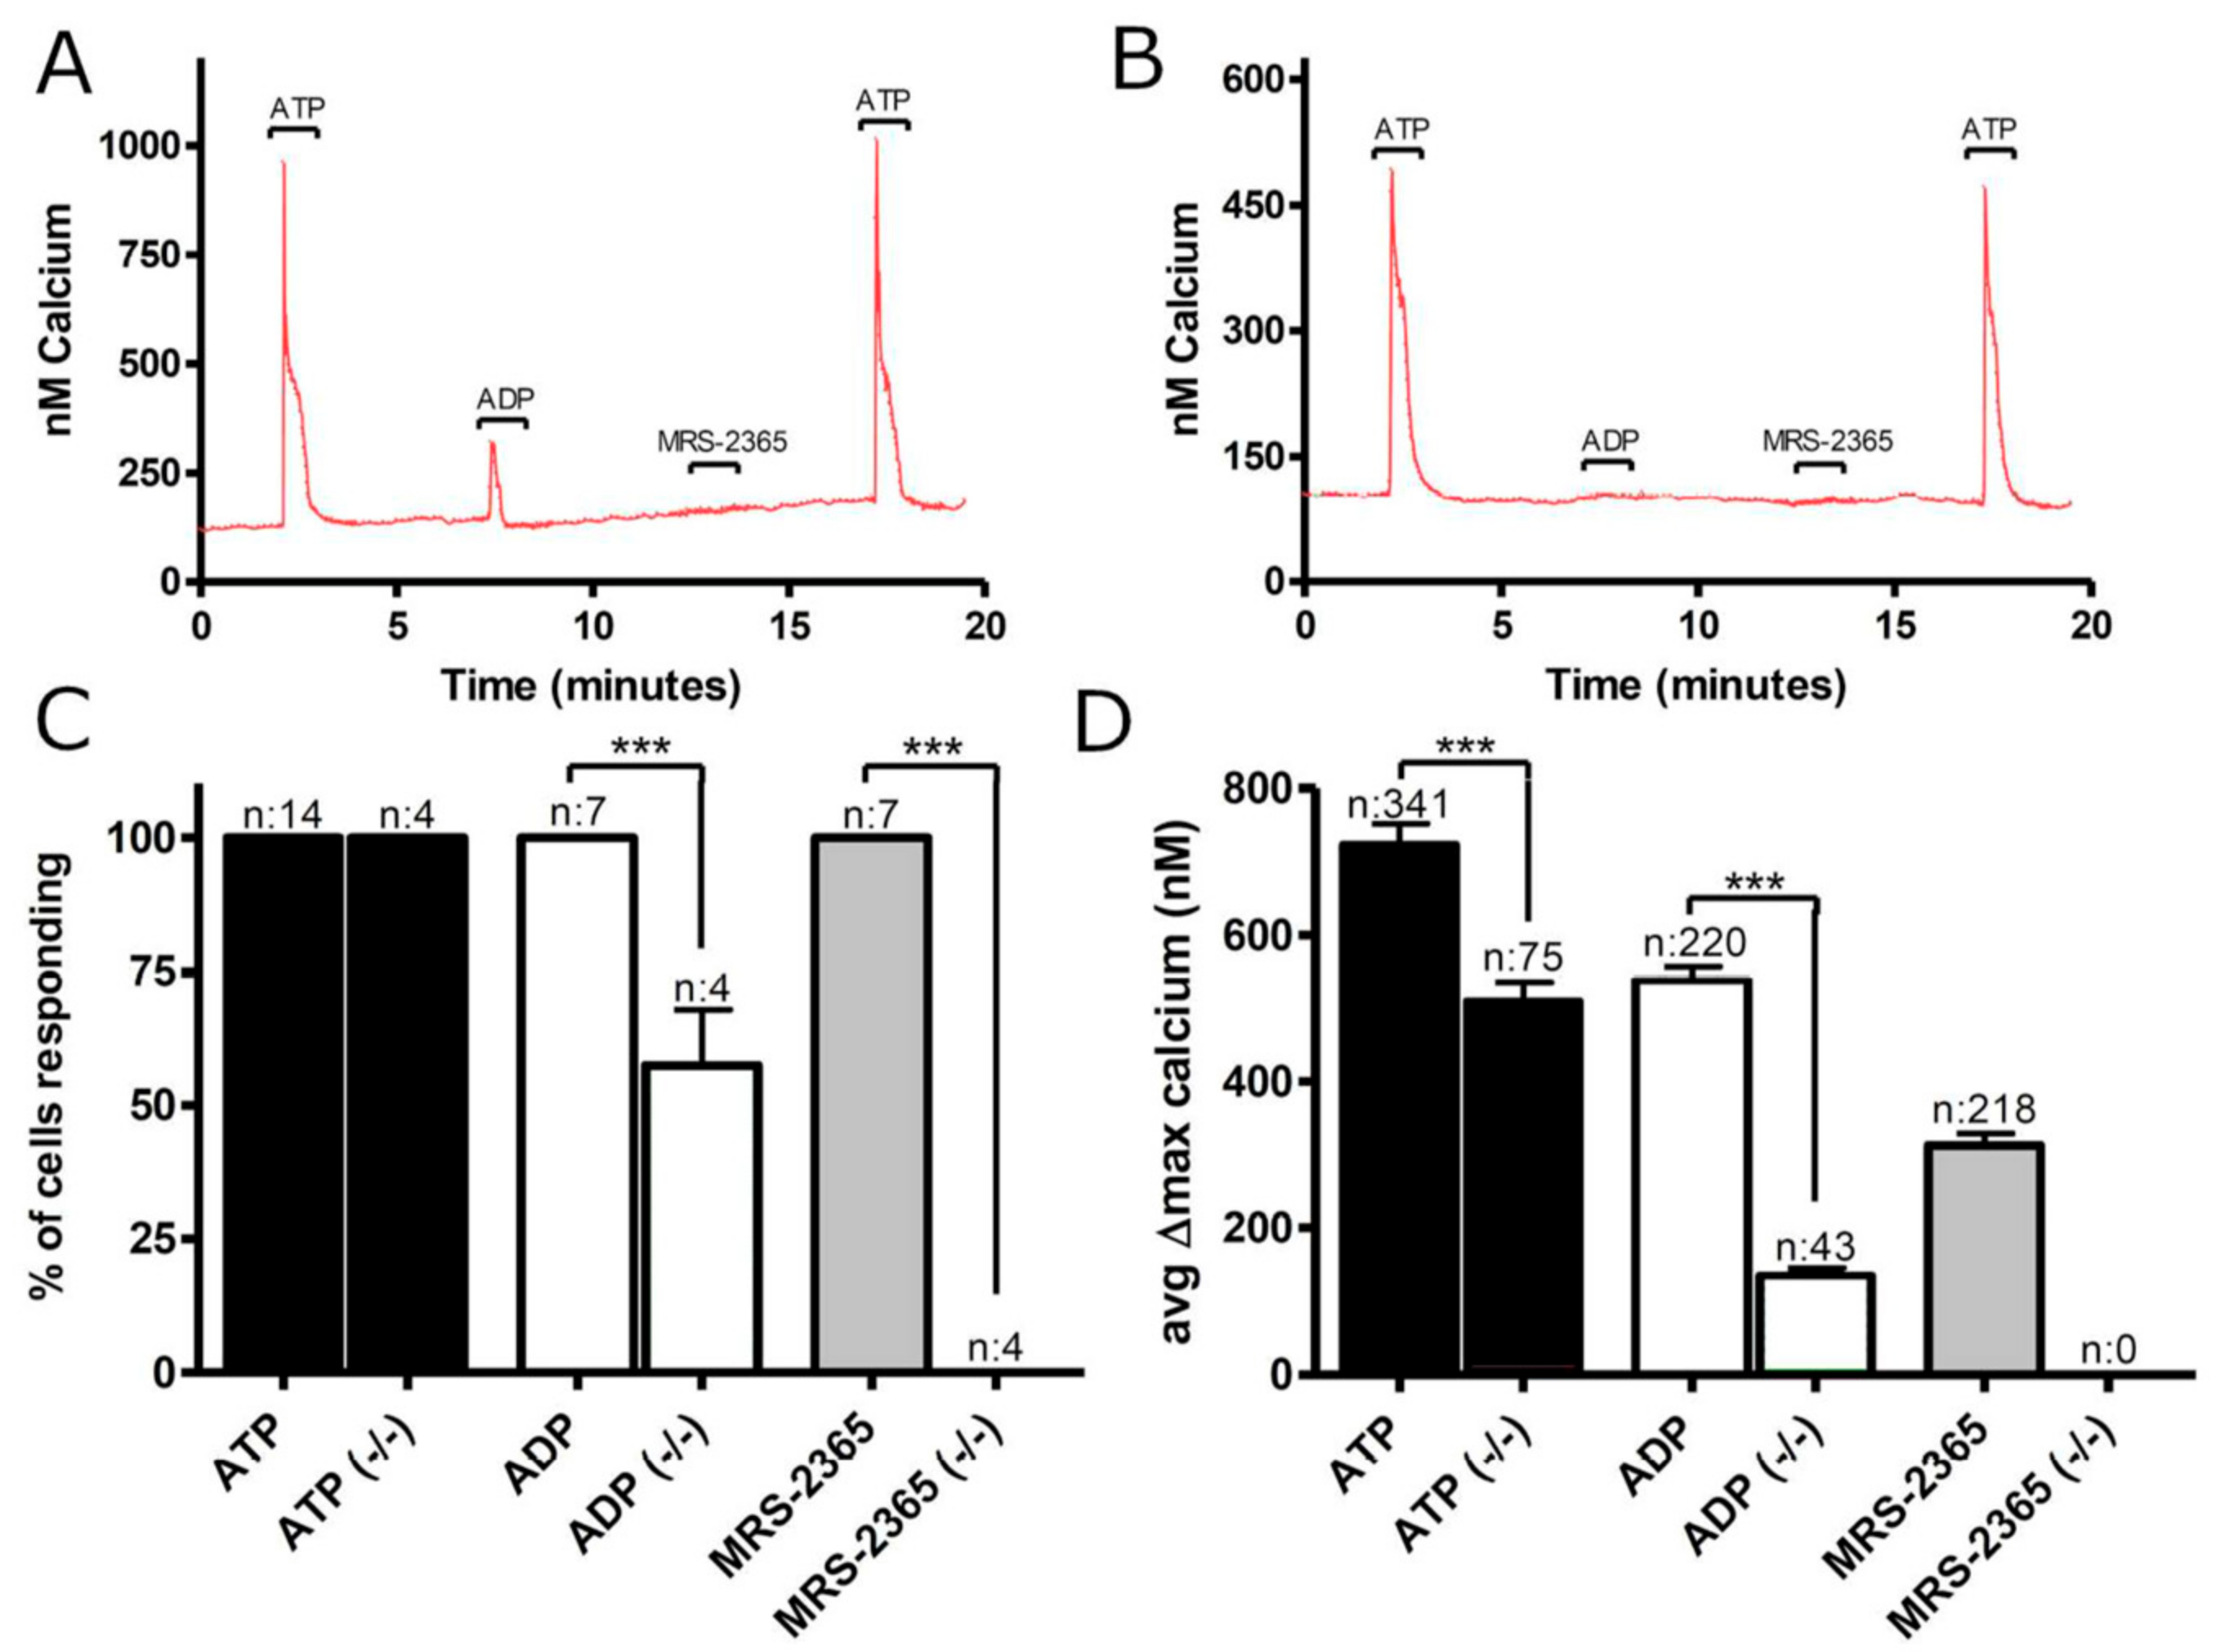
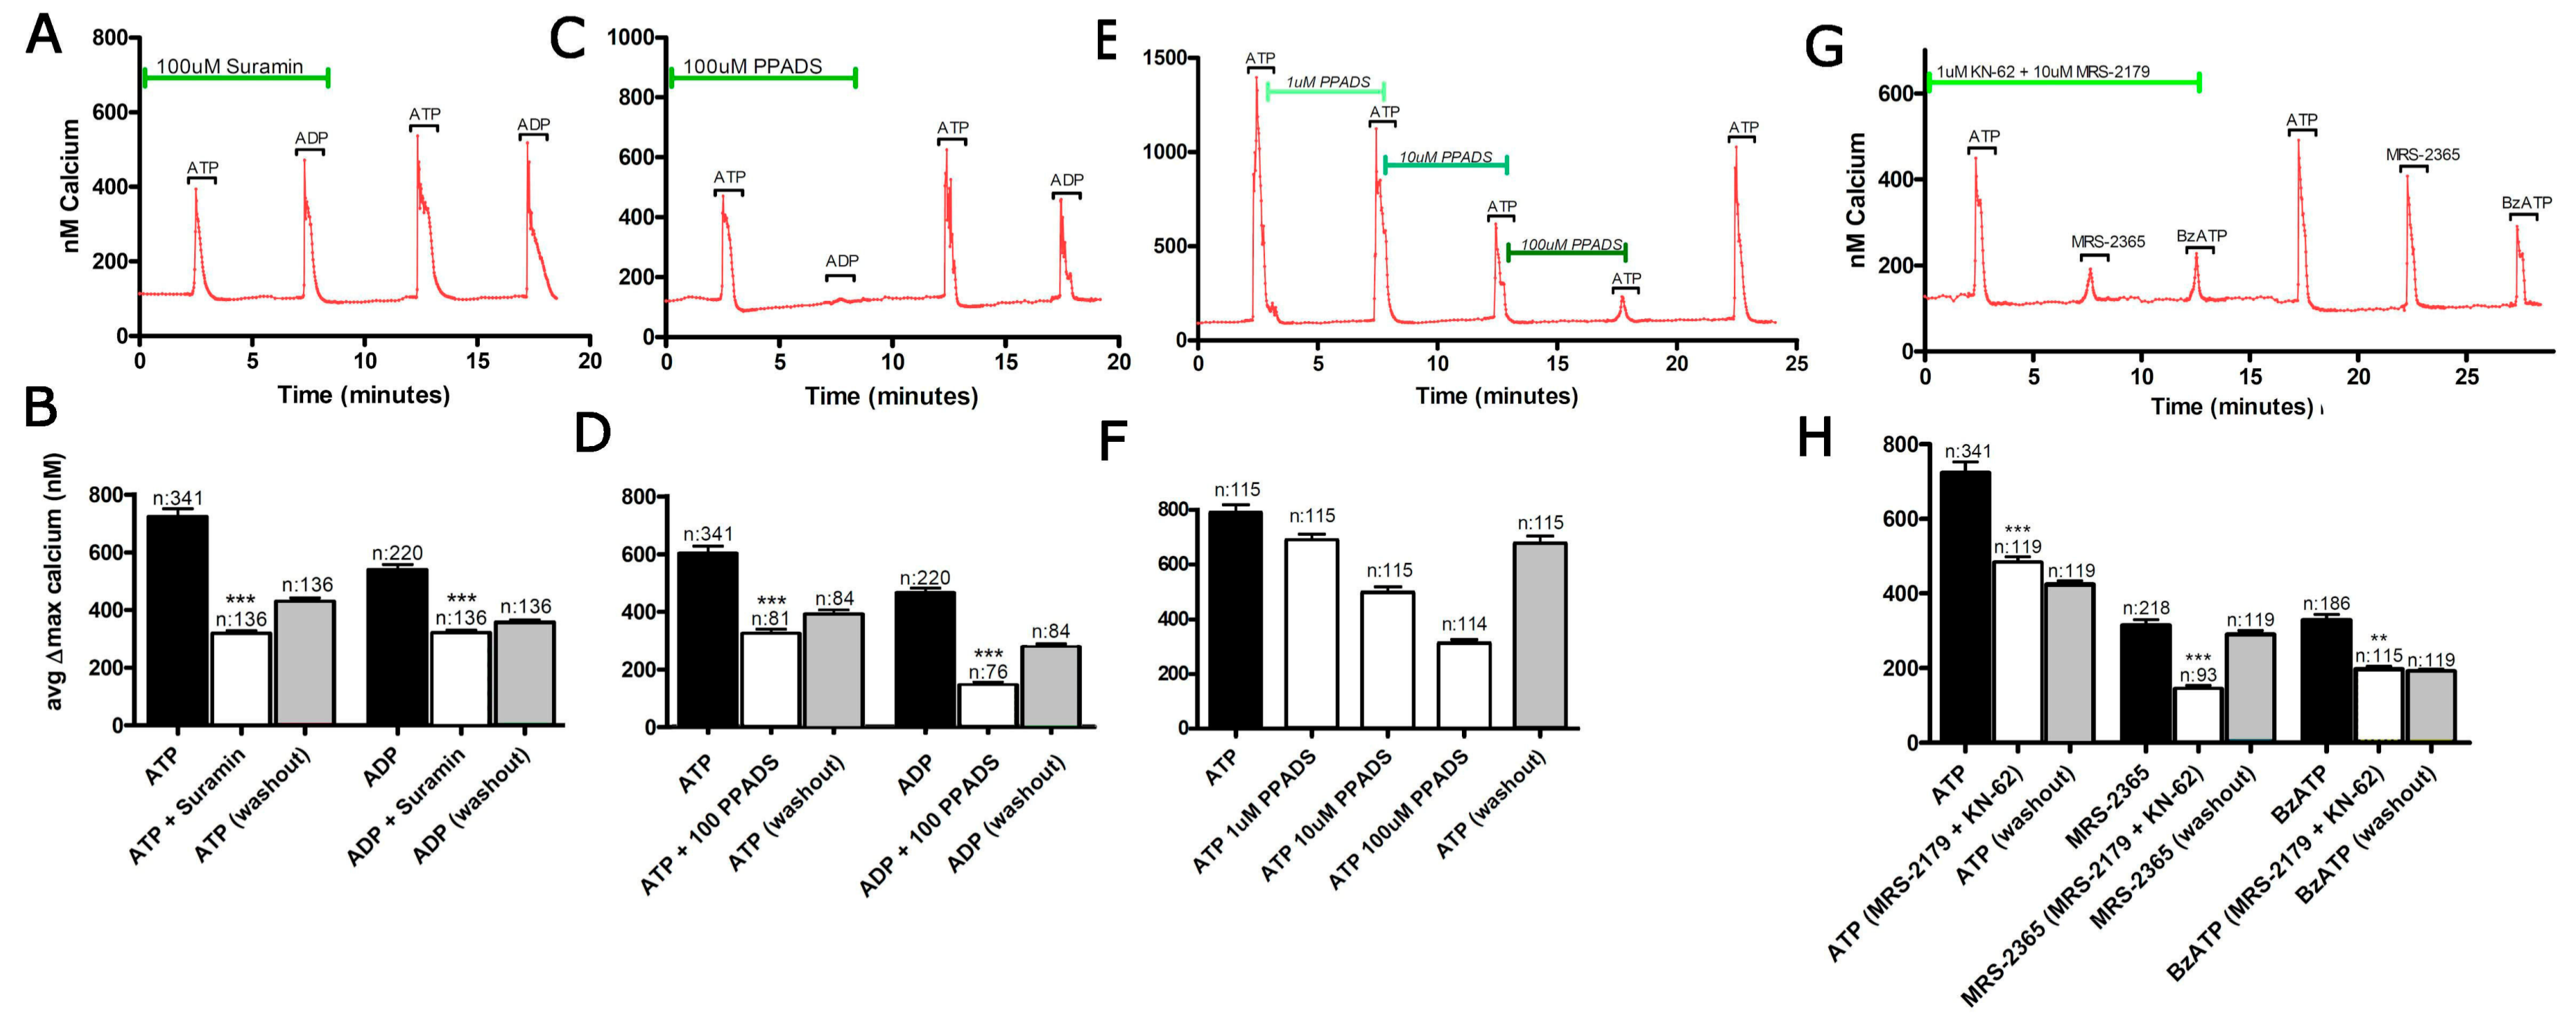
3.1. Functional P2 Receptors and GluR in Astrocyte-Enriched and Neuron-Enriched Cultures

Functional GluR and P2 ATP receptor expression was examined in neuron- and astrocyte-enriched cultures, using Ca2+ micro-fluorimetry. Resting [Ca2+]i was significantly higher in astrocyte cultures compared to neurons (98.0 nM ± 3.0 n = 554 vs. 65.0 nM ± 1.5, n = 739, respectively; p < 0.001), and in both cases was affected by tonic application of various receptor antagonists used in this study. For this reason, [Ca2+]i changes have been used for the statistical comparison of drug effects, rather than absolute [Ca2+]i levels. To confirm the presence of functional P2 receptors on astrocytes, cells were exposed to a series of P2 receptor agonists. One hundred percent of astrocytes responded to 100 μM ATP, with a mean [Ca2+]i increase of 722.9 ± 29.2 nM (n = 341; Figure 1A–C). All receptor sub-type selective agonists tested (100 μM adenosine diphosphate (ADP), 100 μM ATPγS, 10 nM MRS-2365, 100 μM BzATP) had response rates approaching 100% and produced smaller [Ca2+]i responses than those produced by ATP, in the 328–539 nM range (Figure 1A–C). A second application of 100 μM ATP at the end of the experiment produced a [Ca2+]i rise of a similar amplitude to the initial response, but a degree of response run-down was found during multiple sequential applications of ATP (falling to 84.9% of the first response after six repeats, 5 min apart, n = 62). Small amplitude glutamate responses were observed in a sub-set of cultured astrocytes (e.g., Figure 1A), as reported in a companion study [4].
The presence of ionotropic glutamate receptors is well documented in cultured neurons (see [4] for studies on sister cultures), P2 receptor responses less so. The proportion of cells in neuronal cultures responding to sequential exposure to a series of P2 agonists ranged from 58.0 ± 4.2% for ATP down to 26.4 ± 7.1% for BzATP (Figure 1D,E), in all cases significantly lower than the corresponding response rate in astrocyte cultures. The maximal [Ca2+]i rises evoked by P2 agonists were also smaller than in astrocytes, between 110.0 ± 4.6 nM for ATP and 56.9 ± 4.3 nM for BzATP (Figure 1F). In general, neurons responded to either the majority of P2 agonists or none at all, although the amplitude of responses varied within cells. As with astrocytes, a degree of hysteresis in the ATP response was observed in cultured neurons with a second application evoking a significantly smaller response (Figure 1F).
Since neurons express both functional GluR and P2 receptors, the effects of combined P2 + GluR block were examined on agonist-induced responses in neuronal cultures. Combined block of GluR and P2 receptors (60 min pre-treatment with 30 μM NBQX + 10 μM MK-801 + 100 μM PPADS) reduced the proportion of neurons responding to glutamate (under zero-Mg2+ conditions) from 100% to 72.0 ± 3.2%, with response amplitude falling by 73.1% (p < 0.001; n = 107; Figure 2A–D). Responses to specific NMDA- and non-NMDA-type ionotropic glutamate receptor agonists were suppressed to a greater extent than those to glutamate, indicating a significant metabotropic component to the glutamate response in cultured neurons. The cellular ATP response rate fell to 13.7 ± 6.6% (p < 0.001; n = 231) in the presence of the antagonist cocktail, but the amplitude of [Ca2+]i rises in the remaining responding cells was not significantly affected (Figure 2C,D).
Astrocytes express a wide range of P2 receptors and to differentiate P2X- and P2Y-mediated responses the Ca2+-dependence of P2 responses in these cells was investigated [29]. Astrocyte cultures were pre-treated with 1 μM thapsigargin for 60 min to block sarcoplasmic/endoplasmic reticulum Ca2+-ATPase (SERCA) and deplete Ca2+ stores prior to sequential exposure to ATP and ADP in the presence and then the absence of extracellular Ca2+ (Figure 3). In normal aCSF, thapsigargin treatment reduced the proportion of ATP-responding cells from 100% to 60.1 ± 13.0% and response amplitude to 7.3% of control (both p < 0.001). All responses were eliminated by the removal of extracellular Ca2+ (Figure 3B,C). The data suggest that ~60% of astrocytes express functional P2X receptors but that these contribute less than 10% to the Ca2+ rises evoked by ATP. ADP, which is a selective agonist for a sub-set of P2Y receptors, produced only limited responses following thapsigargin treatment, consistent with this hypothesis. The P2Y receptor compliment on astrocytes included a significant P2Y1 component since ~30% of the [Ca2+]i response to ATP was lost when experiments were conducted on astrocyte cultures prepared from P2Y1 −/− mice (Figure 4). The [Ca2+]i responses to ADP were also reduced in these cells (by over 80%), and all effects of the selective P2Y1 agonist MRS-2365 were abolished (Figure 4). As a corollary, this experiment demonstrates the purity of the ATP used since some cells responded to ATP but not ADP; ADP impurity has been a major concern in commercially available ATP [30].
In astrocyte cultures, pre-incubation for 60 min with the broad-spectrum P2 antagonists suramin (100 μM, Figure 5A,B) or PPADS (100 μM, Figure 5C,D) reduced the mean [Ca2+]i response to ATP by 43.9 ± 1.4% and 55.9 ± 1.8% of control, respectively. ADP responses, which should be largely P2Y-mediated, were reduced by 59.5 ± 1.9% and 39.5 ± 1.9%, respectively. Drug washout was incomplete over the time-course of the experiment. Neither drug significantly reduced the 100% response rate of the cells to either agonist. The concentration-dependence of PPADS was investigated during shorter exposure periods (Figure 5E,F). Sixty-minute pre-incubation with combined application of the selective P2Y1 antagonist MRS-2179 and the P2X7 antagonist KN-62 was also tested (Figure 5G,H). This protocol significantly reduced the amplitude of the [Ca2+]i responses to ATP to 69.4 ± 2.2% of control (p < 0.001, n = 119), with limited reversibility after 5 min wash-out. Somewhat larger effects of this antagonist combination was found upon the responses evoked by the selective P2Y1 and P2X7 agonists MRS-2365 and BzATP (Figure 5G,H).

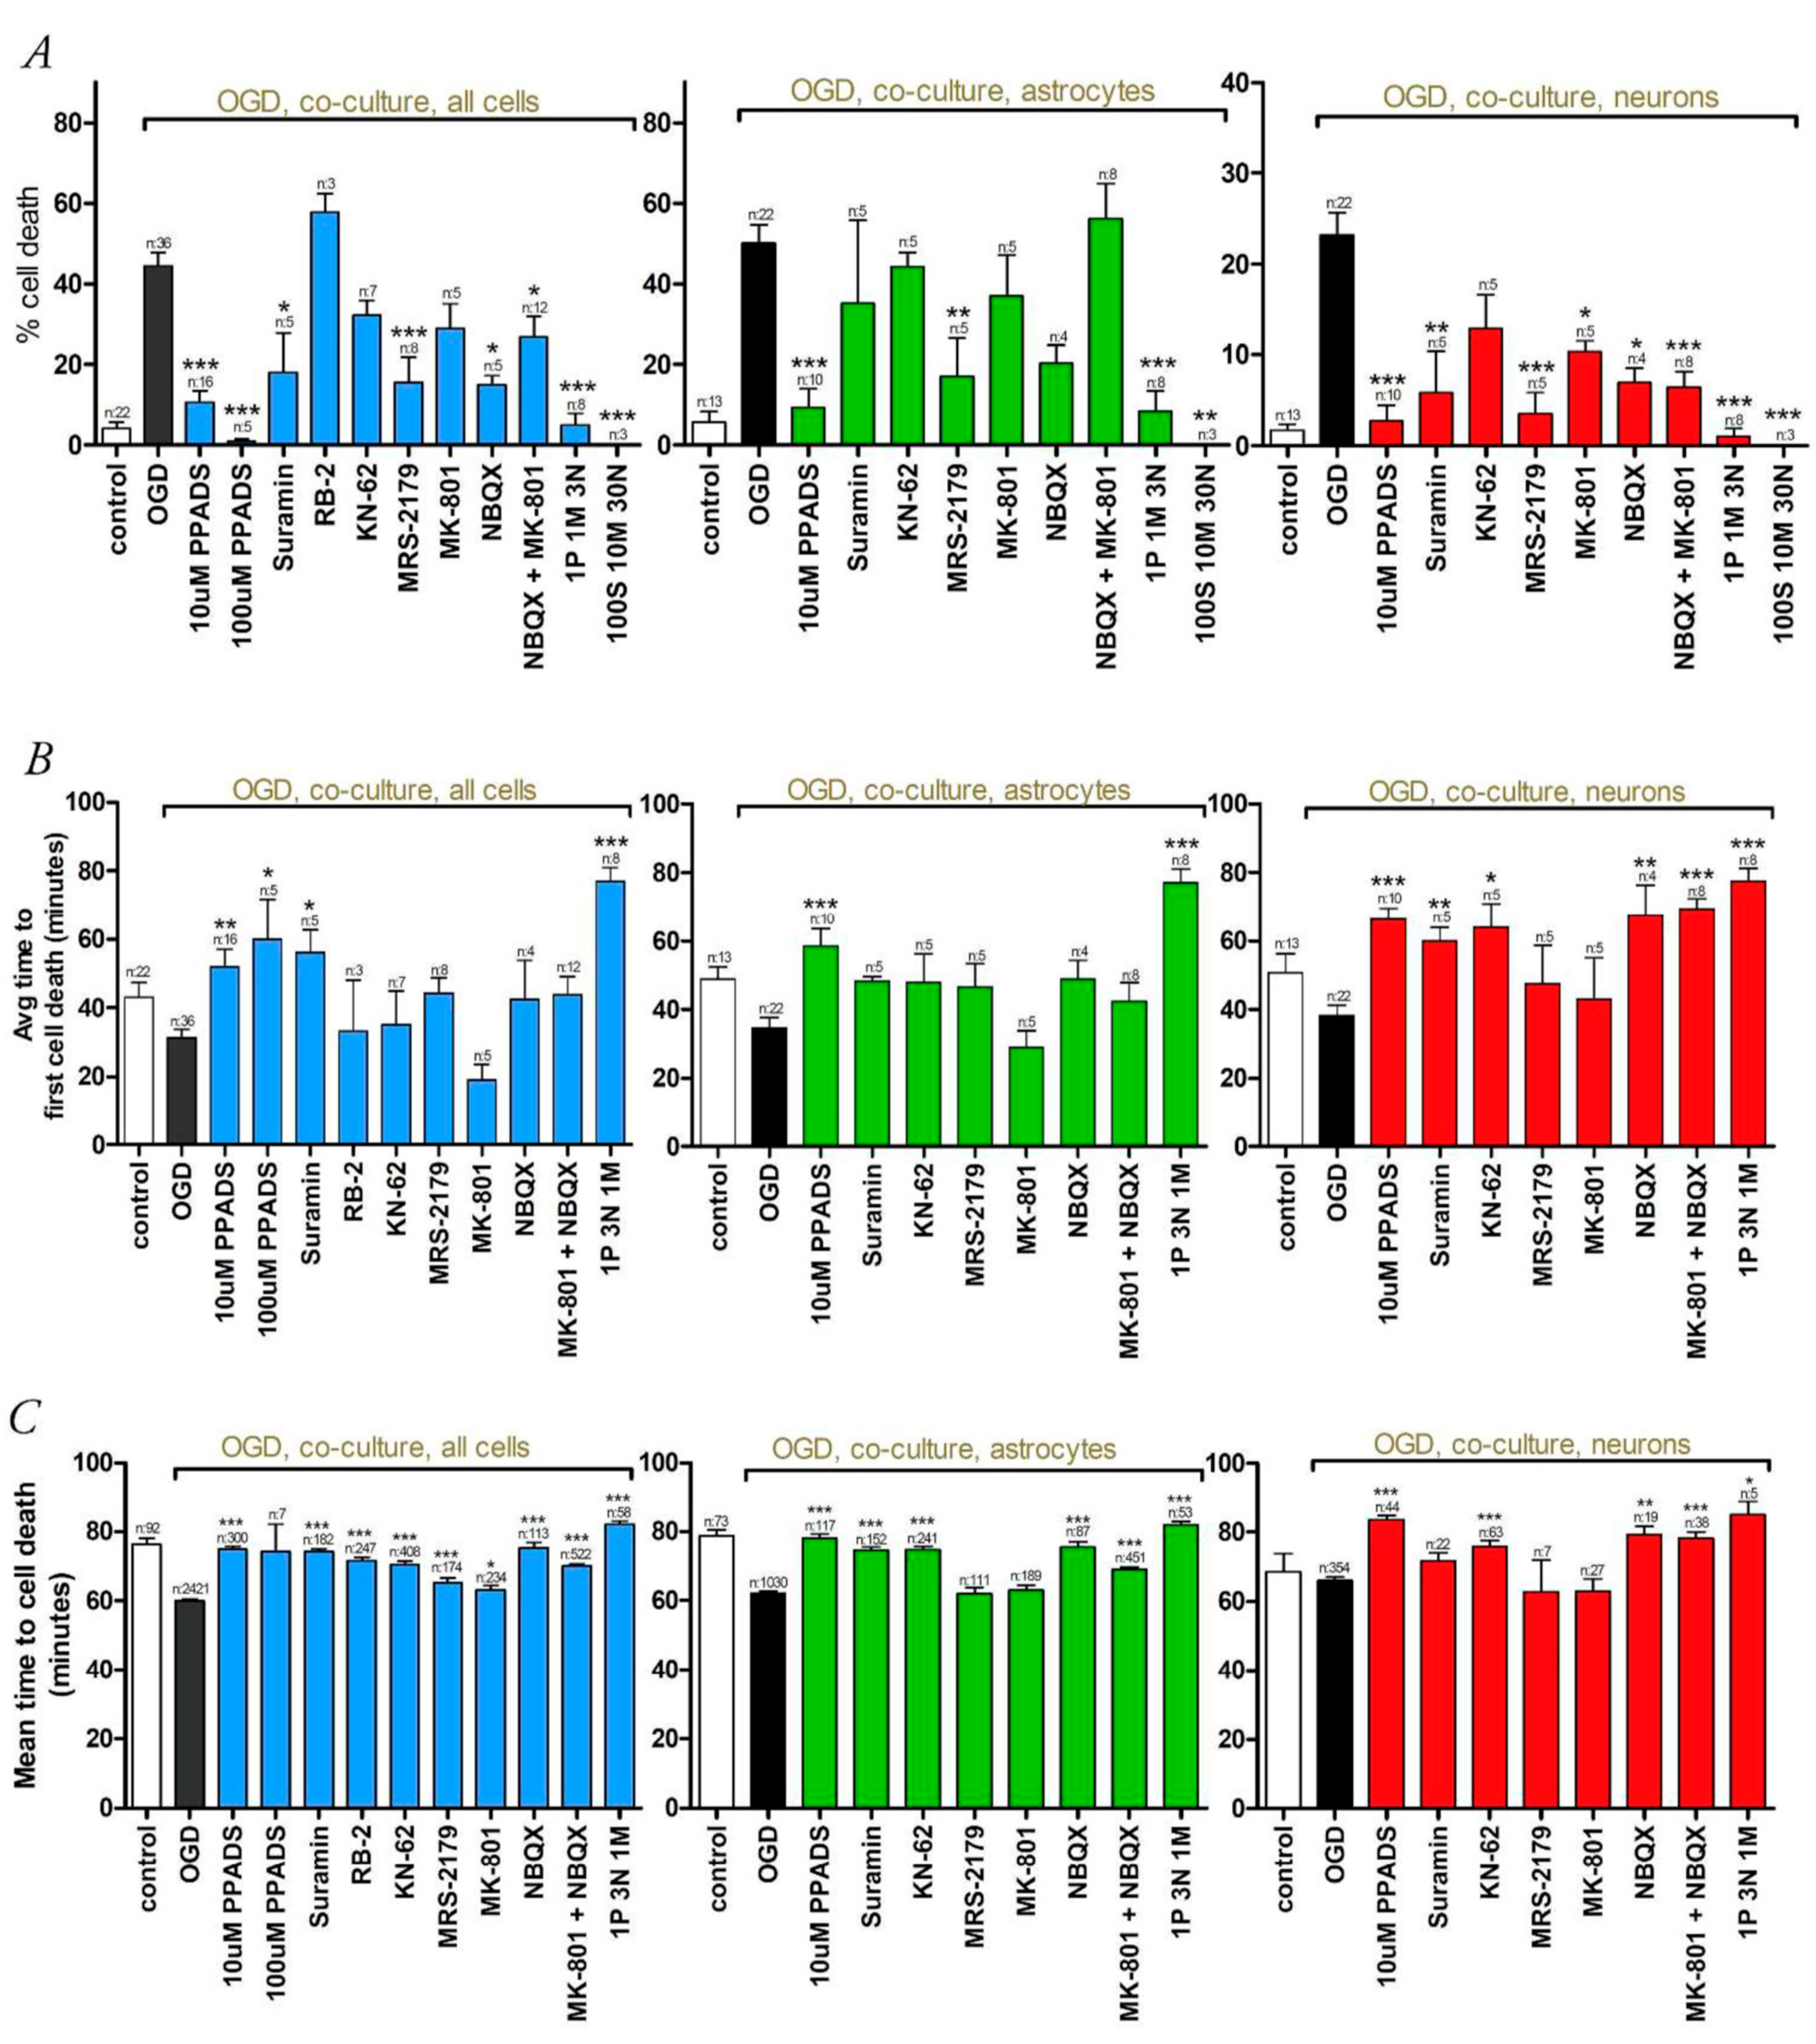
3.2. Oxygen-Glucose Deprivation in High-Density Neuron/Astrocyte Co-Cultures

Ischemic conditions in the brain were modelled by exposing high-density co-cultures to OGD with a similar neuron:astrocyte ratio to that found in the CNS (1:1). OGD evoked a gradual rise in extracellular ATP measured in the unstirred media layer surrounding cells [4] (Figure 6A,B). The mean extracellular ATP increase reached 8.9 ± 3.1 μM during the 80–90 min period of OGD (p < 0.01 relative to control perfused cultures). A significant elevation in ATP concentration was apparent in the 60–70 min epoch (p < 0.05), but the data trend suggests that ATP release started soon after the initiation of OGD (Figure 6A). Activation of P2 receptors during OGD was subsequently found to contribute to acute cell death in this preparation (See below). To test the hypothesis that P2 receptor antagonists act independently of glutamate release, glutamate was measured in the mixed high density cultures during OGD in the presence and absence of 10 μM PPADS (Figure 6C,D). OGD evoked an early increase in extracellular glutamate in this preparation, and this was not significantly affected by block of P2 receptors.
The effect of a range of ionotropic glutamate and P2 receptor blockers in isolation and in combination (see Table 1 and Table 2 for selectivity of P2 antagonists) were tested upon the degree of cell death produced by 90 min of OGD in high-density co-cultures, assessed via CFMDA cell-tracker imaging (Figure 7). This approach allowed neurons and astrocytes to be differentiated using unambiguous morphological criteria [4]. The non-selective P2 antagonist PPADS (10 μM) was highly protective of both neurons and astrocytes, with neuronal death reduced to 2.8 ± 1.7% and astrocyte death to 9.4 ± 4.5% (n = 10; p < 0.001); PPADS (100 μM) (sufficient to block all P2 receptor types) reduced total cell death to a level below that found in control perfused cultures (0.9 ± 0.5%; p < 0.001). Suramin (100 μM) has been reported to block P2X 2, 3, 5, 6 and 7 in addition to P2Y 1, 2, 6, 12 and 13 types, produced significant protection of neurons but not astrocytes, reducing over-all cell death as a result. In contrast, reactive blue-2, which at the concentration used (100 μM) has been reported to block P2X 1–3 and 5 and P2Y 1, 4, 6 and 11–12, was without effect. The P2X7 selective antagonist KN-62 (1 μM) did not have a significant effect upon either cell type, while the P2Y1 antagonist MRS-2179 (10 μM) significantly protected both astrocytes and neurons from cell death, and reduced total cell death to 15.5 ± 6.3%. Consistent with prior reports, block of non-NMDA or NMDA GluRs (NBQX 30 μM or MK-801 10 μM, respectively), was protective of neurons. The most significant protection was found during combined application of both antagonists; no glutamate receptor blocking protocol had any significant effect upon astrocyte survival. Combined block of P2 and glutamate receptors with 100 μM suramin + 10 μM MK-801 + 30 μM NBQX (100S10M30N) completely abolished all cell death in both astrocytes and neurons. Combined perfusion with low agonist concentrations was also tested. PPADS (1 μM) + mk-801 (1 μM) + NBQX (1P1M3N) (3 μM) was highly protective of both neurons (1.1 ± 0.9% cell death) and astrocytes (8.5 ± 3.9% cell death), with total cell death reduced from 13.2 ± 1.6% to 5.0 ± 2.9% (p < 0.001).

3.3. Oxygen-Glucose Deprivation in Normal-Density Neuron/Astrocyte Co-Cultures

To test whether the highly protective nature of combined P2 and GluR block was limited to the high-density cultures required for biosensor recording of neurotransmitter release, we examined the effect of combined blockade in normal density 50:50 neuron:astrocyte cultures using low doses of clinically applicable drugs. Control levels of total cell death was higher in these normal-density cultures, an effect that was countered by low concentrations of PPADS which acted by reducing astrocyte death (Figure 8A). PPADS at 0.5 μM reduced total cell death under control normoxic conditions from 13.2 ± 1.6% to 3.1 ± 0.5% over the 100 min recording protocol (p < 0.001), suggesting tonic ATP release and low levels of on-going P2 receptor-mediated excitotoxicity in these cultures. Ninety-minute OGD evoked a significantly lower level of overall cell death (22.0 ± 1.6%; Figure 8B) than it did in the high density cultures (see Figure 7), the difference accounted for by a reduced level of astrocyte death. This phenomenon is potentially related to lower levels of ischemic neurotransmitter release associated with lower cell density. Very low levels of PPADS significantly reduced OGD-induced astrocyte and total cell death, with 0.5 μM reducing overall cell death during OGD to 16.7 ± 5.8% (p < 0.02 vs. OGD alone). PPADS (1 μM) reduced total cell death to 11.2 ± 1.6% (p = 0.01), with only the highest concentration tested (10 µM) having any protective effect upon neurons (8.4 ± 2.2%, p = 0.002). The time-course of cell death under control perfused and during OGD are shown in Figure 8C,D.
To test combined block of NMDA-type GluR and P2 receptors in this preparation, cultures were exposed to 0.2 µM memantine + 0.5 µM PPADS. Current and established data show that these concentrations given individually are not protective of total cell death in this preparation [4]. Following application of this combination a significant protective effect against astrocyte (7.0 ± 2.0%, p < 0.0001) and total cell death (7.0 ± 2.0%, p < 0.0001; Figure 8B) was found. However, no significant effect was seen upon neuronal death (13.3 ± 2.4%, p = 0.0772). Memantine (0.2 µM) + PPADS (0.5 µM) significantly decreased cumulative cell death at 75 min onwards compared to OGD-only conditions (Figure 8F; p < 0.001). A further low concentration combination was investigated. PPADS (0.25 µM) and MEM (0.1 µM) significantly reduced neuronal death (11.3 ± 3.0%; p < 0.01), with no effect on astrocyte or all cell death (Figure 8D). This combination showed an increased cumulative level of cell death in continually-imaged cells compared to OGD-only conditions (Figure 8F).

4. Discussion

The focus for acute stroke intervention research has been on re-vascularization therapies, reactive species buffering or excitotoxicity interruption via NMDA-type GluR blockers [31]. Drugs directed toward glutamate-mediated excitotoxicity have shown particular promise in animals, but have not translated into clinical practice. Neural function is dependent upon the homeostatic relationship between neurons and astrocytes, and any successful stroke intervention must protect both cell types if functional improvement is to be achieved. Since the NMDA-type GluRs which largely mediate glutamate excitotoxicity are either absent or expressed at low levels in astrocytes (e.g., [5]), one shortfall of targeting glutamate excitotoxicity may be a lack of astrocyte protection. Astrocytes express a high density of P2 ATP receptors [6], and brain ischemia produces significant rises in extracellular ATP concentration [16]; targeting ATP-mediated excitotoxicity may therefore be necessary for stroke neuroprotection.
For ATP and glutamate mediated excitotoxic cascades to co-exist, cells must release excessive ATP and glutamate during ischaemic conditions, events which we have confirmed in high-density cultures using biosensor microelectrodes. Neurotransmitter release was apparent soon after the onset of OGD, although ATP levels were lower and reached statistical significance later than glutamate. In this preparation, astrocytes rather than neurons contributed the majority of glutamate release during OGD, since significant glutamate release only occurred from astrocyte cultures and co-cultures. Glutamate release from co-cultures was not attenuated by the non-selective P2 blocker PPADS, suggesting that P2 receptor activation does not contribute to ischaemic glutamate release. Excessive ischemic ATP release was only consistently detected in co-cultures, indicating that astrocytes and neurons interact/co-operate by an unknown mechanism to release ATP or enhance extracellular ATP accumulation during ischaemia.
A second pre-requisite for ATP and glutamate mediated excitotoxicity is the functional expression of P2 and GluRs on neural cells. Functional receptor responses were examined via Ca2+ imaging, revealing widespread ionotropic and metabotropic GluR responses in neuronal cultures, while only a small percentage of cultured astrocytes expressed functional (mostly metabotropic) GluRs. Cultured neurons and astrocytes expressed a variety of functional P2 receptors, with 100% of astrocytes and approximately 60% of neurons responding to ATP. In both cell types, there was a dominant contribution of metabotropic P2Y over ionotropic P2X receptors. A P2 receptor subtype expression profile obtained using multiple P2 agonists/antagonists and P2Y1−/− astrocytes found expression on neurons and astrocytes of P2Y1 and P2Y6, with a possibility of P2Y2 and/or P2Y4, while astrocytes in particular also expressed functional P2X7 receptors.

4.1. GluR Antagonists Protect Neurons but Not Astrocytes

Blocking NMDA and/or AMPA/kainate GluRs reduced OGD-induced cell death in neurons but not astrocytes. A similar differential effect has been previously documented in cell cultures, and correlates with the largely neuronal pattern of GluR expression [4,32,33,34,35]. Analysis of the time course of cell lysis revealed that the reduction in neuronal death produced by the NMDA blocker MK-801 reached statistical significance after 90 min of OGD, and did not reduce the mean time to cell death. NBQX (alone or in combination with MK-801) significantly reduced cell death after 60–65 min of OGD, and significantly delayed the mean time to cell death. Consistent with this, NMDA GluR antagonists are less effective than AMPA/kainate receptor antagonists during prolonged and/or more severe ischaemia.

4.2. Broad-Spectrum P2 Antagonists Protect Neurons and Astrocytes

Of the broad-spectrum P2 antagonists tested, PPADS is selective for P2 receptors while suramin and RB-2 have non-specific effects including activity at GluRs [36,37,38,39,40,41,42,43] (see Table 1 and Table 2). RB-2 did not significantly affect cell death, although it did delay the mean time to cell death of all cells combined. Suramin significantly reduced neuronal but not astrocyte death, and also increased the average time to first death of neurons. PPADS was the most protective of the antagonists tested, significantly reducing death of both neurons and astrocytes. PPADS (100 μM) almost eliminated cell death during the 90 min OGD period, while 10 μM reduced astrocyte and neuron death by ~80% and significantly delaying the average time to first death and mean time to cell death for both cell types.
Suramin or PPADS reduce neuronal death in primary neuron and brain slice cultures exposed to glucose deprivation or OGD (injury assessed ≥ 20 h) [44,45,46]; protection with low (PPADS, 5 μM) concentrations of has been reported in hippocampal slice cultures [47]. The current findings are the first to demonstrate that P2 antagonists can protect neurons during acute ischaemia, and that PPADS protects both neurons and astrocytes. The absence of protection afforded by RB-2 in the current results contradicts reports that have measured injury at delayed time-points [45,48,49], and may indicate an effect of this blocker only on delayed injury. The selective P2X7 antagonist KN-62 also produced no significant protection in high-density cultures, consistent with results with other P2X7 antagonist and receptor knock-out animals where infarct volume following middle cerebral artery occlusion is not significantly affected [50,51]. The size of excitotoxic lesions induced by the NMDA receptor agonist methano-glutamate in vivo are not reduced in P2X7 −/− animals or by three different selective P2X7 antagonists, suggesting that these receptors are not involved in glutamate neurotoxicity [50,51].
P2Y1 receptor block was highly protective in high-density cultures. P2Y1 receptor block delays anoxic depolarization in hippocampal slices [52], but the current data are consistent with reports that P2Y1 block is effective against ischemic injury in vivo [53,54,55]. P2Y1 receptor activation stimulates glutamate release from cultured hippocampal and spinal cord astrocytes but not neurons, while P2Y1 receptor antagonists reduce ATP induced glutamate release from astrocytes [56,57,58]. P2Y1 antagonists may therefore act to mitigate glutamate excitotoxicity via reduced glutamate release, although the current finding that PPADS did not reduce ischaemic glutamate efflux from the co-culture argues against this. Furthermore, glutamate receptor antagonists only significantly reduced neuronal ischaemic death without protecting astrocytes. Heteromeric functional coupling of P2Y1 and A1 receptors has been demonstrated in neurons and astrocytes [59,60], resulting in A1 receptor desensitization following P2Y1 activation. Since A1 receptor activation is protective, P2Y1 blockers may afford neural protection via this alternative mechanism. However, the most likely mechanisms is reduced Ca2+ over-loading during OGD following receptor block; P2Y1 receptors are shown to mediate a significant component of the Ca2+-rise evoked by ATP and since elevated [Ca2+]i is central to acute ischemic cell injury, block of any receptor mediating [Ca2+]i elevation is predicted to be protective. The data relating to receptor-mediated excitotoxic injury during acute ischemic conditions in mixed neuron-astrocyte environments are summarized in Figure 9.

4.3. Synergistic Effect of P2 and Glutamate Receptor Antagonists

Initially, suramin (100 μM) + NBQX (30 μM) + MK-801 (10 μM) were added to high-density cultures: this combination completely prevented cell death during 90 min of OGD and was significantly more protective than either suramin or NBQX + MK-801 paradigms. To further probe this synergism, PPADS (1 μM) + NBQX (3 μM) + MK-801 (1 μM) was tested. This combination, less likely to produce non-selective effects, reduced acute astrocyte and neuron lysis by 83% and 95%, respectively, and significantly delaying the onset and mean time to cell death more than any other antagonist combination. The synergistic effect was significantly greater than that produced by either class of antagonist alone, even when applied at high concentrations. A similar combined protective effect was suggested in a study by Runden-Pran and colleagues [47], where the combination of suramin (200 μM) + MK-801 (100 μM) significantly attenuated cell death in hippocampal slice cultures exposed to 32 min OGD followed by up to 48 h of re-oxygenation [47]. However, this was not significantly more protection than either antagonist on its own, and this suramin concentration is poorly specificity. Low concentrations of PPADS or PPADS + the clinically approved NMDA GluR blocker memantine were tested in normal density co-cultures. PPADS at 1 μM and combined 0.5 μM PPADS + 0.2 μM memantine were protective against acute OGD-induced lysis in neurons and astrocytes, and also reduced background levels of cell death in these cultures. The current data are the first to confirm that a combinatorial approach blocking P2 and ionotropic glutamate receptors provides synergistic protection against ischaemic death of astrocytes and neurons in vitro. Thus, a combinatorial approach may be relevant to test in vivo but this will require the development of selective PPADS antagonists which are able to cross the blood brain barrier.

Acknowledgments

This work was supported by the BBSRC (RF: BB/J016969/1) and by MediSearch (Leicester: RF).

Author Contributions

R.F. conceived and designed the experiments; P.V. and M.T.-L. performed the experiments and analyzed the data; B.H., C.G. and R.J.E. contributed the P2Y1−/− mouse; C.L.G. and R.F. supervised the project; and R.F. wrote the paper.

Conflicts of Interest

The authors declare no conflict of interest.

References

  1. Ginsberg, M.D. Current status of neuroprotection for cerebral ischemia: Synoptic overview. Stroke 2009, 40, S111–S114. [Google Scholar] [CrossRef] [PubMed]
  2. Dirnagl, U.; Iadecola, C.; Moskowitz, M.A. Pathobiology of ischaemic stroke: An integrated view. Trends Neurosci. 1999, 22, 391–397. [Google Scholar] [CrossRef]
  3. Pringle, A.K. In, out, shake it all about: Elevation of [Ca2+]i during acute cerebral ischaemia. Cell Calcium 2004, 36, 235–245. [Google Scholar] [CrossRef] [PubMed]
  4. Trotman, M.; Vermehren, P.; Gibson, C.L.; Fern, R. The dichotomy of memantine treatment for ischemic stroke: Dose-dependent protective and detrimental effects. J. Cereb. Blood Flow Metab. 2015, 35, 230–239. [Google Scholar] [CrossRef] [PubMed]
  5. Lalo, U.; Pankratov, Y.; Kirchhoff, F.; North, R.A.; Verkhratsky, A. NMDA receptors mediate neuron-to-glia signaling in mouse cortical astrocytes. J. Neurosci. 2006, 26, 2673–2683. [Google Scholar] [CrossRef] [PubMed]
  6. Butt, A.M. Atp: A ubiquitous gliotransmitter integrating neuron-glial networks. Semin. Cell Dev. Biol. 2011, 22, 205–213. [Google Scholar] [CrossRef] [PubMed]
  7. Franke, H.; Illes, P. Involvement of P2 receptors in the growth and survival of neurons in the CNS. Pharmacol. Ther. 2006, 109, 297–324. [Google Scholar] [CrossRef] [PubMed]
  8. Sperlagh, B.; Zsilla, G.; Baranyi, M.; Illes, P.; Vizi, E.S. Purinergic modulation of glutamate release under ischemic-like conditions in the hippocampus. Neuroscience 2007, 149, 99–111. [Google Scholar] [CrossRef] [PubMed]
  9. Hisanaga, K.; Onodera, H.; Kogure, K. Changes in levels of purine and pyrimidine nucleotides during acute hypoxia and recovery in neonatal rat brain. J. Neurochem. 1986, 47, 1344–1350. [Google Scholar] [CrossRef] [PubMed]
  10. Phillis, J.W.; O’Regan, M.H.; Perkins, L.M. Adenosine 5′-triphosphate release from the normoxic and hypoxic in vivo rat cerebral cortex. Neurosci. Lett. 1993, 151, 94–96. [Google Scholar] [CrossRef]
  11. Phillis, J.W.; Smith-Barbour, M.; O’Regan, M.H. Changes in extracellular amino acid neurotransmitters and purines during and following ischemias of different durations in the rat cerebral cortex. Neurochem. Int. 1996, 29, 115–120. [Google Scholar] [CrossRef]
  12. Lutz, P.L.; Kabler, S. Release of adenosine and ATP in the brain of the freshwater turtle (Trachemys scripta) during long-term anoxia. Brain Res. 1997, 769, 281–286. [Google Scholar] [CrossRef]
  13. Juranyi, Z.; Sperlagh, B.; Vizi, E.S. Involvement of P2 purinoceptors and the nitric oxide pathway in [3H]purine outflow evoked by short-term hypoxia and hypoglycemia in rat hippocampal slices. Brain Res. 1999, 823, 183–190. [Google Scholar] [CrossRef]
  14. Parkinson, F.E.; Sinclair, C.J.; Othman, T.; Haughey, N.J.; Geiger, J.D. Differences between rat primary cortical neurons and astrocytes in purine release evoked by ischemic conditions. Neuropharmacology 2002, 43, 836–846. [Google Scholar] [CrossRef]
  15. Melani, A.; Turchi, D.; Vannucchi, M.G.; Cipriani, S.; Gianfriddo, M.; Pedata, F. ATP extracellular concentrations are increased in the rat striatum during in vivo ischemia. Neurochem. Int. 2005, 47, 442–448. [Google Scholar] [CrossRef] [PubMed]
  16. Dale, N.; Frenguelli, B.G. Release of adenosine and ATP during ischemia and epilepsy. Curr. Neuropharmacol. 2009, 7, 160–179. [Google Scholar] [CrossRef] [PubMed]
  17. Ferrari, D.; Chiozzi, P.; Falzoni, S.; Dal Susino, M.; Collo, G.; Buell, G.; Di Virgilio, F. ATP-mediated cytotoxicity in microglial cells. Neuropharmacology 1997, 36, 1295–1301. [Google Scholar] [CrossRef]
  18. Amadio, S.; D’Ambrosi, N.; Cavaliere, F.; Murra, B.; Sancesario, G.; Bernardi, G.; Burnstock, G.; Volonte, C. P2 receptor modulation and cytotoxic function in cultured CNSs neurons. Neuropharmacology 2002, 42, 489–501. [Google Scholar] [CrossRef]
  19. Ryu, J.K.; Kim, J.; Choi, S.H.; Oh, Y.J.; Lee, Y.B.; Kim, S.U.; Jin, B.K. ATP-induced in vivo neurotoxicity in the rat striatum via P2 receptors. Neuroreport 2002, 13, 1611–1615. [Google Scholar] [CrossRef] [PubMed]
  20. Volonte, C.; Amadio, S.; Cavaliere, F.; D’Ambrosi, N.; Vacca, F.; Bernardi, G. Extracellular ATP and neurodegeneration. Curr. Drug Targets CNS Neurol. Disord. 2003, 2, 403–412. [Google Scholar] [CrossRef] [PubMed]
  21. Matute, C.; Torre, I.; Perez-Cerda, F.; Perez-Samartin, A.; Alberdi, E.; Etxebarria, E.; Arranz, A.M.; Ravid, R.; Rodriguez-Antiguedad, A.; Sanchez-Gomez, M.; et al. P2x7 receptor blockade prevents ATP excitotoxicity in oligodendrocytes and ameliorates experimental autoimmune encephalomyelitis. J. Neurosci. 2007, 27, 9525–9533. [Google Scholar] [CrossRef] [PubMed]
  22. Zimmermann, H. Biochemistry, localization and functional roles of ecto-nucleotidases in the nervous system. Prog. Neurobiol. 1996, 49, 589–618. [Google Scholar] [CrossRef]
  23. Robson, S.C.; Kaczmarek, E.; Siegel, J.B.; Candinas, D.; Koziak, K.; Millan, M.; Hancock, W.W.; Bach, F.H. Loss of ATP diphosphohydrolase activity with endothelial cell activation. J. Exp. Med. 1997, 185, 153–163. [Google Scholar] [CrossRef] [PubMed]
  24. Swanson, R.A.; Farrell, K.; Stein, B.A. Astrocyte energetics, function, and death under conditions of incomplete ischemia: A mechanism of glial death in the penumbra. Glia 1997, 21, 142–153. [Google Scholar] [CrossRef]
  25. Fern, R. Ischemic tolerance in pre-myelinated white matter: The role of astrocyte glycogen in brain pathology. J. Cereb. Blood Flow Metab. 2015, 35, 951–958. [Google Scholar] [CrossRef] [PubMed]
  26. Fern, R. Intracellular calcium and cell death during ischemia in neonatal rat white matter astrocytes in situ. J. Neurosci. 1998, 18, 7232–7243. [Google Scholar] [PubMed]
  27. Bondarenko, A.; Chesler, M. Rapid astrocyte death induced by transient hypoxia, acidosis, and extracellular ion shifts. Glia 2001, 34, 134–142. [Google Scholar] [CrossRef] [PubMed]
  28. Dale, N.; Hatz, S.; Tian, F.; Llaudet, E. Listening to the brain: Microelectrode biosensors for neurochemicals. Trends Biotechnol. 2005, 23, 420–428. [Google Scholar] [CrossRef] [PubMed]
  29. Centemeri, C.; Bolego, C.; Abbracchio, M.P.; Cattabeni, F.; Puglisi, L.; Burnstock, G.; Nicosia, S. Characterization of the Ca2+ responses evoked by ATP and other nucleotides in mammalian brain astrocytes. Br. J. Pharmacol. 1997, 121, 1700–1706. [Google Scholar] [CrossRef] [PubMed]
  30. Reifel Saltzberg, J.M.; Garvey, K.A.; Keirstead, S.A. Pharmacological characterization of P2Y receptor subtypes on isolated tiger salamander muller cells. Glia 2003, 42, 149–159. [Google Scholar] [CrossRef] [PubMed]
  31. Hoyte, L.; Barber, P.A.; Buchan, A.M.; Hill, M.D. The rise and fall of NMDA antagonists for ischemic stroke. Curr. Mol. Med. 2004, 4, 131–136. [Google Scholar] [CrossRef] [PubMed]
  32. Goldberg, M.P.; Weiss, J.H.; Pham, P.C.; Choi, D.W. N-methyl-d-aspartate receptors mediate hypoxic neuronal injury in cortical culture. J. Pharmacol. Exp. Ther. 1987, 243, 784–791. [Google Scholar] [PubMed]
  33. Choi, D.W.; Rothman, S.M. The role of glutamate neurotoxicity in hypoxic-ischemic neuronal death. Annu. Rev. Neurosci. 1990, 13, 171–182. [Google Scholar] [CrossRef] [PubMed]
  34. Goldberg, M.P.; Choi, D.W. Combined oxygen and glucose deprivation in cortical cell culture: Calcium-dependent and calcium-independent mechanisms of neuronal injury. J. Neurosci. 1993, 13, 3510–3524. [Google Scholar] [PubMed]
  35. Newell, D.W.; Barth, A.; Papermaster, V.; Malouf, A.T. Glutamate and non-glutamate receptor mediated toxicity caused by oxygen and glucose deprivation in organotypic hippocampal cultures. J. Neurosci. 1995, 15, 7702–7711. [Google Scholar] [PubMed]
  36. Balcar, V.J.; Dias, L.S.; Li, Y.; Bennett, M.R. Inhibition of [3H]CGP 39653 binding to NMDA receptors by a P2 antagonist, suramin. Neuroreport 1995, 7, 69–72. [Google Scholar] [CrossRef] [PubMed]
  37. Nakazawa, K.; Inoue, K.; Ito, K.; Koizumi, S.; Inoue, K. Inhibition by suramin and reactive blue 2 of GABA and glutamate receptor channels in rat hippocampal neurons. Naunyn-Schmiedeberg's Arch. Pharmacol. 1995, 351, 202–208. [Google Scholar] [CrossRef]
  38. Price, C.J.; Raymond, L.A. Evans blue antagonizes both alpha-amino-3-hydroxy-5-methyl-4-isoxazolepropionate and kainate receptors and modulates receptor desensitization. Mol. Pharmacol. 1996, 50, 1665–1671. [Google Scholar] [PubMed]
  39. Peoples, R.W.; Li, C. Inhibition of NMDA-gated ion channels by the P2 purinoceptor antagonists suramin and reactive blue 2 in mouse hippocampal neurones. Br. J. Pharmacol. 1998, 124, 400–408. [Google Scholar] [CrossRef] [PubMed]
  40. Lambrecht, G. Agonists and antagonists acting at P2X receptors: Selectivity profiles and functional implications. Naunyn-Schmiedeberg’s Arch. Pharmacol. 2000, 362, 340–350. [Google Scholar] [CrossRef]
  41. Zona, C.; Marchetti, C.; Volonte, C.; Mercuri, N.B.; Bernardi, G. Effect of P2 purinoceptor antagonists on kainate-induced currents in rat cultured neurons. Brain Res. 2000, 882, 26–35. [Google Scholar] [CrossRef]
  42. Suzuki, E.; Kessler, M.; Montgomery, K.; Arai, A.C. Divergent effects of the purinoceptor antagonists suramin and pyridoxal-5′-phosphate-6-(2′-naphthylazo-6′-nitro-4′,8′-disulfonate) (PPNDS) on α-amino-3-hydroxy-5-methyl-4-isoxazolepropionic acid (AMPA) receptors. Mol. Pharmacol. 2004, 66, 1738–1747. [Google Scholar] [CrossRef] [PubMed]
  43. Lammer, A.; Gunther, A.; Beck, A.; Krugel, U.; Kittner, H.; Schneider, D.; Illes, P.; Franke, H. Neuroprotective effects of the P2 receptor antagonist PPADS on focal cerebral ischaemia-induced injury in rats. Eur. J. Neurosci. 2006, 23, 2824–2828. [Google Scholar] [CrossRef] [PubMed]
  44. Cavaliere, F.; D’Ambrosi, N.; Ciotti, M.T.; Mancino, G.; Sancesario, G.; Bernardi, G.; Volonte, C. Glucose deprivation and chemical hypoxia: Neuroprotection by P2 receptor antagonists. Neurochem. Int. 2001, 38, 189–197. [Google Scholar] [CrossRef]
  45. Cavaliere, F.; Florenzano, F.; Amadio, S.; Fusco, F.R.; Viscomi, M.T.; D’Ambrosi, N.; Vacca, F.; Sancesario, G.; Bernardi, G.; Molinari, M.; et al. Up-regulation of p2x2, p2x4 receptor and ischemic cell death: Prevention by p2 antagonists. Neuroscience 2003, 120, 85–98. [Google Scholar] [CrossRef]
  46. Cavaliere, F.; Dinkel, K.; Reymann, K. Microglia response and P2 receptor participation in oxygen/glucose deprivation-induced cortical damage. Neuroscience 2005, 136, 615–623. [Google Scholar] [CrossRef] [PubMed]
  47. Runden-Pran, E.; Tanso, R.; Haug, F.M.; Ottersen, O.P.; Ring, A. Neuroprotective effects of inhibiting N-methyl-d-aspartate receptors, P2X receptors and the mitogen-activated protein kinase cascade: A quantitative analysis in organotypical hippocampal slice cultures subjected to oxygen and glucose deprivation. Neuroscience 2005, 136, 795–810. [Google Scholar] [CrossRef] [PubMed]
  48. Cavaliere, F.; D’Ambrosi, N.; Sancesario, G.; Bernardi, G.; Volonte, C. Hypoglycaemia-induced cell death: Features of neuroprotection by the P2 receptor antagonist basilen blue. Neurochem. Int. 2001, 38, 199–207. [Google Scholar] [CrossRef]
  49. Melani, A.; Amadio, S.; Gianfriddo, M.; Vannucchi, M.G.; Volonte, C.; Bernardi, G.; Pedata, F.; Sancesario, G. P2X7 receptor modulation on microglial cells and reduction of brain infarct caused by middle cerebral artery occlusion in rat. J. Cereb. Blood Flow Metab. 2006, 26, 974–982. [Google Scholar] [CrossRef] [PubMed]
  50. Le Feuvre, R.; Brough, D.; Rothwell, N. Extracellular ATP and P2X7 receptors in neurodegeneration. Eur. J. Pharmacol. 2002, 447, 261–269. [Google Scholar] [CrossRef]
  51. Le Feuvre, R.A.; Brough, D.; Touzani, O.; Rothwell, N.J. Role of P2X7 receptors in ischemic and excitotoxic brain injury in vivo. J. Cereb. Blood Flow Metab. 2003, 23, 381–384. [Google Scholar] [CrossRef] [PubMed]
  52. Coppi, E.; Pedata, F.; Gibb, A.J. P2Y1 receptor modulation of Ca2+-activated K+ currents in medium-sized neurons from neonatal rat striatal slices. J. Neurophysiol. 2012, 107, 1009–1021. [Google Scholar] [CrossRef] [PubMed]
  53. Kuboyama, K.; Harada, H.; Tozaki-Saitoh, H.; Tsuda, M.; Ushijima, K.; Inoue, K. Astrocytic P2Y1 receptor is involved in the regulation of cytokine/chemokine transcription and cerebral damage in a rat model of cerebral ischemia. J. Cereb. Blood Flow Metab. 2011, 31, 1930–1941. [Google Scholar] [CrossRef] [PubMed]
  54. Chin, Y.; Kishi, M.; Sekino, M.; Nakajo, F.; Abe, Y.; Terazono, Y.; Hiroyuki, O.; Kato, F.; Koizumi, S.; Gachet, C.; et al. Involvement of glial P2Y1 receptors in cognitive deficit after focal cerebral stroke in a rodent model. J. Neuroinflamm. 2013, 10, 95. [Google Scholar] [CrossRef] [PubMed]
  55. Carmo, M.R.; Simoes, A.P.; Fonteles, A.A.; Souza, C.M.; Cunha, R.A.; Andrade, G.M. ATP P2Y1 receptors control cognitive deficits and neurotoxicity but not glial modifications induced by brain ischemia in mice. Eur. J. Neurosci. 2014, 39, 614–622. [Google Scholar] [CrossRef] [PubMed]
  56. Domercq, M.; Brambilla, L.; Pilati, E.; Marchaland, J.; Volterra, A.; Bezzi, P. P2Y1 receptor-evoked glutamate exocytosis from astrocytes: Control by tumor necrosis factor-α and prostaglandins. J. Biol. Chem. 2006, 281, 30684–30696. [Google Scholar] [CrossRef] [PubMed]
  57. Zeng, J.W.; Liu, X.H.; He, W.J.; Du, L.; Zhang, J.H.; Wu, X.G.; Ruan, H.Z. Inhibition of ATP-induced glutamate release by MRS2179 in cultured dorsal spinal cord astrocytes. Pharmacology 2008, 82, 257–263. [Google Scholar] [CrossRef] [PubMed]
  58. Zeng, J.W.; Liu, X.H.; Zhang, J.H.; Wu, X.G.; Ruan, H.Z. P2Y1 receptor-mediated glutamate release from cultured dorsal spinal cord astrocytes. J. Neurochem. 2008, 106, 2106–2118. [Google Scholar] [CrossRef] [PubMed]
  59. Tonazzini, I.; Trincavelli, M.L.; Storm-Mathisen, J.; Martini, C.; Bergersen, L.H. Co-localization and functional cross-talk between A1 and P2Y1 purine receptors in rat hippocampus. Eur. J. Neurosci. 2007, 26, 890–902. [Google Scholar] [CrossRef] [PubMed]
  60. Tonazzini, I.; Trincavelli, M.L.; Montali, M.; Martini, C. Regulation of A1 adenosine receptor functioning induced by P2Y1 purinergic receptor activation in human astroglial cells. J. Neurosci. Res. 2008, 86, 2857–2866. [Google Scholar] [CrossRef] [PubMed]
Figure 1. P2 receptor-mediated responses in astrocyte and neuronal cultures. (A) [Ca2+]i recorded from a typical individual astrocyte showing baseline and agonist-evoked responses. Raw pseudo-colour images from this experiment are shown at the top, demonstrating cell responses to each of the agonists (each colder spot in the resting image is a single cell). Scale = 10 μm. (B) Mean number of astrocytes which respond to individual agonists (n = number of individual cultures). (C) Mean change in [Ca2+]i evoked by agonists (n = individual astrocytes). (DF) Similar series to (AC), in this case for cultured neurons. ATP: adenosine triphosphate, ADP: adenosine diphosphate.
Neuroglia 01 00005 g001
Figure 2. Combined P2 and ionotropic glutamate receptor block of neuronal responses. (A,B) [Ca2+]i changes evoked by serial application of the receptor agonists glutamate (100 μM), AMPA (100 μM), NMDA (100 μM) + glycine (10 μM) and ATP (100 μM) in two cultured neurons from the same culture in the combined presence of 30 μM NBQX + 10 μM MK-801 + 100 μM PPADS (pre-applied for 60 min, all in zero-Mg2+). These two cells show the range of responses observed. Note that, while all responses are small or blocked in the cell shown in (A), robust glutamate and ATP responses are retained in (B). (C,D) Mean number of responding cells (C) and mean [Ca2+]i changes (D).
Neuroglia 01 00005 g002
Figure 3. P2X and P2Y receptors are expressed in cultured astrocytes. (A) Representative data showing the effects of 100 μM ATP and 100 μM ADP perfusion following depletion of Ca2+i stores by treatment with 1 μM thapsigargin in the presence and then the absence of extracellular Ca2+. (B,C) Mean number of responding cells (n = cover slips) (B) and mean [Ca2+]i changes (n = cells responding) (C) showing the major contribution to ATP responses by P2Y receptors in these cells.
Neuroglia 01 00005 g003
Figure 4. P2Y1 receptors in astrocytes. (A,B) Representative responses in two astrocytes in cultures prepared from P2Y1 −/− mice. (C,D) Mean number of responding cells (n = cover slips) (C) and mean [Ca2+]i changes (n = cells responding) (D) showing lower amplitude [Ca2+]i rises in response to ATP and ADP in the knock-out cells, and no response to the selective agonist MRS-2365.
Neuroglia 01 00005 g004
Figure 5. P2 receptor block in cultured astrocytes. (AD) The effect of pre-perfusion for 60 min with 100 μM suramin or 100 μM PPADS upon ATP and ADP evoked [Ca2+]i changes. (E,F) Concentration-dependence of the effect of PPADS during shorter antagonist exposures. (G,H) The effect of combined exposure to the selective P2Y1 antagonist 10 μM MRS-2179 and the P2X7 antagonist 1 μM KN-62 upon ATP-evoked [Ca2+]i changes.
Neuroglia 01 00005 g005
Figure 6. Neurotransmitter release from mixed cultures. (A) ATP concentration in the media surrounding cultured neurons and astrocytes rises gradually during a 90 min period of OGD (red data) compared to control recordings (green). Means +/− standard error mean are shown. (B) Mean data for each 10 min interval showing statistical significant between control and OGD at later time points. (C) Glutamate in the extracellular media is elevated during OGD, an effect that is not affected by co-perfusion with 10 μM PPADS to block P2 receptors. (D) Mean data for 10 min intervals, showing no statistical significant effect of PPADS.
Neuroglia 01 00005 g006
Figure 7. The effects of various receptor agonists on OGD-induced cell death in mixed cultures. (A) The per cent cell death of all cells (blue), astrocytes (green) and neurons (red) under control perfused (white), control OGD (black) and OGD in the presence of single or combined receptor antagonist (coloured). (B) Analysis showing the mean time to the first cell death event in each culture. (C) Mean time to cell death. * p < 0.05, ** p < 0.005, *** p < 0.001 vs. cell death under control OGD conditions. “1P” = 1 μM PPADS; “1M” = 1 μM MK-801; “3N” = 3 μM NBQX; “100S” = 100 μM suramin; “n” = number of cultures.
Neuroglia 01 00005 g007
Figure 8. The effects of P2 and GluR antagonists on OGD-induced cell death in normal-density co-cultures. (A) The extent of cell death during a 100 min period of control imaging, showing neuron, astrocyte and neuron death. Note the relatively high level of baseline cell death in the absence of antagonists and the protective effect of even low concentrations of PPADS or combined low dose PPADS + memantine. (B) Cell death during 90 min of OGD and the protective effects of low concentrations of PPADS or low dose PPADS + memantine. (CF) The time-course of total cell death for the two sets of conditions shown in “A” and “B”. * p < 0.05, ** p < 0.005, *** p < 0.001 vs. no drugs present.
Neuroglia 01 00005 g008
Figure 9. A model of purinergic and glutamatergic events involved in astrocyte and neuronal death during OGD. Glutamate and ATP accumulate in the extracellular space following the onset of OGD: glutamate is released by astrocytes, while the source of ATP is not clear. Glutamate evokes neuronal death by gating AMPA/kainate and NMDA receptors, leading to cytotoxic Ca2+ influx. ATP activates P2 receptors on both astrocytes and neurons, leading to Ca2+ release from intracellular stores (P2Y receptors) and/or Ca2+ influx through P2X ion channels. P2Y1 receptors in particular are present on both cell types and contribute to cell death. P2X7 receptors may be involved in early neuronal but not astrocyte death.
Neuroglia 01 00005 g009
Table 1. Antagonists at P2X receptors.
SuraminPPADSKN-62Highly Selective Antagonists a,h,p,s
P2X1No, >1 mM g (mouse)0.4 g (mouse)NoNF449, NF864, RO-1
0.01–0.3, 0.851 e,t (human)0.01–0.3, 1.29 a,t (human)
P2X233.1 e (rat)3.8 e (rat)No-
1-32 m,p,t (human)0.4–20.4 a,m,p,t (human)
P2X30.776 e (rat)3.63 e (rat)No-
14.9, 15.8, >100 e,n,p,t (human)1.7–5.13 e,n,t (human)
P2X4>100 q (mouse)10.5 q (mouse)No, >3 q (mouse)Benzofuro-1,4-diazepin-2-ones
178.1–200 e,o,p (human)10–25,27.5, >100 a,o,p (human)
P2X54.5 r (rat)2 r (rat)No-
0.199 p,t (human)0.01-0.3, 3.16 p,t (human)
P2X6No, >30 r (rat)No, >30 r (rat)
>0.3 t (human)
No-
P2X740 f (mouse)No, >100 e,t (human)Cation pore openingCation pore opening1A-438079 **
14.79 a (mouse)0.389 a (mouse)1A-740003 **
3.24 a (human)0.38 a (human)A-804590
Large pore formationLarge pore formationGSK314181A
7, 9, >100 a,b (mouse)0.18, 1.17 a,b (mouse)AZ11645373
0.015 b (human)0.011 b (human)1AZ10606120
P2X2/333.1 e (rat)1.26 e (rat)NoA-317491
16.6 a (human)RO-3
P2X1/51.58 p (rat)0.5–8.6 h (mouse)No-
P2X4/6Some activity u (rat)Some activity u (rat)No-
Numbers represent IC50 values, in μM. Murine data are presented where available. **: antagonists with good oral bioavailability. References: a (Donnelly-Roberts et al., 2009), b (Chessell et al., 1998), e (Bianchi et al., 1999), f (Watano et al., 2002), g (Ikeda, 2007), h (Lalo et al., 2008), m (Lynch et al., 1999), n (Garcia-Guzman et al., 1997a), o (Garcia-Guzman et al., 1997b), p (Gever et al., 2006), q (Jones et al., 2000), r (Collo et al., 1996), s (Jarvis and Khakh, 2009), t (Burnstock and Knight, 2004), u (Le et al., 1998a).
Table 2. Antagonists at P2Y receptors.
SuraminPPADSMRS-2179Highly Selective Antagonists h
P2Y1Effective at 100uM d (mouse)
1.67 t (turkey)
3.16 a (human)
Effective at 30 uM d (mouse)
1.05 t (turkey)
2 b (human)
Effective at 10 uM f,g (mouse)
0.015–0.331 f,h,p,q,u (human)
MRS-2279
MRS-2179
MRS-2500
A3P5P
P2Y247.86 t (human)No b,t (human)No a,s,uAR-C126313
MRS-2576
P2Y4No n,o (mouse/human)45 n (mouse)
15 o (human)
No a,s,uMRS-2577
P2Y6Effective at 100uM d (mouse)Effective at 30uM d (mouse)No a,s,uMRS-2578
MRS-2575
P2Y12 3.6 r (human)No r (human)No a,sMeSAMP
AZD6140
INS50589
Clopidogrel
P2Y132.3 e (human)11.7 e (human)>100 e (human)MRS-2211
Numbers represent IC50 values, in μM; Murine data are presented where available. References: a (Fischer and Krugel, 2007), b (Donnelly-Roberts et al., 2009), d (Calvert et al., 2004), e (Marteau et al., 2003), f (Baurand et al., 2001), g (Atterbury-Thomas et al., 2008), h (Jacobson et al., 2009), n (Suarez-Huerta et al., 2001), o (Communi et al., 1996b), p (Waldo and Harden, 2004), q (Moro et al., 1998), r (Abbracchio et al., 2006), t (Charlton et al., 1996b), u (Boyer et al., 1998).

