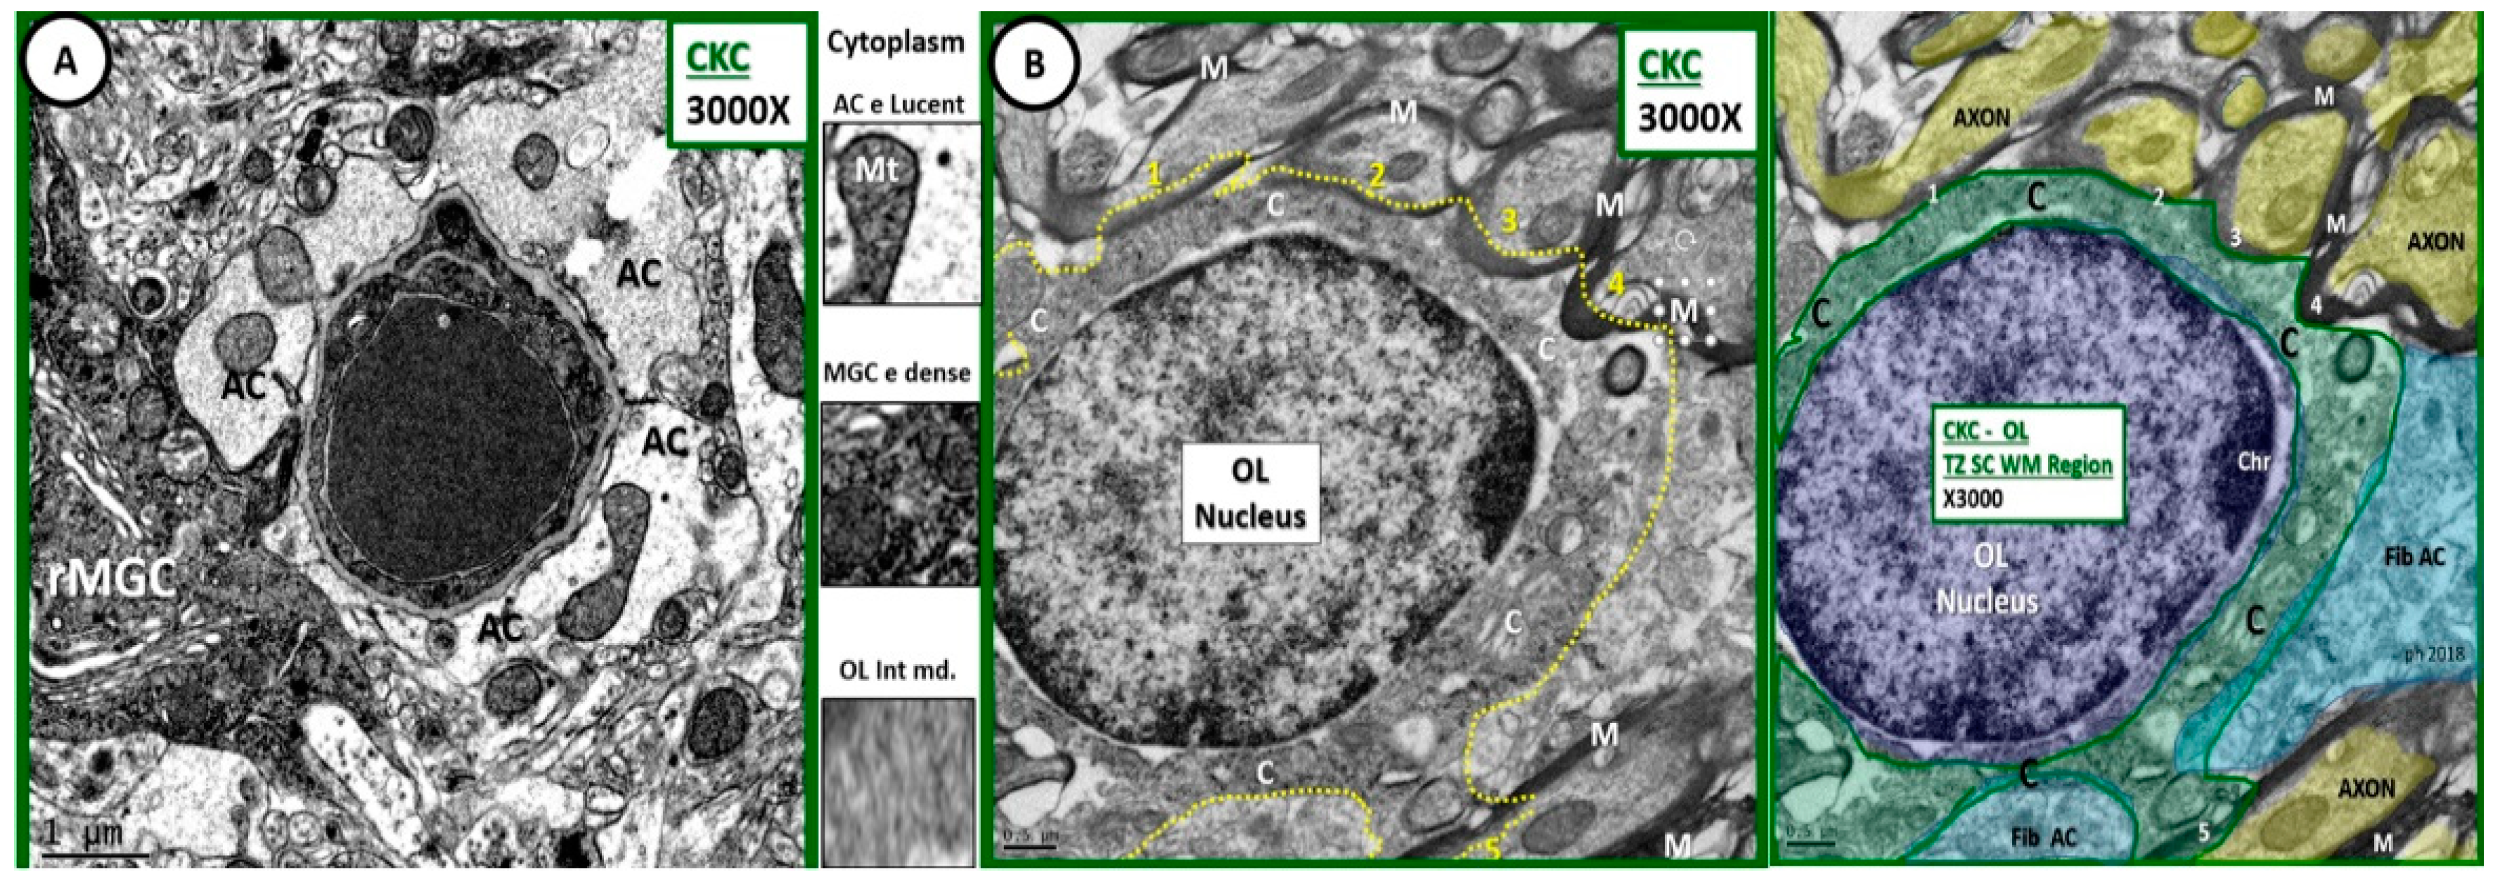
Figure 1.
Comparison of astrocyte, ramified microglial cell, and oligodendrocyte to illustrate intermediate electron dense and thin cytoplasm. (A) Depicts an astrocyte (AC) with electron lucent cytoplasm and a ramified microglial cell (rMGC) with its electron dense cytoplasm. (B) Illustrates a thinned intermediate electron dense cytoplasm of the oligodendrocyte (OL) obtained from the transition zone in subcortical white matter (TZ SCWM) just deep to layer VI as compared to ACs and microglia cells. Note that the OL is in the process of enwrapping at least 5 axons (1–5) with myelin in (B) and its pseudo-colored image, far right. Between (A,B) the cytoplasm has been cut from each cell to further demonstrate the intermediate electron (e) density of the OL cytoplasm. Also note the small amount of cytoplasm as compared to nucleus volume as well as the incorporation of myelin at its outer margins of the cytoplasm plasmalemma. A pseudo-colorized image is inserted far right to aid in identifying OL nucleus (purple); cytoplasm (C green); fibrous astrocyte (fib AC blue); axons (yellow). Magnification ×3000; scale bar = 1 µm in A and 0.5 µm in (B). C: cytoplasm; MGC: microglial cell; M: myelin; CKC: age-matched non-diabetic wild type control C57BL/KsJ.
![Neuroglia 01 00024 g001]()
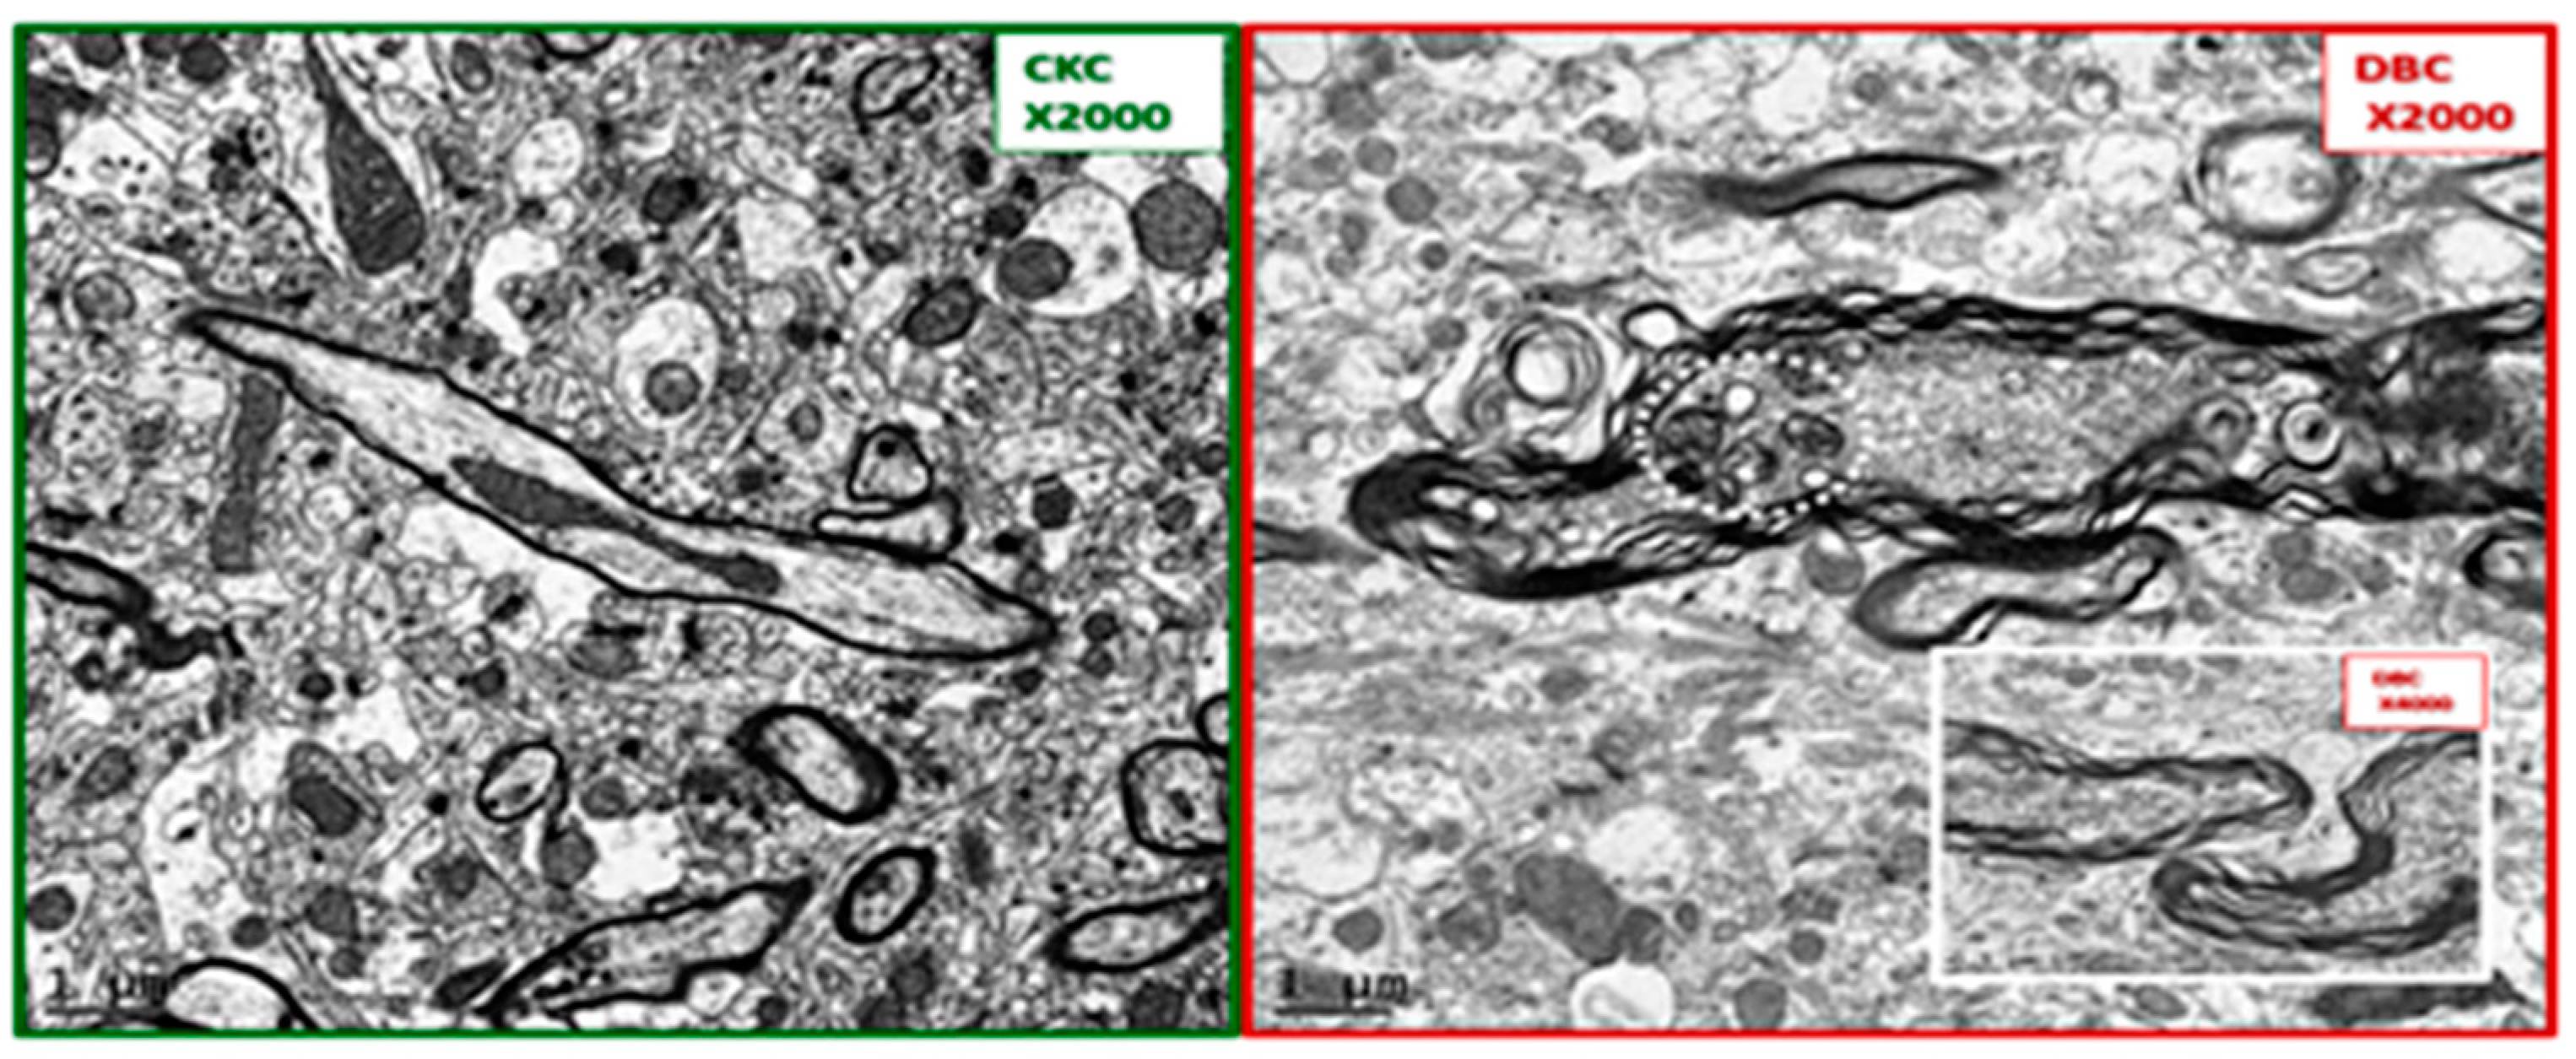
Figure 2.
Comparison of control CKC and diabetic diabetic db/db [BKS.CgDock7m +/+ Leprdb/J] (DBC) myelination in layer III cortical grey matter. These panels depict the marked difference between the myelination of axons in the cortical grey matter of Layer III. Note in the diabetic DBC panel (to the right) the marked splitting and separation of myelin (dysmyelination) and the grouping of suspected aberrant mitochondria (encircled white dashed line). The insert in the DBC panel is from another model in cortical layer III with dysmyelination. Also note the increased thickness of myelin which measures approximately 0.5 µm in the DBC as compared to the 0.1 µm thickness of the myelin in the CKC model. Also note the elongated axonal mitochondria in the CKC model in contrast to the smaller rounded mitochondria in the DBC. Importantly, note the increase in electron density of the axoplasm of the neuron in the DBC as compared to the CKC. Magnification ×2000; bar = 1 µm. Magnification of insert ×4000 and scale bar = 0.5 µm.
![Neuroglia 01 00024 g002]()
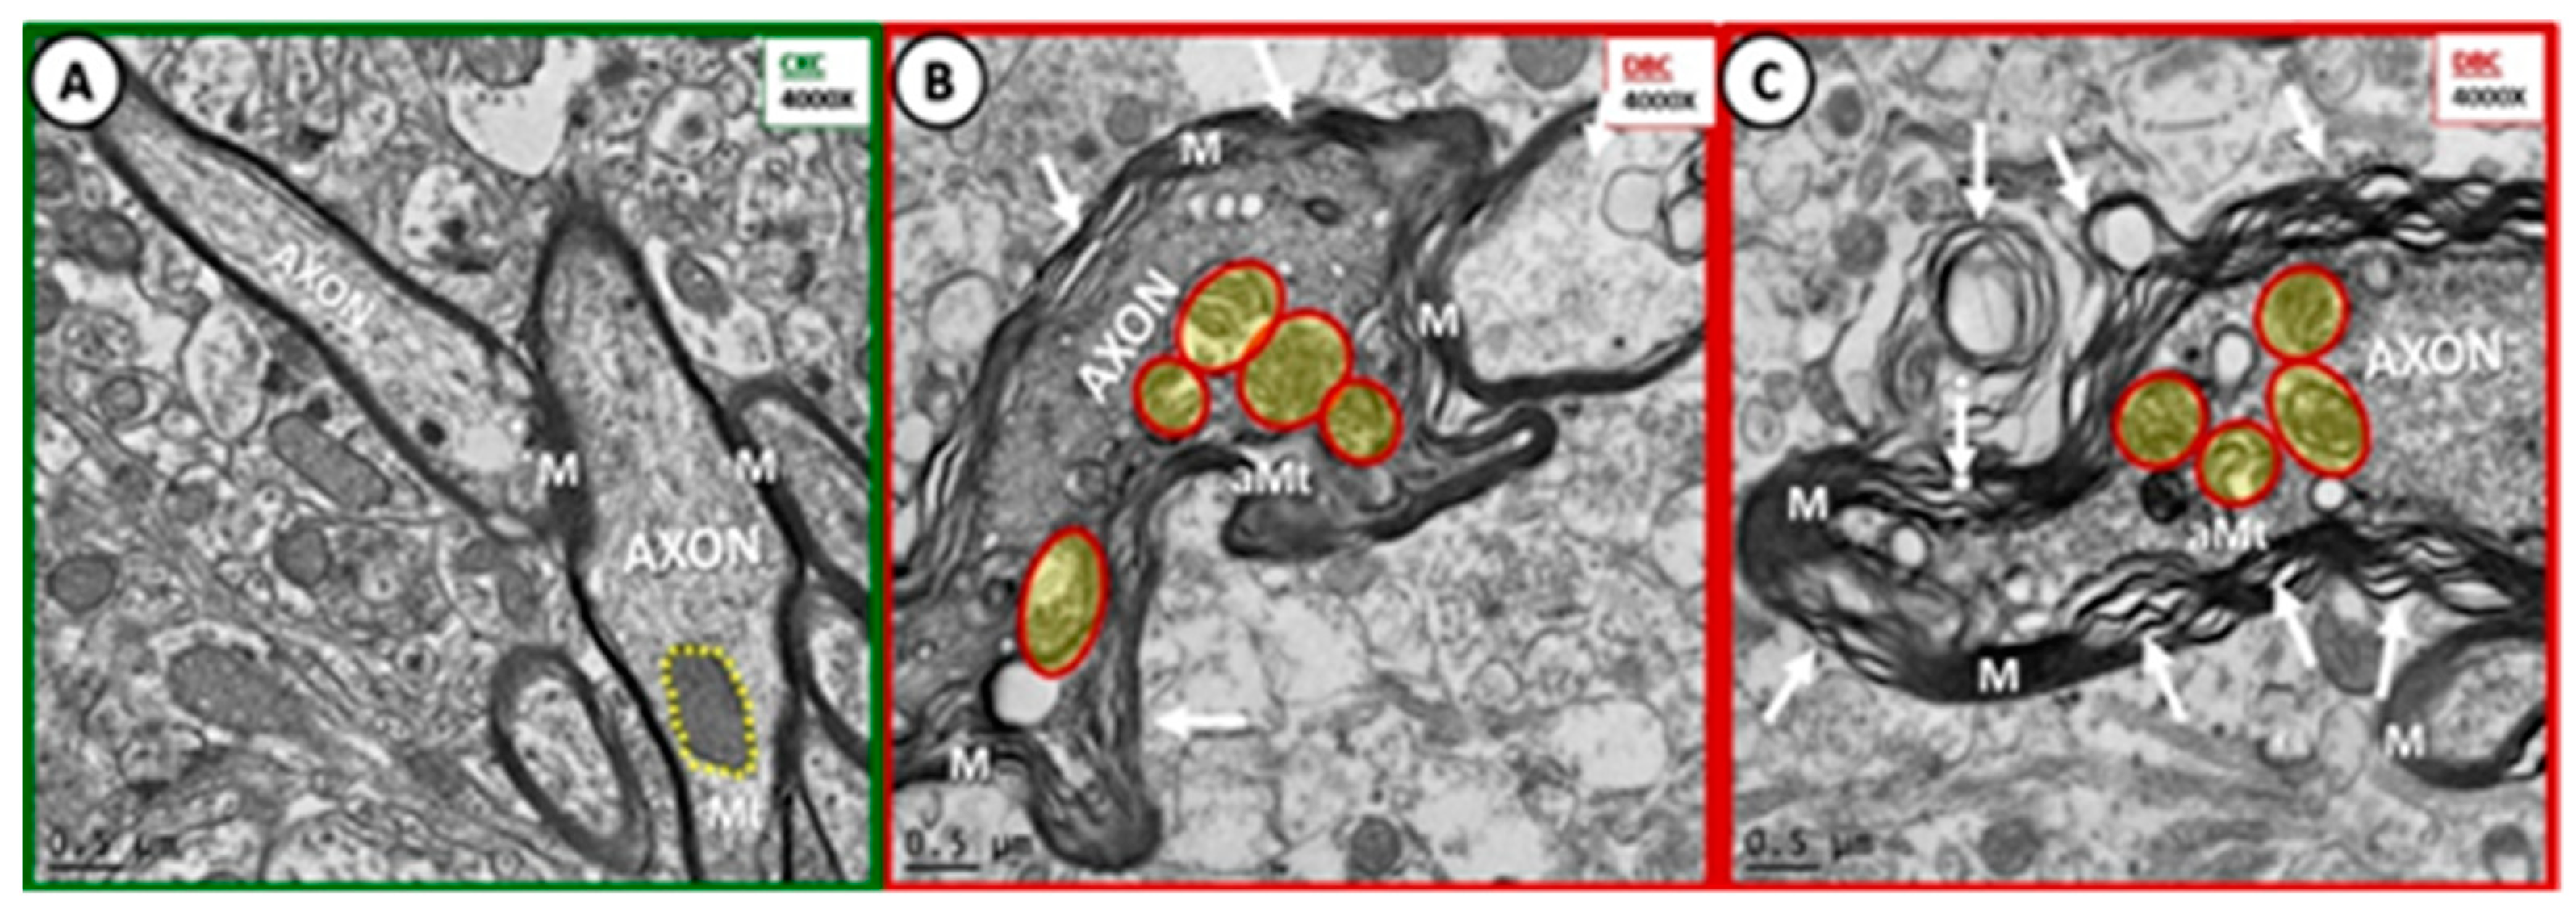
Figure 3.
Dysmyelination and aberrant mitochondria in cortical grey matter layer III of diabetic DBC models. (A) Depicts the normal compact myelin (M) ensheathing the axons of the nondiabetic control CKC models and note the normal electron dense mitochondria (Mt) (encircled by yellow dashed line). Panels (B,C) depict the marked splitting and separation of myelin ensheathment in DBC models (arrows). Also note the aberrant Mt (aMt)—(pseudo-colored yellow with red lines) and increased electron dense cytoplasm in the DBC. Magnification ×4000; bar = 0.5 µm.
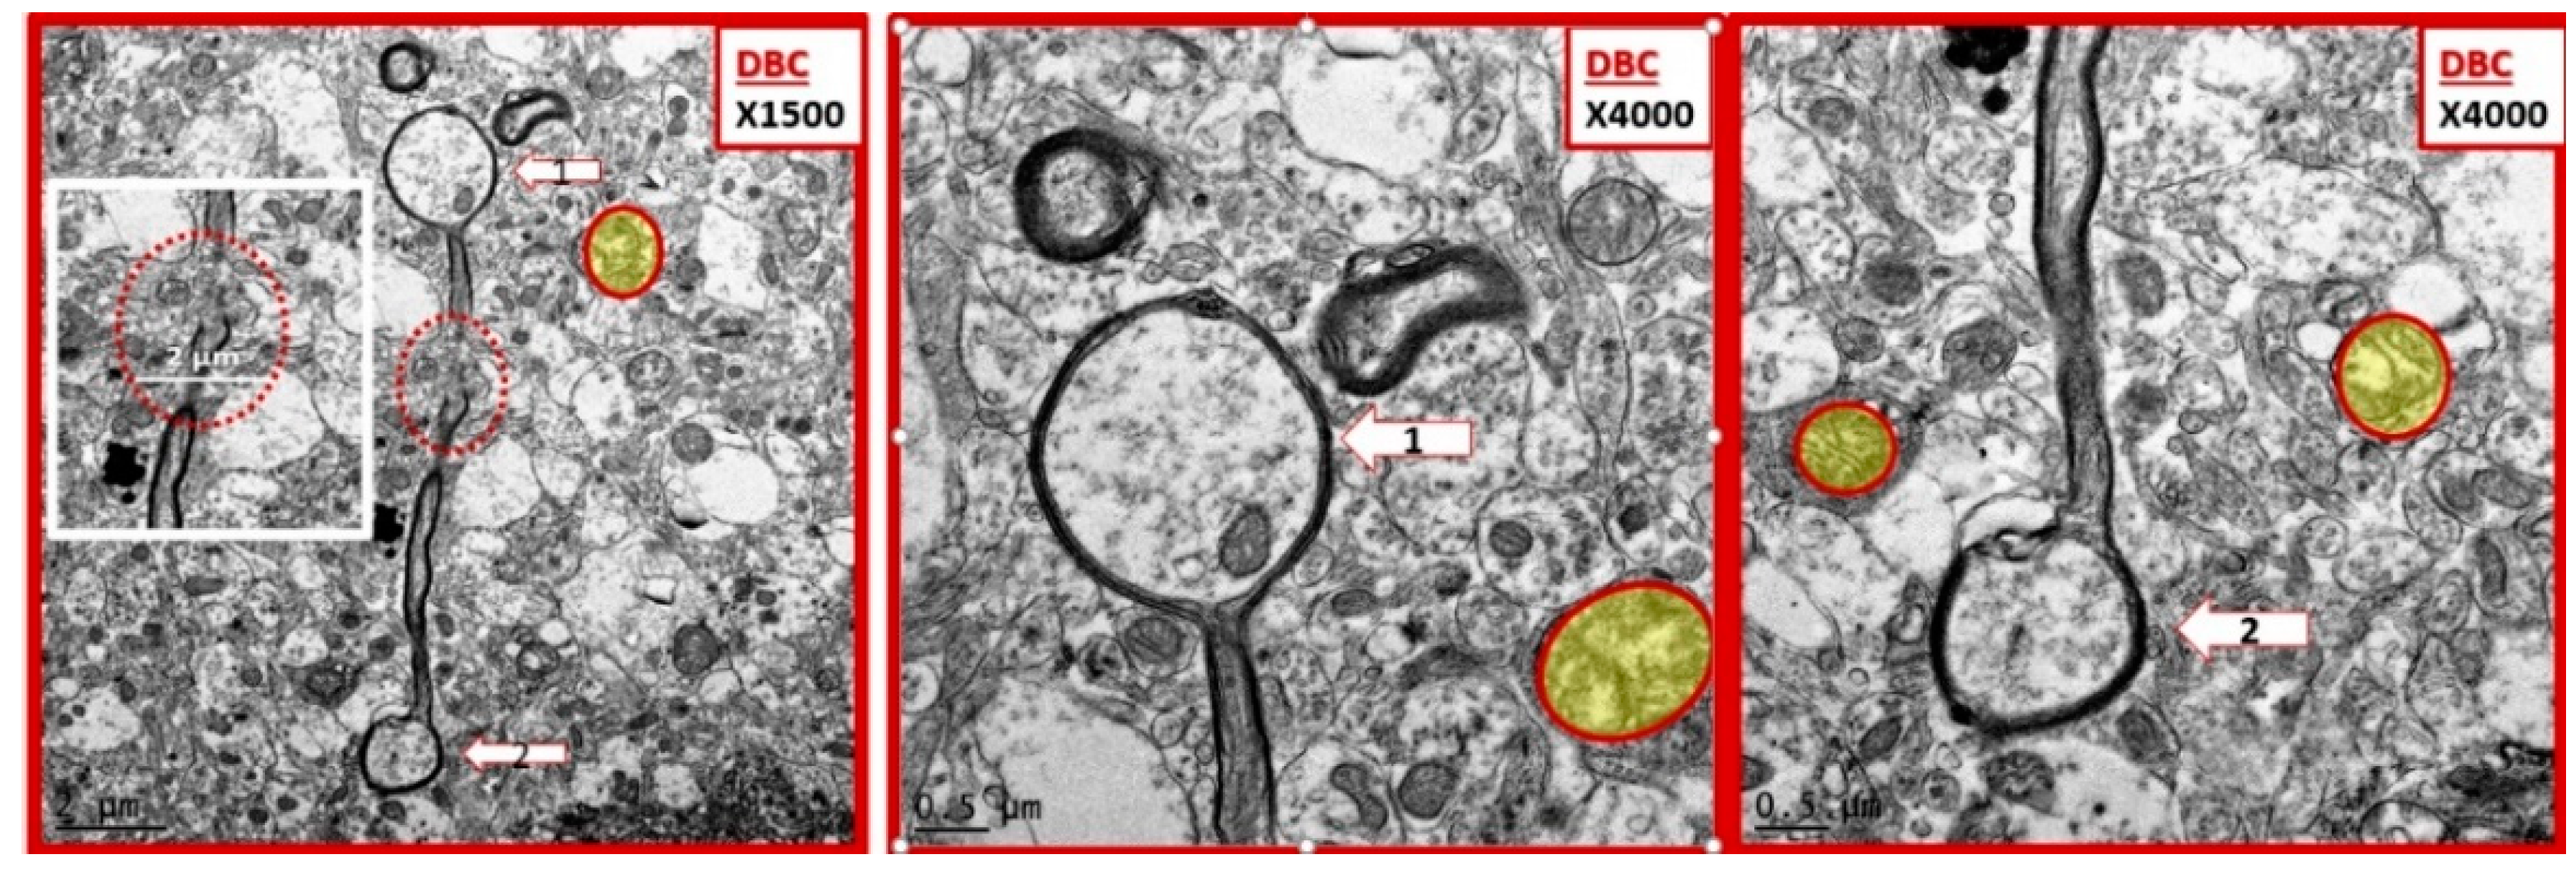
Figure 4.
Examples of ballooning in myelinated axons of diabetic DBC models in cortical grey matter. This three-panel image depicts ballooning of myelinated axons that were only observed in the diabetic DBC and did not occur in nondiabetic control CKC. The left-hand panel depicts a myelinated axon with ballooning superiorly (open arrow 1) and a ballooning inferiorly (open arrow 2) and note the interruption of the myelin sheath in mid axon (red dashed oval) and the cropped image insert from this region exploded in Microsoft paint with intact scale bar of 2 µm. Mid panel has open arrow pointing to balloon 1 and right-hand panel has open arrow pointing to balloon 2. Note the aberrant mitochondria pseudo-colored yellow with red outline. Magnification ×1500; scale bar = 2 µm far left, Magnification ×4000; scale bar = 0.5 µm in mid and far right-hand panels.
Figure 5.
Larger axons, loss of microtubule neurofilament linearity, fragmentation and proteinaceous aggregation and deposition within axoplasm in some of diabetic DBC models. (B,C) Depict a loss of linearity of neurofilaments (nf) with fragmentation and aggregated proteinaceous electron dense deposits (within the lower half, below the red dashed line) axoplasm of diabetic DBC as compared to nondiabetic CKC controls (A). Some of the larger electron densities are microtubules (MT), while others could be protein aggregations. (B,C) Are from different regions of the same unmyelinated axon. Note that the axon width of the DBC is ~1.5 µm as compared to 0.5 µm in CKC. Magnifications ×10,000 (A,C); scale bar = 0.2 µm. (B) Magnifications ×6000; scale bar = 0.5 µm.
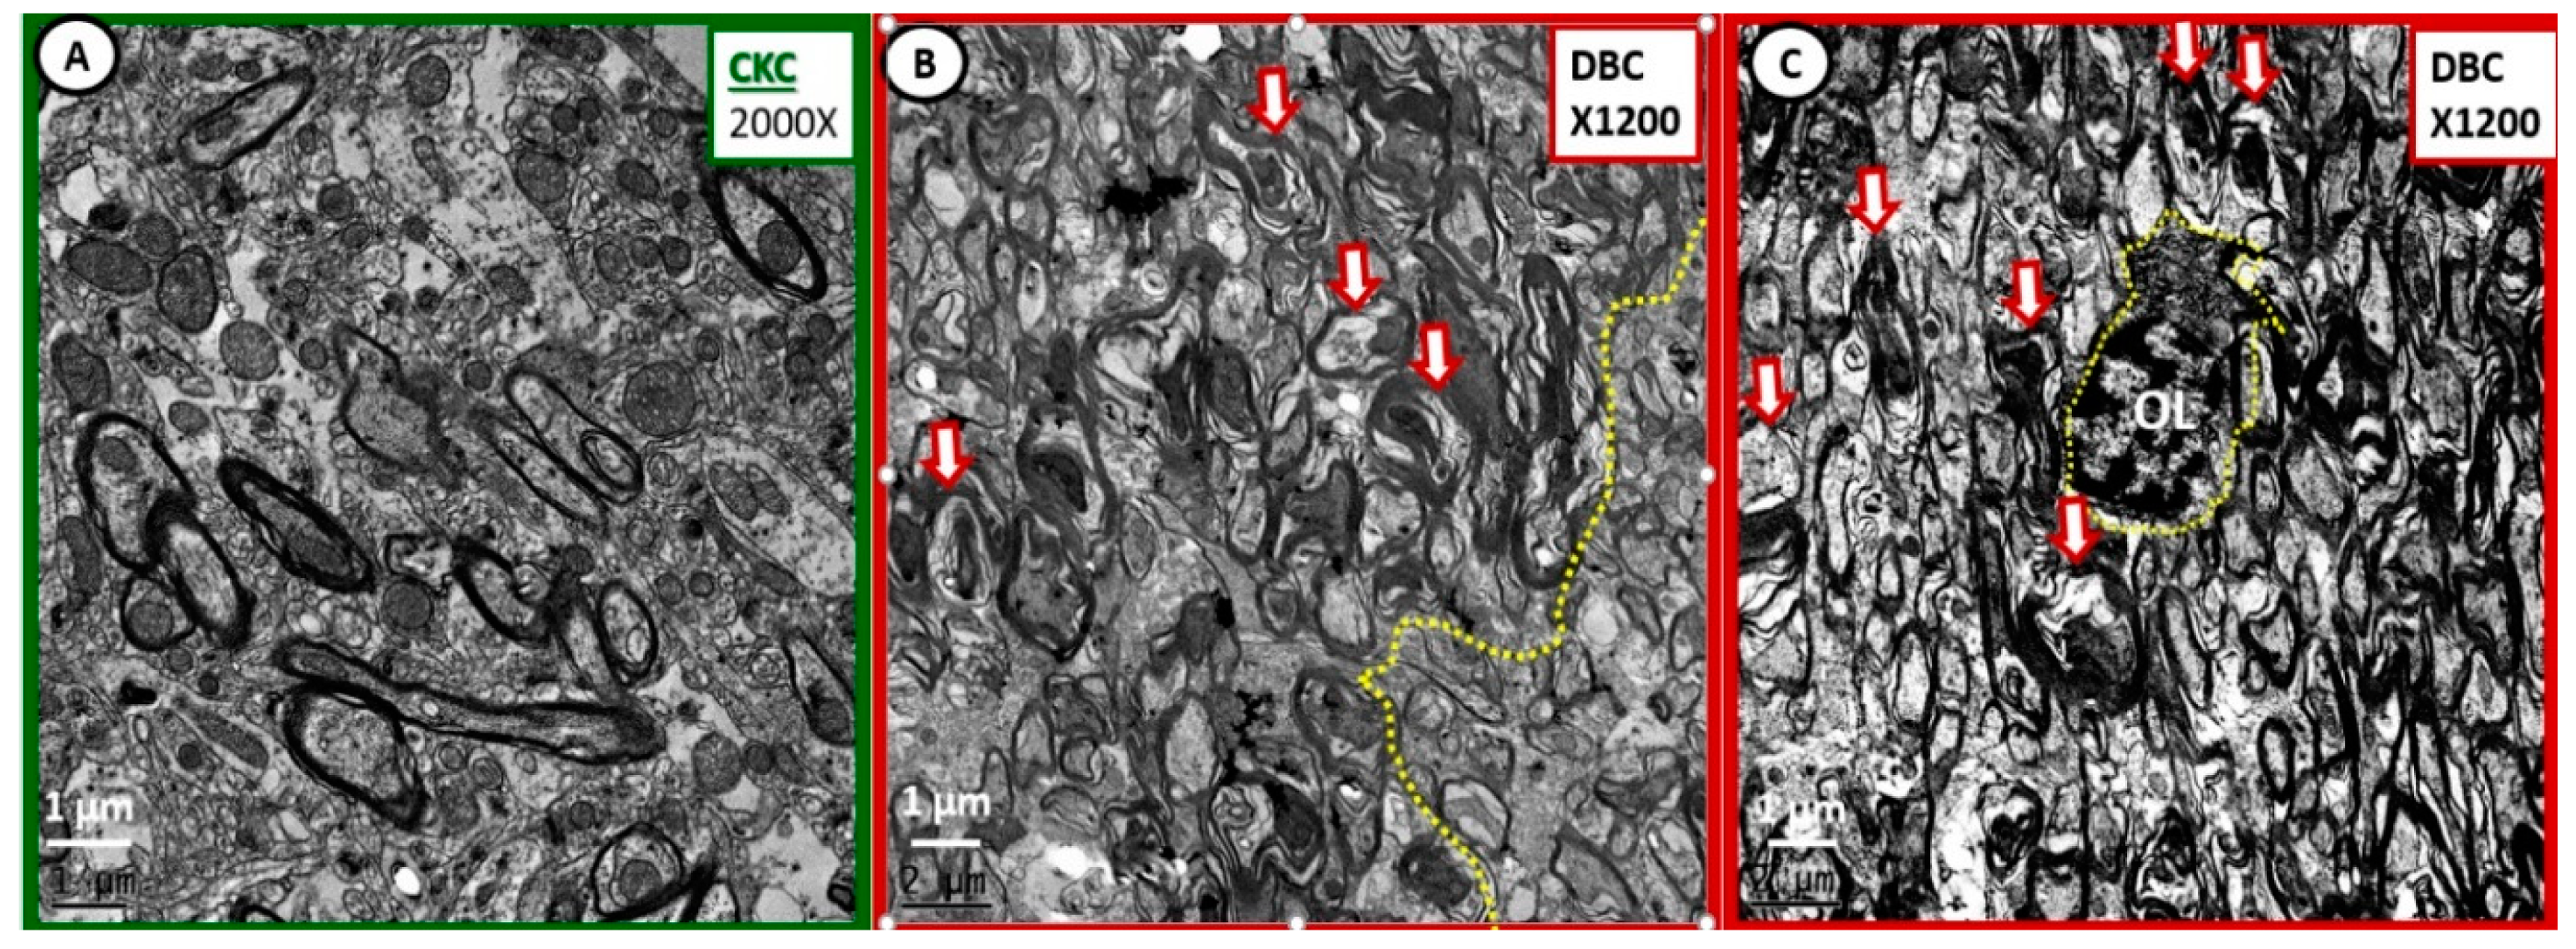
Figure 6.
Extensive myelin remodeling disarray in diabetic DBC at deeper transition regions of the subcortical white matter regions. (A) Illustrates the normal appearance of the transitional subcortical white matter regions just deep to layer VI grey matter. (B,C) Depict markedly abnormal myelin remodeling in the diabetic DBC models. (B) Even demonstrates a demarcation between more severe remodeling to the left side of the demarcation (yellow dashed line) with more severe myelin splitting and axonal—axoplasm collapse (open red arrows) within the abnormal myelin lamellar sheaths. (C) Depicts a centrally located oligodendrocyte (OL outlined by yellow dashed line) that appears to be in the process of wrapping multiple axons with myelin. Importantly, note the very electron dense chromatin clumping—condensation within the nuclei and the very small amount of cytoplasm. (B,C) Depict marked disorganization of myelin lamella—dysmyelination with disordered myelin lamella, which is associated with splitting and separation of the myelin sheath lamella. Also, this region demonstrated marked abnormal remodeling changes of myelinated neurons in the diabetic DBC models as compared to control CKC models. Magnification ×2000; scale bar = 1 µm (A). Magnification ×1200; scale bar = 1 µm (B,C).
![Neuroglia 01 00024 g006]()
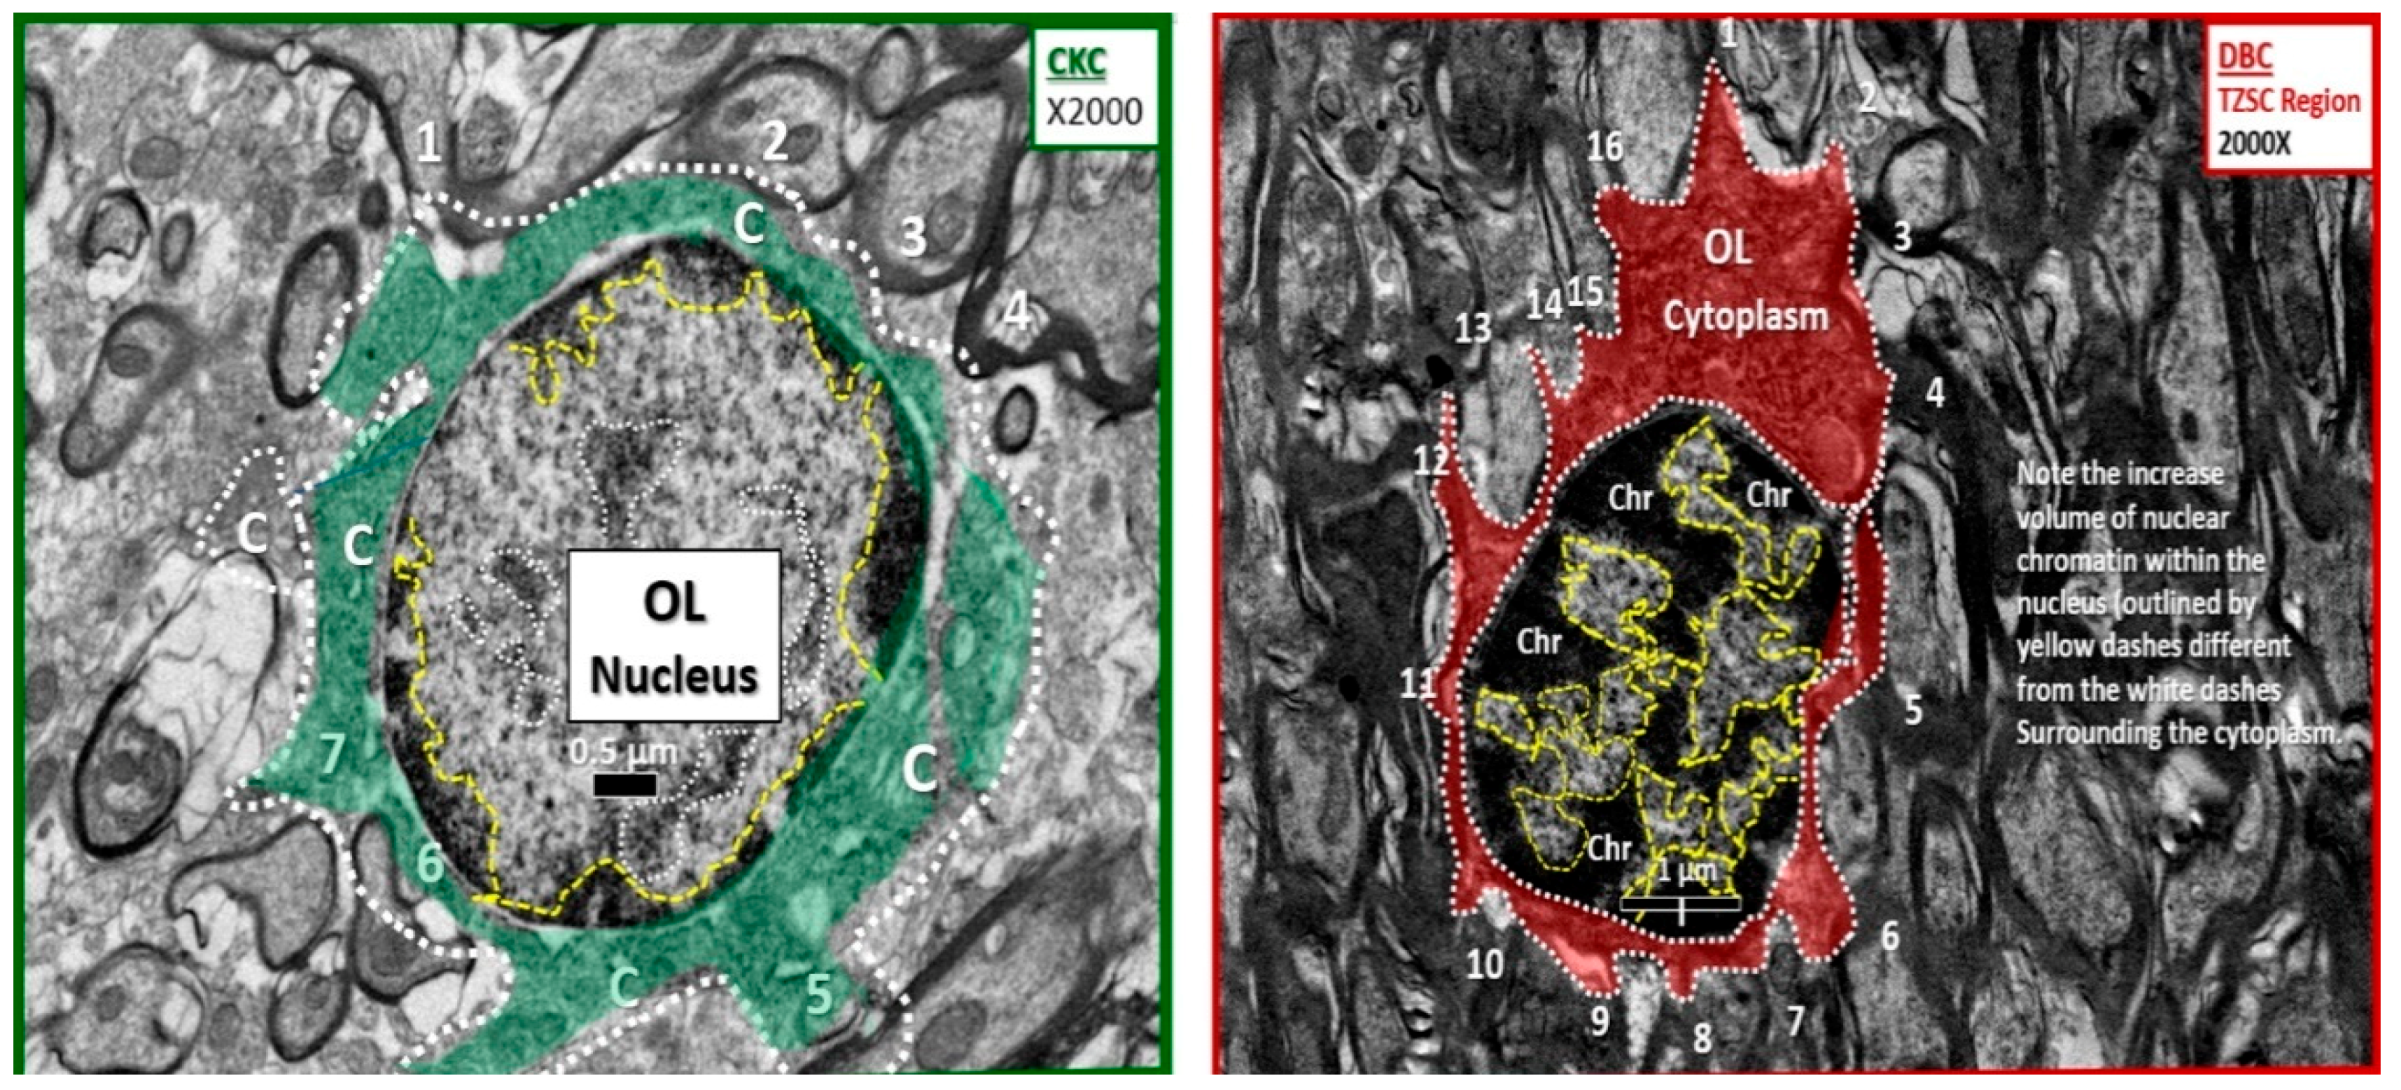
Figure 7.
Increased chromatin condensation volume in nuclei of diabetic DBC models in the transitional zone subcortical regions as compared to nondiabetic CKC models. The nondiabetic CKC model to the left (cytoplasm pseudo-colored green and outlined with white dashed line) depicts an OL in the transitional zone subcortical (TZSC) region with surrounding myelinated axons and displays at least 1–7 numbered regions of myelination and maintenance zones. Note that the cytoplasm (C) in control models to the left has approximately seven regions of myelination as compared to diabetic DBC model to the right, which depicts up to 16 regions of myelination and maintenance zones with adjacent numerous electron dense myelinated axons (cytoplasm is pseudo-colored red with white dashed outline). Of great interest in the TZSC regions of the DBC, note that nuclear chromatin (Chr) is markedly increased (outlined by yellow dashed lines) in volume compared to nuclear volume when compared to the CKC nuclear chromatin on the left (outlined by yellow dashed lines). This was a consistent remodeling abnormality in the TZSC regions in the DBC models. Magnification ×2000; bar = 0.5 µm in CKC and 1 µm in DBC.
![Neuroglia 01 00024 g007]()
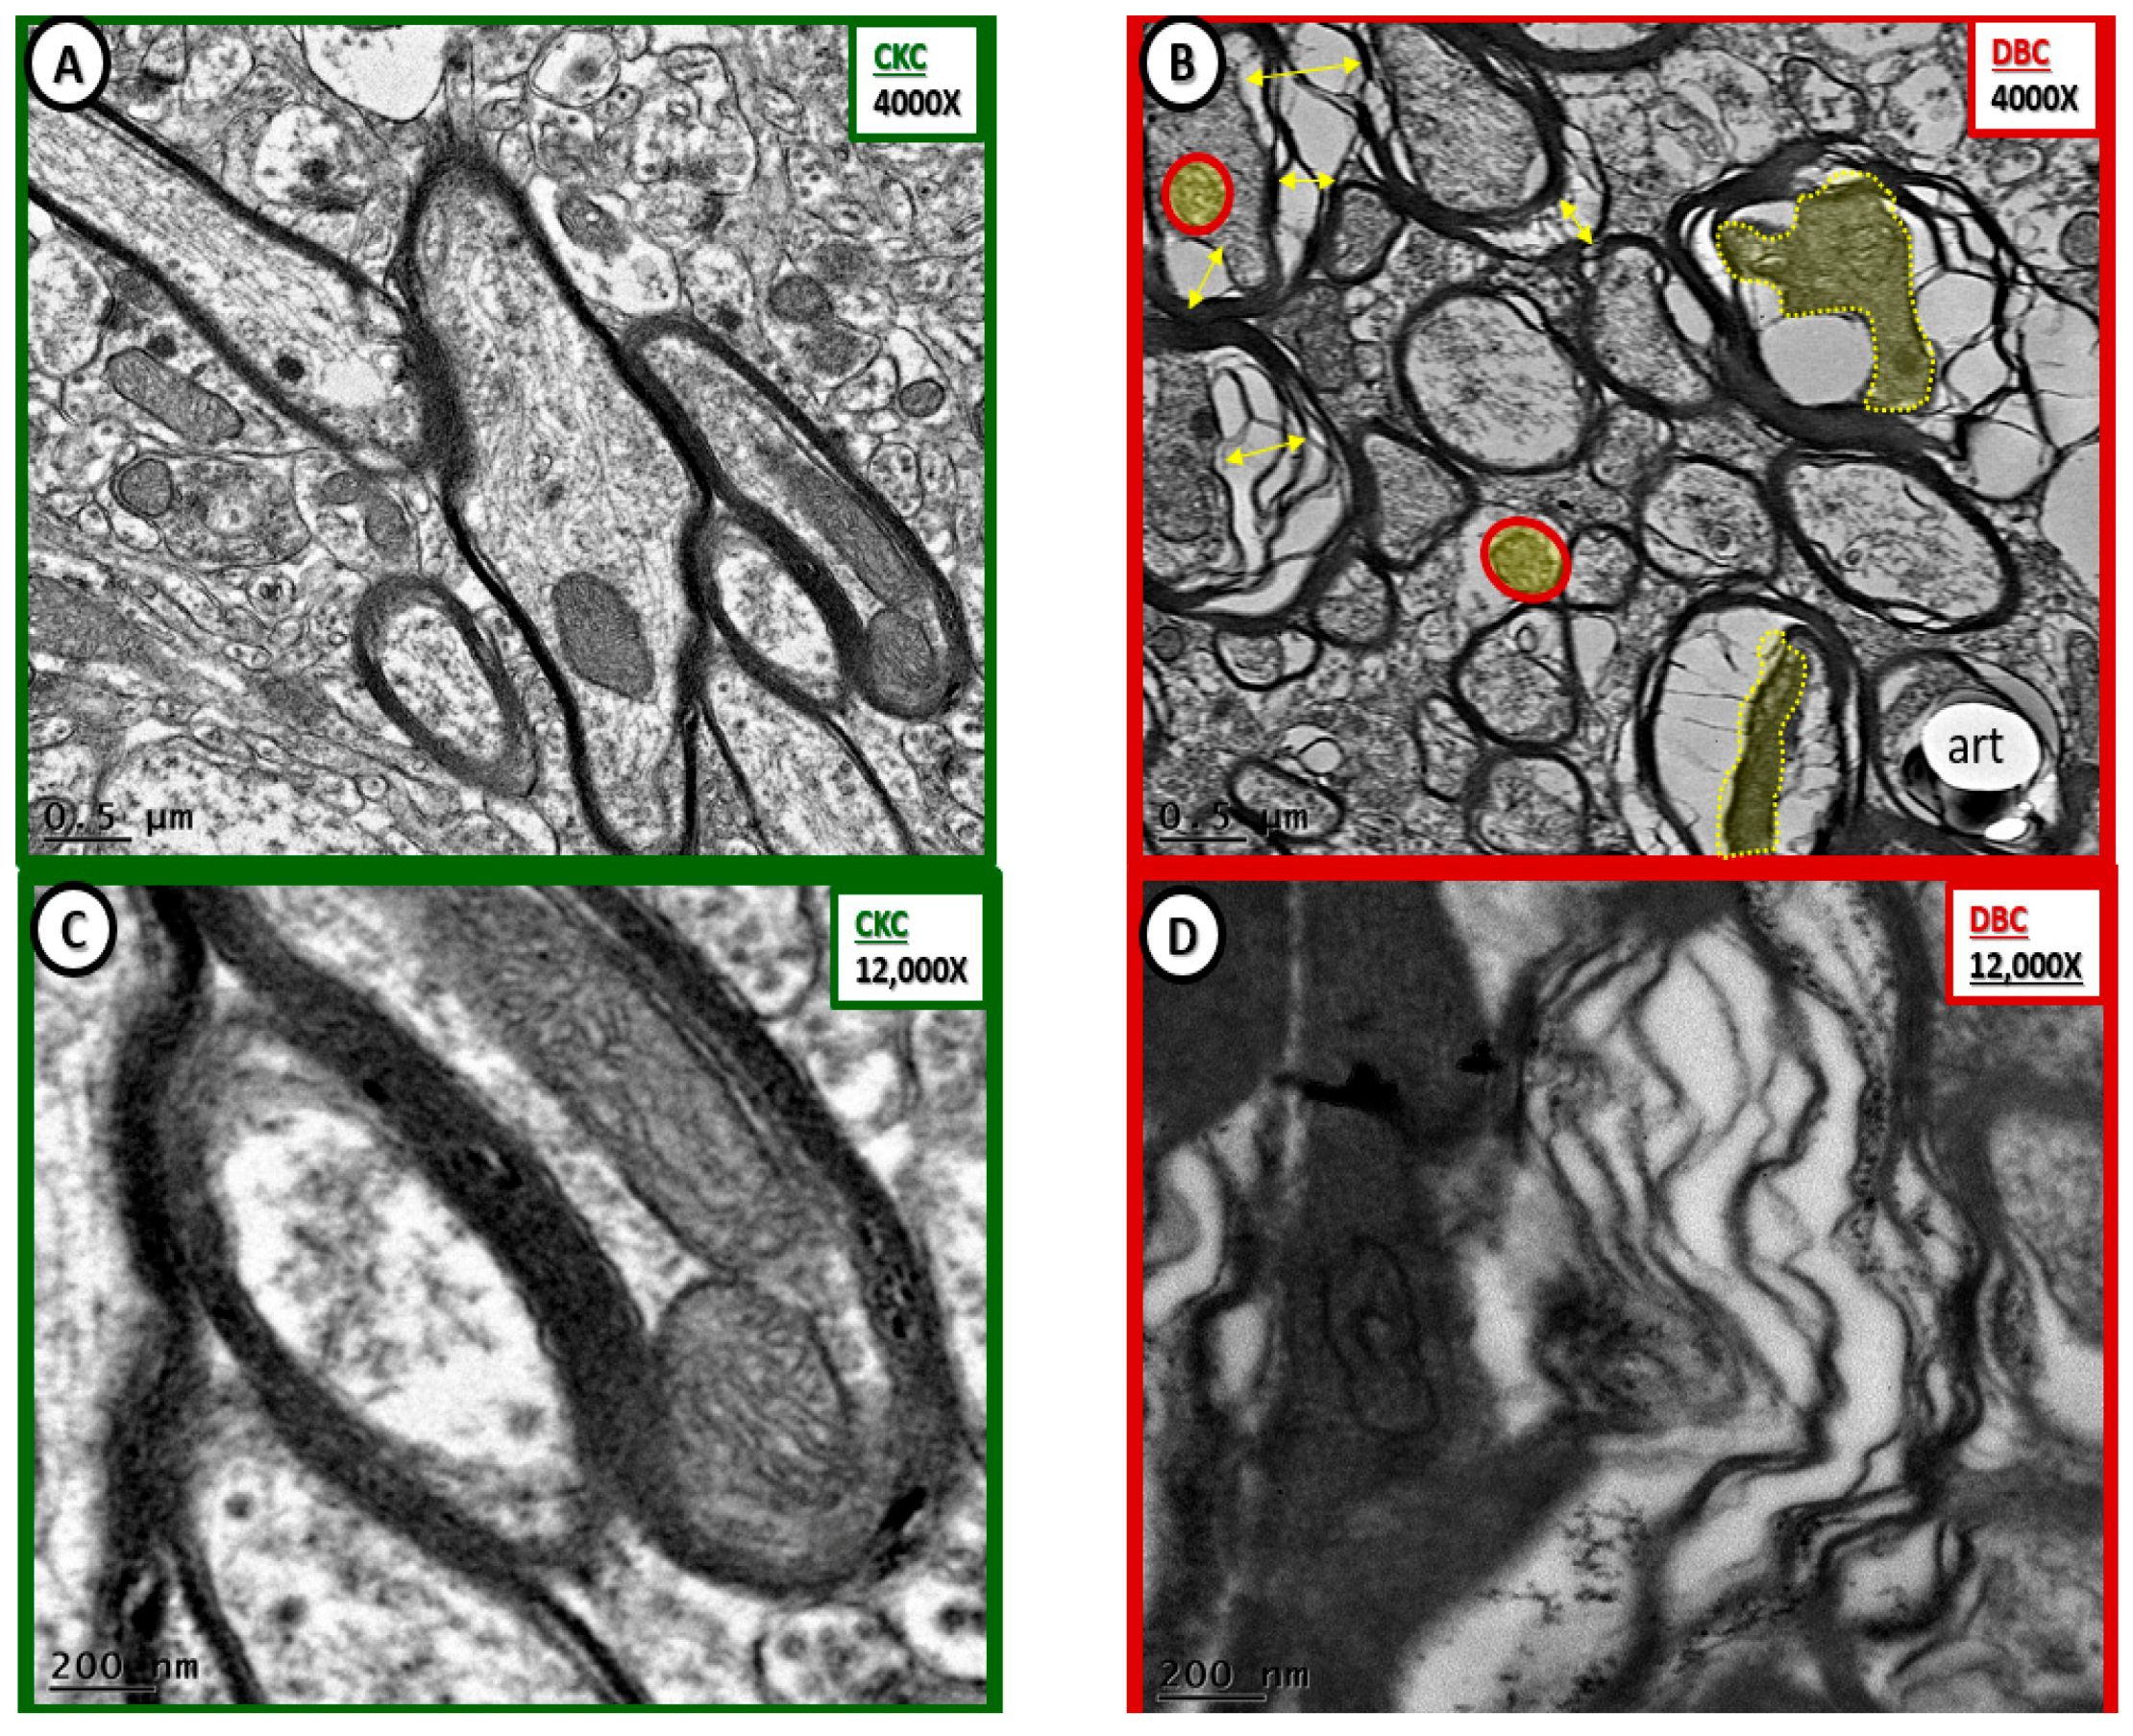
Figure 8.
Markedly abnormal subcortical white matter myelin in diabetic DBC models. (C,D) Depict marked disorganization—disarrangement of the transitional zone subcortical white matter (SCWM) myelin and the neuronal axon in the diabetic DBC models. (B) Illustrates axon-axoplasm collapse (double arrows) in myelinated neurons. Also note that the neuronal axons become very electron dense once they collapse (pseudo-colored yellow and outlined by yellow dashed lines). Additionally, note the aberrant mitochondria (pseudo-colored yellow and outlined by red lines) as compared to the electron dense Mt with crista in the control CKC models (A,C). (D) Illustrates the abnormal myelin lamella with marked splitting and separation of myelin lamella. Magnification ×4000; bar = 0.5 µm in (A,B). Magnification ×12,000; bar = 200 nm in (C,D). art: artifact.
Figure 9.
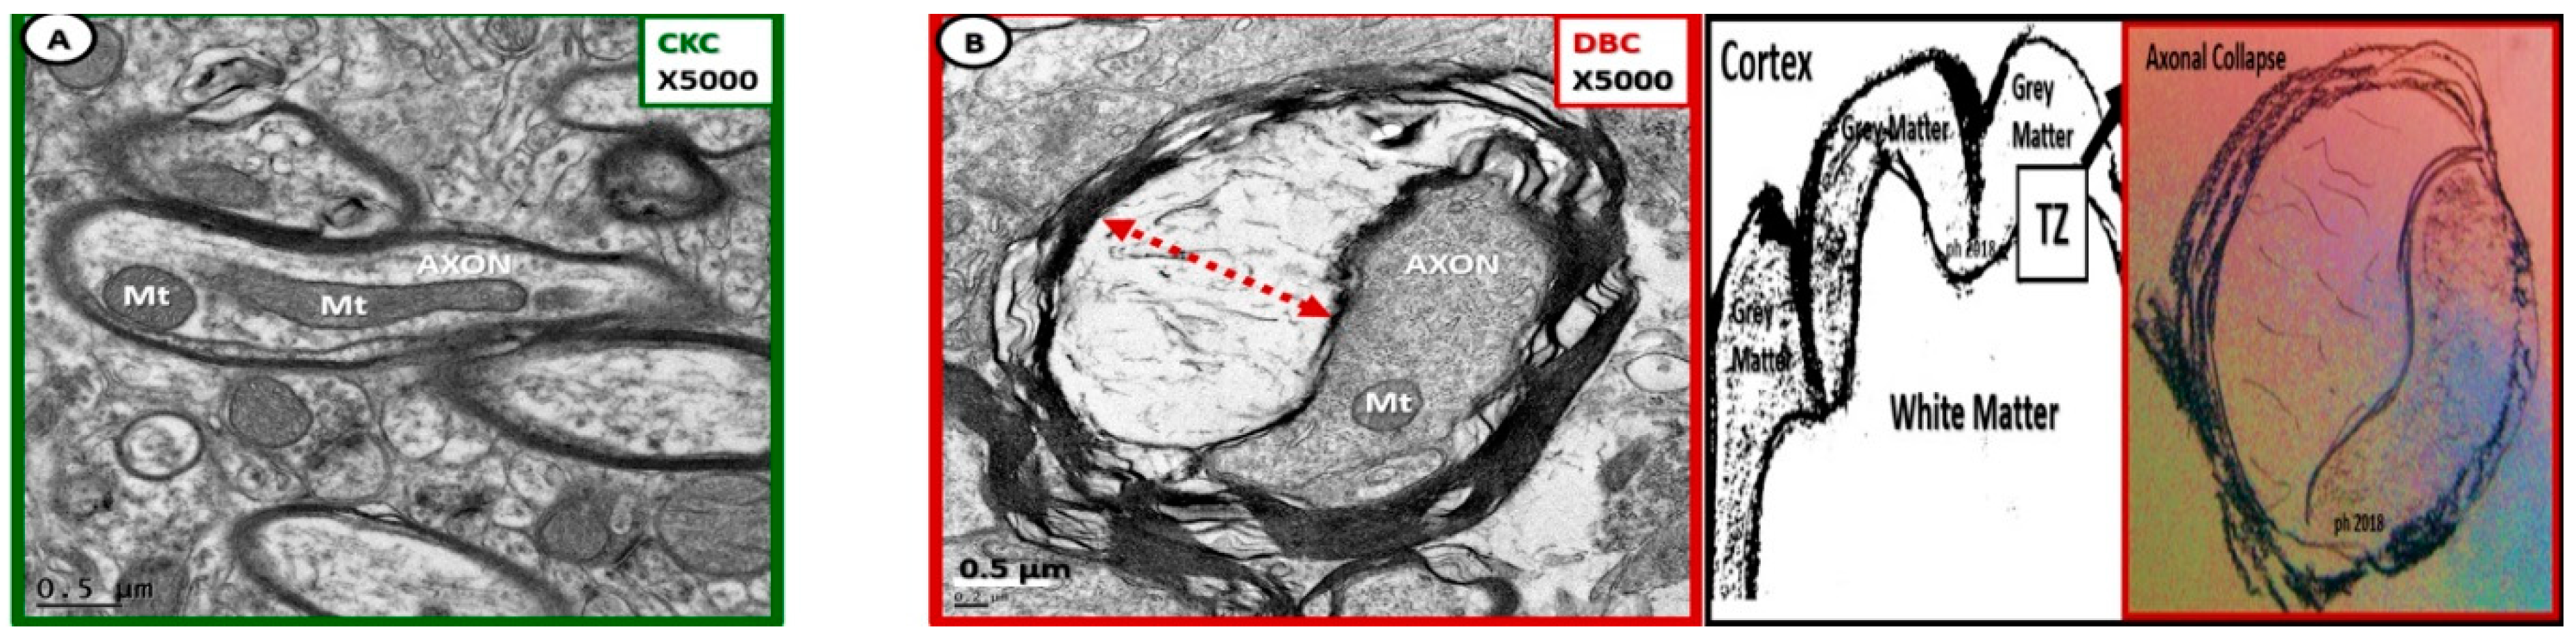
Axonal collapse in dysmyelinated neurons with splitting and separation transitional zones in diabetic DBC. Note in (B) that the collapse of the axon within the dysmyelinated neuron with splitting and separation of myelin lamella sheath in the transitional zones (TZ) of the subcortical white matter of the diabetic DBC as compared to the TZ non-collapsed axons in CKC models (A). Axonal collapse was markedly increased in the transitional zone regions as compared to the grey matter and not found in any of the CKC models. Note the region of the TZ in artistic rendering to far right of above figure. Magnification ×5000; scale bar = 0.5 µm.
Figure 9.
Axonal collapse in dysmyelinated neurons with splitting and separation transitional zones in diabetic DBC. Note in (B) that the collapse of the axon within the dysmyelinated neuron with splitting and separation of myelin lamella sheath in the transitional zones (TZ) of the subcortical white matter of the diabetic DBC as compared to the TZ non-collapsed axons in CKC models (A). Axonal collapse was markedly increased in the transitional zone regions as compared to the grey matter and not found in any of the CKC models. Note the region of the TZ in artistic rendering to far right of above figure. Magnification ×5000; scale bar = 0.5 µm.
Figure 10.
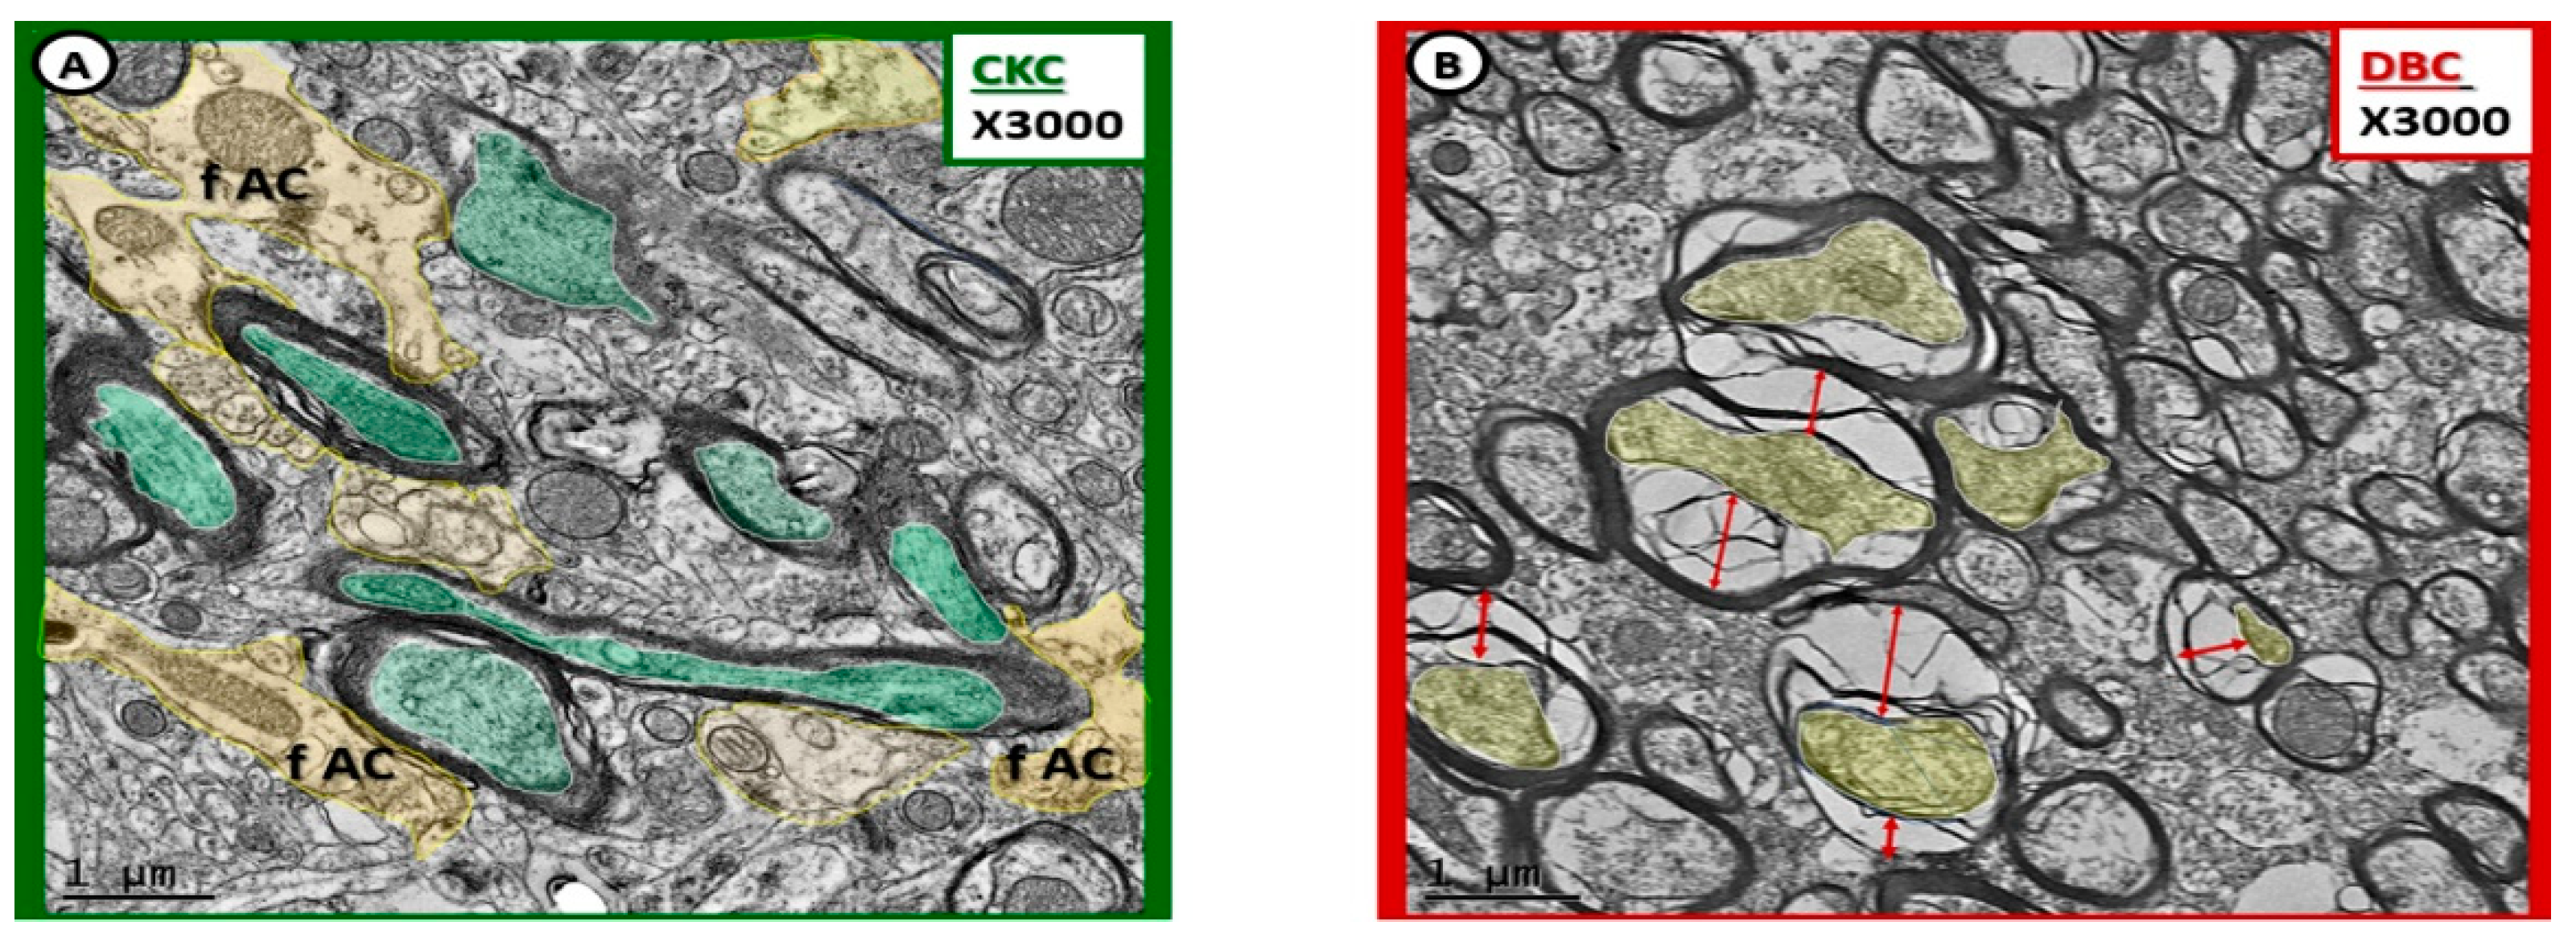
Myelin splitting, separation, and ballooning with axonal collapse in transitional zone in diabetic DBC models. (A) Depicts myelinated neurons with pseudo-colored green axons that fully occupy the myelin core. Also note the pseudo-colored yellow fibrous astrocyte (f AC) that are adjacent to the myelinated axons. (B) Demonstrates the splitting, separation, and ballooning of the myelin sheath resulting in axonal collapse in the diabetic DBC models in the transitional zone between layers VI and the subcortical white matter. Magnification ×3000; scale bar = 1 µm in (A,B).
Figure 10.
Myelin splitting, separation, and ballooning with axonal collapse in transitional zone in diabetic DBC models. (A) Depicts myelinated neurons with pseudo-colored green axons that fully occupy the myelin core. Also note the pseudo-colored yellow fibrous astrocyte (f AC) that are adjacent to the myelinated axons. (B) Demonstrates the splitting, separation, and ballooning of the myelin sheath resulting in axonal collapse in the diabetic DBC models in the transitional zone between layers VI and the subcortical white matter. Magnification ×3000; scale bar = 1 µm in (A,B).
Figure 11.
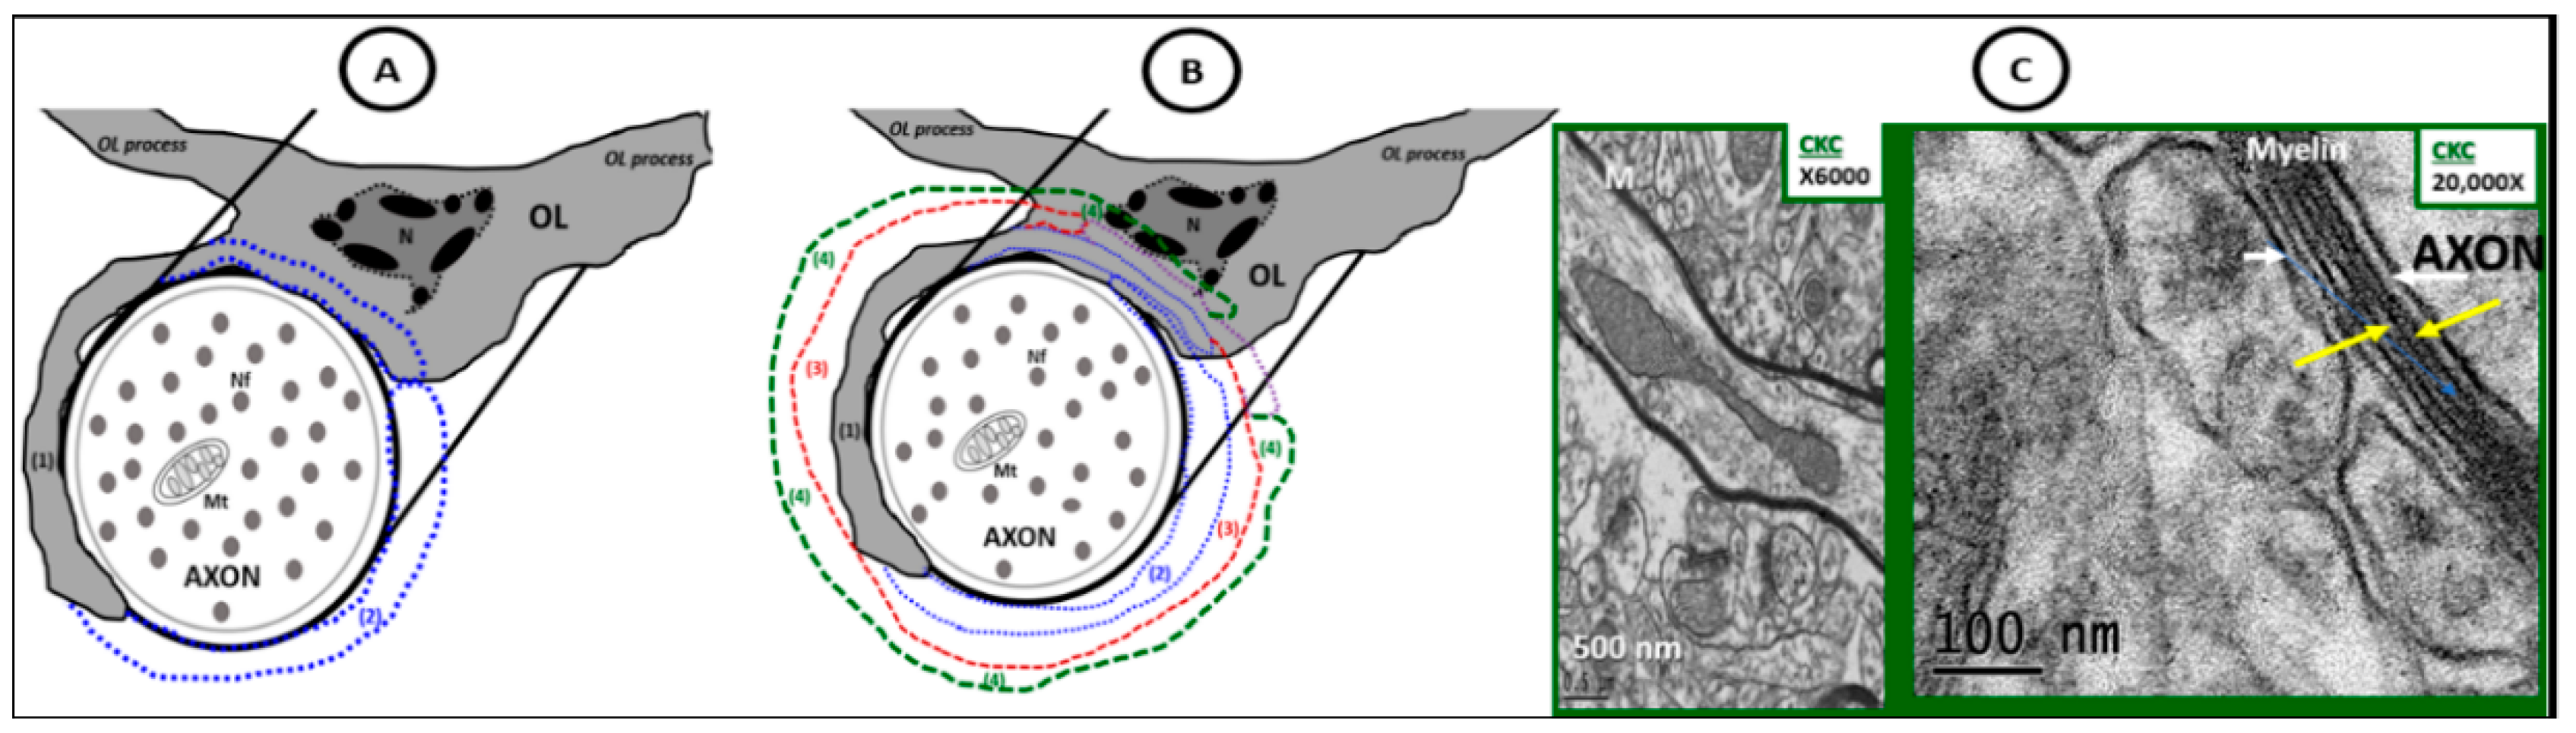
Possible mechanisms for oligodendrocyte myelination. (A) Depicts an illustration of the initial engagement of an OL and an unmyelinated axon with a protrusion of an oligodendrocyte cytoplasmic process (grey) beginning to extend and enwrap (blue dashed lines) of an unmyelinated neuron. (B) Depicts the possible multi-step process: (1) solid grey oligodendrocyte cytoplasmic process protrusion and engagement of the OL to the unmyelinated axon; (2) extension of the original oligodendrocyte cytoplasmic protrusion—blue dashed line; (3) another wrapping—red dashed line; (4) the most recent extension of wrapping—green dashed line. These previous steps may represent a common OL cellular mechanism of myelination. The multiple wrappings, which result in multilamellar myelin ensheathments are then bound tightly and compacted via the myelin basic protein plus other compacting proteins synthesized and secreted by oligodendrocytes that eventually develop into the highly electron dense tightly wrapped compacted myelinated neurons that we observe in transmission electron microscopic images in control CKC models as depicted in the control CKC model in (C). This mechanism does not explain for the lateral extension of the internodal myelin. Note that in (C) there is present some separation of myelinated lamella as a result of high magnification ×20,000; scale bar = 100 nm that is not recognized at lower magnification. This higher magnification delineates the electron dense (dense lines—yellow arrows) and the electron lucent (intraperiod lines—white arrows). M: mitochondria; N: nucleus of oligodendrocyte; Nf: neurofilament; OL: oligodendrocyte.
Figure 11.
Possible mechanisms for oligodendrocyte myelination. (A) Depicts an illustration of the initial engagement of an OL and an unmyelinated axon with a protrusion of an oligodendrocyte cytoplasmic process (grey) beginning to extend and enwrap (blue dashed lines) of an unmyelinated neuron. (B) Depicts the possible multi-step process: (1) solid grey oligodendrocyte cytoplasmic process protrusion and engagement of the OL to the unmyelinated axon; (2) extension of the original oligodendrocyte cytoplasmic protrusion—blue dashed line; (3) another wrapping—red dashed line; (4) the most recent extension of wrapping—green dashed line. These previous steps may represent a common OL cellular mechanism of myelination. The multiple wrappings, which result in multilamellar myelin ensheathments are then bound tightly and compacted via the myelin basic protein plus other compacting proteins synthesized and secreted by oligodendrocytes that eventually develop into the highly electron dense tightly wrapped compacted myelinated neurons that we observe in transmission electron microscopic images in control CKC models as depicted in the control CKC model in (C). This mechanism does not explain for the lateral extension of the internodal myelin. Note that in (C) there is present some separation of myelinated lamella as a result of high magnification ×20,000; scale bar = 100 nm that is not recognized at lower magnification. This higher magnification delineates the electron dense (dense lines—yellow arrows) and the electron lucent (intraperiod lines—white arrows). M: mitochondria; N: nucleus of oligodendrocyte; Nf: neurofilament; OL: oligodendrocyte.
![Neuroglia 01 00024 g011]()
Figure 12.
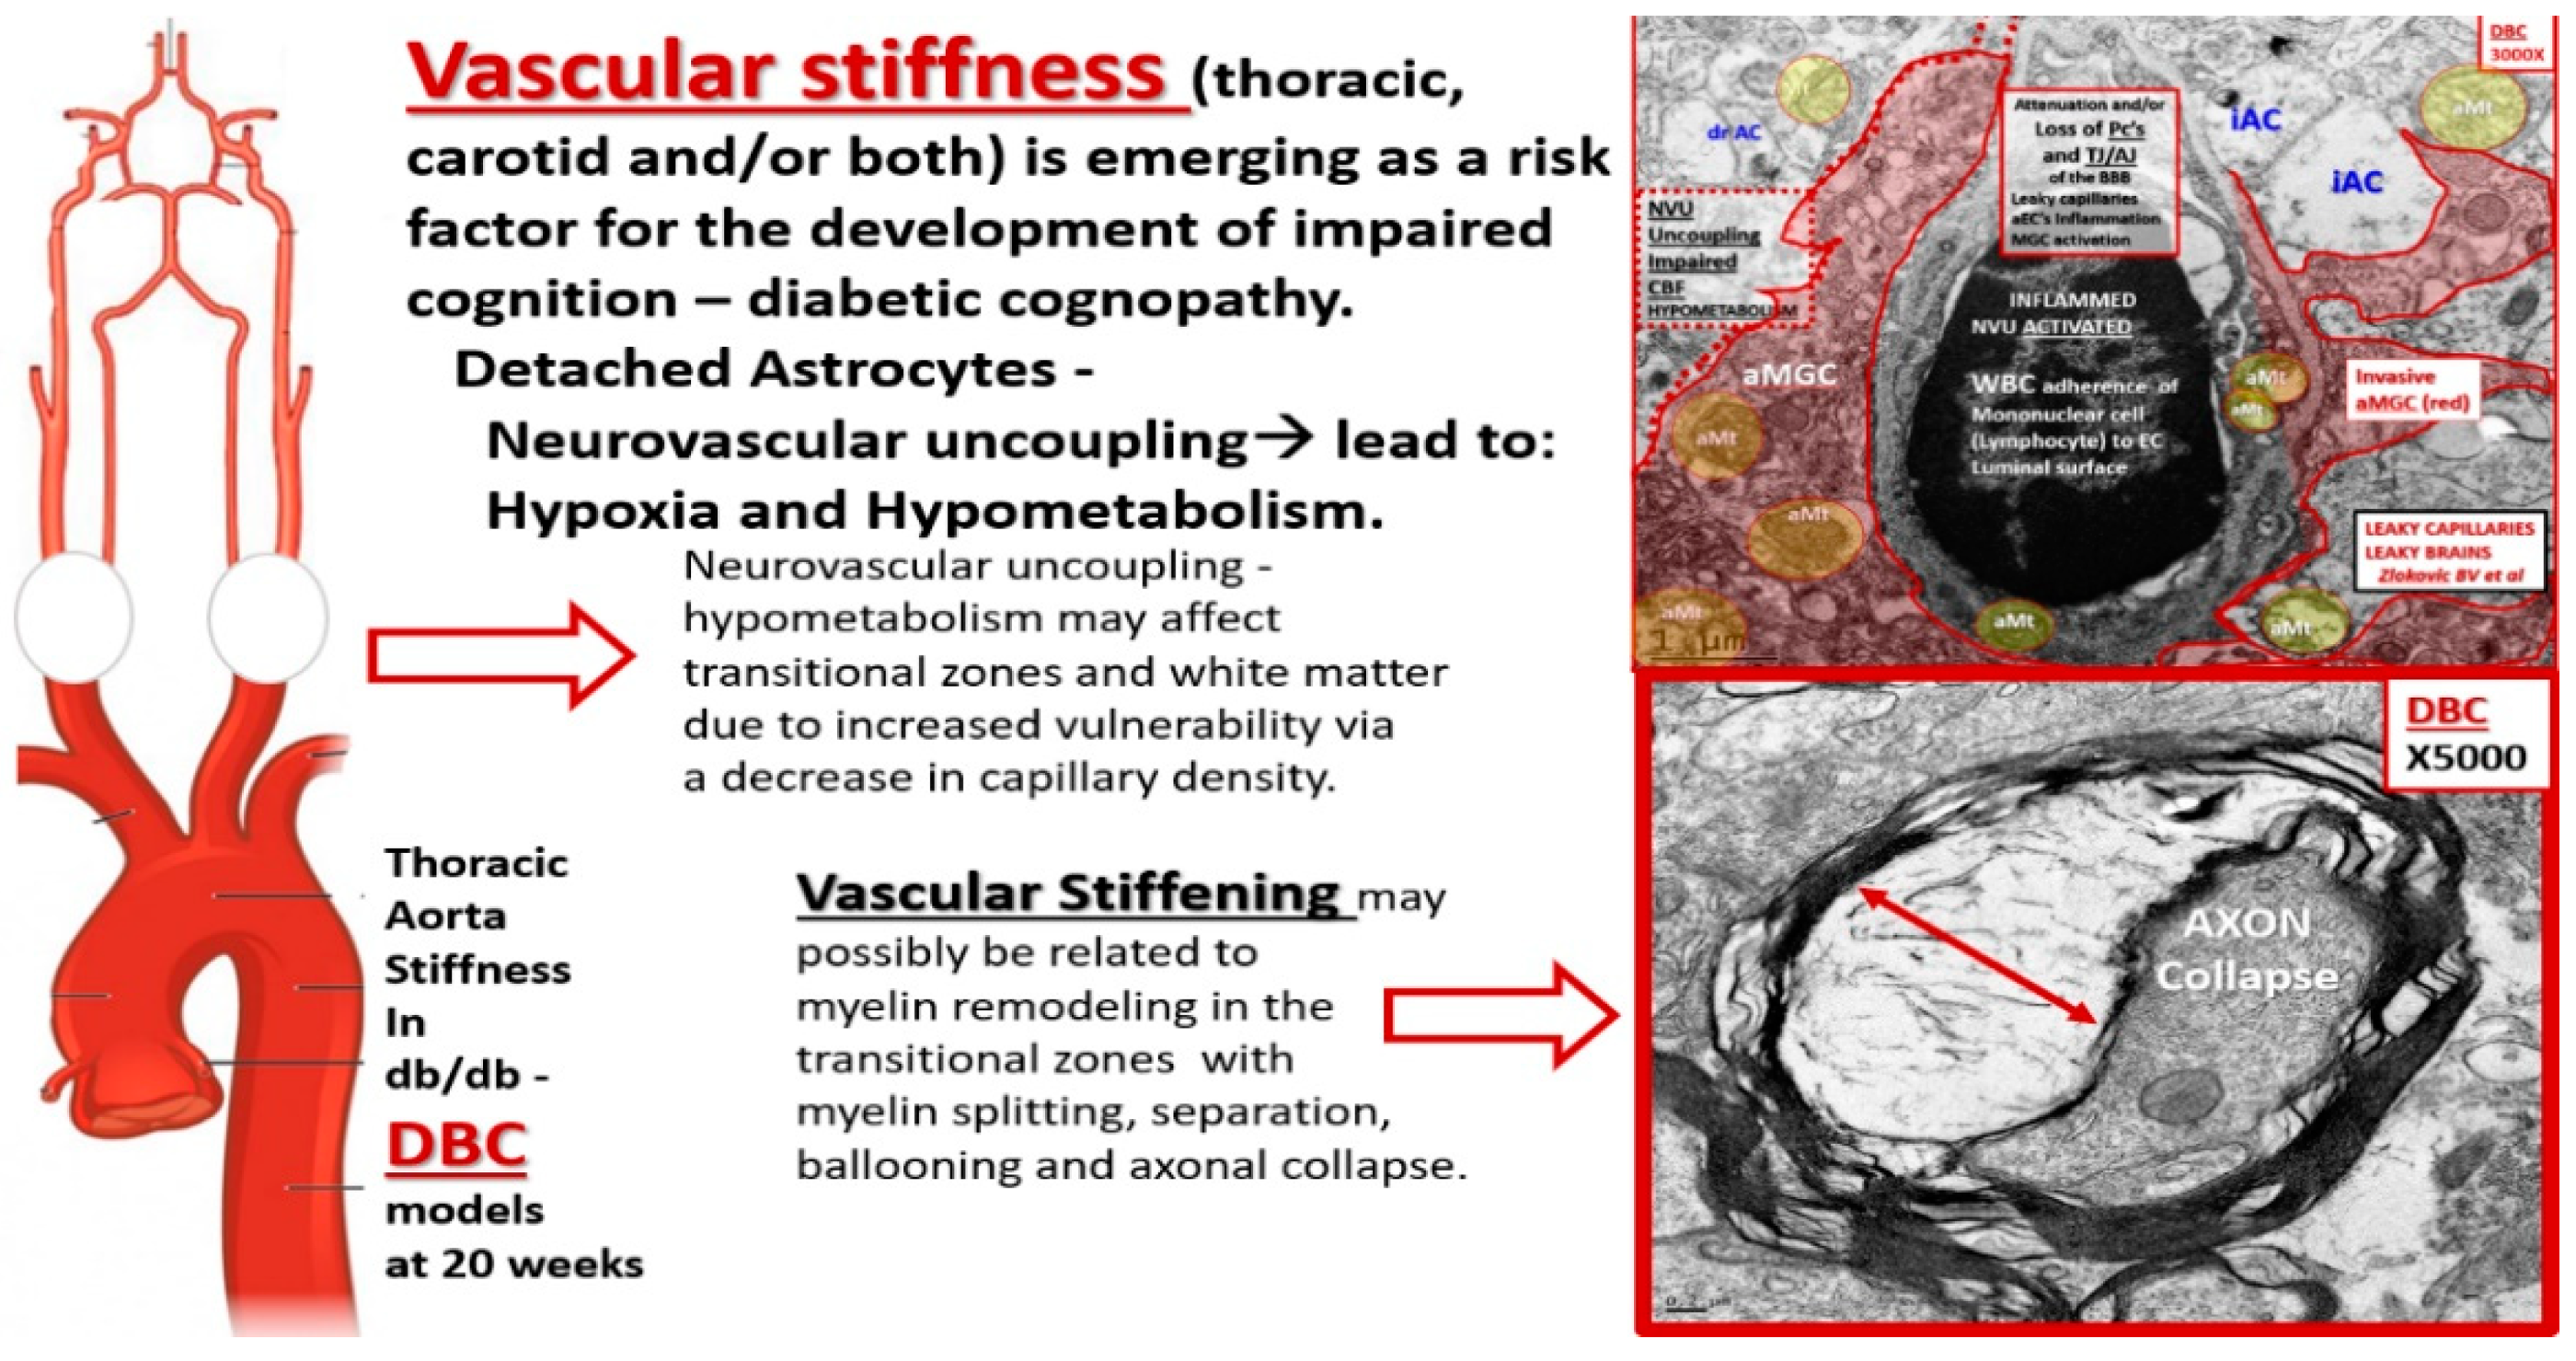
Montage of images demonstrating that vascular stiffness in the thoracic or carotid arteries may result in capillary neurovascular unit remodeling and the possible relationship to the development of dysmyelination in the diabetic DBC models. On the far left are depictions of the thoracic aorta, carotids, and brain circulatory system that are known to experience vascular stiffness in the diabetic DBC model [
19]. The open arrow then points to the fact that there may be neurovascular uncoupling, which decreases the cerebral blood flow and could result in hypometabolism not only in the cortical grey matter but also in the vulnerable transitional zone. Cerebral flow pulsatility is augmented in type 2 diabetes mellitus (T2DM) [
17] and this has been associated with markers of cerebral damage, such as white matter hyperintensities in T2DM. Thus, thoracic or carotid artery stiffness could result in dysmyelination and in turn the dysmyelination could slow the delivery of information—action potential without proper synchronicity and result in impaired cognition.
Figure 12.
Montage of images demonstrating that vascular stiffness in the thoracic or carotid arteries may result in capillary neurovascular unit remodeling and the possible relationship to the development of dysmyelination in the diabetic DBC models. On the far left are depictions of the thoracic aorta, carotids, and brain circulatory system that are known to experience vascular stiffness in the diabetic DBC model [
19]. The open arrow then points to the fact that there may be neurovascular uncoupling, which decreases the cerebral blood flow and could result in hypometabolism not only in the cortical grey matter but also in the vulnerable transitional zone. Cerebral flow pulsatility is augmented in type 2 diabetes mellitus (T2DM) [
17] and this has been associated with markers of cerebral damage, such as white matter hyperintensities in T2DM. Thus, thoracic or carotid artery stiffness could result in dysmyelination and in turn the dysmyelination could slow the delivery of information—action potential without proper synchronicity and result in impaired cognition.
![Neuroglia 01 00024 g012]()
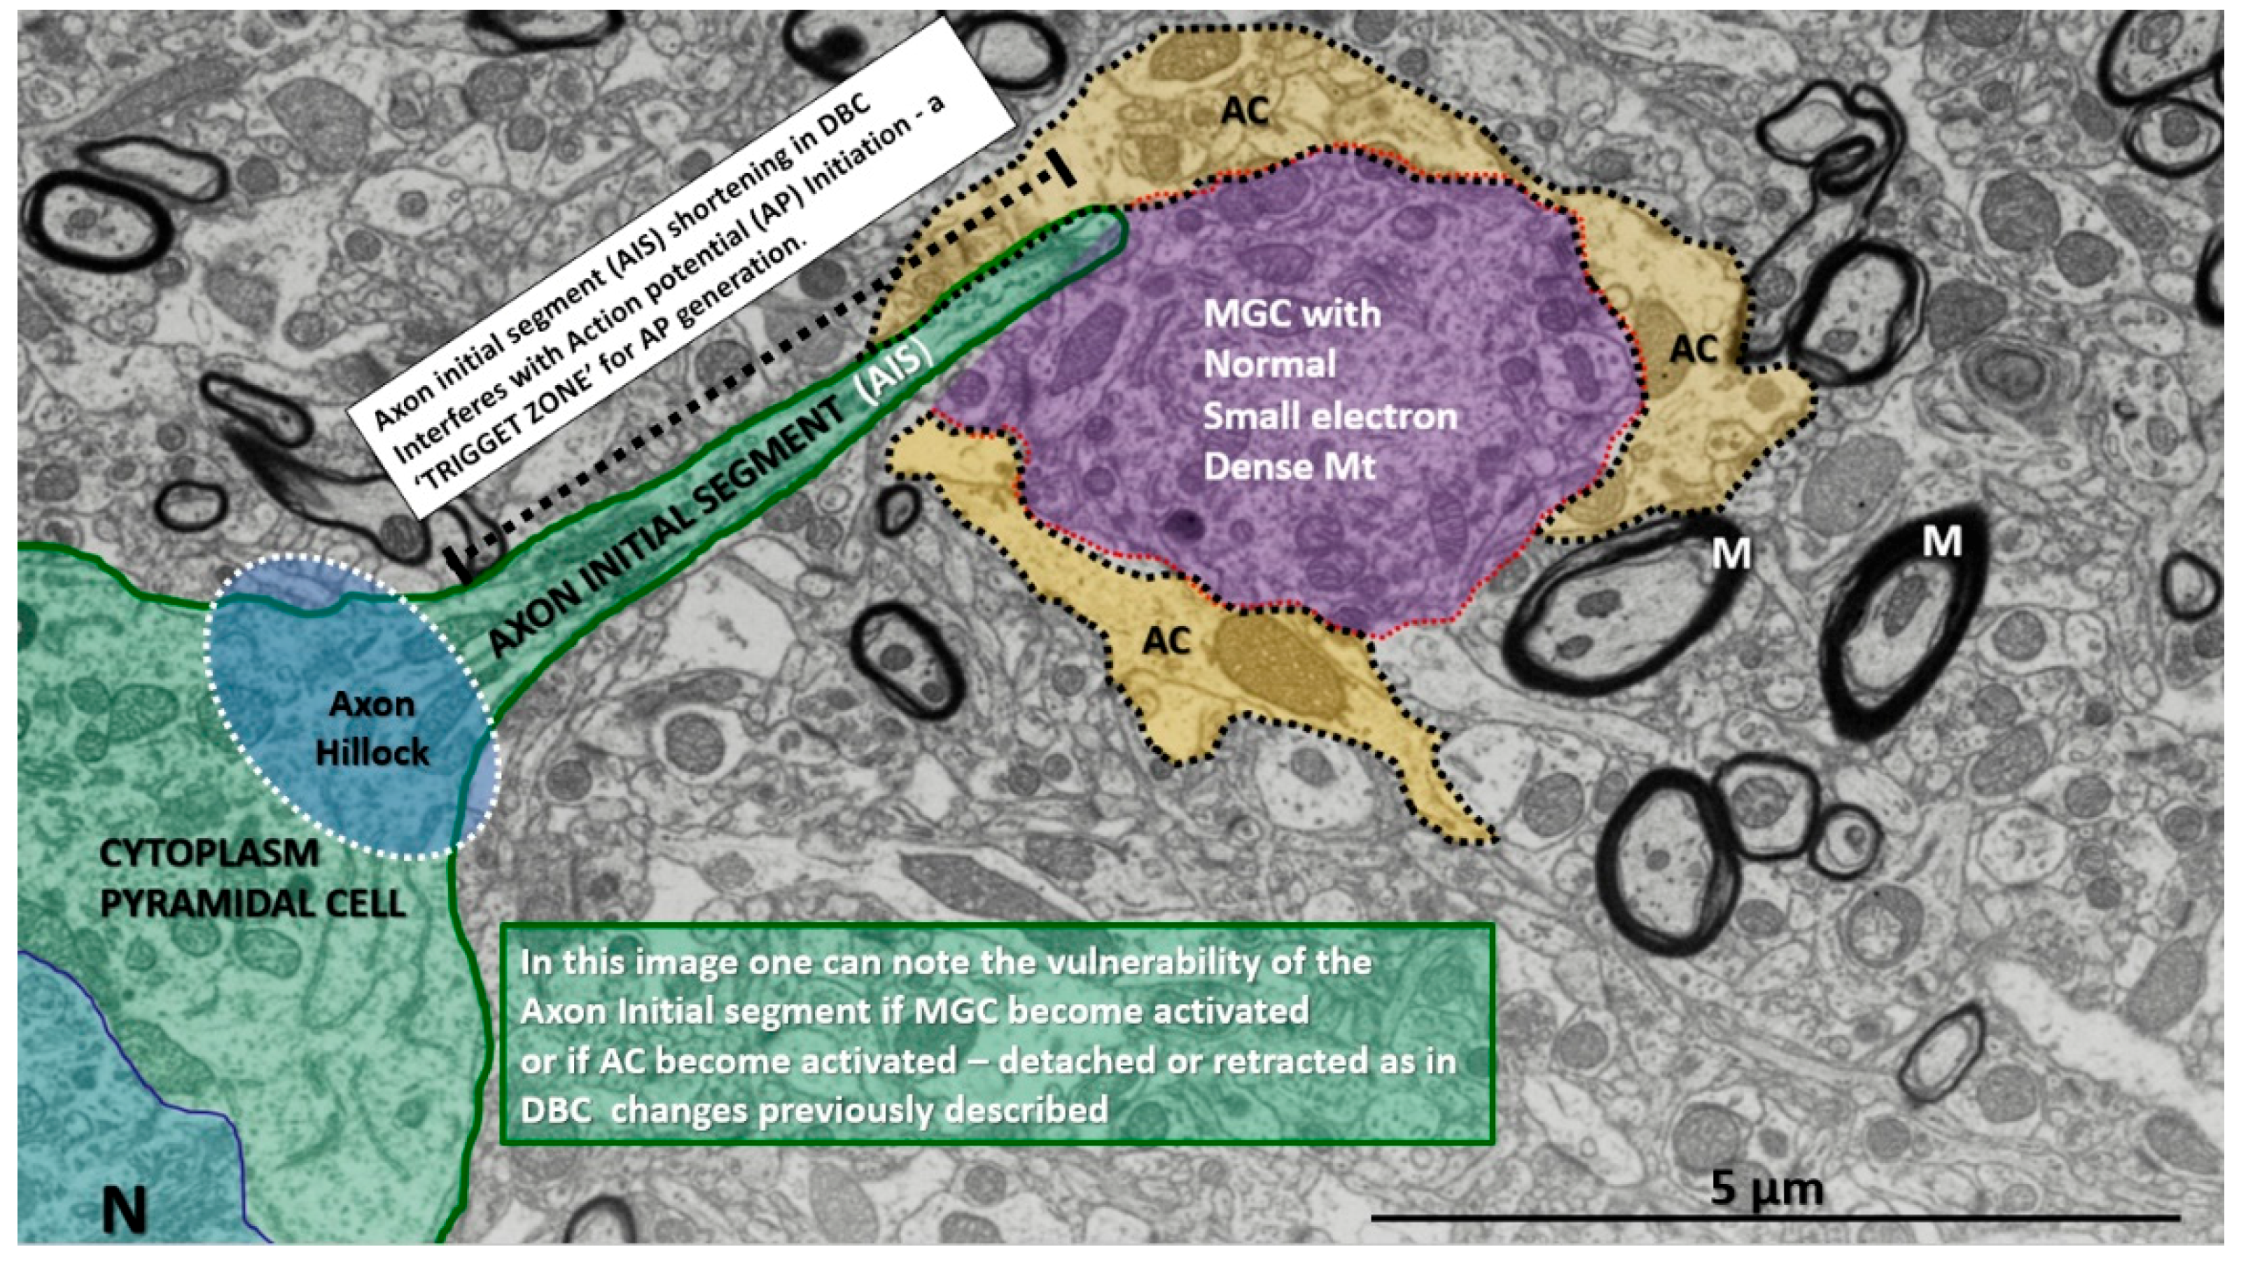
Figure 13.
Pyramidal cell demonstrating the normal axon initial segment (AIS) in a control model. Note the cytoplasm of this pyramidal cell has an axon hillock region and also the axon initial segment region as the axon protrudes from the soma of the pyramidal cell. M: myelin; MGC: microglial cell; N: pyramidal nucleus; AP = action potential. Scale bar = 5 µm.
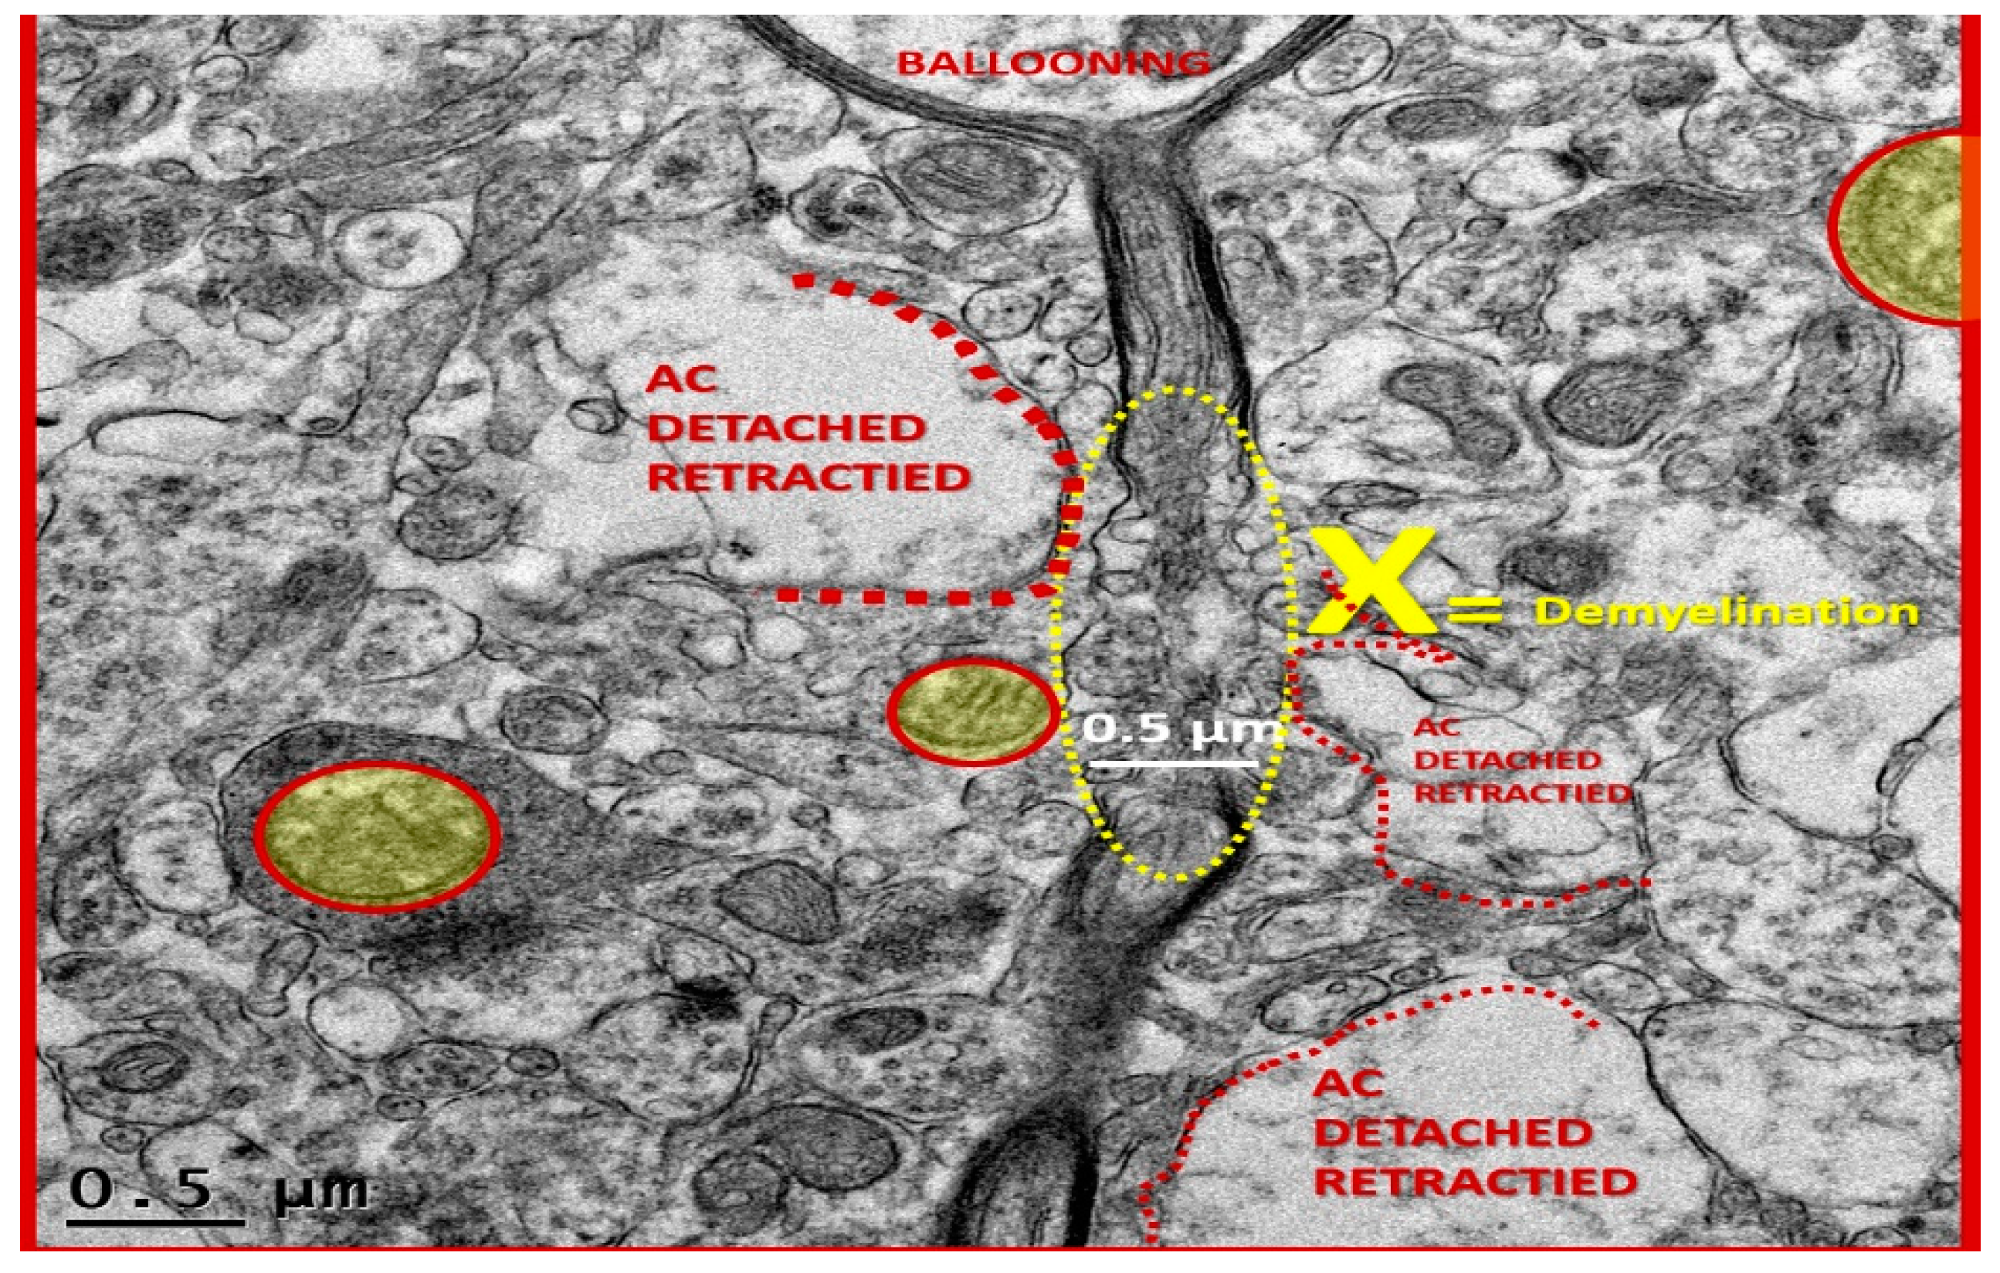
Figure 14.
Detached and retracted astrocytes from a ballooning pyramidal neuronal axon in layer III of cortical grey matter. This is a higher magnification of previous image
Figure 4 ×1500. In this image one can observe that there is a region marked with the letter X (yellow) where there is an area of myelin loss (demyelination) in a ballooned axon within layer III of the cortical grey matter. Importantly, note the detachment and retraction of astrocytes (AC) from the neuronal axon (defined in red lettering and by dashed lines). Also note the presence of at least three aberrant mitochondria in this region. Magnification ×4000; scale bar = 0.5 µm.
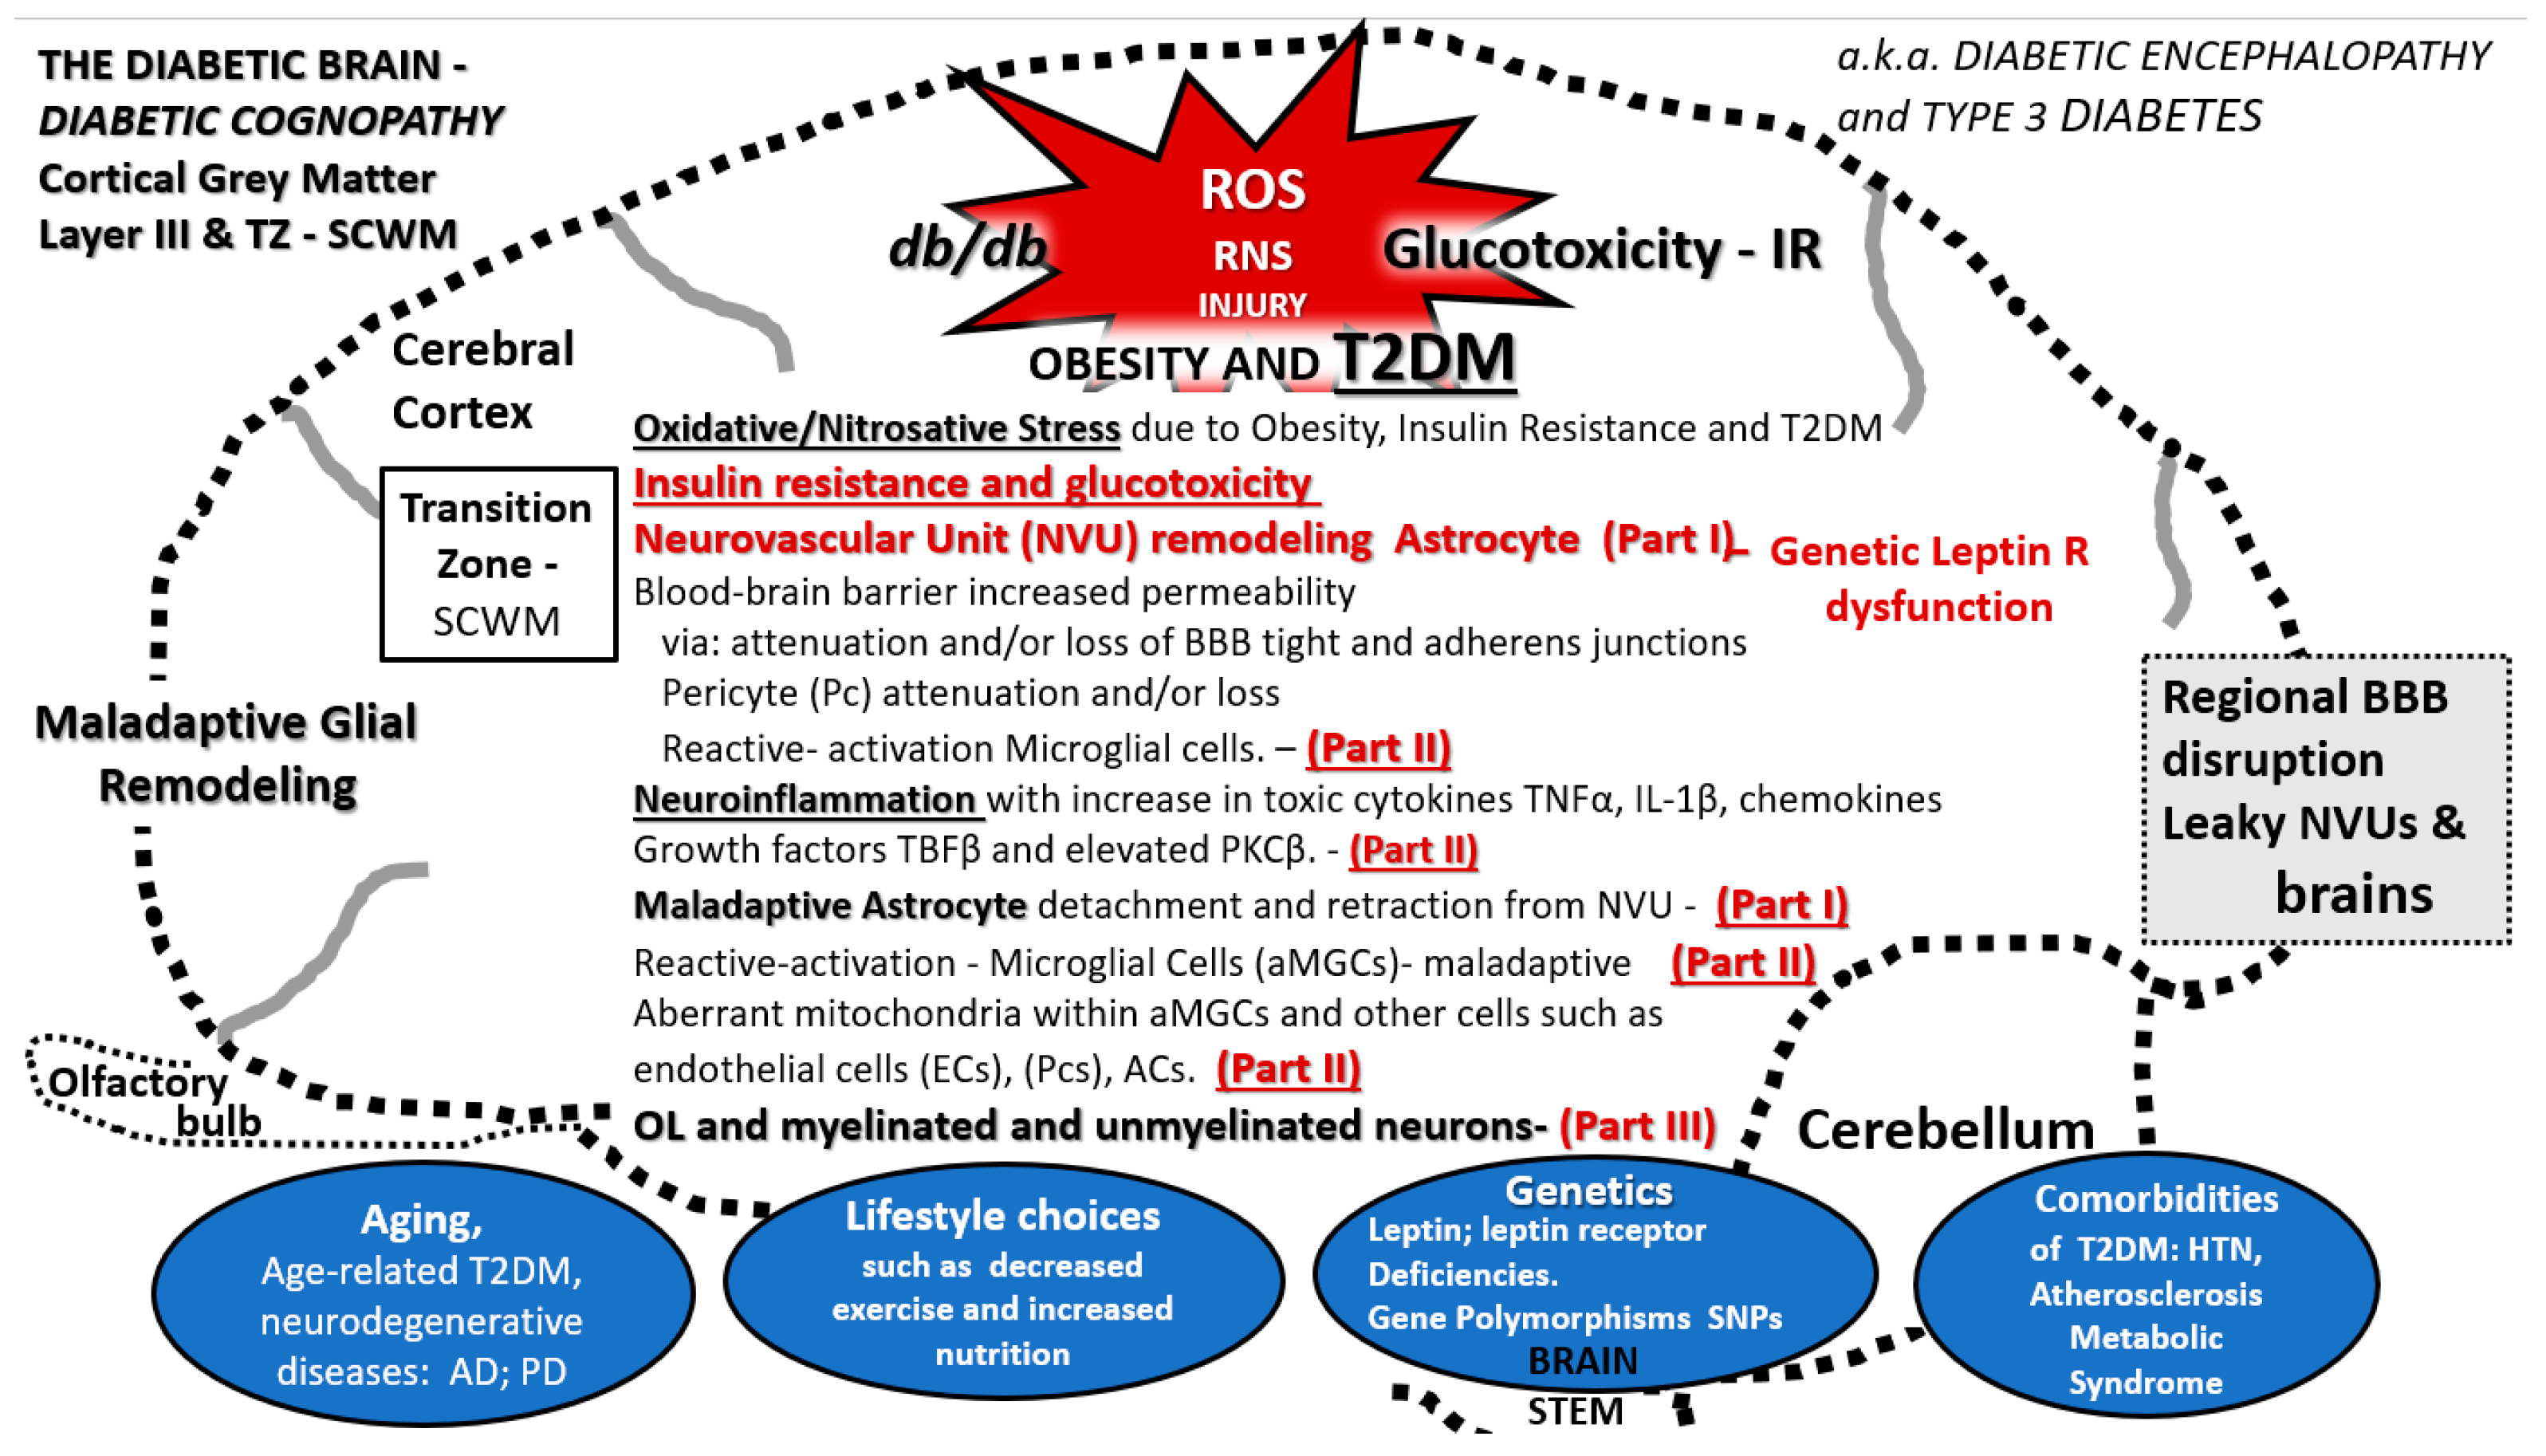
Figure 15.
Multiple predisposing risk factors and metabolic and structural defects in DBC models. This figure depicts the multiple predisposing risk factors, metabolic and our ultrastructural remodeling that we have shared regarding the neurovascular unit and glia including the astrocyte (AC), microglia, and oligodendrocyte in this three-part series. The blue ovals at the bottom of the image depict the multiple situations that might give rise to the remodeling changes and how they are related to each of the three-part series as Part I, Part II, and Part III publications as follows: Aging, lifestyle, environment, genetics—particularly the leptin receptor deficiencies in the DBC and also the numerous single nucleotide polymorphisms (SNPs) in humans, and comorbidities associated with obesity (metabolic syndrome and accelerated atherosclerosis). a.k.a: also known as; AD: Alzheimer’s disease; aMGC: activated microglia cell; BBB: blood-brain barrier; db/db: DBC; HTN: hypertension; IL-1β: interleukin 1 beta; IR: insulin resistance; NVU: neurovascular unit; OL: oligodendrocyte; PD: Parkinson’s disease; PKCβ: protein kinase C beta; R: receptor; ROS/RNS: reactive oxygen/reactive nitrogen species; SCWM: subcortical white matter; T2DM: type 2 diabetes mellitus; TGFβ: transforming growth factor beta; TNFα: tumor necrosis factor alpha; TZ: transition zone.
![Neuroglia 01 00024 g015]()


