
Quarkonia Formation in a Holographic Gravity–Dilaton Background Describing QCD Thermodynamics


1
Helmholtz-Zentrum Dresden-Rossendorf, 01314 Dresden, Germany
2
Institut für Theoretische Physik, TU Dresden, 01062 Dresden, Germany
*
Author to whom correspondence should be addressed.
Particles 2021, 4(2), 159-177; https://0-doi-org.brum.beds.ac.uk/10.3390/particles4020015
Submission received: 28 February 2021
/
Revised: 22 March 2021
/
Accepted: 30 March 2021
/
Published: 6 April 2021
Abstract
:A holographic model of probe quarkonia is presented, where the dynamical gravity–dilaton background was adjusted to the thermodynamics of 2 + 1 flavor QCD with physical quark masses. The quarkonia action was modified to account for the systematic study of the heavy-quark mass dependence. We focused on the and spectral functions and related our model to heavy quarkonia formation as a special aspect of hadron phenomenology in heavy-ion collisions at LHC.
1. Introduction
Heavy-quark flavor degrees of freedom are currently receiving strong interest as valuable probes of hot and dense strong-interaction matter produced by the heavy-ion collisions at LHC energies. The information encoded, e.g., in quarkonia (, ) observables, supplements penetrating electromagnetic probes and hard (jet) probes and the rich flow observables, thus complementing each other in characterizing the dynamics of quarks and gluons until the final hadronic states (cf., contributions in [1,2] for the state of the art). Since heavy quarks essentially emerge in early, hard processes, they witness the course of heavy-ion collision—either as individual entities or subjects of dissociating and regenerating bound states [3,4,5]. Accordingly, the heavy-quark physics addresses such issues as charm (c, ) and bottom (b, ) dynamics related to transport coefficients [6,7,8,9,10] in the rapidly evolving and highly anisotropic ambient quark–gluon medium [11,12] as well as and states as open quantum systems [13,14,15,16]. The rich body of experimental data from LHC, and also from RHIC, enabled a tremendous refinement of our understanding of heavy-quark dynamics. For a recent survey on quarkonium physics, we refer the interested reader to [17].
The yields of various hadron species, light nuclei and anti-nuclei—even such ones which are only very loosely bound [18]—emerging from heavy-ion collisions at LHC energies are described by the thermo-statistical hadronization model [19] with high accuracy. These yields span an interval of nine orders of magnitude. The final hadrons and nuclear clusters are described by two parameters: the freeze-out temperature MeV and a freeze-out volume depending on the system size or centrality of the collision. Due to the near-perfect matter–antimatter symmetry at top LHC energies, the baryo-chemical potential is exceedingly small, . It is argued in [19] that the freeze-out of color-neutral objects only happens in the demarcation region of hadron matter to quark–gluon plasma, i.e., of confined vs. deconfined strong-interaction matter. In fact, the lattice QCD results report a pseudo-critical temperature of MeV [20]—a value agreeing with the disappearance of the chiral condensates and the maximum of some susceptibilities. The key is the adjustment of physical quark masses and the use of 2 + 1 flavors [21,22], in short, QCD2 + 1(phys). Details of the (maybe accidental) coincidence of the deconfinement and chiral symmetry restoration are currently matters of debate [23], as is the formation of color-neutral objects out of the cooling quark–gluon plasma at . For instance, [24] advocates flavor-dependent freeze-out temperatures. Note that at no phase transition happens, rather the thermodynamics is characterized by a cross-over accompanied by a pronounced dip in the sound velocity.
Among the tools for describing hadrons as composite strong-interaction systems is holography. Anchored in the famous AdS/CFT correspondence, holographic bottom-up approaches have facilitated a successful description of mass spectra, coupling strengths/decay constants, etc. of various hadron species. While the direct link to QCD by holographic QCD-dual or rigorous top–down formulations are still missing, one has to restrict the accessible observables to explore certain frameworks and scenarios. We consider here a minimal framework within the Einstein–dilaton model class, which merges (i) QCD2 + 1(phys) thermodynamics, described by a dynamical holographic gravity–dilaton background, with (ii) holographic probe quarkonia. We envisaged a scenario which embodies the QCD thermodynamics of QCD2 + 1(phys) and the emergence of hadron states at at the same time. One motivation of our work was the exploration of a holographic model, which is in agreement with the above hadron phenomenology in heavy-ion collisions at LHC energies. Early holographic attempts [25,26,27] of hadrons at non-zero temperatures faced the problem of meson melting at temperatures significantly below the deconfinement temperature . Several proposals have been made [28,29,30,31] to determine rescue avenues which accommodate hadrons at and below . Otherwise, a series of holographic models of hadron melting without reference to QCD thermodynamics, e.g., [31,32,33,34,35,36,37,38,39,40], finds quarkonia states well above, at and below in agreement with lattice QCD results [41,42,43,44]. It is therefore tempting to account for the proper QCD-related background.
We followed [45,46,47,48] and modelled the holographic background by a gravity–dilaton set-up, i.e., without adding further fundamental degrees of freedom (as done, e.g., in [49,50] and Refs. therein (The influence of the tachyon dual to the quark condensate can be neglected for heavy mesons.)) to the dilaton, which was originally solely related to the gluon degrees of freedom [51]. That is, the dilaton potential was adjusted to QCD2 + 1(phys) lattice data. In the temperature region , the impact of the charm and bottom degrees of freedom on the quark–gluon–hadron thermodynamics is minor [52]. Thus, we considered quarkonia as test particles. If the gravity–dilaton background is considered to be unique, it is known that there would be no confinement at zero temperature [48]. As we show, this problem can be efficiently solved by a less intricate generalization of the standard action of the soft-wall model [53] inspired by [54] which evince a principle to bring together QCD thermodynamics and the confinement of test particles at zero temperature. Our emphasis is on the formation of quarkonia in a cooling strong-interaction environment mimicking conditions in heavy-ion collisions at LHC. Thereby, the quarkonia properties are described by spectral functions.
Our paper is organized as follows. In Section 2, the dynamics of the probe quarkonia is formulated and the coupling to the thermodynamics-related background is explained (the recollection of the gravity–dilaton dynamics and the consideration of special features are relegated to Appendix A). Numerical solutions in the charm () and bottom () sectors with respect to quarkonium’s spectral functions and systematic formation are dealt with in Section 3. The tested two-parameter Schrödinger potential facilitates bottomonium formation through the rapid squeezing of the spectral function towards a narrow quasi-particle state in a small temperature interval around . An analogous behavior is accomplished for charmonium by a three-parameter potential considered in Section 4. The squeezing of the charmonium spectral function extends over a somewhat longer temperature interval and requires a particular parameter setting. We summarize in Section 5.
2. Quarkonia as Probe Vector Mesons
The action of quarkonia as probe vector mesons in string frame is:
where the function carries the flavor (or heavy-quark mass, labeled by m) dependence and is the field strength tensor squared of a gauge field in 5D asymptotic anti-de Sitter (AdS) space time, with or without a black hole (BH), with the bulk coordinate z and metric fundamental determinant ; is the scalar dilatonic field with a zero mass dimension. The gauge field in the bulk was sourced by a current operator of the structure at the boundary, where Q stands for the heavy quark field operator. The structure of (1) is that of a field-dependent gauge kinetic term, familiar, e.g., from realizations of a localization mechanism in brane world scenarios [55,56,57].
The action (1) with , originally put forward in the soft-wall (SW) model for light-quark mesons [53], is also used for describing heavy-quark vector mesons [32,33,34], e.g., charmonium [35,36] or bottomonium [58]. As emphasized, e.g., in [35], the holographic background encoded in and must be chosen differently to imprint the different mass scales, since (1) with as such would be flavor blind. Clearly, the combination in (1) with flavor-dependent function is nothing but effectively introducing a flavor-dependent dilaton profile , while keeping the thermodynamics-steered hadron-universal dilaton . In fact, many authors use the form to study the vector meson melting by employing different parameterizations of to account for different flavor sectors. Here, we emphasize the use of a unique gravity–dilaton background for all flavors and include the quark mass (or flavor) dependence solely in .
Our procedure to determine was based on the import of information from the hadron sector at . The action (1) leads via the gauges and and the ansatz with , which uniformly separates the z dependence of the gauge field by the bulk-to-boundary propagator for all components of , and the constant polarization vector to the equation of motion:
where is the warp factor and denotes the blackening function in the AdS + BH metric with a horizon at :
and a prime denotes the derivative with respect to the bulk coordinate z. Both and are solutions of Einstein’s equation with a dilatonic potential adjusted to QCD thermodynamics with physical quark masses in the temperature range 100 MeV 400 MeV (cf., Appendix A in [59] and Appendix A for more details); is also dynamically determined and is consistent with the metric coefficients via field equations.
By the transformation one gets the form of a one-dimensional Schrödinger equation with the tortoise coordinate :
where one has to employ from solving . The Schrödinger equivalent potential is:
as a function of with:
At (label “0”), and and with:
and (4) becomes:
with normalizable solutions and discrete states with masses squared , for quarkonia at rest. That is, at , one has to deal with a suitable Schrödinger equivalent potential to generate the desired spectrum . In such a way, the needed hadron physics information at is imported by parameterizing in a suitable manner (see Section 3 and Section 4).
The next step is solving (7) to obtain and with (8), then with . This procedure requires the knowledge of the warp factor and the dilaton profile , which are determined by Equations (A2)–(A4) in Appendix A. The governing dilaton potential in turn is found by an adjustment to lattice QCD data. On the one hand, at MeV, there are nearly no lattice QCD data of the needed thermodynamic quantities, such as sound velocity and entropy etc., at our disposal. On the other hand, at MeV the rich body of lattice QCD data has, despite the great progress made, still non-negligible error bars. We therefore must assume that the ansatz (A5) delivers an adequate representation of the QCD input (see Figure 5-left in [59] for the sound velocity squared). Leaving a dedicated investigation of the potential impact of variations of under constraints of lattice QCD thermodynamics data for follow-up work, we then used the so determined as universal (i.e., temperature-independent) function.
The equation of motion (2) of can also be employed to compute quarkonia spectral functions, cf., [25,33,34,35,60]. For fixed, the asymptotic boundary behavior facilitates two linearly independent solutions by considering the leading order terms on both sides of the interval . (i) For , one has, due to the AdS asymptotics at the boundary, the general solution is:
with two -dependent complex constants A and B, and and ; (ii) near the horizon, , the asymptotic behavior of solutions of (2) is steered by the poles of and . The two linearly independent solutions are , where represent out-going and in-falling solutions, respectively. The obvious and commonly used side conditions for the bulk-to-boundary propagator are , which means , and (purely in-falling solution at the black hole horizon).
Then, the corresponding retarded Green function of the dual current operator , defined within the framework of the holographic dictionary via a generating functional by , is given by (cf., [61])
with and for . The quantity denotes here the action (1) with the solution from (2). Finally, the spectral function follows from .
3. Two-Parameter Potential—Bottomonium Formation
Our setting does not explicitly refer to a certain quark mass m. Instead, an ansatz with a parameter n-tuple was used such to catch a certain quarkonium mass spectrum. Therefore, m is to be considered as a cumulative label highlighting the dependence of on a parameter set which originally enters and which is to be adjusted to the charmonium and bottomonium masses observed in nature.
As a transparent model, we select the two-parameter potential [33,35]:
which is known to deliver via (9) the normalizable functions with discrete eigenvalues:
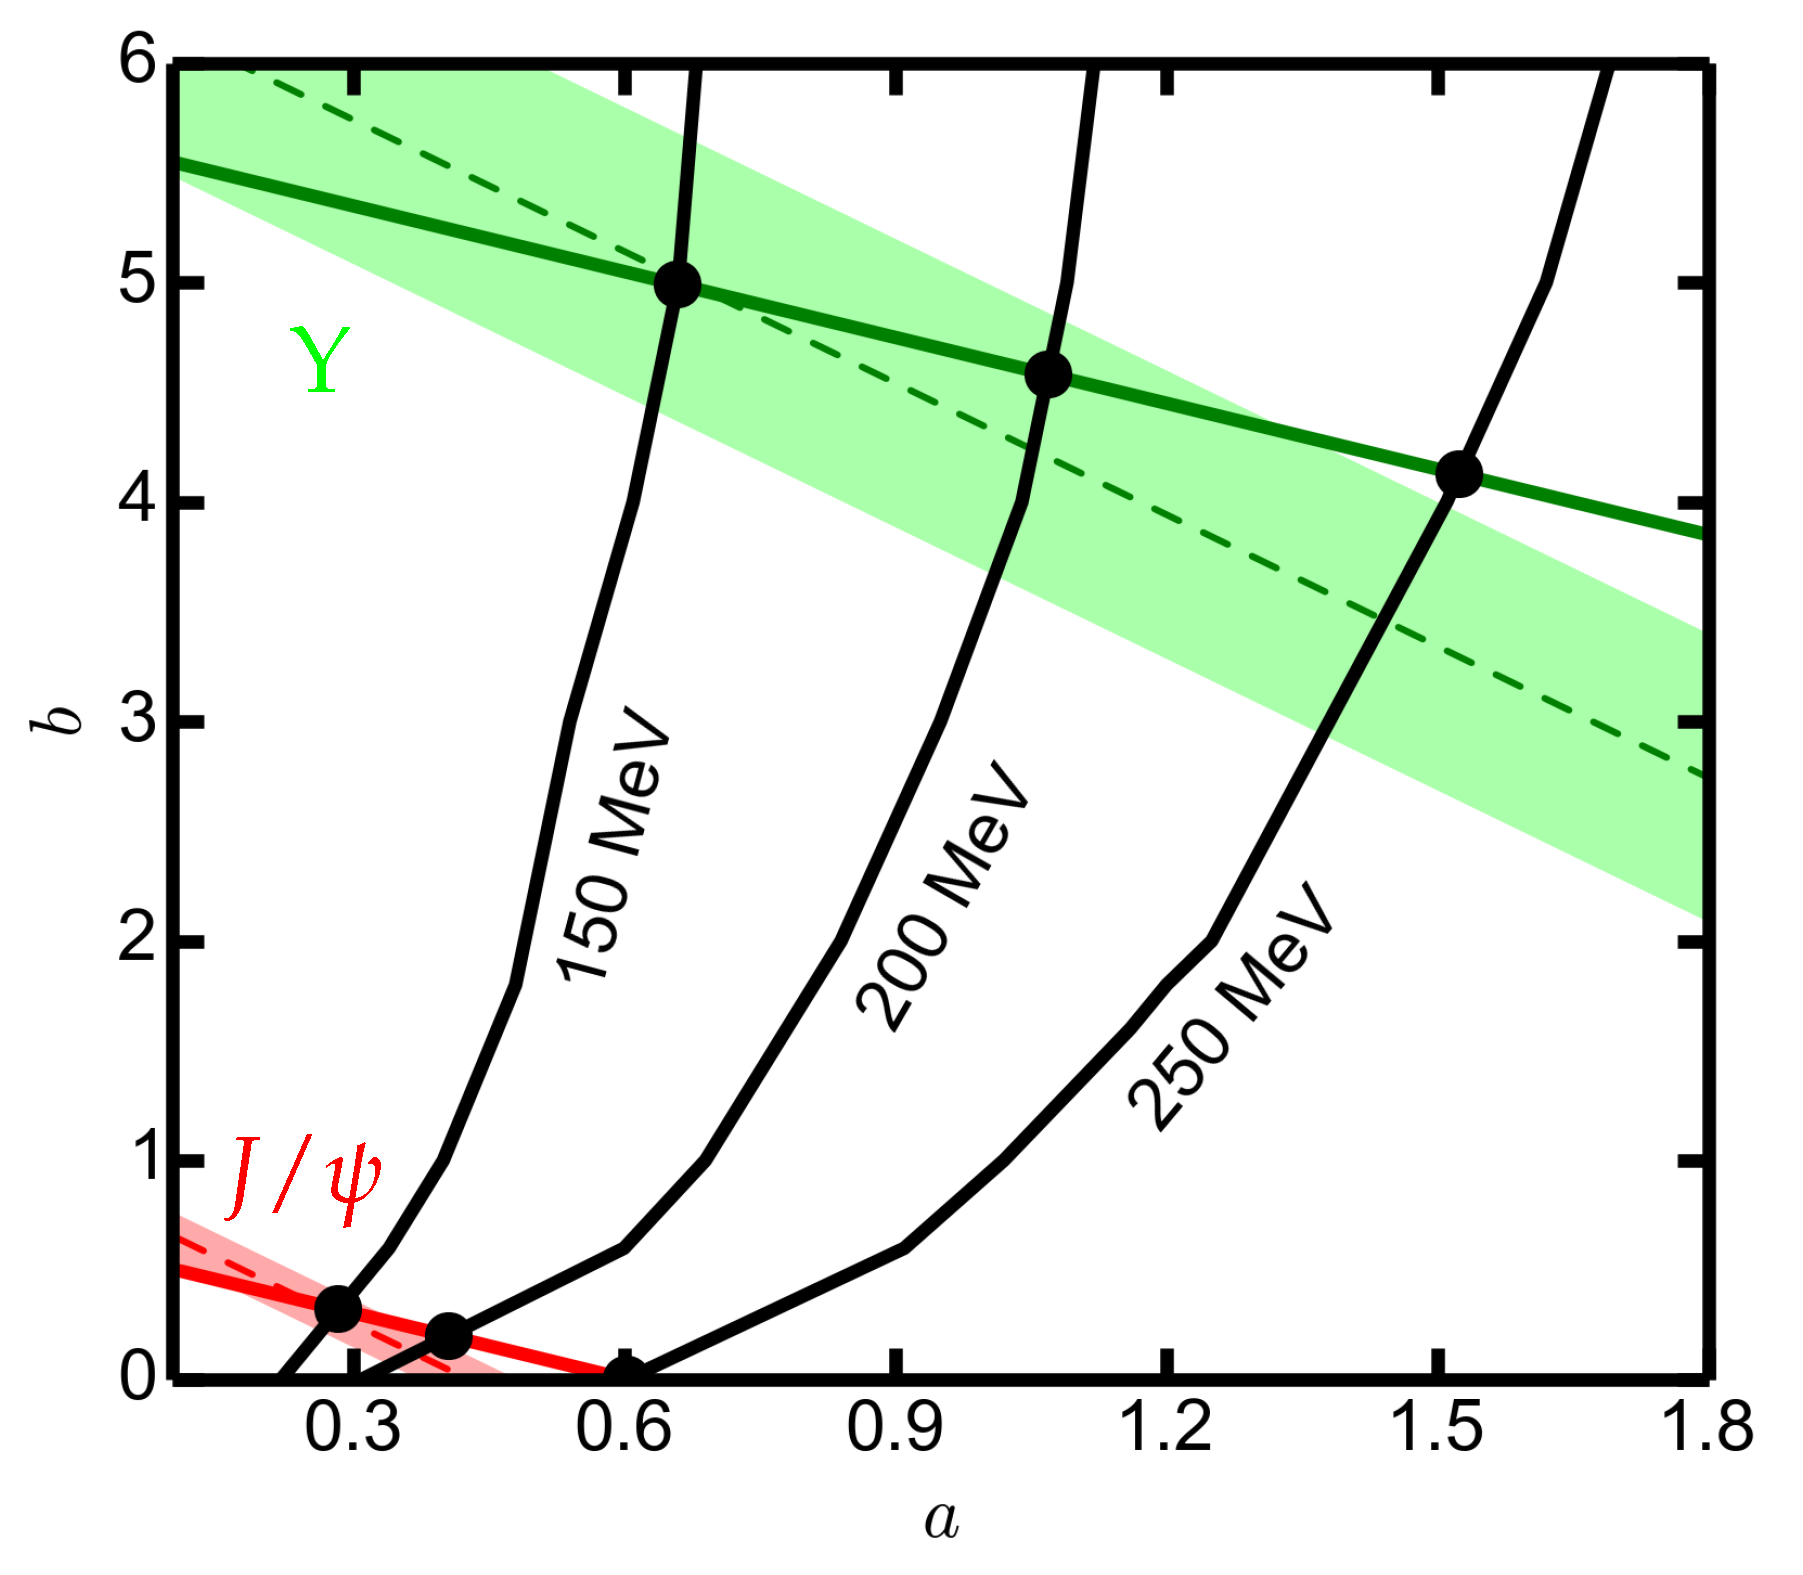
The potential (12) is a slight modification of the SW model [53]. We choose these parameters as follows. The mass determines the ground state (g.s.) “trajectory” in the a-b plane, , and determines the first excitation (1st) “trajectory” by . Using the PDG values of and adjusts the “trajectories” as solid and dashed lines in Figure 1, where we employ the scale setting with GeV, which is related to the QCD thermodynamics sector (see Appendix A in [59]). Allowing for a 10% variation of , one arrives at the colored bands in Figure 1. By such a parameter choice, one places emphasis on the quarkonia g.s. masses as representatives of the heavy quark masses and less emphasis on the level spacing of excitations and ignores other possible constraints.
As we shall demonstrate below, the ansatz (12) has several drawbacks, and therefore, is to be considered as an illustrative example. For instance, the sequence of radial excitations in nature does not form a strictly linear Regge trajectory [62]. This prevents an unambiguous mapping of . While the radial excitations of follow quite accurately a linear Regge trajectory in nature [62], the request for accommodating further properties in also calls for modifying (12), cf., [35,60]. Despite the mentioned deficits, the appeal of (12) and (13) is nevertheless the simply invertible relation yielding and . Since we are going to study the systematic, we retain the primary parameters a and b in what follows. Instead of discussing the results at isolated points in parameter space referring to and ground states and first excited states , we consider the systematic over the a-b plane.
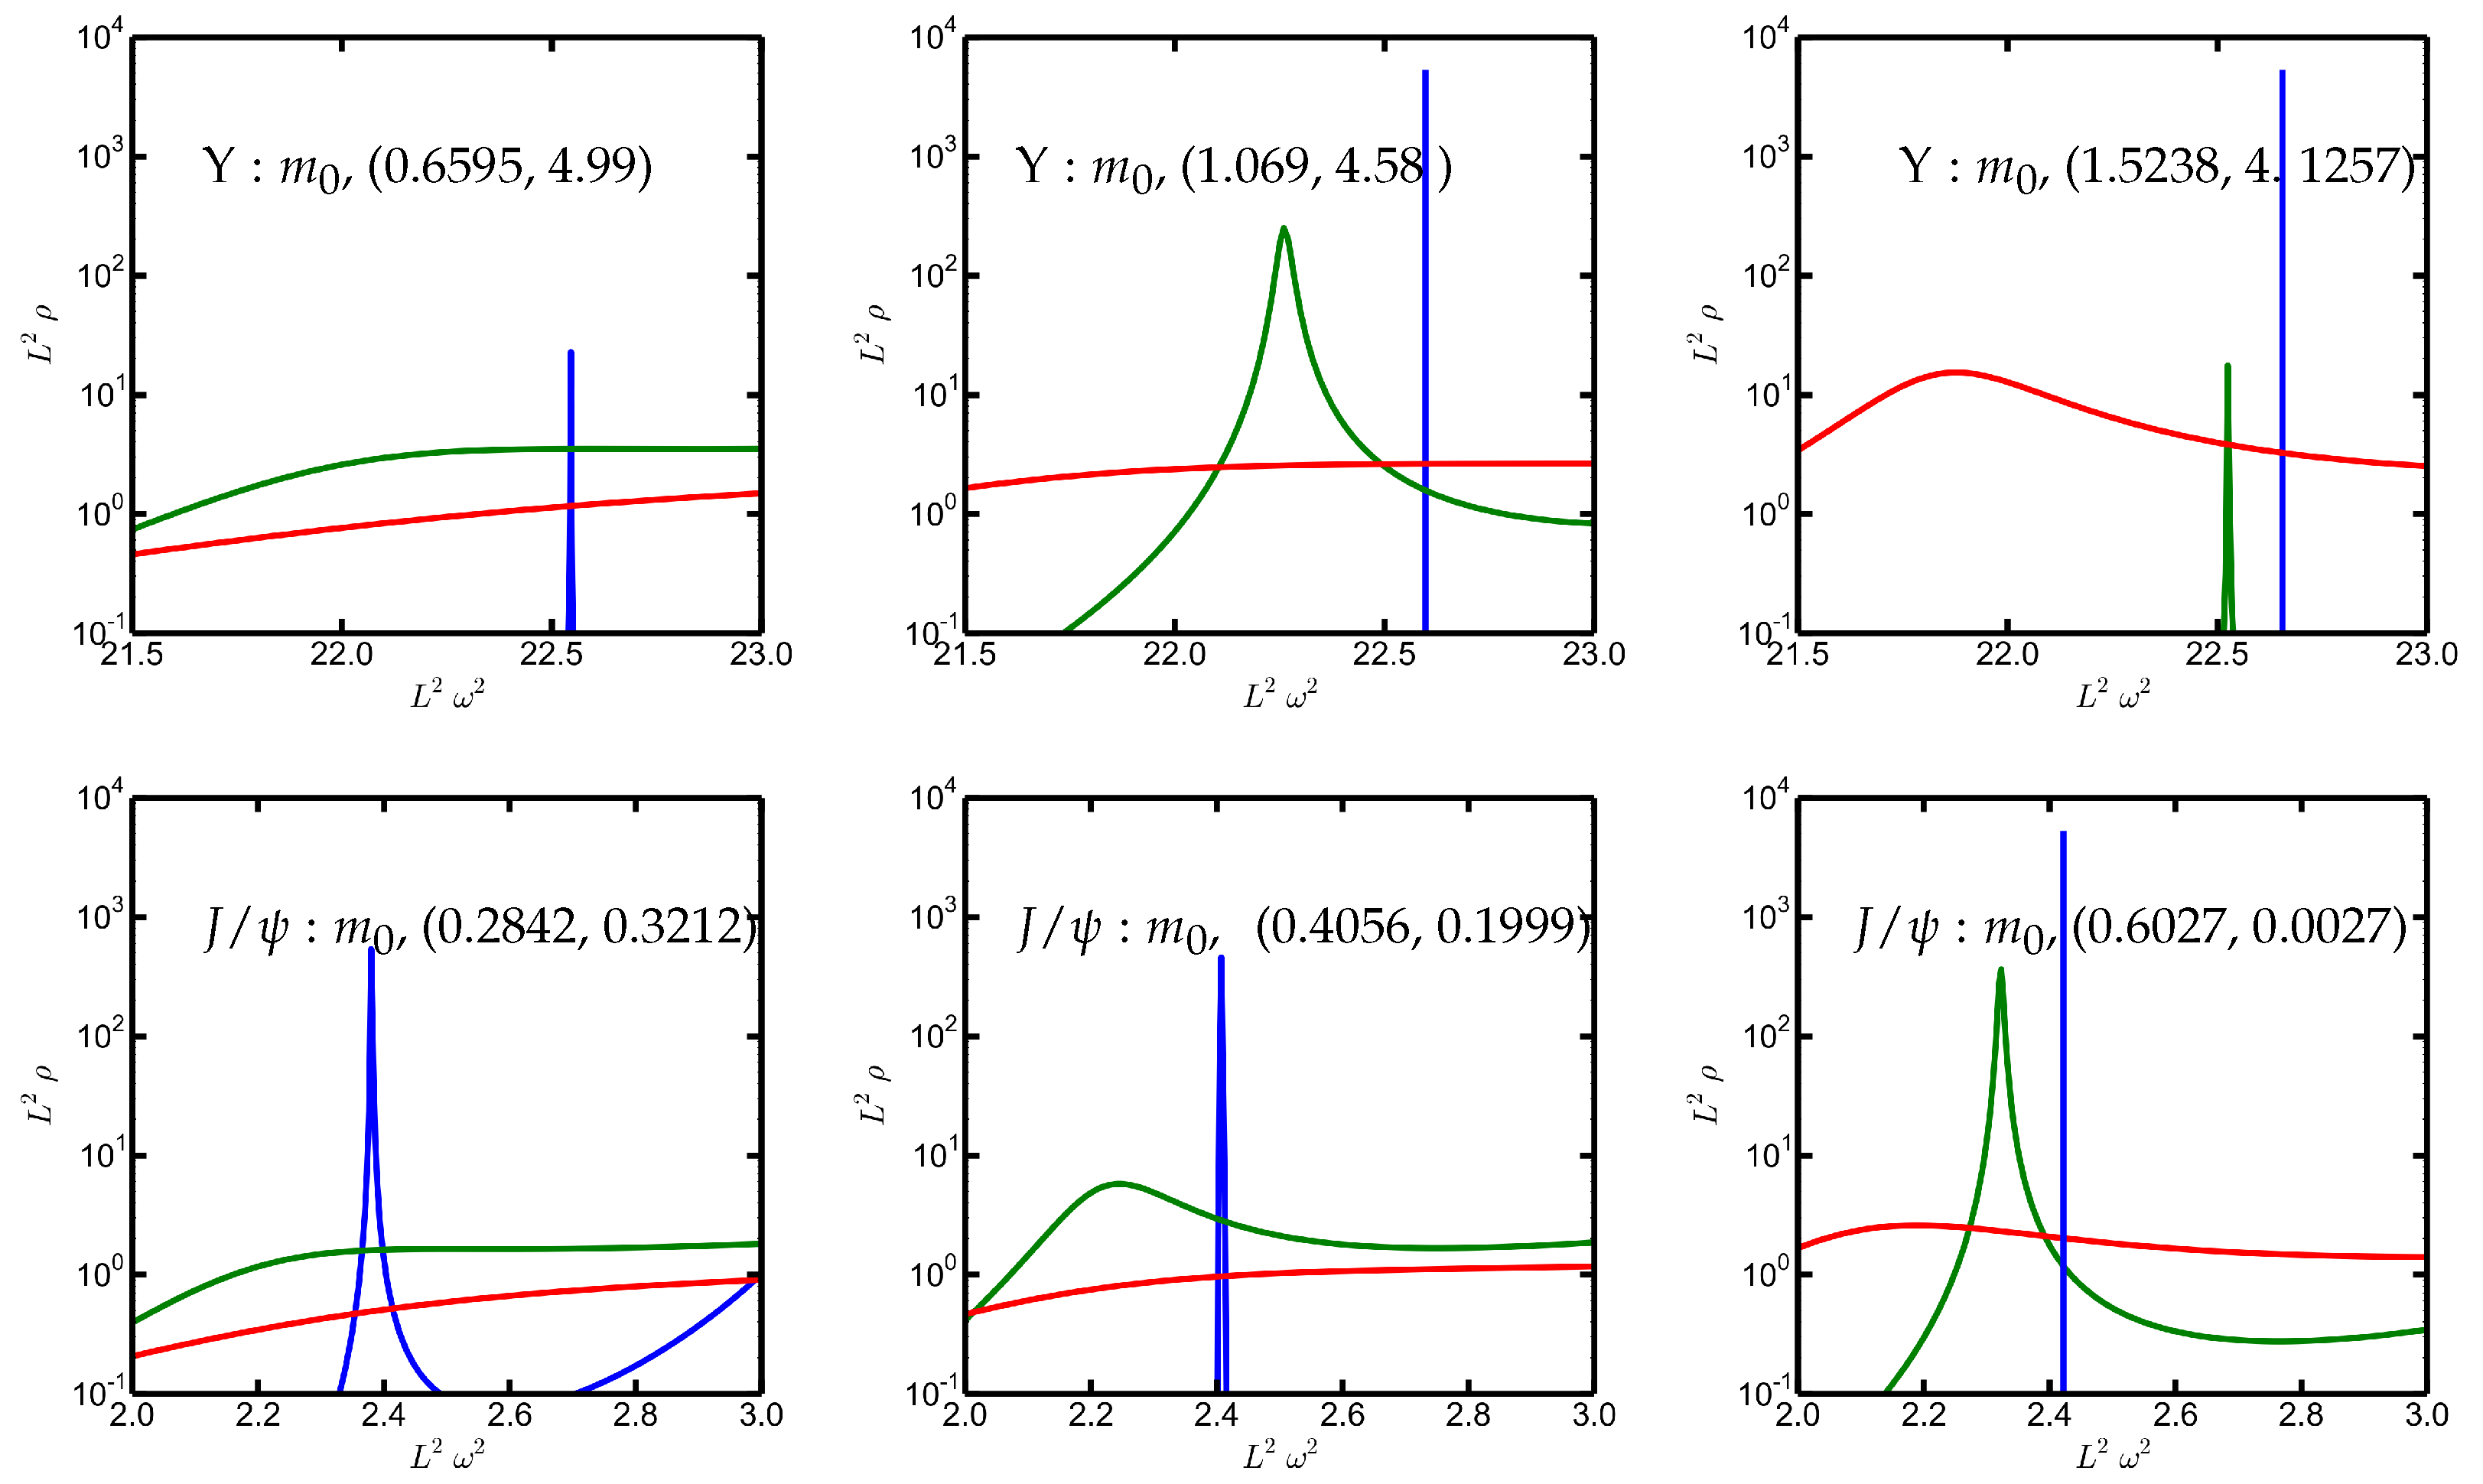
The black curves in Figure 1 exhibit the contours , 200, and 250 MeV. The melting temperature is determined by the disappearance of the peak of the g.s. spectral function upon the temperature increase. One observes a strong parameter dependence as well, which determines the spectral functions, as can be seen in Figure 2. Changing the parameters deforms the potential (12) in a characteristic manner [59], e.g., going on a g.s. trajectory to the right squeezes the excited states to higher energies, as can be identified in Figure 1, in particular for the . Such changes immediately affect the spectral functions.
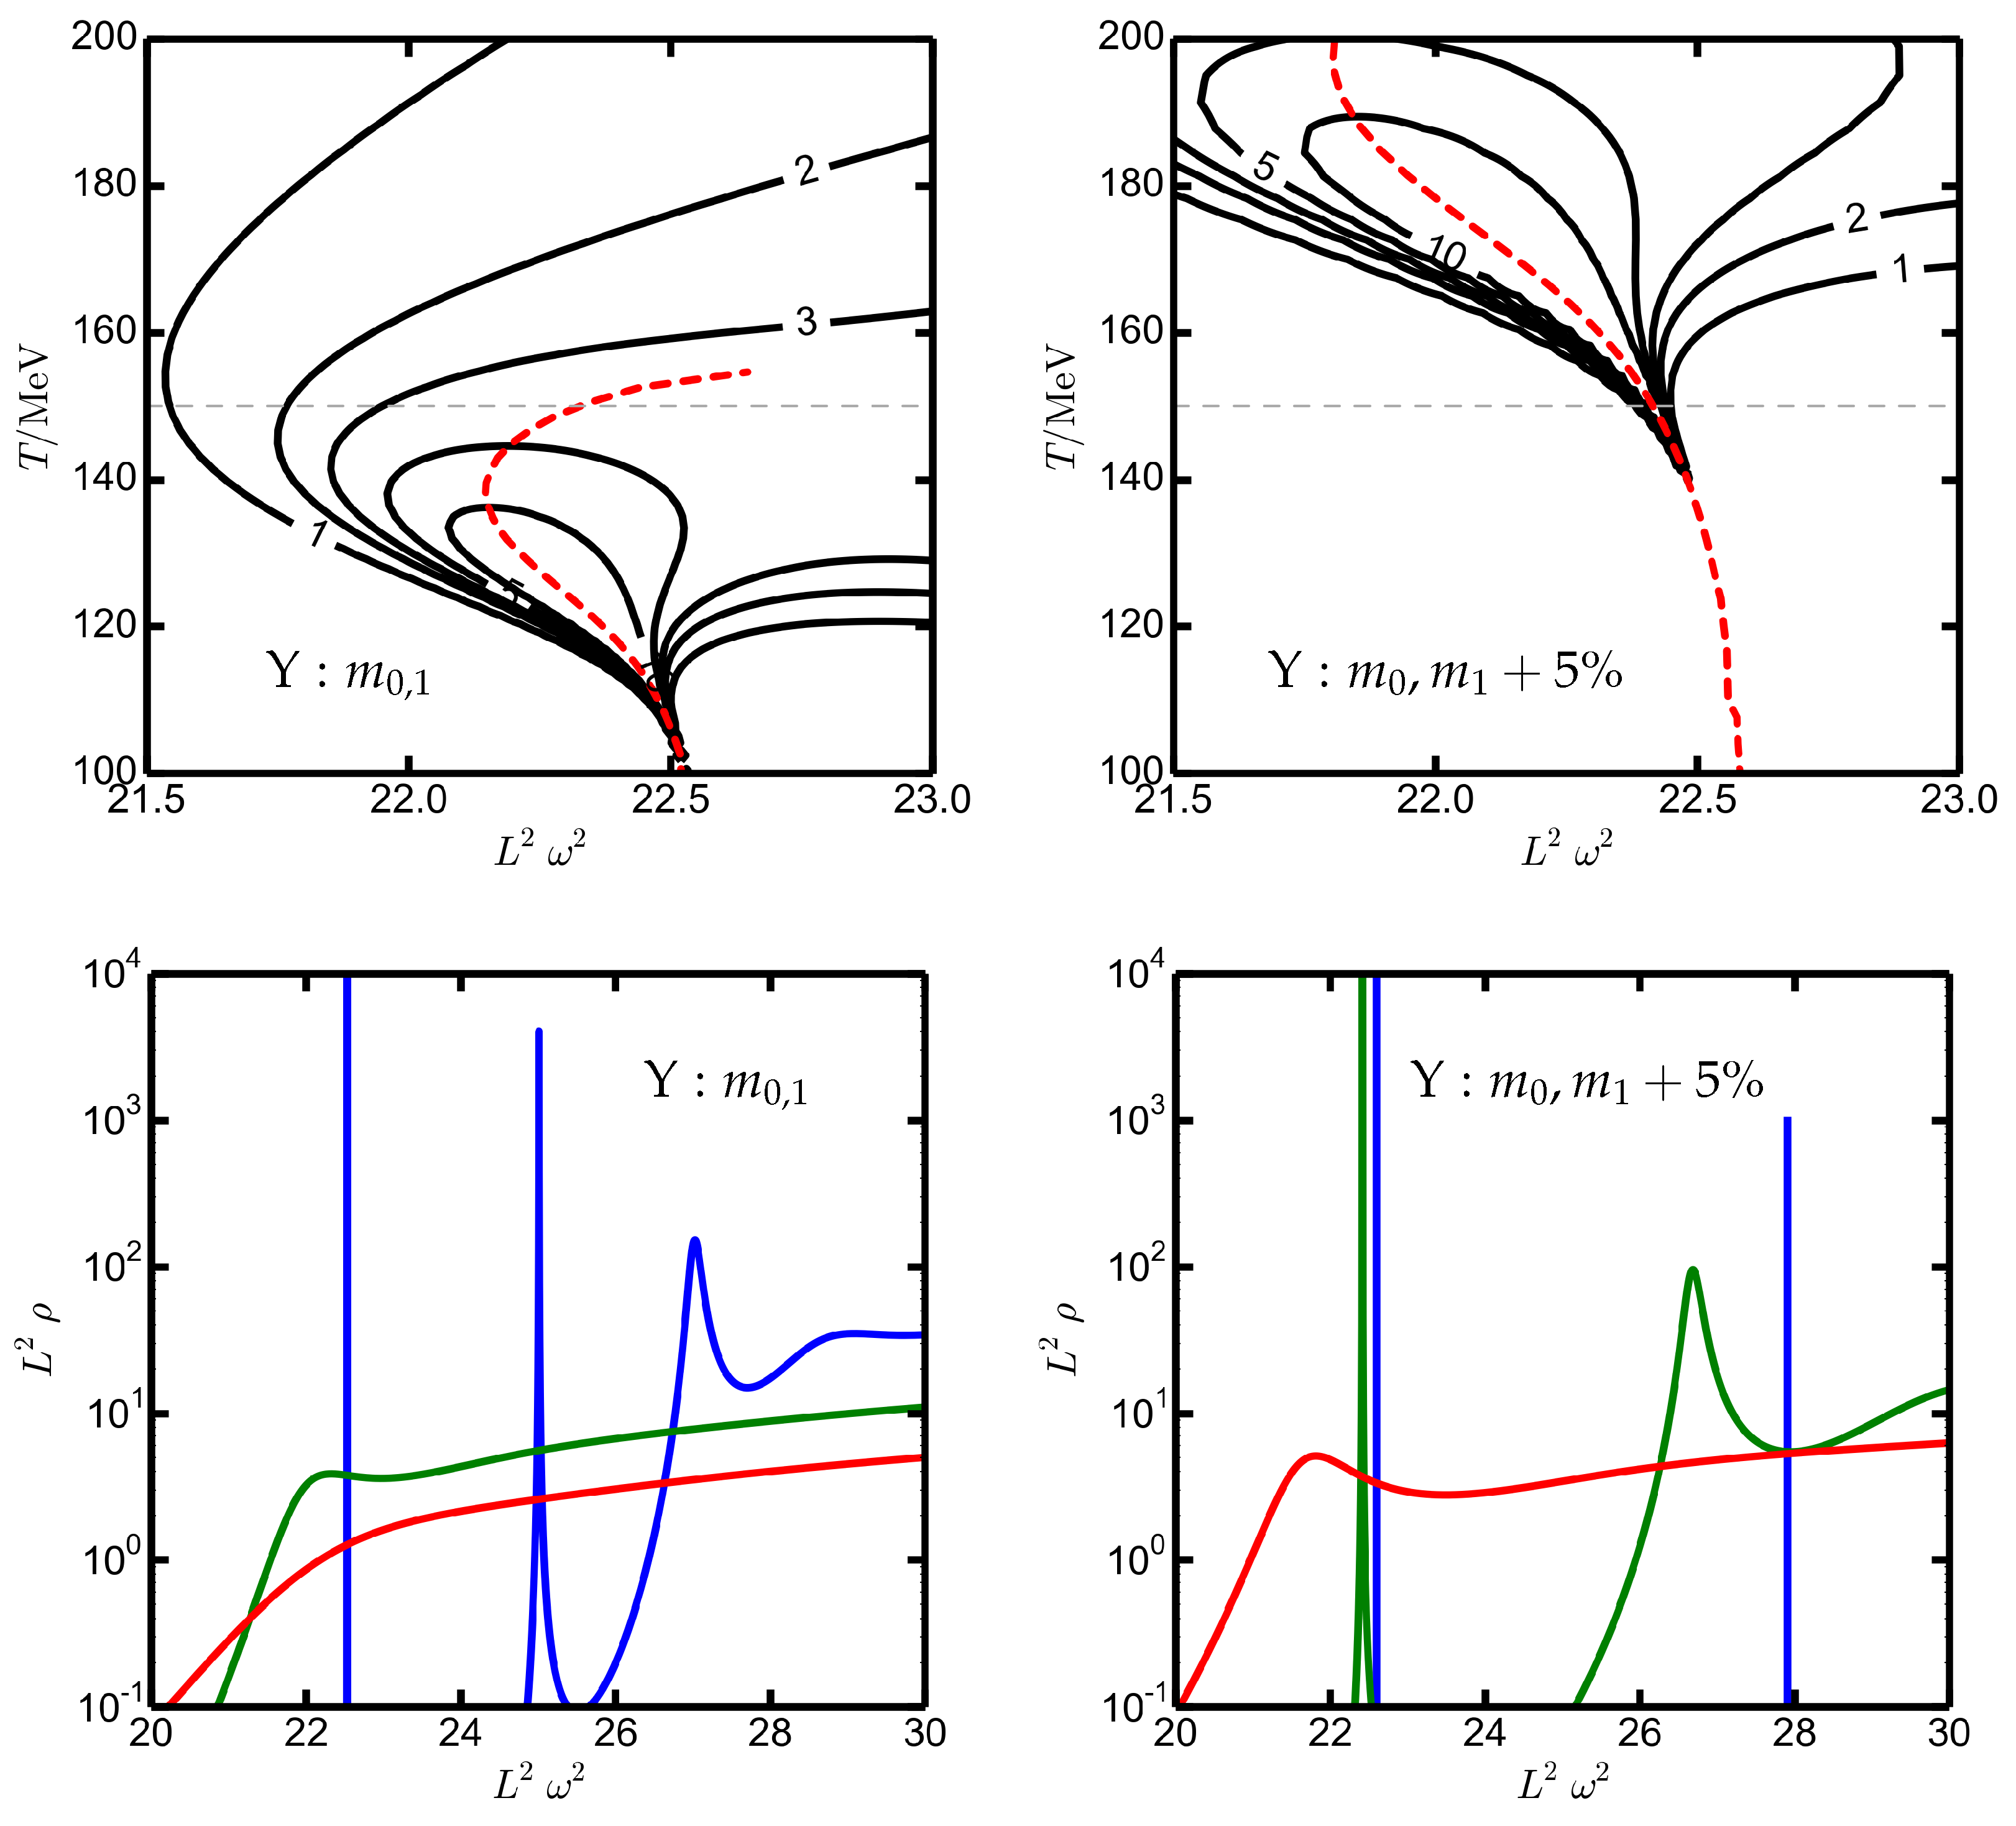
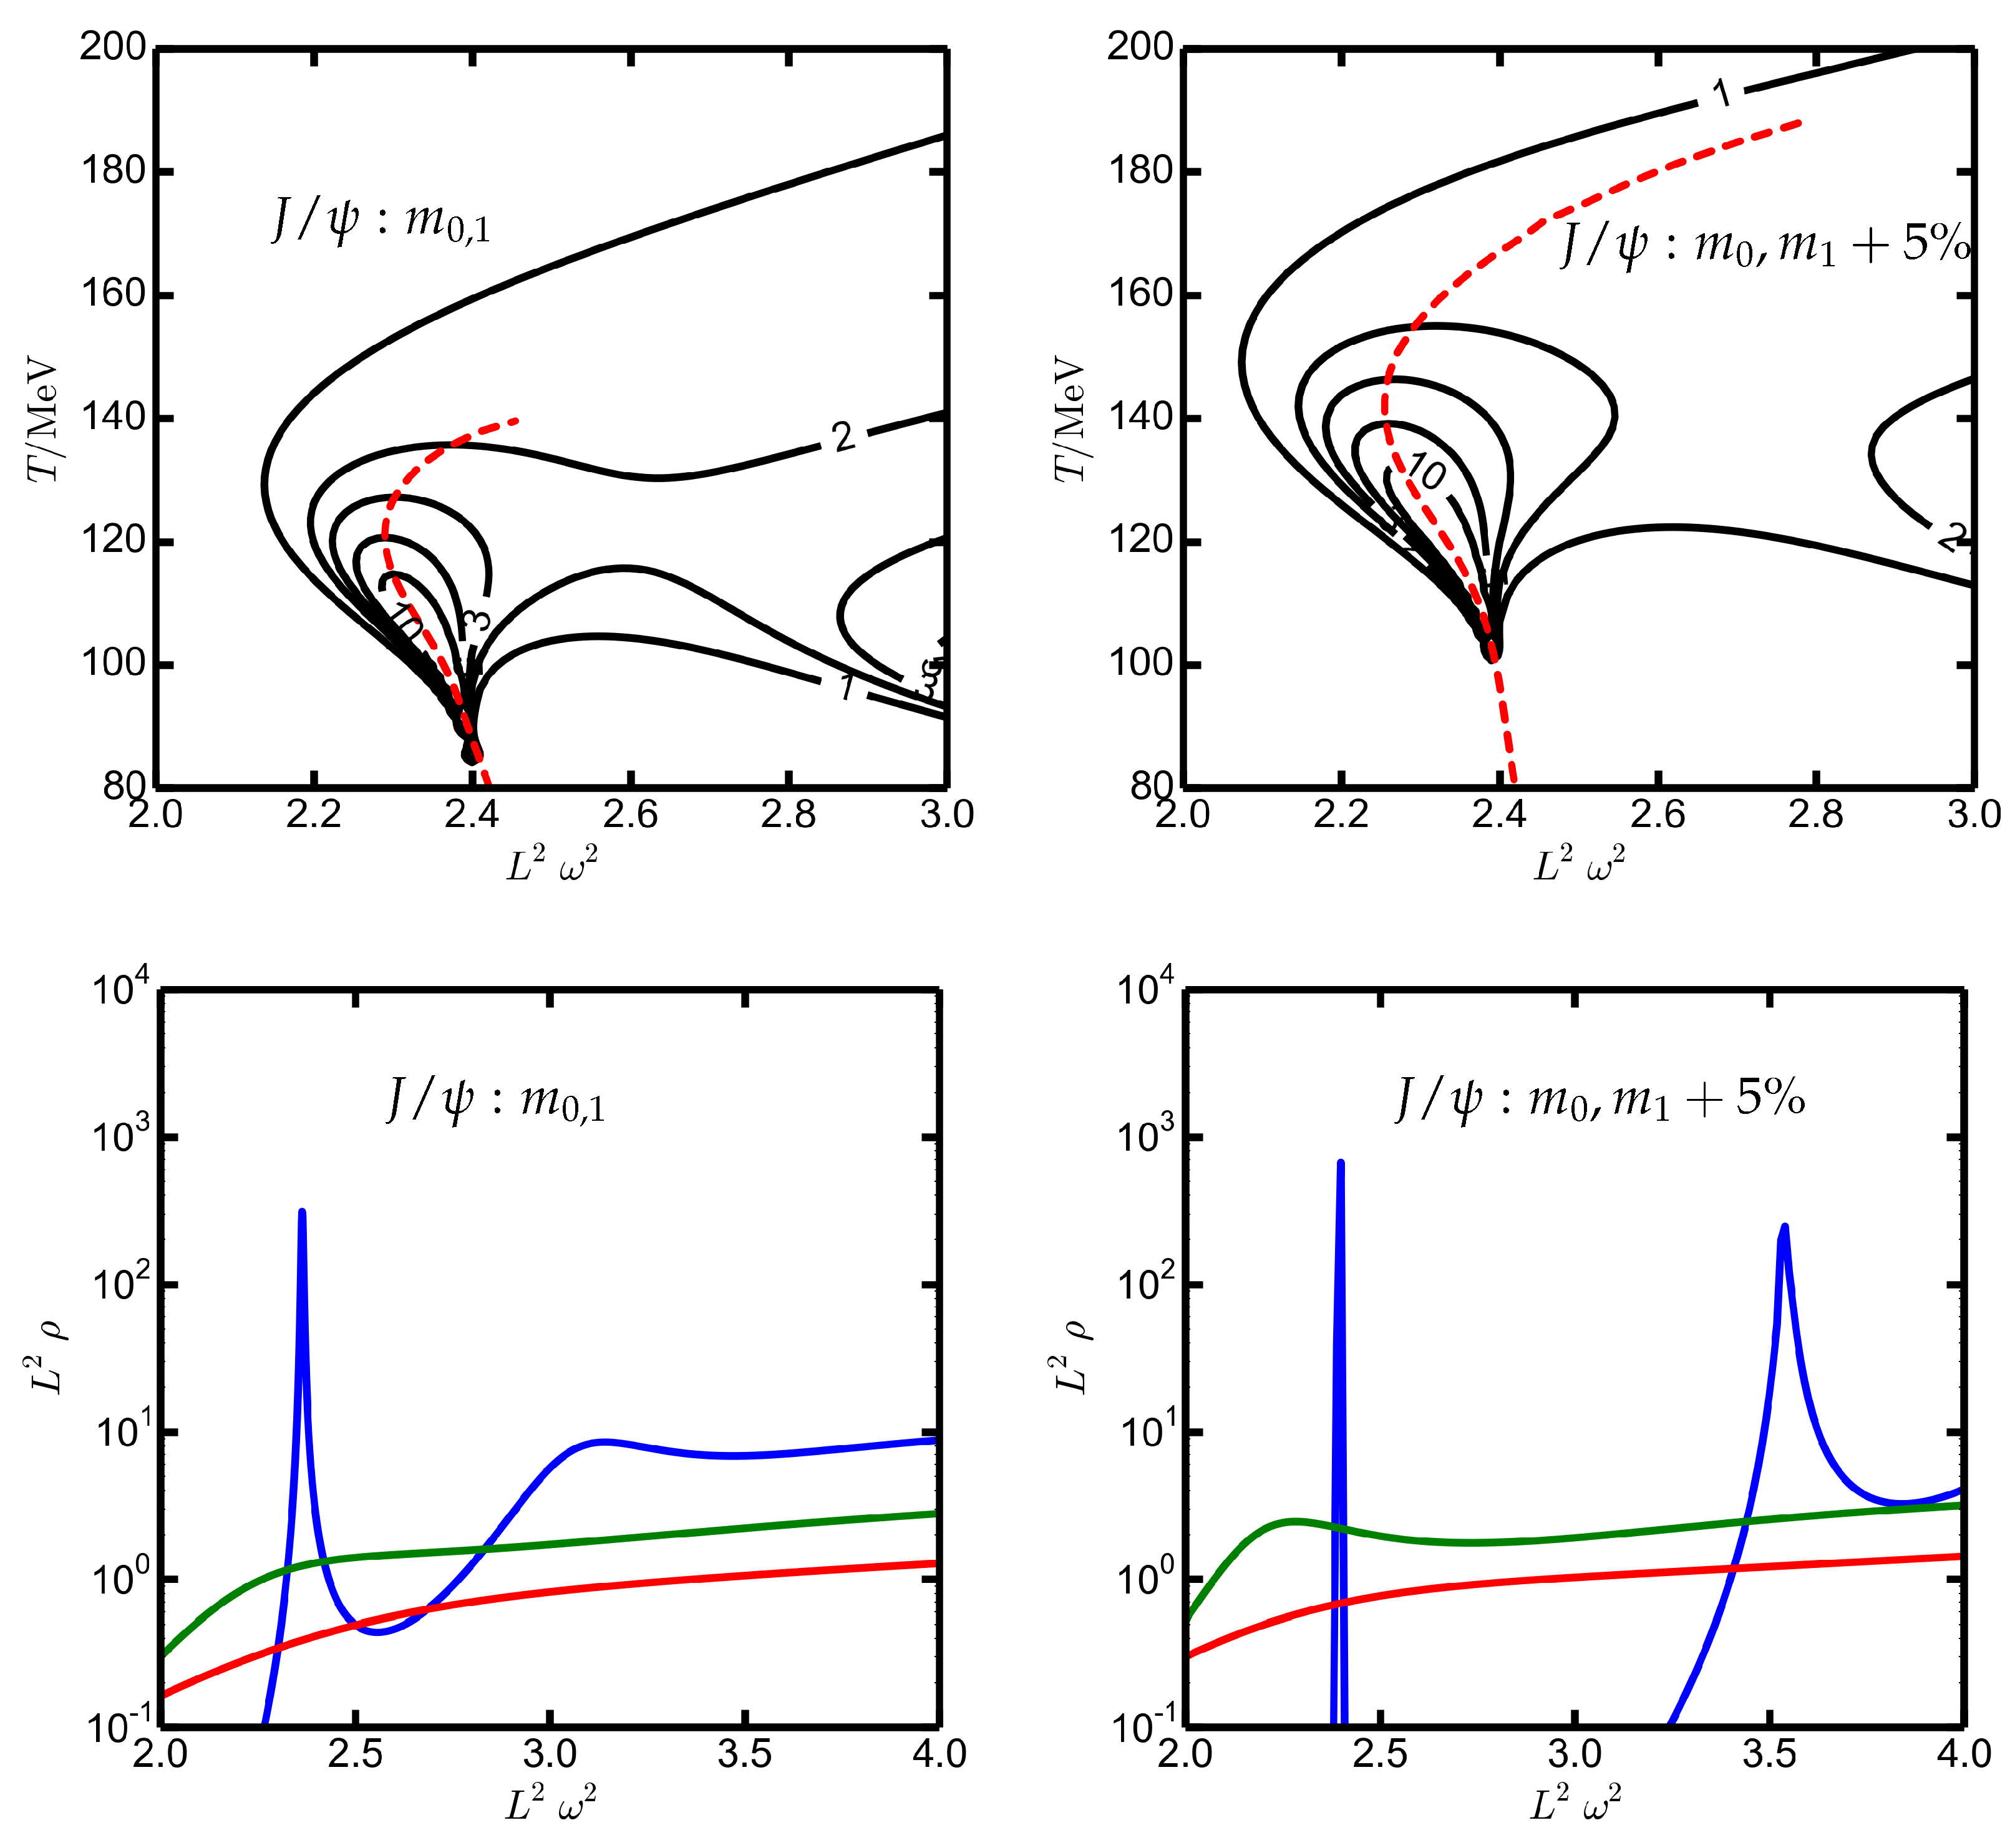
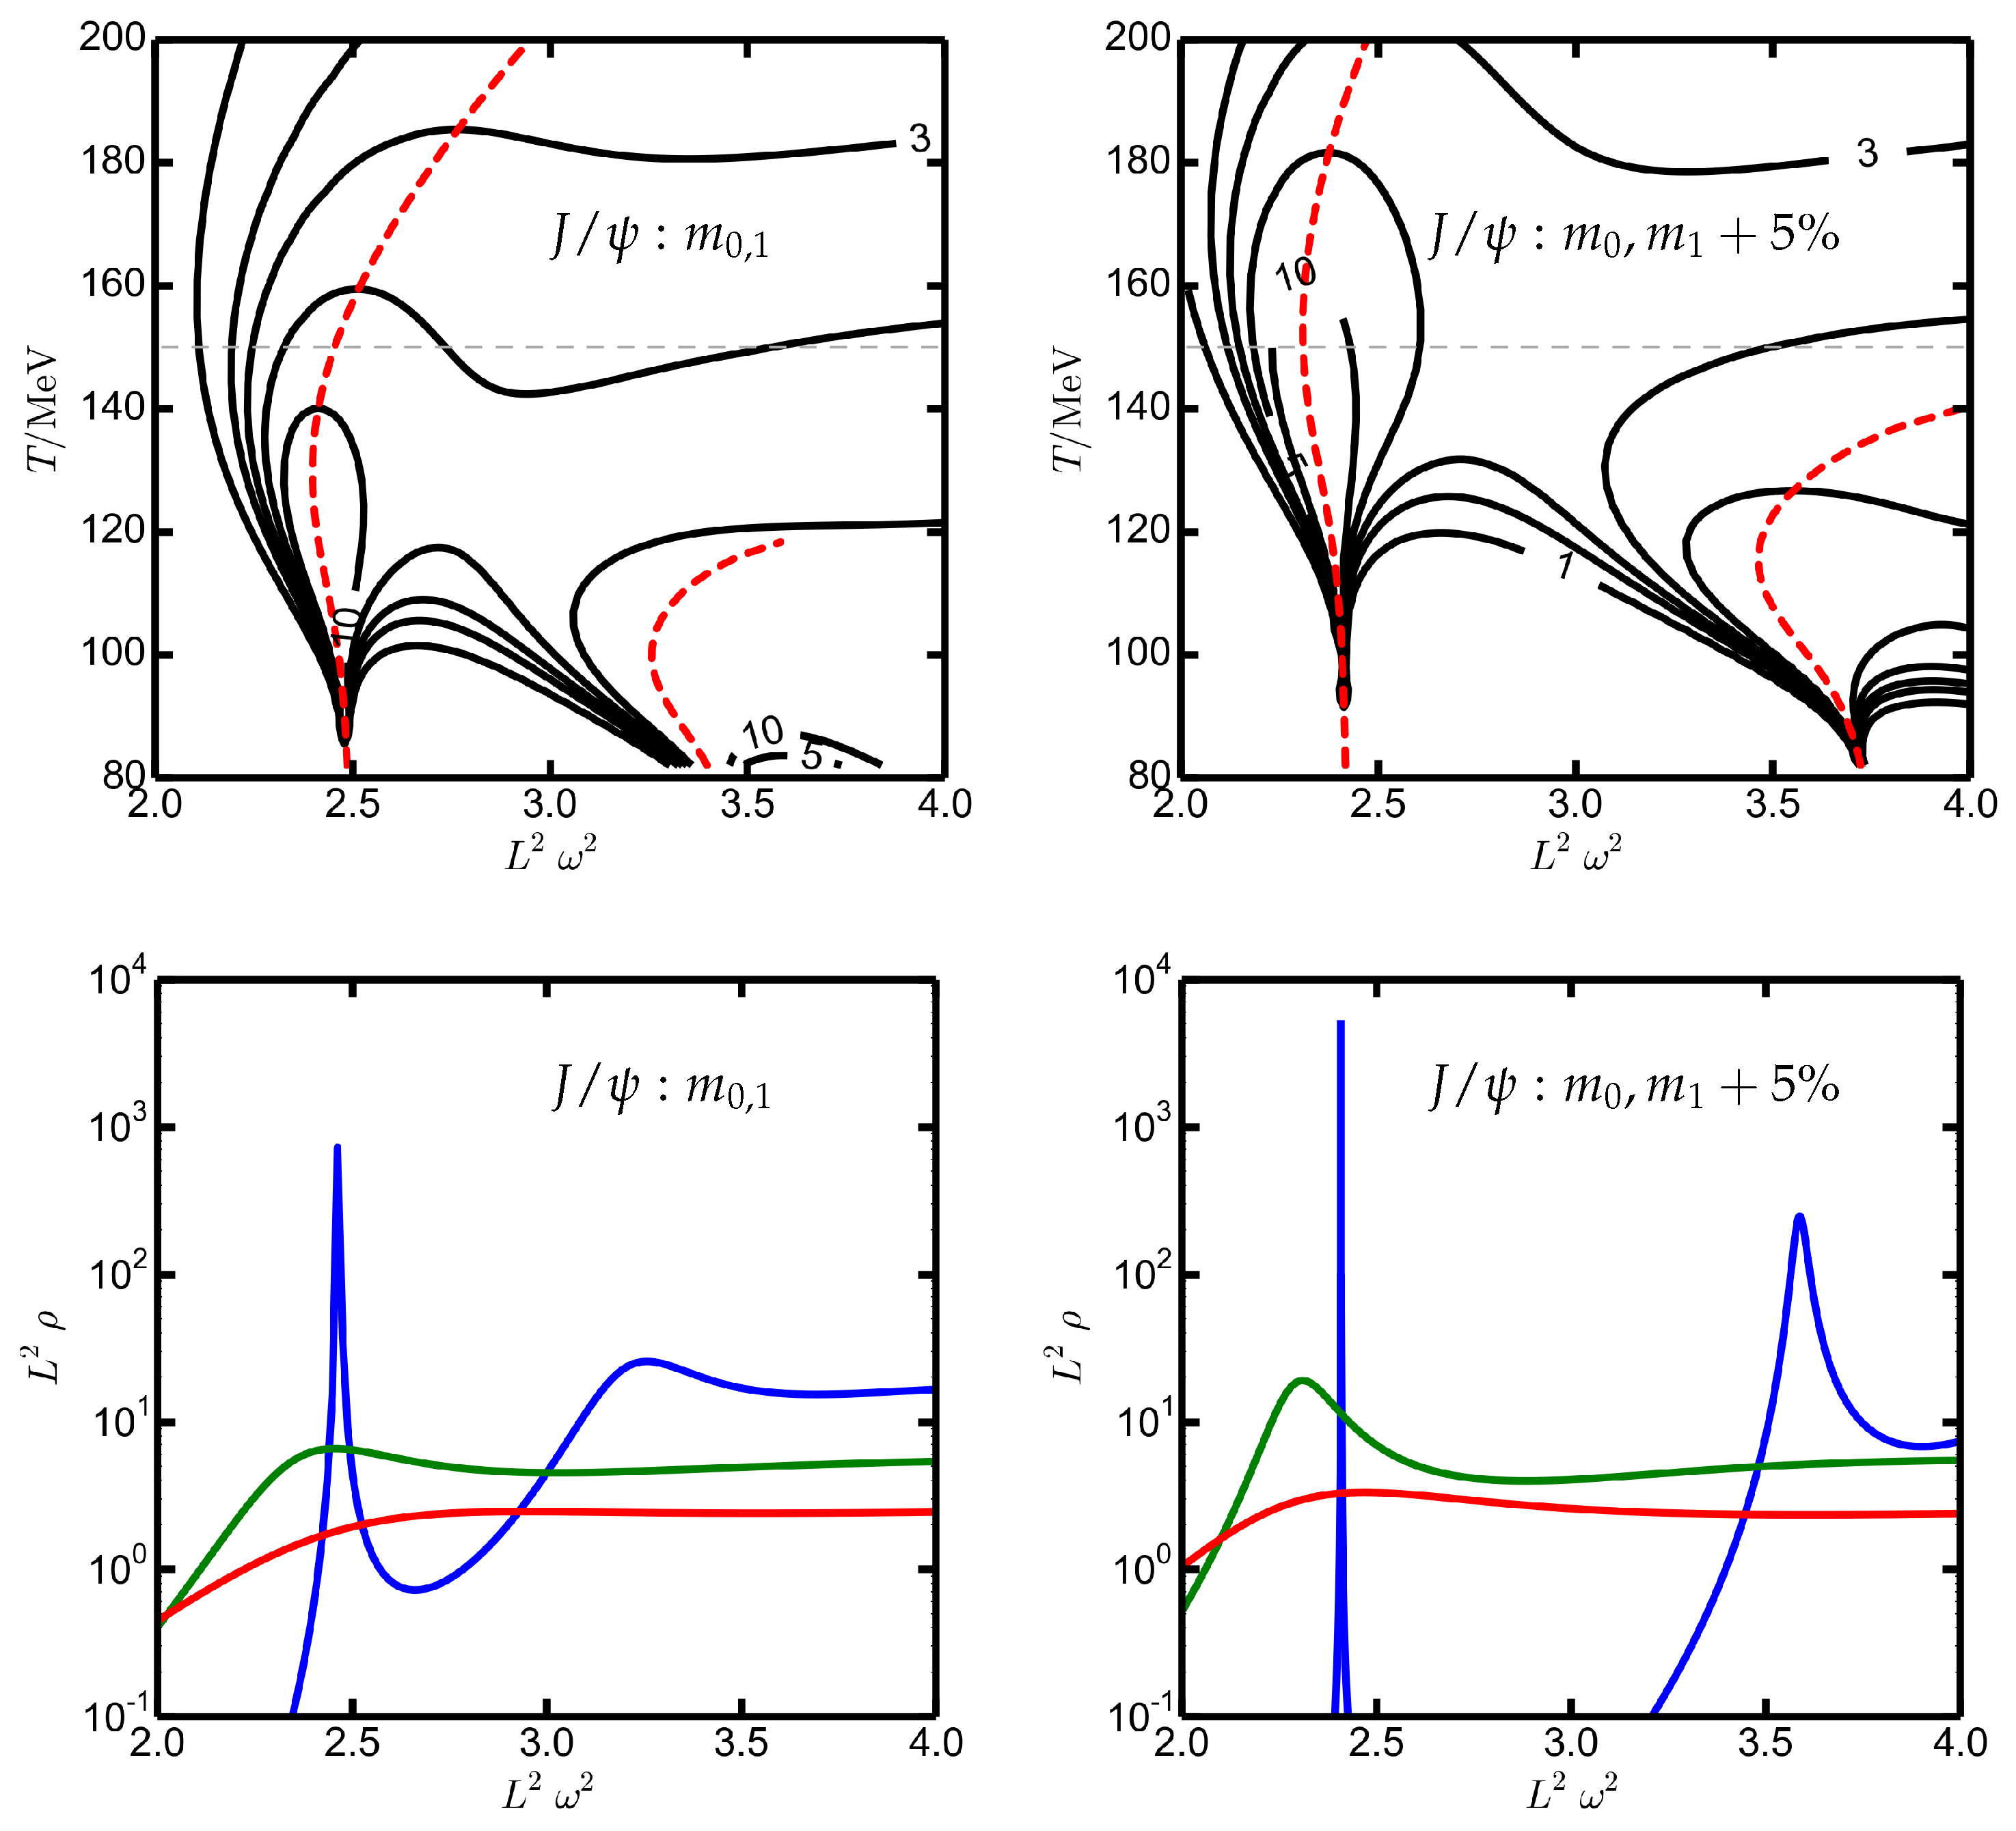
In Figure 1, it looks like an accidental coincidence that, at the crossing points of the g.s. and first excitation trajectories of and , the melting temperature is 150 MeV. In other words, in a cooling system, the formation of the quarkonium ground state seems to start when passing the temperature of 150 MeV. This is consistent with the claim in [19] which advocates the formation of hadron states at . Consistency does not necessarily mean perfect agreement. The criteria for “melting” or “onset of formation” are not very precise. For instance, [60] uses the relative high of the spectral function’s peak over the smooth background as a threshold value to define “melting”. The transition to a quasi-particle with sharp spectral function does not happen instantaneously but within some temperature span, as can be seen in the top panels in Figure 3 and Figure 4. Considering the dynamics of the cooling system as a sequence of equilibrium states, the spectral-function contour-plots in Figure 3 and Figure 4 are suggestive: upon cooling, the strength of a hadron state is consecutively concentrated to a narrow energy range, eventually forming the quasi-particle. Displaying a spectral function at a few selected temperatures, as in Figure 2, and bottom panels of Figure 3 and Figure 4 as well, only insufficiently illustrates such a feature but is useful for a more quantitative account.
The inspection of the top panels of Figure 3 and Figure 4 unravels that the temperature difference from until the formation of a sharp quasi-particle state is quite large. Sharp quasi-particles can be identified by the squeezed contour lines which eventually nearly coincide with the peak position of the spectral functions depicted by the red dashed curves in the top panels of Figure 3 and Figure 4. Keeping the quarkonia ground state masses and artificially allowing for a somewhat larger value of the first excited state moves the quarkonia formation temperatures to larger values, in particular for , as can be seen in the right panels in Figure 3. In such a way, the quasi-particle formation temperature copes with the claim in [19] of hadron formation at . The , in contrast, would be formed at (see Figure 4) in conflict with the advertisement of [19]. Section 4 provides a potential ansatz which accomplishes .
To understand why the () reacts so sluggishly (violently) on a modification of while keeping fixed, we mention that the parameter a in (12) changes by 33% (92%, i.e., a factor of nearly two) upon a 5% increase in , (due to the non-linearity of the bottomonium Regge trajectory, the energy of % is between the and states. For charmonium, in contrast, % is well below the state, cf., [62].) which is to been seen in connection with the curvature of at the minimum . The more the potential is squeezed by parameter variation, e.g., by larger values of , the less sensitive the temperature of is , as can be seen in Figure 2 in [59] and Figure 6 below. At the origin of these differences is the ratio of which is 1.42 for and 1.12 for , respectively. It enters the scaled potential (12) solely as a parameter.
A second issue refers to the formation of excited states. It seems to be a generic feature of the holographic model class considered here that higher excited states would form at lower temperatures than the respective g.s.—in particular , as can be seen in the bottom panels in Figure 3 and Figure 4. The conjecture of [19], in contrast, advocates . This feature is to be seen in relation to the considered ansatz of with the IR behavior : a much steeper increase in at larger values of z would concentrate the melting temperatures in a narrow corridor.
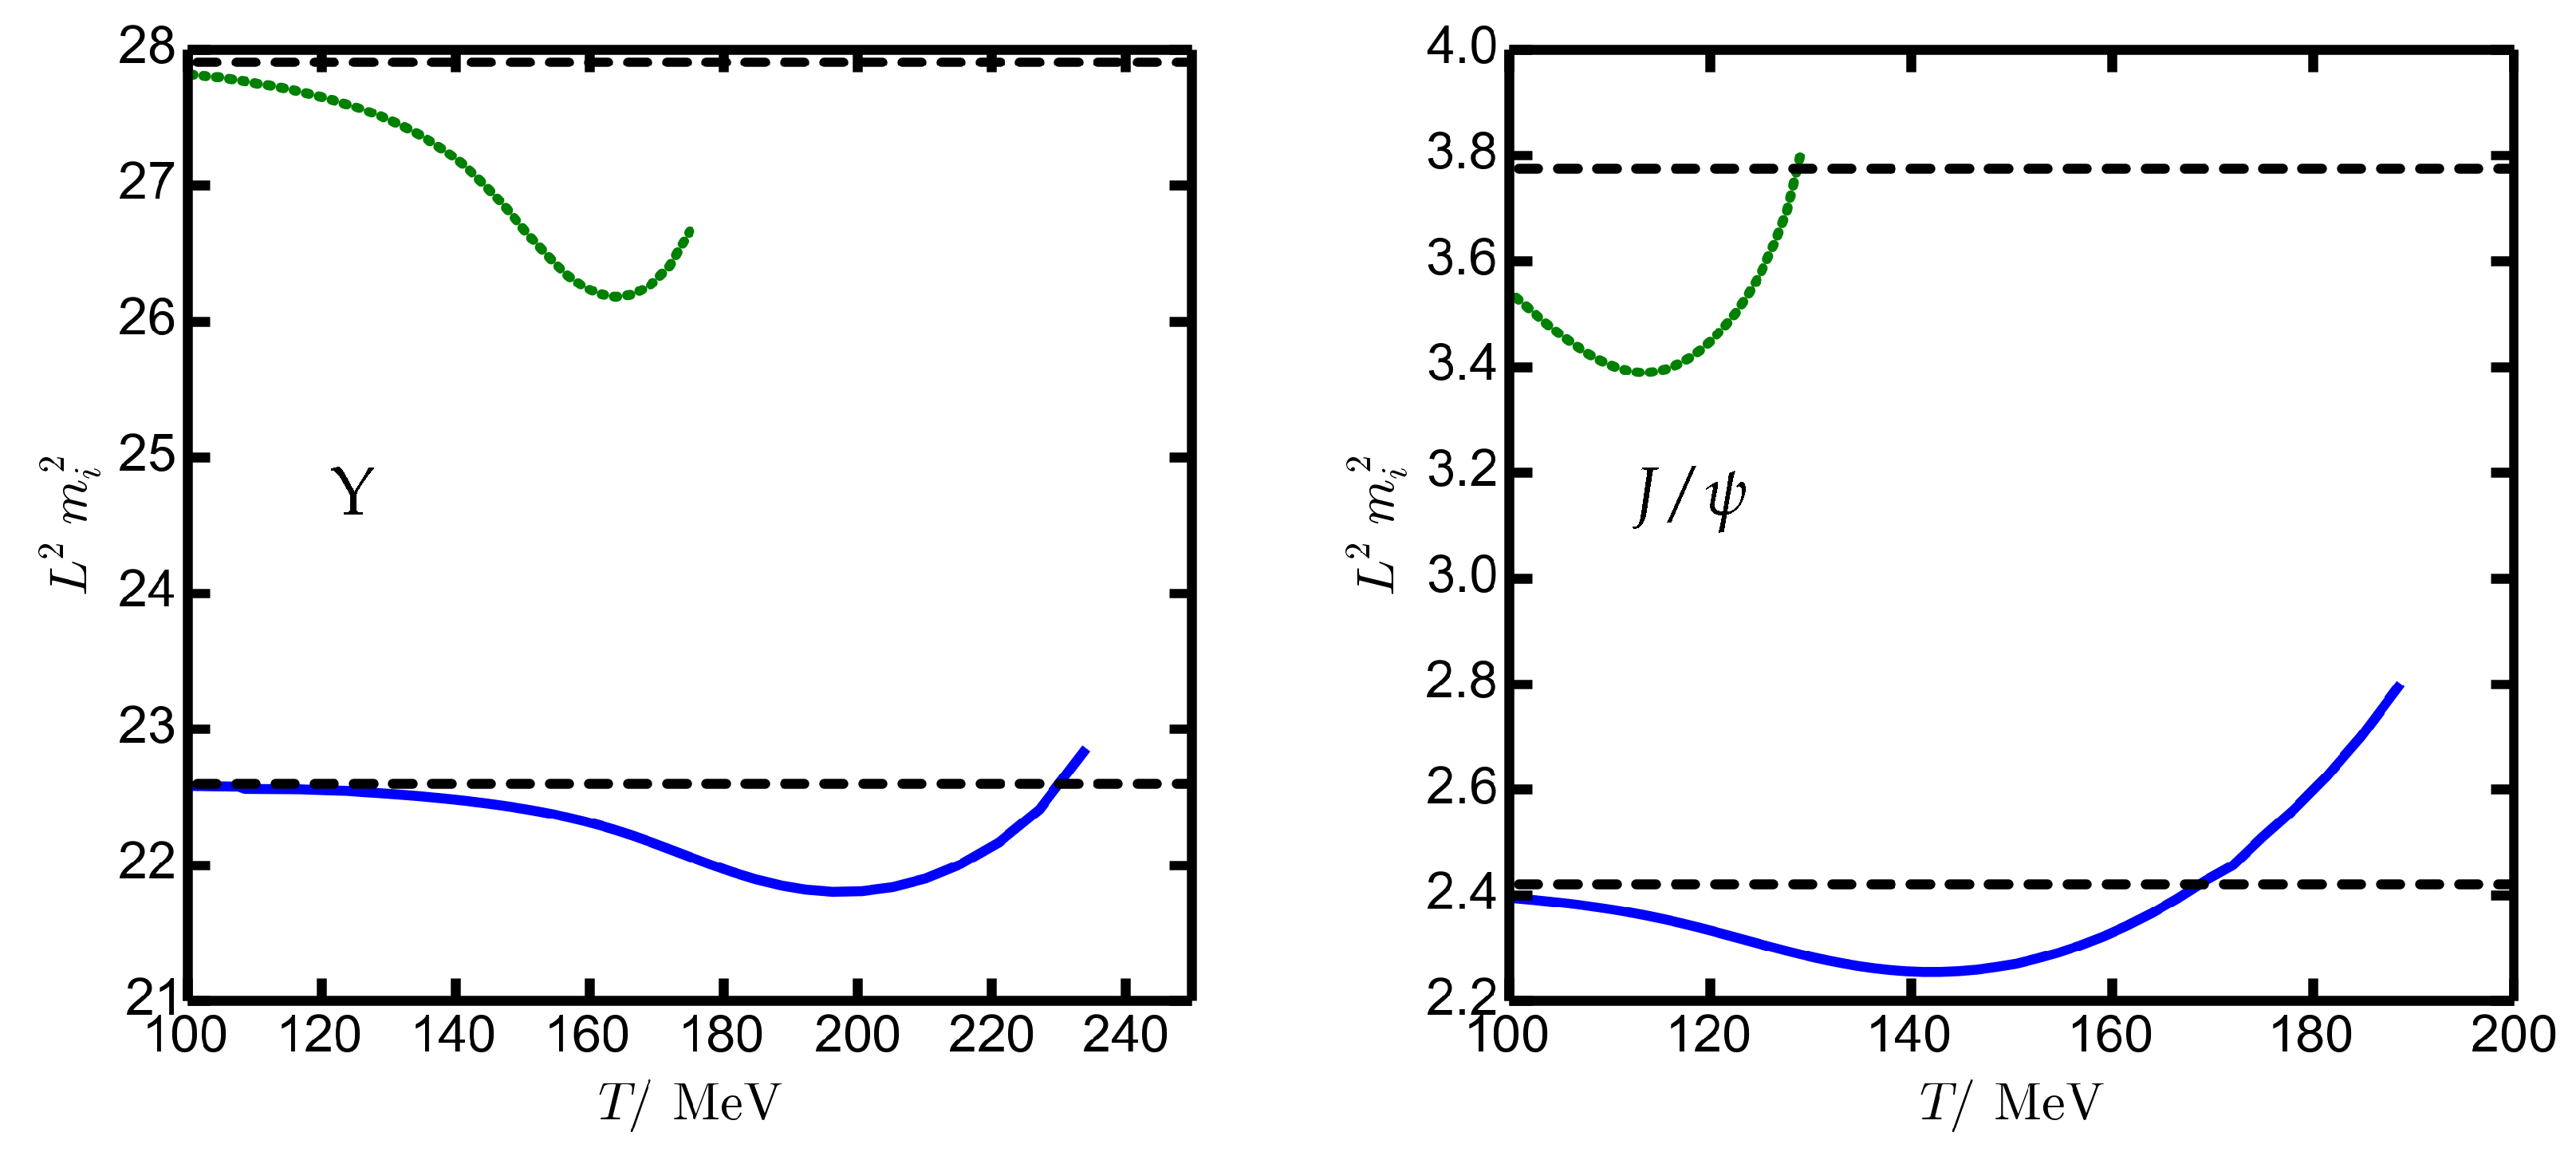
In addition to the ansat, (12) facilitates a sequential quarkonium formation upon decreasing temperature, etc., which potentially allows for some flavor dependence, e.g., . The thermal mass shifts have a non-trivial temperature dependence as evidenced in Figure 5. Such thermal mass shifts are employed in [9] to pin down the heavy-quark (HQ) transport coefficient which can be considered as the dispersive counterpart of the HQ momentum diffusion coefficient , where D stands for the HQ spatial diffusion coefficient. In [17], the author seemingly stresses a tension within previous holographic results [36], where positive mass shifts are reported, in contrast to negative shifts, e.g., in [34]. Our set-up qualitatively resolves this issue since, depending on the considered temperature, the thermal mass shift can be negative or positive, see Figure 5. One should note, however, that our thermal mass shifts of and are larger than the lattice QCD-based values quoted in [9,44].
Finally, let us remind that the two-parameter ansatz (12) is appealing since it allows for analytic solutions with respect to the excitation spectrum and an easy overview of the parameter dependencies. However, the authors of [35,60] already promoted (12) a “shift and dip potential” to catch more properties of the states rather than only masses.
4. Three-Parameter Potential with Dip—Charmonium Formation
The two-parameter potential from (12) with the realistic values of and facilitate formation at too low temperatures. This failure can be repaired by turning to more appropriate parameterizations. For instance, [35,60] proposed a four-parameter “dip and shift potential” which allows for melting temperatures significantly above , as does the construction in [31,32,33,34,36] deploying three parameters. The essence is a dip in which holds together the spectral strength despite large temperatures. Here, we consider such an option. The difference to previous work is the use of the dynamical background related to QCD, as described in Appendix A.
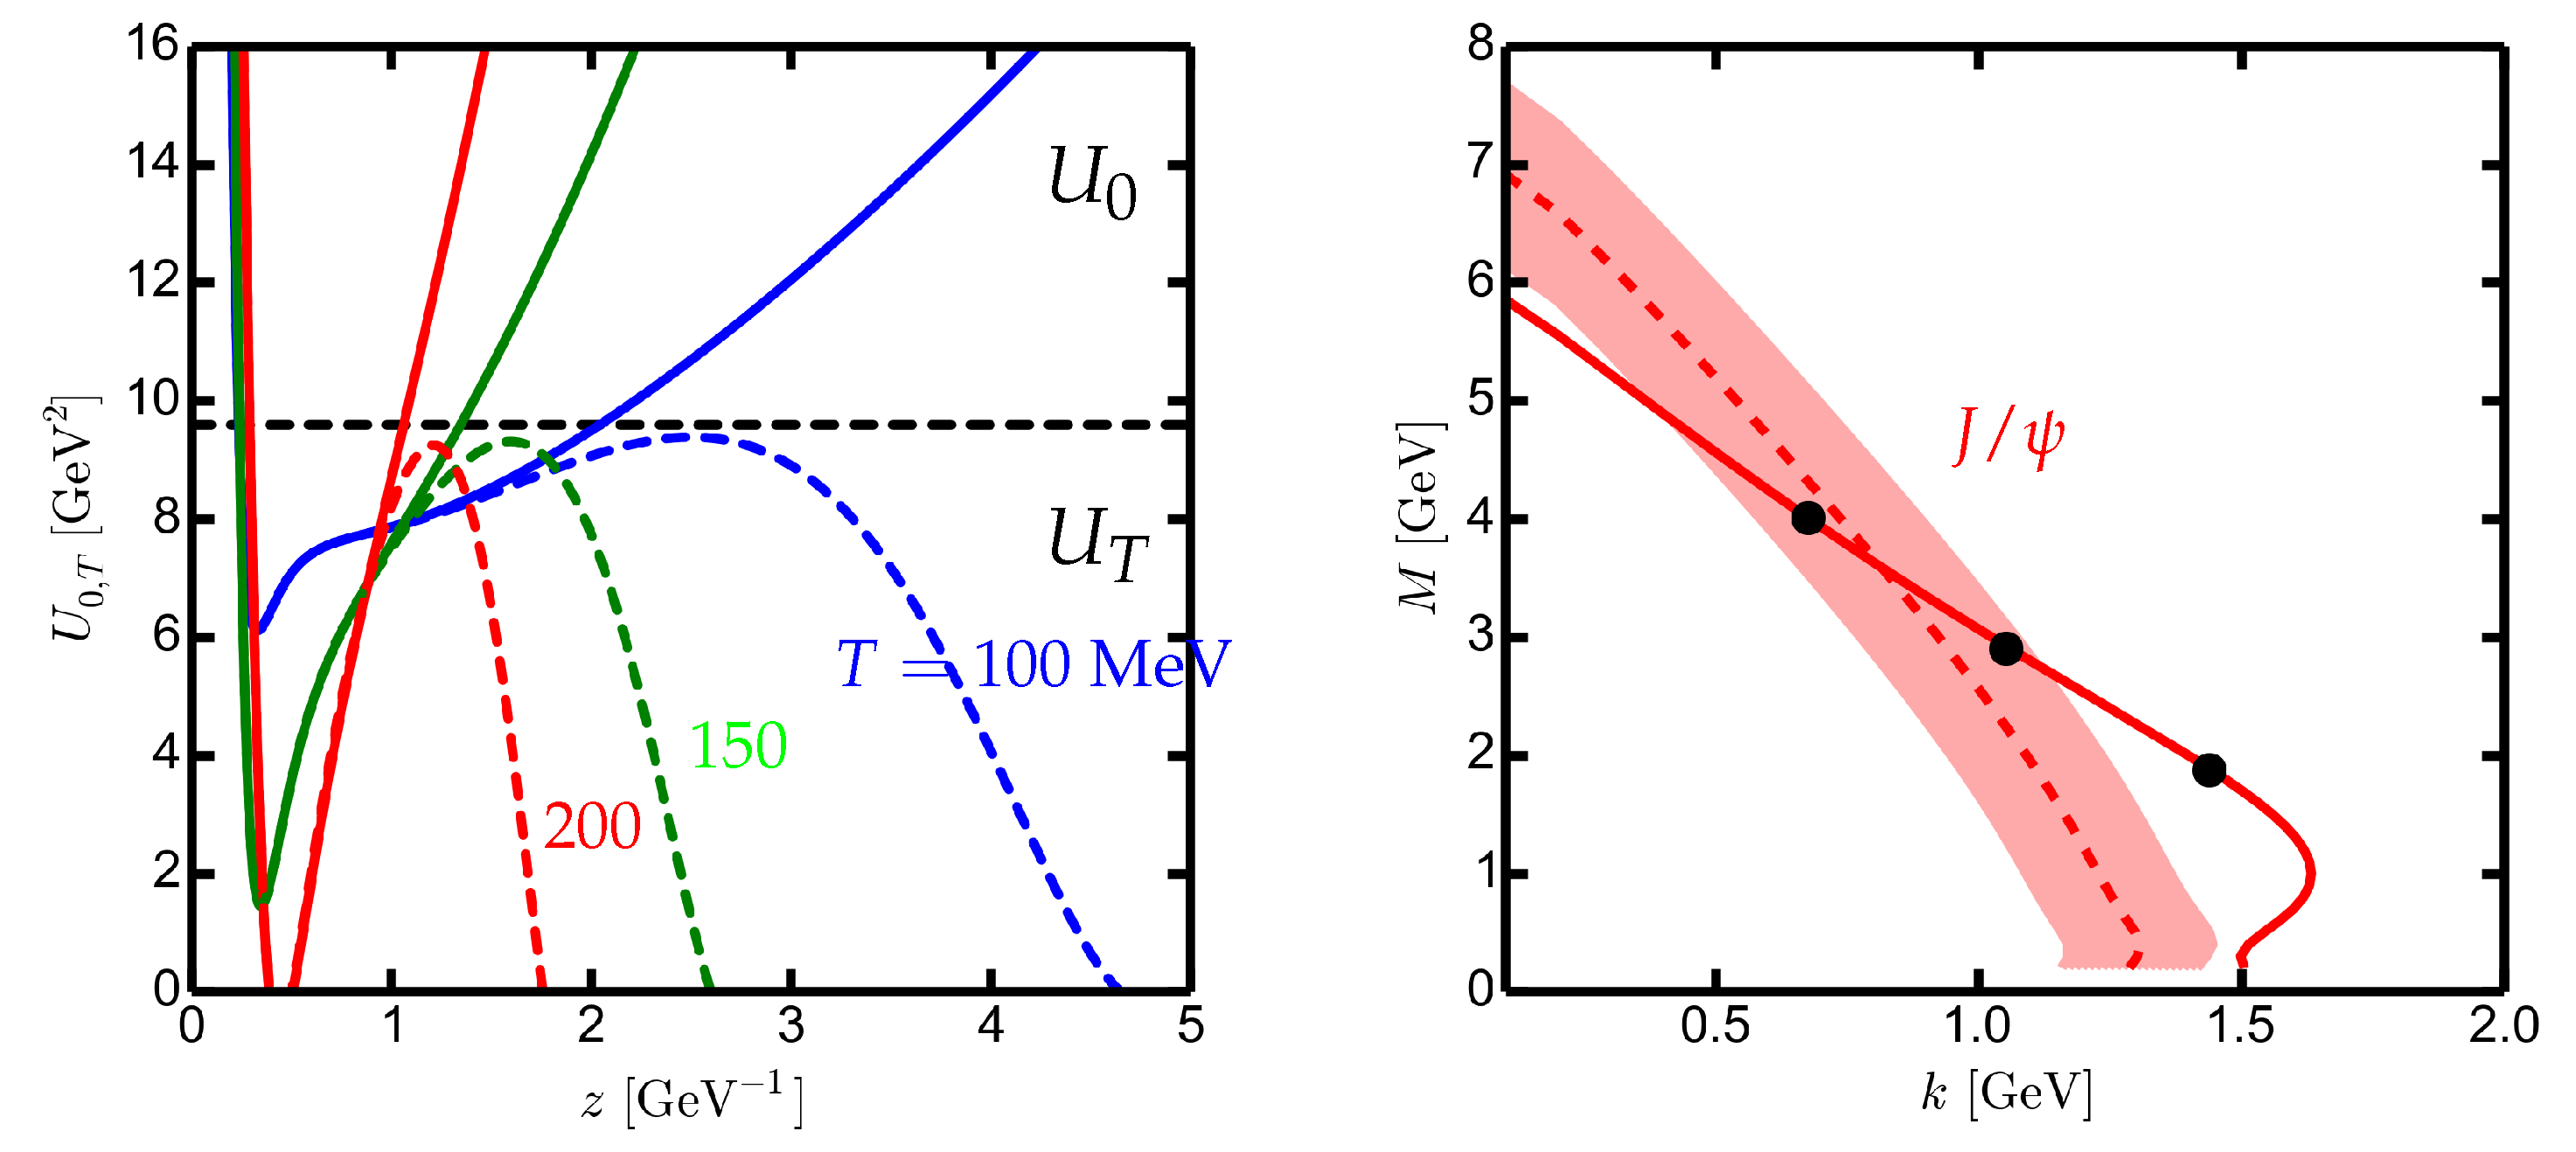
The construction of a particular three-parameter potential is as follows. Use and [58] with . Due to (see (7) and (8)) the potential is given by
The first three terms in the top line suggest a correspondence and by a comparison with (12), while the next two terms cause some modification of (12) at intermediate values of z. The second line of (14) is essentially responsible for the dip—somewhat modified by terms in the third line. The dip position is determined to a large extent by the term which peaks at ; the sinh term in the third line shifts the dip tip to smaller values of z. The UV and IR asymptotics are the same as for the potential (12). The dip position and the dip depth are interrelated, in contrast to the construction in [35,60].
The potential (14) might exhibit some non-trivial local structures as a function of z for particular parameters. In [58], the author advocates the optimum parameters GeV (representing a mass scale of non-hadronic decays); GeV (representing the quark mass); and GeV (representing the string tension) to yield the () mass of 2.943 (3.959) GeV) and the decay constant of 399 (255) MeV (see Table I in [58], the entries displaying “Holographic Results for Charmonium”). Note the resulting overestimated level spacing quantified by , in contrast to the PDG value of 1.42, when deploying these parameters.
Completely analog to the two-parameter potential (12), increasing the parameter k at , the potential (14) is squeezed and becomes deeper. Analogously, decreasing the parameter at constant values of k and M lets drop the absolute minimum of . One may select such parameter pairs of at a constant to keep the g.s. mass constant, see the horizontal dashed line the in left panel of Figure 6. Due to the squeezing of the potential, the interior (left) part was less influenced when imposing a horizon at , where is facilitated according to (5). As a result, the more the potential is squeezed, the smaller the values of are which are allowed to hold the prior to melting. This is the very reason which forces us to enlarge the parameter k (or a in (12)) to achieve quarkonium formation at sufficiently high temperatures in agreement with the perspective put forward in [19]. The dip in the potential (14) is useful in that respect since enlarging the parameter a in the flat potential (12) influenced the quarkonium formation in a less effective manner for . Let us emphasize that we put more weight on the g.s. mass (see the fat solid curve in the right panel of Figure 6) as the representative of the quark mass, while we relaxed the constraint on the excited state to be in a realistic range (see the dashed curve and colored band in the right panel of Figure 6), thus following the rationale in [35].
Having at our disposal, we proceed as in Section 3. The contour plots of the spectral function are exhibited in the top panels of Figure 7. One observes again the tendency of charmonium formation as a narrow corridor of contour lines at too low temperatures for parameters delivering exactly the PDG values of , as can be seen in the left top panel. This is quantified by the spectral functions shown in the left bottom panel of Figure 7 which display only a broad peak at MeV. Modifying the parameters as such to catch and % DPG values significantly improves the approach to charmonium formation near , as can be seen in the right panels of Figure 7, despite the yet imperfect squeezing of the contour lines in the right top panel. Nevertheless, the spectral function becomes well peaked at MeV, as can be seen in the right bottom panel of Figure 7.
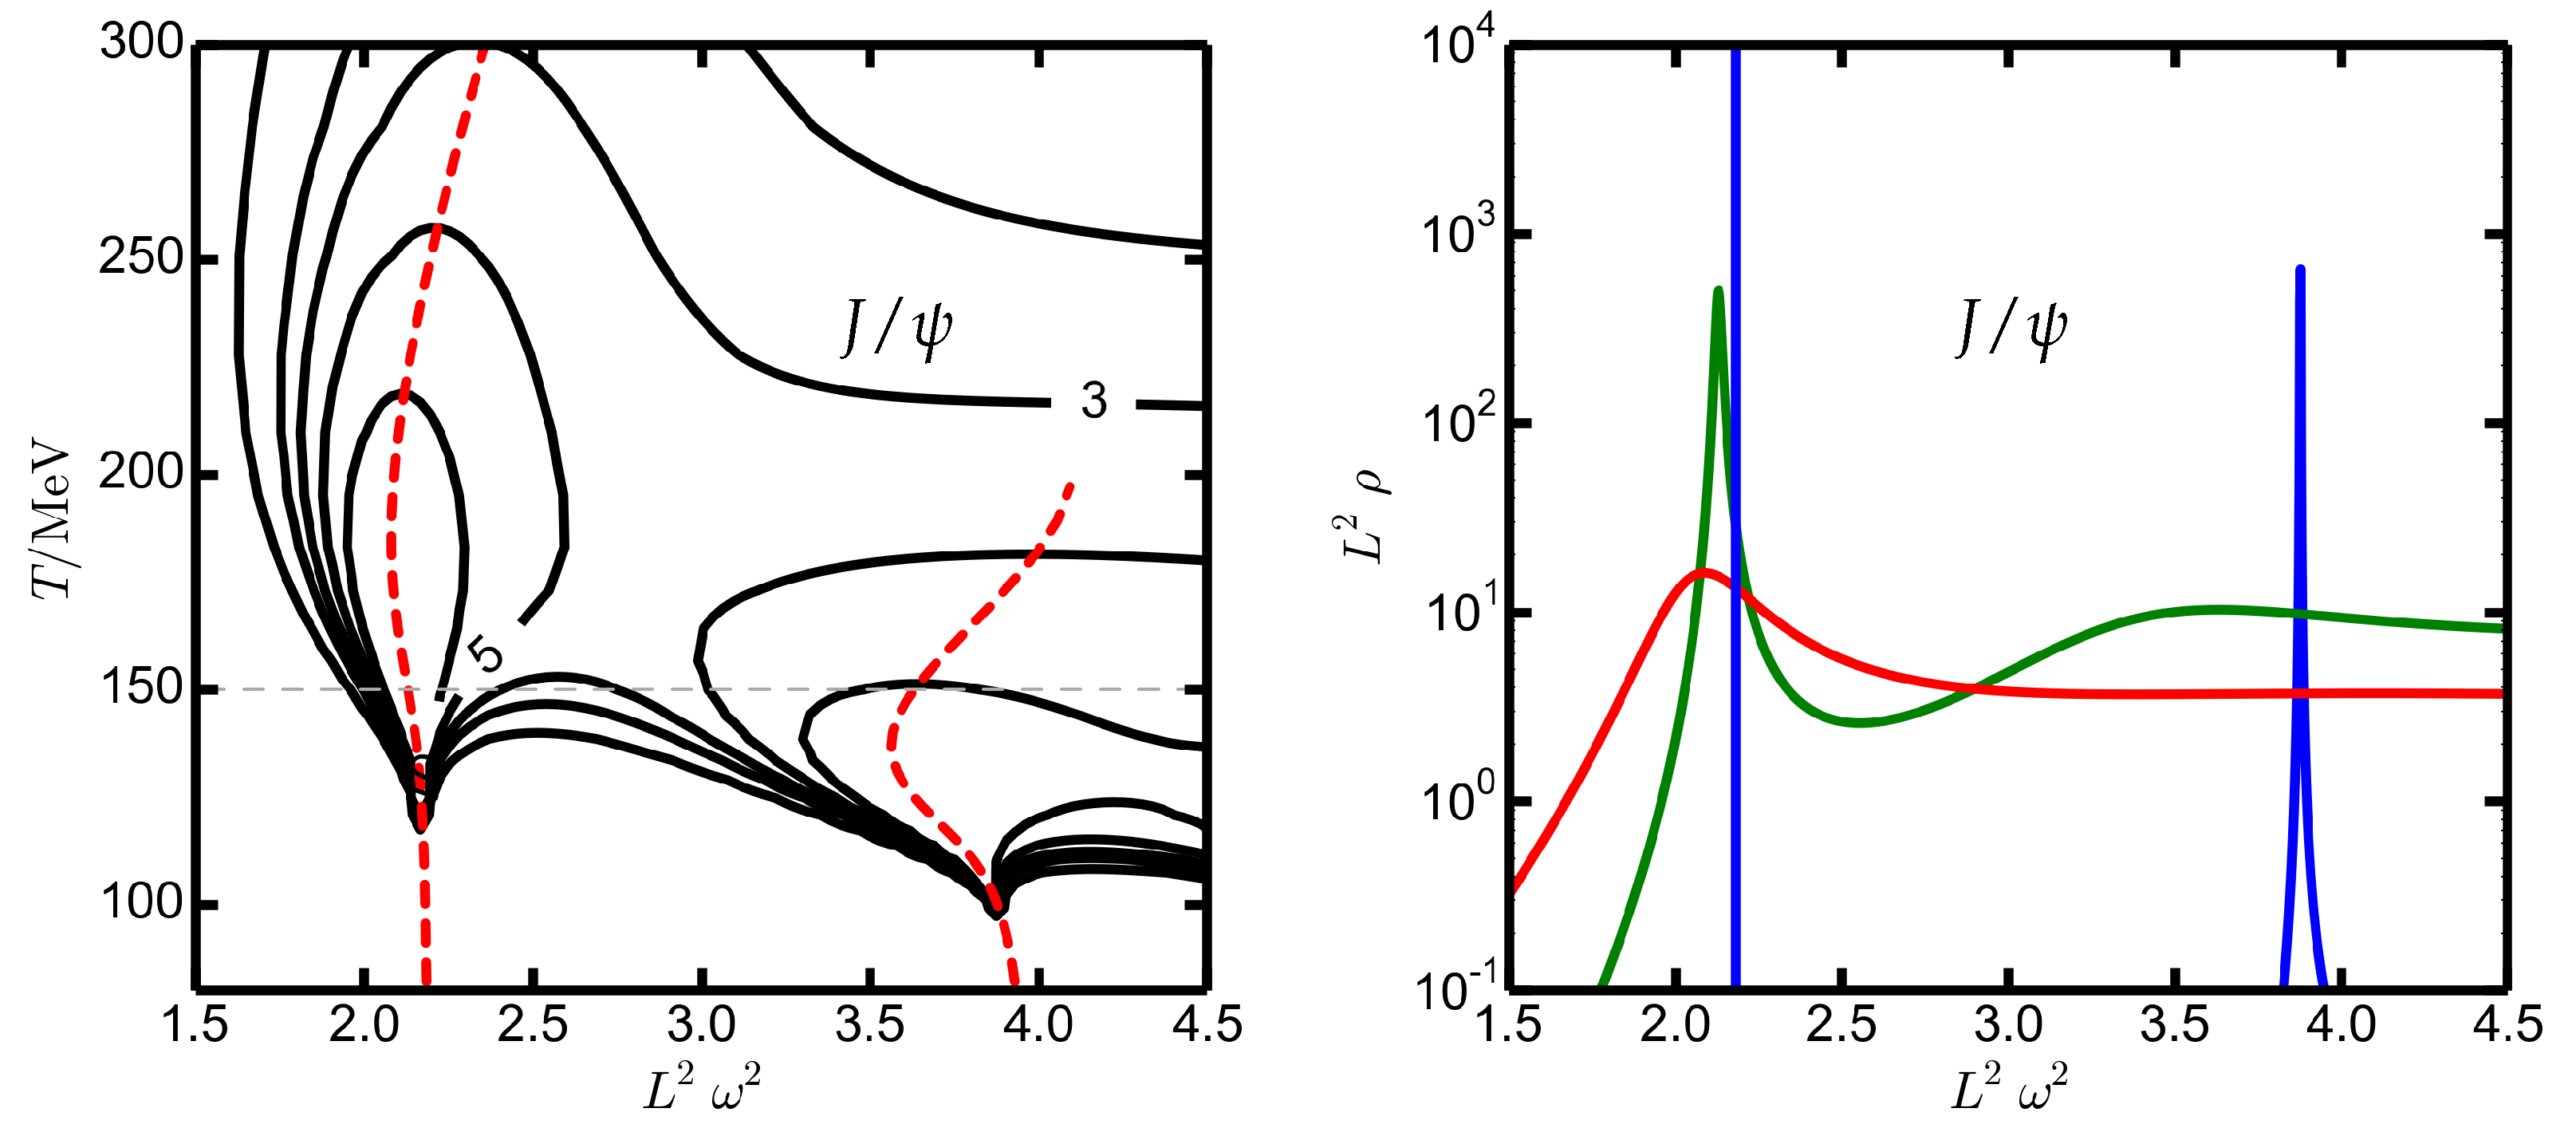
Finally, we exhibit in Figure 8 the contour plot of the charmonium spectral function (left panel) and the spectral function at selected temperatures (right panel) for the parameter set GeV favored in [58]. These parameters, albeit with noticeable deviations to the PDG values of , realize the charmonium formation as a transition from the spectral function to a narrow, quasi-particle state at temperatures slightly below . While the squeezing of the contour lines near in the left panel of Figure 8 is apparently not so pronounced as in the case of bottomonium (see right top panel in Figure 3), the spectral function displays a sharp peak at , see right panel of Figure 8. Insofar, it is justified to speak on charmonium formation at for the given parameter set. We emphasize the QCD-related background employed here, in contrast to the schematic background in [58].
To complete the systematic related to charmonium, we exhibit in Figure 9 the quantity as a function of . Note the huge variation of . In general, sensitively depends on the parameters in and is tightly related to the background.
An analog study of the formation is hampered by some uncomfortable structures of . References [31,32,36] advocate parameters which avoid such obstacles, however, these result in a value of being only one half of the PDG value. We therefore did not perform an analysis of the potential ansatz (14) in the QCD-related background since the two-parameter potential (12) was already shown to successfully accomplish bottomonium formation at .
5. Summary
In summary, we introduced a modification of the holographic vector meson action for quarkonia such to join (i) the QCD2 + 1(phys) thermodynamics, dynamically and consistently described by a dilaton and the metric coefficients in AdS + BH, with (ii) realistic quarkonia masses at zero temperature. Both pillars, thermodynamics and quarkonium mass spectra, are anchored in QCD as a common footing. The formal holographic construction was based on an effective dilaton , where is solely tight to the light-quark–gluon thermodynamics background, while the flavor-dependent quantity is determined by a combination of and the adopted Schrödinger equivalent potential at zero temperature. encodes the flavor (or quark mass) dependence and can be chosen with much sophistication to accommodate many quarkonia properties. We explore here the systematic of a two-parameter model to demonstrate the features of our scheme, where the thermodynamic background at and meson spectra at serve as a QCD-based input to analyze the quarkonia formation at . We tested a scenario where quarkonium formation was considered as an adiabatic process, i.e., a sequence of equilibrium states, and characterized by the shrinking of the respective spectral functions towards narrow quasi-particle states, in qualitative agreement with lattice QCD studies [44]. Realistic values of masses in fact allow the formation temperature of nearby in line with the claim of [18,19] that hadrons form themselves at temperatures MeV. Insofar, the mystery “why ?” could be resolved by a dynamical process within such a scenario: hadronization is the transit of a broad-to-narrow spectral functions within a few-MeV temperature intervals at .
While quite promising, the proposed scenario was hampered by at least three issues. First, the finding of looks somewhat accidental and is not explicitly locked to a certain microscopic process; in addition, there is a slight tension due to the tendency of when deploying the exact PDG value of the mass together with the PDG value. Second, the formation of the quasi-particle occurs at due to the sequential formation, which, however, could be an artifact of the two-parameter model of . Third, the envisaged scenario quantitatively fails for since for the two-parameter model. It happens, however, that an improved three-parameter model overcomes such problems to some extent, i.e., charmonium formation at is accomplished. An ideal choice of should deliver the quarkonia mass spectra (and other properties as well) and quarkonia formation as the rapid shrinking of the spectral functions in a narrow temperature interval at , including the excited states.
Formally, the hadronization of heavy-flavor probe quarkonia is determined by the potential , which governs the crucial function , thus partially decoupling it from the holographic background.
The herein proposed bottom-up scenario of quarkonia formation solely accommodates the properties of vector and states in the holographic bulk vector field . This is in contrast to microscopic studies, e.g., in [3,5,63,64,65], where the heavy-quark interaction with constituents of the ambient medium was dealt with in detail. Primordial contributions, early off-equilibrium yields as well as the corresponding feedings were also not accounted for. An important (yet) missing issue of the proposed scenario is a direct relation to observables in relativistic heavy-ion collisions. All this calls for further investigations.
Author Contributions
Conceptualization, B.K. and R.Z.; software, R.Z.; validation, B.K. and R.Z.; formal analysis, B.K. and R.Z.; writing—original draft preparation, B.K.; writing—review and editing, B.K. and R.Z.; visualization, R.Z.; supervision, B.K.; All authors have read and agreed to the published version of the manuscript.
Funding
The work is supported in part by the European Union’s Horizon 2020 research and innovation program STRONG-2020 under grant agreement No. 824093.
Institutional Review Board Statement
Not applicable.
Informed Consent Statement
Not applicable.
Acknowledgments
The authors gratefully acknowledge the collaboration with J. Knaute and thank M. Ammon, P. Braun-Munzinger, M. Kaminski, K. Redlich and G. Röpke for useful discussions.
Conflicts of Interest
The authors declare no conflict of interest.
Appendix A. Specific Features of the Holographic Gravity–Dilaton Background Adjusted to QCD Thermodynamics
The QCD2 + 1(phys) equation of state obeys certain features. Among them are the minimum of the sound velocity at MeV, , and the maximum of the interaction measure at MeV, [21,22]. The contributions of charm and bottom quarks are negligible at MeV [52]. The quoted temperature values bracket the pseudo-critical temperature MeV which is determined by a peak of the chiral susceptibility [20]. We focus here on the local minimum of the sound velocity and its mapping onto the gravity–dilaton background.
Deforming the AdS metric by putting a black hole with horizon at yields the metric for the infinitesimal line elements squared (3) where is a simple zero. In identifying the Hawking temperature with the temperature of the system at bulk boundary and the attributed Bekenstein–Hawking entropy density , one holographically describes the thermodynamics. at refers to the vacuum.
The gravity–dilaton background is determined by the action in the Einstein frame:
where R stands for the curvature invariant and . (For our purposes, the numerical values of and as well as in (1) are irrelevant.) The field equations and equation of motion for the metric coefficients and the dilaton follow from (A1) as
to be solved with boundary conditions , , , , ; the prime means differentiation with respect to z. The dilaton potential is the central quantity [48]. If imposing certain conditions, one can describe the QCD-relevant cross-over (instead of the phase transitions of first or second order or a Hawking–Page transition). A necessary condition for a cross-over is (i) , as a function of , which has a local maximum and (ii) (for refinements, cf., [48]). Note that the adjustment of V to given lattice data is a non-local problem because there does not exist a point-to-point relation between and relevant thermodynamic quantities (e.g., sound velocity as a function of the temperature).
The three-parameter ansatz:
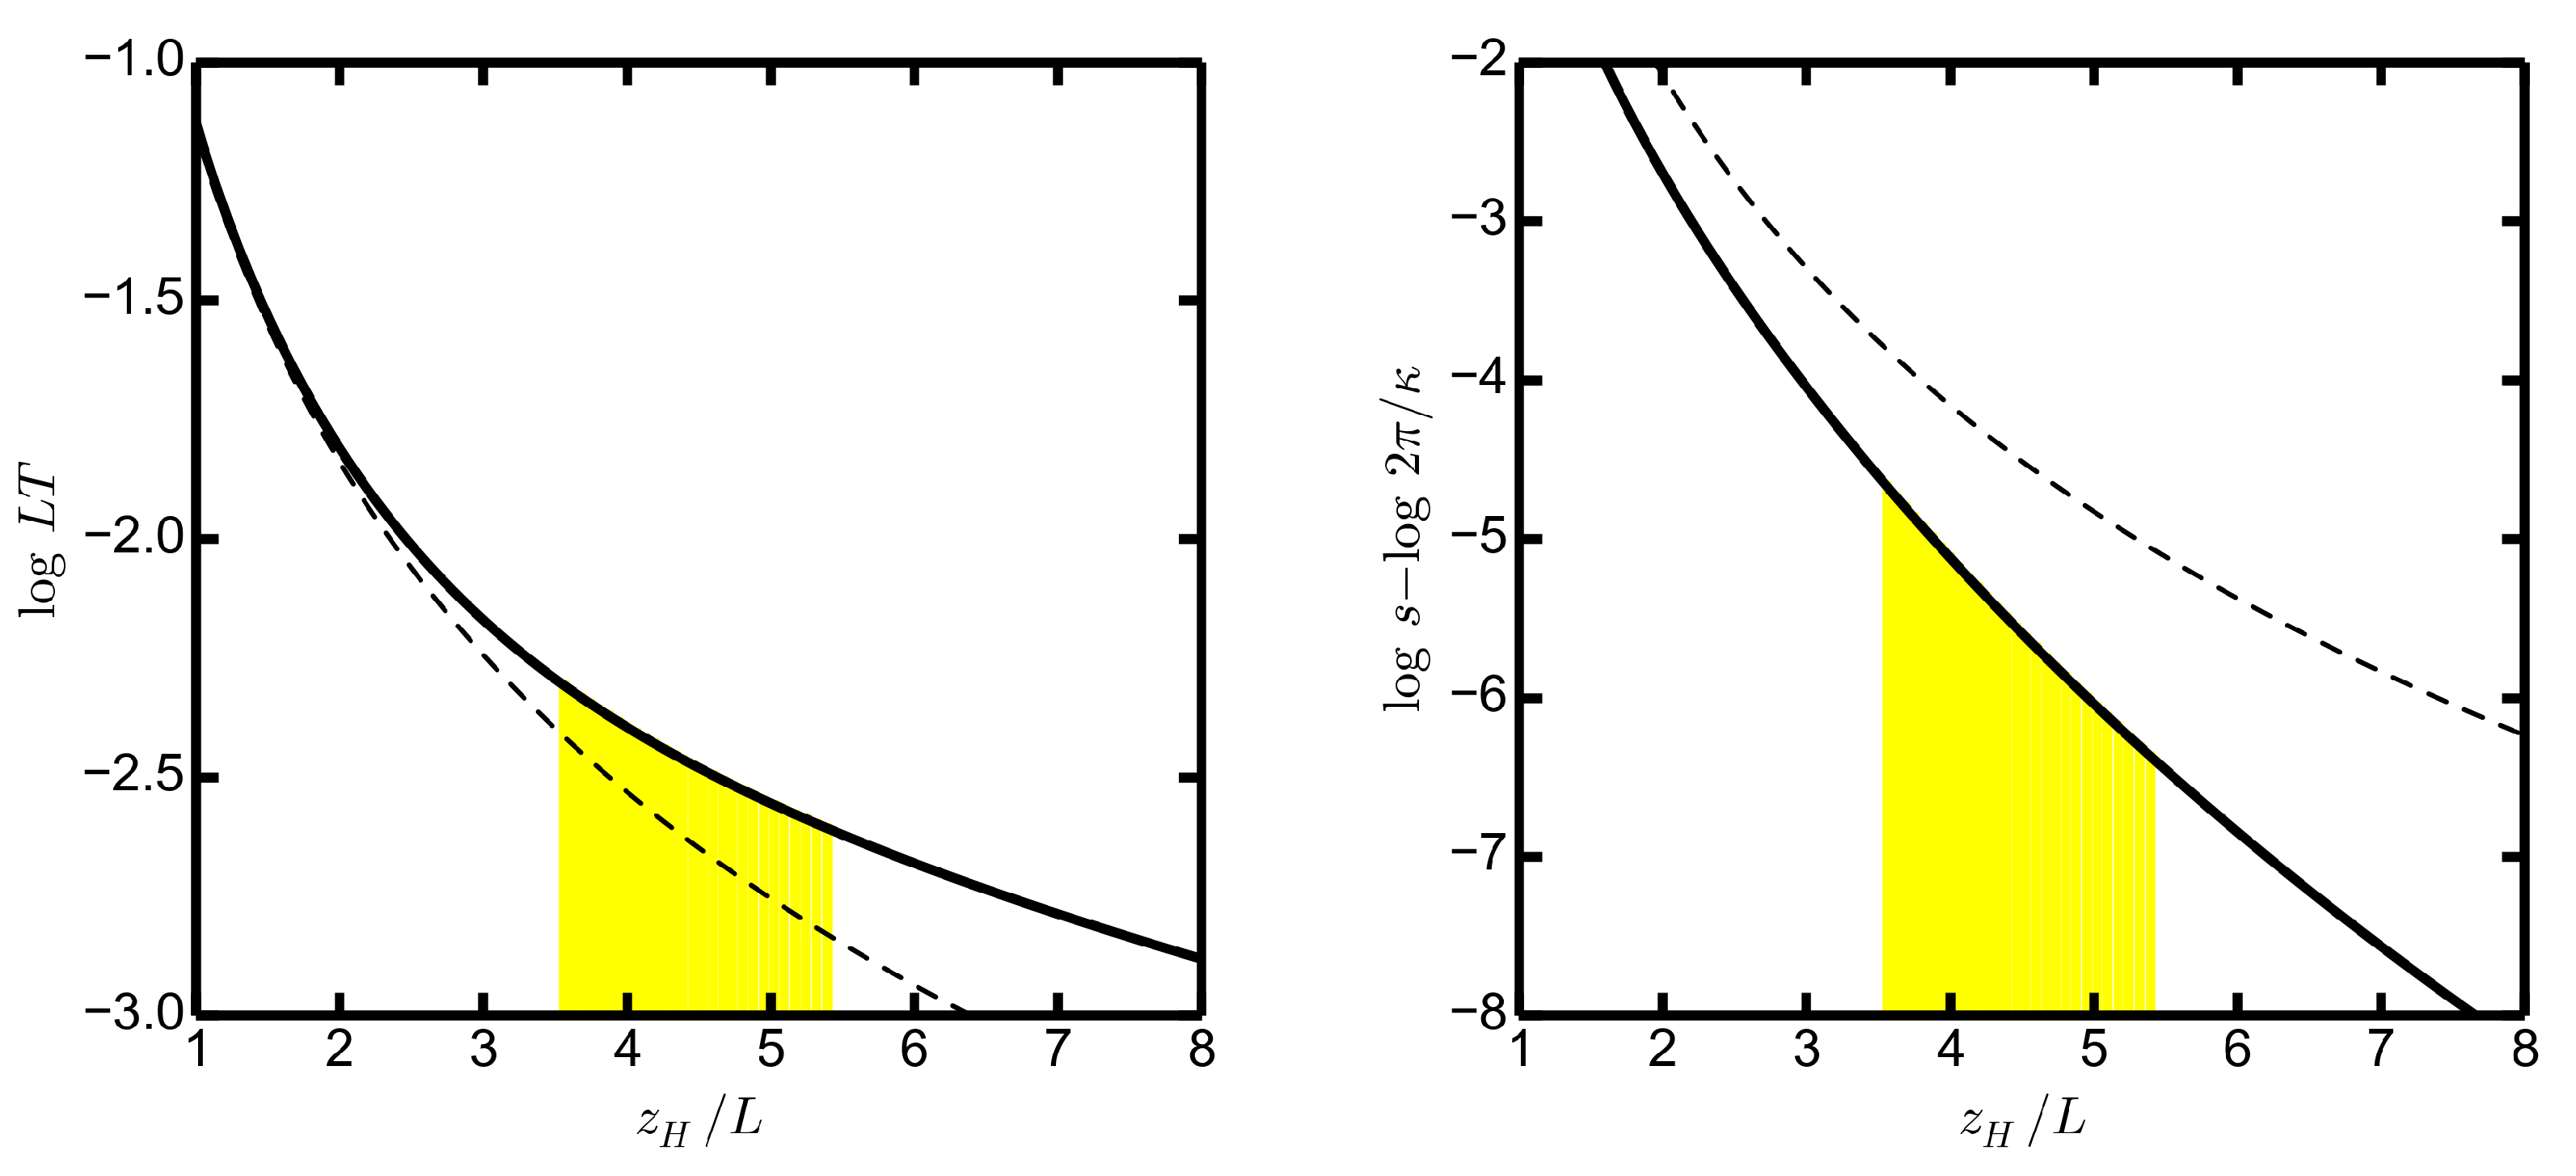
is sufficient for a satisfactory description of the lattice QCD2 + 1(phys) data [21,22] (more parameters are required for a perfect match of the various thermodynamic state variables as a function of the temperature within the full data range) by coefficients together with GeV, see Figure 5-left in [59]. In fact, the aforementioned conditions are met: a maximum of at .
In general, the sound velocity squared, acquires a local minimum if , or has an inflection point. Surprisingly, neither nor display such a feature. Instead, both and are monotonous functions of , as can be seen in Figure A1. This means, the minimum of the sound velocity is caused by a subtle interplay of derivatives of and . Displaying the sound velocity squared by , the local minimum is determined by
Figure A1.
The logarithms of temperature, (left panel), and entropy density, (right panel), as a function of . Dashed curves are for (left) and (right). The colored regions are for , which are determined by MeV (position of the minimum sound velocity) and MeV (position of the maximum of interaction measure ) according to [22].

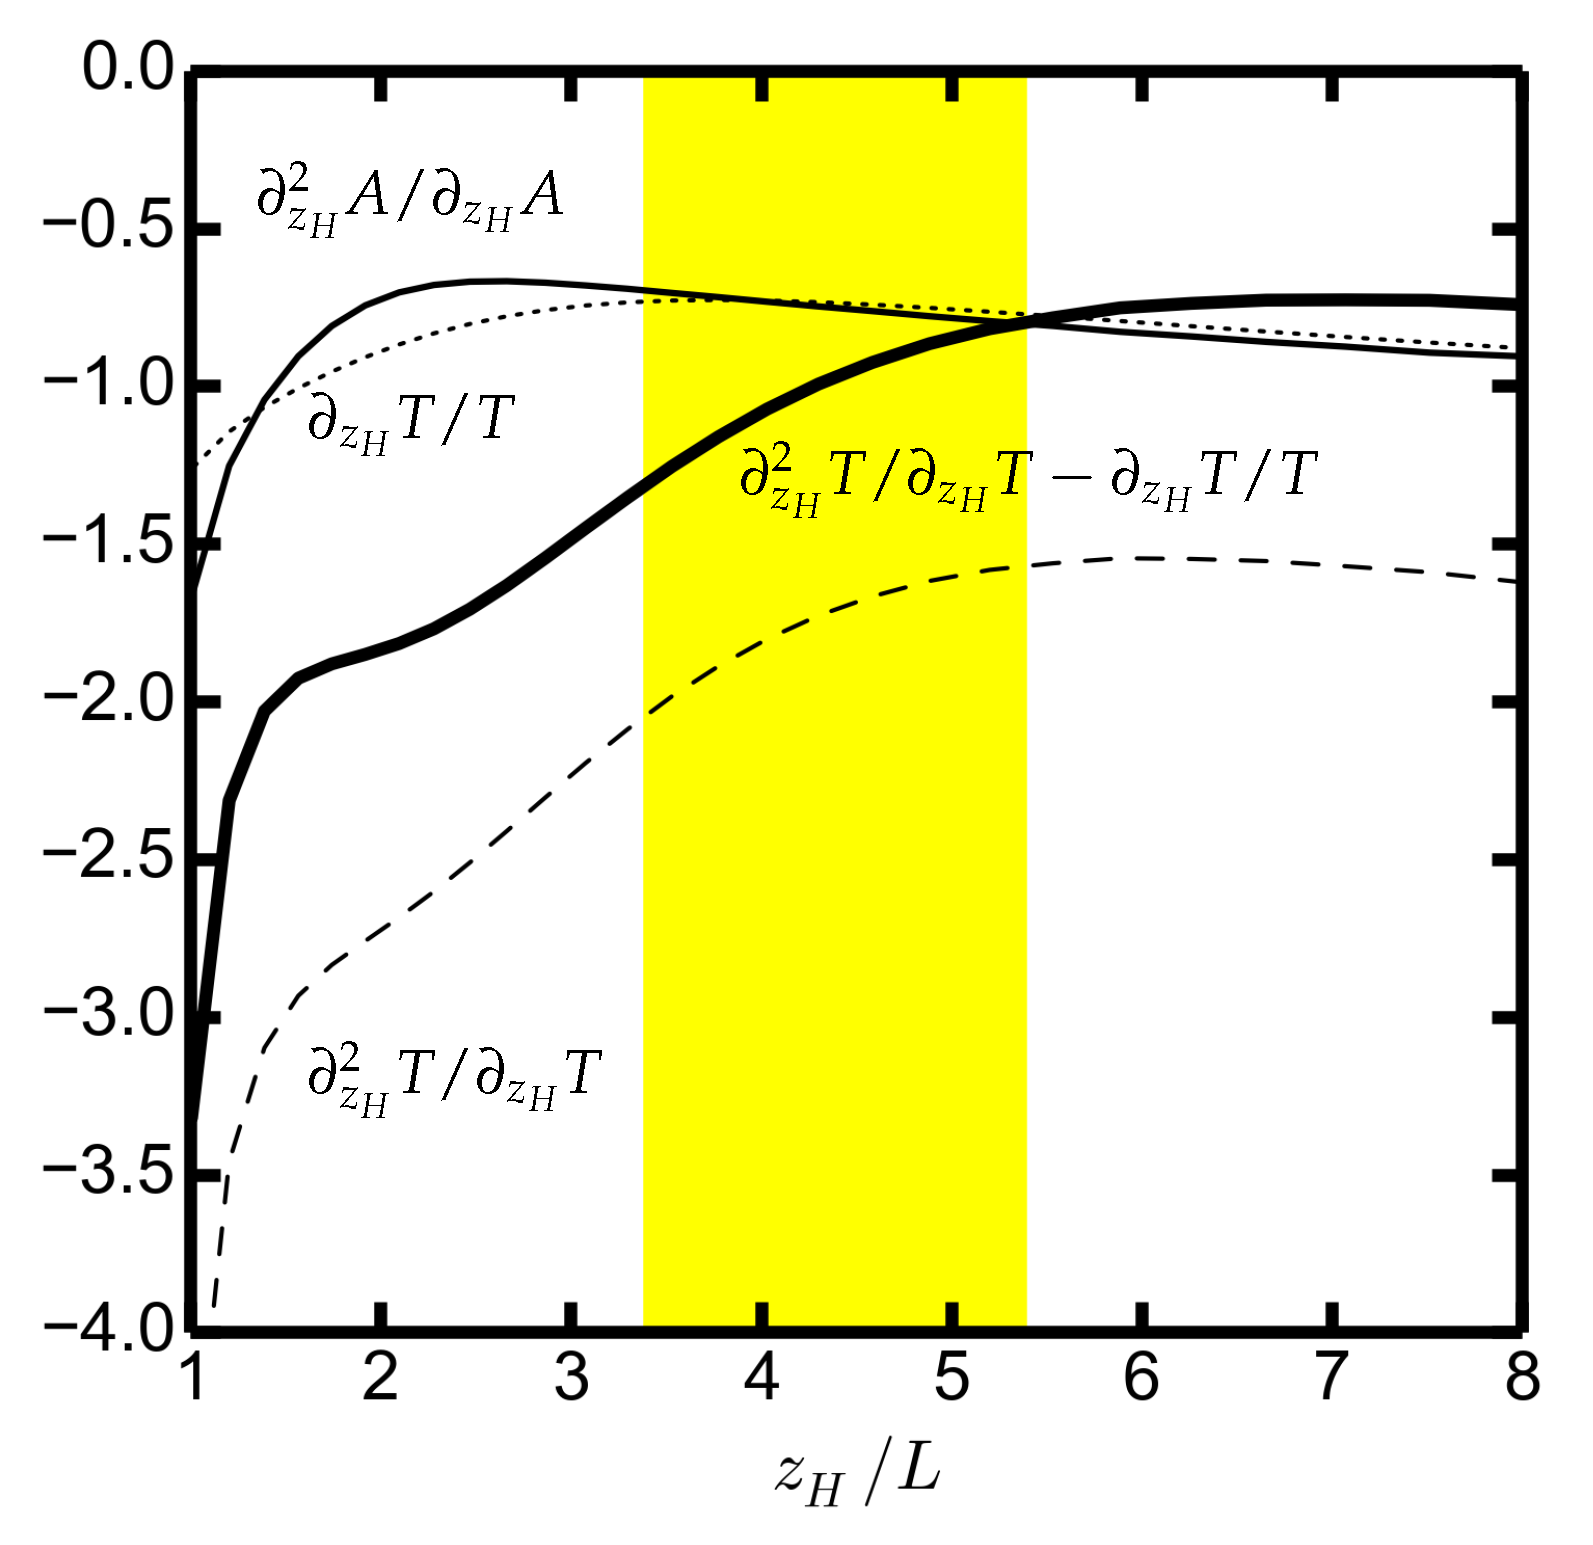
These individual terms are exhibited in Figure A2. It turns out that the actually chosen parameters facilitate the minimum of sound velocity at the crossing of the fat solid and thin solid curves at , corresponding to MeV, i.e., nearby and thus .
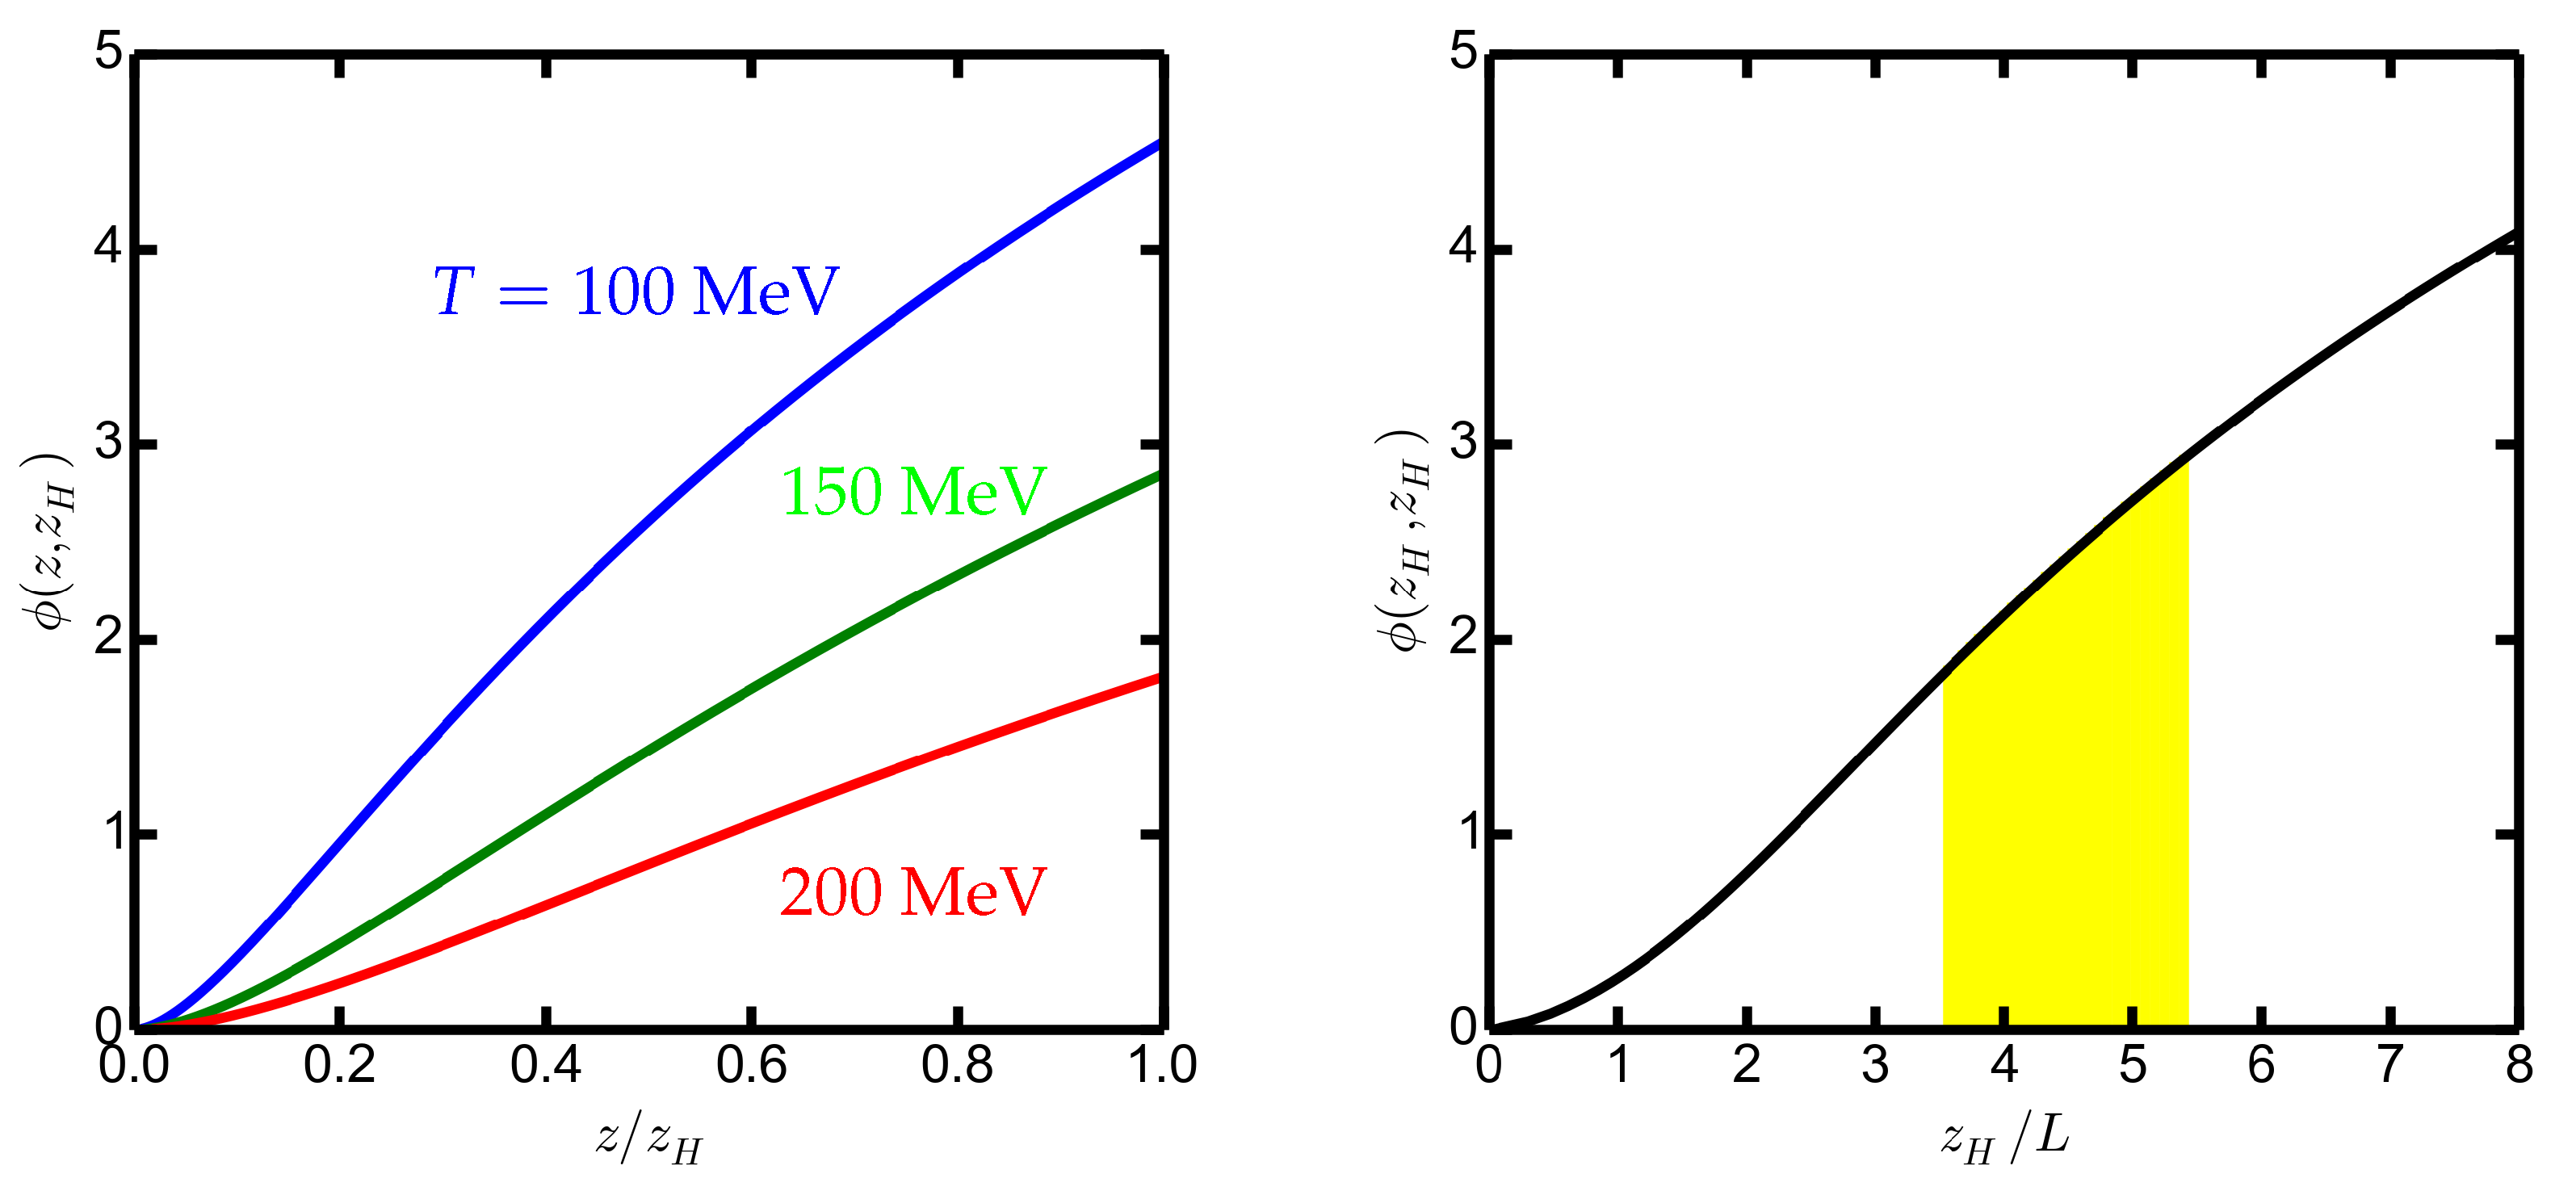
In contrast to and , the dilaton profile has a marked imprint of the QCD specifics: this exhibits inflection points in both the z direction and direction, as can be seen in Figure A3. This is a remarkable property which makes the use of the QCD-related gravity–dilaton background distinct in comparison with the schematic ansätze, which additionally misses the consistent interrelations of the quantities A, f and via field equations. Note that the dilaton explicitly enters the quarkonium action (1), thus directly leaving its imprints related to quarkonium formation.
Figure A2.
The terms entering (A6) multiplied by : —dashed curve; —dotted curve; —fat solid curve; and —thin solid curve. The yellow region is as in Figure A1.

Figure A3.
The dilaton profile as a function of (left panel, for , 5.22 and 3.52 corresponding to (blue), 150 (green), 200 (red) MeV with inflection points at , 0.33, 0.44) and as a function of (right panel, the inflection point is at ).
Figure A3.
The dilaton profile as a function of (left panel, for , 5.22 and 3.52 corresponding to (blue), 150 (green), 200 (red) MeV with inflection points at , 0.33, 0.44) and as a function of (right panel, the inflection point is at ).

References
- Antinori, F.; Dainese, A.; Giubellino, P.; Greco, V.; Lombardo, M.P.; Scomparin, E. (Eds.) Proceedings of the 27th International Conference on Ultrarelativistic Nucleus-Nucleus Collisions (Quark Matter 2018), Venice, Italy, 14–19 May 2018; Available online: https://indico.cern.ch/event/656452/registrations/participants (accessed on 5 April 2021).
- Antinori, F.; Dainese, A.; Giubellino, P.; Greco, V.; Lombardo, M.P.; Scomparin, E. (Eds.) Proceedings of the 28th International Conference on Ultrarelativistic Nucleus-Nucleus Collisions (Quark Matter 2019), Wuhan, China, 4–9 November 2019; Available online: https://indico.cern.ch/event/792436/page/19061-proceedings (accessed on 5 April 2021).
- Strickland, M. Using bottomonium production as a tomographic probe of the quark-gluon plasma. In Proceedings of the 13th International Workshop in High pT Physics in the RHIC and LHC Era, Knoxville, TN, USA, 19–22 March 2019. [Google Scholar]
- Prino, F.; Rapp, R. Open Heavy Flavor in QCD Matter and in Nuclear Collisions. J. Phys. G 2016, 43, 093002. [Google Scholar] [CrossRef]
- Yao, X.; Müller, B. Quarkonium inside the quark-gluon plasma: Diffusion, dissociation, recombination, and energy loss. Phys. Rev. D 2019, 100, 014008. [Google Scholar] [CrossRef] [Green Version]
- Rapp, R.; Gossiaux, P.B.; Andronic, A.; Averbeck, R.; Masciocchi, S.; Beraudo, A.; Bratkovskaya, E.; Braun-Munzinger, P.; Cao, S.; Dainese, A.; et al. Extraction of Heavy-Flavor Transport Coefficients in QCD Matter. Nucl. Phys. A 2018, 979, 21–86. [Google Scholar] [CrossRef] [Green Version]
- Xu, Y.; Bass, S.A.; Moreau, P.; Song, T.; Nahrgang, M.; Bratkovskaya, E.; Gossiaux, P.; Aichelin, J.; Cao, S.; Greco, V.; et al. Resolving discrepancies in the estimation of heavy quark transport coefficients in relativistic heavy-ion collisions. Phys. Rev. C 2019, 99, 014902. [Google Scholar] [CrossRef] [Green Version]
- Cao, S.; Coci, G.; Das, S.K.; Ke, W.; Liu, S.Y.F.; Plumari, S.; Song, T.; Xu, Y.; Aichelin, J.; Bass, S.; et al. Toward the determination of heavy-quark transport coefficients in quark-gluon plasma. Phys. Rev. C 2019, 99, 054907. [Google Scholar] [CrossRef] [Green Version]
- Brambilla, N.; Escobedo, M.A.; Vairo, A.; Griend, P.V. Transport coefficients from in medium quarkonium dynamics. Phys. Rev. D 2019, 100, 054025. [Google Scholar] [CrossRef] [Green Version]
- Song, T.; Moreau, P.; Aichelin, J.; Bratkovskaya, E. Exploring non-equilibrium quark-gluon plasma effects on charm transport coefficients. Phys. Rev. C 2020, 101, 044901. [Google Scholar] [CrossRef] [Green Version]
- Chattopadhyay, C.; Heinz, U.W. Hydrodynamics from free-streaming to thermalization and back again. Phys. Lett. B 2020, 801, 135158. [Google Scholar] [CrossRef]
- Bazow, D.; Heinz, U.W.; Strickland, M. Second-order (2+1)-dimensional anisotropic hydrodynamics. Phys. Rev. C 2014, 90, 054910. [Google Scholar] [CrossRef] [Green Version]
- Katz, R.; Gossiaux, P.B. The Schrödinger–Langevin equation with and without thermal fluctuations. Ann. Phys. 2016, 368, 267. [Google Scholar] [CrossRef] [Green Version]
- Blaizot, J.P.; Escobedo, M.A. Quantum and classical dynamics of heavy quarks in a quark-gluon plasma. J. High Energy Phys. 2018, 2018, 34. [Google Scholar] [CrossRef] [Green Version]
- Blaizot, J.P.; Escobedo, M.A. Approach to equilibrium of a quarkonium in a quark-gluon plasma. Phys. Rev. D 2018, 98, 074007. [Google Scholar] [CrossRef] [Green Version]
- Brambilla, N.; Escobedo, M.A.; Soto, J.; Vairo, A. Heavy quarkonium suppression in a fireball. Phys. Rev. D 2018, 97, 074009. [Google Scholar] [CrossRef] [Green Version]
- Rothkopf, A. Heavy Quarkonium in Extreme Conditions. Phys. Rept. 2020, 858, 1–117. [Google Scholar] [CrossRef]
- Braun-Munzinger, P.; Dönigus, B. Loosely-bound objects produced in nuclear collisions at the LHC. Nucl. Phys. A 2019, 987, 144–201. [Google Scholar] [CrossRef]
- Andronic, A.; Braun-Munzinger, P.; Redlich, K.; Stachel, J. Decoding the phase structure of QCD via particle production at high energy. Nature 2018, 561, 321–330. [Google Scholar] [CrossRef] [Green Version]
- Bazavov, A.; Ding, H.-T.; Hegde, P.; Kaczmarek, O.; Karsch, F.; Karthik, N.; Laermann, E.; Lahiri, A.; Larsen, R.; Li, S.-T.; et al. Chiral crossover in QCD at zero and non-zero chemical potentials. Phys. Lett. B 2019, 795, 15–21. [Google Scholar] [CrossRef]
- Borsanyi, S.; Fodor, Z.; Hoelbling, C.; Katz, S.D.; Krieg, S.; Szabo, K.K. Full result for the QCD equation of state with 2+1 flavors. Phys. Lett. B 2014, 730, 99–104. [Google Scholar] [CrossRef] [Green Version]
- Bazavov, A.; Bhattacharya, T.; DeTar, C.; Ding, H.-T.; Gottlieb, S.; Gupta, R.; Hegde, P.; Heller, U.M.; Karsch, F.; Laermann, E.; et al. Equation of state in (2+1)-flavor QCD. Phys. Rev. D 2014, 90, 094503. [Google Scholar] [CrossRef] [Green Version]
- Suganuma, H.; Doi, T.M.; Redlich, K.; Sasaki, C. Relating Quark Confinement and Chiral Symmetry Breaking in QCD. J. Phys. G 2017, 44, 124001. [Google Scholar] [CrossRef] [Green Version]
- Bellwied, R.; Noronha-Hostler, J.; Parotto, P.; Vazquez, I.P.; Ratti, C.; Stafford, J.M. Freeze-out temperature from net-kaon fluctuations at energies available at the BNL Relativistic Heavy Ion Collider. Phys. Rev. C 2019, 99, 034912. [Google Scholar] [CrossRef] [Green Version]
- Colangelo, P.; Giannuzzi, F.; Nicotri, S. In-medium hadronic spectral functions through the soft-wall holographic model of QCD. J. High Energy Phys. 2012, 2012, 76. [Google Scholar] [CrossRef] [Green Version]
- Colangelo, P.; Giannuzzi, F.; Nicotri, S. Holographic Approach to Finite Temperature QCD: The Case of Scalar Glueballs and Scalar Mesons. Phys. Rev. D 2009, 80, 094019. [Google Scholar] [CrossRef] [Green Version]
- Colangelo, P.; Fazio, F.D.; Giannuzzi, F.; Jugeau, F.; Nicotri, S. Light scalar mesons in the soft-wall model of AdS/QCD. Phys. Rev. D 2008, 78, 055009. [Google Scholar] [CrossRef] [Green Version]
- Zöllner, R.; Kämpfer, B. Holographically emulating sequential versus instantaneous disappearance of vector mesons in a hot environment. Phys. Rev. C 2016, 94, 045205. [Google Scholar] [CrossRef] [Green Version]
- Zöllner, R.; Kämpfer, B. Holography at QCD-Tc. J. Phys. Conf. Ser. 2017, 878, 012023. [Google Scholar] [CrossRef] [Green Version]
- Zöllner, R.; Kämpfer, B. Holographic vector mesons in a dilaton background. J. Phys. Conf. Ser. 2018, 1024, 012003. [Google Scholar] [CrossRef]
- Braga, N.R.F.; Contreras, M.A.M.; Diles, S. Holographic model for heavy-vector-meson masses. EPL Europhys. Lett. 2016, 115, 31002. [Google Scholar] [CrossRef] [Green Version]
- Braga, N.R.F.; Contreras, M.A.M.; Diles, S. Holographic Picture of Heavy Vector Meson Melting. Eur. Phys. J. C 2016, 76, 598. [Google Scholar] [CrossRef]
- Fujita, M.; Fukushima, K.; Misumi, T.; Murata, M. Finite-temperature spectral function of the vector mesons in an AdS/QCD model. Phys. Rev. D 2009, 80, 035001. [Google Scholar] [CrossRef] [Green Version]
- Fujita, M.; Kikuchi, T.; Fukushima, K.; Misumi, T.; Murata, M. Melting Spectral Functions of the Scalar and Vector Mesons in a Holographic QCD Model. Phys. Rev. D 2010, 81, 065024. [Google Scholar] [CrossRef] [Green Version]
- Grigoryan, H.R.; Hohler, P.M.; Stephanov, M.A. Towards the Gravity Dual of Quarkonium in the Strongly Coupled QCD Plasma. Phys. Rev. D 2010, 82, 026005. [Google Scholar] [CrossRef] [Green Version]
- Braga, N.R.F.; Ferreira, L.F.; Vega, A. Holographic model for charmonium dissociation. Phys. Lett. B 2017, 774, 476–481. [Google Scholar] [CrossRef]
- Andreev, O. Aspects of quarkonium propagation in a thermal medium as seen by string models. Phys. Rev. D 2019, 100, 026013. [Google Scholar] [CrossRef] [Green Version]
- Vega, A.; Contreras, M.A.M. Melting of scalar hadrons in an AdS/QCD model modified by a thermal dilaton. Nucl. Phys. B 2019, 942, 410–418. [Google Scholar] [CrossRef]
- Mamani, L.A.H.; Miranda, A.S.; Zanchin, V.T. Melting of scalar mesons and black-hole quasinormal modes in a holographic QCD model. Eur. Phys. J. C 2019, 79, 435. [Google Scholar] [CrossRef]
- Dudal, D.; Mertens, T.G. Melting of charmonium in a magnetic field from an effective AdS/QCD model. Phys. Rev. D 2015, 91, 086002. [Google Scholar] [CrossRef] [Green Version]
- Bazavov, A.; Karsch, F.; Maezawa, Y.; Mukherjee, S.; Petreczky, P. In-medium modifications of open and hidden strange-charm mesons from spatial correlation functions. Phys. Rev. D 2015, 91, 054503. [Google Scholar] [CrossRef] [Green Version]
- Kim, S.; Petreczky, P.; Rothkopf, A. Quarkonium in-medium properties from realistic lattice NRQCD. J. High Energy Phys. 2018, 2018, 088. [Google Scholar] [CrossRef] [Green Version]
- Kruse, A.L.; Ding, H.T.; Kaczmarek, O.; Ohno, H.; Sandmeyer, H. Insight into Thermal Modifications of Quarkonia From a Comparison of Continuum-Extrapolated Lattice Results to Perturbative QCD. Proceedings 2019, 10, 45. [Google Scholar] [CrossRef] [Green Version]
- Larsen, R.; Meinel, S.; Mukherjee, S.; Petreczky, P. Excited bottomonia in quark-gluon plasma from lattice QCD. Phys. Lett. B 2020, 800, 135119. [Google Scholar] [CrossRef]
- Gubser, S.S.; Nellore, A. Mimicking the QCD equation of state with a dual black hole. Phys. Rev. D 2008, 78, 086007. [Google Scholar] [CrossRef] [Green Version]
- Finazzo, S.I.; Rougemont, R.; Marrochio, H.; Noronha, J. Hydrodynamic transport coefficients for the non-conformal quark-gluon plasma from holography. J. High Energy Phys. 2015, 2015, 51. [Google Scholar] [CrossRef]
- Finazzo, S.I.; Noronha, J. A holographic calculation of the electric conductivity of the strongly coupled quark-gluon plasma near the deconfinement transition. Phys. Rev. D 2014, 89, 106008. [Google Scholar] [CrossRef] [Green Version]
- Zöllner, R.; Kämpfer, B. Phase structures emerging from holography with Einstein gravity—Dilaton models at finite temperature. Eur. Phys. J. Plus 2020, 135, 304. [Google Scholar] [CrossRef]
- Bartz, S.P.; Dhumuntarao, A.; Kapusta, J.I. Dynamical AdS/Yang-Mills model. Phys. Rev. D 2018, 98, 026019. [Google Scholar] [CrossRef] [Green Version]
- Jarvinen, M.; Kiritsis, E. Holographic Models for QCD in the Veneziano Limit. J. High Energy Phys. 2012, 2012, 2. [Google Scholar] [CrossRef] [Green Version]
- Gursoy, U.; Kiritsis, E.; Mazzanti, L.; Michalogiorgakis, G.; Nitti, F. Improved Holographic QCD. In From Gravity to Thermal Gauge Theories: The AdS/CFT Correspondence; Lecture Notes in Physics; Springer: Berlin/Heidelberg, Germany, 2011; Volume 828, pp. 79–146. [Google Scholar]
- Borsanyi, S.; Fodor, Z.; Guenther, J.; Kampert, K.-H.; Katz, S.D.; Kawanai, T.; Kovacs, T.G.; Mages, S.W.; Pasztor, A.; Pittler, F.; et al. Calculation of the axion mass based on high-temperature lattice quantum chromodynamics. Nature 2016, 539, 69–71. [Google Scholar] [CrossRef] [Green Version]
- Karch, A.; Katz, E.; Son, D.T.; Stephanov, M.A. Linear confinement and AdS/QCD. Phys. Rev. D 2006, 74, 015005. [Google Scholar] [CrossRef] [Green Version]
- Afonin, S.S. Generalized Soft Wall model. Phys. Lett. B 2013, 719, 399–403. [Google Scholar] [CrossRef] [Green Version]
- Chumbes, A.E.R.; da Silva, J.M.H.; Hott, M.B. A model to localize gauge and tensor fields on thick branes. Phys. Rev. D 2012, 85, 085003. [Google Scholar] [CrossRef] [Green Version]
- Eto, M.; Kawaguchi, M. Localization of gauge bosons and the Higgs mechanism on topological solitons in higher dimensions. J. High Energy Phys. 2019, 2019, 98. [Google Scholar] [CrossRef] [Green Version]
- Arai, M.; Blaschke, F.; Eto, M.; Sakai, N. Grand Unified Brane World Scenario. Phys. Rev. D 2017, 96, 115033. [Google Scholar] [CrossRef] [Green Version]
- Braga, N.R.F.; Ferreira, L.F. Heavy meson dissociation in a plasma with magnetic fields. Phys. Lett. B 2018, 783, 186–192. [Google Scholar] [CrossRef]
- Zöllner, R.; Kampfer, B. Holographic vector meson melting in a thermal gravity-dilaton background related to QCD. Eur. Phys. J. Spec. Top. 2020, 229, 3585–3594. [Google Scholar] [CrossRef]
- Hohler, P.M.; Yin, Y. Charmonium moving through a strongly coupled QCD plasma: A holographic perspective. Phys. Rev. D 2013, 88, 086001. [Google Scholar] [CrossRef] [Green Version]
- Teaney, D. Finite temperature spectral densities of momentum and R-charge correlators in N = 4 Yang Mills theory. Phys. Rev. D 2006, 74, 045025. [Google Scholar] [CrossRef] [Green Version]
- Ebert, D.; Faustov, R.N.; Galkin, V.O. Spectroscopy and Regge trajectories of heavy quarkonia and Bc mesons. Eur. Phys. J. C 2011, 71, 1825. [Google Scholar] [CrossRef]
- Hoelck, J.; Nendzig, F.; Wolschin, G. In-medium Υ suppression and feed-down in UU and PbPb collisions. Phys. Rev. C 2017, 95, 024905. [Google Scholar] [CrossRef] [Green Version]
- Du, X.; Liu, S.Y.F.; Rapp, R. Extraction of the Heavy-Quark Potential from Bottomonium Observables in Heavy-Ion Collisions. Phys. Lett. B 2019, 796, 20–25. [Google Scholar] [CrossRef]
- Du, X.; Rapp, R.; He, M. Color Screening and Regeneration of Bottomonia in High-Energy Heavy-Ion Collisions. Phys. Rev. C 2017, 96, 054901. [Google Scholar] [CrossRef] [Green Version]
Figure 1.
Constant ground state masses (fat solid lines) and the respective first excitations (dashed lines; a ±5% corridor is depicted by colored bands) at over the dimensionless a–b plane of the potential (12). Color code: green—; red—. The bullets mark selected parameters for the spectral functions exhibited in Figure 2. The black curves exhibit the loci at which the peaks of the spectral functions completely disappear, i.e., they represent the contours of melting temperatures , 200, and 250 MeV. That is, for a given point (a, b) in the parameter space, the spectral function in the energy range of the ground state displays a peak only for .

Figure 2.
Spectral functions of (top row) and (bottom row) in the ground state (g.s.) energy region at (blue), 150 (green), and 200 MeV (red). For parameters (a, b) on the g.s. trajectories, i.e., for PDG values of . The values of (a, b) are given in the legends; these positions are marked in Figure 1 by bullets.

Figure 3.
Bottomonium formation. Top row: contour plots of the spectral functions (the red dashed curves depict the peak position of the respective spectral function; they terminate at ; dashed horizontal lines indicate MeV), bottom row: spectral functions at several temperatures ( (blue), 150 (green), and 200 MeV (red), left column: for potential parameters (a, b) = (0.6924, 4.9571), i.e., at such values where the trajectories cross; right column: (a, b) = (1.3266, 4.3229), i.e., at crossing points of the trajectory with the upper limit of the 10% corridor of the respective first excitation ( MeV).

Figure 4.
Charmonium formation. Top row: contour plots of the spectral functions , bottom row: spectral functions in the energy region of g.s. and first excitation at several temperatures ( (blue), 150 (green), and 200 MeV (red)), left column: (a, b) = (0.2522, 0.3533) i.e., at such values where the trajectories cross; right column: (a, b) = (0.338, 0.2675), i.e., at crossing points of the trajectory with the upper limit of the 10% corridor of the respective first excitation.

Figure 5.
Positions of the peaks of the spectral functions of (left panel) and (right panel) as a function of temperature. The right end points of the solid curves define fore the g.s. (lower blue solid curves) and first excitation (upper green dotted curves). The dashed lines depict the masses squared at . The difference of the solid or dotted curves to the dashed lines is termed “thermal mass shift” squared. For (a, b) = (1.3266, 4.3229) and (0.338, 0.2675), as in the right columns of Figure 3 and Figure 4.

Figure 6.
Left panel: the potential from (14) (upper fat solid curves) and the resulting from (5)–(8) (lower dashed curves) as a function of z for GeV and values (blue), (green), and (red). The dashed horizontal line depicts the g.s. mass squared from which is the same for all three parameter selections. Right panel: the trajectories with PDG values in the k-M plane at GeV. The % corridor is depicted as a colored band. The three parameter pairs of the left panel are shown by bullets.

Figure 7.
Charmonium formation in the three-parameter potential (14). Top row: contour plots of the spectral functions (the red dashed red curves depict the peak positions of the spectral functions); bottom row: spectral functions for a few selected values of the temperature, (blue), 150 (green), and 200 MeV (red); left column: GeV (yielding PDG values of , MeV); right column: GeV (yielding and %, MeV).

Figure 8.
Charmonium formation in the potential (14) for the parameter set GeV favored in [58], here combined with the QCD-related background. Left panel: contour plot of the charmonium spectral function . The dashed red curves are for the first two peak positions ( MeV). The dashed horizontal line indicates MeV; Right panel: spectral functions at temperatures of 100 (blue), 150 (green), and 200 (red) MeV.

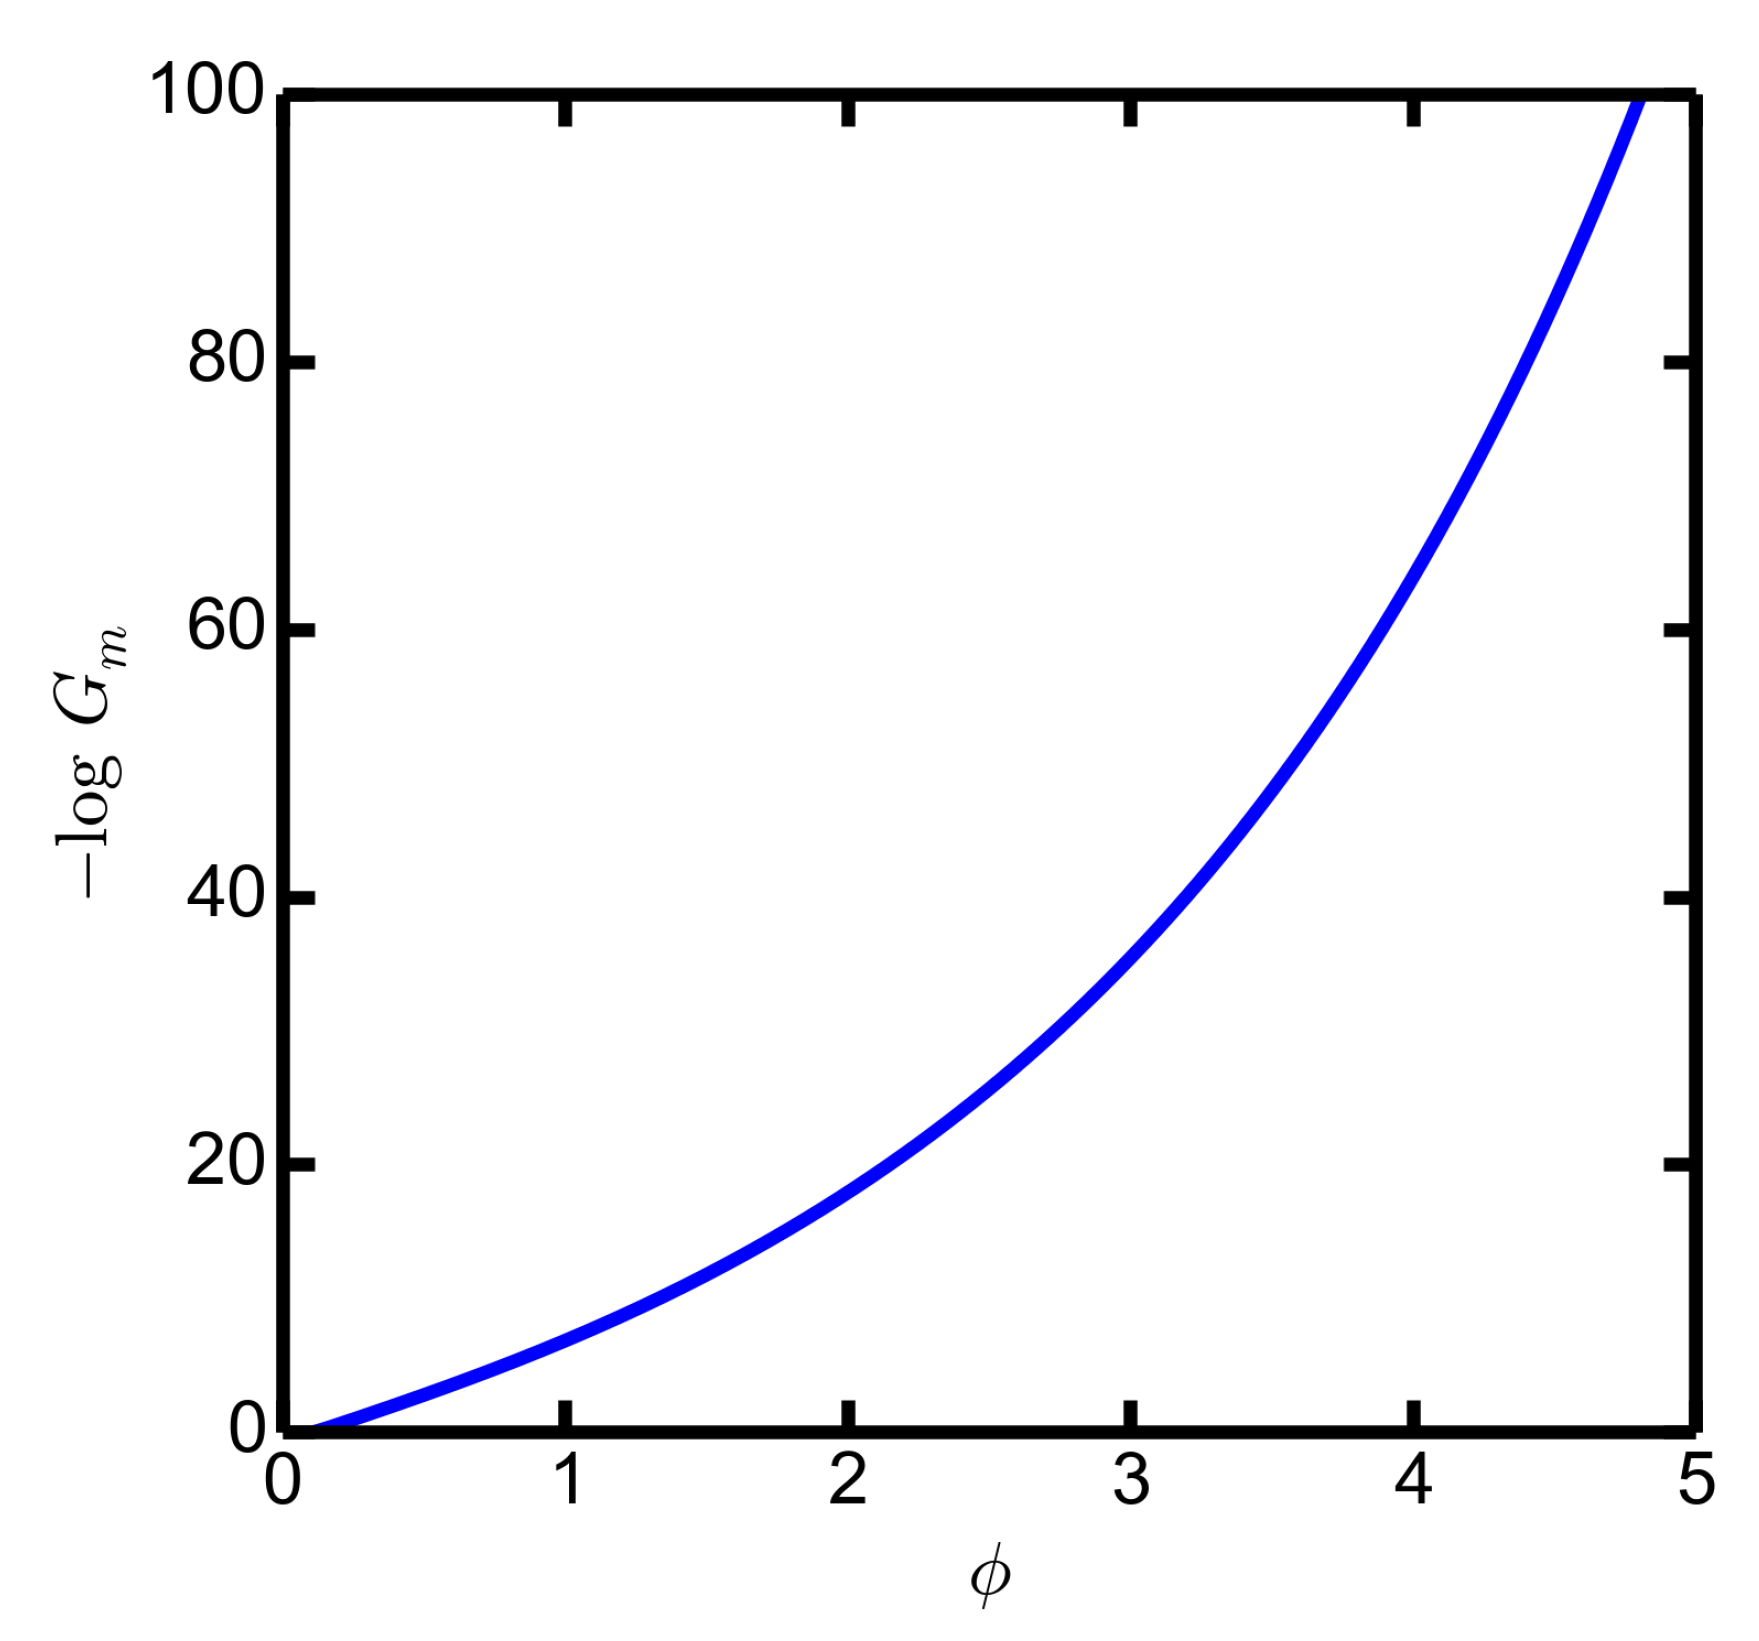
Figure 9.
The quantity calculated from Equations (7) and (8) with , deduced from the thermodynamics in Appendix A and the potential (14) with GeV yielding PDG values of charmonium masses . is supposed to be independent of temperature.
Figure 9.
The quantity calculated from Equations (7) and (8) with , deduced from the thermodynamics in Appendix A and the potential (14) with GeV yielding PDG values of charmonium masses . is supposed to be independent of temperature.

Publisher’s Note: MDPI stays neutral with regard to jurisdictional claims in published maps and institutional affiliations. |
© 2021 by the authors. Licensee MDPI, Basel, Switzerland. This article is an open access article distributed under the terms and conditions of the Creative Commons Attribution (CC BY) license (https://creativecommons.org/licenses/by/4.0/).
Share and Cite
MDPI and ACS Style
Zöllner, R.; Kämpfer, B. Quarkonia Formation in a Holographic Gravity–Dilaton Background Describing QCD Thermodynamics. Particles 2021, 4, 159-177. https://0-doi-org.brum.beds.ac.uk/10.3390/particles4020015
AMA Style
Zöllner R, Kämpfer B. Quarkonia Formation in a Holographic Gravity–Dilaton Background Describing QCD Thermodynamics. Particles. 2021; 4(2):159-177. https://0-doi-org.brum.beds.ac.uk/10.3390/particles4020015
Chicago/Turabian StyleZöllner, Rico, and Burkhard Kämpfer. 2021. "Quarkonia Formation in a Holographic Gravity–Dilaton Background Describing QCD Thermodynamics" Particles 4, no. 2: 159-177. https://0-doi-org.brum.beds.ac.uk/10.3390/particles4020015