
Relating Charged Particle Multiplicity to Impact Parameter in Heavy-Ion Collisions at NICA Energies


Moscow Engineering Physics Institute, National Research Nuclear University, 115409 Moscow, Russia
*
Author to whom correspondence should be addressed.
Particles 2021, 4(2), 275-287; https://0-doi-org.brum.beds.ac.uk/10.3390/particles4020024
Submission received: 30 April 2021
/
Revised: 30 May 2021
/
Accepted: 31 May 2021
/
Published: 4 June 2021
(This article belongs to the Special Issue Analysis Techniques and Physics Performance Studies for FAIR and NICA)
Abstract
:The size and evolution of the matter created in relativistic heavy-ion collisions strongly depend on collision geometry, defined by the impact parameter. However, the impact parameter cannot be measured directly in an experiment but might be inferred from final state observables using the centrality procedure. We present the procedure of centrality determination for the Multi-Purpose Detector (MPD) at the NICA collider and its performance using the multiplicity of produced charged particles at midrapidity. The validity of the procedure is assessed using the simulated data for Au + Au collisions at = 4–11 GeV.
1. Introduction
One of the main purposes of the upcoming Multi-Purpose Detector (MPD) at the Nuclotron based Ion Collider fAcility (NICA) is to study the properties of the strongly interacting matter created in relativistic heavy-ion collisions [1]. NICA will operate at energies in the range of = 4 to 11 GeV per nucleon pair, which will provide the possibility to investigate the matter in the region of high net-baryon density. Centrality is a very important concept for heavy-ion collisions, which characterizes the size of the overlap region in the collision. The physics observables from relativistic heavy-ion collisions, such as transverse momentum spectra, the anisotropic flow coefficients , the HBT radii, etc., are then presented for various centralities. Ideally, the impact parameter (b), the distance between the centers of two colliding ions in the transverse plane, should be used to define the collision centrality [2]. It is a well-defined quantity and a key input to theoretical calculations of heavy-ion collisions. However, one cannot directly measure the impact parameter in an experiment [3]. Experimental heavy-ion collisions can be characterized by the measured particle multiplicities around midrapidity (or the total transverse energy) or by the energy measured in the forward rapidity region, which is sensitive to the spectator fragments. The measured () distribution is divided into percentile centrality classes, with the most central class defined by X% of events with the highest value of (smallest forward energy ), which corresponds to small values of the impact parameter b. This is referred to as 0–X% centrality. The different detector systems should be used for the determination of the collision centrality and for the measurement of the physics observables in order to avoid nontrivial autocorrelations associated with event selection. The correlation between measured () and b of the collision is then inferred by fitting a specific model of the collision dynamics to experimental data. Then this model is used to extract information about b. Experiments at high energies usually employ the Monte-Carlo Glauber (MC-Glauber) approach [4] coupled with a simple model of particle production for this purpose [5,6]. The Glauber model also provides estimates for many other parameters that describe the initial collision geometry, such as eccentricities, which describe the azimuthal asymmetry in the distribution of the sources in the transverse plane. While this approach offers a convenient parametrization of the measured distributions, it may suffer from systematic uncertainties, and limitations of the Glauber model [3]. At lower energies (relevant to the NICA program), the spectator-participant paradigm becomes less justified [7,8,9]. Recently, a new method for reconstructing the impact parameter b distributions from the measured was proposed [10,11]. The -fit method is based on the assumption that the relation between the measured and b is purely probabilistic and can be inferred from data without relying on any specific model of collisions. This typical inverse problem can be solved by a deconvolution method. A gamma distribution is used for the fluctuation kernel to model fluctuations of at a fixed impact parameter. The parameters of the gamma distribution were then extracted by fitting the measured distribution of .
In this work, we present the procedure of centrality determination for the Multi-Purpose Detector at NICA and its performance using the multiplicity of produced charged particles at midrapidity. In order to reconstruct the impact parameter distribution, the MC-Glauber approach and -fit method have been employed. The validity of the procedure has been checked using the simulated data for Au + Au collisions at = 4.5, 7.7, and 11.5 GeV.
2. Impact Parameter Estimation from the Multiplicity of Charged Particles
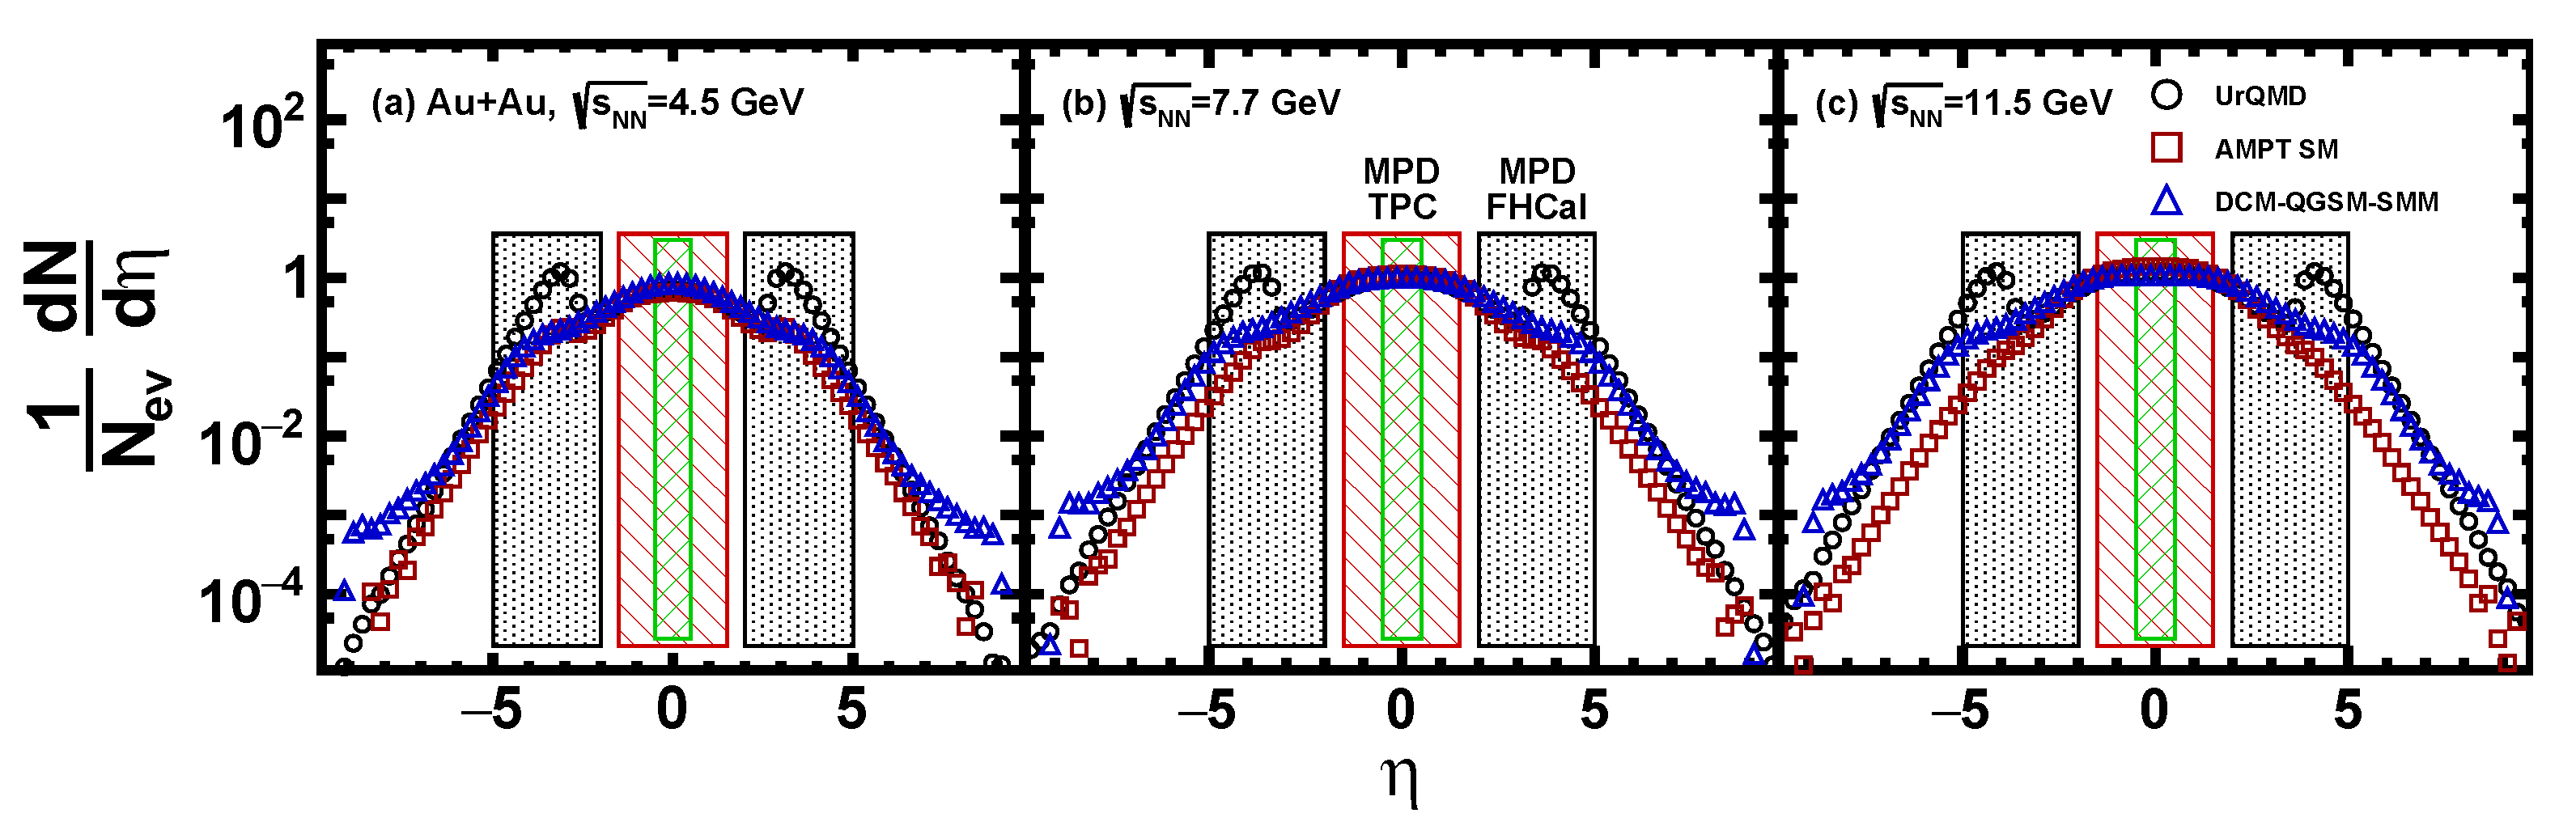
In this section, we describe the construction of the impact parameter estimators based on the MC-Glauber [5,6] and -fit methods [10,11] from the output of transport model calculations. We have used several Monte Carlo models to simulate Au + Au collisions at NICA energies: the cascade mode of UrQMD (Ultrarelativistic Quantum Molecular Dynamics) [12], string melting version of AMPT-SM (A Multi-phase transport) [13], and DCM-QGSM-SMM(hybrid model based on Dubna Cascade Model, the Quark-Gluon String Model, and the Statistical Multifragmentation Models) [14,15]. In total, the sample of 1 M minimum bias Au + Au events has been generated by each model for collision energies: = 4.5, 7.7, and 11.5 GeV. The selected collision energies can be used in the future for the direct comparison of the first MPD results with published results from the Beam Energy Scan program of the STAR experiment at RHIC [8,16]. The centrality definition in the STAR experiment is based on the measured charged particle multiplicity from the Time Projection Chamber (TPC) within pseudorapidity 0.5, uncorrected for detection efficiencies. We have applied the same acceptance cuts in our analysis. Figure 1 shows the resulting pseudorapidity distributions of the selected charged particles produced in Au + Au collisions at collision energies = 4.5, 7.7, and 11.5 GeV generated by UrQMD, AMPT SM, and DCM-QGSM-SMM models.
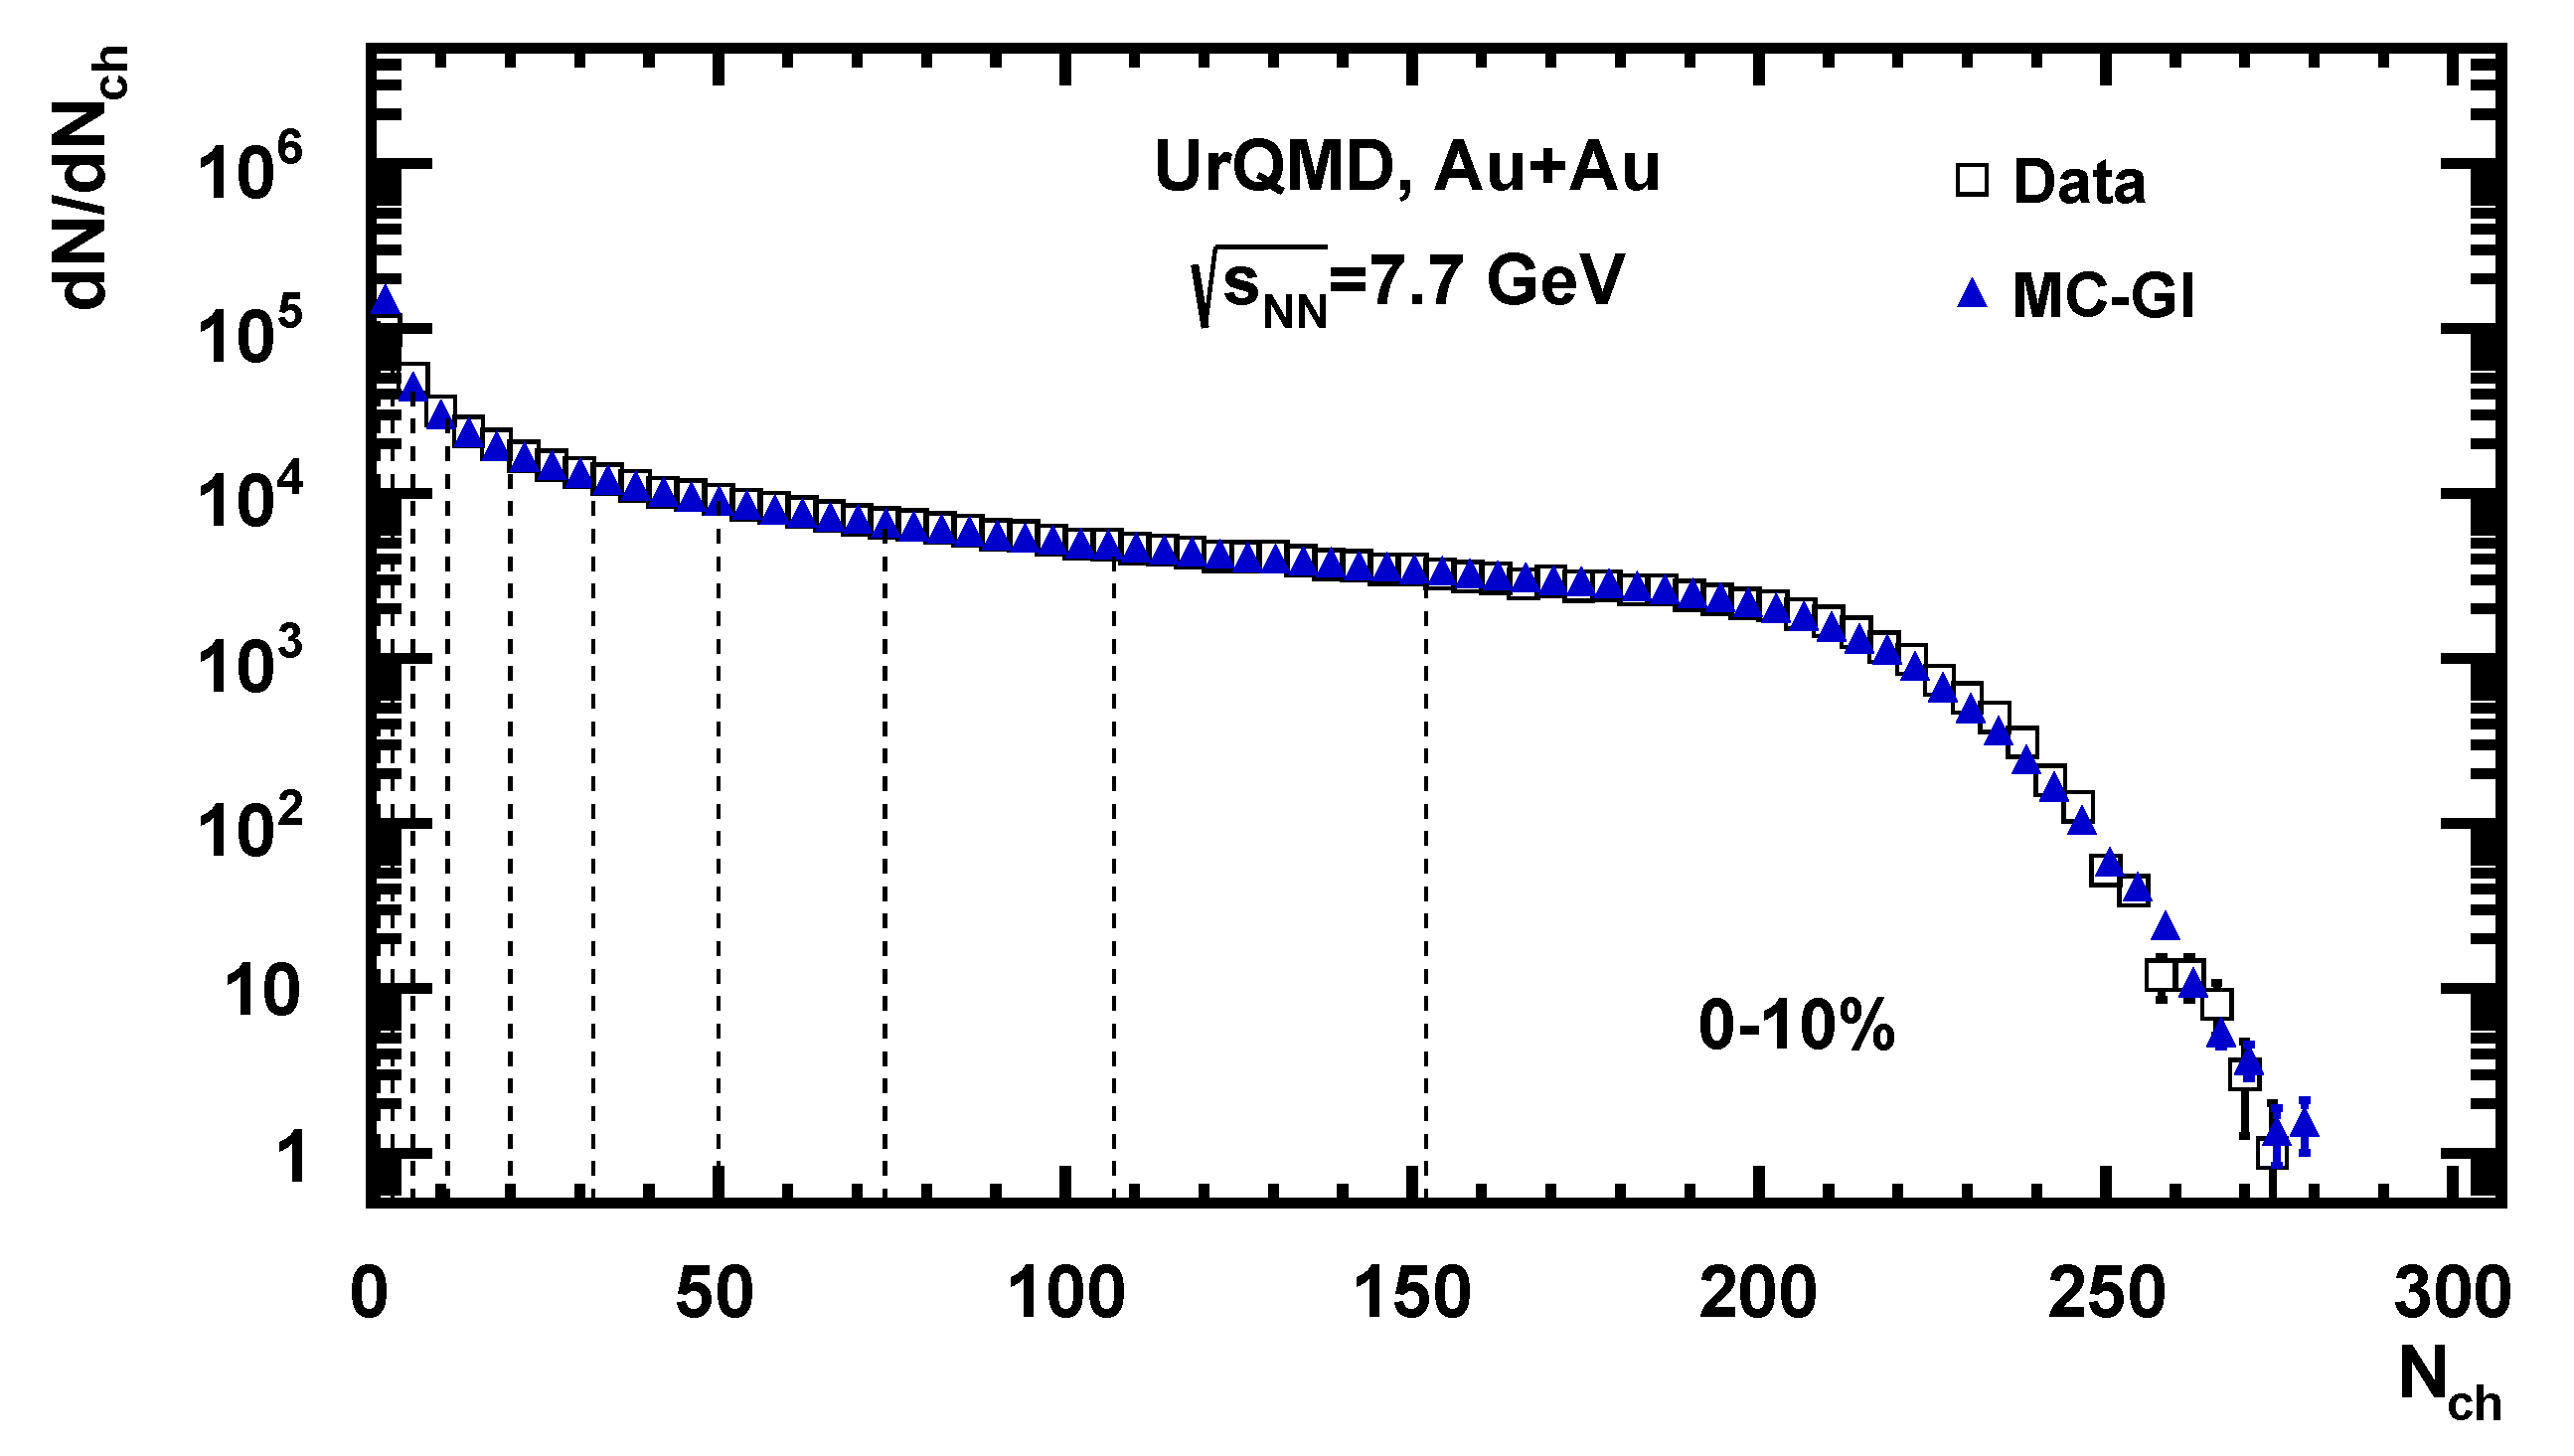
As an example, Figure 2 shows the charged particle multiplicity distribution for Au + Au collisions at = 7.7 GeV obtained from the analysis of events from the UrQMD model (open squares).
2.1. Centrality Determination Using MC-Glauber Approach
The purpose of Monte Carlo implementations of the Glauber model [17] is to compose two nuclei out of nucleons and simulate their collision process event-by-event. In this model, a collision is described as individual interactions of the constituent nucleons. It assumes that at sufficiently high energy, nucleons pass each other undeflected and move independently inside the nucleus. Geometrical properties of the collision, such as the impact parameter b, number of participating nucleons (), and number of binary nucleon-nucleon collisions (), are calculated by simulating many nucleus-nucleus collisions. In the present work, we use the 3.2 version of the PHOBOS MC-Glauber approach [4]. At the next step, one can couple the MC-Glauber with the simple model of particle production based on a negative binomial distribution (NBD) [5,6]. The produced particle multiplicity distribution can then be fitted to the experimentally measured one. Mean values of geometrical quantities are then calculated for centrality classes defined according to their multiplicity. The first step in the MC-Glauber approach is to prepare a model of the two nuclei by defining the position of the nucleons in each nucleus stochastically. The nucleon position in the Au nucleus is determined by the nuclear density function, parametrized by Fermi distribution:
where R is the radius of the nucleus, is density in the center of the nucleus; a is the skin thickness of the nucleus, which defines how quickly the nuclear density falls off near the edge of the nucleus. The additional parameter w is needed to describe nuclei whose maximum density is reached at radii . For Au, the parameters are set to fm, fm, [18]. Two nucleons from different nuclei are assumed to collide if the relative transverse distance d between centers is less than the distance corresponding to the inelastic nucleon-nucleon cross section: . For selected energies, the values of are set to 29.3, 29.7, and 31.2 mb for = 4.5, 7.7, and 11.5 GeV, correspondingly [19].
The MC-Glauber defines the corresponding number of participating nucleons () and the number of binary nucleon-nucleon collisions () for an event with a given impact parameter b. The multiplicity of a heavy-ion collision is modeled as a sum of particles produced from a set of independent emitting sources (“ancestors”) [5,6]. Each ancestor produces particles according to a negative binomial distribution (NBD) with mean multiplicity per ancestor and width parameter k:
The parameterization is inspired by two-component models, which decompose nucleus–nucleus collisions into soft and hard interactions. In this approach, the soft interactions contribute to the multiplicity dependence as , while hard interactions as . The track multiplicity distribution for the charged particles in TPC is simulated for an ensemble of events and various values of the NBD parameters , k, and the parameter f [5,6]. A minimization procedure is applied to find the optimal set of parameters that result in the smallest fitting criteria . As an example, Figure 2 shows the charged particle multiplicity distribution (open squares) with the MC-Glauber fit function (blue solid triangles). With the final set of parameters (f, , k), the mean value of impact parameter can be extracted for the centrality classes defined by the sharp cuts in the multiplicity distribution—see the dotted vertical lines in Figure 2.
2.2. Centrality Determination Using the -Fit Method
The -fit method [10,11] is based on the assumption that the relation between the measured and impact parameter b is purely probabilistic and can be inferred from the experimental data without relying on any specific model of collisions. The measured multiplicity distribution, , is obtained by summing the contributions to multiplicity at all impact parameters:
where is the probability distribution of the impact parameter and denotes the centrality, defined as the cumulative distribution of the impact parameter: . denotes that the distribution is normalized . is the probability of at fixed b. The probability distribution of b reads
where is the probability for an inelastic collision to occur at a given b, and is the inelastic nucleus–nucleus cross section. The probability for an inelastic collision is close to 1 for nonperipheral collisions, and in this method of centrality determination, the approximation is used. A gamma distribution is used for the fluctuation kernel to model the fluctuations of at a fixed impact parameter:
where k and are two positive parameters, which generally depend on . They define the shape of the multiplicity distribution and can be attributed to the mean and standard deviation of the distribution: . One assumes that the mean is a smooth, monotonously decreasing function of . To define the variable k, we used the following parameterization:
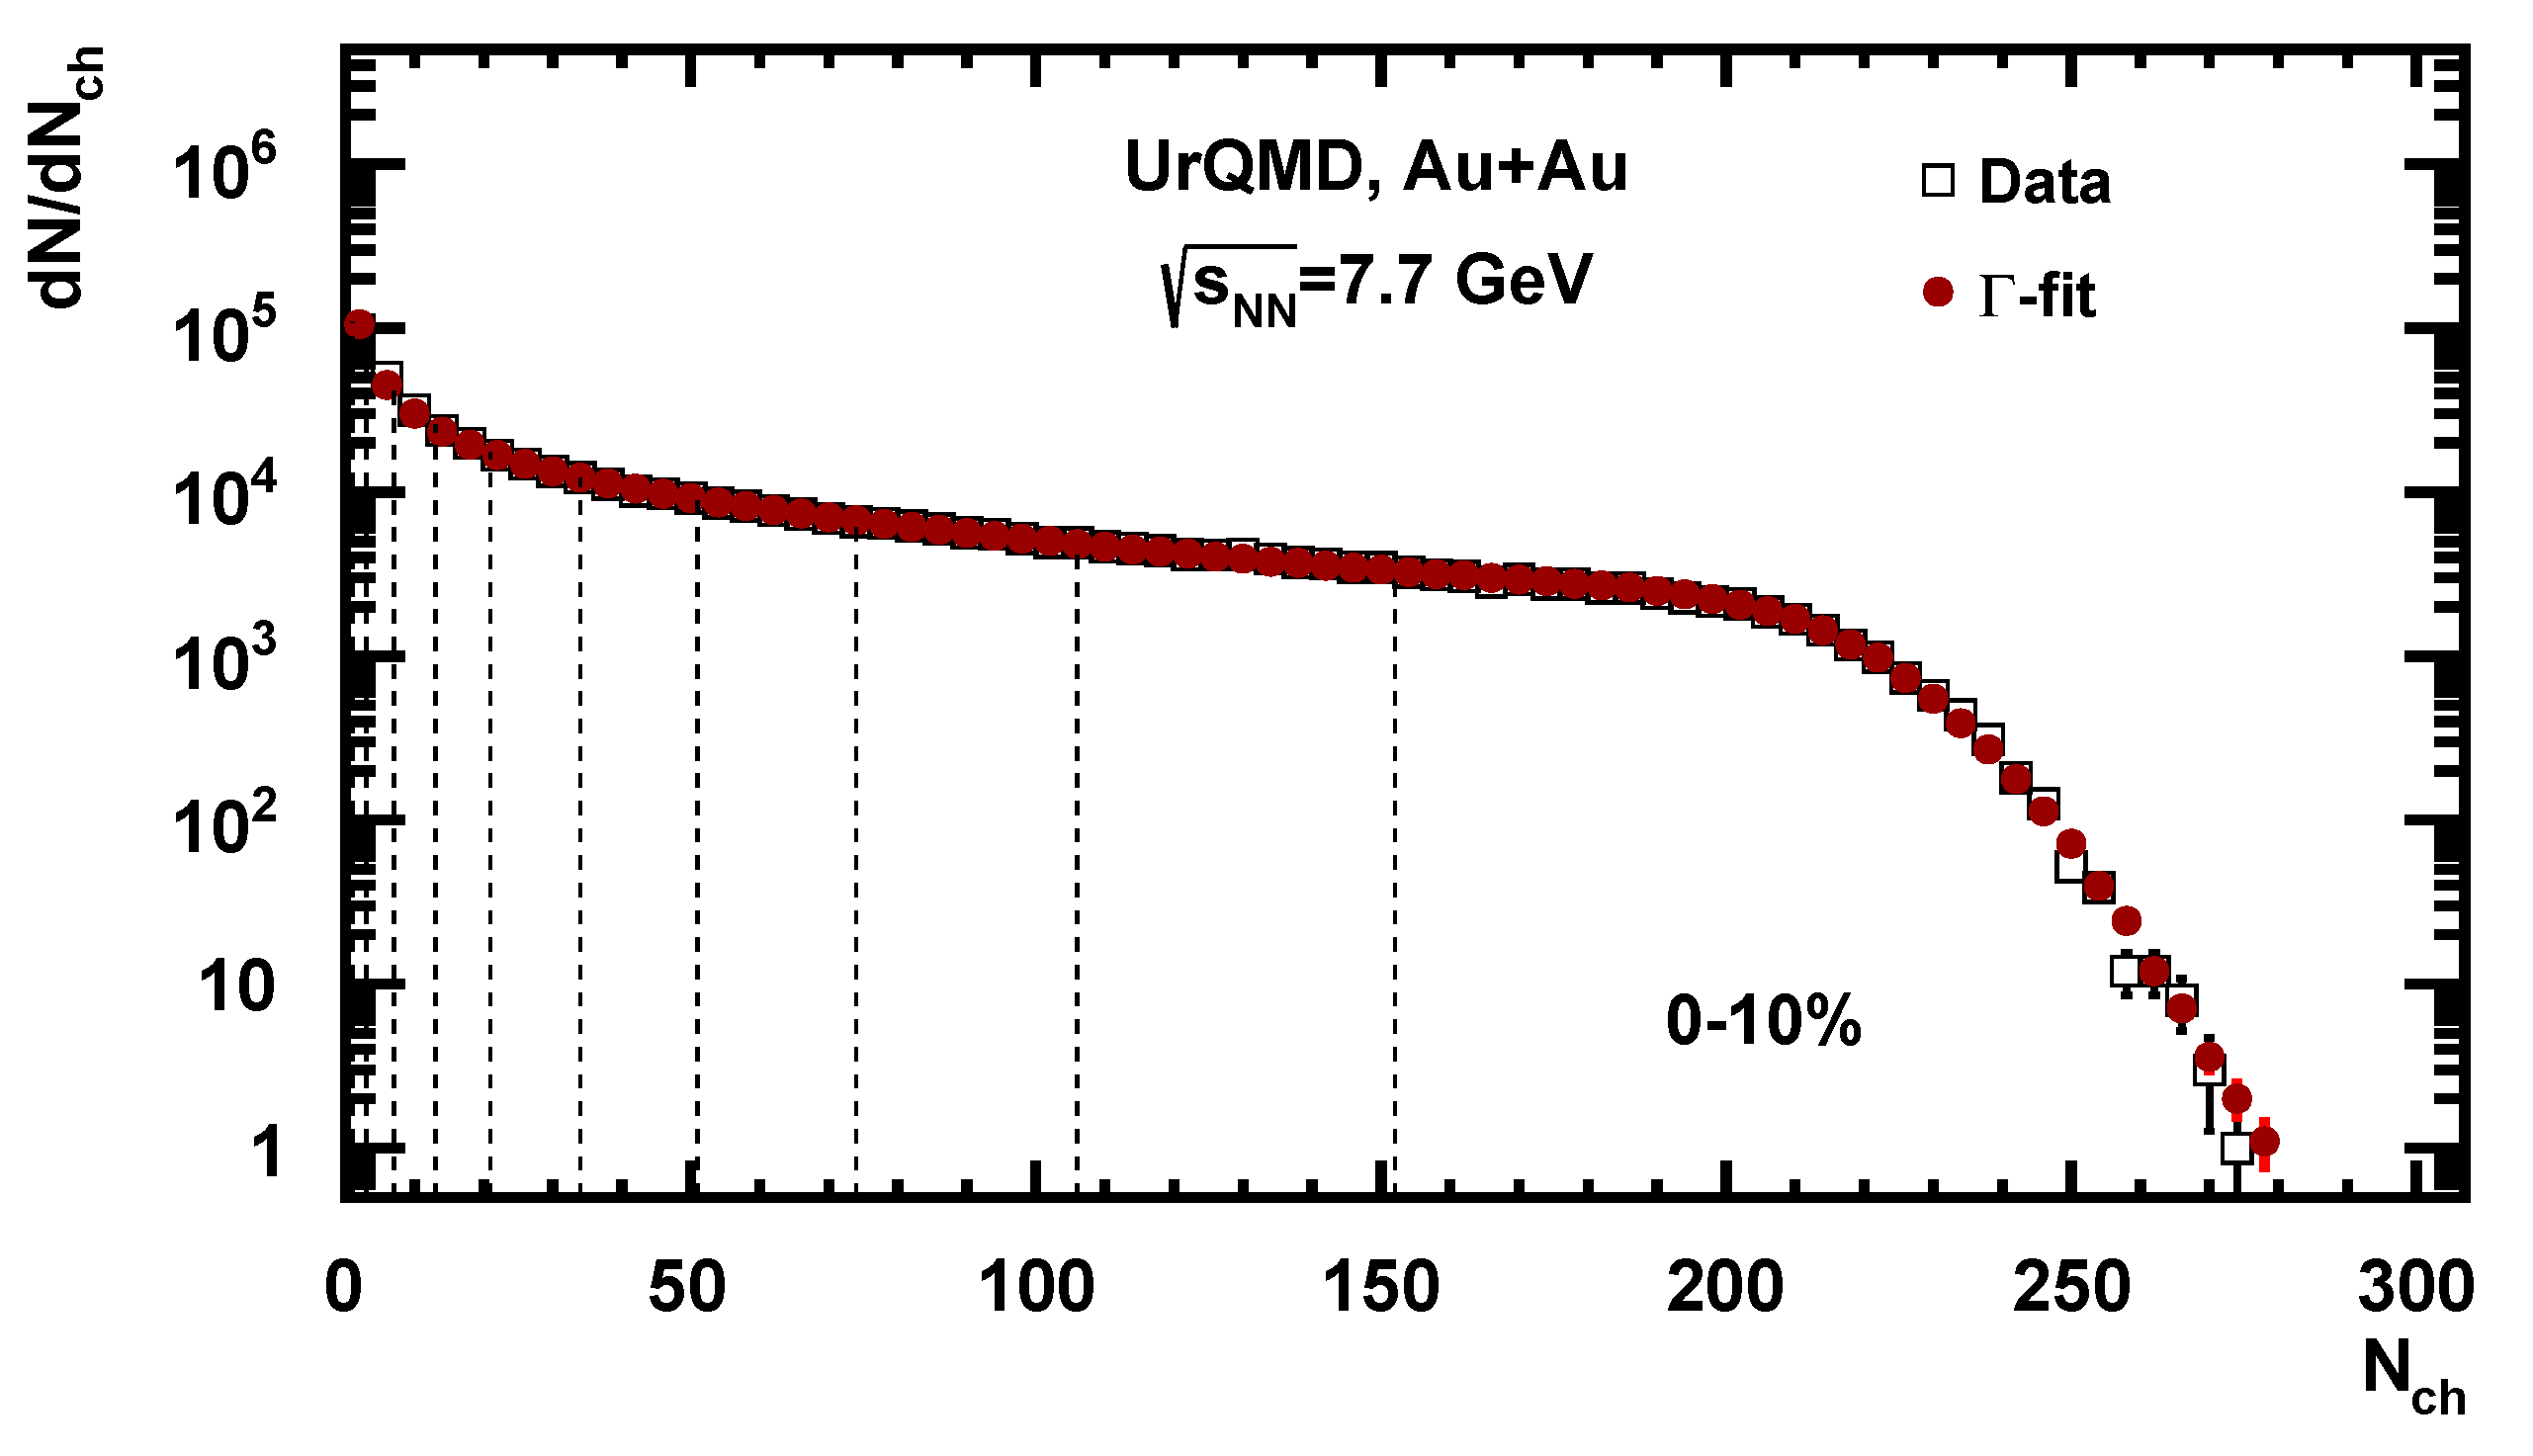
As a result, we have five fitting parameters , , and . The parameters of the gamma distribution were then extracted by fitting the measured distribution of [10,11]. We then tested the procedure on the same charged particle multiplicity distribution from the UrQMD model for Au + Au collisions at = 7.7 GeV—see Figure 3. The result of the fit is shown as red circles. The fit returns the parameters of the gamma distribution in Equation (5), which allows us to reconstruct the probability of at fixed centrality . The probability distribution of impact parameter, b, at fixed , can be obtained by Bayes’ theorem: , where is given by Equation (5) and [10,11].
3. Results
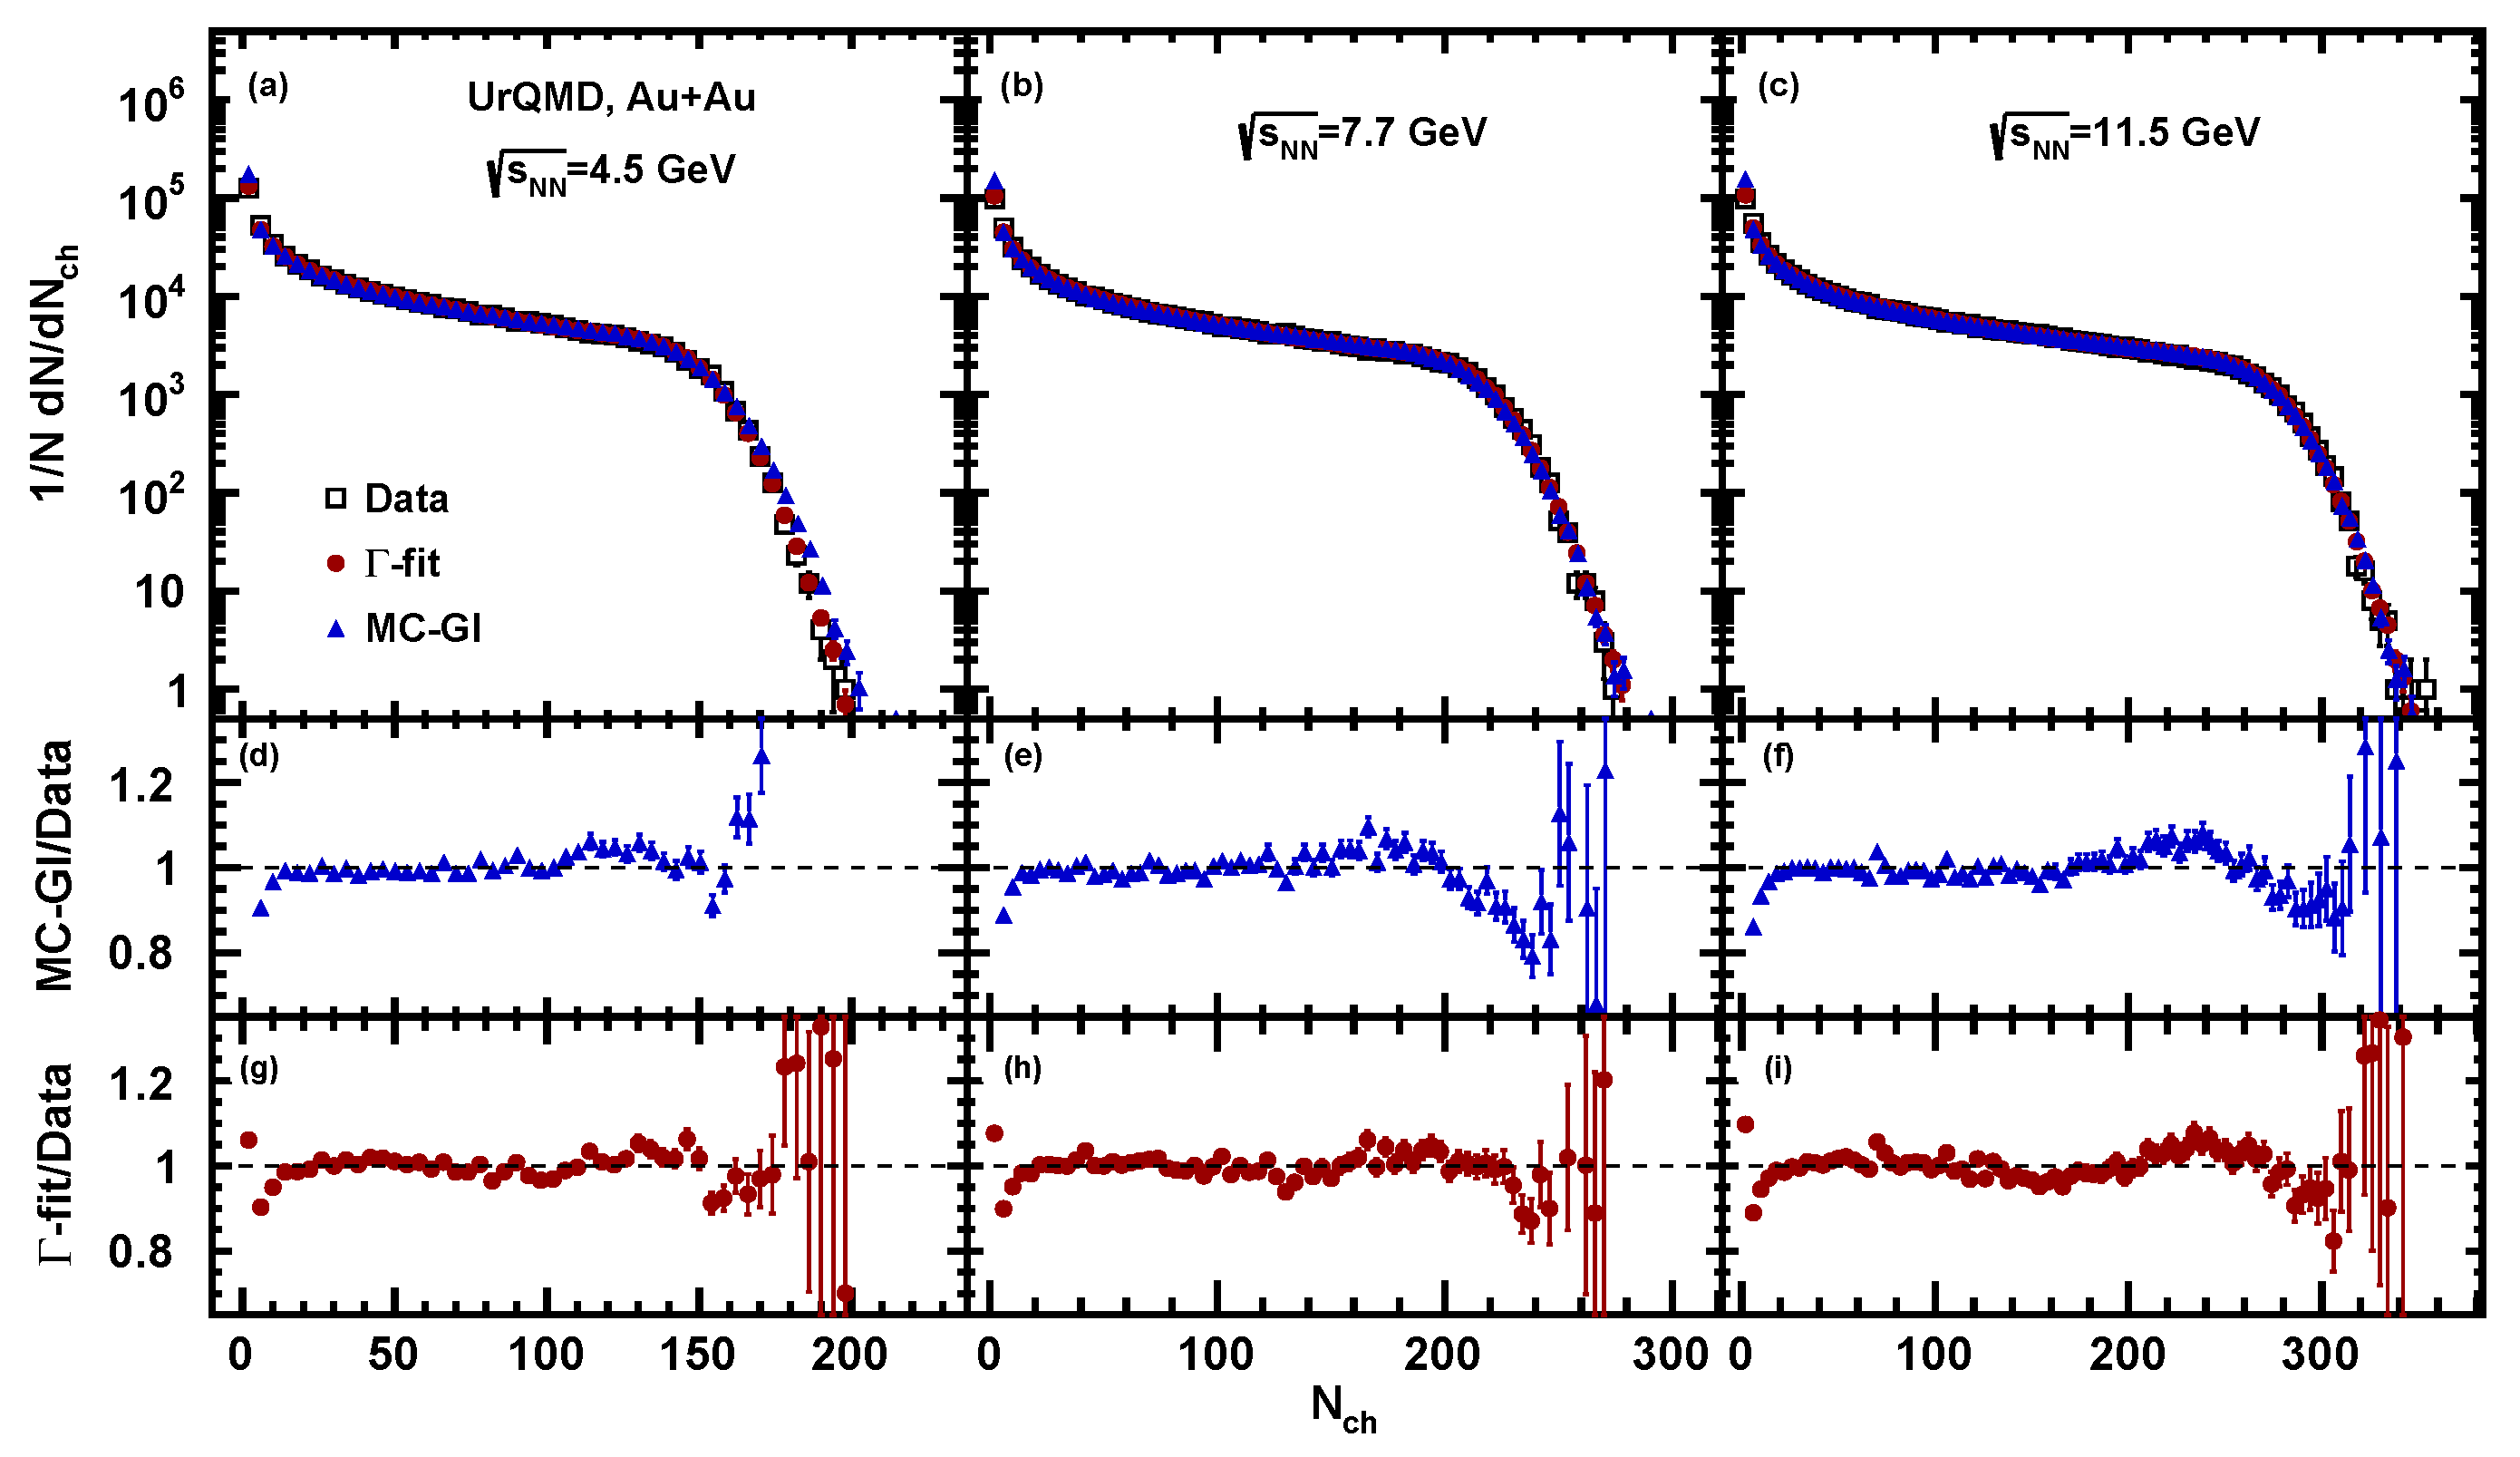
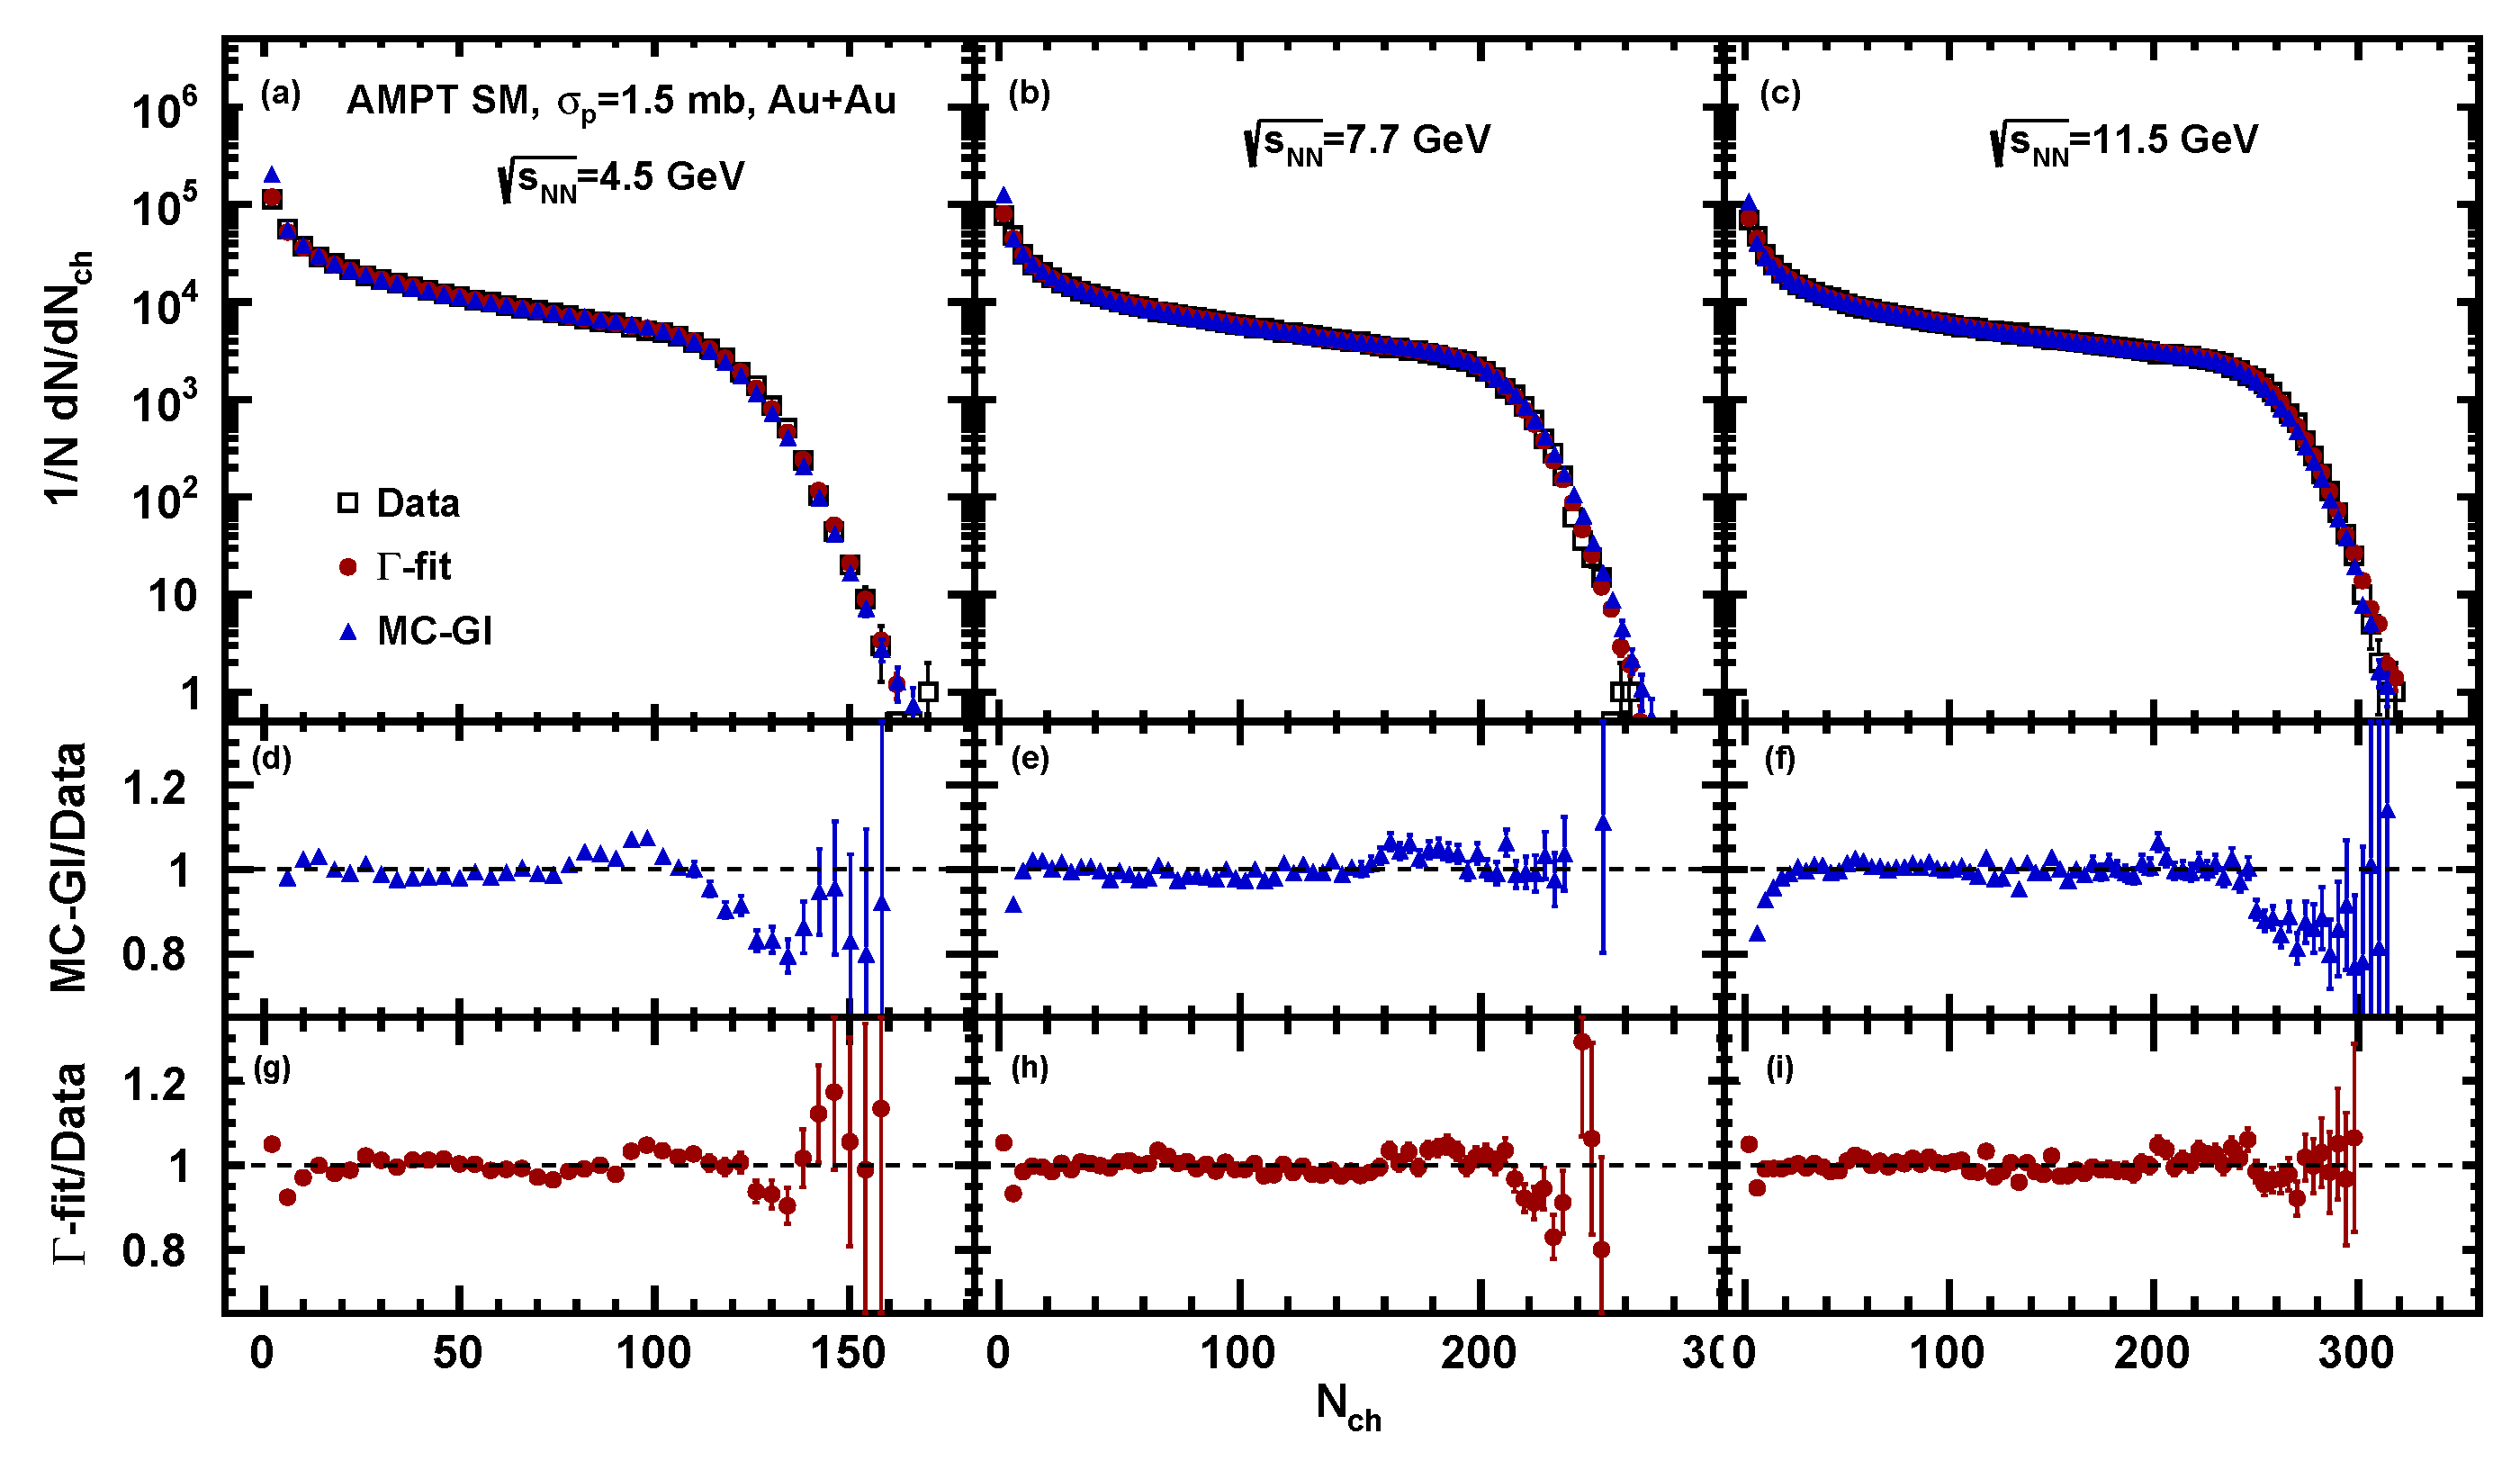
Figure 4, Figure 5 and Figure 6 show the resulting multiplicity distribution of charged particles for Au + Au collisions at = 4.5, 7.7, and 11.5 GeV for UrQMD, AMPT SM, and DCM-QGSM-SMM models (black open boxes). The results of the fitting procedure by MC-Glauber (blue solid triangles) and -fit (red solid squares) methods are displayed together with the model data in the top panels of Figure 4, Figure 5 and Figure 6. The bottom panels display the ratio of the resulting fit functions to the charged particle multiplicity distribution.
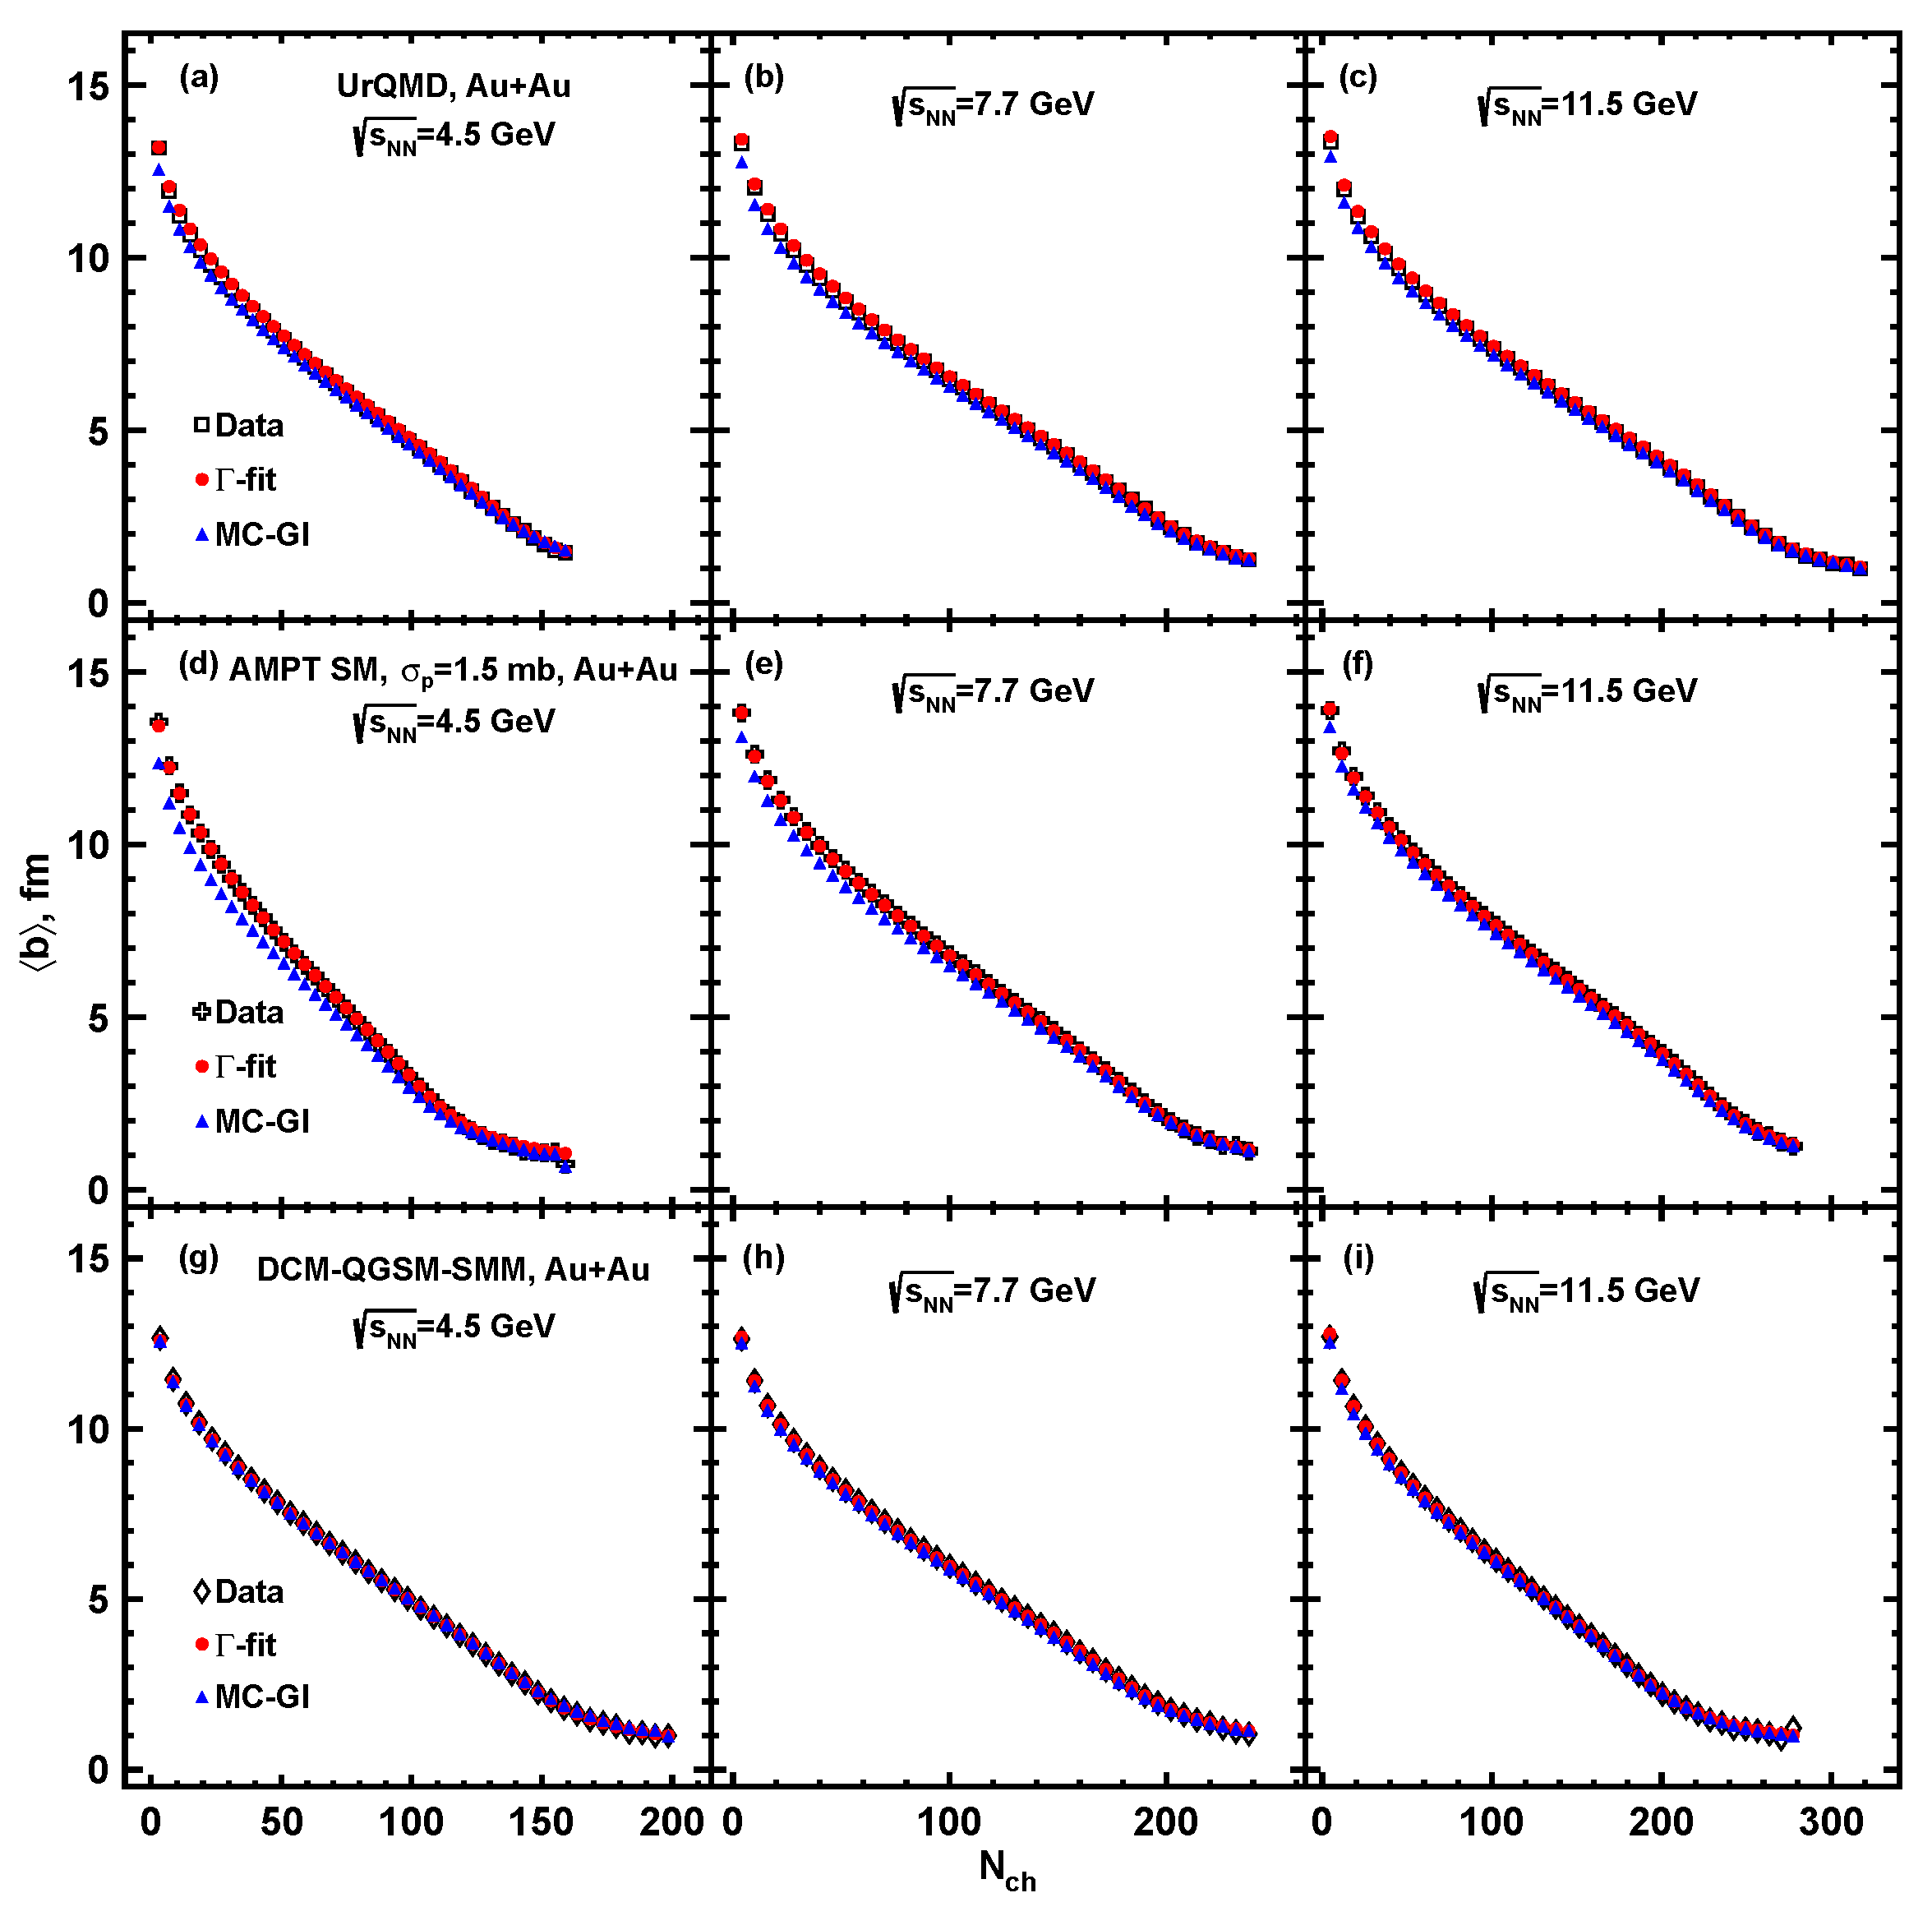
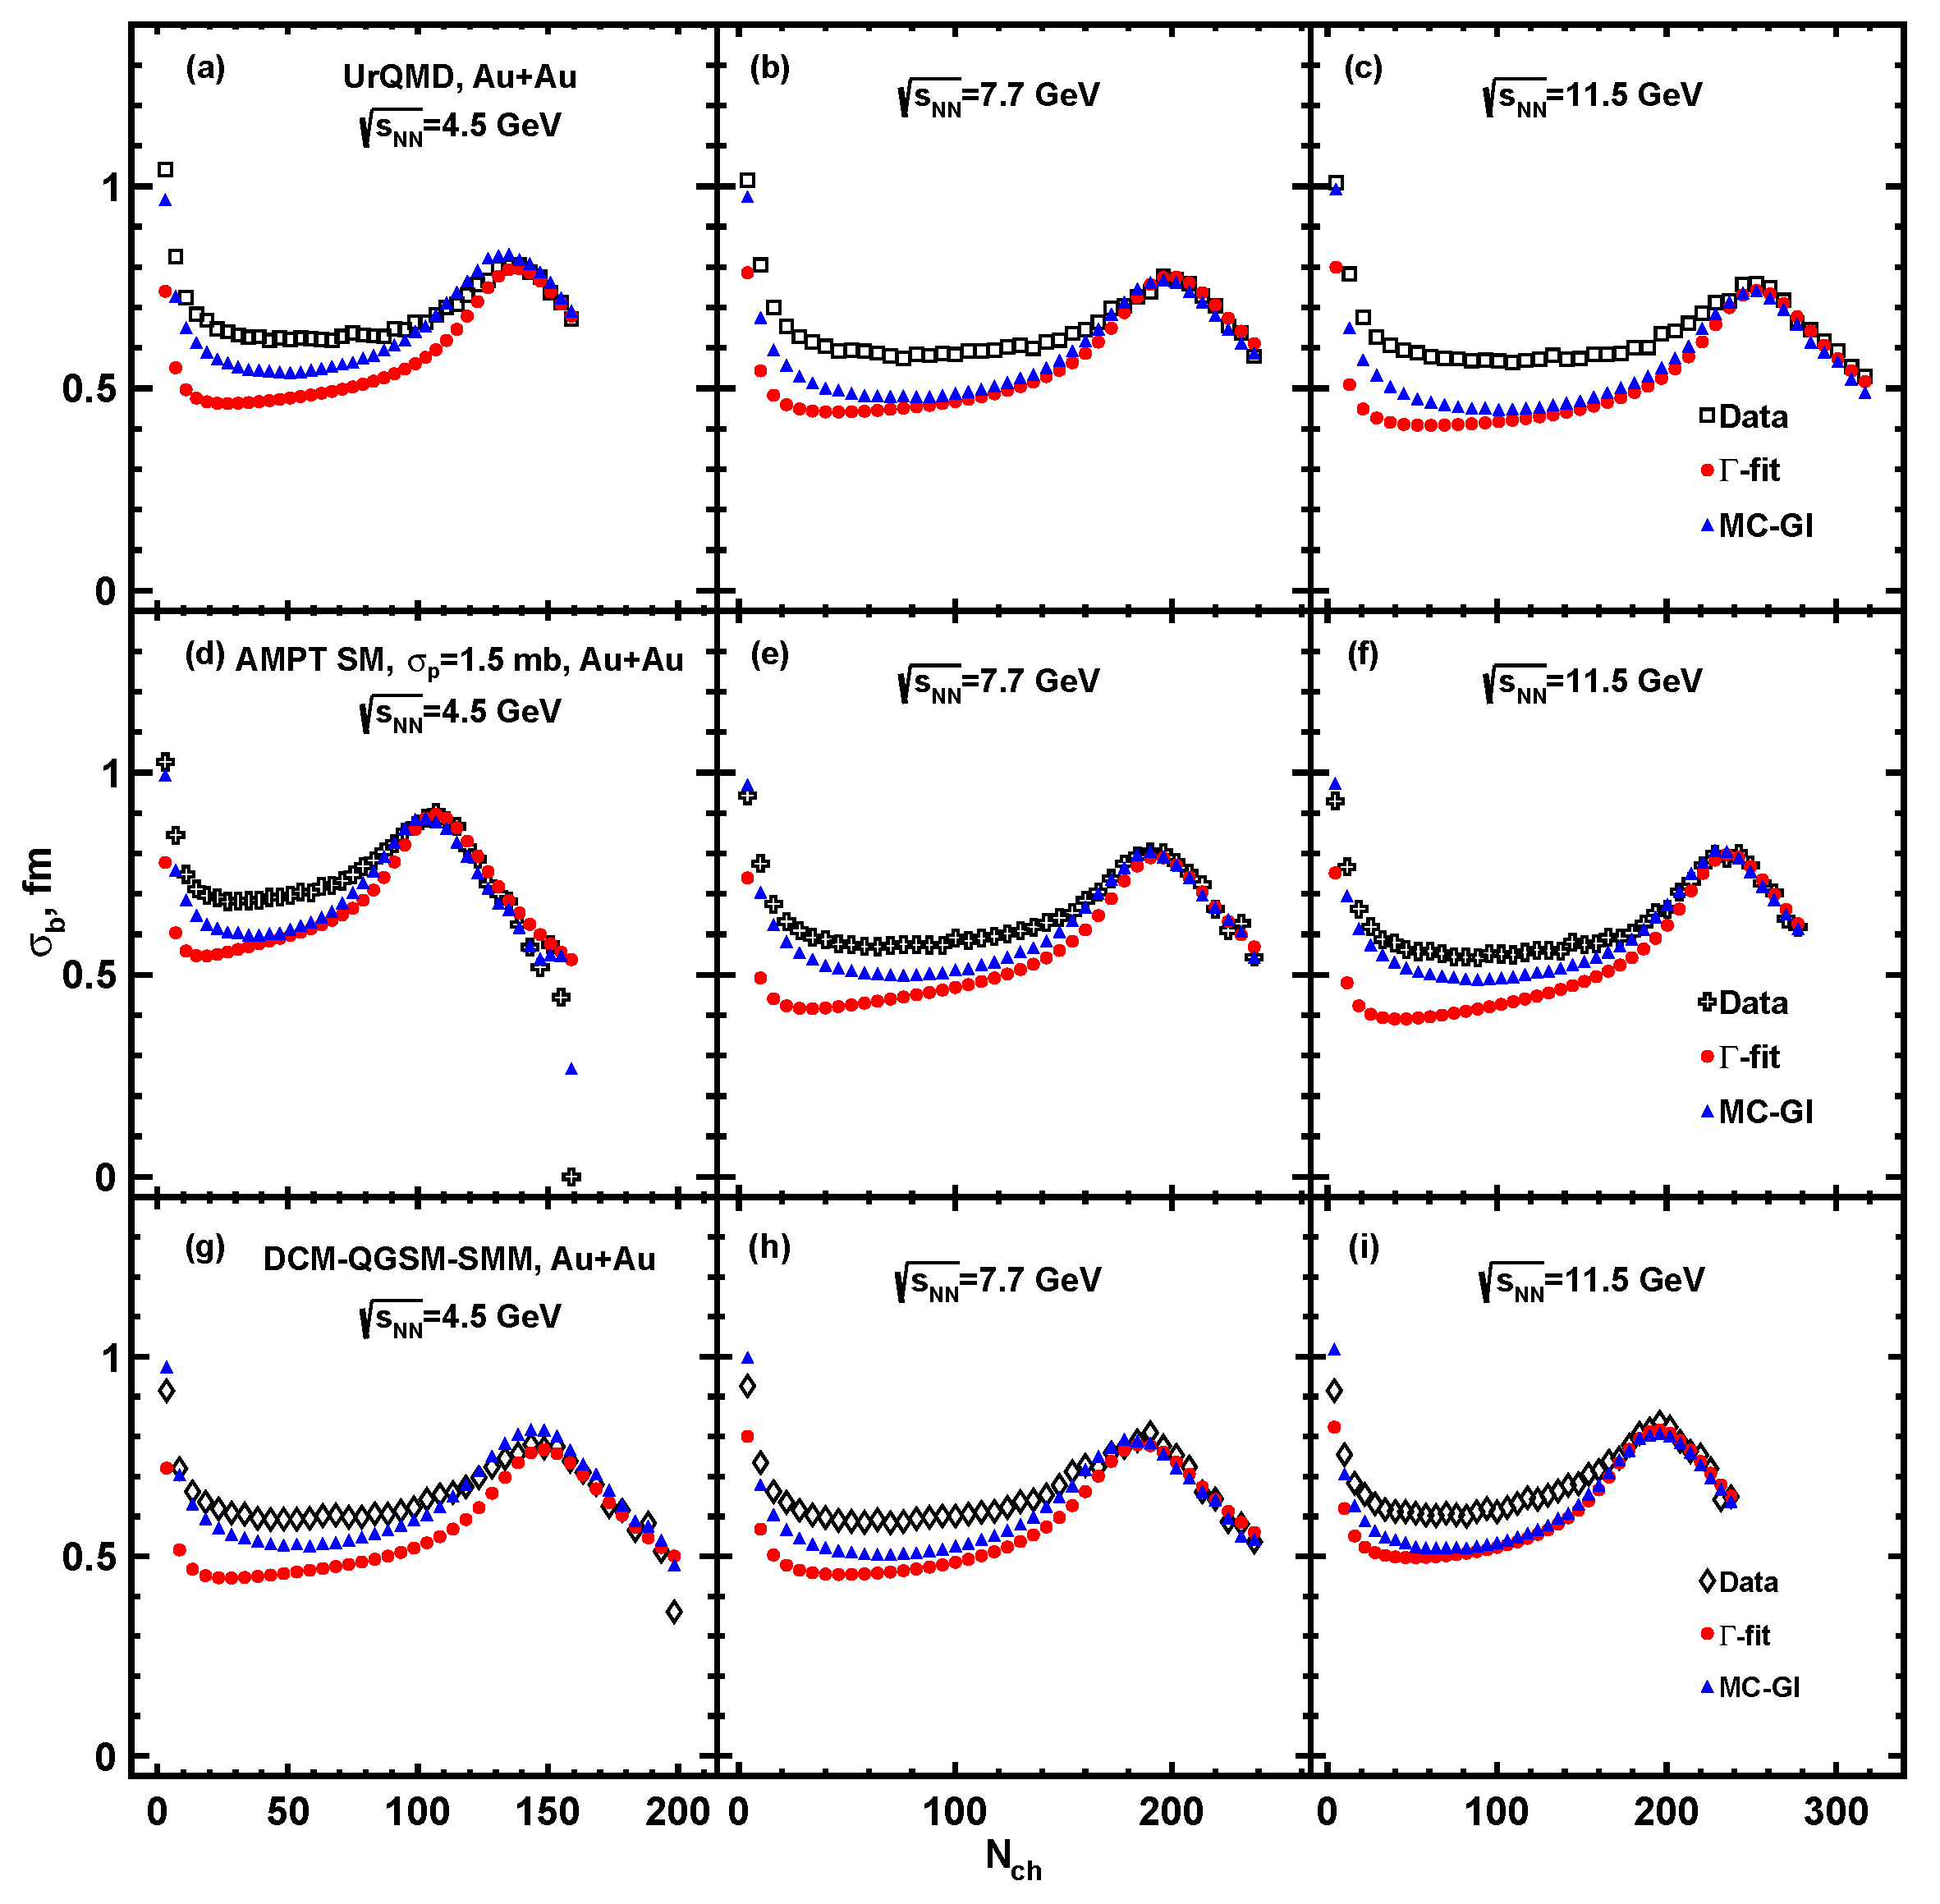
The fits have been performed for multiplicities in the range of . A value of the multiplicity at which the fit starts to deviate from the multiplicity distribution defines the so-called “anchor point” below which the centrality determination is not reliable. In the -fit method, we normalize so that the fraction of events above the anchor point matches the value specified by model distribution. The ratio plots show that both methods can reproduce the charged particle multiplicity distribution with good accuracy. Figure 7 and Figure 8 show the mean impact parameter and its standard deviation as a functions of charged particle multiplicity for UrQMD, AMPT, DCM-QGSM-SMM model events at collision energies = 4.5, 7.7, and 11.5 GeV. Results estimated by MC-Glauber and -fit approaches are plotted as blue and red solid symbols accordingly. Values extracted from the models directly are plotted as open symbols.
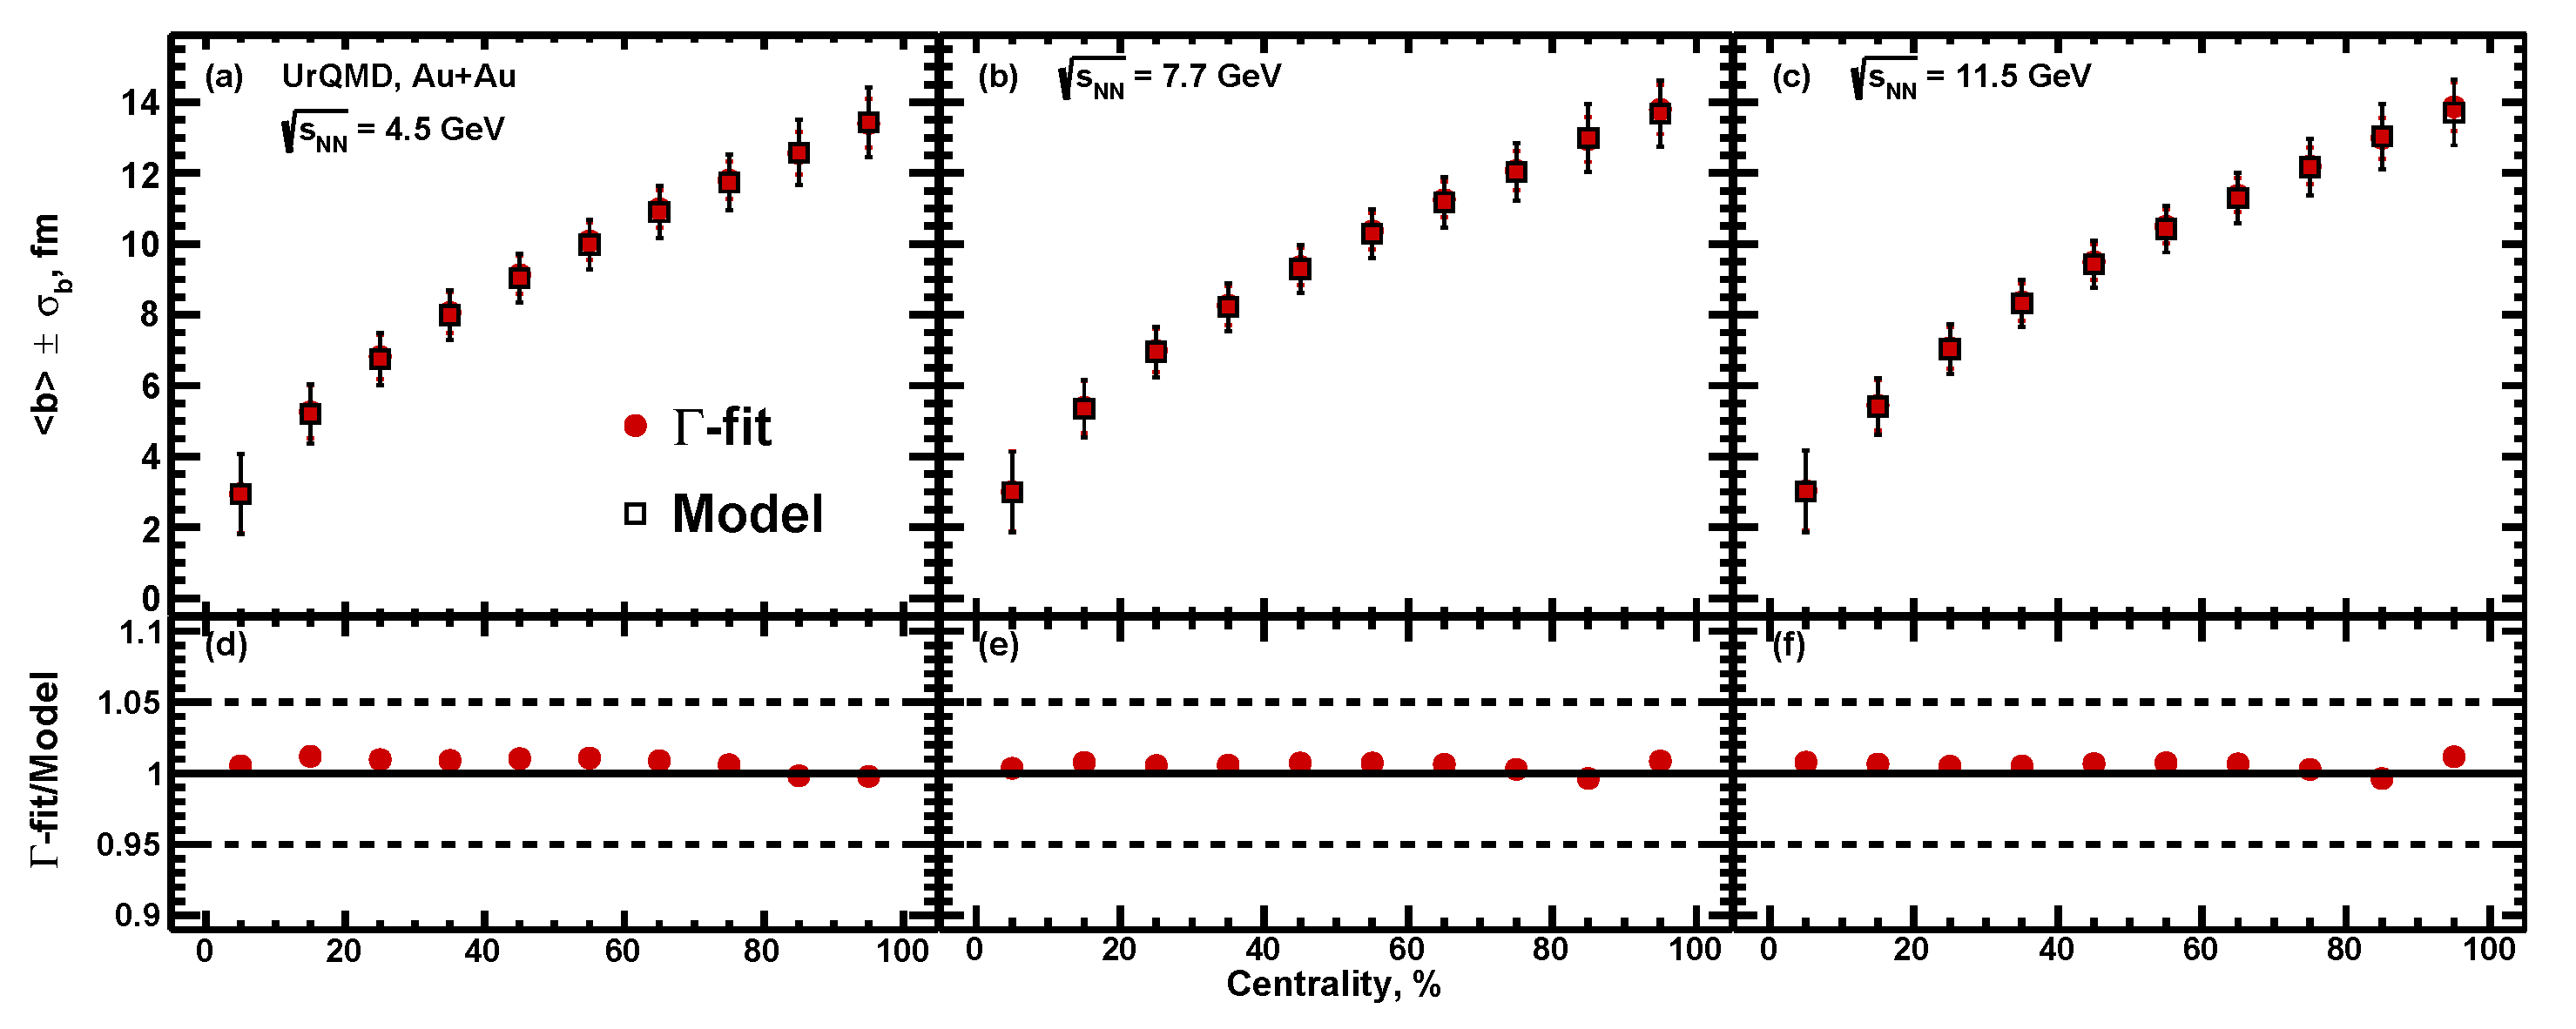
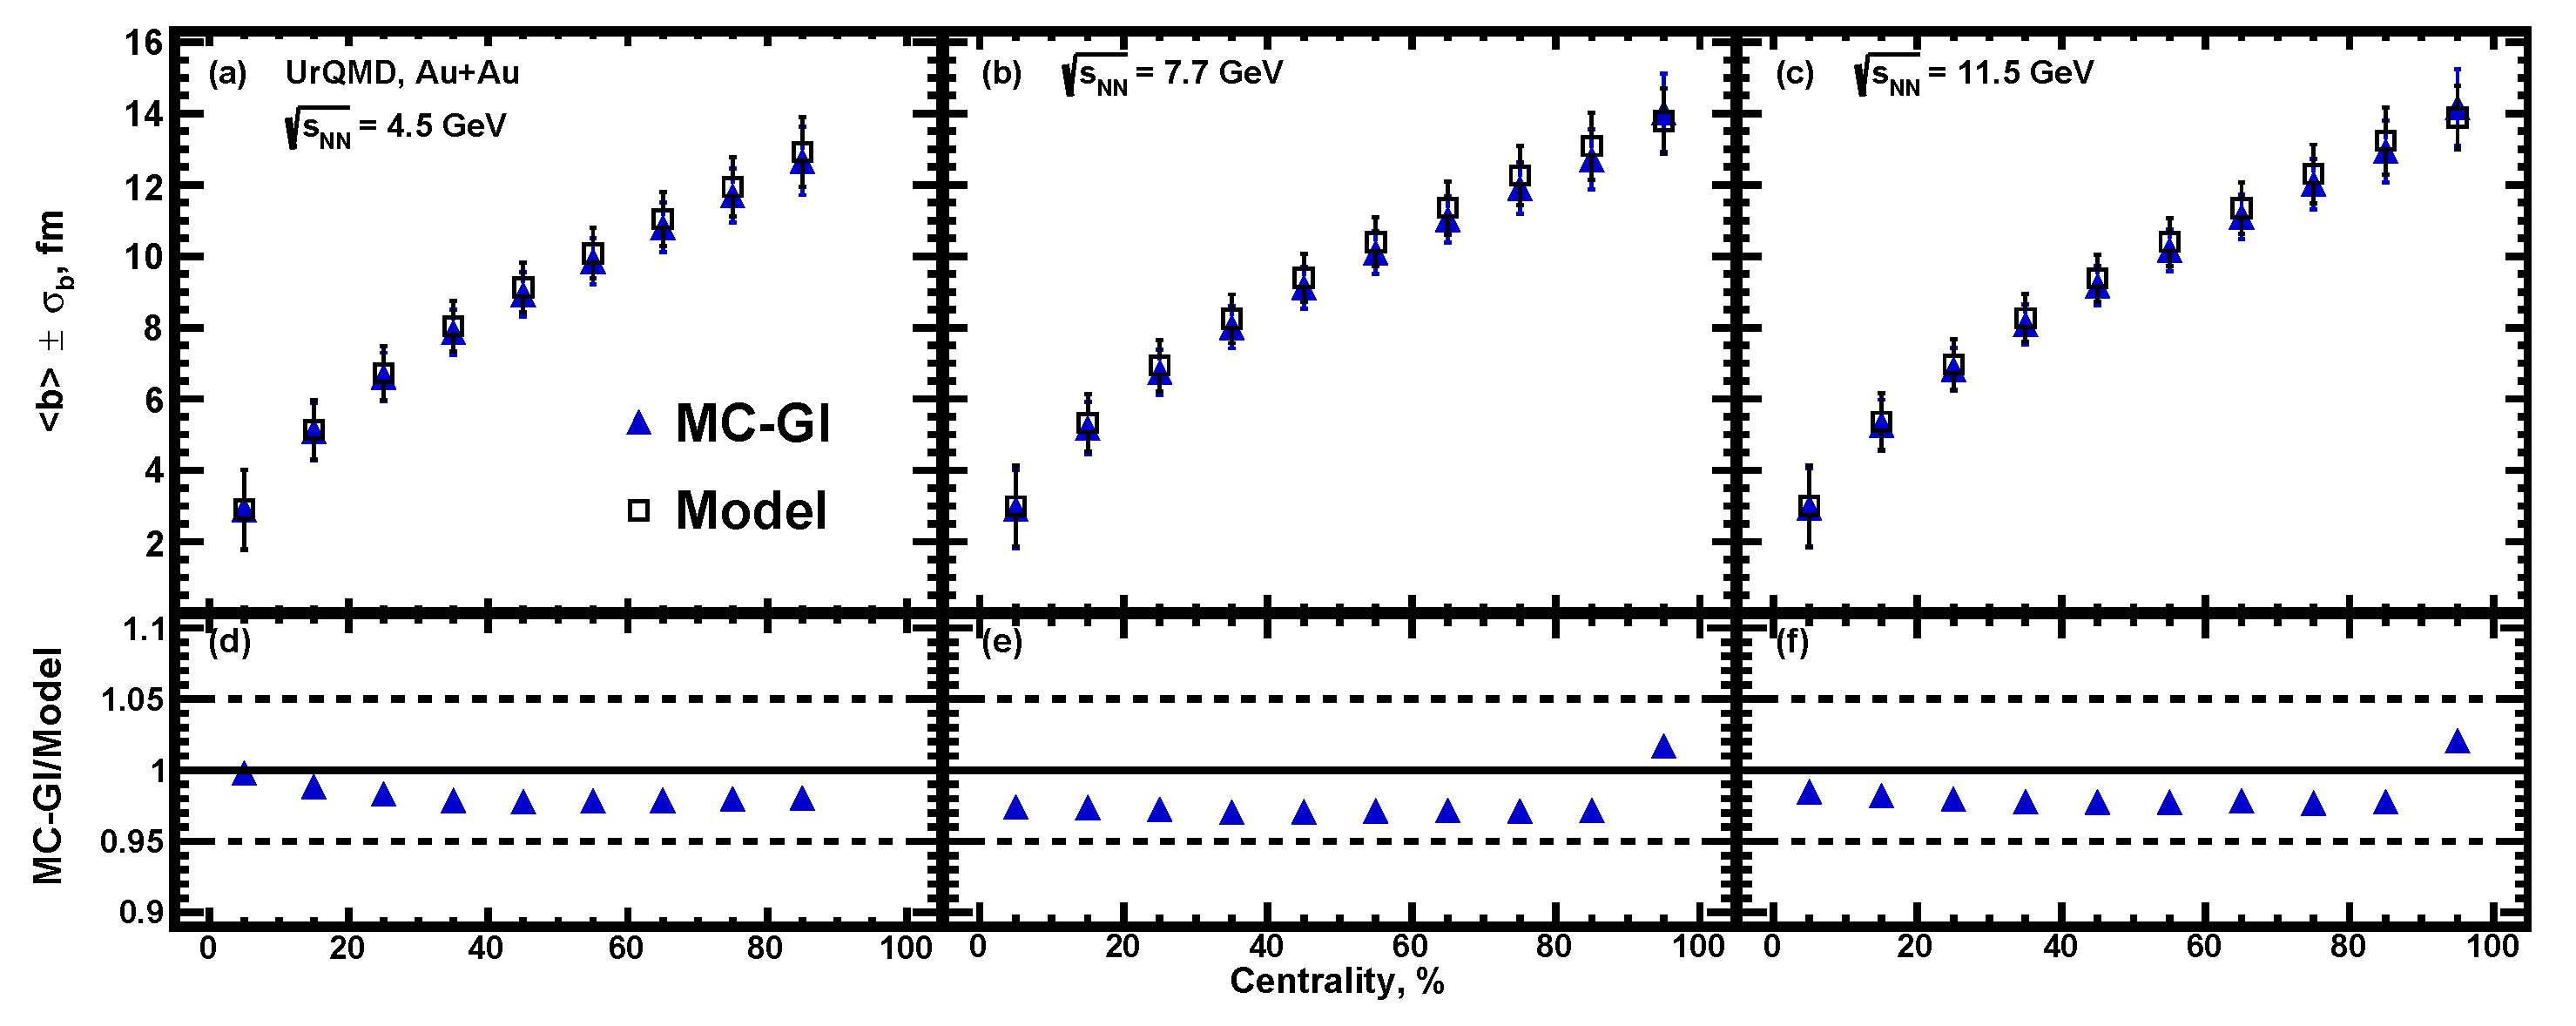
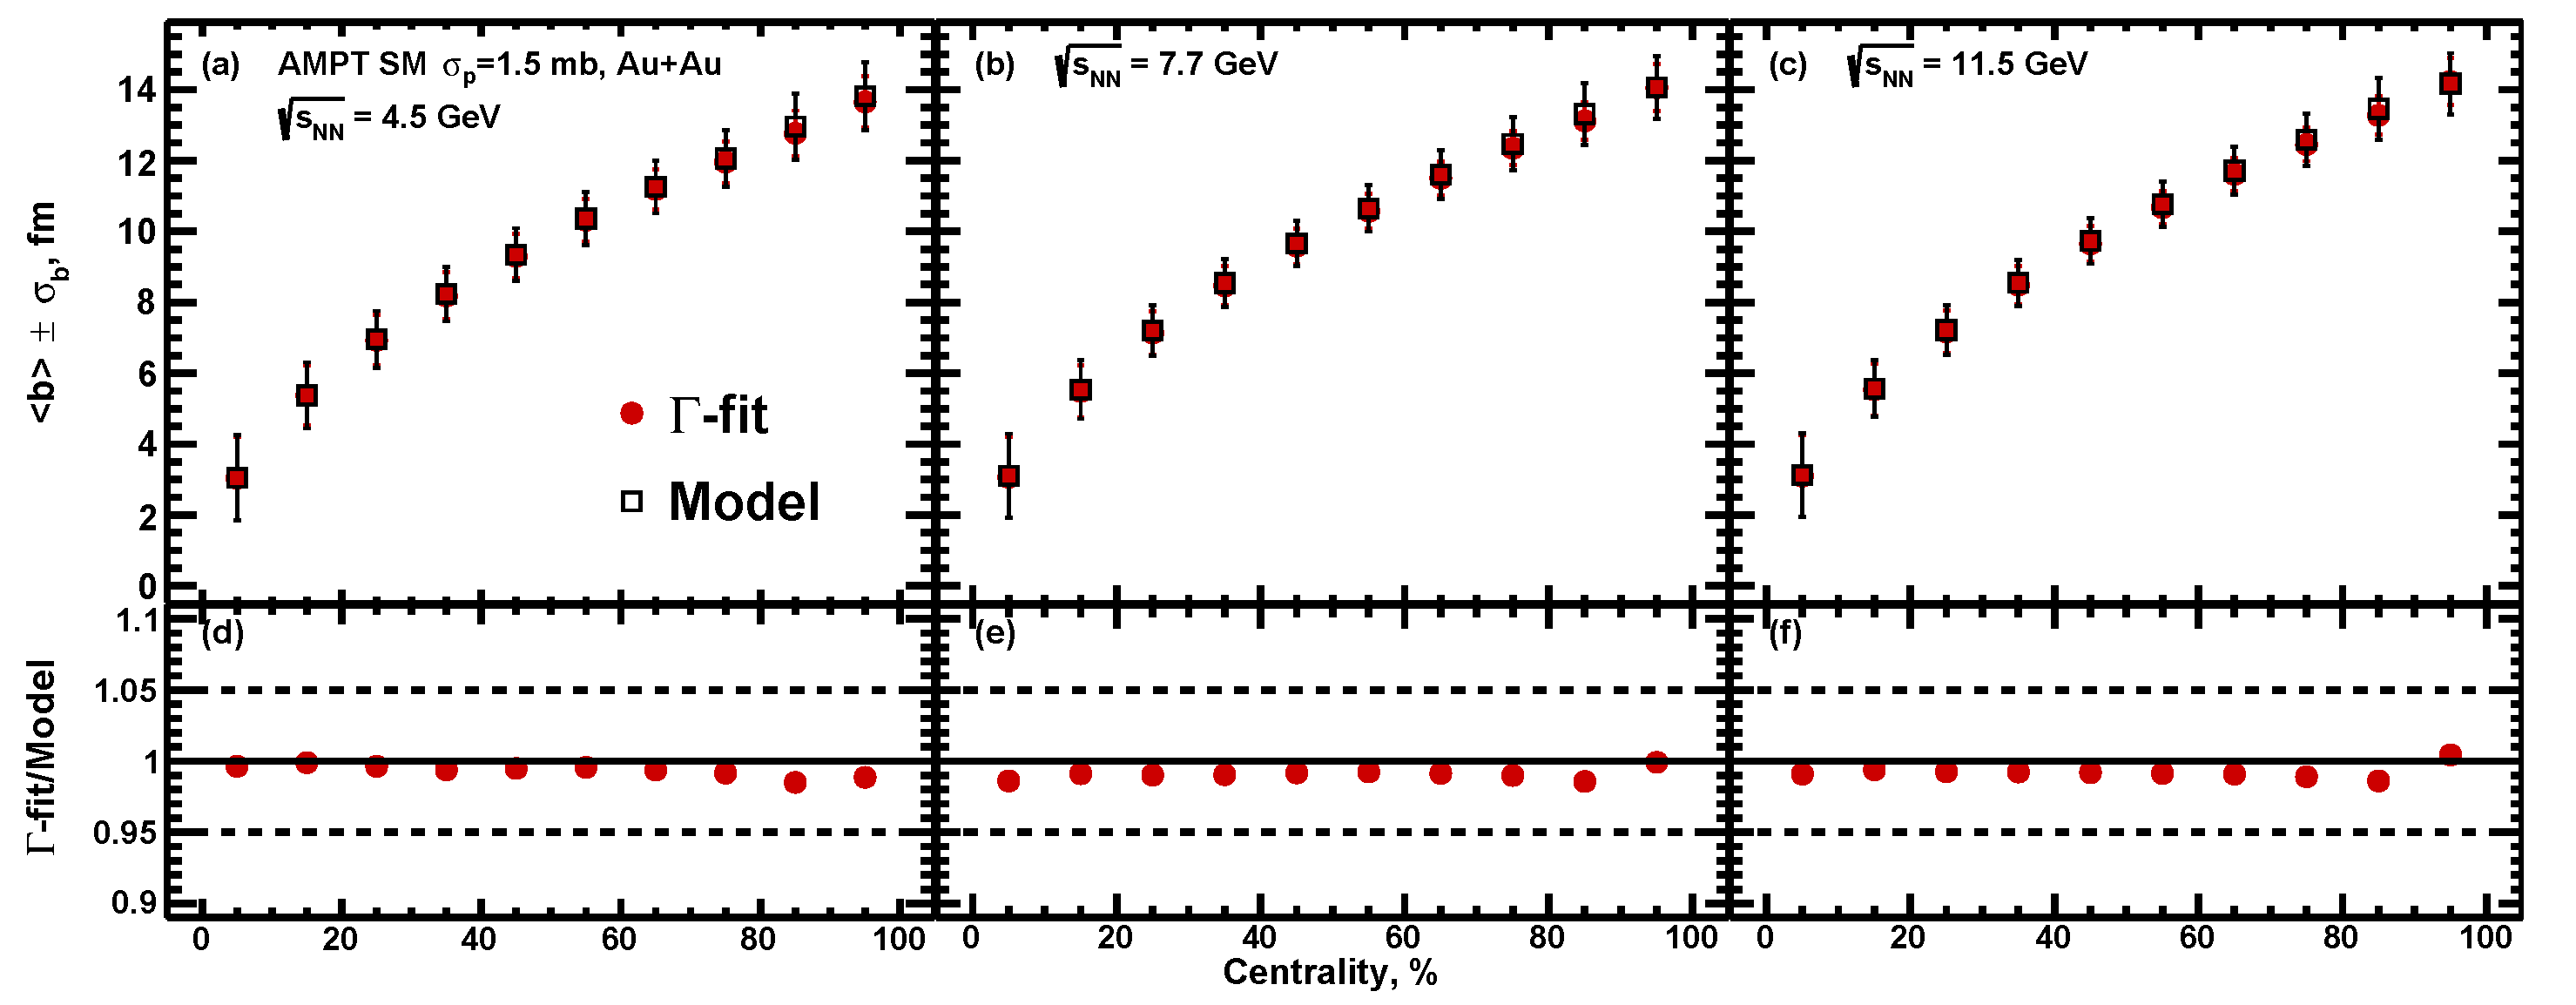
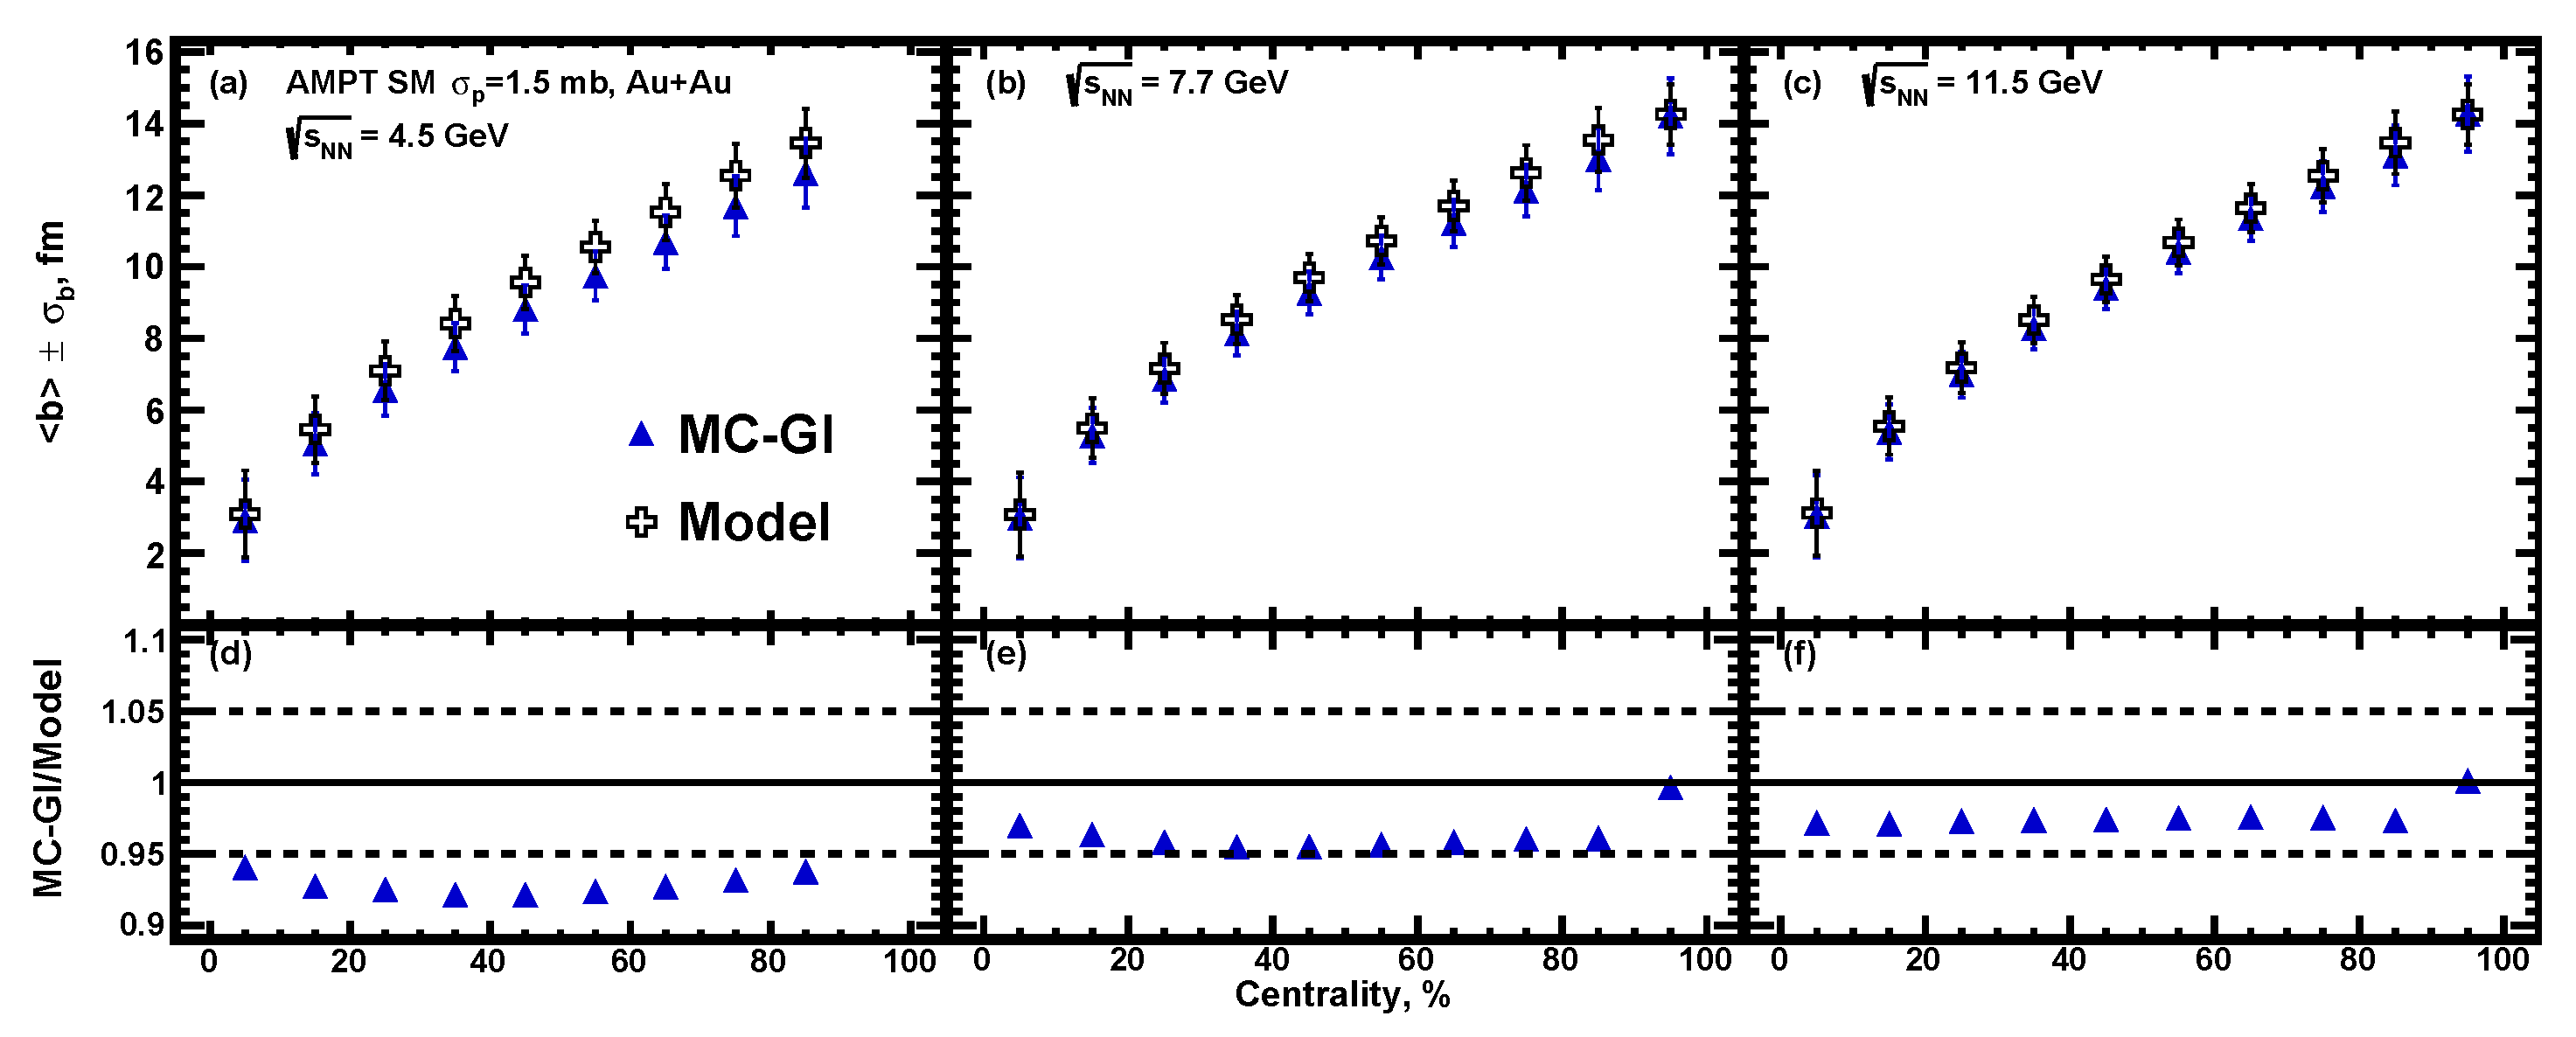
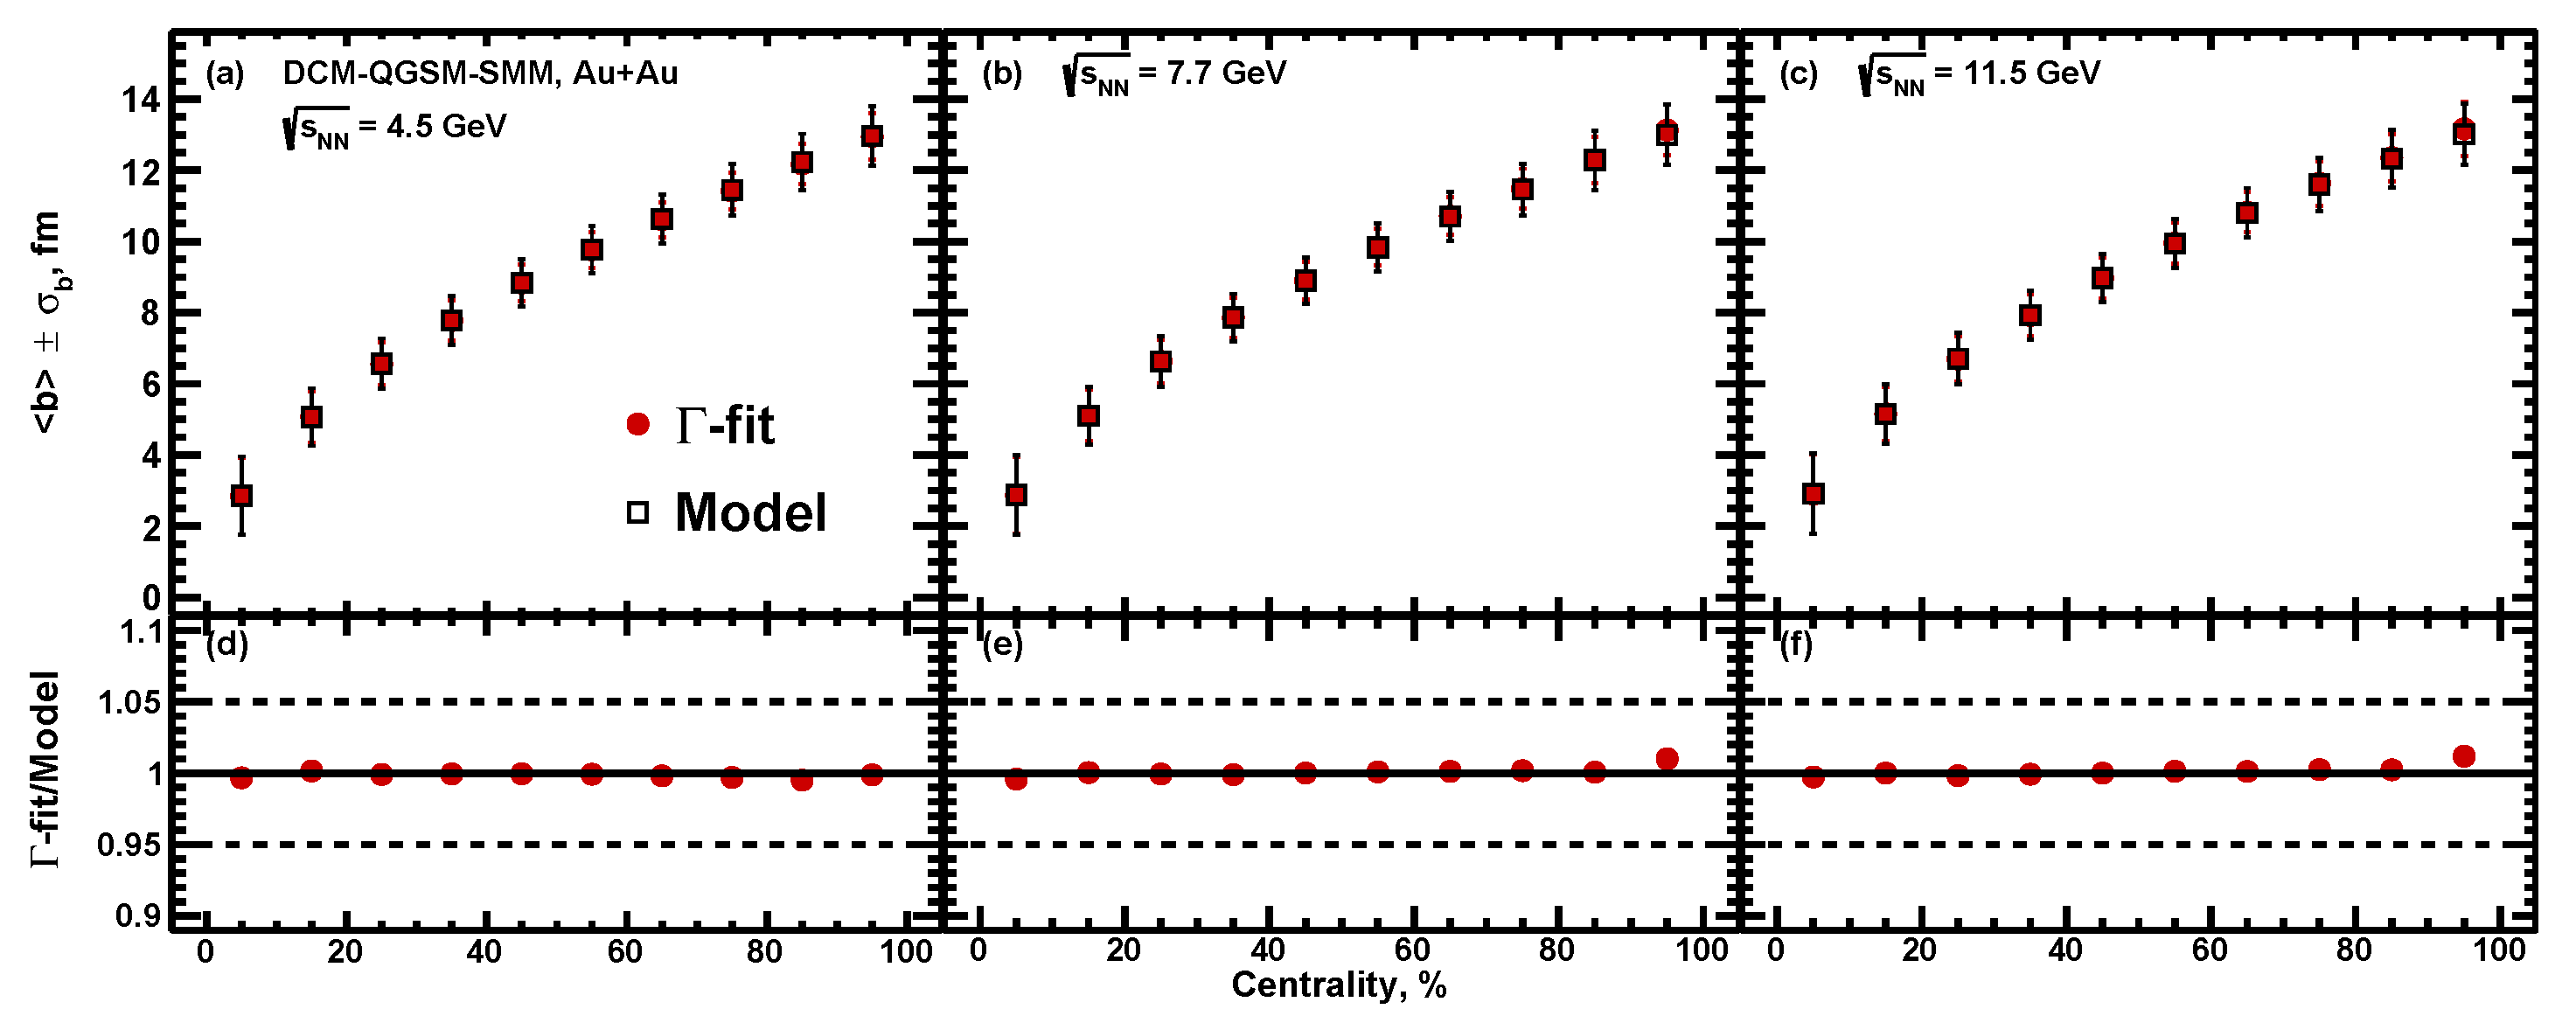
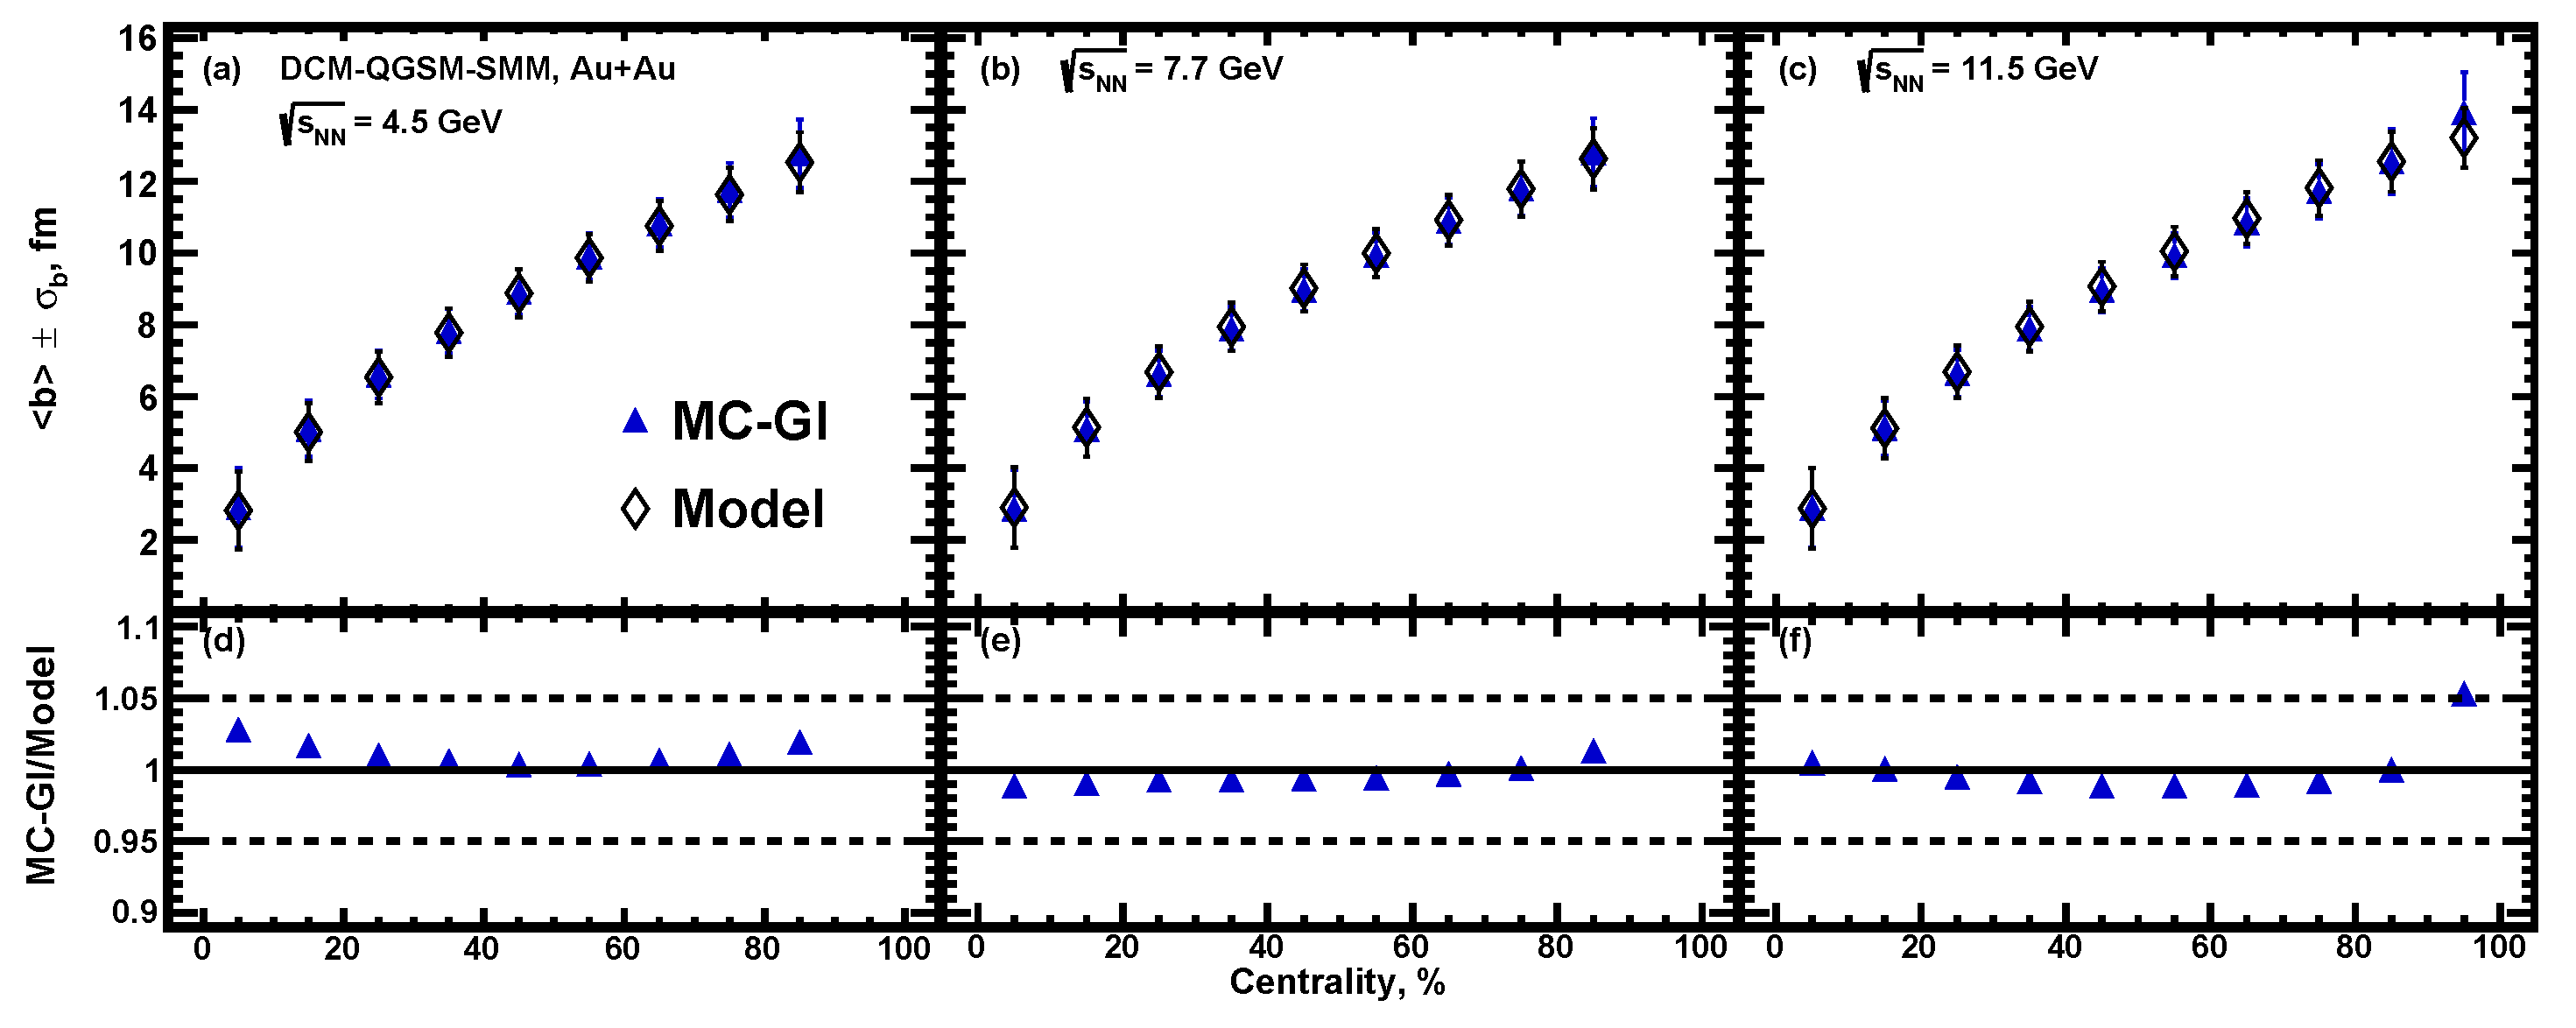
Figure 9, Figure 10, Figure 11, Figure 12, Figure 13 and Figure 14 show the centrality dependence of the resulting from MC-Glauber and -fit approximations for UrQMD, AMPT, and DCMQGSM-SMM models. Results are compared with extracted directly from the corresponding models. It is shown that values of reconstructed by both methods are in good agreement with the one from the models. Results for the -fit approach tend to be in a better agreement. However, it should be noted that this approach requires the total integral of the multiplicity distribution to be evaluated separately. Thus, -fit method is more sensitive to any bias, such as trigger inefficiencies, that could distort the estimation of the total integral of the multiplicity distribution.
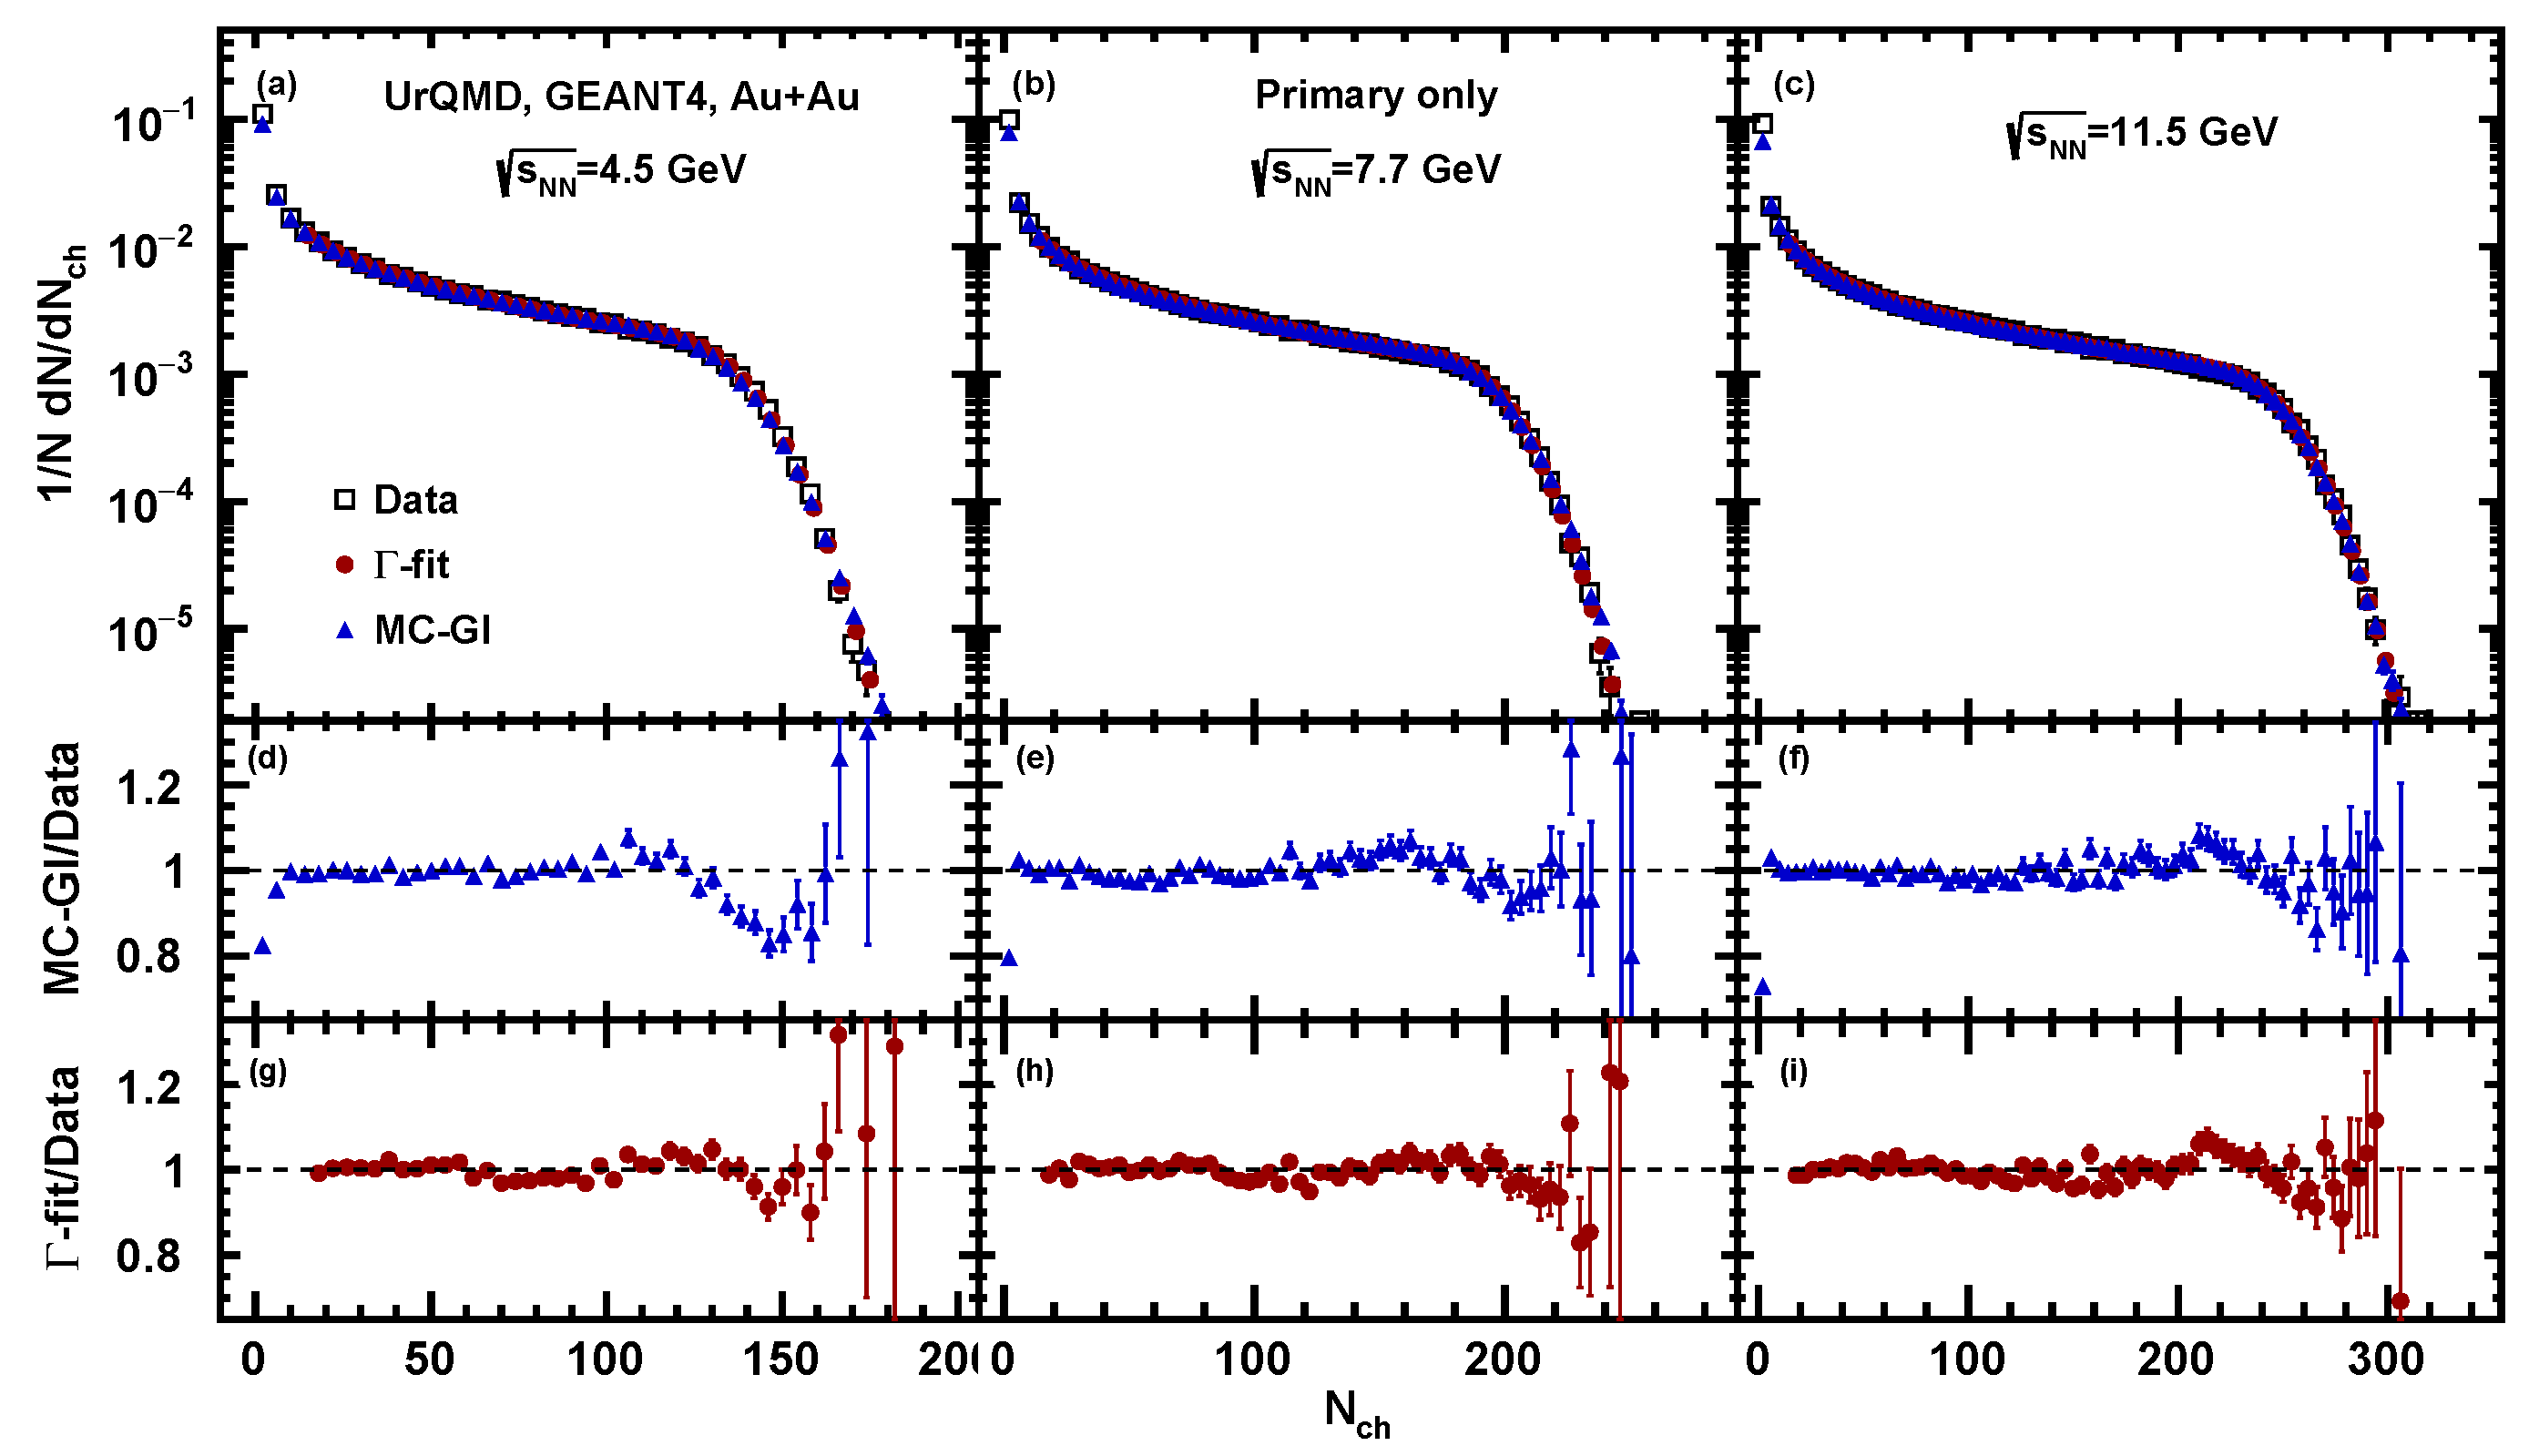
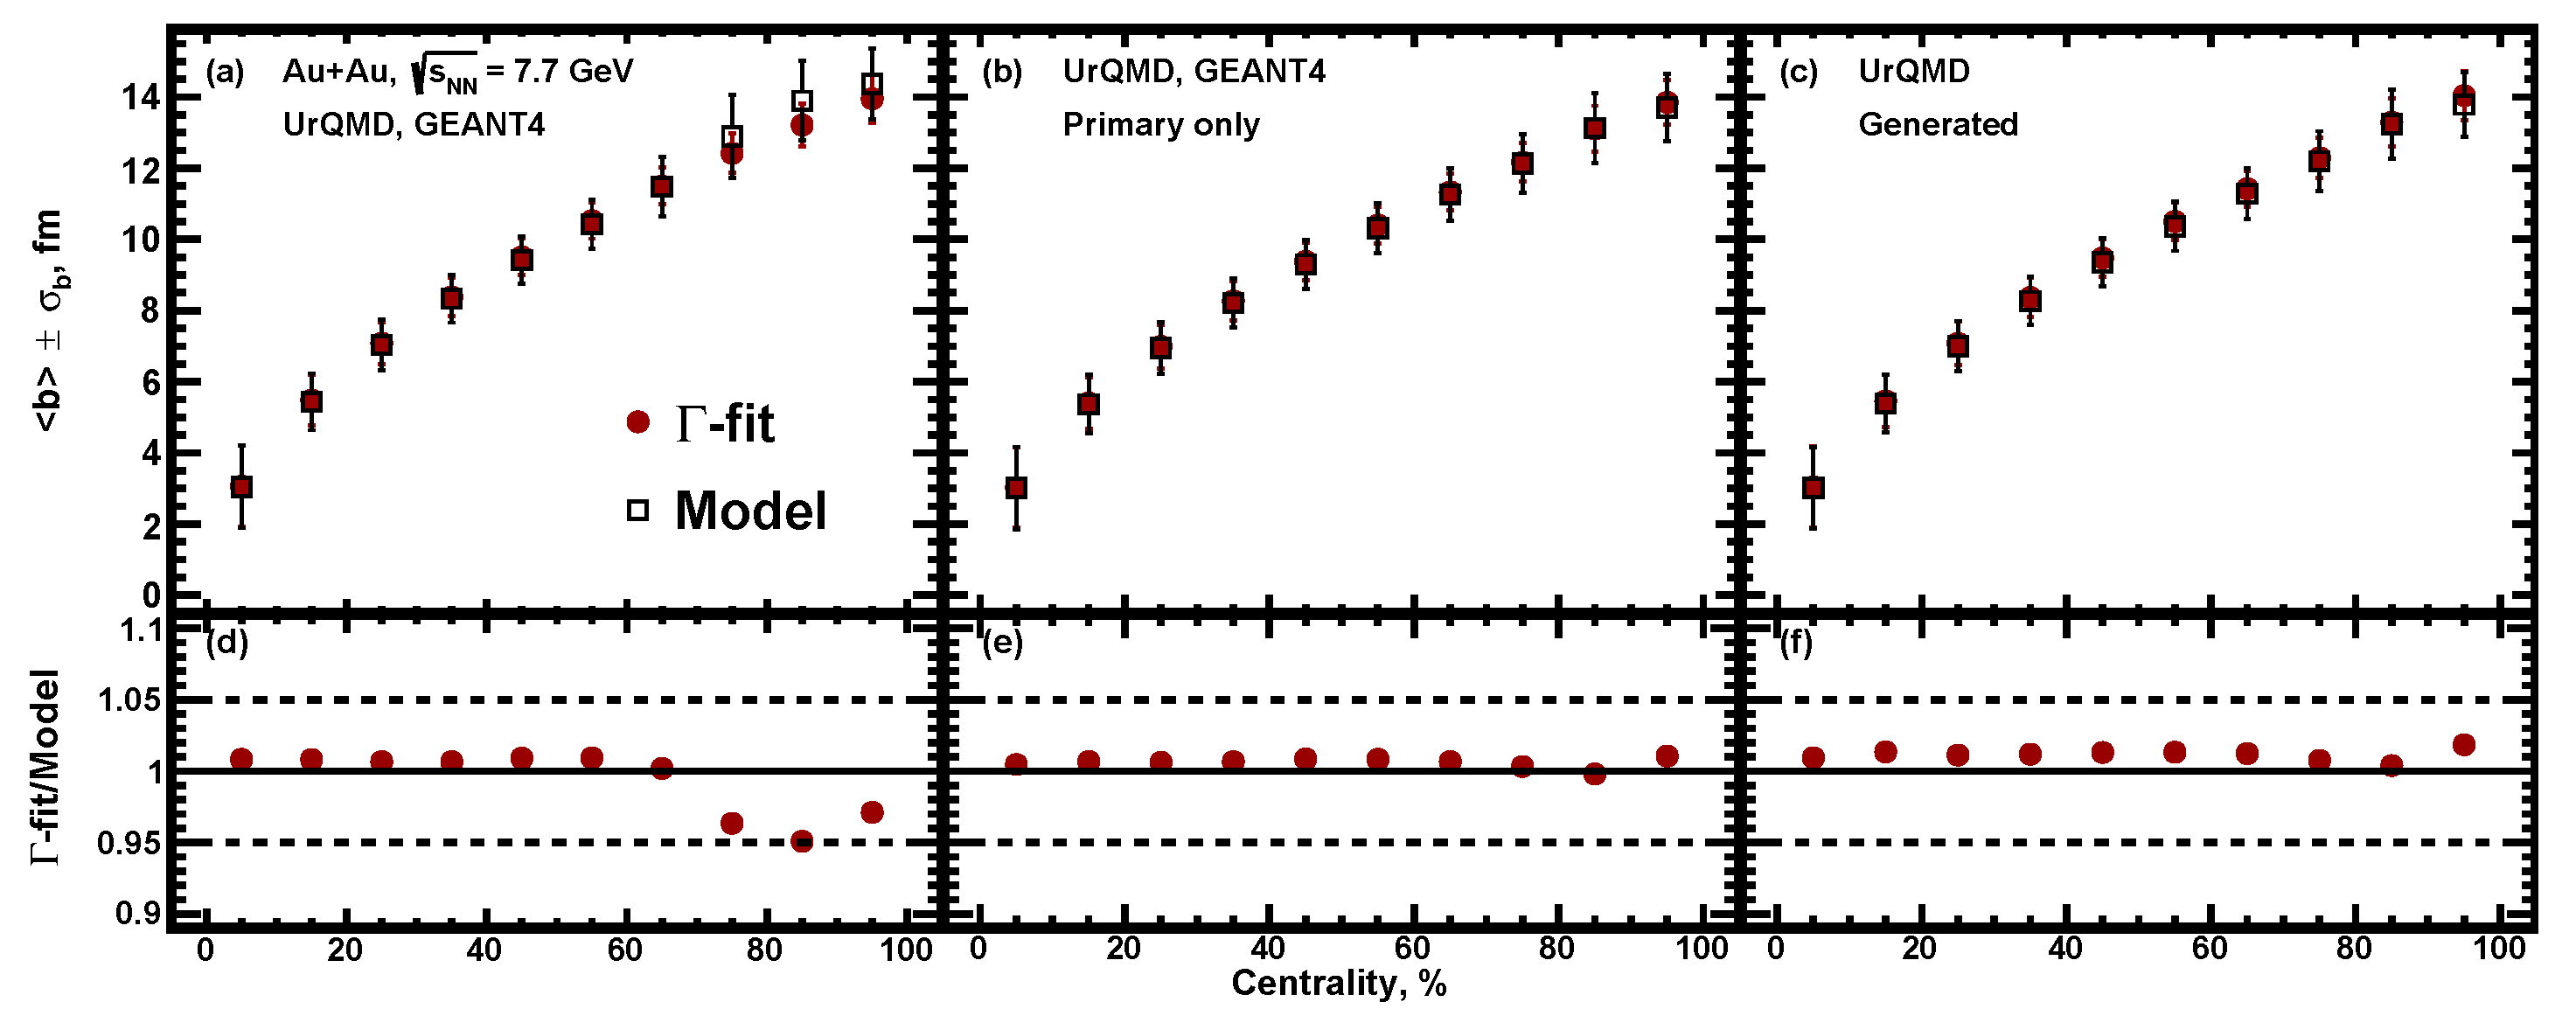
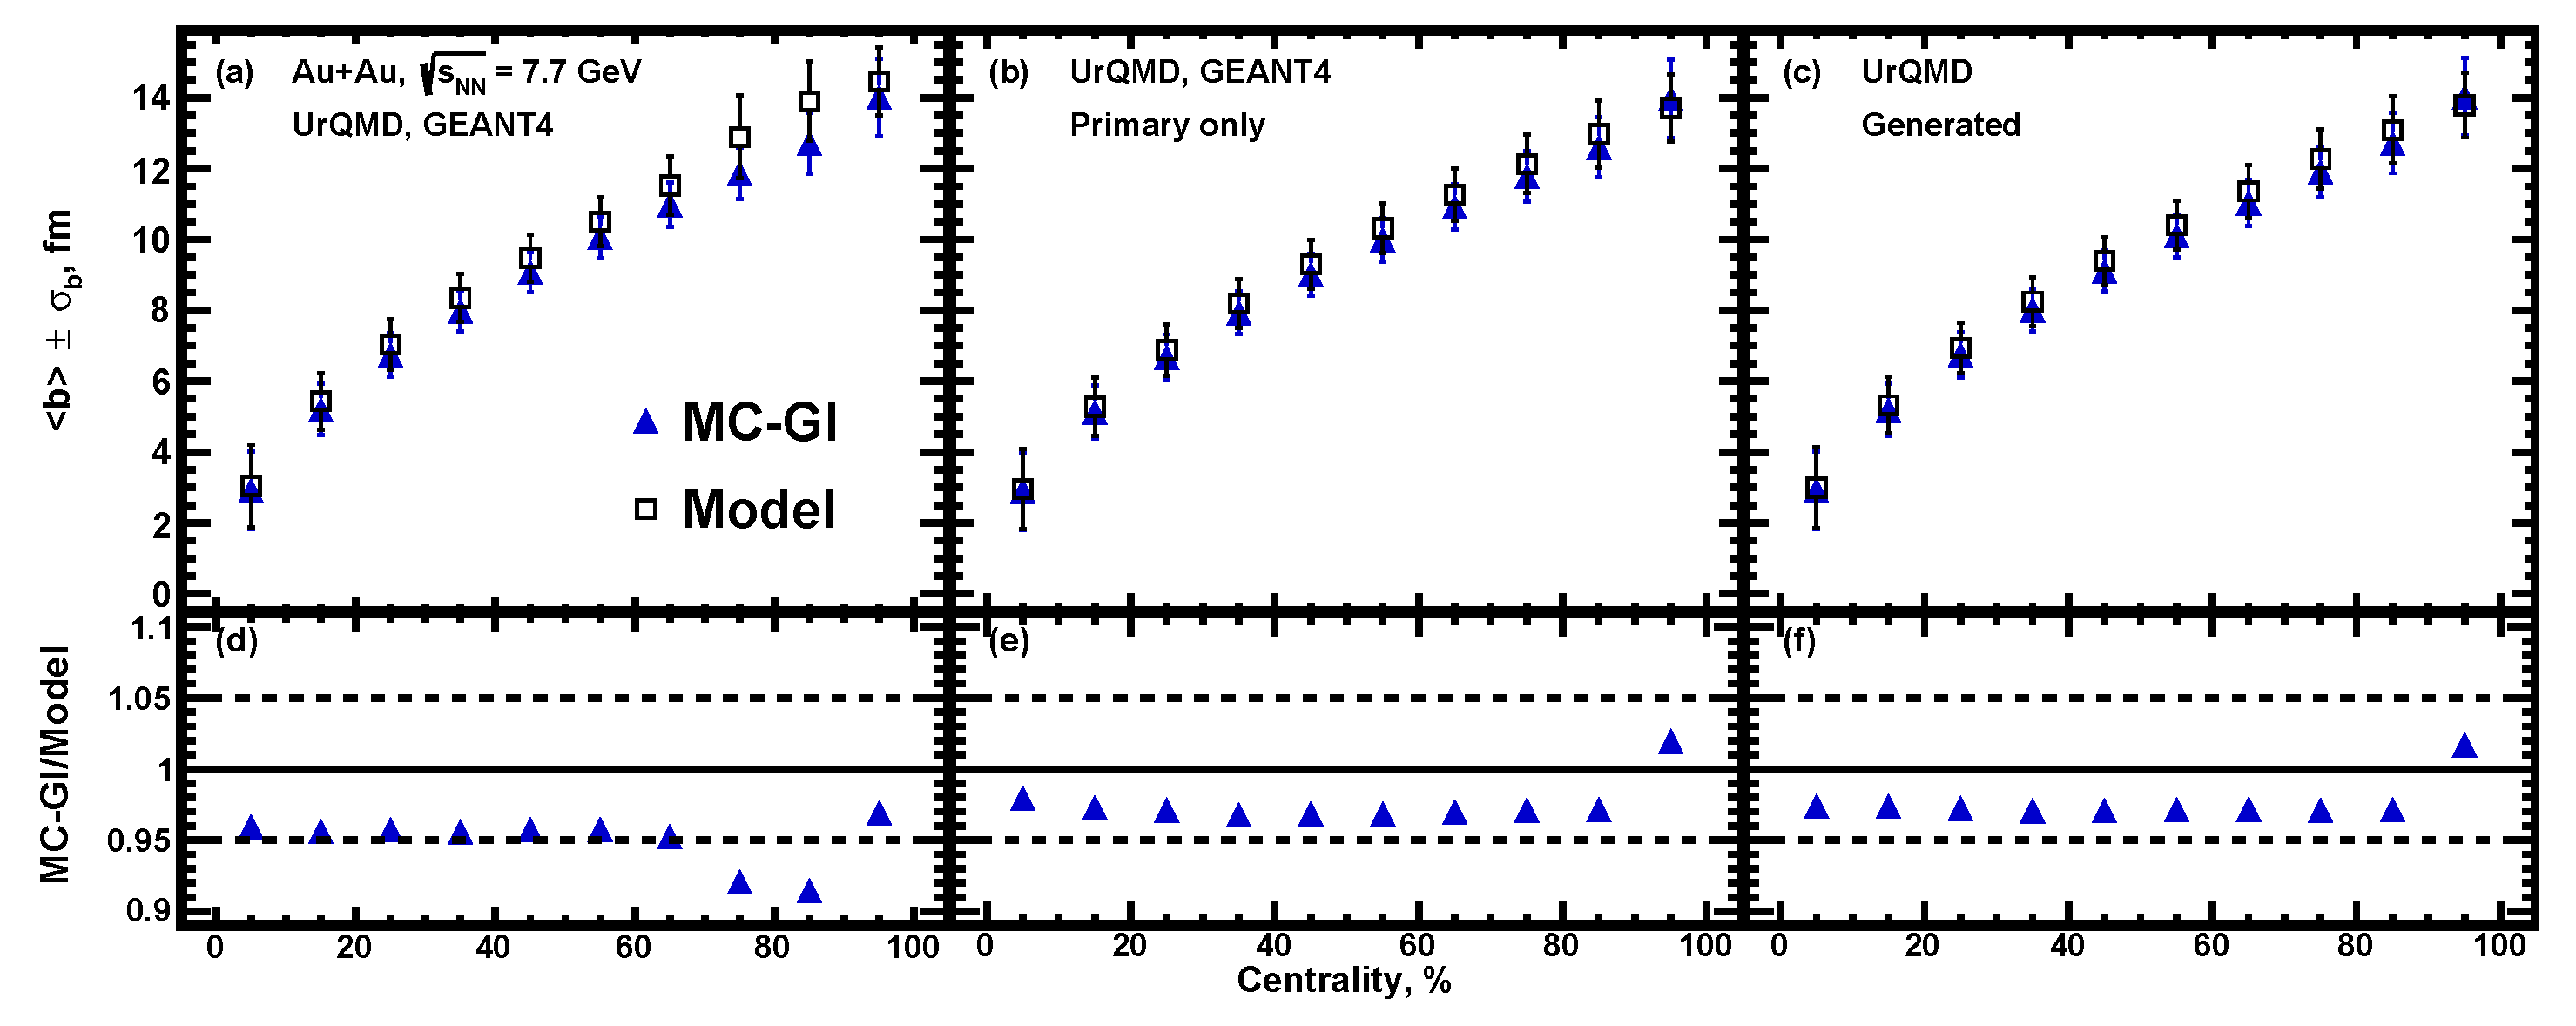
At the next step of the analysis, the sample of UrQMD minimum bias events was made as an input for the full chain of realistic simulations of the MPD detector subsystems based on the GEANT4 platform and reconstruction algorithms built in the MPDROOT framework. The track reconstruction in MPD is based on the Kalman filter technique [20], and the minimal requirement of 16 TPC hits ensures a low momentum error. We have introduced a 3D distance of the closest approach (DCA) between the track and the reconstructed primary vertex. The primary tracks have been selected with the 2 cut on the DCA. Figure 15 shows the multiplicity distribution for Au + Au collisions at = 7.7 GeV obtained from fully reconstructed UrQMD events (open squares). Red circles show the result of the fitting procedure for -fit and blue triangles for the MC-Glauber method. The fits were carried out for multiplicities in the range of . The bottom parts of Figure 15 show the ratio of the track multiplicity distribution to the corresponding fit. Figure 16a and Figure 17a show the resulting centrality dependence of the mean impact parameter . Secondary particles produced during the particle propagation through the MPD detector introduce a bias in the correlation between the impact parameter and charged particle multiplicity. It is clearly seen from the comparison of the results from the reconstructed data with primary track selection (Figure 16b and Figure 17b) and results from the direct analysis of UrQMD model events (Figure 16c and Figure 17c).
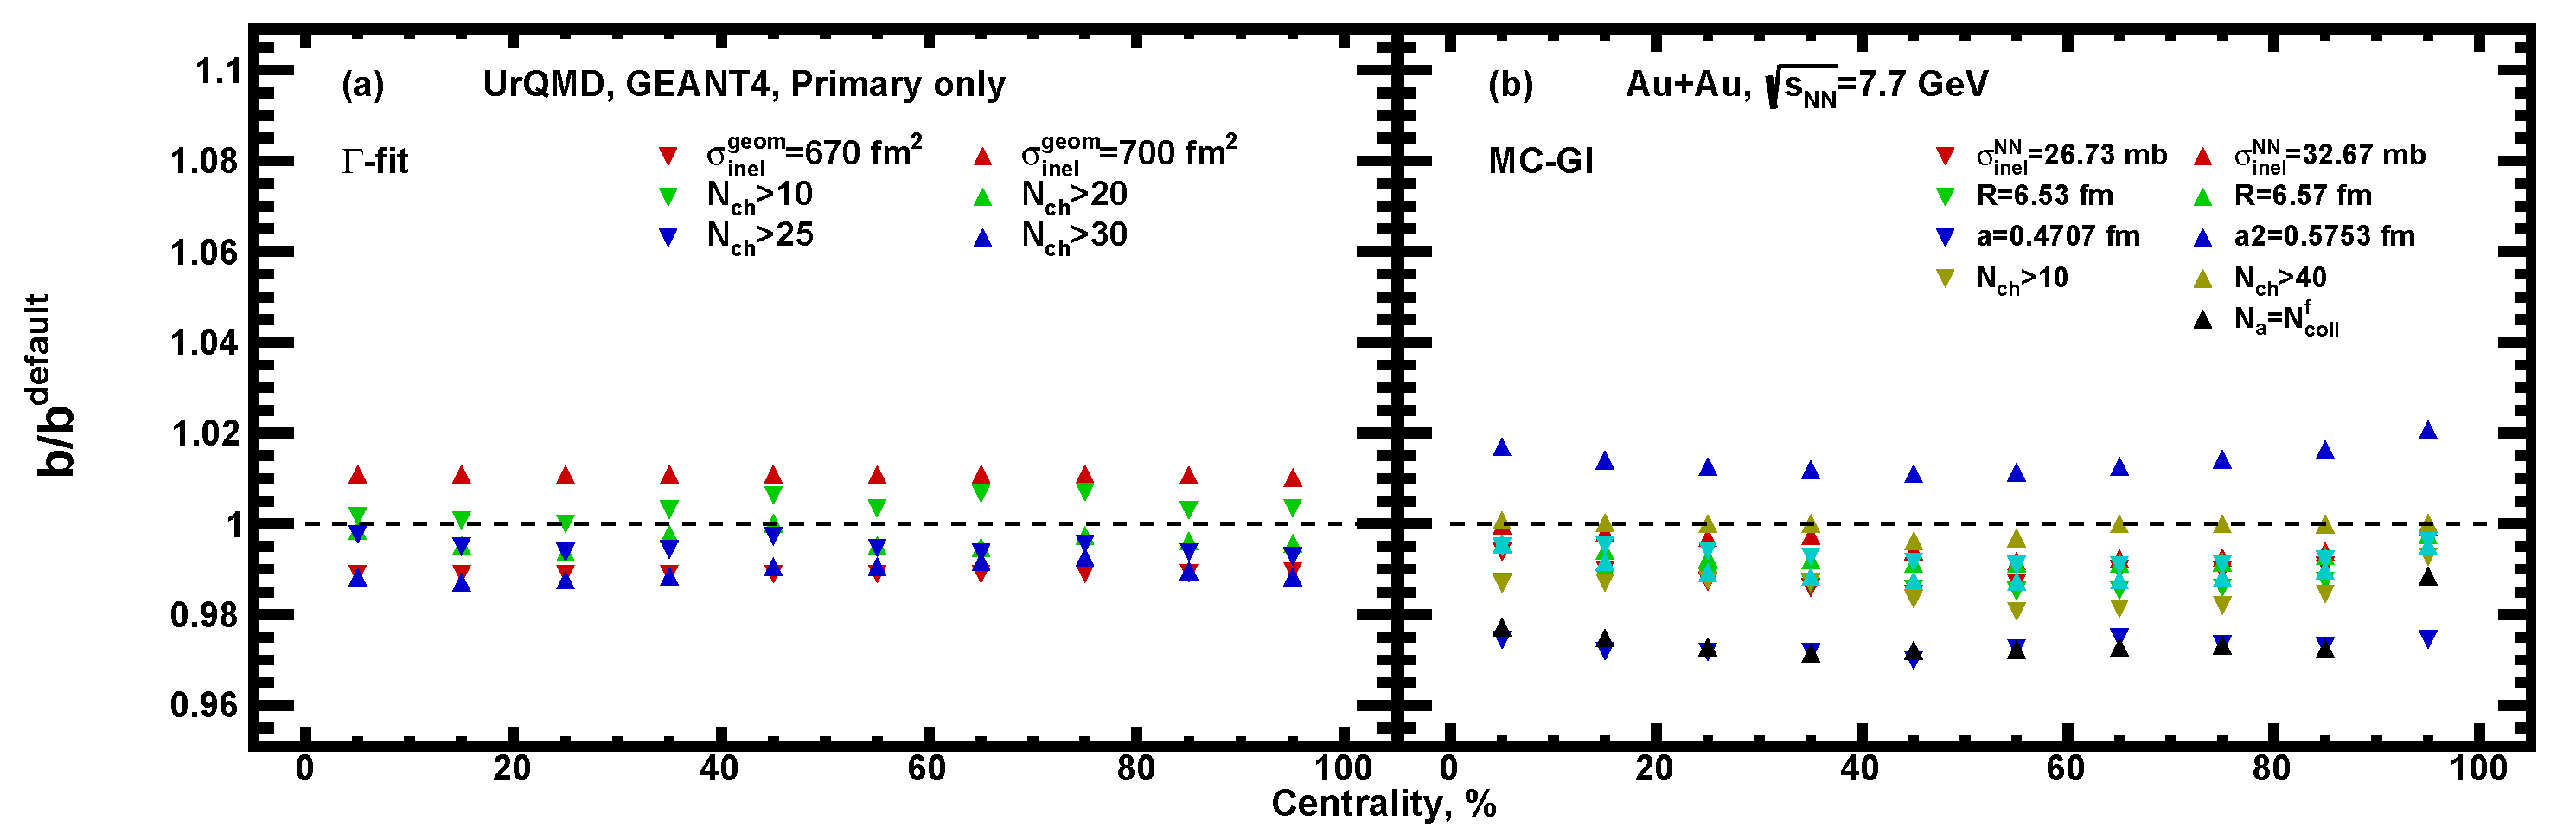
The systematic uncertainties with regard to the mean values of impact parameter b were obtained by independently varying the parameters of the initial parameters in each method. The fit procedures were repeated for all parameter variations. For the -fit method, geometric inelastic nucleus–nucleus cross section and fit ranges were varied. was varied within 2% from its value, and fit ranges were chosen. For the MC-Glauber approach, these parameters were a cross section of inelastic nucleon–nucleon collisions (varied within 10%), radius R (varying within 0.04 fm) and skin thickness a (varying within 0.1 fm) of the nucleus, fit ranges () and definition of the number of ancestors . All values of the parameters are shown in the legend in Figure 18. It is shown that differences in the resulting impact parameter due to parameter variations are within 2–3%.
4. Conclusions
A procedure for centrality determination based on charged hadron multiplicity is established for the Multi-Purpose Detector (MPD) experiment at NICA. The connection between the averaged impact parameter and centrality classes was extracted using the multiplicity of the produced charged particles at midrapidity. The Monte-Carlo Glauber model and -fit methods have been used to map the multiplicity of charged particles and impact parameter in a given centrality class. The validity of the procedure has been assessed using the generated and fully reconstructed transport model (UrQMD, AMPT SM, DCM-QGSM-SMM) data for Au + Au collisions at = 4.5, 7.7, and 11.5 GeV. In the future, we plan to extend the MC-Glauber and -fit fitting procedures for the energy of particles detected in the forward rapidity region by forward hadronic calorimeter FHCAL (MPD), which is sensitive to the spectator fragments.
Author Contributions
All authors contributed equally to this work. All authors have read and agreed to the published version of the manuscript.
Funding
This research was funded by RFBR according to the research project No. 18-02-40086 and was partially supported by the European Union‘s Horizon 2020 research and innovation program under grant agreement No. 871072 and by the Ministry of Science and Higher Education of the Russian Federation, Project “Fundamental properties of elementary particles and cosmology” No 0723-2020-0041.
Institutional Review Board Statement
Not applicable.
Informed Consent Statement
Not applicable.
Data Availability Statement
The data presented in this study are available on request from the corresponding author. The data are not publicly available since it contains the data produced by the internal software of the experiment.
Acknowledgments
The authors thank Ilya Seluyzhenkov and Ilya Segal for helpful discussions and comments. We thank Andrey Moshkin from the MPD collaboration for the help with production of the reconstructed data used in the analysis. Computational resources were provided by the NRNU MEPhI high-performance computing center and NICA high-performance cluster of LHEP JINR.
Conflicts of Interest
The funders had no role in the design of the study; in the collection, analyses, or interpretation of data; in the writing of the manuscript, or in the decision to publish the results.
References
- Kekelidze, V.D. Heavy Ion Collisions: Baryon Density Frontier. Phys. Part. Nucl. 2018, 49, 457. [Google Scholar] [CrossRef]
- Broniowski, W.; Florkowski, W. Geometric relation between centrality and the impact parameter in relativistic heavy ion collisions. Phys. Rev. C 2002, 65, 024905. [Google Scholar] [CrossRef] [Green Version]
- Tarafdar, S.; Citron, Z.; Milov, A. A Centrality Detector Concept. Nucl. Instrum. Meth. A 2014, 768, 170–178. [Google Scholar] [CrossRef] [Green Version]
- Loizides, C.; Nagle, J.; Steinberg, P. Improved version of the PHOBOS Glauber Monte Carlo. SoftwareX 2015, 1–2, 13. [Google Scholar] [CrossRef] [Green Version]
- Abelev, B.; Adam, J.; Adamová, D.; Adare, A.M.; Aggarwal, M.M.; Rinella, G.A.; Agnello, M.; Agocs, A.G.; Agostinelli, A.; Ahammed, Z.; et al. Centrality determination of Pb-Pb collisions at = 2.76 TeV with ALICE. Phys. Rev. C 2013, 88, 044909. [Google Scholar] [CrossRef] [Green Version]
- Klochkov, V.; Selyuzhenkov, I. Centrality Determination in Heavy-ion Collisions with CBM. Acta Phys. Polon. Supp. 2017, 10, 919. [Google Scholar] [CrossRef] [Green Version]
- Kagamaster, S.; Reed, R.; Lisa, M. Centrality determination with a forward detector in the RHIC Beam Energy Scan. Phys. Rev. C 2021, 103, 044902. [Google Scholar] [CrossRef]
- Chatterjee, A.; Zhang, Y.; Zeng, J.; Sahoo, N.R.; Luo, X. Effect of centrality selection on higher-order cumulants of net-proton multiplicity distributions in relativistic heavy-ion collisions. Phys. Rev. C 2020, 101, 034902. [Google Scholar] [CrossRef] [Green Version]
- Chatterjee, A.; Zhang, Y.; Liu, H.; Wang, R.; He, S.; Luo, X. Effects of centrality fluctuation and deuteron formation on proton number cumulant in Au + Au collisions at = 3 GeV from JAM model. Chin. Phys. C 2021, 45, 064003. [Google Scholar] [CrossRef]
- Rogly, R.; Giacalone, G.; Ollitrault, J.Y. Reconstructing the impact parameter of proton-nucleus and nucleus-nucleus collisions. Phys. Rev. C 2018, 98, 024902. [Google Scholar] [CrossRef] [Green Version]
- Das, S.J.; Giacalone, G.; Monard, P.A.; Ollitrault, J.Y. Relating centrality to impact parameter in nucleus-nucleus collisions. Phys. Rev. C 2018, 97, 014905. [Google Scholar] [CrossRef] [Green Version]
- Bass, S.A.; Belkacem, M.; Bleicher, M.; Brandstetter, M.; Bravina, L.; Ernst, C.; Gerland, L.; Hofmann, M.; Hofmann, S.; Konopka, J.; et al. Microscopic models for ultrarelativistic heavy ion collisions. Prog. Part. Nucl. Phys. 1998, 41, 255–369. [Google Scholar] [CrossRef] [Green Version]
- Lin, Z.W.; Ko, C.M.; Li, B.A.; Zhang, B.; Pal, S. A Multi-phase transport model for relativistic heavy ion collisions. Phys. Rev. C 2005, 72, 064901. [Google Scholar] [CrossRef] [Green Version]
- Toneev, V.D.; Gudima, K.K. Particle emission in light and heavy ion reactions. Nucl. Phys. A 1983, 400, 173–189. [Google Scholar] [CrossRef]
- Botvina, A.S.; Gudima, K.K.; Steinheimer, J.; Bleicher, M.; Mishustin, I.N. Production of spectator hypermatter in relativistic heavy-ion collisions. Phys. Rev. C 2011, 84, 064904. [Google Scholar] [CrossRef] [Green Version]
- Adamczyk, L.; Agakishiev, G.; Aggarwal, M.M.; Ahammed, Z.; Alakhverdyants, A.V.; Alekseev, I.; Alford, J.; Anderson, B.D.; Anson, C.D.; Arkhipkin, D.; et al. Inclusive charged hadron elliptic flow in Au + Au collisions at = 7.7–39 GeV. Phys. Rev. C 2012, 86, 054908. [Google Scholar] [CrossRef]
- Miller, M.L.; Reygers, K.; Sanders, S.J.; Steinberg, P. Glauber modeling in high energy nuclear collisions. Ann. Rev. Nucl. Part. Sci. 2007, 57, 205–243. [Google Scholar] [CrossRef] [Green Version]
- Fricke, G.; Heilig, K. Nuclear Charge Radii 79-Au Gold: Datasheet from Landolt-Börnstein. Group I Elem. Part. Nucl. Atoms 2004, 20. [Google Scholar] [CrossRef]
- Particle Data Group; Zyla, P.A.; Barnett, R.M.; Beringer, J.; Dahl, O.; Dwyer, D.A.; Groom, D.E.; Lin, C.J.; Lugovsky, K.S.; Pianori, E.; et al. Review of Particle Physics. Prog. Theor. Exp. Phys. 2020, 2020, 083C01. [Google Scholar] [CrossRef]
- Kolesnikov, V.; Mudrokh, A.; Vasendina, V.; Zinchenko, A. Towards a Realistic Monte Carlo Simulation of the MPD Detector at NICA. Phys. Part. Nucl. Lett. 2019, 16, 6–15. [Google Scholar] [CrossRef]
Figure 1.
Pseudorapidity distributions of charged particles in minimum bias Au + Au collisions at = 4.5, 7.7, and 11.5 GeV. Each marker represents the event generator: UrQMD [12] (black circles), AMPT [13] (red squares), and DCM-QGSM-SMM [14,15] (blue triangles). The green vertical band shows the pseudorapidity region of TPC used for centrality selection.

Figure 2.
Charged particle multiplicity distribution from the UrQMD model (open squares) for Au + Au collisions at = 7.7 GeV compared to the fitted distribution using MC–Glauber (blue solid triangles). 10% centrality classes defined with MC–Glauber normalization are indicated with black dotted vertical lines.

Figure 3.
Charged particle multiplicity distribution from the UrQMD model (open squares) for Au + Au collisions at = 7.7 GeV compared to the fitted distribution using the –fit method (red circles). The 10% centrality classes are defined with MC–Glauber normalization, indicated with black dotted vertical lines.

Figure 4.
Charged particle multiplicity distribution from the UrQMD model (open squares) for Au + Au collisions at = 4.5, 7.7 and 11.5 GeV compared to the fitted distribution using -fit (red squares) and MC-Glauber (blue triangles) methods. Bottom plots show the ratio of the resulting fit functions to the charged particle multiplicity distribution.

Figure 5.
Charged particle multiplicity distribution from the AMPT model (open squares) for Au + Au collisions at = 4.5, 7.7 and 11.5 GeV compared to the fitted distribution using -fit (red squares) and MC-Glauber (blue triangles) methods. Bottom plots show the ratio of the resulting fit functions to the charged particle multiplicity distribution.

Figure 6.
Charged particle multiplicity distribution from the DCM-QGSM-SMM model (open squares) for Au + Au collisions at = 4.5, 7.7 and 11.5 GeV compared to the fitted distribution using -fit (red squares) and MC-Glauber (blue triangles) methods. Bottom plots show the ratio of the resulting fit functions to the charged particle multiplicity distribution.

Figure 7.
Mean impact parameter distribution from three models (open symbols) for Au + Au collisions at = 4.5, 7.7 and 11.5 GeV compared to the fitted distribution using -fit (red symbols) and MC-Glauber (blue symbols) methods.
Figure 7.
Mean impact parameter distribution from three models (open symbols) for Au + Au collisions at = 4.5, 7.7 and 11.5 GeV compared to the fitted distribution using -fit (red symbols) and MC-Glauber (blue symbols) methods.

Figure 8.
Standard deviation of the impact parameter distribution from three models (open symbols) for Au + Au collisions at = 4.5, 7.7 and 11.5 GeV compared to the fitted distribution using -fit (red symbols) and MC-Glauber (blue symbols) methods.
Figure 8.
Standard deviation of the impact parameter distribution from three models (open symbols) for Au + Au collisions at = 4.5, 7.7 and 11.5 GeV compared to the fitted distribution using -fit (red symbols) and MC-Glauber (blue symbols) methods.

Figure 9.
Centrality dependence of the average impact parameter for Au + Au collisions at = 4.5, 7.7 and 11.5 GeV for -fit approach. The resulting values of extracted from the used method (closed symbols) are compared with the values used in UrQMD model (open symbols).
Figure 9.
Centrality dependence of the average impact parameter for Au + Au collisions at = 4.5, 7.7 and 11.5 GeV for -fit approach. The resulting values of extracted from the used method (closed symbols) are compared with the values used in UrQMD model (open symbols).

Figure 10.
Centrality dependence of the average impact parameter for Au + Au collisions at = 4.5, 7.7 and 11.5 GeV for MC-Glauber approach. The resulting values of extracted from the used method (closed symbols) are compared with the values used in UrQMD model (open symbols).
Figure 10.
Centrality dependence of the average impact parameter for Au + Au collisions at = 4.5, 7.7 and 11.5 GeV for MC-Glauber approach. The resulting values of extracted from the used method (closed symbols) are compared with the values used in UrQMD model (open symbols).

Figure 11.
Centrality dependence of the average impact parameter for Au + Au collisions at = 4.5, 7.7 and 11.5 GeV for -fit approach. The resulting values of extracted from the used method (closed symbols) are compared with the values used in AMPT model (open symbols).
Figure 11.
Centrality dependence of the average impact parameter for Au + Au collisions at = 4.5, 7.7 and 11.5 GeV for -fit approach. The resulting values of extracted from the used method (closed symbols) are compared with the values used in AMPT model (open symbols).

Figure 12.
Centrality dependence of the average impact parameter for Au + Au collisions at = 4.5, 7.7 and 11.5 GeV for MC-Glauber approach. The resulting values of extracted from the used method (closed symbols) are compared with the values used in AMPT model (open symbols).
Figure 12.
Centrality dependence of the average impact parameter for Au + Au collisions at = 4.5, 7.7 and 11.5 GeV for MC-Glauber approach. The resulting values of extracted from the used method (closed symbols) are compared with the values used in AMPT model (open symbols).

Figure 13.
Centrality dependence of the average impact parameter for Au + Au collisions at = 4.5, 7.7 and 11.5 GeV for -fit approach. The resulting values of extracted from the used method (closed symbols) are compared with the values used in DCM-QGSM-SMM model (open symbols).
Figure 13.
Centrality dependence of the average impact parameter for Au + Au collisions at = 4.5, 7.7 and 11.5 GeV for -fit approach. The resulting values of extracted from the used method (closed symbols) are compared with the values used in DCM-QGSM-SMM model (open symbols).

Figure 14.
Centrality dependence of the average impact parameter for Au + Au collisions at = 4.5, 7.7 and 11.5 GeV for MC-Glauber approach. The resulting values of extracted from the used method (closed symbols) are compared with the values used in DCM-QGSM-SMM model (open symbols).
Figure 14.
Centrality dependence of the average impact parameter for Au + Au collisions at = 4.5, 7.7 and 11.5 GeV for MC-Glauber approach. The resulting values of extracted from the used method (closed symbols) are compared with the values used in DCM-QGSM-SMM model (open symbols).

Figure 15.
Charged particle multiplicity distribution from the reconstructed UrQMD events (open squares) for Au + Au collisions at = 4.5, 7.7 and 11.5 GeV compared to the fitted distribution using -fit (red squares) and MC-Glauber (blue triangles). Bottom plots show ratio of the resulting fit functions to the charged particle multiplicity distribution.

Figure 16.
Centrality dependence of the average impact parameter for Au + Au collisions at = 7.7 GeV for -fit approach. Multiplicity of charged particles were gathered for (a) all charged tracks and (b) only primary tracks from the model itself. Additional track quality cut was applied. The resulting values were compared with generated UrQMD data without any reconstruction (c). Lower plots shows fit-to-model ratio.

Figure 17.
Centrality dependence of the average impact parameter for Au + Au collisions at = 7.7 GeV for MC-Glauber approach. Multiplicity of charged particles were gathered for (a) all charged tracks and (b) only primary tracks from the model itself. Additional track quality cut was applied. The resulting values were compared with generated UrQMD data without any reconstruction (c). Lower plots shows fit-to-model ratio.

Figure 18.
Sensitivity of the impact parameter reconstruction to variations of parameters for the MC-Glauber and -fit approaches as a function of centrality.
Figure 18.
Sensitivity of the impact parameter reconstruction to variations of parameters for the MC-Glauber and -fit approaches as a function of centrality.

Publisher’s Note: MDPI stays neutral with regard to jurisdictional claims in published maps and institutional affiliations. |
© 2021 by the authors. Licensee MDPI, Basel, Switzerland. This article is an open access article distributed under the terms and conditions of the Creative Commons Attribution (CC BY) license (https://creativecommons.org/licenses/by/4.0/).
Share and Cite
MDPI and ACS Style
Parfenov, P.; Idrisov, D.; Luong, V.B.; Taranenko, A. Relating Charged Particle Multiplicity to Impact Parameter in Heavy-Ion Collisions at NICA Energies. Particles 2021, 4, 275-287. https://0-doi-org.brum.beds.ac.uk/10.3390/particles4020024
AMA Style
Parfenov P, Idrisov D, Luong VB, Taranenko A. Relating Charged Particle Multiplicity to Impact Parameter in Heavy-Ion Collisions at NICA Energies. Particles. 2021; 4(2):275-287. https://0-doi-org.brum.beds.ac.uk/10.3390/particles4020024
Chicago/Turabian StyleParfenov, Petr, Dim Idrisov, Vinh Ba Luong, and Arkadiy Taranenko. 2021. "Relating Charged Particle Multiplicity to Impact Parameter in Heavy-Ion Collisions at NICA Energies" Particles 4, no. 2: 275-287. https://0-doi-org.brum.beds.ac.uk/10.3390/particles4020024