
Diurnal Variations of the Count Rates from Dark Photons in PHELEX


Institute for Nuclear Research, Russian Academy of Sciences, 117312 Moscow, Russia
*
Author to whom correspondence should be addressed.
Particles 2022, 5(2), 180-187; https://0-doi-org.brum.beds.ac.uk/10.3390/particles5020016
Submission received: 24 April 2022
/
Revised: 1 June 2022
/
Accepted: 2 June 2022
/
Published: 6 June 2022
(This article belongs to the Collection Dark Matter and New Physics of Hidden Particles)
Abstract
:This paper reports the PHELEX experiment, i.e., PHoton–ELectron EXperiment, to search for the dark photons (DPs) of cold dark matter using a multicathode counter technique specifically developed for this purpose by the authors. The paper presents new data, a novel upper limit for the constant of kinetic mixing, and the first results of measurements of the diurnal variations in solar and stellar frames. The perspectives of this method are outlined in terms of the search for DPs.
1. Introduction
Undoubtedly, dark matter (DM) is one of nature’s great enigmas, which poses a challenge for the present experiment. Solving the problem requires obtaining a DM signal and proving its DM origin. The importance of this issue was demonstrated by the results obtained by the DAMA/LIBRA experiment [1]; the annual variations of the observed signal in that research can be considered as proof that weakly interacting massive particle (WIMP)-nucleon scattering is observed in NaI(Tl) crystals. However, as independent experiments have failed to validate this result to date, this is still an open question. The task is both difficult and rewarding since it involves the evolution of the universe. Physicists are employing different techniques in an attempt to explore all possibilities in the search for DM, and numerous experiments have been performed to pursue this goal. The present paper describes the authors’ work in the search for dark photons (DPs) as cold dark matter (CDM) using a novel technique proposed and developed by the authors specifically for this purpose. As the technique has been described previously [2,3], this paper focuses on the search for diurnal variations of the count rate as a promising technique to prove that DPs are truly observed as CDM. The strength of the method is that if DPs are polarized, i.e., vector of E-field of DPs has a major direction in stellar frame, then in this case one should observe that a temporal distribution in stellar frame should be symmetrical relative to some moment of time when the vector of E-field is in a plane of a meridian where the detector is located. This is independent of some uncertainties of the used reference model and is a strong argument that one really observes DPs. The work has been performed in the framework of PHoton–ELectron Experiment at the Institute for Nuclear Research, Moscow.
2. Materials and Methods
First, what is a dark photon? The discussion on the possible existence of a new Spin-1 Boson began last century in the early 1980s [4,5,6] and has resulted in extensive literature on the topic; review [7] can be referenced as a broad academic venture into this subject. From an experimental perspective, this object is an interesting focus of study, as a new boson has a mass that can be transformed into the energy of a usual massless photon due to kinetic mixing with a dimensionless parameter (χ), thereby quantifying the mixing. By this parameter, particles from the dark and standard model sectors are connected, which enables researchers to observe the effect. This hypothesis facilitates the introduction of a new field (A′) and two parameters (χ and mγ′) into Lagrangian, as shown in Equation (1):
where Aμ and A′μ are the photon and DP fields, respectively; Fμν and F’μν are the corresponding field strength tensors; and mγ′ is the mass of a DP. With the introduction of two new parameters into the theory, the effect of this can be observed in multiple ways. First, the most popular method of observing this particle is via its decay, e.g., to an e+e− pair [8] at accelerators where it can be created. Second, the effect of the scattering of the photon created from DPs in kinetic mixing can be observed on the valence electrons of atoms. In this case, the expected effect is proportional to the mass of the target, and the threshold and background count rates of the detector should be very low.
DAMA/LIBRA was one of the first experiments in this sphere and was succeeded by numerous experiments following the same ideology (e.g., reference [9] and others therein). Over the past three decades, these investigations, which were designed to search for WIMP scattering on the nuclei of a target, have made significant advances. Some of these detectors are also sensitive to the scattering of DPs on the valence electrons of atoms and notable experimental techniques have been employed, e.g., scintillating and semiconducting detectors, dual-phase xenon detectors, and cryogenic detectors. The upper limits for the scattering of DPs on the valence electrons of a target’s atoms have been obtained (e.g., reference [10] and the references contained therein). The original method is an idea to use a dish antenna [11] to observe the reflected radiation from the surface of the antenna by the conversion of DPs into real ones. In this case, the effect is proportional to the surface of the antenna due to the power collected by the antenna, as follows:
where it was taken that c = 1, α2 = cos2θ, θ is the angle between the vector of the E-field of the DP-originated photon and its projection onto the surface of the antenna, ρCDM is the energy density of DM (which can be taken here as ρCDM = (0.55 ± 0.12) GeV/cm3 [12]), and A is the surface of the antenna. However, this method does not work at higher photon energies because as the coefficient of photon reflection from the surface of an antenna becomes low, the photon is absorbed rather than reflected. To apply this method to higher energies, the authors proposed the use of a proportional counter instead of an antenna to detect the electrons emitted in the photoelectric effect from the surface of a counter’s cathode by the conversion of DPs into real ones. In this case, the power collected by the antenna will be described by Equation (2) also, but θ here is the angle between the vector of the E-field of the DP-originated photon and surface normal because it is quite reasonable to believe that the expected effect from DPs is maximal when E-field is normal to the surface of the cathode. This assumption may turn out to be wrong because we do not know yet what the field configuration of the real DP is, as modern theoretical studies suggest a variety of possibilities [13]. However we can take it as a reference model which will be tested in the experiment, as will be explained in the final section. In this case, the count rate of single electrons can be obtained using the following equation:
where it was taken that c = 1, RMCC is the count rate of single electrons, and η is the quantum efficiency for a given cathode; here, this was taken to be equal to that of the real photon with energy equal to the mass of the DP. The upper limit is obtained by combining Equations (2) and (3), as shown in Equation (4).
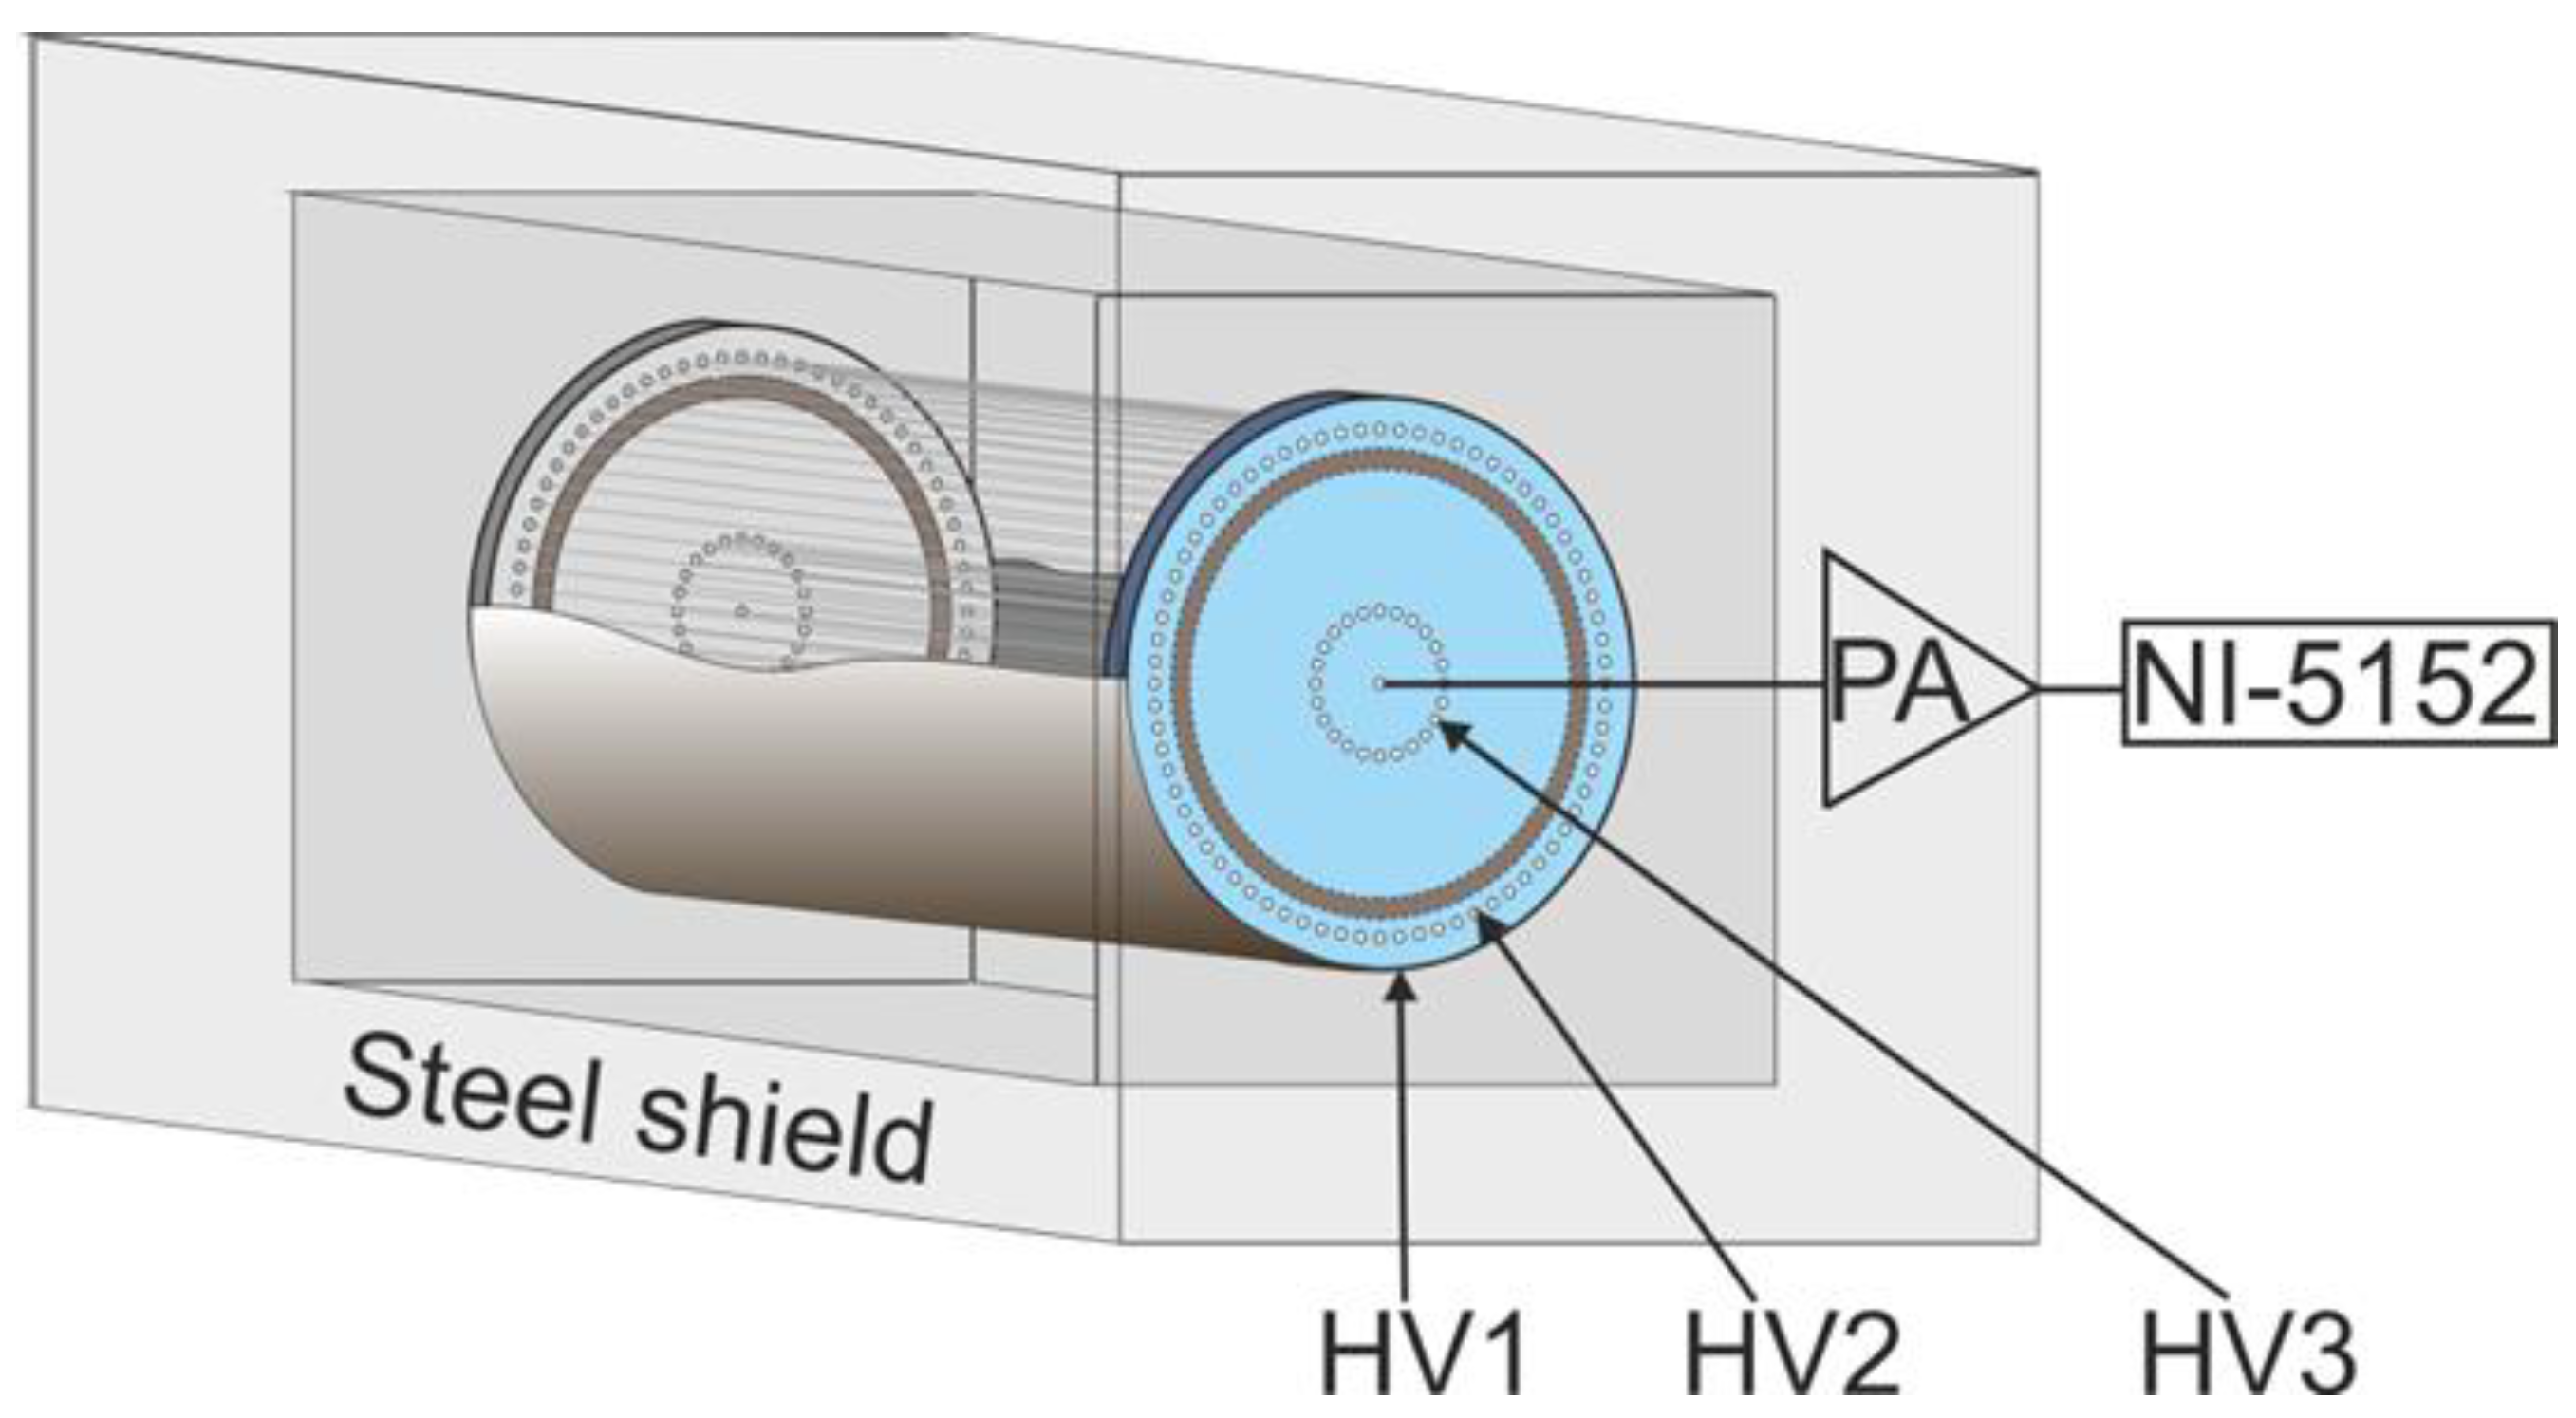
The main problem here is the background count rate from the events with traces of ionized particles cut at both ends of the counter, which can simulate single electrons. These simulations produce major irreducible background in this technique. To subtract this background, a multicathode counter was constructed [2,3] (see Figure 1 for its design).
The counter has three cathodes instead of one. The first, which is an outer metallic cylinder, acts as a target. The second, which is fabricated from 50 μm diameter wires located 5 mm from the first cathode, functions as a barrier to the electrons emitted from the first cathode. Finally, the third cathode, which is also made of 50 μm wires tightened in a 20 mm radius around a 20 μm diameter anode wire, enables high (>105) gas amplification; this is required to register the single electrons emitted from the outer cathode.
3. Results
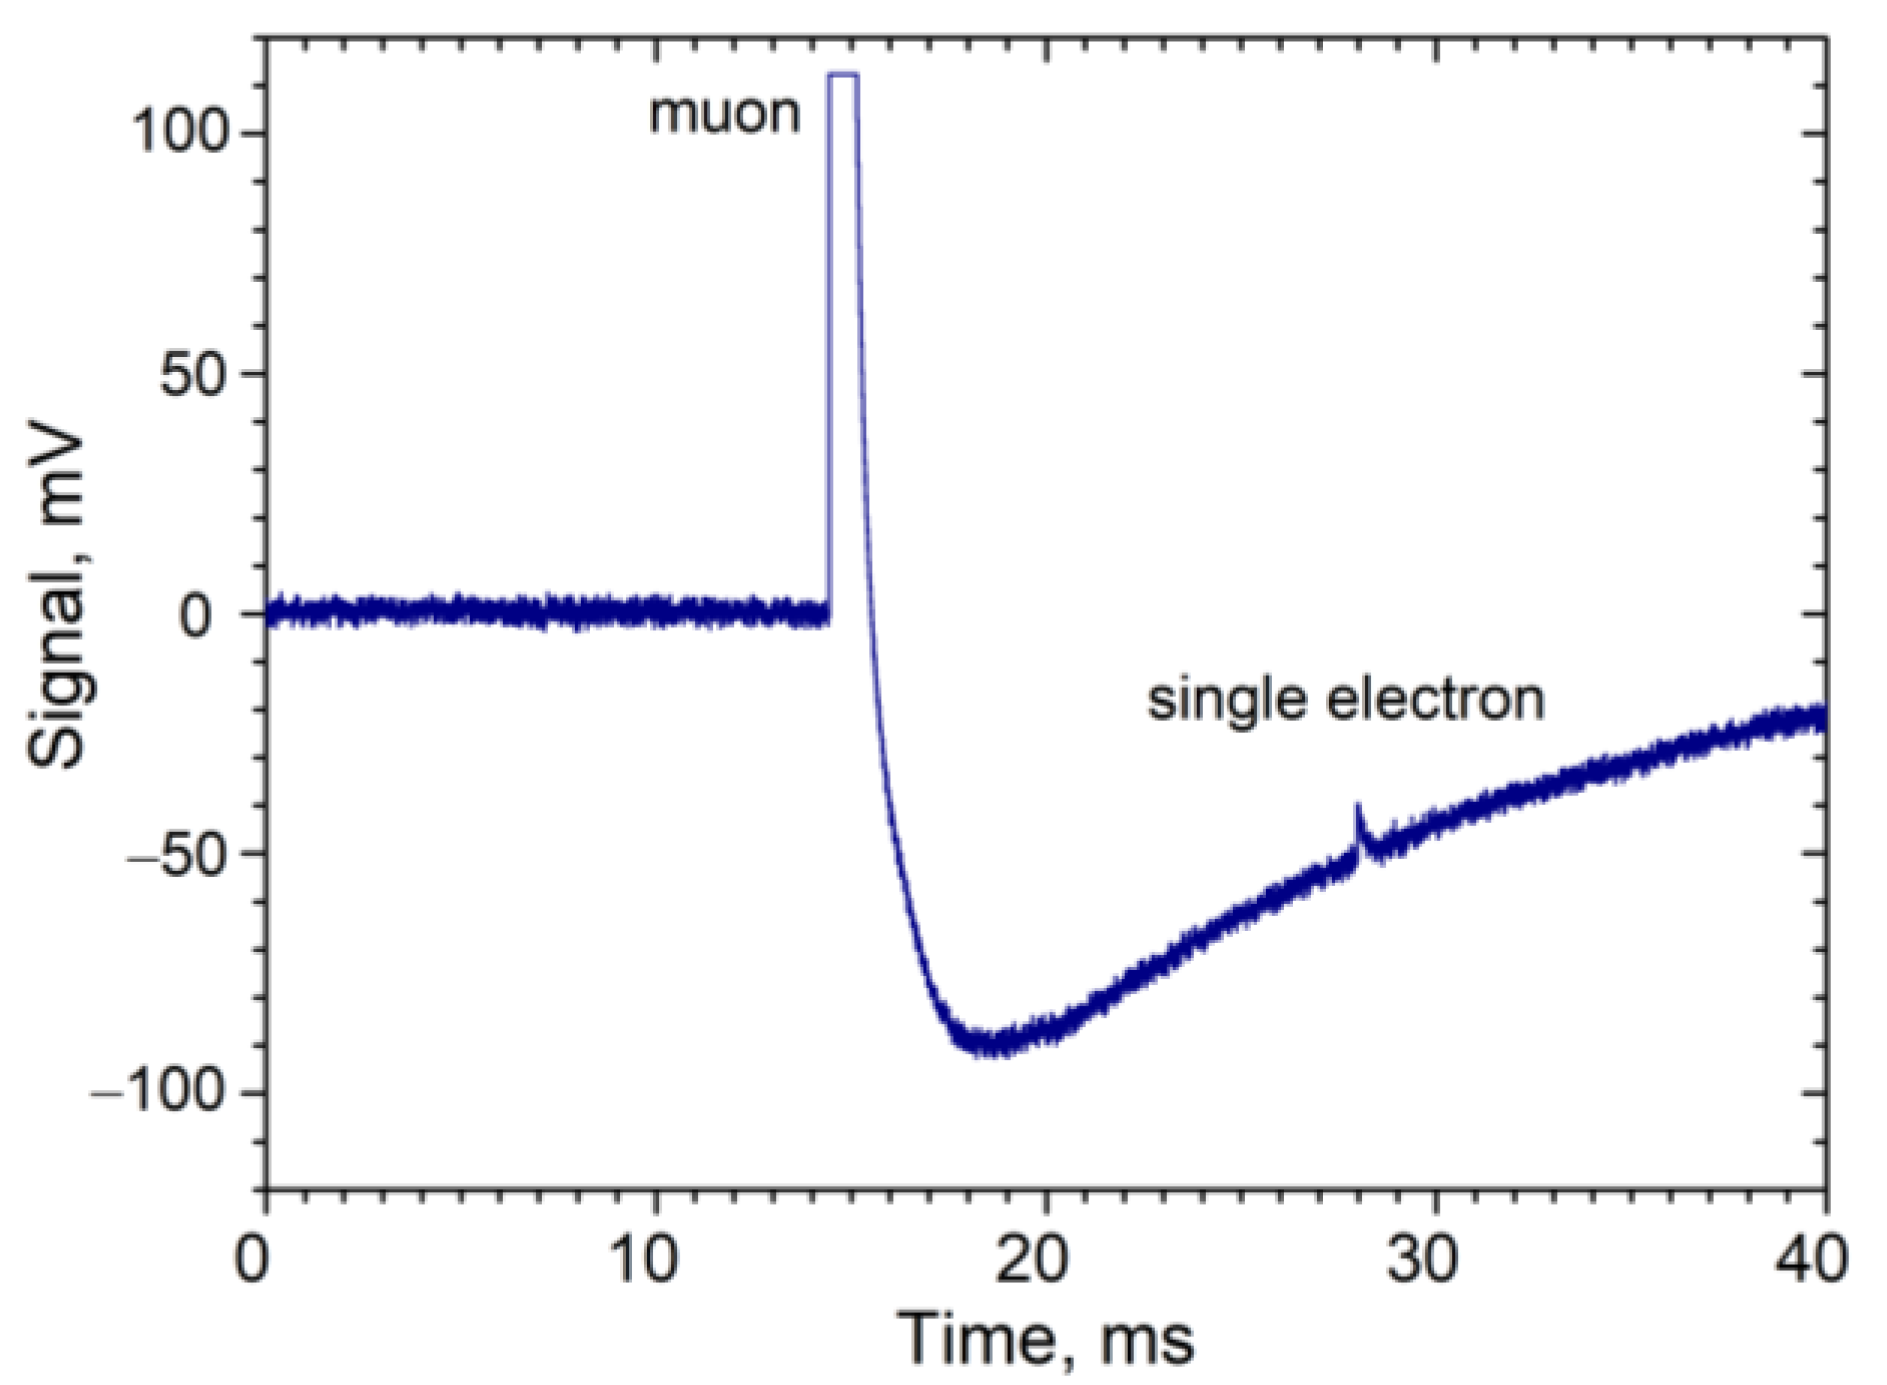
This study used two counting configurations. The first was utilized when the potential at the second cathode was higher than at the first. This configuration allows electrons emitted from the outer cathode to drift freely toward the anode. In addition to the electrons emitted from the outer cathode, the background from both ends of the counter was counted in this configuration. In the second configuration, the potential applied to the second cathode was lower than that of the outer cathode; therefore, the electrons emitted from this cathode were rejected and were unable to reach the counter’s anode. Only the background was counted in this configuration. The net effect was determined by subtracting the count rate in the second configuration from that in the first configuration run by run. After many counting runs, the data were collected to obtain the result. This study’s upper limit result of χ < 10−11 for the mass range from 9 to 40 eV obtained using a counter with an aluminum cathode and a Ne + CH4 (10%) mixture published in [14] was included in the review of PDG in reference [15]. The sensitivity of this study’s proposed method is highest within this mass range [3]. It should be noted that here, free electrons of a degenerate electron gas were used as a target; therefore, the proposed method complements those using valence electrons as targets [16,17,18]. The details of the physics in the above processes differ, which may have significant implications in terms of data interpretation. Recently, measurements were made using the same counter with increased data. The measurements were made directly on the surface of Earth at the ground floor in a building in Troitsk, Moscow. In this case, the counter was crossed by multiple muons from cosmic rays. Figure 2 presents one of the frames taken with a pulse from a muon crossing the counter and a pulse from a single electron.
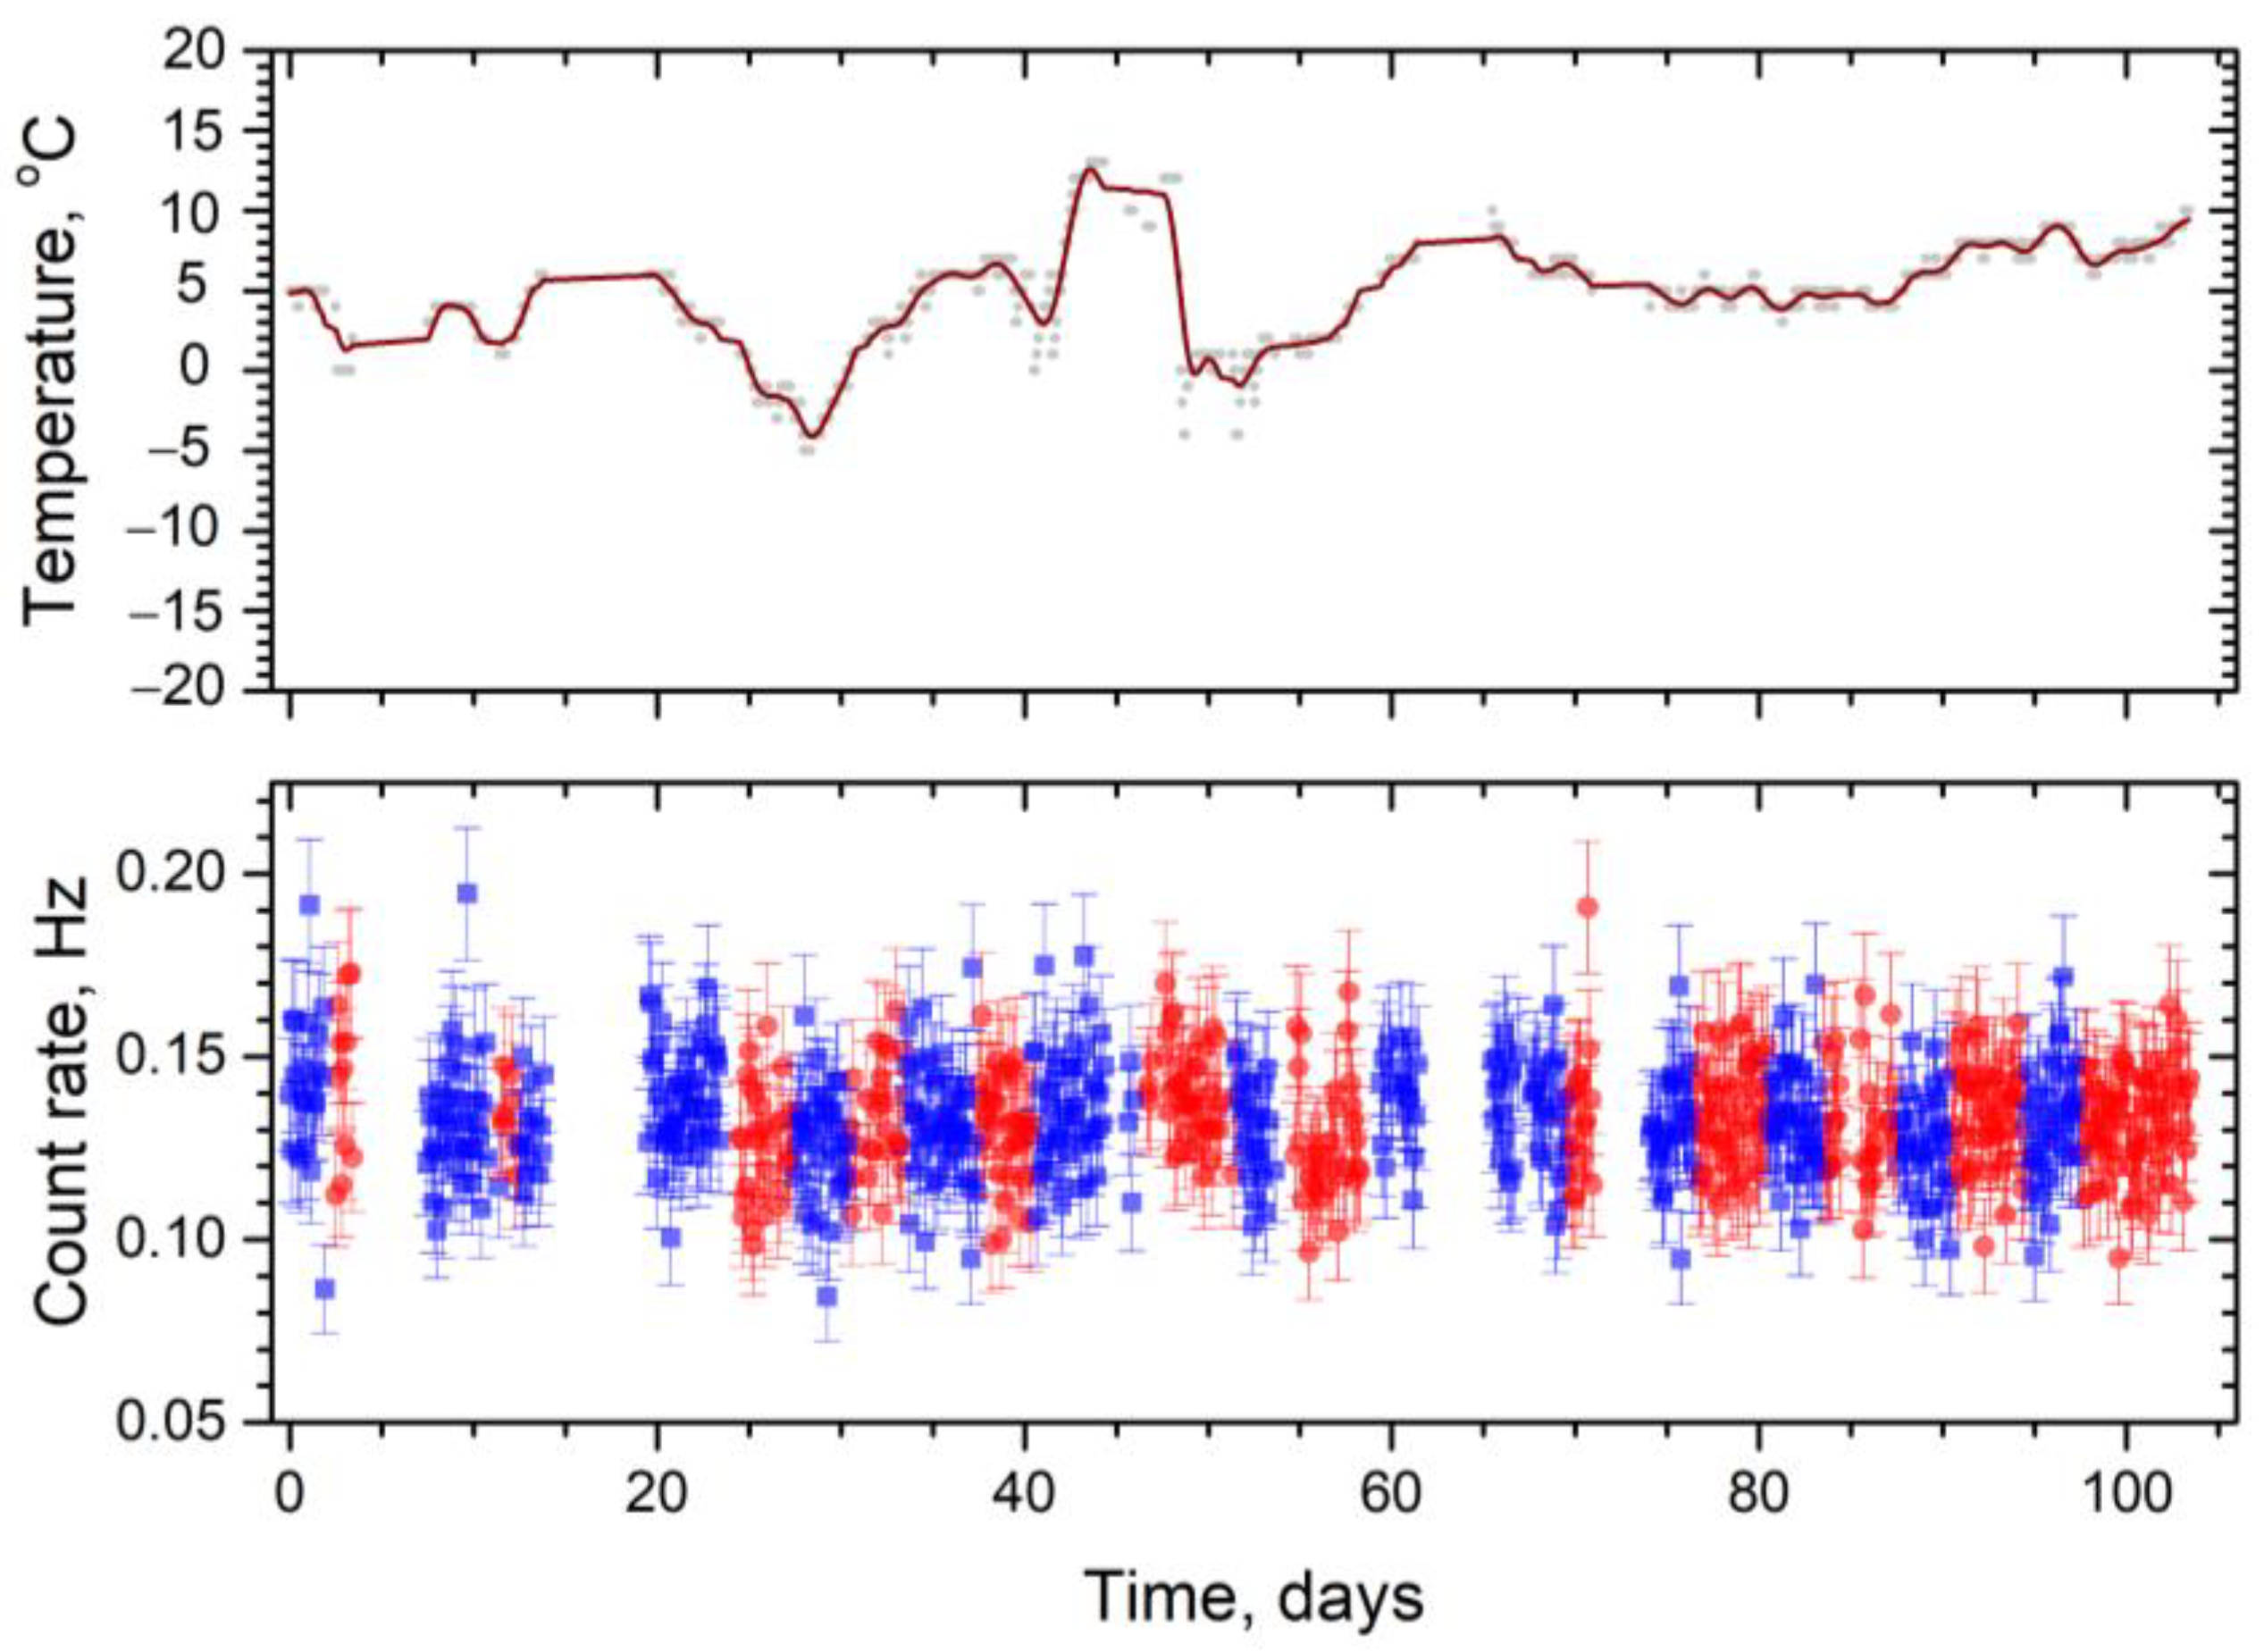
The pulses from single electrons were collected at intervals between the pulses from muons. Because a typical count rate of muons was approximately 15 per second and a dead time after the leading edge of each muon pulse was approximately 10 ms, there was minimal counting interference. Around 1 TB of data was collected on a hard disk daily, and all data treatment was performed offline. Figure 3 shows the count rates measured in configurations 1 and 2.
The net count rate of the single electrons emitted from the outer cathode was obtained by subtracting the count rate in configuration 2 from that in configuration 1. Based on these measurements, the count rate from the single electrons was obtained, as follows:
where ε = 0.608—efficiency of counting of single electron [3]. Then, from Equation (4):
rMCC = −0.00018 ± 0.00101 Hz and from here we take 95% CL upper limit:
RMCC = 1.64σ/ε = 0.0027 Hz
RMCC = 1.64σ/ε = 0.0027 Hz
χ < 6×10⁻¹² for mass interval from 9 till 40 eV.
4. Discussion
The detector presented in this study has a remarkable feature of directionality. As Spin-1 DM candidates for DPs have an intrinsic polarization direction, the polarization of DP-originated photons and that of DPs should match. In Equation (2), the factor α2 means that if the flux of photons is polarized, i.e., the vector of the E-field has a certain direction in a galactic or solar frame, then the Earth’s rotation will cause variations in the effect of DPs. We take for a reference model that when the E-field vector is along the axis of the counter when < α2 > = 0, this effect is minimal. However, when this vector is perpendicular to the axis of the counter, then < α2 > = 0.5. Both the geographical latitude of the location site of the detector and the specific orientation of the counter influence the diurnal variations of the effects of DPs [19]. This can be observed if DPs are polarized and the counter’s cathode has a mirrored surface. The internal surface of the cathode of this paper’s counter can be seen in Figure 4.
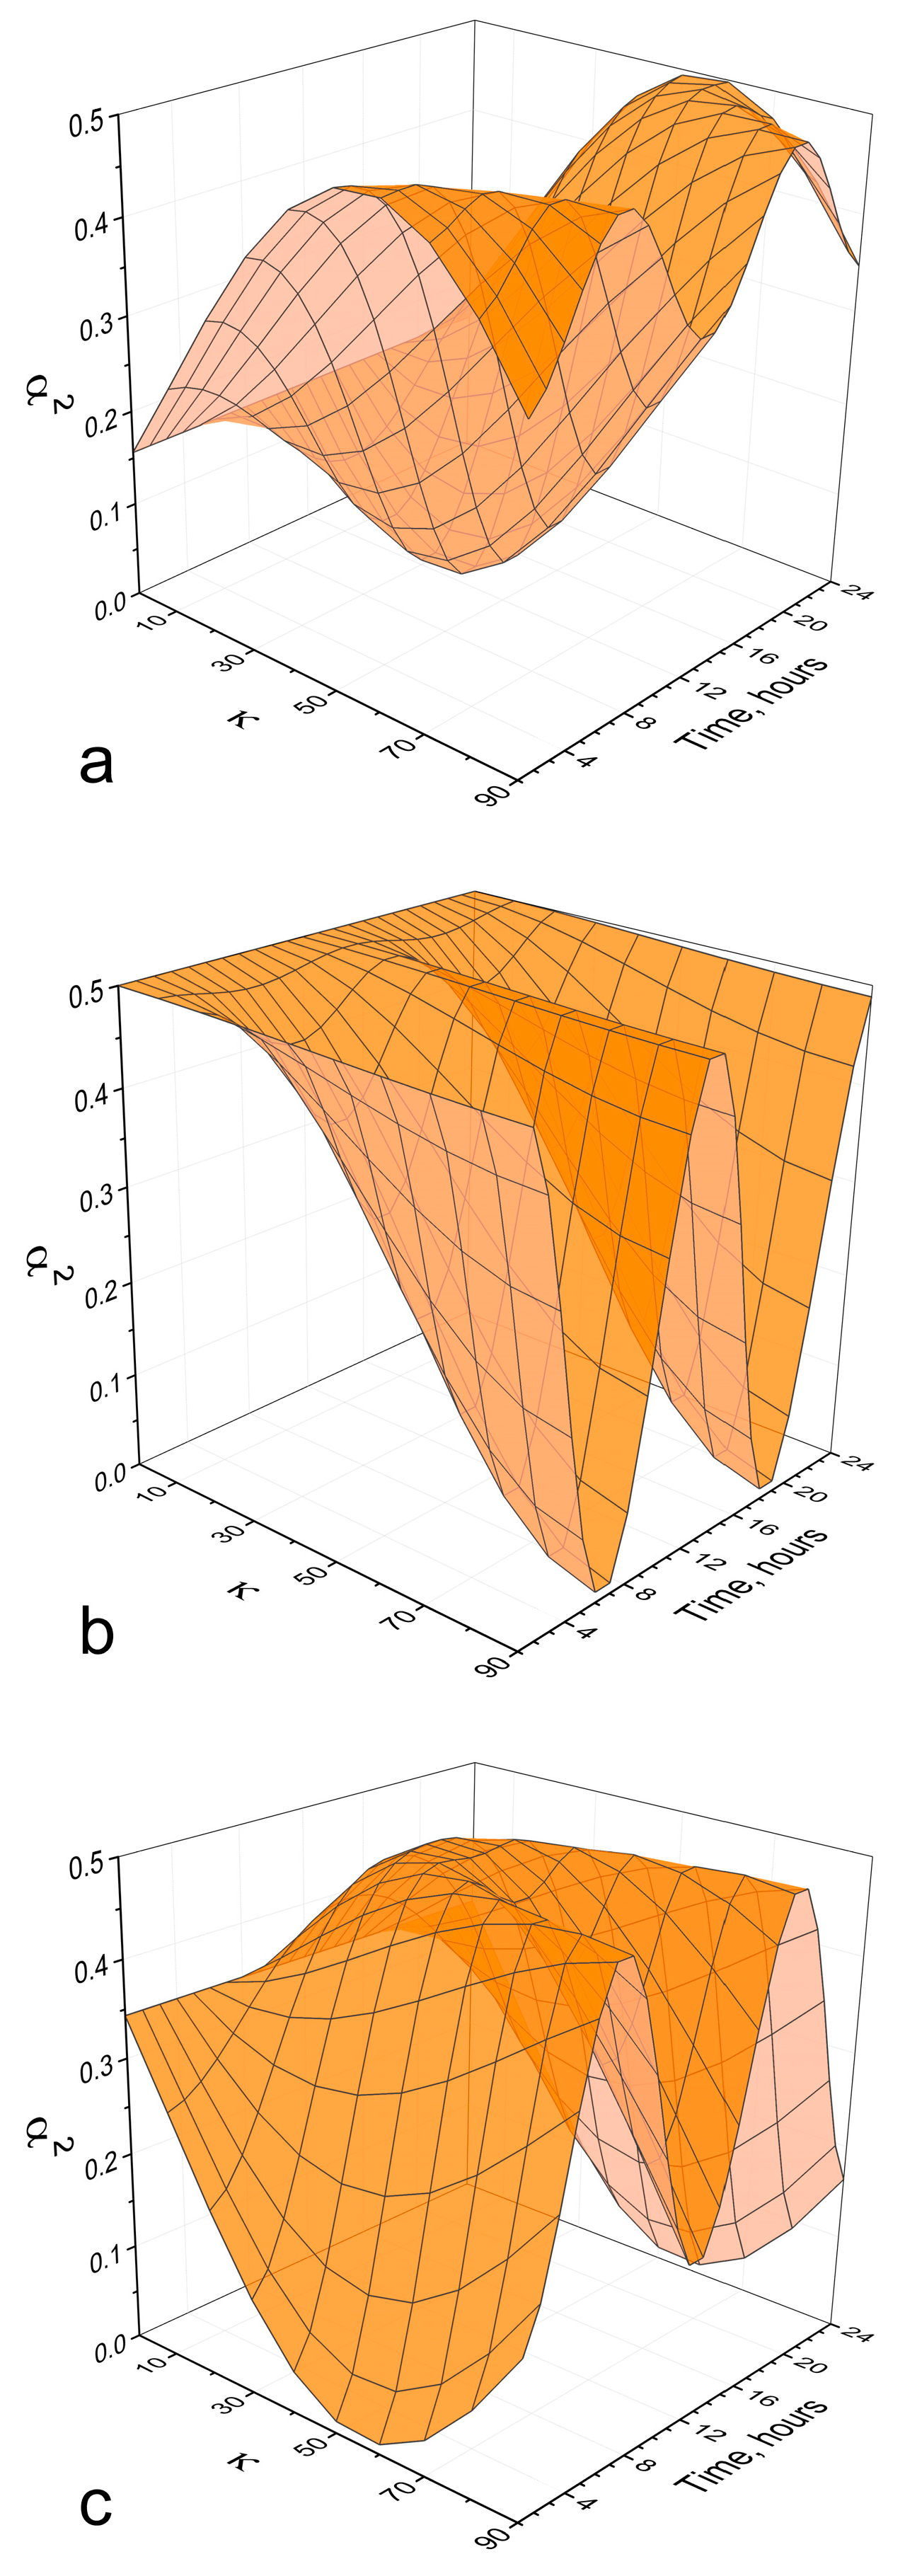
For the control measurements, a counter with a matt cathode can be used to ensure that there is no effect in this case. The curve of the diurnal variations of the count rate can be acquired by collecting the results of the measurements in configurations 1 and 2 obtained at specific time intervals during one solar day (24 h) or one sidereal day (23 h, 56 min, and 4 s). Figure 5 presents the expected effect calculated for the Moscow-based counter (geographical latitude 55°45′ N) for three different orientations of counters (vertical, horizontal west–east, and north–south) for different angles κ between the E-field vector and the Earth’s axes. The starting-point moment was selected when the vector of the E-field was in the plane of the Moscow meridian.
Significant differences can be observed in the variation curves for different orientations and angles (κ); however, they are always symmetrical relative to the moment of 12:00. This feature enables the suppression of curves without this symmetry as false curves. Additionally, it facilitates the identification of a moment in time when the vector of the field is in the plane of the corresponding meridian. Figure 6 shows the curves obtained for 871 points calculated from this study’s latest measurements presented in Figure 3.
5. Conclusions
As one can see from Figure 6, the error bars here are large, and to make definite conclusions, we should collect more data; however, it illustrates what could be obtained from measured variation curves in future analyses if the data are expanded and we manage to significantly decrease error bars. From here, a moment of time relative to when the curve exhibits symmetry could be acquired. Suppose that, for the blue curve, this moment is at 18:00 stellar time. Then, it would follow that, first, this study’s results supported the vector of the E-field having a certain direction within a stellar frame. Then, this moment of time relative to when symmetry would be observed would be 6 h later than the moment of 12:00. Second, this means that 6 h later, the moment of 00:00, i.e., at the moment of 06:00 stellar time, the E-field vector would be in the plane of the Moscow meridian where the detector is situated at present. Then, the obtained and calculated curves should be compared for different angles between the vector of the E-field and the axes of the Earth for specific orientations of the measurement counter. If an agreement is found between the calculated and observed curves at some angles and specific orientations of the counter, then the orientation of the E-field vector can be obtained. Then, the factor α2 = cos2θ in Equation (2) can be considered correct and our reference model is correct. However, if it is not, then something should be omitted from the considerations, or the factor differs from cos2θ; consequently, a comparison should be made with the data obtained using counters at different orientations and potentially at different geographical latitudes. This could indicate the explanation.
This field encompasses an expansive study area in which the existence of symmetrical curves in observed diurnal variations is a critical point. Furthermore, for the control, counters with matt cathode surfaces should not exhibit this feature. These considerations will form the basis of the authors’ future work.
Author Contributions
Conceptualization: A.K.; Data curation: A.K. and V.P.; Formal analysis: V.P.; Funding acquisition: V.P.; Investigation: A.K. and I.O.; Methodology: A.K.; Project administration: A.K.; Software: V.P. All authors have read and agreed to the published version of the manuscript.
Funding
This research received no external funding.
Institutional Review Board Statement
Not applicable.
Informed Consent Statement
Not applicable.
Data Availability Statement
Not applicable.
Acknowledgments
We appreciate very much the substantial support from the Ministry of Science and Higher Education of Russian Federation within the “Instrument Base Renewal Program” in the framework of the State project “Science”.
Conflicts of Interest
The authors declare that they have no known competing financial interest or personal relationship that could have appeared to influence the work reported in this paper.
References
- Bernabei, R.; Belli, P.; Caracciolo, V.; Cerulli, R.; Merlo, V.; Cappella, F.; Ye, Z.P. The dark matter: DAMA/LIBRA and its perspectives. arXiv 2021, arXiv:2110.04734v1. [Google Scholar]
- Kopylov, A.; Orekhov, I.; Petukhov, V. A multi-cathode counter in a single-electron counting mode. Nucl. Instrum. Meth. A 2018, 910, 164. [Google Scholar] [CrossRef] [Green Version]
- Kopylov, A.V.; Orekhov, I.V.; Petukhov, V.V. Method of search for hidden photons of Cold Dark Matter using a multi-cathode counter. Phys. Atom. Nucl. 2019, 82, 1317–1324. [Google Scholar] [CrossRef]
- Fayet, P. On the search for a New Spin 1 Boson. Nucl. Phys. B 1981, 187, 184–204. [Google Scholar] [CrossRef] [Green Version]
- Okun, L.B. Limits of Electrodynamics: Paraphotons? Sov. Phys. JETP 1982, 56, 502. [Google Scholar]
- Georgi, H.; Ginsparg, P.; Glashow, S.L. Photon Oscillations and the Cosmic Background Radiation. Nature 1983, 306, 765–766. [Google Scholar] [CrossRef]
- Fabbrichesi, M.; Gabrielli, E.; Lanfranchi, G. The Physics of the Dark Photon; Springer Cham: New York, NY, USA, 2021. [Google Scholar] [CrossRef]
- Banerjee, D.; Bernhard, J.; Burtsev, V.E.; Chumakov, A.G.; Cooke, D.; Crivelli, P.; NA64 Collaboration. Improved limits on a hypothetical X(16.7) boson and a dark photon decaying into e+e− pairs. Phys. Rev. D 2020, 101, 071101. [Google Scholar] [CrossRef] [Green Version]
- XENON Collaboration; Aprile, E.; Aalbers, J.; Agostini, F.; Alfonsi, M.; Althueser, L.; Zhu, T. Dark Matter Search Results from a one ton-year Exposure of XENON1T. Phys. Rev. Lett. 2018, 121, 111302. [Google Scholar] [CrossRef] [Green Version]
- An, H.; Pospelov, M.; Pradler, J.; Ritz, A. Direct detection constraints on dark photon dark matter. Phys. Lett. B 2015, 747, 331. [Google Scholar] [CrossRef] [Green Version]
- Horns, D.; Jackel, J.; Lindner, A.; Lobanov, A.; Redondo, J.; Ringwald, A. Searching for wispy cold dark matter with a dish antenna. JCAP 2013, 4, 16. [Google Scholar] [CrossRef]
- Benito, M.; Iocco, F.; Couco, A. Uncertainties in the Galactic Dark Matter Distribution: An Update. Phys. Dark Universe 2021, 32, 100826. [Google Scholar] [CrossRef]
- Dzunushaliev, V.; Folomeev, V. Proca balls with angular momentum or flux of electric field. Phys. Rev. D 2022, 105, 016022. [Google Scholar] [CrossRef]
- Kopylov, A.; Orekhov, I.; Petukhov, V. Results from a hidden photon dark matter search using a multi-cathode counter. JCAP 2019, 7, 008. [Google Scholar] [CrossRef] [Green Version]
- Zyla, P.A.; Barnett, R.M.; Beringer, J.; Dahl, O.; Dwyer, D.A.; Groom, D.E.; Lin, C.J.; Lugovsky, K.S.; Pianori, E.; Robinson, D.J.; et al. Review of Particle Physics. Prog. Theor. Exp. Phys. 2020, 2020, 083C01. [Google Scholar] [CrossRef]
- Essig, R.; Volansky, T.; Yu, T.T. New constraints and prospects for sub-GeV dark matter scattering off electrons in xenon. Phys. Rev. D 2017, 96, 043017. [Google Scholar] [CrossRef] [Green Version]
- Abramoff, O.; Barak, L.; Bloch, I.M.; Chaplinsky, L.; Crisler, M.; Drlica-Wagner, A.; Sensei Collaboration. SENSEI: Direct-Detection Constraints on Sub-GeV Dark Matter from a Shallow Underground Run Using a Prototype Skipper CCD. Phys. Rev. Lett. 2019, 122, 161801. [Google Scholar] [CrossRef] [PubMed] [Green Version]
- Aguilar-Arevalo, A.; Amidei, D.; Baxter, D.; Cancelo, G.; Vergara, B.C.; Chavarria, A.E.; Damic Collaboration. Constraints on Light Dark Matter Particles Interacting with Electrons from DAMIC at SNOLAB. Phys. Rev. Lett. 2019, 123, 181802. [Google Scholar] [CrossRef] [PubMed] [Green Version]
- Kopylov, A.; Orekhov, I.; Petukhov, V. On the possibility of observing diurnal variations in the count rate of dark photons using a multicathode counters. Phys. Part. Nucl. 2021, 52, 31–38. [Google Scholar] [CrossRef]
Figure 1.
The scheme of multicathode counter. PA—preamplifier. NI-5152—digitizing board. HV1–HV3—potentials at the cathodes.
Figure 1.
The scheme of multicathode counter. PA—preamplifier. NI-5152—digitizing board. HV1–HV3—potentials at the cathodes.

Figure 2.
The pulses from muon and from single electron.

Figure 3.
The count rates measured in configuration 1 (red) and configuration 2 (blue). Upper diagram shows the temperature of the counter during measurements.
Figure 3.
The count rates measured in configuration 1 (red) and configuration 2 (blue). Upper diagram shows the temperature of the counter during measurements.

Figure 4.
The internal surface of the cathode of multicathode counter.

Figure 5.
The expected diurnal variations for counters placed in Moscow for different orientations and different angle κ between vector of E-field and the axes of the Earth; (a)—vertical orientation, (b) east–west orientation, (c) north–south orientation.
Figure 5.
The expected diurnal variations for counters placed in Moscow for different orientations and different angle κ between vector of E-field and the axes of the Earth; (a)—vertical orientation, (b) east–west orientation, (c) north–south orientation.

Figure 6.
The variation curves obtained for solar day (red line and lower scale) and sidereal day (blue line and upper scale).
Figure 6.
The variation curves obtained for solar day (red line and lower scale) and sidereal day (blue line and upper scale).

Publisher’s Note: MDPI stays neutral with regard to jurisdictional claims in published maps and institutional affiliations. |
© 2022 by the authors. Licensee MDPI, Basel, Switzerland. This article is an open access article distributed under the terms and conditions of the Creative Commons Attribution (CC BY) license (https://creativecommons.org/licenses/by/4.0/).
Share and Cite
MDPI and ACS Style
Kopylov, A.; Orekhov, I.; Petukhov, V. Diurnal Variations of the Count Rates from Dark Photons in PHELEX. Particles 2022, 5, 180-187. https://0-doi-org.brum.beds.ac.uk/10.3390/particles5020016
AMA Style
Kopylov A, Orekhov I, Petukhov V. Diurnal Variations of the Count Rates from Dark Photons in PHELEX. Particles. 2022; 5(2):180-187. https://0-doi-org.brum.beds.ac.uk/10.3390/particles5020016
Chicago/Turabian StyleKopylov, Anatoly, Igor Orekhov, and Valery Petukhov. 2022. "Diurnal Variations of the Count Rates from Dark Photons in PHELEX" Particles 5, no. 2: 180-187. https://0-doi-org.brum.beds.ac.uk/10.3390/particles5020016