Machine Learning Models for Abnormality Detection in Musculoskeletal Radiographs

Department of Electrical and Computer Engineering, University of Houston, Houston, TX 77004, USA
Reports 2019, 2(4), 26; https://0-doi-org.brum.beds.ac.uk/10.3390/reports2040026
Submission received: 5 October 2019
/
Revised: 17 October 2019
/
Accepted: 20 October 2019
/
Published: 22 October 2019
Abstract
:Increasing radiologist workloads and increasing primary care radiology services make it relevant to explore the use of artificial intelligence (AI) and particularly deep learning to provide diagnostic assistance to radiologists and primary care physicians in improving the quality of patient care. This study investigates new model architectures and deep transfer learning to improve the performance in detecting abnormalities of upper extremities while training with limited data. DenseNet-169, DenseNet-201, and InceptionResNetV2 deep learning models were implemented and evaluated on the humerus and finger radiographs from MURA, a large public dataset of musculoskeletal radiographs. These architectures were selected because of their high recognition accuracy in a benchmark study. The DenseNet-201 and InceptionResNetV2 models, employing deep transfer learning to optimize training on limited data, detected abnormalities in the humerus radiographs with 95% CI accuracies of 83–92% and high sensitivities greater than 0.9, allowing for these models to serve as useful initial screening tools to prioritize studies for expedited review. The performance in the case of finger radiographs was not as promising, possibly due to the limitations of large inter-radiologist variation. It is suggested that the causes of this variation be further explored using machine learning approaches, which may lead to appropriate remediation.
1. Introduction
Musculoskeletal diseases affect more than one out of two persons over the age of 18 and three out of four age 65 and over in the United States [1]. Worldwide, more than 1.7 billion people are affected by musculoskeletal conditions. With an aging population, these diseases are becoming an increasing burden in a trend that is expected to continue and accelerate. Consequently, radiologist workloads are increasing with more images, greater case volume, increasing complexity, and less time to do the work, possibly leading to radiologist burnout [2]. Patients with musculoskeletal problems most often visit primary care offices. Almost 105 million ambulatory care visits to physician offices and hospital outpatient and emergency departments in the United States in 2009–2010 were for diseases of the musculoskeletal system and connective tissue. Of these visits, 39 million were to primary care offices, 32.4 million to surgical specialists, and 17 million to medical specialists [3]. While offering radiology services in a primary care setting reduces access issues and decreases the time to diagnosis and treatment, it could also lead to lower quality due to insufficient training and skills [4,5,6]. Increasing radiologist workloads and increasing primary care radiology services make it relevant to explore the use of AI and particularly deep learning to provide diagnostic assistance to radiologists and primary care physicians to improve the quality of patient care.
Early efforts at AI in performing human tasks have largely been experimental with significantly sub-human performance. In recent years, a dramatic increase in computing power and availability of large datasets have led to the creation of machine learning algorithms that are able to match and even surpass human performance in increasingly complex tasks [7]. Deep learning algorithms inspired by the human brain are based on a neural network structure and are trained on data to learn discriminative features [8]. Models thus trained can then be applied to new patient data to perform automated detection and diagnosis.
Deep learning algorithms are increasingly being used in radiological applications. Rajpurkar et al. [9] employed deep learning models to detect clinically important abnormalities such as edema, fibrosis, and pneumonia on chest radiography at performance levels comparable to practicing radiologists. Taylor et al. [10] successfully created a deep convolutional neural network for the detection of pneumothorax on chest x-rays. The area under the curve for this model was 0.96 on their single-site test dataset containing moderate to large size pneumothorax, suggesting that this model could serve as a useful screening tool for prioritizing studies for more rapid review and help improve time to treatment for this potentially life-threatening problem. When the same models were tested on images acquired outside this institution, performance declined significantly with an AUC of 0.75. Zech et al. [11] investigated how well deep learning models for pneumonia detection generalized across hospital systems. They found that the models performed significantly better (AUC 0.93–0.94) on new data from the same sites used for developing the model compared to data from other sites (AUC 0.75–0.89). To overcome the challenges in generalizing across the sites, a large training dataset collected in a variety of scenarios will be needed. Such an effort could be extremely expensive and difficult as it relates to medical data.
Rajpurkar et al. [12] investigated the performance of a 169-layer deep convolutional neural network model in detecting abnormalities of upper extremities in MURA (musculoskeletal radiographs) dataset, a collection of 14,863 musculoskeletal radiological studies from a single institution. Their model showed performance comparable to radiologist performance in detecting abnormalities on finger and wrist studies but lower performance on elbow, forearm, hand, humerus, and shoulder studies. In the case of finger data, while the model agreement with gold standard was similar to other radiologists’ agreement with gold standard, it was still quite low. The aim of this study is to investigate new model architectures and deep transfer learning to improve the performance in detecting abnormalities of upper extremities in limited data environments and allow them to serve as initial screening tools to prioritize studies for expedited review. Particular focus is placed on the MURA humerus and finger datasets, where Rajpurkar et al.’s model had the lowest performance. Improvements using this approach should translate into performance improvements when deployed to other sites.
Section 2 of this paper discusses the processes and techniques used in this study. The subsections provide a description of the dataset, preprocessing used on the data, and the rationale behind model architecture selection. The process used to train and test the selected deep learning models and the measures used for evaluating their performance are also detailed. Section 3 presents the performance results and the receiver operating characteristic curves of the selected models. Section 4 discusses the relative performance of the models used in the study on the humerus and finger datasets and some limitations of the study. This section also shares some interesting alternative approaches to dealing with limited data as topics for future studies. Finally, the concluding Section 5 summarizes the performance of the models on the humerus and finger datasets and their suitability for use as initial screening tools to prioritize radiographic studies for expedited review.
2. Experimental Section
2.1. Data
This study uses the MURA dataset, which was collected through an institutional review board approved study by Rajpurkar et al. [12] and made publicly available for research. MURA is a dataset of de-identified, HIPAA-compliant musculoskeletal radiographs consisting of 14,863 radiographic studies from 12,173 patients, with a total of 40,561 multi-view radiographic images from the Picture Archive and Communication System (PACS) of Stanford Hospital. Each radiographic study belongs to one of seven standard upper extremity radiographic study types: elbow, finger, forearm, hand, humerus, shoulder, and wrist.
Each radiographic study was manually labeled as normal or abnormal by board-certified radiologists from the Stanford Hospital at the time of the clinical radiographic interpretation in the diagnostic radiology environment between 2001 and 2012.
2.2. Study Design
2.2.1. Overview
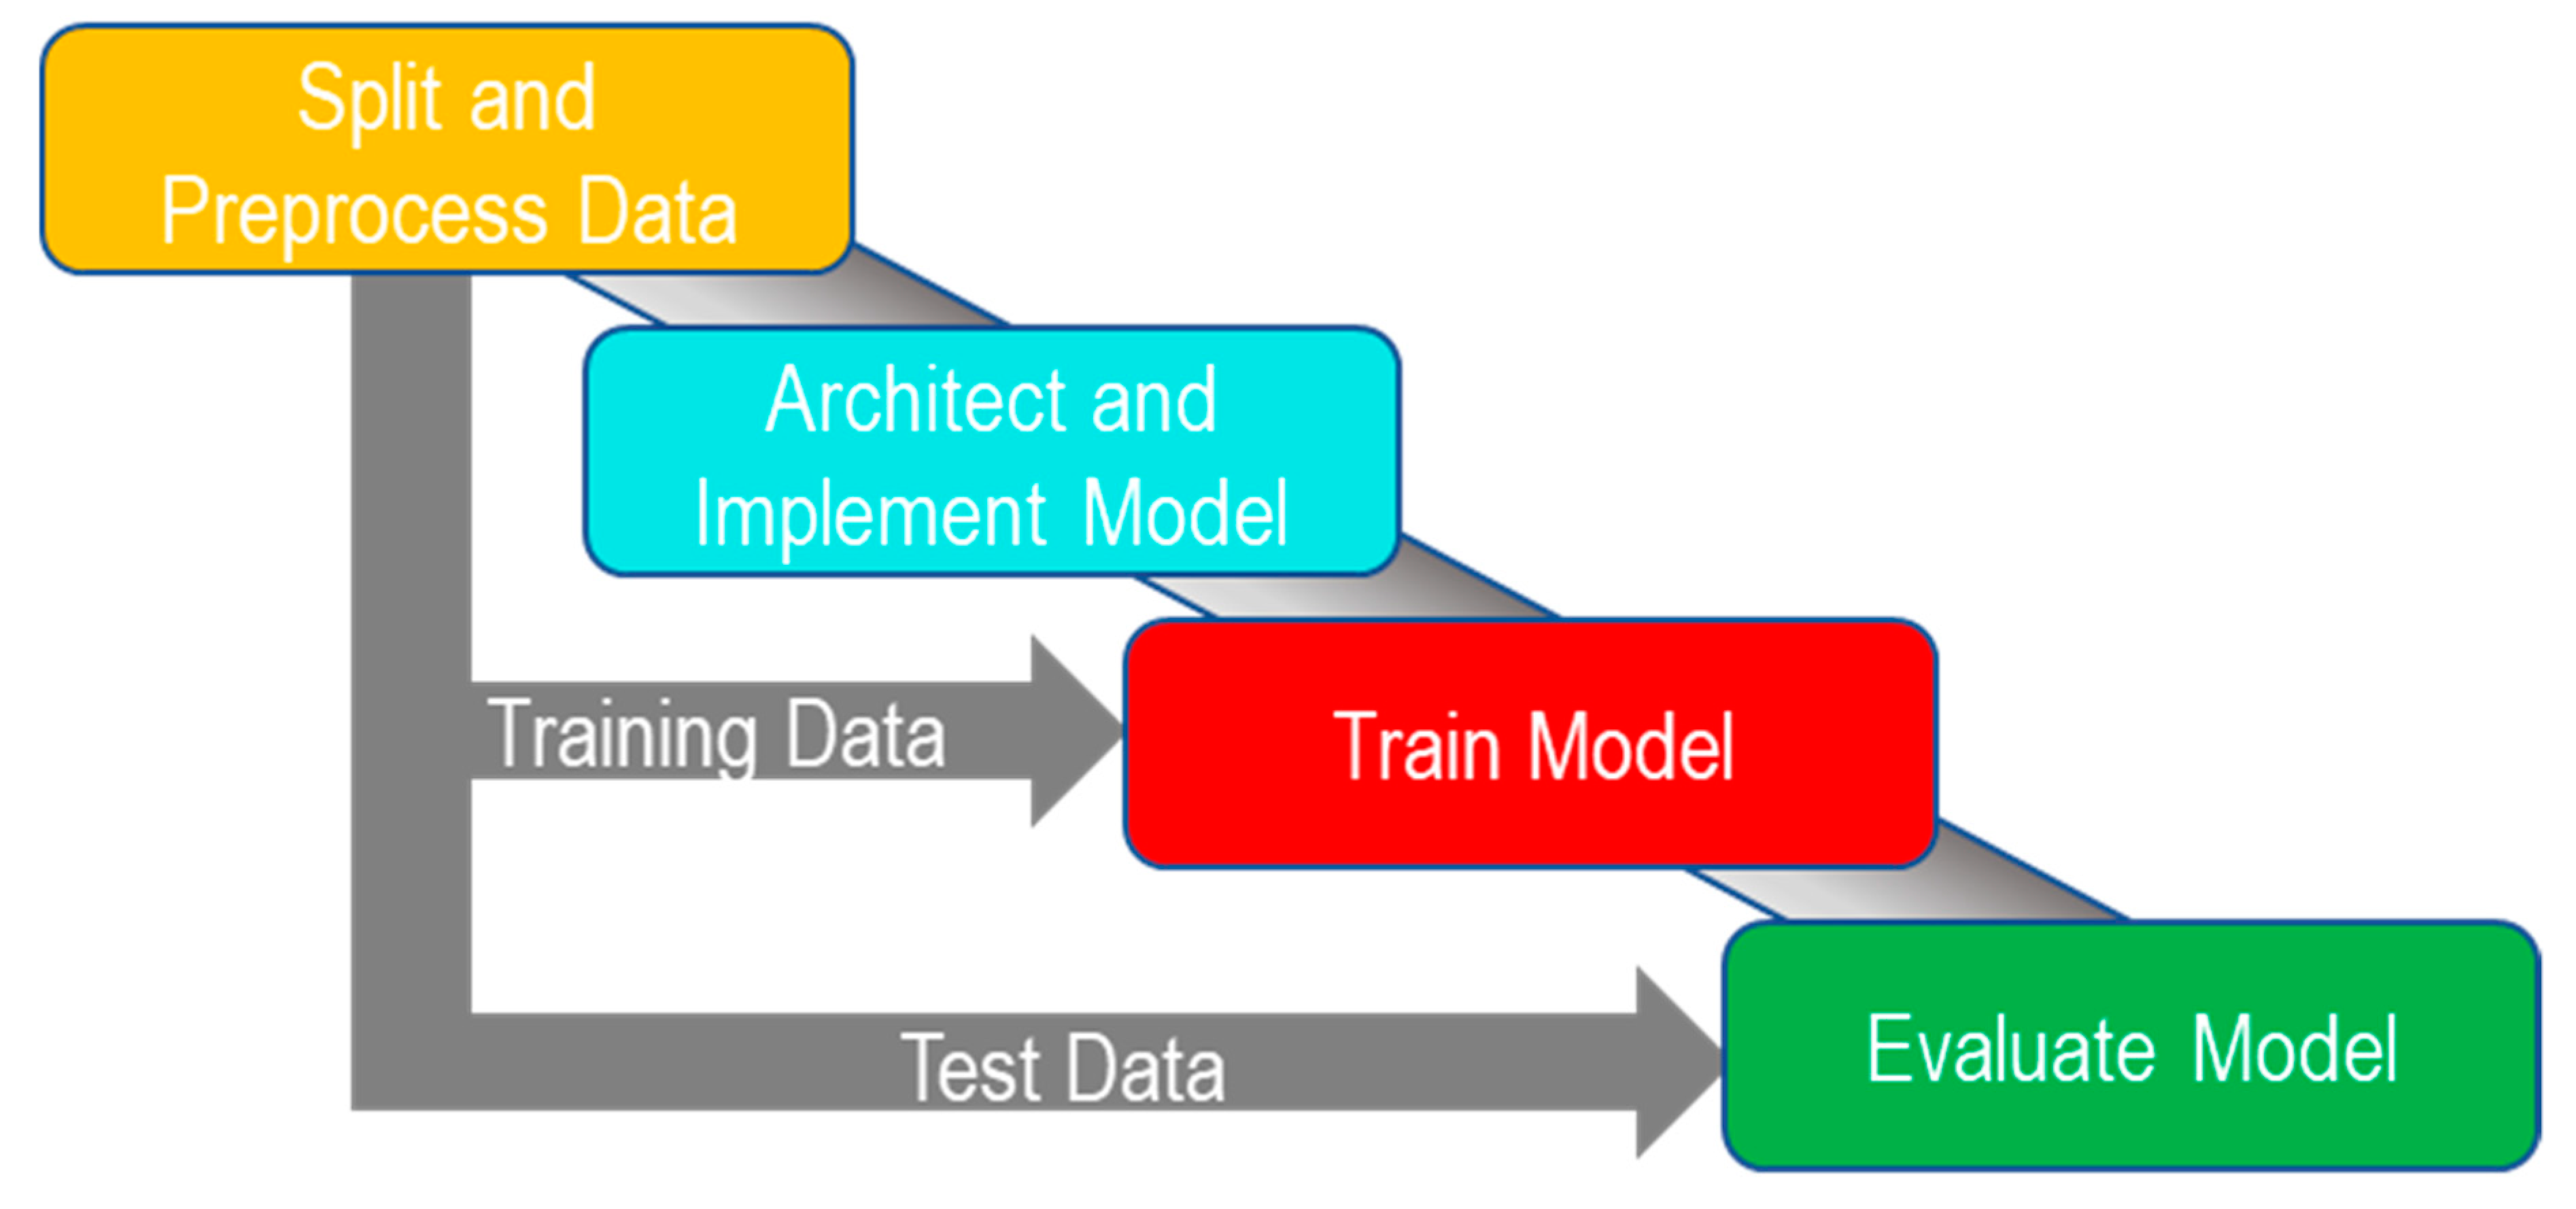
The aim of this study is to investigate various deep learning convolutional neural networks in detecting abnormalities of upper extremities with a view to improving performance up to practicing radiologist levels. The model used in the previous study by Rajpurkar et al. [12] has the lowest agreement rating with the radiologists on the finger and humerus data. This study evaluates three different models on these datasets. The abnormality detection method used in this study follows the steps shown in Figure 1.
2.2.2. Splitting and Preprocessing Data
MURA dataset is the largest publicly available dataset of upper extremity musculoskeletal radiographs and is separated into a training dataset component and a validation dataset component. The model is first trained using images in the training dataset. A part of this training dataset is set aside to evaluate the performance and tune the model hyperparameters while training. After the training is complete, the final model performance is evaluated using the validation dataset that has not been seen by the model during the training phase. In our study, we set aside 10% of the training dataset to evaluate the models during the training phase, while using the entire validation dataset for evaluating the trained models. The number of normal and abnormal images in the training and final model validation datasets is shown in Table 1.
Securing large amounts of annotated medical image data is a challenge due to patient privacy and security policies, as well as the cost. To enhance the capabilities of the models to work with limited datasets, we use the concept of deep transfer learning and pre-train models on the ImageNet database [13]. The effectiveness of deep transfer learning strategy to improve accuracies when training on limited datasets has been demonstrated in various studies including on biomedical imaging data [14,15,16,17]. Gulshan et al. [18] have used models pre-trained on the ImageNet database for improved accuracies in diabetic retinopathy detection. This study employs the deep transfer learning technique and uses model architectures that can work more effectively with fewer data, improving the likelihood of achieving high accuracies.
The clinical images vary in resolution and in aspect ratios. All images were resized to 320 × 320. The selected image size allowed for moderate upscaling and moderate downscaling of the images. Also, this size is consistent with the original MURA dataset study.
2.2.3. Architecture and Implementation
Rajpurkar et al. [12] used a 169-layer Dense Convolutional Network architecture (DenseNet-169) [19] to predict the probability of abnormality for each image in their MURA dataset study. This study implements DenseNet-169, DenseNet-201, and InceptionResNetV2 [20,21,22] deep learning models pre-trained on ImageNet. These architectures were selected because of their high recognition accuracy in the benchmark study by Bianco et al. [23]. Initial layers of deep learning networks capture generic features, while later ones focus on task–specific features. By using weights from ImageNet to pre-train the models, we leverage previous learning of generic features captured in the initial layers and reduce the training data need. The architectures used in this study utilize model parameters more effectively and use less data for training than other architectures and have a lower tendency to overfit to training data [19].
DenseNet-169 and DenseNet-201 models are models based on the DenseNet architecture [19]. Whereas traditional convolutional networks with L layers have L connections - one between each layer and its subsequent layer—DenseNet has L (L + 1)/2 direct connections. For each layer, the feature-maps of all preceding layers are used as inputs, making DenseNets very compact models with high feature reuse throughout the network. InceptionResNetV2 combines the idea of residual connections introduced by He et al. in [21] and the Inception architecture [22].
2.2.4. Training
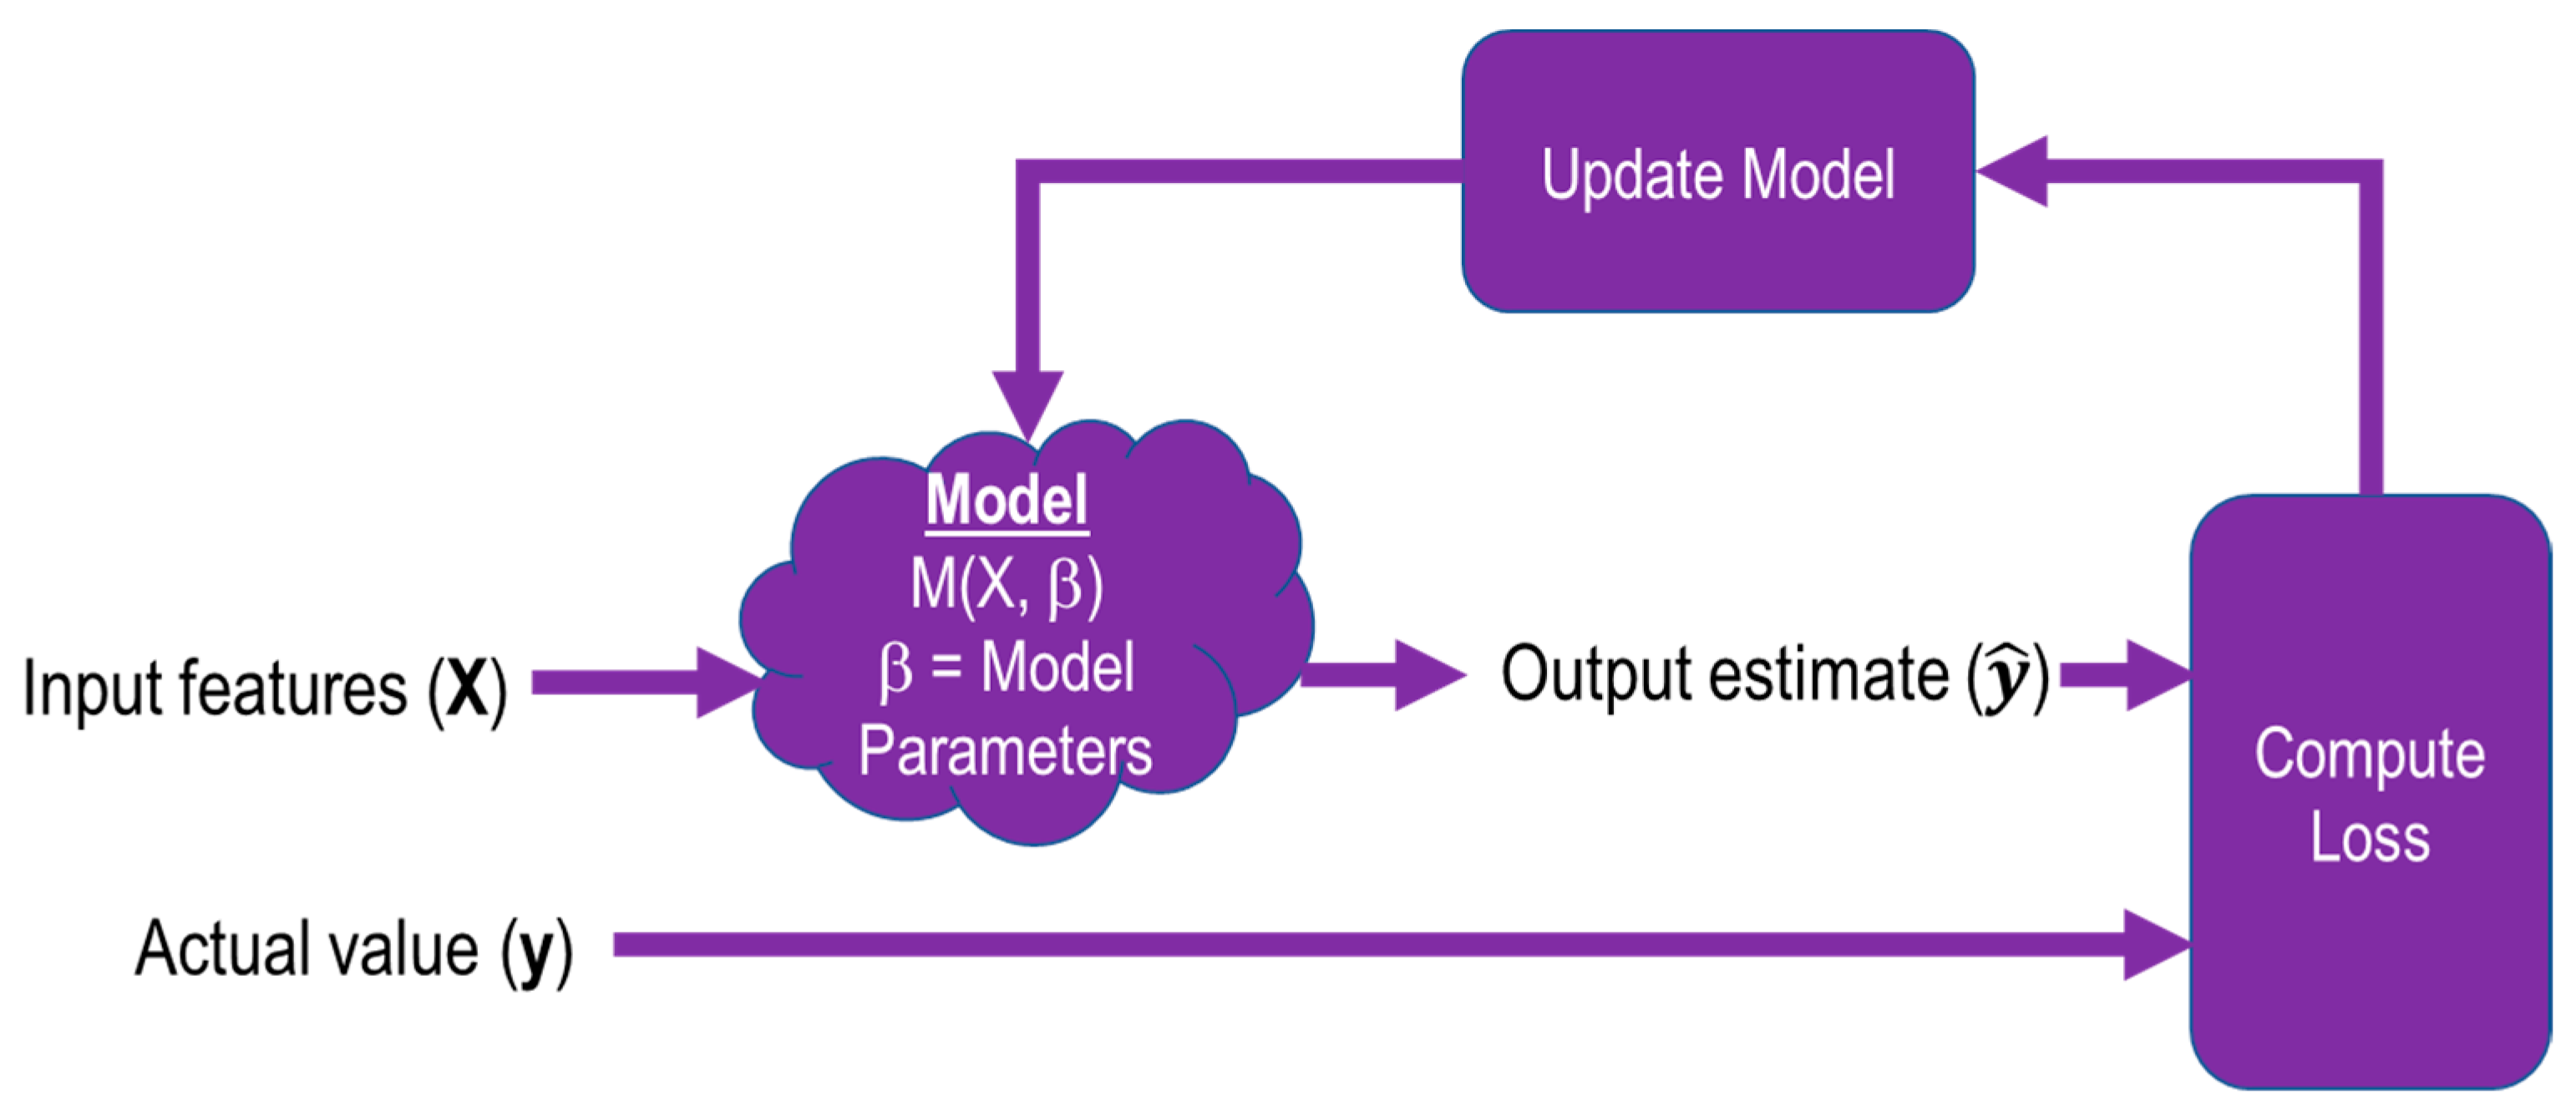
During the training process shown in Figure 2., images X from the training dataset are fed into the model M, which is defined by its parameters β. The output of the model is compared with the training label that corresponds to the input image, the loss is computed, and the model is updated with new parameters.
To start the training process, models were initialized with weights pre-trained on ImageNet, a large computer vision database [13]. After pre-training, the weights were fine-tuned using the training data. Pre-training, followed by fine-tuning, reduces the time it takes for the model to converge. This also helps regularize the model to reduce overfitting. During the iterative training process, a softmax activation function was used on the estimates before the loss was calculated. Cross entropy was used as the loss function to be optimized. All the models used Adam optimizer [24] with a learning rate of 0.0001 and default parameters β1 = 0.9 and β2 = 0.999. Models were trained for 50 epochs using minibatches of size 8.
2.3. Model Evaluation
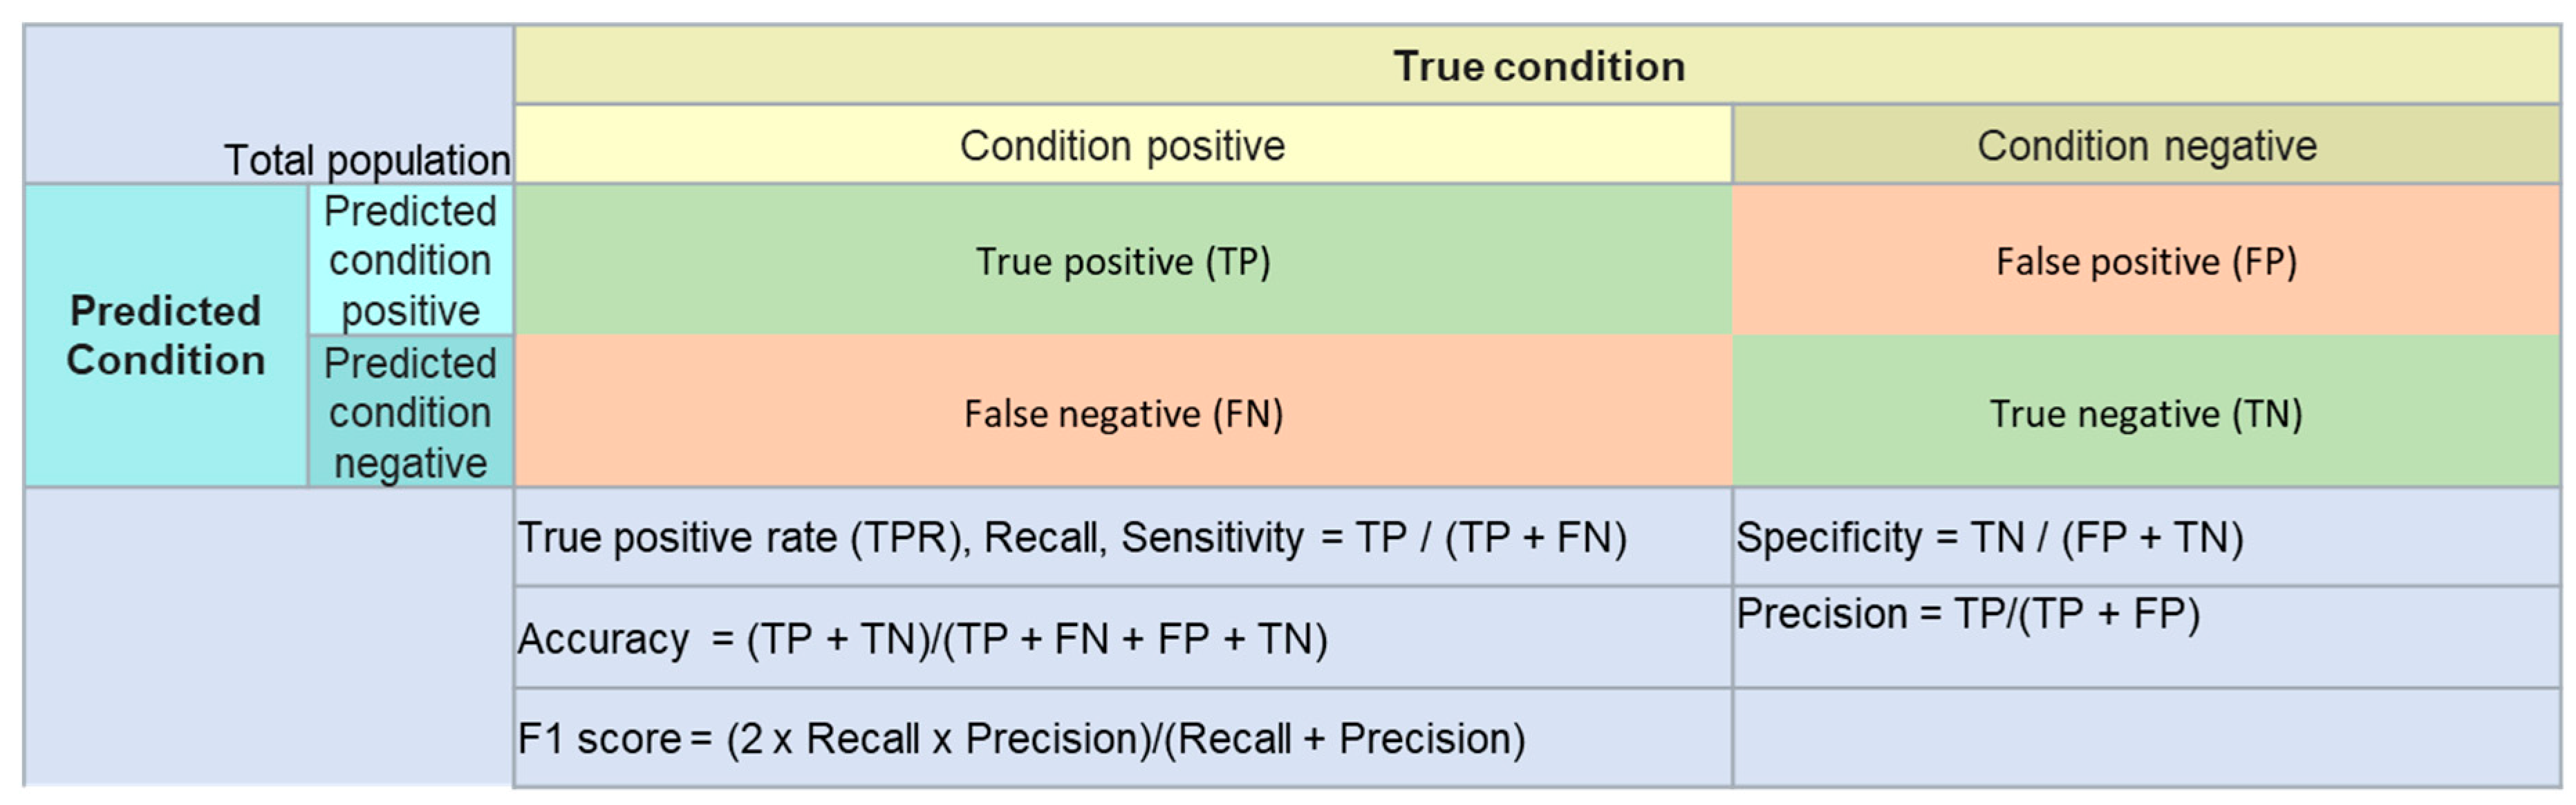
After training, the models were tested using the test data, which the models have never seen before, and accuracy, sensitivity (recall), specificity, precision, and F1 score were calculated.
Performance measures used in the study and their definitions are shown in Figure 3.
Cohen’s kappa statistic (κ) [25], which expresses the agreement of each model with the radiologist labels, is also calculated to take into account the possibility of agreement occurring by chance.
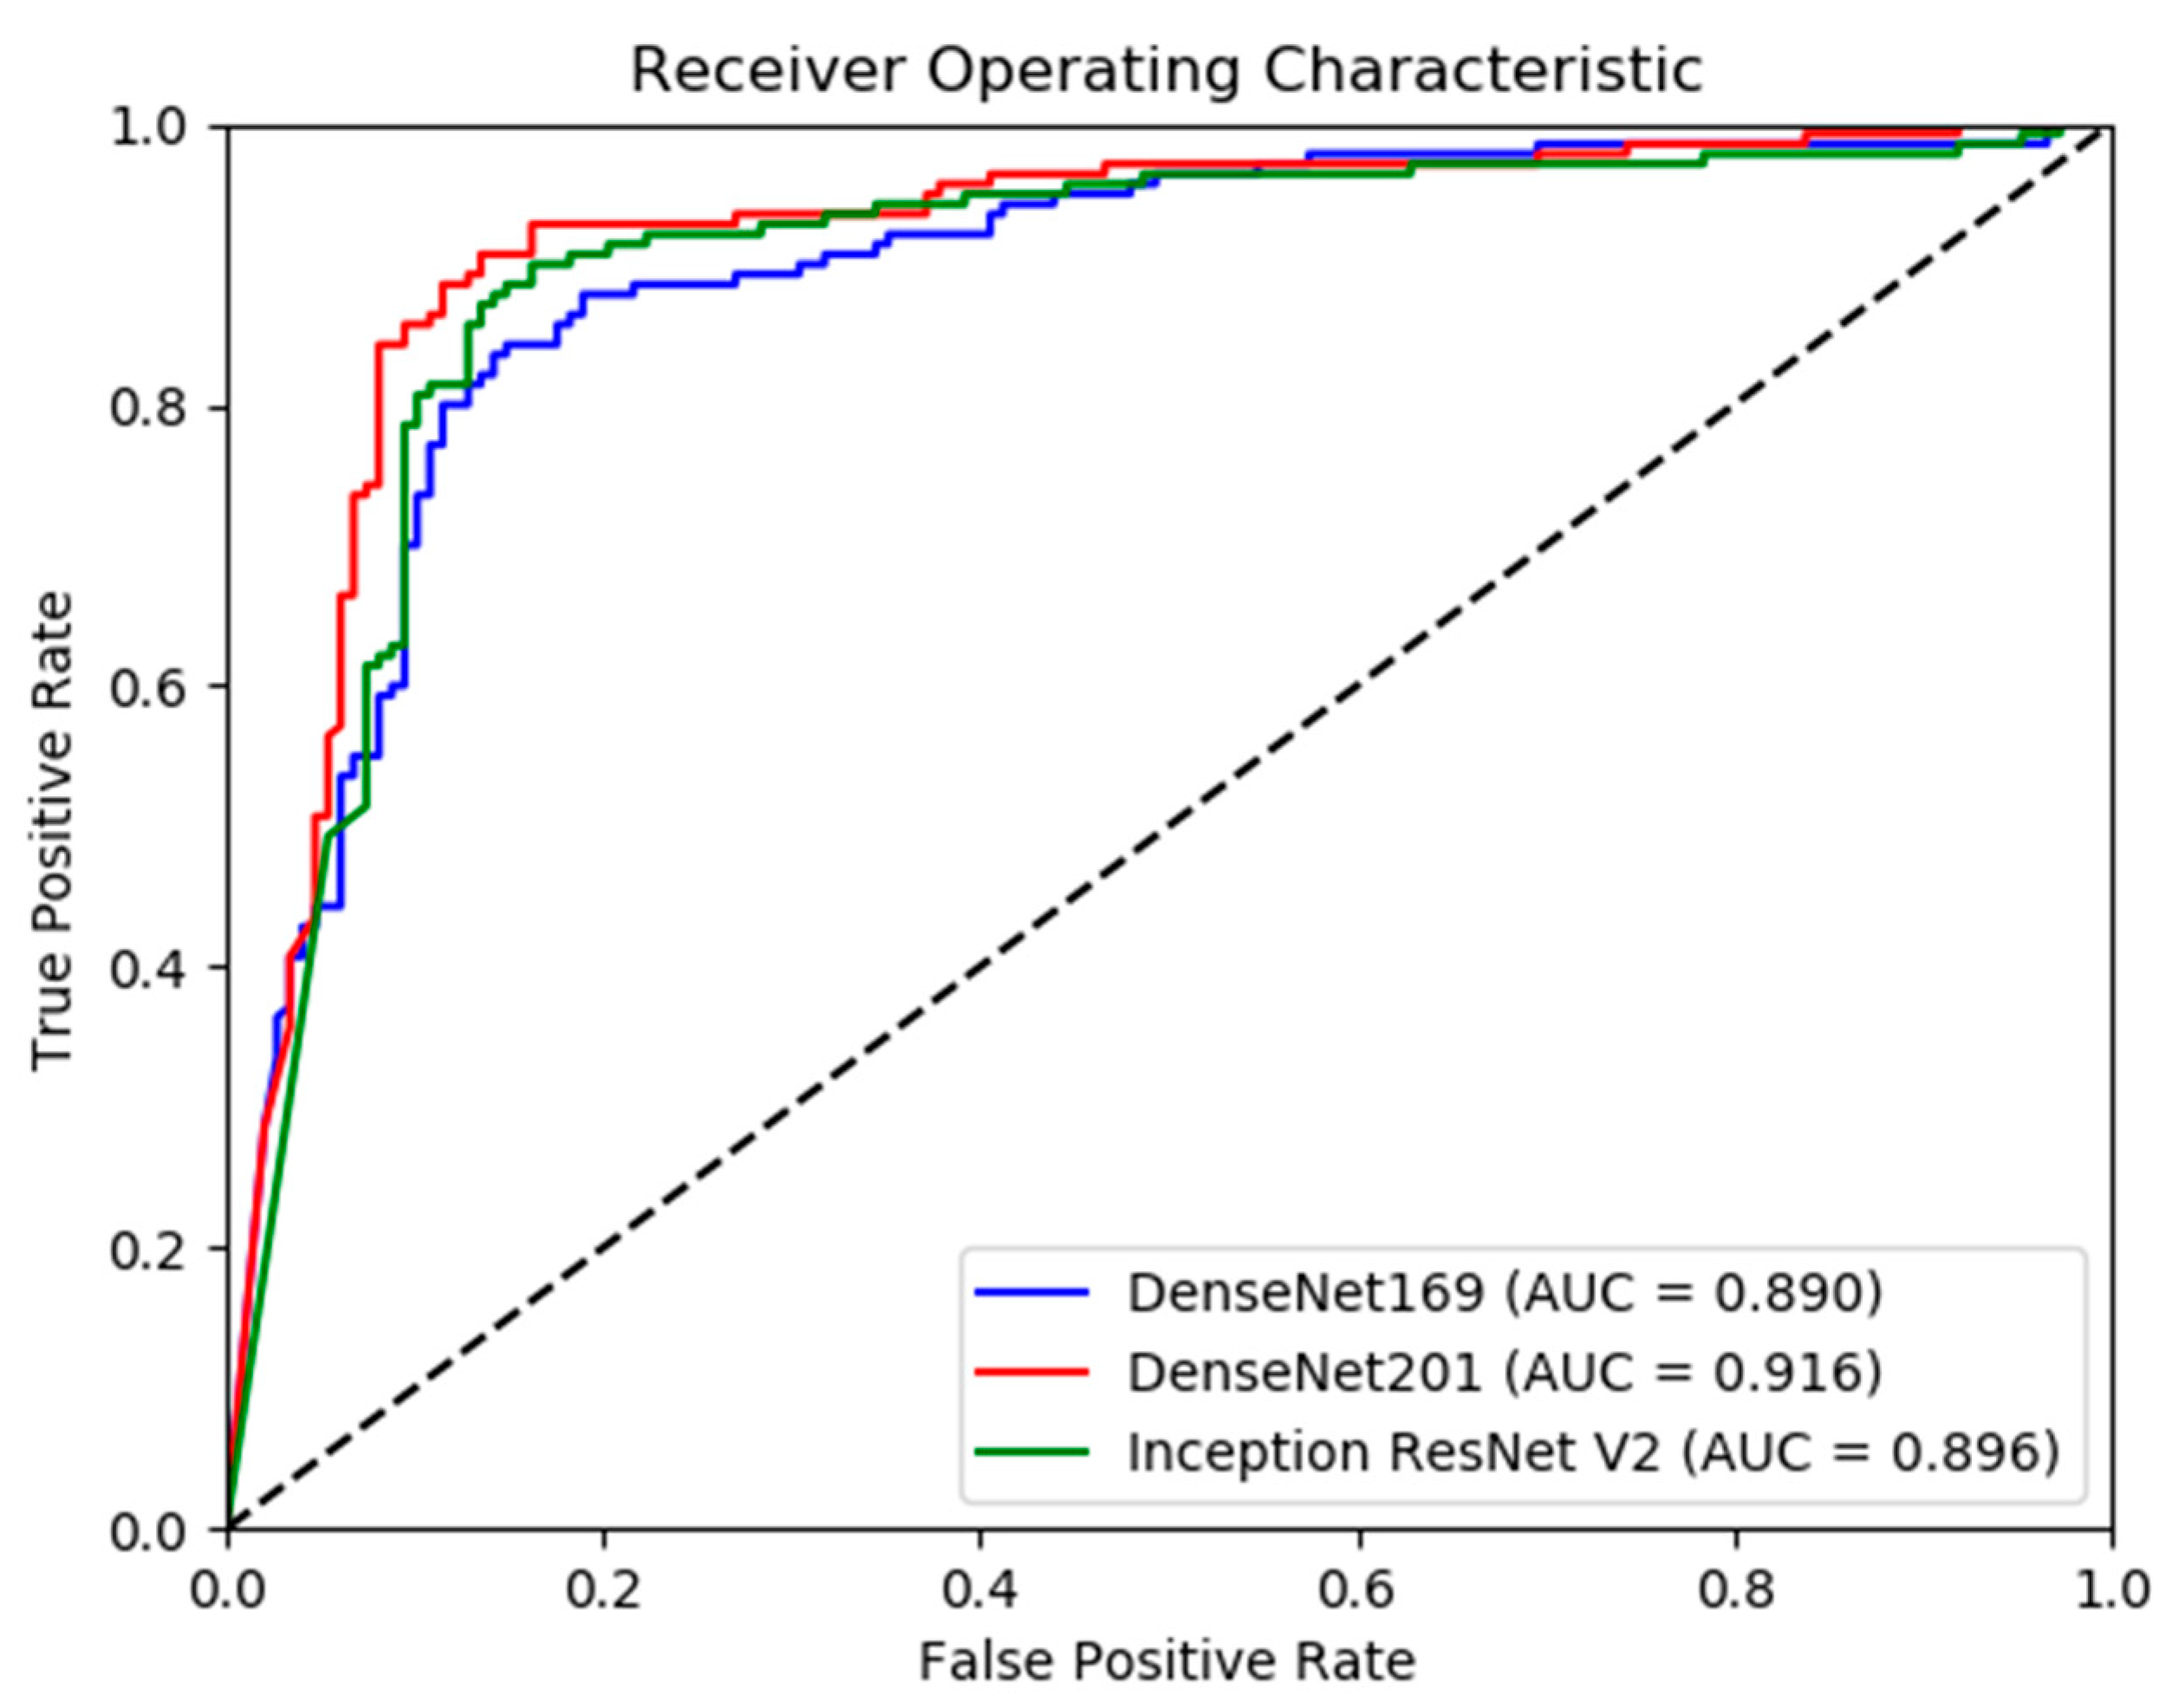
In addition, the receiver operating characteristic (ROC) curve is plotted for each model to show the diagnostic ability of the model as the discrimination threshold is varied. AUC for each ROC curve is also calculated.
2.4. Software and Hardware
- Keras 2.2.4 and TensorFlow 1.12.0 for model development
- Scikit-Learn 0.20.2 for calculating metrics
Models were trained using 4 Titan V GPUs.
3. Results
Model Performance
In this study, training and test data use labels created by board-certified radiologists from the Stanford Hospital at the time of clinical radiographic interpretation between 2001 and 2012.
4. Discussion
In this study, we used three deep convolutional neural network architectures, DenseNet-169, DenseNet-201, and InceptionResNetV2, and deep transfer learning to detect abnormalities in musculoskeletal radiographs of humerus and finger.
Evaluating the model performance on the humerus test set, all the three models show accuracies greater than 80% in detecting abnormalities. DenseNet-201 with an accuracy of 88.19% and an F1 score of 0.88 performed the best on this test set. InceptionResNetV2 also performed better with an accuracy of 86.46% and an F1 score of 0.87 than DenseNet-169 with an accuracy of 84.03% and an F1 score of 0.83. Accuracies with 95% confidence intervals range from 80–92%. The models at these accuracy levels can serve as useful triage tools to prioritize cases for expedited review. Evaluating model performance using Cohen’s kappa, which takes into account the possibility of the agreement by chance, the DenseNet-201 model with a kappa of 0.76 performed the best on this test set. InceptionResNetV2, with a kappa of 0.73, also had better performance than DenseNet-169 with a kappa of 0.68. Comparing the kappas with 95% confidence intervals shows that the performance of the DenseNet-201 (0.69–0.84) and InceptionResNetV2 (0.65–0.81) models is significantly better than that of Rajpurkar et al.’s model (0.56–0.64). The DenseNet-201 model also had a higher AUC of 0.92 than DenseNet-169 with an AUC of 0.89, indicating a higher measure of separability and classification capability.
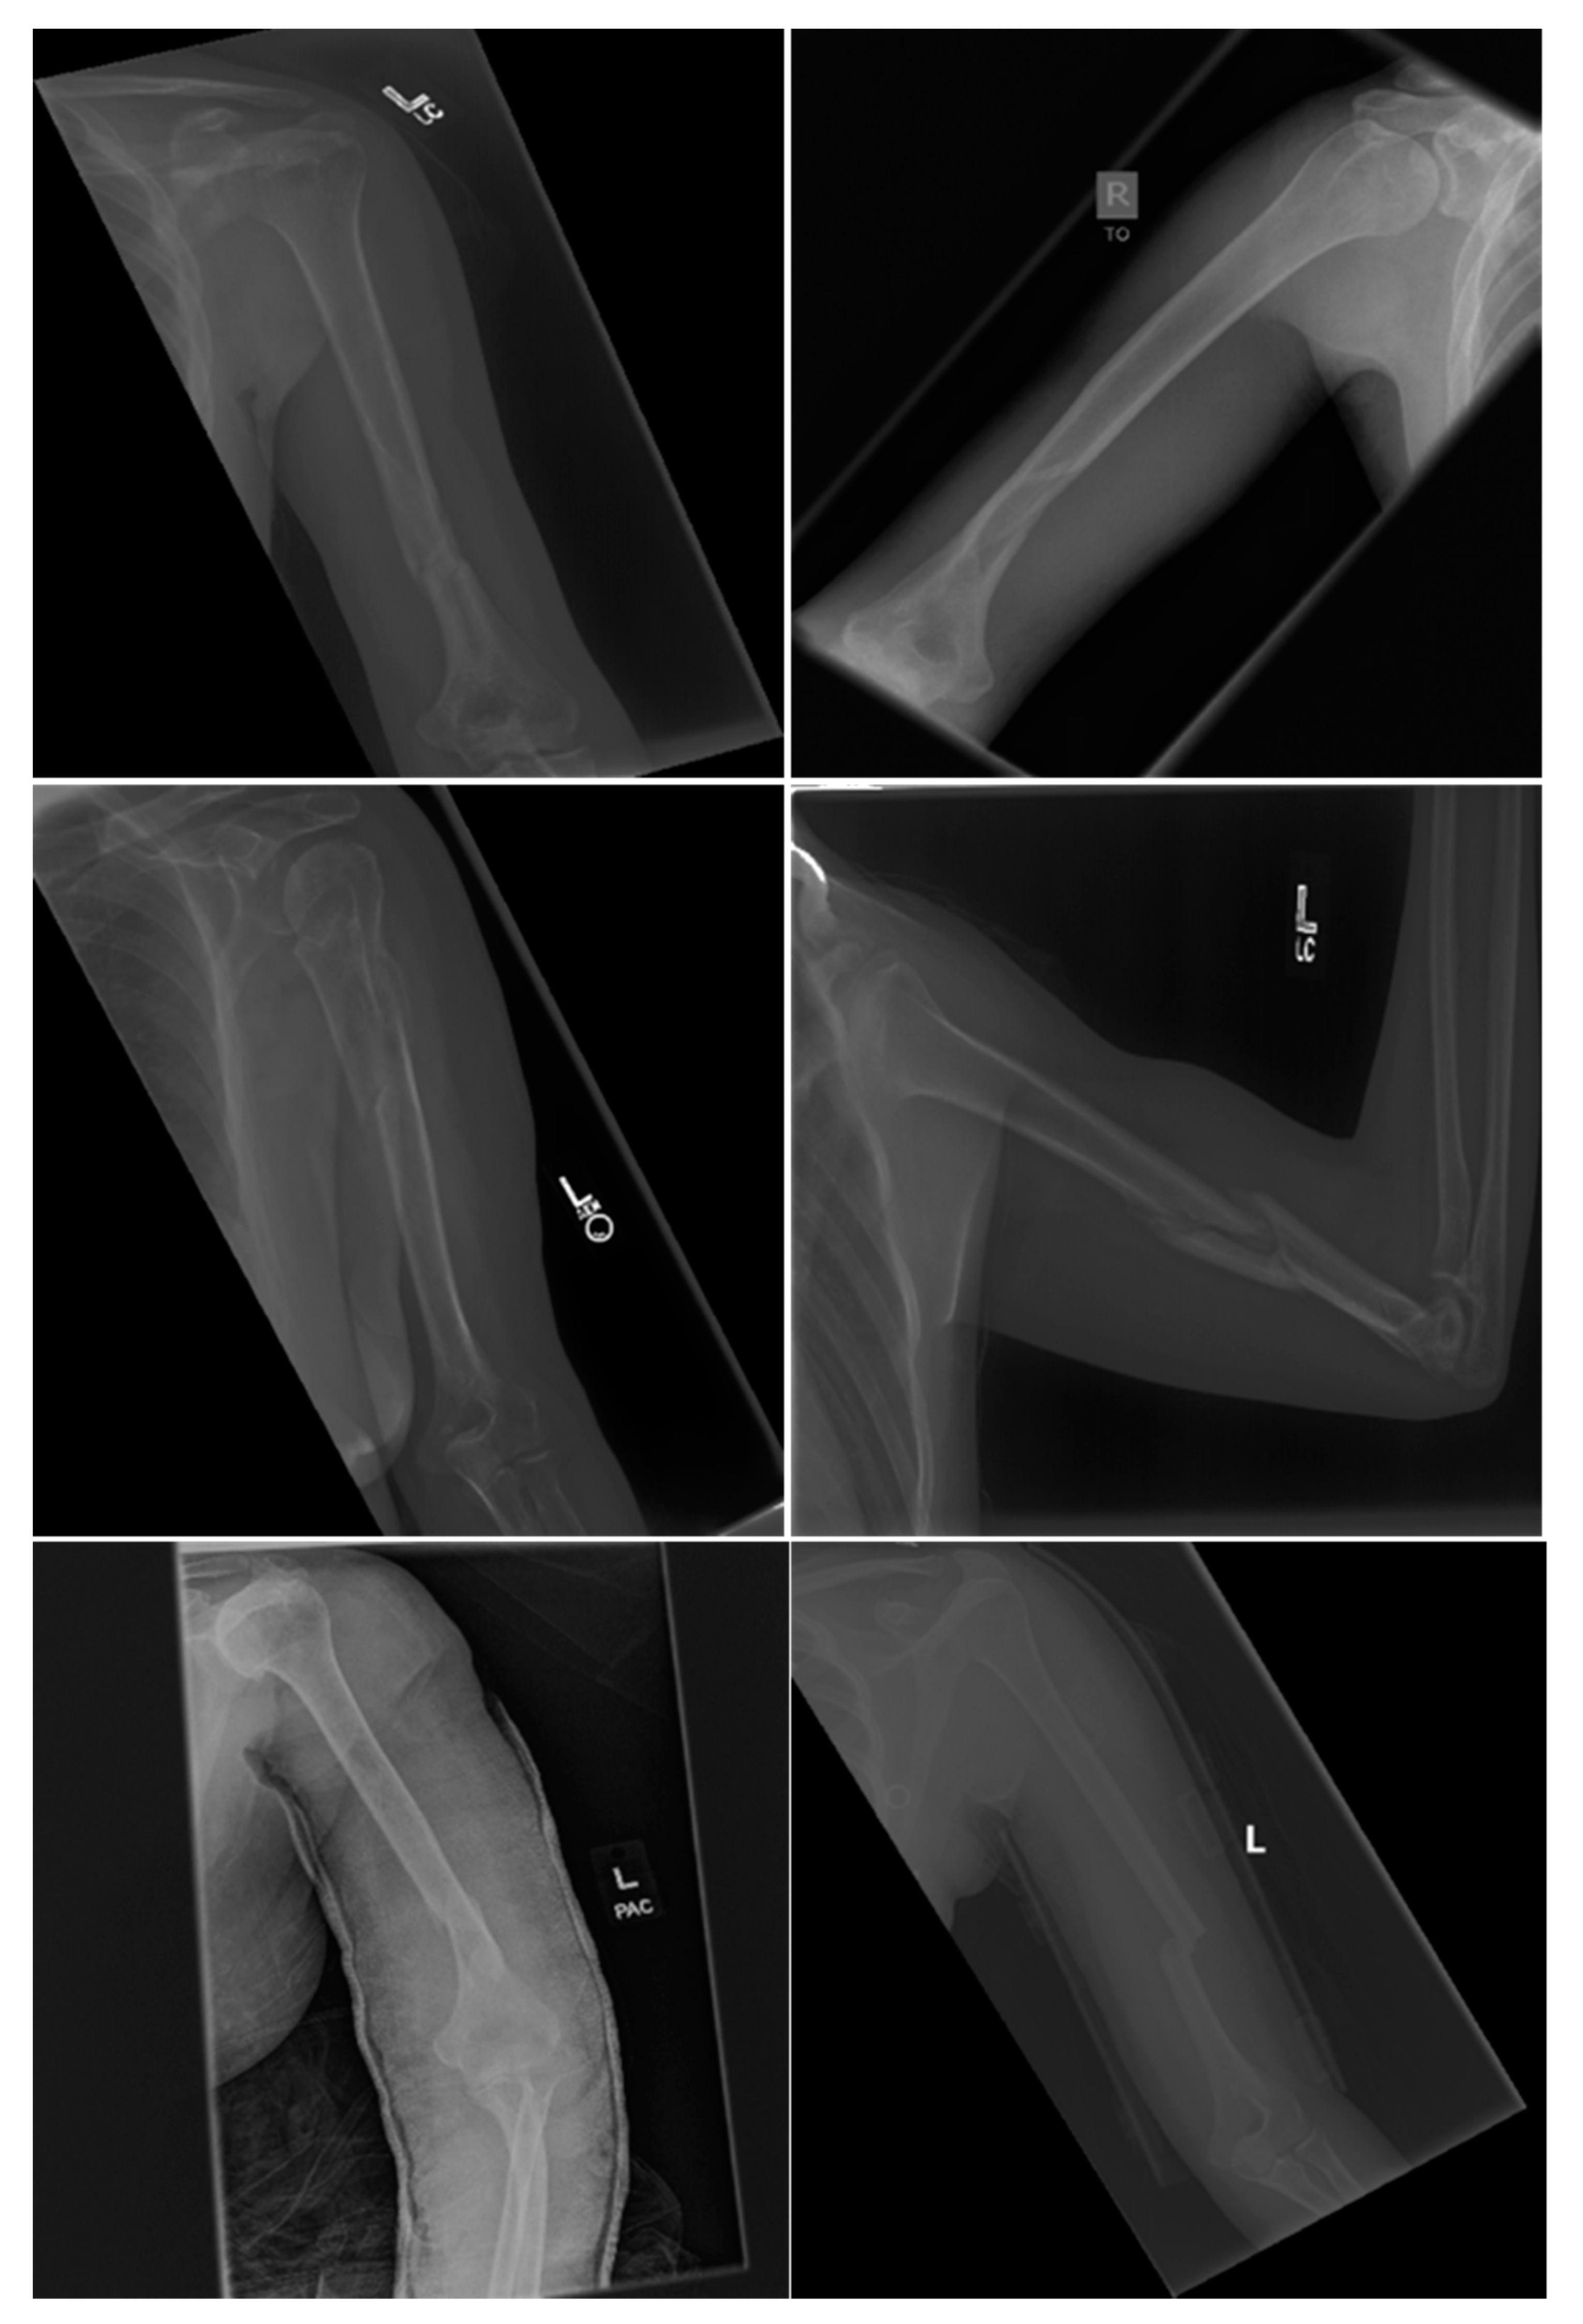
Both DenseNet-201 and InceptionResNetV2 models show a high sensitivity greater than 0.9. Figure 6 shows examples of the humerus that were classified correctly as abnormalities by DenseNet-201 model, whereas DenseNet-169 could not classify these as abnormalities. There were 17 such images in the test set that DenseNet-201 was able to classify correctly but DenseNet-169 could not. There was only one abnormal image where DenseNet-169 did better in recall compared to DenseNet-201. With the availability of larger training datasets, the ability of the more complex DenseNet-201 and InceptionResNetV2 to exploit additional feature information in the data as compared to DenseNet-169 may allow for further increase in relative accuracies of these models to demonstrate a performance difference at 95% CIs.
In studies by Taylor et al. [10] and Zech et al. [11], models created to detect pneumothorax and pneumonia using datasets from a single site declined in performance in clinical settings at other sites. It is possible that the models in this study may see a similar decline in performance at other sites due to differences in the distribution of data from that which the model is trained on. Also, even at the same site, data distributions can be expected to drift over time. This can be addressed by using new incoming data to retrain the model periodically. This approach can also improve the model performance on specific pathologies and normal variants as more data are added to the training set.
The model performances on the finger test set are less promising, with all the three models showing accuracies greater than 75% in detecting abnormalities. DenseNet-201 with an accuracy of 76.57% and an F1 score of 0.76 performed at the same level as DenseNet-169 with an accuracy of 75.7% and an F1 score of 0.74. InceptionResNetV2 performed marginally better on this test set with an accuracy of 77.66% and an F1 score of 0.78. Accuracies with 95% confidence intervals range from 72–81%. The models also show poor recall values, which is important for use as a screening tool. The DenseNet-169 model in this study had a kappa of 0.52 (0.45–0.60 95% CI), DenseNet-201 had a kappa of 0.54 (0.46–0.61 95% CI), and InceptionResNetV2 had a kappa of 0.56 (0.48–0.63 95% CI). In comparison, Rajpurkar et al.’s model had a kappa of 0.39 (0.33–0.45 95% CI). Rajpurkar et al. also report a kappa of 0.3–0.4 when comparing the labels of other radiologists against test set labels. The significant inter-radiologist variability limits the possibility of gaining additional model performance; finding reasons for this inter-radiologist variation may help formulate approaches for further performance increases. One possibility for the variation could be that the radiologists’ decisions may be based on looking at different features, which itself may be because of a lack of sufficient standardization of the diagnostic or variation in the skill levels of the radiologists. Identification of root causes through additional research can lead to better standardization or training to address the issue. One machine learning-based approach to identify the root cause of inter-expert variability in retinopathy [26] could be extended to address the inter-radiologist variability problem.
Some limitations of the study are discussed below. Deep learning algorithms have been shown to scale well and benefit from training on large datasets [27,28]. However, manually annotating large amounts of data for training is a very time consuming and expensive process. While the MURA dataset is the largest publicly available dataset of upper extremity musculoskeletal radiographs, it is still on the lower end of the power-law region of the training curve, and accuracies can be improved by making more training data available. While this study uses techniques such as deep transfer learning and model architectures that leverage limited data effectively, it is worthwhile to look at alternative methods to fully supervised learning, such as unsupervised learning or learning from weakly labeled datasets. In investigating how the brain solves the visual object recognition problem, DiCarlo et al. [29] indicate how unsupervised learning and weakly labeled learning play an important role in how humans learn to recognize objects. Joulin et al. [30] trained convolutional neural networks on publicly available Flickr photos with associated titles, hashtags, and captions to demonstrate that visual features can be learned without full supervision. This is an area of interesting applicability to musculoskeletal abnormality detection and is a topic for future study.
MURA dataset includes data collected at the Stanford hospitals from 2001–2012 and contained abnormalities such as fractures, hardware, degenerative joint diseases, and other miscellaneous abnormalities such as lesions and subluxations. However, we were not able to obtain relative frequencies of specific pathologies or normal variants in this training. The scope of this present study is limited to building models for a two-class problem of detecting abnormal/normal. Our goal for this study is to show the promise of the approaches used in building models that can serve as initial screening tools to assist physicians. We think this early research would be valuable for the purpose of prioritizing cases for expedited review. As large datasets with enough sub-class sample data for various pathologies become available, models that can effectively distinguish between various pathologies can be developed, and their performance analyzed.
The training data used in this study were manually labeled as normal or abnormal by board-certified radiologists from the Stanford Hospital at the time of clinical radiographic interpretation in the diagnostic radiology environment. Due to radiologist interpretation errors during the routine clinical review, it is possible the model is influenced by the incorrect assignments, leading to lower accuracies in production.
5. Conclusions
The DenseNet-201 and InceptionResNetV2 models, employing deep transfer learning to optimize training on limited data, detected abnormalities in humerus radiographs with 95% CI accuracies of 83–92% and high sensitivities greater than 0.9, allowing for these models to serve as useful initial screening tools to prioritize studies for expedited review. The deployed models can be further retrained periodically on new incoming data to improve accuracies on specific pathologies and normal variants, as well as site-specific variations. Performance in the case of finger radiographs was not as promising, possibly due to the limitations of large inter-radiologist variation. It is suggested that the causes of this variation be further explored using machine learning approaches, which may lead to appropriate remediation.
Funding
This research received no external funding.
Acknowledgments
This research was performed at Houston Learning Algorithms Lab, Department of Electrical and Computer Engineering, the University of Houston, under the guidance of Hien Nguyen.
Conflicts of Interest
The authors declare no conflict of interest.
References
- United States Bone and Joint Initiative: The Burden of Musculoskeletal Diseases in the United States (BMUS). Available online: http://www.boneandjointburden.org (accessed on 14 June 2019).
- McDonald, R.J.; Schwartz, K.M.; Eckel, L.J.; Diehn, F.E.; Hunt, C.H.; Bartholmai, B.J.; Erickson, B.J.; Kallmes, D.F. The effects of changes in utilization and technological advancements of cross-sectional imaging on radiologist workload. Acad. Radiol. 2015, 22, 1191–1198. [Google Scholar] [CrossRef] [PubMed]
- Robert, L. Musculoskeletal Hits Top 10 in Primary Care Visits. Available online: https://www.patientcareonline.com/musculoskeletal-disorders/musculoskeletal-hits-top-10-primary-care-visits (accessed on 15 July 2019).
- Scher, D.L.; Ferreira, J.V.; Cote, M.; Abdelgawad, A.; Wolf, J.M. The need for musculoskeletal education in primary care residencies. Orthopedics 2014, 37, 511–513. [Google Scholar] [CrossRef] [PubMed]
- Freedman, K.B.; Bernstein, J. Educational deficiencies in musculoskeletal medicine. J. Bone Jt. Surg. Am. 2002, 84, 604–608. [Google Scholar] [CrossRef] [PubMed]
- Freedman, K.B.; Bernstein, J. The adequacy of medical school education in musculoskeletal medicine. J. Bone Jt. Surg. Am. 1998, 80, 1421–1427. [Google Scholar] [CrossRef]
- Grace, K.; Salvatier, J.; Dafoe, A.; Zhang, B.; Evans, O. When will AI exceed human performance? Evidence from AI experts. J. Artif. Intell. Res. 2018, 62, 729–754. [Google Scholar] [CrossRef]
- LeCun, Y.; Bengio, Y.; Hinton, G. Deep learning. Nature 2015, 521, 436–444. [Google Scholar] [CrossRef]
- Rajpurkar, P.; Irvin, J.; Ball, R.L.; Zhu, K.; Yang, B.; Mehta, H.; Duan, T.; Ding, D.; Bagul, A.; Langlotz, C.P.; et al. Deep learning for chest radiograph diagnosis: A retrospective comparison of the CheXNeXt algorithm to practicing radiologists. PLoS Med. 2018, 15, e1002686. [Google Scholar] [CrossRef]
- Taylor, A.G.; Mielke, C.; Mongan, J. Automated detection of moderate and large pneumothorax on frontal chest X-rays using deep convolutional neural networks: A retrospective study. PLoS Med. 2018, 15, e1002697. [Google Scholar] [CrossRef]
- Zech, J.R.; Badgeley, M.A.; Liu, M.; Costa, A.B.; Titano, J.J.; Oermann, E.K. Variable generalization performance of a deep learning model to detect pneumonia in chest radiographs: A cross-sectional study. PLoS Med. 2018, 15, e1002683. [Google Scholar] [CrossRef]
- Rajpurkar, P.; Irvin, J.; Bagul, A.; Ding, D.; Duan, T.; Mehta, H.; Yang, B.; Zhu, K.; Laird, D.; Ball, R.L.; et al. MURA: Large Dataset for Abnormality Detection in Musculoskeletal Radiographs. arXiv 2017, arXiv:1712.06957. [Google Scholar]
- Deng, J.; Dong, W.; Socher, R.; Li, L.-J.; Li, K.; Fei-Fei, L. Imagenet: A large-scale hierarchical image database. In Proceedings of the 2009 IEEE Conference on Computer Vision and Pattern Recognition, Miami, FL, USA, 20–25 June 2009; pp. 248–255. [Google Scholar]
- Mormont, R.; Geurts, P.; Marée, R. Comparison of deep transfer learning strategies for digital pathology. In Proceedings of the IEEE Conference on Computer Vision and Pattern Recognition Workshops, Salt Lake City, UT, USA, 18–22 June 2018; pp. 2262–2271. [Google Scholar]
- Esteva, A.; Kuprel, B.; Novoa, R.A.; Ko, J.; Swetter, S.M.; Blau, H.M.; Thrun, S. Dermatologist-level classification of skin cancer with deep neural networks. Nature 2017, 542, 115. [Google Scholar] [CrossRef] [PubMed]
- Litjens, G.; Kooi, T.; Bejnordi, B.E.; Setio, A.A.A.; Ciompi, F.; Ghafoorian, M.; Van Der Laak, J.A.; Van Ginneken, B.; Sánchez, C.I. A survey on deep learning in medical image analysis. Med. Image Anal. 2017, 42, 60–88. [Google Scholar] [CrossRef] [PubMed] [Green Version]
- Kensert, A.; Harrison, P.J.; Spjuth, O. Transfer Learning with Deep Convolutional Neural Networks for Classifying Cellular Morphological Changes. SLAS DISCOVERY Adv. Life Sci. R D 2019, 24, 466–475. [Google Scholar] [CrossRef] [PubMed] [Green Version]
- Gulshan, V.; Peng, L.; Coram, M.; Stumpe, M.C.; Wu, D.; Narayanaswamy, A.; Venugopalan, S.; Widner, K.; Madams, T.; Cuadros, J.; et al. Development and Validation of a Deep Learning Algorithm for Detection of Diabetic Retinopathy in Retinal Fundus PhotographsAccuracy of a Deep Learning Algorithm for Detection of Diabetic RetinopathyAccuracy of a Deep Learning Algorithm for Detection of Diabetic Retinopathy. JAMA 2016, 316, 2402–2410. [Google Scholar] [CrossRef] [PubMed]
- Huang, G.; Liu, Z.; van der Maaten, L.; Weinberger, K.Q. Densely Connected Convolutional Networks. arXiv 2016, arXiv:1608.06993. [Google Scholar]
- Szegedy, C.; Ioffe, S.; Vanhoucke, V.; Alemi, A. Inception-v4, Inception-ResNet and the Impact of Residual Connections on Learning. arXiv 2016, arXiv:1602.07261. [Google Scholar]
- He, K.; Zhang, X.; Ren, S.; Sun, J. Deep Residual Learning for Image Recognition. arXiv 2015, arXiv:1512.03385. [Google Scholar]
- Szegedy, C.; Vanhoucke, V.; Ioffe, S.; Shlens, J.; Wojna, Z. Rethinking the Inception Architecture for Computer Vision. arXiv 2015, arXiv:1512.00567. [Google Scholar]
- Bianco, S.; Cadene, R.; Celona, L.; Napoletano, P. Benchmark Analysis of Representative Deep Neural Network Architectures. arXiv 2018, arXiv:1810.00736. [Google Scholar] [CrossRef]
- Kingma, D.P.; Ba, J. Adam: A Method for Stochastic Optimization. arXiv 2014, arXiv:1412.6980. [Google Scholar]
- McHugh, M.L. Interrater reliability: the kappa statistic. Biochem. Med. (Zagreb) 2012, 22, 276–282. [Google Scholar] [CrossRef] [PubMed]
- Bolon-Canedo, V.; Ataer-Cansizoglu, E.; Erdogmus, D.; Kalpathy-Cramer, J.; Fontenla-Romero, O.; Alonso-Betanzos, A.; Chiang, M.F. Dealing with inter-expert variability in retinopathy of prematurity: A machine learning approach. Comput. Methods Programs Biomed. 2015, 122, 1–15. [Google Scholar] [CrossRef] [PubMed] [Green Version]
- Sun, C.; Shrivastava, A.; Singh, S.; Gupta, A. Revisiting Unreasonable Effectiveness of Data in Deep Learning Era. arXiv 2014, arXiv:1412.6980. [Google Scholar]
- Hestness, J.; Narang, S.; Ardalani, N.; Diamos, G.; Jun, H.; Kianinejad, H.; Patwary, M.M.A.; Yang, Y.; Zhou, Y. Deep Learning Scaling is Predictable, Empirically. arXiv 2017, arXiv:1712.00409. [Google Scholar]
- DiCarlo, J.J.; Zoccolan, D.; Rust, N.C. How does the brain solve visual object recognition? Neuron 2012, 73, 415–434. [Google Scholar] [CrossRef]
- Joulin, A.; van der Maaten, L.; Jabri, A.; Vasilache, N. Learning visual features from large weakly supervised data. In Proceedings of the European Conference on Computer Vision, Amsterdam, The Netherlands, 8–16 October 2016; pp. 67–84. [Google Scholar]
Figure 1.
Steps used in the study.

Figure 2.
Training Process.

Figure 3.
Performance measures and definitions.

Figure 4.
Model Receiver Operating Characteristic Curves—Humerus.

Figure 5.
Model Receiver Operating Characteristic Curves—Finger.

Figure 6.
Examples of Humerus abnormalities correctly classified by DenseNet-201 and incorrectly classified by DenseNet-169.
Figure 6.
Examples of Humerus abnormalities correctly classified by DenseNet-201 and incorrectly classified by DenseNet-169.


Table 1.
Images from MURA dataset were split into training and test sets.
| Image Type | Training | Final Model Validation (Test) | Total | |||
|---|---|---|---|---|---|---|
| Normal | Abnormal | Normal | Abnormal | Normal | Abnormal | |
| Finger | 3138 | 1968 | 214 | 247 | 3352 | 2215 |
| Humerus | 673 | 599 | 148 | 140 | 821 | 739 |
Table 2.
Model Performance Summary—Humerus.
| Model | Accuracy (95% CI) | Sensitivity (Recall) | Specificity | Precision | F1 Score |
|---|---|---|---|---|---|
| DenseNet-169 | 84.03% (79.80–88.26) | 0.81 | 0.86 | 0.85 | 0.83 |
| DenseNet-201 | 88.19% (84.47–91.92) | 0.93 | 0.84 | 0.84 | 0.88 |
| InceptionResNetV2 | 86.46% (82.51–90.41) | 0.90 | 0.83 | 0.83 | 0.87 |
Table 3.
Model Performance Summary—Humerus.
| Model | Kappa | 95% Confidence Interval |
|---|---|---|
| Rajpurkar et. al’s Model | 0.600 | 0.558–0.642 |
| DenseNet-169 | 0.680 | 0.595–0.765 |
| DenseNet-201 | 0.764 | 0.690–0.839 |
| InceptionResNetV2 | 0.730 | 0.651–0.808 |
Table 4.
Model Performance Summary—Finger.
| Model | Accuracy (95% CI) | Sensitivity (Recall) | Specificity | Precision | F1 Score |
|---|---|---|---|---|---|
| DenseNet-169 | 75.70% (71.79–79.62) | 0.63 | 0.90 | 0.88 | 0.74 |
| DenseNet-201 | 76.57% (72.71–80.44) | 0.69 | 0.85 | 0.84 | 0.76 |
| InceptionResNetV2 | 77.66% (73.85–81.46) | 0.72 | 0.84 | 0.84 | 0.78 |
Table 5.
Model Performance Summary—Finger.
| Model | Kappa | 95% Confidence Interval |
|---|---|---|
| Rajpurkar et. al’s Model | 0.389 | 0.332–0.446 |
| DenseNet-169 | 0.522 | 0.445–0.599 |
| DenseNet-201 | 0.535 | 0.459–0.612 |
| InceptionResNetV2 | 0.555 | 0.480–0.631 |
© 2019 by the author. Licensee MDPI, Basel, Switzerland. This article is an open access article distributed under the terms and conditions of the Creative Commons Attribution (CC BY) license (http://creativecommons.org/licenses/by/4.0/).
Share and Cite
MDPI and ACS Style
Chada, G. Machine Learning Models for Abnormality Detection in Musculoskeletal Radiographs. Reports 2019, 2, 26. https://0-doi-org.brum.beds.ac.uk/10.3390/reports2040026
AMA Style
Chada G. Machine Learning Models for Abnormality Detection in Musculoskeletal Radiographs. Reports. 2019; 2(4):26. https://0-doi-org.brum.beds.ac.uk/10.3390/reports2040026
Chicago/Turabian StyleChada, Govind. 2019. "Machine Learning Models for Abnormality Detection in Musculoskeletal Radiographs" Reports 2, no. 4: 26. https://0-doi-org.brum.beds.ac.uk/10.3390/reports2040026