Streambank Legacy Sediments in Surface Waters: Phosphorus Sources or Sinks?


1
Plant and Soil Sciences, University of Delaware, Newark, DE 19716, USA
2
Water Science & Policy Graduate Program, University of Delaware, Newark, DE 19716, USA
3
Stroud Water Research Center, Avondale, PA 19311, USA
*
Author to whom correspondence should be addressed.
Soil Syst. 2020, 4(2), 30; https://0-doi-org.brum.beds.ac.uk/10.3390/soilsystems4020030
Submission received: 31 March 2020
/
Revised: 7 May 2020
/
Accepted: 9 May 2020
/
Published: 11 May 2020
(This article belongs to the Special Issue Challenges and Successes in Identifying the Transfer and Transformation of Phosphorus from Soils to Open Waters and Sediments)
Abstract
:Streambank legacy sediments can contribute substantial amounts of sediments to Mid-Atlantic waterways. However, there is uncertainty about the sediment-bound P inputs and the fate of legacy sediment P in surface waters. We compared legacy sediment P concentrations against other streambank sediments and upland soils and evaluated a variety of P indices to determine if legacy sediments are a source or sink of P to surface waters. Legacy sediments were collected from 15 streambanks in the mid-Atlantic USA. Total P and M3P concentrations and % degree of phosphorus saturation (DPS) values for legacy sediments were lower than those for upland soils. % DPS values for legacy sediments were below the water quality threshold for P leaching. Phosphorus sorption index (PSI) values for legacy sediments indicated a large capacity for P sorption. On the other hand, equilibrium phosphorus concentration (EPC0) for legacy sediments suggested that they could be a source or a sink depending on stream water P concentrations. Anoxic conditions resulted in a greater release of P from legacy sediments compared to oxic conditions. These results suggest that legacy sediment P behavior could be highly variable and watershed models will need to account for this variability to reliably quantify the source-sink behavior of legacy sediments in surface waters.

1. Introduction
Sediment and sediment-bound nutrients such as phosphorus (P) can be detrimental to the health of aquatic ecosystems and are an important concern for watershed managers and natural resource agencies [1,2,3]. Fine sediments can decrease light penetration and reduce the primary productivity of aquatic vegetation [4]. Inputs of excess nitrogen (N) and/or P to aquatic systems can cause eutrophication and enhance the production of harmful algal blooms [5]. Subsequently, algal decomposition can reduce dissolved oxygen levels in the water column resulting in fish kills [6,7]. The Chesapeake Bay Program ranks nutrients (N and P) and sediment as the top two polluters for the Bay, and the Chesapeake Bay commission seeks to reduce P inputs by 24% and sediment loads by 20% per year [8]. While billions of dollars are being invested in agricultural management practices (e.g., $3.6 billion by 2025 in 2010 dollars in the Chesapeake Bay; [9]) such as riparian buffers, cover crops, nutrient management, etc., water quality improvements have not achieved their targets, especially in agricultural watersheds [2,10]. In 2017, the Chesapeake Bay Model indicated that an additional 0.46 million kg of P reductions will be required from agricultural sources per year to meet the watershed management plan goals for the endpoint year 2025 [2]. While much of the current management and regulatory focus is on upland agricultural and urban sources that constitute 56% and 18% of the total bay P loads [2], other potential sources such as streambanks [11,12] and associated legacy sediments [13,14] have also been gaining increasing attention [15].
Legacy sediments have been defined as deposits of historic sediments that have accumulated in the valley-bottoms of eastern US following European settlement [13,14]. These sediments have resulted from extensive erosion from land clearing and agriculture and the simultaneous construction of mill dams and other structures on streams [13,14,16,17]. Many of the milldams, which were particularly ubiquitous across the mid-Atlantic region (every few kilometers), have now breached or have been removed, leaving incised streams vulnerable to bank erosion [14,17,18] (Figure 1). Not surprisingly, recent studies reveal that streambank erosion of legacy sediments could constitute as much as 50 to 100% of the watershed fine sediment exports [19,20,21] and need to be accounted for in watershed sediment budgets and management plans. Beyond sediments, however, very few studies have characterized the concentrations of P in legacy sediments and their contributions to sediment-bound and total P budgets [15]. We know of only three studies, including two of our own that have determined P concentrations in legacy sediments and estimated their contributions to watershed P loadings [21,22,23]. One other study [24] investigated anthropogenic signatures in legacy sediments through the use of elemental ratios. Our work showed that while P concentrations in legacy sediments were on the lower side (25–1293 mg/kg; [22]), streambank legacy sediment contributions to watershed fluxes could be as much as 50% and 32% for sediments and sediment-bound P, respectively [21].
Beyond total amounts, we know even less about the fate of legacy sediment P as it is eroded from streambanks and deposited in the stream channel or transported downstream to receiving water bodies. While there is substantial information on streambank sediments and associated nutrients [11,25], we do not know if legacy sediments, deposited in streams, become sources or sinks of P and how this behavior varies with sediment and stream water P concentrations and redox conditions in stream sediments. A recent report by the Chesapeake Bay Science and Technology Advisory Committee (STAC) [15] highlighted the lack of information on N and P concentrations in legacy sediments and their fate as a major knowledge gap that urgently needs to be addressed. Without consideration of legacy sediments and sediment-bound P, there is concern that we may have an inaccurate assessment of the watershed loadings and may not be appropriately allocating sediment and nutrient reductions and remedial/management resources [26].
Our interest here was to address these knowledge gaps for legacy sediment P and gain a better understanding of the fate of legacy sediment P in aquatic ecosystems. Key questions we addressed were: (1) What are the concentrations of P in streambank legacy sediments and how do they compare against concentrations for upland soils, stream bed sediments, and water quality P thresholds? (2) What is the fate and net source-sink behavior of sediment-bound P under varying stream water P concentrations and redox conditions? and (3) What are the broader implications of legacy sediment P for water quality and watershed management? To address the first question we collated our recent legacy sediment P concentrations reported by [21,22], compared them to P values reported for other streambank legacy and non-legacy sediment sites, upland soil concentrations, stream bed sediments, and water quality thresholds. Comparisons were performed for total P, bioavailable fraction of P quantified by Mehlich-3 extracts [27], and the % degree of phosphorus saturation (%DPS; [27]). The %DPS has been used to estimate the amount of P sorbed on soils and therefore the potential for P loss via desorption from soils [27].
To address the second question, we analyzed selected legacy sediment samples that were collected [22] using standard analytical methods and indices that have been used to determine the potential for P leaching and its source-sink behavior [28]. These indices included the phosphorus sorption index (PSI, [27,29]) and equilibrium phosphorus concentration (EPC0; [30]). The PSI provides a measure of the maximum phosphorus sorption capacity and can be used to assess the upper limit for P sorption of legacy sediments. In contrast, EPC0 represents the lower end and is the concentration at which there is no net sorption or desorption from the sediment [30,31]. If EPC0 values of sediments are lower than that of the stream water concentrations, the sediments will sorb nutrients from stream water and considered net sinks for P. Inversely, if the sediment EPC0 value is greater than the stream water concentration, sediment will desorb P and thus act as net P source. Thus, the higher the value of EPC0, the greater the vulnerability of P leaching from sediments. In addition to these metrics, we also determined how legacy sediments with known P concentrations responded to oxic and anoxic redox conditions through laboratory incubation assays. The intent here was to investigate if reductive dissolution of P [32] occurred from legacy sediments under anoxic conditions and its extent. These observations were taken together to address the broader implications and water quality challenges for question 3.
2. Materials and Methods
2.1. Site Description, Streambank Sampling for Legacy Sediments, and Sediment Analysis
Detailed description of the streambank sampling sites, coordinates, and methods is provided in [21,22,33]. Briefly, legacy sediment sampling was performed at 15 streambank sites across five streams in northern Delaware (DE), eastern Maryland (MD), and southeast Pennsylvania (PA) (Figure 2). These included Big Elk Creek and its first order tributary Gramies Run and Christina River and its two major tributaries the White Clay Creek and the Brandywine Creek. Big Elk Creek with a drainage area of 205 km2 (empties into the Chesapeake Bay) and Christina River with a drainage area of 1463 km2 (drains into Delaware Bay) straddle the fall line with upper portions of the watersheds extending into the Piedmont and Appalachian regions and the lower portions in the Coastal Plain. The drainage areas for Gramies Run, White Clay Creek, and the Brandywine Creek were 8 km2, 277 km2, and 854 km2, respectively [22].
All of the streambank legacy sediment sampling sites were located upstream of formerly breached or existing milldam locations. These sites spanned four different contemporary land use and land covers (LULC) – urban, suburban, forested, and agriculture (see Figure 1 and Table 1 in [22]). Streambank samples were collected for multiple depths (recorded from the top; Table 1 in [22]) by scraping off the surface sediment and collecting a sample using an auger or a hand trowel (where the sediments were too hard to auger). All samples were placed in sterile Ziploc bags and put on ice until they were brought back to the lab. A total of 67 sediment samples were collected across all 15 sites and all sediment sampling was performed in October–November, 2017. Sediments were ground with a mortar and pestle and sieved through a 2-mm mesh to remove small rocks and organic matter. Sediments were then sieved into coarse (>63 µm) and fine (<63 µm) fractions using an RX-29 RoTap® sieve shaker. Percent sand, silt, and clay for the samples were also determined using Beckmann Coulter LS 13 320 Particle Size Analyzer ® (Indianapolis, IN) [22].
Sediment samples were analyzed for Mehlich-3 [27] extractable elements (M3P, M3Fe, and M3Al) and microwave digestion (EPA method 3051) for total P. Using M3P, M3Al, and M3Fe values, the %DPS was computed using the equation:
where all the M3 extractable values are in molar concentrations [27]. Representative stream water samples were also collected at the time of bank sediment sampling at all 15 sites to compare stream water PO43− against sediment EPC0 values (to assess source-sink behavior). In addition, stream water PO43− data at bi-monthly intervals was also available for Big Elk Creek sampling site (BEB) for a temporal comparison with EPC0 [28].
2.2. Phosphorus Sorption Index (PSI)
The intent of this experiment was to determine the maximum sorption capacity of streambank legacy sediments and compare them against literature values for other sediments. Sediments from all 15 streambank sites and depths (total samples = 67) were used. Fine and coarse fractions were replicated twice for a total of 268 samples (67 samples × 2 size fractions × 2 replicates). Soils were treated with a 75 mg P L−1 solution created by dissolving 0.3295 g of monobasic potassium phosphate (KH2PO4) in 1L of deionized water following the protocol of [34] (pages 20–21) based on [35]. About one gram of sediment (the exact amount was recorded) was placed in a 50 mL centrifuge tube along with 20 mL of the 75 mg P L−1 sorption solution. This provides a ratio of added P to soil of 1.5 g P kg−1 soil. Two drops of chloroform were added to each solution to kill and inhibit microbial activity. Tubes were placed in an end-over-end shaker and shaken for 18 h. After 18 h, samples were centrifuged at 2000 rpm for 30 min and then filtered through 0.45 μm filters using a Millipore filtration unit into 40 mL amber glass vials. The filtered solution samples were analyzed for PO43− (mg P L−1) using EPA-118-A Rev 5 method on an AQ2 Discrete Analyzer (Seal Analytical, Mequon, Wisconsin). The PSI (mg kg−1) value was determined using the equation:
where C is the solution equilibrium P concentration after 18 h (mg L−1). Differences in PSI values with particle size class (fine versus coarse fraction) were determined using t tests. Pearson correlations (r) were determined to investigate relationships between PSI values and Mehlich-3 extracted Al and Fe contents of legacy sediments (M3Fe and M3Al). All statistical analyses were performed in JMP (Version 14.0).
2.3. Equilibrium Phosphorus Concentration (EPC0)
Since EPC0 analysis required sorption assays with multiple PO43− solution concentrations for each sediment sample, to keep things manageable, we limited the sediment analysis to only one randomly-selected depth across the 15 streambank sites and the fine sediment fraction. The intent here was to survey the EPC0 behavior across sites. With the inclusion of two replicates, 30 sediment samples were analyzed in total (15 sites × 1 depth × 2 replicates). In addition, to assess EPC0 variability with streambank depth, we determined the EPC0 values for all depths at two sites—BEB and SM3 (four depths each). These samples were also replicated twice.
Four PO43−-P solution concentrations, representing the likely range of stream water P concentrations, were used for the assay and included n.d., 0.25, 0.50, and 2.0 mg P L−1. All solutions were made by dissolving KH2PO4 in filtered stream water collected from a forested headwater tributary of Big Elk Creek, Maryland, with undetectable P concentration. Stream water was used to simulate natural ionic strength conditions. About one gram of sediment (exact weight was noted) was added to a 50 mL centrifuge tube to which 20 mL of PO43− solution was added; this mixture was created for each of the four P solution concentrations. Two drops of chloroform were added to the solution to inhibit microbial activity. Samples were placed on an end-over-end shaker and incubated for 24 h at 25 ± 2 °C. Once incubated, samples were centrifuged at 2000 rpm for 30 min. Using Sterlitech Glass Microfiber 0.7-µm filters, the centrifugate was filtered into 40 mL amber vials. The solution PO43− concentrations were measured colorimetrically using EPA-118-A Rev 5 method on the AQ2 Discrete Analyzer (Seal Analytical, Mequon, Wisconsin).
The EPC0 was computed using the procedures described by [36] based on [30]. The P sorbed on the sediment phase () (µg g−1) after a 24 hour period was calculated using the following equation:
where v is the total volume of the solution (0.02 L in this case), m is the mass of dry sediment in (g), (µg P L−1) is the concentration of solution prior to incubation and (µg P L−1) is the concentration of solution after the 24-hour incubation. S was plotted (on the y-axis) against (x-axis) and the data points were fitted with a linear regression. At low solution P concentrations (as in this case) the relationship between C and S can be estimated using linear regression [30,37]. The EPC0 (µg P L−1) value is the coordinate at which the linear fit line intercepts the x-axis and is computed by substituting y as 0 and solving the linear equation for x. EPC0 values were then expressed in mg L−1. Additionally, Pearson correlations (r) were determined to investigate the relationships between the EPC0 value, particle size fractions, and M3Fe and M3Al concentrations using JMP software (version 14.0).
2.4. Sorption and Desorption Under Anoxic and Oxic Conditions
The intent of this experiment was to investigate how legacy sediment P sorption or desorption could vary if streambank legacy sediments were eroded from the bank and deposited in the stream under anoxic and oxic conditions [32]. Legacy sediment samples for four sites, one depth each, and only the fine sediment fraction were selected for this analysis. Three replicates were used for each sediment sample. Since the legacy sediments had low initial inorganic P, the sediments were exposed to an elevated P solution (10 mg L−1) prepared using KH2PO4 prior to the experiment. For this, thirty grams of the dry sediment sample was placed in an acid-washed, ethanol cleaned, glass tray and 600 mL of 10 mg L−1 PO43− solution was added to saturate the sediment with P. The sediment was placed on a shaker table for 24 h at 100 rpm, drained, and then placed under a dry hood until any excess liquid was evaporated. The sediment was then removed and placed in a sterile Ziploc bag until the second part of the experiment.
For the second part of the experiment, two grams of P-sorbed legacy sediments were added to 40 mL of filtered stream water in an amber vial and placed on a shaker table for 24 h at 112 rpm. A control treatment was also created where no sediment was added to the stream water. Unlike that for EPC0, stream water PO43− values were above detection (0.04 mg P L−1) for this experiment. This was likely because of stormflow conditions prior to sampling; this however was not a problem for this experiment since our intent was to investigate the differences between oxic and anoxic conditions. The vials were subject to both oxic and anoxic treatments. To maintain oxic conditions, the cap was left off the amber vial to ensure oxygen would not be depleted in the water. Anoxic conditions were created by adding one gram of sodium sulfite (Na2SO3; an oxygen scavenger) to the solution and the vial was sealed by closing the cap. Anoxic conditions were verified using a dissolved oxygen meter. After 24 h, samples were filtered using Sterlitech glass microfiber 0.7 µm filters. The sample solutions were measured for their solution PO43− concentrations (EPA-118-A Rev 5) on an AQ2 Discrete Analyzer (Seal Analytical, Mequon, Wisconsin). A t-test was used to determine the significant differences between the oxic and anoxic treatment groups.
3. Results and Discussion
3.1. Concentrations of P in Streambank Legacy Sediments and Comparisons Against Upland Soils, Stream Bed Sediments, and Water Quality Thresholds
P concentrations measured by [21,22] are presented in Table 1 and are compared against other studies with data on streambanks, bed sediments, and upland soils. It should be noted that while P concentrations for both the coarse and fine fractions of the soils/sediments were measured by [38], only the fine fraction values were reported in [21]. The comparisons here provide important insights. Total P concentrations for streambank legacy sediments were the lowest of all sediment sources (Table 1) with mean P concentrations for the banks nearly half of those reported for cropland and developed soils [21]. The difference in mean concentrations between legacy sediments and other sediment categories was less for M3P, but nonetheless, M3P values for streambanks were the lowest among all sources (Table 1). Mean concentrations for total and M3P for streambanks [21,22] were comparable to streambank values from other studies (Table 1). Percent DPS values for streambanks were also low and particularly lower than values reported for cropland and developed soils (Table 1).
When P concentrations are assessed for particle size class (Table 1), total P concentrations for fine sediments were twice or more than those for coarse fractions across upland soils, banks and bed sediments. The same level of separation, however, was not observed for M3P and %DPS values. Mean %DPS was generally greater for the coarse versus the fine fractions but a similar consistent trend was not observed for M3P. Similarly, when mean %DPS values were compared for bed sediments and streambanks, bed sediment values were slightly greater than the streambank values, with no consistent pattern for total P and M3P.
While M3P was originally developed for agronomic needs, i.e., determining crop nutrient requirements and associated fertilizer application, it has been used for determining environmental risk associated with P leaching [27]. In Delaware, M3P and %DPS values less than 50 mg kg−1 and 15%, respectively, are considered “below optimum” and do not pose any risk to water quality [27]. In contrast, M3P and %DPS values in excess of 100 mg kg−1and 58%, respectively, are considered a threat to water quality [27].
In Arkansas, environmental threshold for water quality concern for M3P is higher at 150 mg kg−1. When compared against these water quality thresholds, studies listed in Table 1 arrived at the same conclusion that streambank sediments (legacy and non-legacy) likely posed a low risk for P leaching under well oxygenated conditions and served as a net sink for P [36,41,42,43]. All of the studies, however, did recognize that while P concentrations were low and most of the P was likely bound to metal hydro-oxides, this P could be released into solution due to the reductive dissolution of the oxides under anoxic conditions [44,45]. The low P concentrations in streambank legacy sediments should not be very surprising considering that much of these sediments were likely deposited prior to the 1950s [13,15,17], before the significant increase in use of synthetic N and P fertilizers on agricultural lands [3]. One way these buried legacy sediments could have acquired elevated P concentrations would be through contact with P-rich streamflow (along the banks or during overbank flooding) and/or upland runoff carrying fertilizer nutrients that infiltrated through the soil profile.
Elevated concentrations of total P in bank versus stream bed sediments (Table 1) were attributed to a greater fraction of fine sediments in the banks, which includes P-sorbing iron oxides [39]. The same pattern, however, has not been reported by other studies in Table 1 (e.g., [21,40]). This could be because bed sediments typically represent a mixture of various sediment sources including P-rich upland sediments. Bed sediments could also acquire elevated P concentrations from P-rich stream runoff. However, broadly, most studies do report that bed sediments are more coarse grained than bank sediments [39] and this would likely result in less P sorption capacity for bed sediments as reflected by the higher %DPS values for bed sediments in Table 1.
3.2. Phosphorus Sorption Index (PSI) for Legacy Sediments
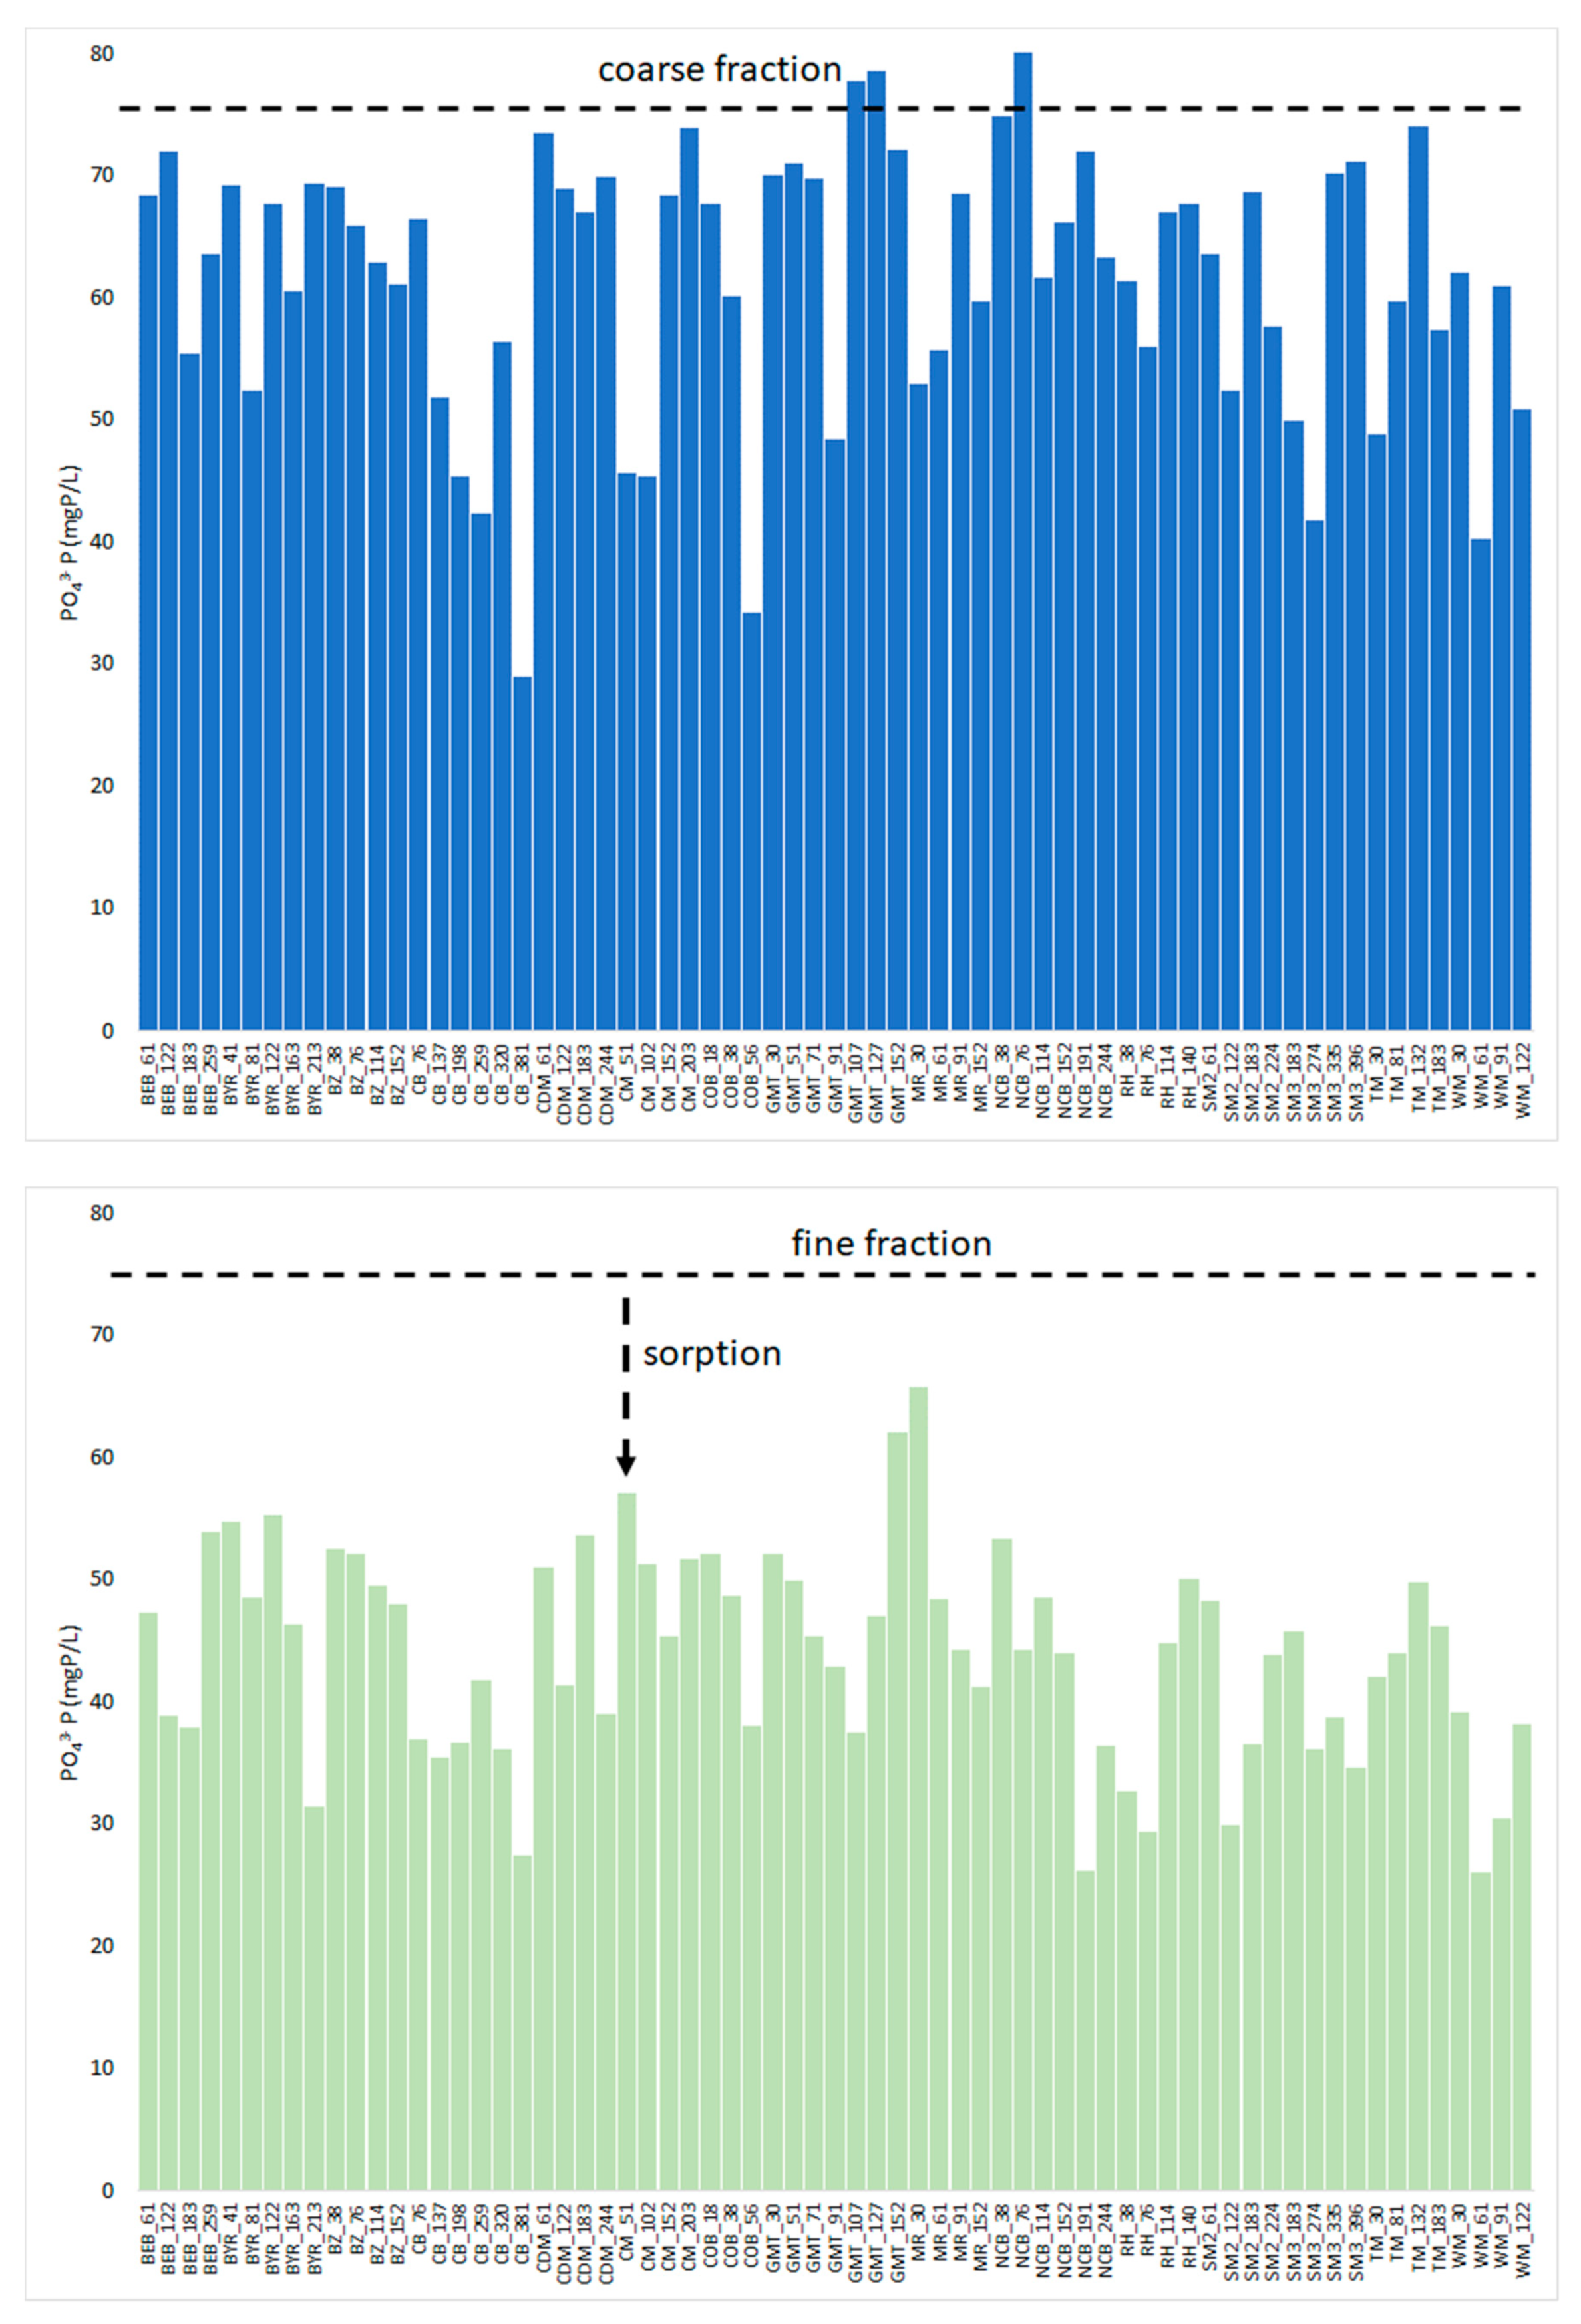
Solution concentrations of PO43− after 18 h of legacy sediment incubation were lowest for the fine fraction (<63 µm) (43.7 ± 8.5 mg P L−1; Figure 3) down from the starting concentration of 75 mg P L−1. While these solution concentrations are much greater than what one would typically observe in streams, this experiment indicates that fine legacy sediments have a fairly high capacity for P sorption. In comparison, solution concentrations for the coarse fraction (>63 µm) were higher (61.5 ± 10.9 mg P L−1; Figure 3), indicating lower sorption for this sediment class. Three samples within the coarse fraction had solution concentrations greater than the starting solution of 75 mg P L−1 (Figure 3) indicating some release of P from sediments. The mean PSI value for coarse and fine legacy sediment fractions taken together was 472.3 ± 270.4 mg kg−1, while that for the coarse fraction was 292.6 ± 224.4 mg kg−1, and that for the fine fraction was 652.0 ± 177.3 mg kg−1 (Table 2). There was a significant difference in PSI values between the coarse and fine size fractions (p < 0.001). There was a strong positive correlation between PSI values for the coarse fraction and M3Al (r = 0.77; p < 0.001) and a weak and insignificant correlation with M3Fe (r = 0.17; p = 0.15). For the fine fraction, the relationship between M3Al was slightly weaker, but still positive (r = 0.69; p < 0.0001) and there was a positive correlation with M3Fe (r = 0.26; p = 0.029).
The PSI experiment confirmed that fine legacy sediments have a greater sorption capacity than the coarser fractions. The PSI value for the fine legacy sediments was also greater than most of the agricultural soils (e.g., Table 2, Evesboro loamy-sand (136–263 mg kg−1) and Pocomoke sandy clay loam (95–714 mg kg−1), with the exception of the Matawan sandy loam, which had a higher sorption capacity (588–2564 mg kg−1) [46]. In another sorption study [39], maximum sorption values for exposed and submerged streambank sediments in an agricultural catchment in central Pennsylvania were 259 mg kg−1 and 214 mg kg−1, respectively (Table 2). These values were much lower than values for our fine legacy sediment fraction, but comparable to the coarse fraction PSI value.
3.3. Equilibrium Phosphorus Concentration (EPC0)
EPC0 values across the 15 legacy sediment sites ranged from 0–0.24 (mean: 0.044) mg L−1 (Table 3). Ten of fifteen sites had EPC0 values greater than the baseflow stream water concentration during sediment sampling indicating that the sediment could be a potential P source if deposited into the channel (Table 3). Five of the fifteen sites had EPC0 values that were less than the stream water P concentrations indicating that the sediment would act as a potential sink for P (Table 3). While there was no consistent relationship between EPC0 values and stream water PO43− concentrations, two of the highest EPC0 values were associated with Brandywine Zoo and Cooch’s Bridge locations, both urban stream locations (Table 3).
Our EPC0 values were within the range of values reported by other studies (Table 4). A study in Maryland (Kimages creek) that investigated legacy sediments reported an EPC0 value of 0.010 mg L−1 [47], while that from till bank material near Lake Pepin in Minnesota had an EPC0 value of less than 0.1 mg L−1 [48]. Studies have shown that there is a strong correlation between the EPC0, soluble reactive phosphorus (SRP), and dissolved reactive phosphorus (DRP) in stream water [43,49]. The EPC0 in sediments may change depending upon the SRP concentration in the sediment and stream waters [49] as, potentially, in the case of our urban, P-rich, Brandywine zoo site (Table 3). One study [49] looked at the influence of sewage treatment works (STWs) on riverbed sediment to determine if sediments could act as a buffer for the increase in stream water P concentrations. They found that regardless of STW influence, the riverbed sediments always acted as sinks in the water column. Despite higher concentrations of SRP in the rivers downstream of STWs, sediment near STWs had a higher capacity to absorb SRP [49]. Similarly, [48] showed that fine bank sediments transported in stream waters sorb elevated P from sewage and industrial waste and then deliver it to Lake Pepin. Given that controlling bank erosion could be expensive, they suggest reducing P inputs to waterways to control this loading to Lake Pepin.
For our sites, we did not find any significant correlations between EPC0 concentrations and particle size classes %fine, %sand, %silt, and %clay. In contrast, EPC0 was significantly negatively correlated with M3Al (r = −0.70; p = 0.0033) and positively correlated with M3Fe (r = 0.54; p = 0.03). Contrary to our observations, a significant inverse correlation between M3Fe and EPC0 was reported by [36], indicating that as the amount of M3Fe increased, the potential for sorption increased resulting in lower EPC0 values. In the same study, EPC0 values were positively correlated with sand content but negatively correlated with silt and clay content [31,36], indicating that with finer fractions greater retention of P occurred.
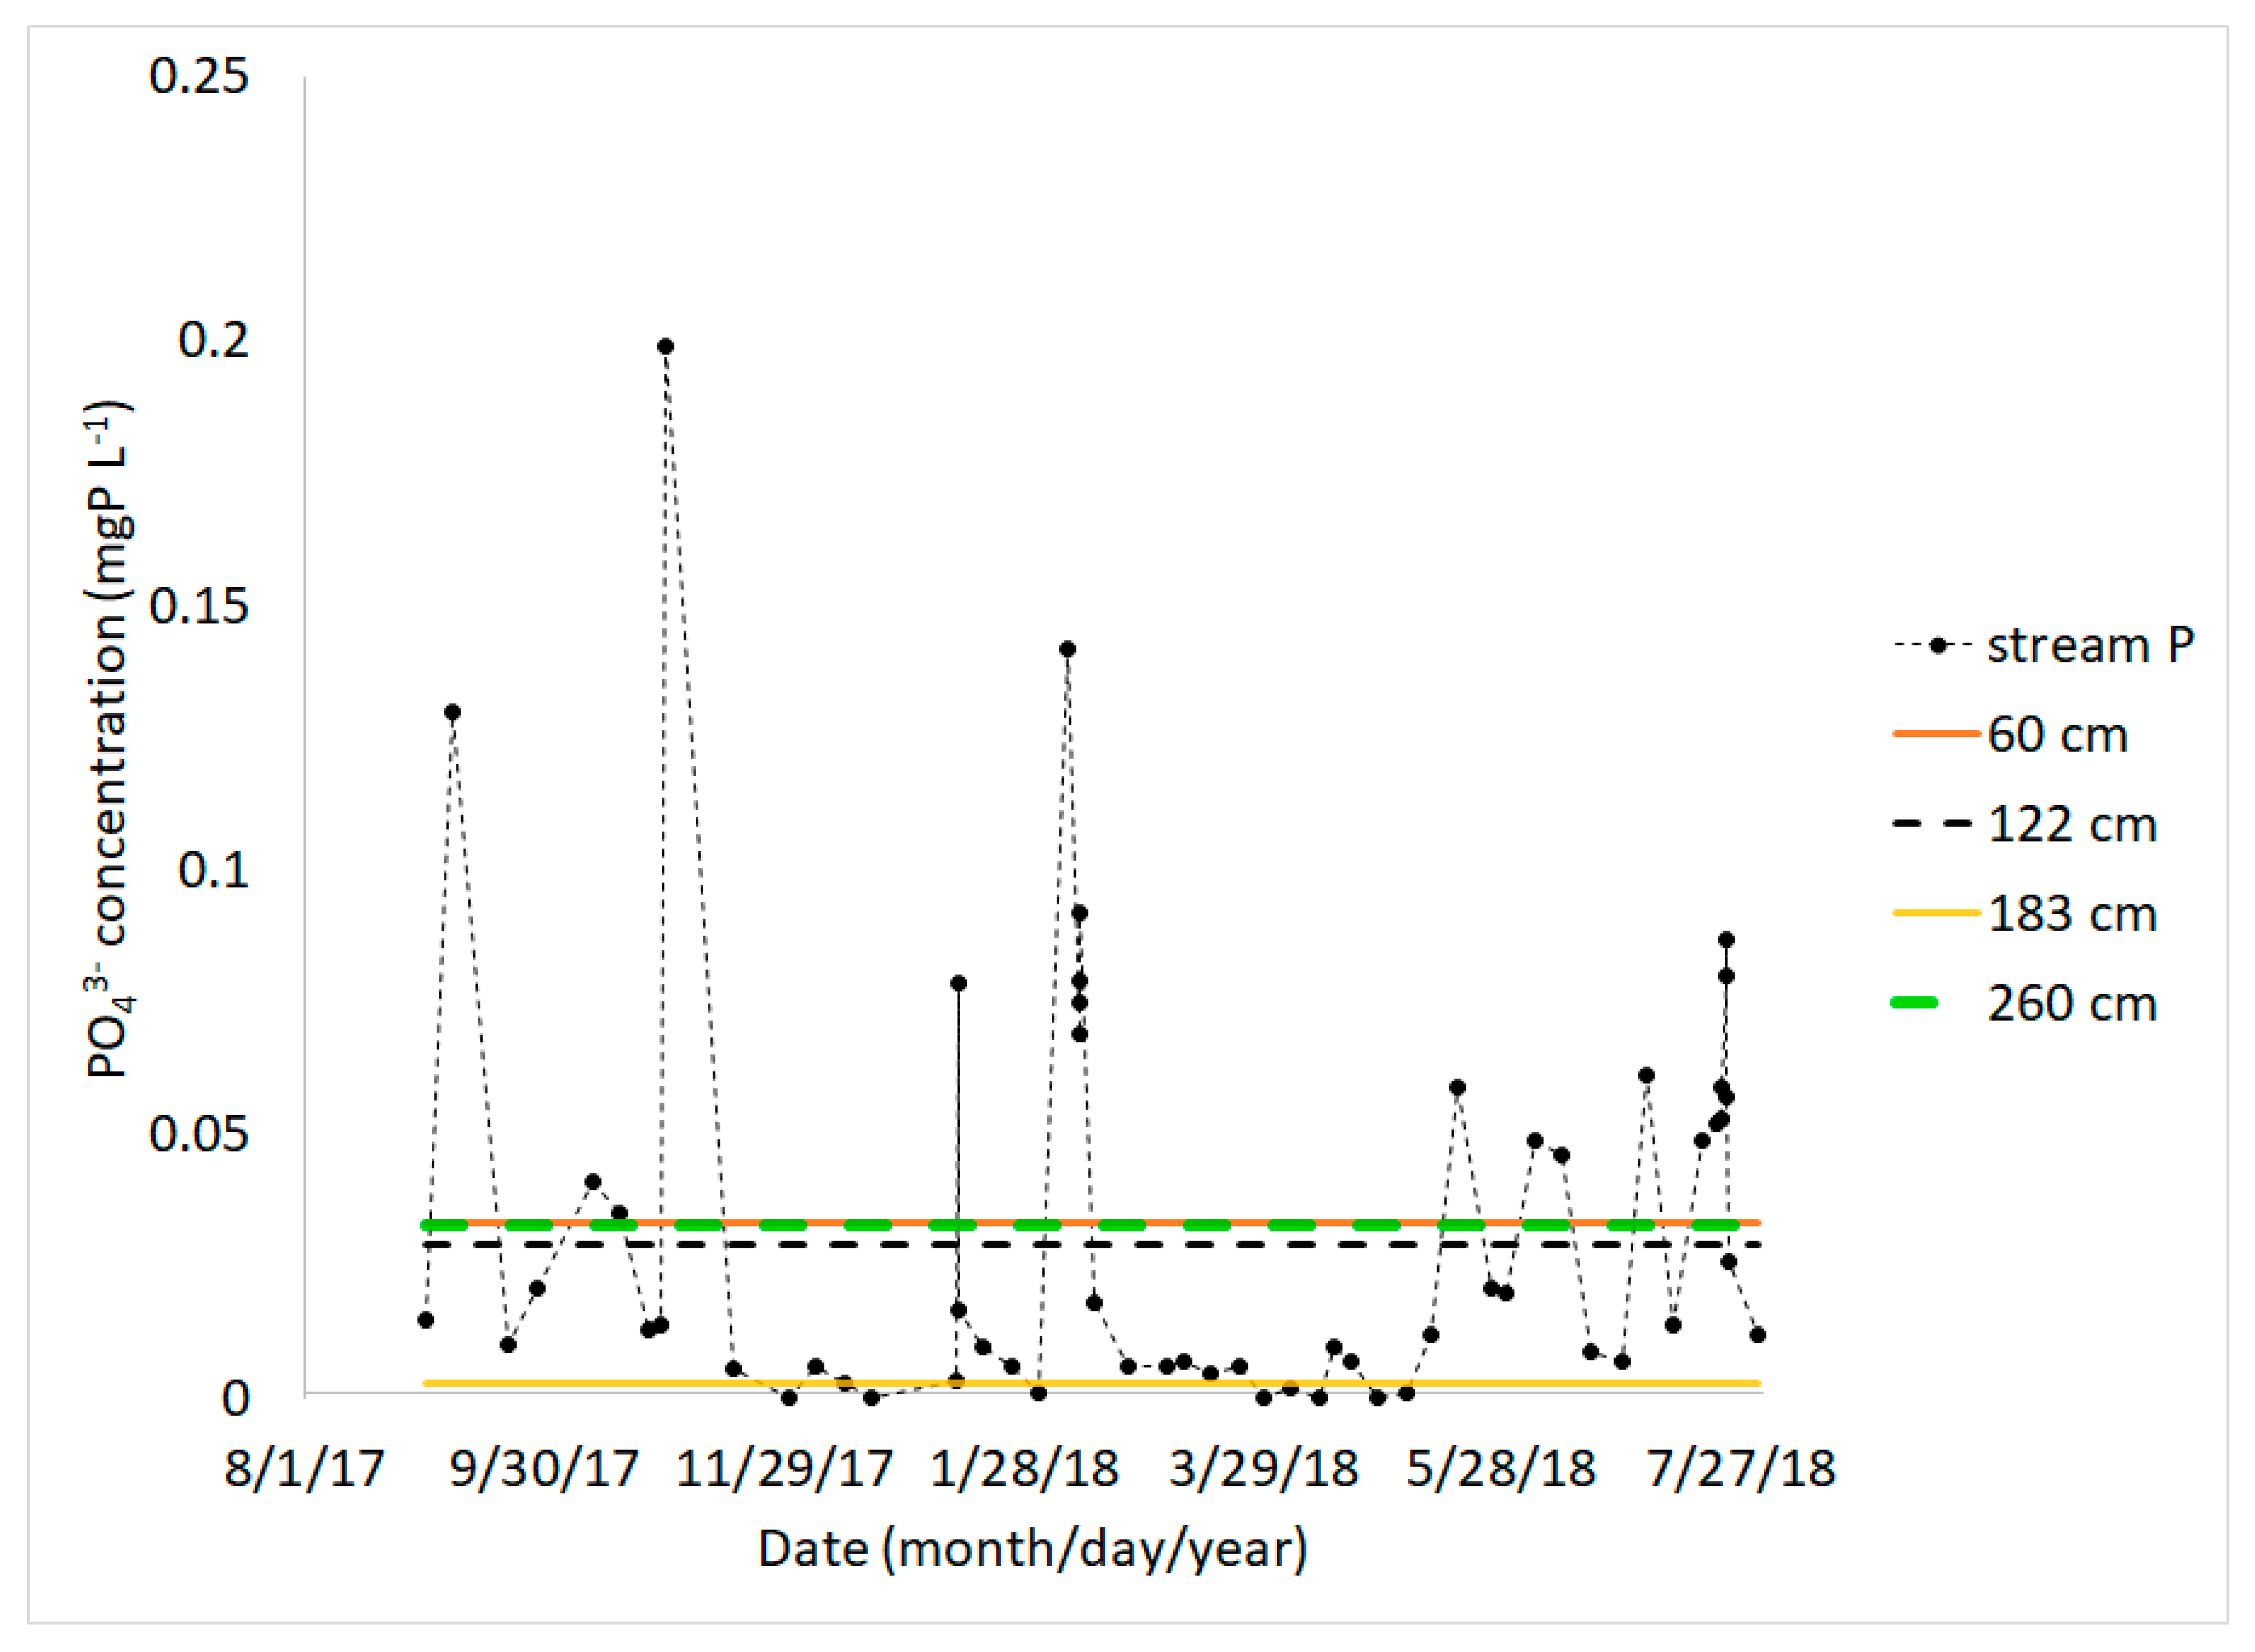
EPC0 values also varied with bank depth for both sites that were evaluated with depth. At BEB, for depths 60, 122, 183, and 260 cm from the top, the EPC0 values were 0.032, 0.028, 0.002, and 0.032, respectively. At SM3, for depths 132, 173, 231, 267 cm from the top, the values were 0.031, 0.024, 0.047, and 0.031, respectively. This variation in EPC0 values with bank depth was likely due to variation in sediment composition and characteristics with depth [22]. When the BEB EPC0 values are compared against seasonally varying stream water PO43− concentrations (Figure 4), we note that the source-sink behavior of sediments varies temporally. The sediments behave as a sink when stream water P concentrations are elevated, particularly during stormflows (Figure 4), and as a source during low-P baseflow conditions. For example, for the sediment at 60 cm depth (EPC0 = 0.032; Figure 4), the sediment would serve as a sink for P for 21 out of the 57 sampling points and as a source for the remainder 35 points (assuming stream waters are in contact with sediment at this depth). In comparison, sediments at 183 cm depth behaved as a sink for 49 out of the 57 sampled stream water concentrations. A similar temporal variation in source-sink behavior of sediments was also reported by [36] by valuating sediment EPC0 values against stream water P concentrations through the year. While we did not measure EPC0 at multiple times of the year, other studies suggest that sediment EPC0 could also be temporally variable, driven by sediment conditions and stream water concentrations. For example, EPC0 can increase under reducing conditions due to the loss of crystalline forms of Fe oxides resulting in a release or reduced retention of P [44,50]. EPC0 values could also fluctuate as a result of stream water concentrations with an increase in EPC0 with increasing stream water concentrations, resulting in a reduction of the sediment buffering capacity [51]. On the other hand, hydrologic dilution after storms could result in a release of P from sediments [52]. This dynamic behavior could make determining source-sink behavior of legacy sediments more complicated since such a behavior would now be dictated by stream water concentrations as well as time-variable sediment EPC0 values.
While we were not able to assess the EPC0 values for bed sediments, others have made such assessments and evaluated them against streambank sediment values. EPC0 values for bed sediments at all of the 10 sites in river Wensum in Norfolk, UK [49], were below the stream water SRP concentrations suggesting that bed sediments were always acting as a sink for P. Two studies [36,39] found that bed sediment EPC0 values were greater than those for bank sediments (Table 4). They suggested that, in general, banks had higher proportion of fine grained material, including P-sorbing clay and metal hydro-oxides (and thus lower EPC0), as opposed to bed sediments [36,39]. Additionally, erosion and downstream transport or loss of finer fractions from bed sediments could further increase EPC0 values for bed sediments and thus reduce the sorption potential for bed sediments compared to the original bank sources [39].
3.4. Legacy Sediment Sorption Under Anoxic and Oxic Conditions:
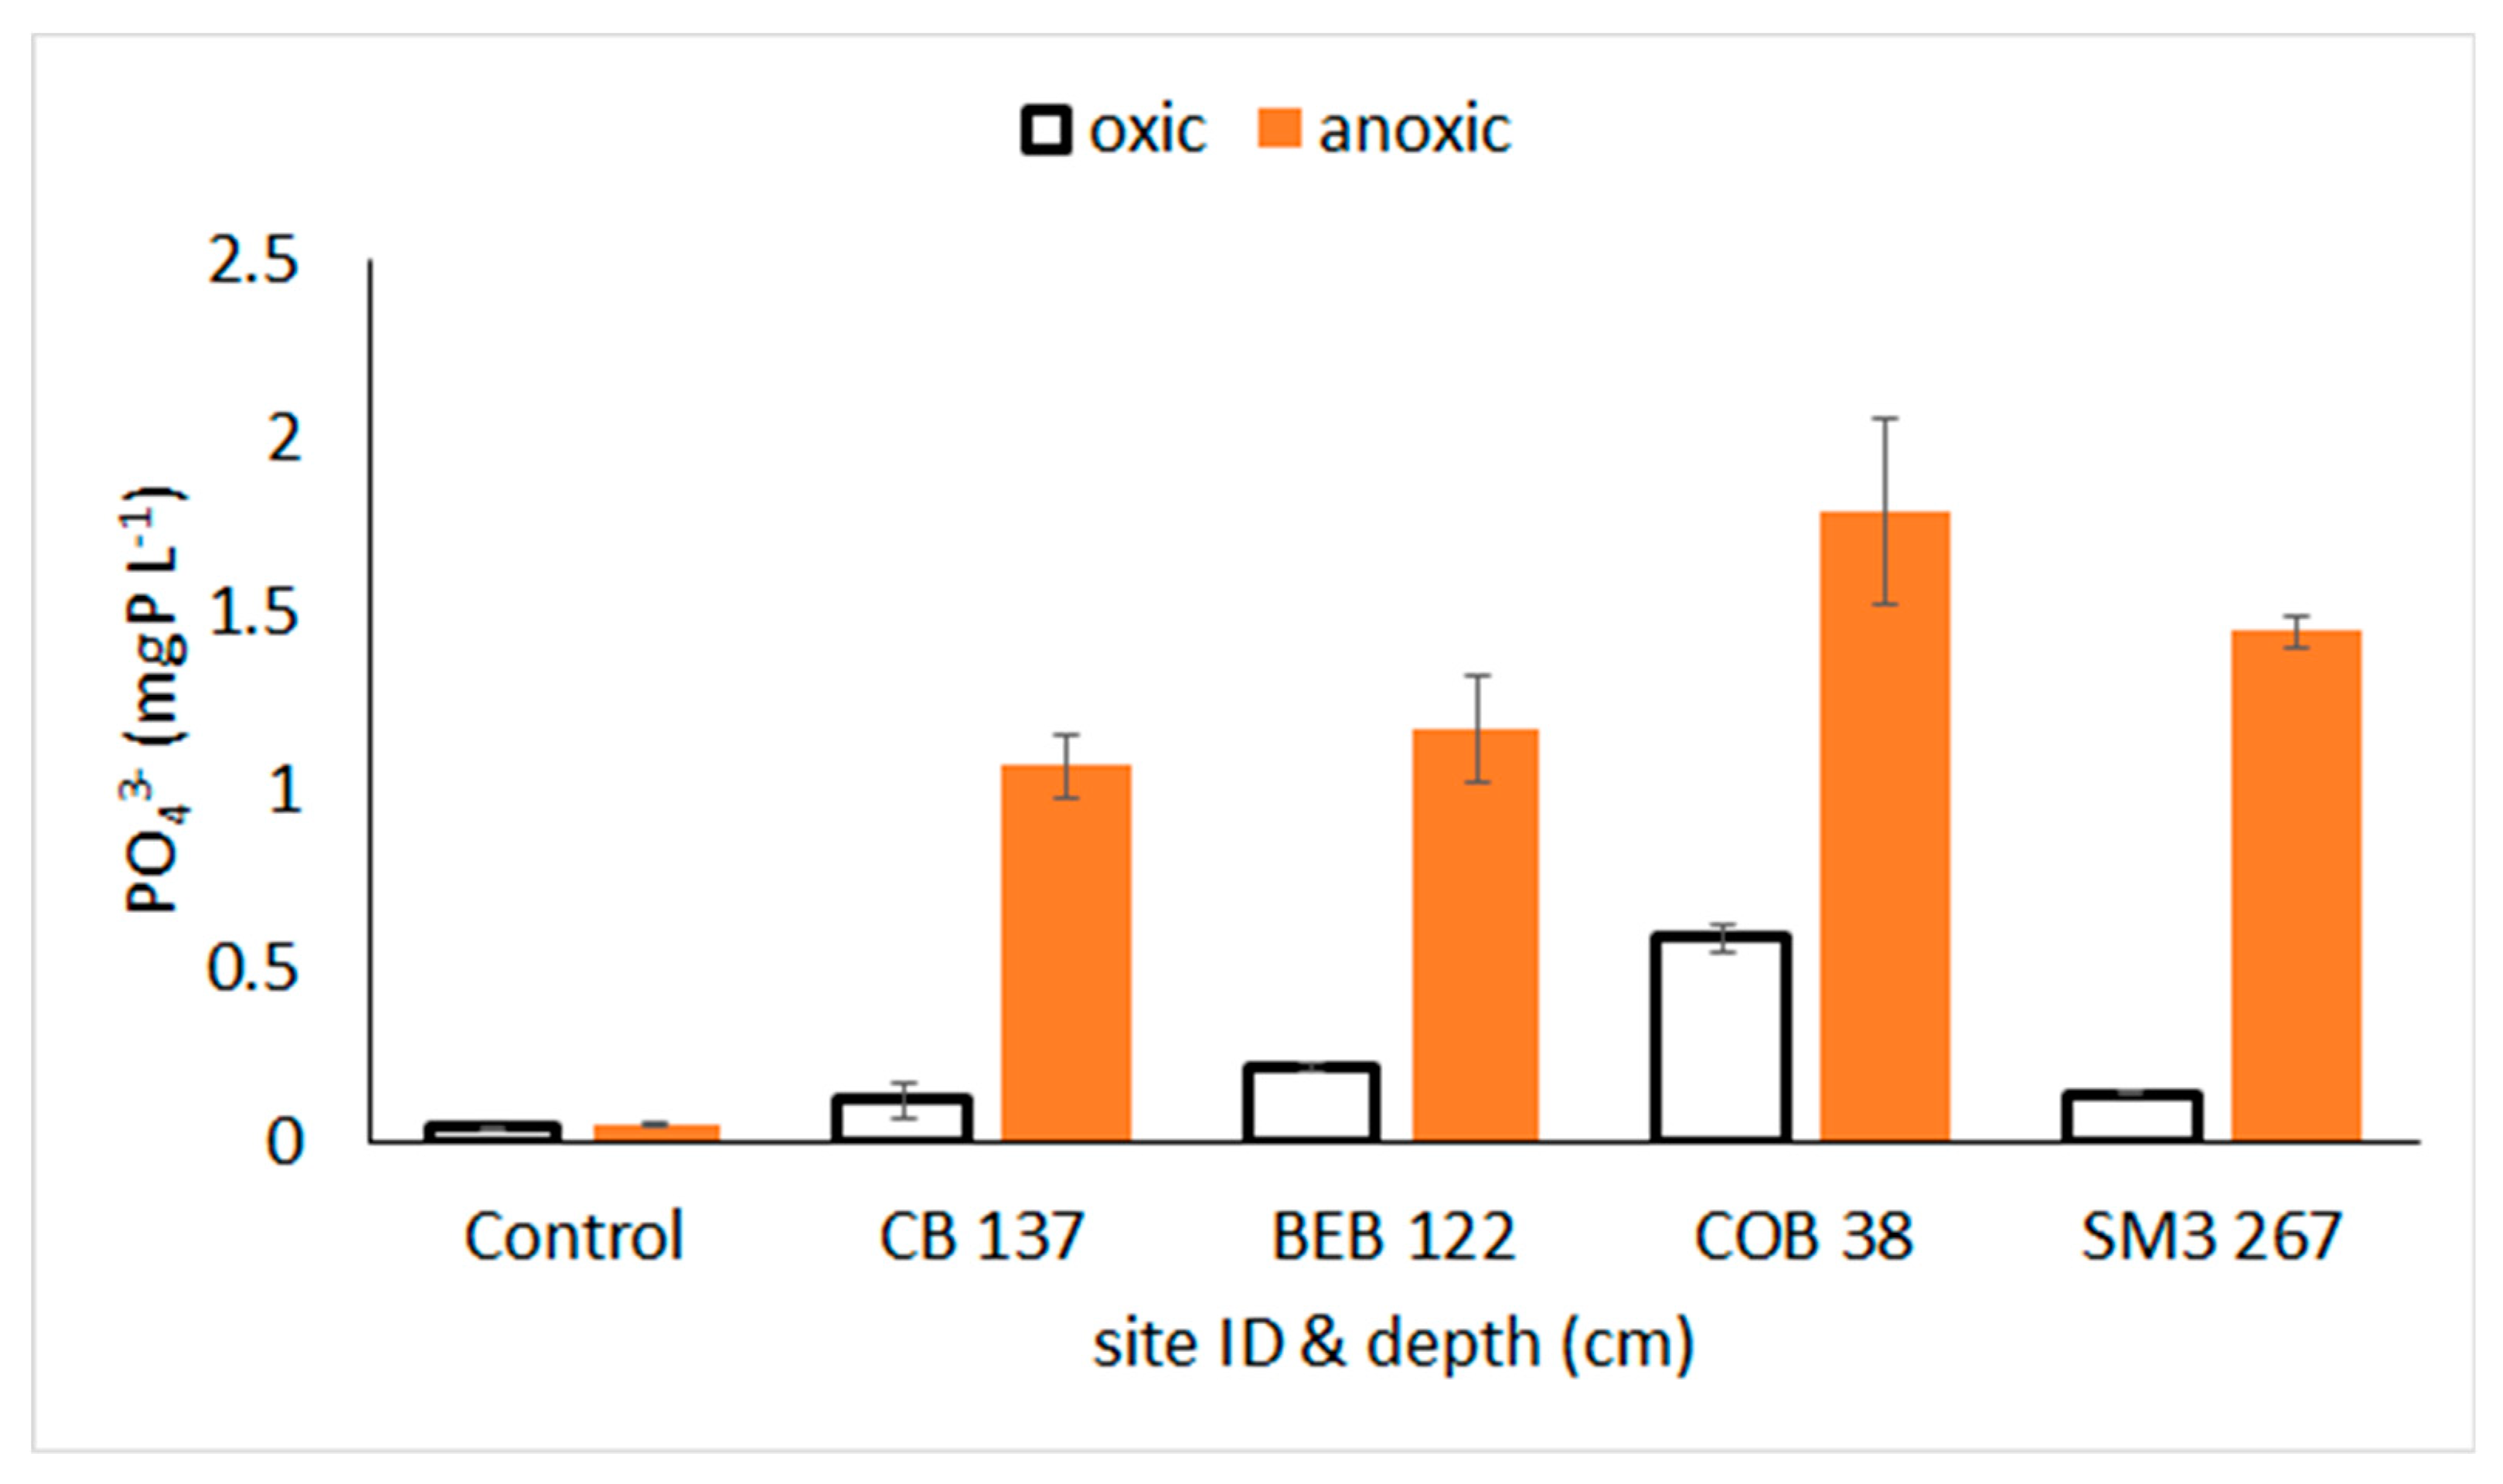
Our experiment with P-sorbed legacy sediments revealed that the solution PO43− concentrations under all sediment treatments under anoxic conditions (mean 1.40 ± 0.32 mg P L−1) were significantly greater (t-test, p < 0.001) than those measured under oxic conditions (mean 0.26 ± 0.19 mg P L−1) (Figure 5). Similar to studies for other sediments and soils [32,44,53], these results showed that the P-sorbed legacy sediments released more PO43− under anoxic conditions than under oxic conditions. Thus, legacy sediments with elevated P could release P in greater amounts under anoxic conditions, effectively acting as a source. Anoxic conditions result in the reduction of Fe (III) to Fe (II) [54,55] releasing the tightly bound P from the iron oxide surfaces [32,44]. Reduced conditions also allow Fe (II) to preferentially bind to sulfide, releasing the PO43− ions [29]. Similar work [40] with aerobic and anaerobic treatments however suggested that the amount of inorganic P release could vary with different soils and would depend on the various P fractions associated with oxides. They found that anaerobic conditions released P associated with Fe, but the same did not extend to slowly-cycling P that was associated with Ca, stable P or residual P [40]. Temperature could also be a factor influencing the release of P under anoxic conditions. Soils under warm flooded and anaerobic conditions released more P than similar anoxic soils under cold or unfrozen/frozen conditions [56]. These responses would likely extend to legacy sediments too with some sediments releasing relatively more P than others under varying anoxic conditions.
3.5. Conceptual Model for Source/Sink Behavior of Legacy Sediment P and Broader Implications for Water Quality and Watershed Management
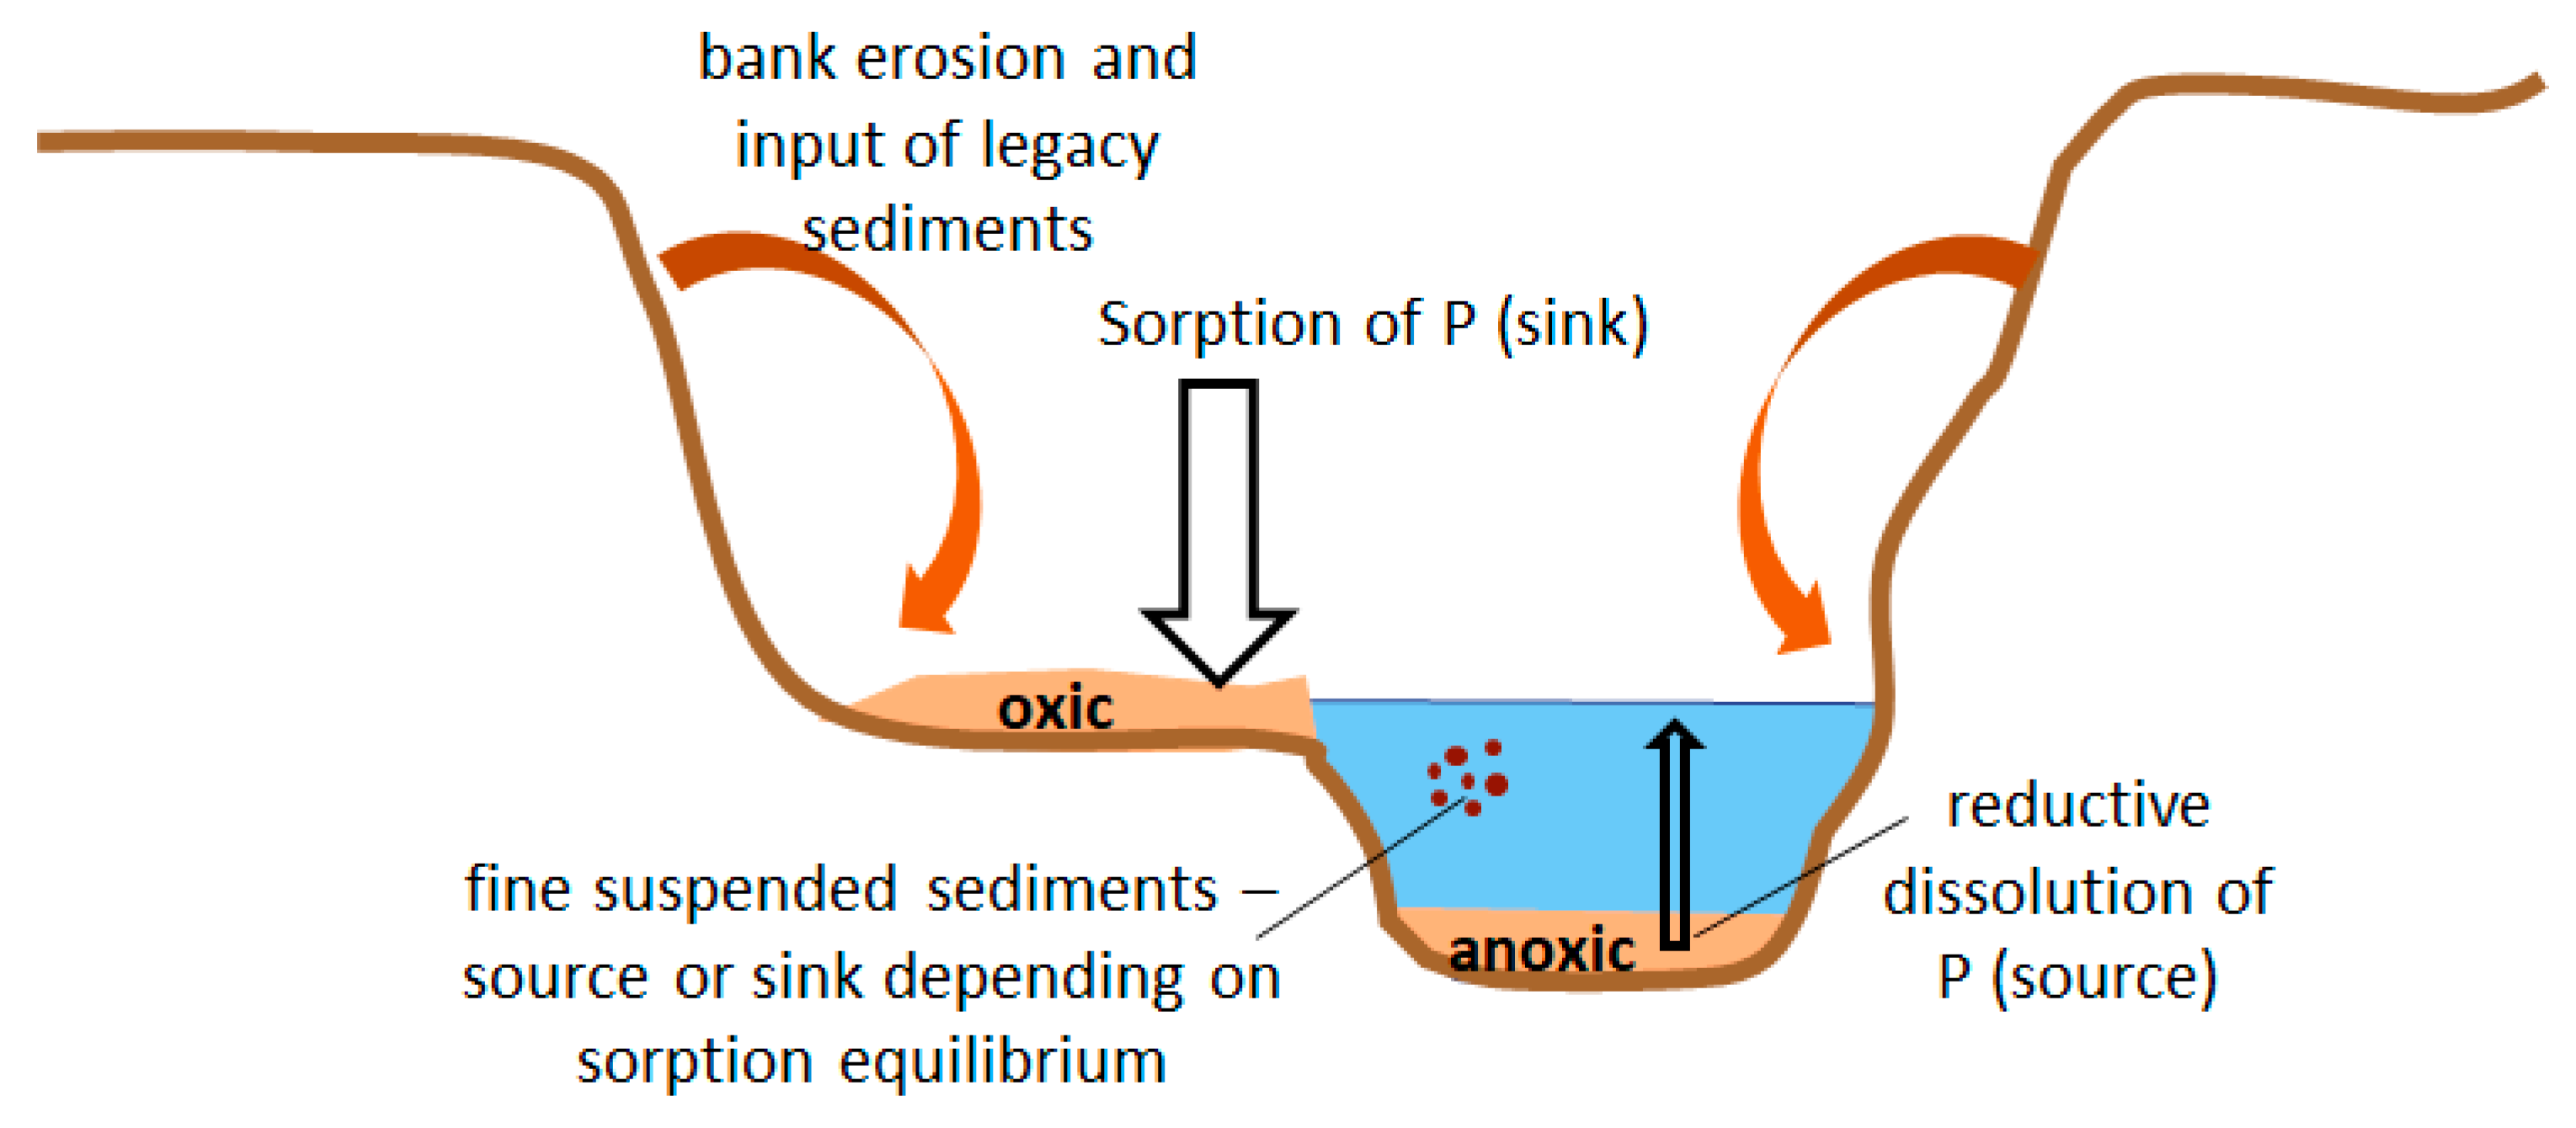
Evaluation of legacy sediments through a variety of P indices provided important insights into the potential source-sink behavior of legacy sediments under contrasting redox conditions and sediment and water P concentrations. Overall, our results suggest that legacy sediments, which are particularly rich in silts and clays [15,17,22], have a large capacity for P sorption and can act as a sink for P under well-oxygenated conditions and in stream waters with moderate to high levels of dissolved P (e.g., as in the case of agricultural and urban streams). Floodplains could be important reservoirs of such P (e.g., conceptual model in Figure 6). In contrast, if legacy sediments are introduced into stream waters with low dissolved P concentrations (e.g., in forested streams with P concentrations below sediment EPC0), or are deposited in anoxic conditions, e.g., sediment interfaces in lowland streams or at the bottom of ponds and lakes (Figure 6), these locations could become potential “hotspots” [57] for release P to overlying waters. Because of the greater amount of fine fractions, streambank legacy sediments are likely greater sinks of P than the stream bed sediments.
At the full drainage network scale, legacy sediments in headwater streams, with steeper slope gradients, shallower and faster flows, and likely more oxygenated conditions, could potentially serve as net sinks/repositories of P as opposed to lower positions in the drainage network where deeper and slower flows with anoxic conditions may encourage P-release. Increasing stream water P concentrations lower in the drainage network due to urban/agricultural land use and/or inputs from wastewater and other sources could also increase P sorption on legacy sediment surfaces and thus reduce the buffering potential [48]. Another factor that could affect legacy sediment P dynamics lower in the drainage basin, particularly in estuaries, is the effect of salinity on sediment P. Studies report that increasing salinity could result in release of P from sediments, but to varying extents [58,59]. It should also be noted that beyond abiotic sorption-desorption processes, P release or sequestration in sediments could also be influenced by biotic decomposition of P associated with sediment organic matter [44,60]. Typically, however, organic matter or organic carbon (OC) content of legacy sediments are low (OC < 1%; [22]), hence, such decomposition-related P release/source is likely to be small.
We recognize here that we investigated legacy sediment behavior through controlled laboratory experiments. Field or in-situ conditions could be much more complicated with multiple factors and conditions (e.g., pH, temperature, salinity, oxygen, water flow and diffusion gradients, dry-wet cycles, etc.) simultaneously affecting P processes and dynamics with one factor reinforcing or cancelling out the effects of the other [11,25,61,62]. Because of this, measuring and understanding legacy sediment responses in-situ could be both, important and challenging [63]. Our observations were also based on only 15 sites and additional legacy sediment sites across the mid-Atlantic and elsewhere, particularly across a gradient of land uses and stream water P concentrations extending from the headwaters to the estuaries, could further help generalize and validate our conceptual model.
Given this conceptual model and the potential source-sink effects of legacy sediments on stream water P, one wonders how the presence of large, valley-bottom stores of P-poor legacy sediments have impacted stream water quality over the past century. Use of synthetic fertilizers started increasing around the 1950s and since then sources such as wastewater, sewage, septic, and fertilizer and manure applications on agricultural lands have been contributing elevated P to our surface waters [2,3,64]. Simultaneously, over the same period or even earlier, streambank legacy sediments have been eroding and contributing sediments to the fluvial system as a result of milldam breaches and removals [17]. Key questions then are: how have the interactions of P-poor legacy sediments and P-rich upland waters affected the trajectory of water quality of our surface waters over the past few decades? Have P-poor legacy sediments buffered the full impacts of upland sources on downstream aquatic ecosystems? On the other hand, have fine legacy sediments enriched with upland-P (among other sediment sources), which have been deposited in downstream aquatic systems and bays, become a long-term, internal, source of P (via reductive dissolution)?
Furthermore, many milldams still exist in the mid-Atlantic with stores of legacy sediments upstream of these dams [17,65]. Backing up and pooling of stream waters in mill ponds encourage anoxic conditions in sediments. This raises the question of how do the anoxic conditions influence the fate and release of P associated with millpond and streambank sediments? Moreover, dams are increasingly being removed across the mid-Atlantic and elsewhere [66,67,68,69]. An important question that is on the mind of many watershed managers and environmental agencies is how does the removal of the dams influence particulate and dissolved fractions of P stored upstream of the dams in the stream channel and along the banks? Dam removals could reduce anoxic conditions and the associated reductive dissolution of P, but increase erosion of particulate P associated with in-stream and streambank sediments. Addressing these questions and determining the net balance of these fluxes and processes is important if we want to fully understand the complex interactions of human land use legacies on water quality and the health of our ecosystems.
Our observations on P source-sink mechanisms also have important implications for contemporary watershed management and restoration and watershed P budget and regulatory assessments. Many of the streams with legacy sediments, particularly in the mid-Atlantic, are incised and hydrologically disconnected from the streambanks or legacy sediment terraces [14]. Stream restoration efforts are currently underway that enhance the hydrologic connectivity (or exchange) of the stream with the streambanks or floodplains via bank grading, floodplain creation, and/or stream uplift [70,71,72]. Such restoration efforts should particularly try to leverage the untapped P sorption capacity of legacy sediments by increasing the surface area of floodplain sediments that are exposed to and interact with stream waters, maintaining the floodplains in oxic conditions (so that P is retained on iron oxides), and reducing the exports of fine legacy sediments to downstream flows. If streambank legacy sediments do not contain other contaminants (e.g., metals or organics), these sediments could serve as valuable P sinks and should be used on-site in floodplain creation and other restoration activities and not moved offsite to landfills for disposal (as happens in some restoration projects (personal observations of the first author)). If legacy sediments have to be removed from valley bottoms [73] and if they are not contaminated, one potential opportunity could be to spread them back on croplands. After all, legacy sediments are the silt and clay-rich topsoil of precolonial America. Their use would particularly be beneficial on cropland soils saturated with decades of fertilizer applications of P, also referred to as legacy P [62,74]. Legacy sediments may be able to mitigate the pollution potential of these P-rich soils via sorption and P sequestration.
Given the various source-sink P mechanisms highlighted in this study, watershed P budgets, models, and regulatory assessments will have to account for the inputs of sediment-bound P with bank erosion of legacy sediments, the sorption capacity of these sediments in the fluvial system under oxic conditions (thus removal of solution P via by sediments), stream water P concentrations and the P sorption-desorption potential, and the release of P from sediments into solution under anoxic conditions. The magnitude of each of these processes would likely vary spatially along the length of the drainage network, from the headwaters to the bays. Assessing the net effect of legacy sediments on aquatic P would thus require a spatially-distributed, integrated, quantitative assessment or model of each of these processes over the drainage network. Characterizing the role of legacy sediments for fluvial P budgets will become more important and urgent given that climate intensification of storm events and other processes could potentially affect the erosion and inputs of these sediments into aquatic ecosystems [75]. Understanding and quantifying this variability and targeting P hotspots with appropriate best management practices (BMPs) will be key to achieving the P reduction goals established by the Chesapeake Bay and other watershed programs.
4. Conclusions
Using measured P concentrations and a variety of P indices, we investigated the potential for legacy sediments to act as a source or a sink of P in aquatic ecosystems. This study shows that streambank legacy sediments have low P concentrations and large capacity for P sorption. Overall, under oxic conditions and in streams with moderate to elevated P (in excess of sediment EPC0 values, e.g., agricultural and urban streams), legacy sediments will likely serve as a net sink for P. However, legacy sediments could release P and become a net source under low stream water P conditions and/or anoxic sediment conditions due to reductive dissolution of iron oxides. Thus, the net source-sink effect for P at the catchment or drainage network scale will have to be assessed by accounting for the spatial variability in source-sink behavior with stream water P and redox conditions. Understanding these processes and the balance of these fluxes is critical to understanding the impact of legacy sediments on aquatic ecosystems. Whether they serve as P sources or sink, legacy sediments and the processes described herein need to be considered in nutrient budgets and watershed models that are being implemented to assign BMPs and meet regulatory load reductions for water quality.
Author Contributions
Conceptualization, S.I. and N.S.; methodology, N.S., A.L., and G.J.; formal analysis, N.S.; writing—original draft preparation, S.I. and N.S.; writing—review and editing, S.I., N.S., A.L., G.J., and J.K.; funding acquisition, S.I. and J.K. All authors have read and agreed to the published version of the manuscript.
Funding
Funding for this project was provided by the US Department of Agriculture via grant # USDA-NIFA 2017-67019-26330.
Acknowledgments
We thank the Fair Hill Natural Resources Management Area staff and the University of Delaware Soils Testing Lab for their analytical support. We also recognize the guidance of Maria Pautler and Karen Gartley on the P test indices.
Conflicts of Interest
The authors declare no conflict of interest.
References
- Correll, D.L. The Role of Phosphorus in the Eutrophication of Receiving Waters: A Review. J. Environ. Qual. 1998, 27, 261–266. [Google Scholar] [CrossRef] [Green Version]
- Kleinman, P.J.A.; Fanelli, R.M.; Hirsch, R.M.; Buda, A.R.; Easton, Z.M.; Wainger, L.A.; Brosch, C.; Lowenfish, M.; Collick, A.S.; Shirmohammadi, A.; et al. Phosphorus and the Chesapeake Bay: Lingering Issues and Emerging Concerns for Agriculture. J. Environ. Qual. 2019, 48, 1191–1203. [Google Scholar] [CrossRef] [PubMed] [Green Version]
- Smil, V. Phosphorus in the environment: Natural Flows and Human Interferences. Annu. Rev. Energy Environ. 2000, 25, 53–88. [Google Scholar] [CrossRef] [Green Version]
- Henley, W.F.; Patterson, M.A.; Neves, R.J.; Lemly, A.D. Effects of Sedimentation and Turbidity on Lotic Food Webs: A Concise Review for Natural Resource Managers. Rev. Fish. Sci. 2000, 8, 125–139. [Google Scholar] [CrossRef] [Green Version]
- Smith, V.H. Eutrophication of freshwater and coastal marine ecosystems a global problem. Environ. Sci. Pollut. Res. 2003, 10, 126–139. [Google Scholar] [CrossRef]
- Goldes, S.A.; Ferguson, H.W.; Moccia, R.D.; Daoust, P. Histological effects of the inert suspended clay kaolin on the gills of juvenile rainbow trout, Salmo gairdneri Richardson. J. Fish Dis. 1988, 11, 23–33. [Google Scholar] [CrossRef]
- Waters, T.F. Sediment in Streams. Sources, Biological Effects, and Control; American Fisheries Society: Bethesda, MD, USA, 1995; Monograph 7; p. 251. [Google Scholar]
- Chesapeake Bay TMDL Document. Available online: https://www.epa.gov/chesapeake-bay-tmdl/chesapeake-bay-tmdl-document (accessed on 10 May 2020).
- Kaufman, Z.; Abler, D.; Shortle, J.; Harper, J.; Hamlett, J.; Feather, P. Agricultural Costs of the Chesapeake Bay Total Maximum Daily Load. Environ. Sci. Technol. 2014, 48, 14131–14138. [Google Scholar] [CrossRef]
- Fanelli, R.M.; Blomquist, J.D.; Hirsch, R.M. Point sources and agricultural practices control spatial-temporal patterns of orthophosphate in tributaries to Chesapeake Bay. Sci. Total Environ. 2019, 652, 422–433. [Google Scholar] [CrossRef]
- Fox, G.A.; Purvis, R.A.; Penn, C.J. Streambanks: A net source of sediment and phosphorus to streams and rivers. J. Environ. Manag. 2016, 181, 602–614. [Google Scholar] [CrossRef] [Green Version]
- Zaimes, G.N.; Schultz, R.C.; Isenhart, T.M. Streambank Soil and Phosphorus Losses under Different Riparian Land-Uses in Iowa1. J. Am. Water Resour. Assoc. 2008, 44, 935–947. [Google Scholar] [CrossRef]
- James, L.A. Legacy sediment: Definitions and processes of episodically produced anthropogenic sediment. Anthropocene 2013, 2, 16–26. [Google Scholar] [CrossRef]
- Walter, R.C.; Merritts, D.J. Natural Streams and the Legacy of Water-Powered Mills. Science 2008, 319, 299–304. [Google Scholar] [CrossRef] [Green Version]
- Miller, A.; Baker, M.; Boomer, K.; Merritts, D.; Prestegaard, K.; Smith, S. Legacy Sediment, Riparian Corridors, and Total Maximum Daily Loads; STAC Publication Number 19-001: Edgewater, MD, USA, 2019; p. 64. [Google Scholar]
- Johnson, K.M.; Snyder, N.P.; Castle, S.; Hopkins, A.J.; Waltner, M.; Merritts, D.J.; Walter, R.C. Legacy sediment storage in New England river valleys: Anthropogenic processes in a postglacial landscape. Geomorphology 2019, 327, 417–437. [Google Scholar] [CrossRef]
- Merritts, D.; Walter, R.; Rahnis, M.; Hartranft, J.; Cox, S.; Gellis, A.; Poter, N.; Hilgartner, W.; Langland, M.; Manion, L.; et al. Anthropocene streams and base-level controls from historic dams in the unglaciated mid-Atlantic region, USA. Philos. Trans. Math. Phys. Eng. Sci. 2011, 369, 976–1009. [Google Scholar] [CrossRef] [PubMed]
- Wegmann, K.; Lewis, R.; Hunt, M. Historic mill ponds and piedmont stream water quality: Making the connection near Raleigh, North Carolina. In From the Blue Ridge to the Coastal Plain: Field Excursions in the Southeastern United States: Geological Society of America Field Guide; Geological Society of America: Boulder, CO, USA, 2012. [Google Scholar]
- Cashman, M.J.; Gellis, A.; Sanisaca, L.G.; Noe, G.B.; Cogliandro, V.; Baker, A. Bank-derived material dominates fluvial sediment in a suburban Chesapeake Bay watershed. River Res. Appl. 2018, 34, 1032–1044. [Google Scholar] [CrossRef]
- Gellis, A.; Noe, G. Sediment source analysis in the Linganore Creek watershed, Maryland, USA, using the sediment fingerprinting approach: 2008 to 2010. J. Soils Sediments 2013, 13, 1735–1753. [Google Scholar] [CrossRef]
- Jiang, G.; Lutgen, A.; Sienkiewicz, N.; Mattern, K.; Kan, J.; Inamdar, S. Streambank legacy sediment contributions to sediment-bound nutrient yields from a Mid-Atlantic, Piedmont Watershed. J. Am. Water Resour. Assoc. 2020, in press. [Google Scholar]
- Lutgen, A.; Jiang, G.; Siekiewicz, N.; Mattern, K.; Kan, J.; Inamdar, S. Nutrients and Heavy Metals in Legacy Sediments: Concentrations, Comparisons with Upland Soils, and Implications for Water Quality. J. Am. Water Resour. Assoc. 2020, in press. [Google Scholar] [CrossRef]
- Walter, R.; Merritts, D.; Rahnis, M. Estimating volume, nutrient content, and rates of stream bank erosion of legacy sediment in the Piedmont and Valley and Ridge Physiographic provinces of southeastern and central PA. In Report to the Pennsylvania Department of Environmental Protection, Lancaster, Pennsylvania; Franklin and Marshall: Lancaster, PA, USA, 2007. [Google Scholar]
- Niemitz, J.; Haynes, C.; Lasher, G. Legacy sediments and historic land use: Chemostratigraphic evidence for excess nutrient and heavy metal sources and remobilization. Geology 2013, 41, 47–50. [Google Scholar] [CrossRef]
- Lammers, R.W.; Bledsoe, B.P. What role does stream restoration play in nutrient management? Crit. Rev. Environ. Sci. Technol. 2017, 47, 335–371. [Google Scholar] [CrossRef]
- Fleming, P.M.; Merritts, D.J.; Walter, R.C. Legacy sediment erosion hot spots: A cost-effective approach for targeting water quality improvements. J. Soil Water Conserv. 2019, 74, 67A–73A. [Google Scholar] [CrossRef] [Green Version]
- Sims, J.T.; Maguire, R.O.; Leytem, A.B.; Gartley, K.L.; Pautler, M.C. Evaluation of Mehlich 3 as an Agri-Environmental Soil Phosphorus Test for the Mid-Atlantic United States of America. Soil Sci. Soc. Am. J. 2002, 66, 2016–2032. [Google Scholar] [CrossRef]
- Sienkiewicz, N. Microbial Characteristics and Fate of Legacy Sediments in Mid-Atlantic Streams. Master’s Thesis, University of Delaware, Newark, DE, USA, 2019. [Google Scholar]
- Nair, V.D.; Reddy, K.R. Phosphorus Sorption and Desorption in Wetland Soils. In Methods in Biogeochemistry of Wetlands; American Society of Agronomy and Soil Science Society of America: Madison, WI, USA, 2013; pp. 667–681. [Google Scholar]
- Haggard, B.; Sharpley, A. Phosphorus Transport in Streams: Processes and Modeling Considerations. In Modeling Phosphorus in the Environment; Radcliffe, D., Carbrera, M., Eds.; CRC Press: Boca Raton, FL, USA, 2007; pp. 105–130. [Google Scholar]
- McDaniel, M.D.; David, M.B.; Royer, T.V. Relationships between Benthic Sediments and Water Column Phosphorus in Illinois Streams. J. Environ. Qual. 2009, 38, 607–617. [Google Scholar] [CrossRef]
- Young, E.O.; Ross, D.S. Phosphate Release from Seasonally Flooded Soils: A Laboratory Microcosm Study. J. Environ. Qual. 2001, 30, 91–101. [Google Scholar] [CrossRef]
- Sienkiewicz, N.; Bier, R.L.; Wang, J.; Zgleszewski, L.; Lutgen, A.; Jiang, G.; Mattern, K.; Inamdar, S.; Kan, J. Bacterial communities and nitrogen transformation genes in streambank legacy sediments and implications for biogeochemical processing. Biogeochemistry 2020, in press. [Google Scholar] [CrossRef]
- Kovar, J.; Pierzynski, G. Methods of Phosphorus Analysis for Soils, Sediments, Residuals, and Waters; Southern Cooperative Series Bulletin; Virginia Tech University: Blacksburg, VA, USA, 2009. [Google Scholar]
- Bache, B.W.; Williams, E.G. A phosphate sorption index for soils. J. Soil Sci. 1971, 22, 289–301. [Google Scholar] [CrossRef]
- Hongthanat, N.; Kovar, J.L.; Thompson, M.L.; Russell, J.R.; Isenhart, T.M. Phosphorus source-sink relationships of stream sediments in the Rathbun Lake watershed in southern Iowa, USA. Environ. Monit. Assess. 2016, 188, 453. [Google Scholar] [CrossRef] [Green Version]
- House, W.A.; Denison, F.H. Factors influencing the measurement of equilibrium phosphate concentrations in river sediments. Water Res. 2000, 34, 1187–1200. [Google Scholar] [CrossRef]
- Jiang, G. Stream Bank Legacy Sediment Contributions to Suspended Sediment and Nutrient Exports from a Mid-Atlantic Piedmont Watershed. Master’s Thesis, University of Delaware, Newark, DE, USA, 2019. [Google Scholar]
- McDowell, R.W.; Sharpley, A.N. A Comparison of Fluvial Sediment Phosphorus (P) Chemistry in Relation to Location and Potential to Influence Stream P Concentrations. Aquat. Geochem. 2001, 7, 255. [Google Scholar] [CrossRef]
- Rahutomo, S.; Kovar, J.; Kovar, J.; Thompson, M.; Thompson, M. Phosphorus transformations in stream bank sediments in Iowa, USA, at varying redox potentials. J. Soils Sediments 2019, 19, 1029–1039. [Google Scholar] [CrossRef] [Green Version]
- Perillo, V.L.; Ross, D.S.; Wemple, B.C.; Balling, C.; Lemieux, L.E. Stream Corridor Soil Phosphorus Availability in a Forested-Agricultural Mixed Land Use Watershed. J. Environ. Qual. 2019, 48, 185–192. [Google Scholar] [CrossRef] [Green Version]
- Ishee, E.R.; Ross, D.S.; Garvey, K.M.; Bourgault, R.R.; Ford, C.R. Phosphorus Characterization and Contribution from Eroding Streambank Soils of Vermont’s Lake Champlain Basin. J. Environ. Qual. 2015, 44, 1745–1753. [Google Scholar] [CrossRef] [Green Version]
- McDowell, R.; Simpson, Z.; Simpson, Z.; Stenger, R.; Stenger, R.; Depree, C.; Depree, C. The influence of a flood event on the potential sediment control of baseflow phosphorus concentrations in an intensive agricultural catchment. J. Soils Sediments 2019, 19, 429–438. [Google Scholar] [CrossRef]
- Reddy, K.R.; Kadlec, R.H.; Flaig, E.; Gale, P.M. Phosphorus Retention in Streams and Wetlands: A Review. Crit. Rev. Environ. Sci. Technol. 1999, 29, 83–146. [Google Scholar] [CrossRef]
- Young, E.O.; Ross, D.S. Total and Labile Phosphorus Concentrations as Influenced by Riparian Buffer Soil Properties. J. Environ. Qual. 2016, 45, 294–304. [Google Scholar] [CrossRef]
- Mozaffari, M.; Sims, J.T. Phosphorus availability and sorption in an Atlantic coastal plain watershed dominated by animal-based agriculture. Soil Sci. 1994, 157, 97–107. [Google Scholar] [CrossRef]
- Sobotka, M. Legacy Sediments in Streams—Effects on Nutrient Partitioning during Simulated Re-Suspension Events. Master’s Thesis, Virginia Commonwealth University, Richmond, VA, USA, 2011. [Google Scholar]
- Grundtner, A.; Gupta, S.; Bloom, P. River bank materials as a source and as carriers of phosphorus to lake pepin. J. Environ. Qual. 2014, 43, 1991–2001. [Google Scholar] [CrossRef]
- Roberts, E.J.; Cooper, R.J. Riverbed sediments buffer phosphorus concentrations downstream of sewage treatment works across the River Wensum catchment, UK. J. Soils Sediments 2018, 18, 2107–2116. [Google Scholar] [CrossRef] [Green Version]
- Rahutomo, S.; Kovar, J.L.; Thompson, M.L. Varying redox potential affects P release from stream bank sediments. PLoS ONE 2018, 13, e0209208. [Google Scholar] [CrossRef]
- Ekka, S.A.; Haggard, B.E.; Matlock, M.D.; Chaubey, I. Dissolved phosphorus concentrations and sediment interactions in effluent–dominated Ozark streams. Ecol. Eng. 2006, 26, 375–391. [Google Scholar] [CrossRef]
- Jarvie, H.P.; Jürgens, M.D.; Williams, R.J.; Neal, C.; Davies, J.J.L.; Barrett, C.; White, J. Role of river bed sediments as sources and sinks of phosphorus across two major eutrophic UK river basins: The Hampshire Avon and Herefordshire Wye. J. Hydrol. 2005, 304, 51–74. [Google Scholar] [CrossRef]
- Young, E.O.; Ross, D.S. Phosphorus Mobilization in Flooded Riparian Soils from the Lake Champlain Basin, VT, USA. Front. Environ. Sci. 2018. [Google Scholar] [CrossRef]
- Rodens, E.; Edmonds, J. Phosphate Mobilization in Iron-Rich Anaerobic Sediments: Microbial Fe(III) Oxide Reduction Versus Iron-Sulfide Formation. Arch. Hydrobiol. 1997, 139, 347–378. [Google Scholar]
- Chambers, R.M.; Odum, W.E. Porewater oxidation, dissolved phosphate and the iron curtain. Biogeochemistry 1990, 10, 37–52. [Google Scholar] [CrossRef]
- Kumaragamage, D.; Concepcion, A.; Gregory, C.; Goltz, D.; Indraratne, S.; Amarawansha, G. Temperature and freezing effects on phosphorus release from soils to overlying floodwater under flooded-anaerobic conditions. J. Environ. Qual. 2020. [Google Scholar] [CrossRef]
- Vidon, P.; Allan, C.; Burns, D.; Duval, T.; Gurwick, N.; Inamdar, S.; Lowrance, R.; Okay, J.; Scott, D.; Sebestyen, S. Hot Spots and Hot Moments in Riparian Zones: Potential for Improved Water Quality Management. J. Am. Water Resour. Assoc. 2010, 46, 278–298. [Google Scholar] [CrossRef]
- Zhang, J.; Huang, X. Effect of Temperature and Salinity on Phosphate Sorption on Marine Sediments. Environ. Sci. Technol. 2011, 45, 6831–6837. [Google Scholar] [CrossRef]
- Upreti, K.; Joshi, S.R.; McGrath, J.; Jaisi, D.P. Factors Controlling Phosphorus Mobilization in a Coastal Plain Tributary to the Chesapeake Bay. Soil Sci. Soc. Am. J. 2015, 79, 826–837. [Google Scholar] [CrossRef] [Green Version]
- Baldwin, D.S.; Mitchell, A.M. The effects of drying and re-flooding on the sediment and soil nutrient dynamics of lowland river–floodplain systems: A synthesis. Regul. Rivers Res. Manag. 2000, 16, 457–467. [Google Scholar] [CrossRef]
- Records, R.M.; Wohl, E.; Arabi, M. Phosphorus in the river corridor. Earth Sci. Rev. 2016, 158, 65–88. [Google Scholar] [CrossRef] [Green Version]
- Sharpley, A.; Jarvie, H.P.; Buda, A.; May, L.; Spears, B.; Kleinman, P. Phosphorus Legacy: Overcoming the Effects of Past Management Practices to Mitigate Future Water Quality Impairment. J. Environ. Qual. 2013, 42, 1308–1326. [Google Scholar] [CrossRef] [Green Version]
- Noe, G.B.; Boomer, K.; Gillespie, J.L.; Hupp, C.R.; Martin-Alciati, M.; Floro, K.; Schenk, E.R.; Jacobs, A.; Strano, S. The effects of restored hydrologic connectivity on floodplain trapping vs. release of phosphorus, nitrogen, and sediment along the Pocomoke River, Maryland USA. Ecol. Eng. 2019, 138, 334–352. [Google Scholar] [CrossRef]
- Garnache, C. Solving the phosphorus pollution puzzle. Am. J. Agric. Econ. 2016, 98, 1334–1359. [Google Scholar] [CrossRef] [Green Version]
- Merritts, D.; Walter, R.; Rahnis, M.; Cox, S.; Hartranft, J.; Scheid, C.; Potter, N.; Jenschke, M.; Reed, A.; Matuszewski, D.; et al. The rise and fall of Mid-Atlantic streams: Millpond sedimentation, milldam breaching, channel incision, and stream bank erosion. Geol. Soc. Am. Rev. Eng. Geol. 2013, XXI, 183–203. [Google Scholar]
- Foley, M.M.; Bellmore, J.R.; O’Connor, J.E.; Duda, J.J.; East, A.E.; Grant, G.E.; Anderson, C.W.; Bountry, J.A.; Collins, M.J.; Connolly, P.J.; et al. Dam removal: Listening in. Water Resour. Res. 2017, 53, 5229–5246. [Google Scholar] [CrossRef]
- Ryan Bellmore, J.; Duda, J.J.; Craig, L.S.; Greene, S.L.; Torgersen, C.E.; Collins, M.J.; Vittum, K. Status and trends of dam removal research in the United States. Wiley Interdiscip. Rev. Water 2017, 4, e1164. [Google Scholar] [CrossRef]
- Tonitto, C.; Riha, S. Planning and implementing small dam removals: Lessons learned from dam removals across the eastern United States. Sustain. Water Resour. Manag. 2016, 2, 489–507. [Google Scholar] [CrossRef] [Green Version]
- Tullos, D.D.; Collins, M.J.; Bellmore, J.R.; Bountry, J.A.; Connolly, P.J.; Shafroth, P.B.; Wilcox, A.C. Synthesis of Common Management Concerns Associated with Dam Removal. J. Am. Water Resour. Assoc. 2016, 52, 1179–1206. [Google Scholar] [CrossRef]
- Palmer, M.A.; Hondula, K.L.; Koch, B.J. Ecological Restoration of Streams and Rivers: Shifting Strategies and Shifting Goals. Annu. Rev. Ecol. Evol. Syst. 2014, 45, 247–269. [Google Scholar] [CrossRef] [Green Version]
- Newcomer Johnson, T.; Kaushal, S.; Mayer, P.; Smith, R.; Sivirichi, G. Nutrient Retention in Restored Streams and Rivers: A Global Review and Synthesis. Water 2016, 8, 116. [Google Scholar] [CrossRef] [Green Version]
- Filoso, S.; Palmer, M.A. Assessing stream restoration effectiveness at reducing nitrogen export to downstream waters. Ecol. Appl. 2011, 21, 1989–2006. [Google Scholar] [CrossRef] [PubMed]
- Hartranft, J.; Merritts, D.; Walter, R.; Rahnis, M. The Big Spring Run Restoration Experiment: Policy, Geomorphology, and Aquatic Ecosystems in the Big Spring Run Watershed, Lancaster County, PA. Sustain 2011, 24, 24–30. [Google Scholar]
- Jarvie, H. Murky waters: Phosphorus mitigation to control river eutrophication. J. Environ. Qual. 2013, 42, 295–304. [Google Scholar] [CrossRef] [PubMed]
- Inamdar, S.; Johnson, E.; Rowland, R.; Warner, D.; Walter, R.; Merritts, D. Freeze–thaw processes and intense rainfall: The one-two punch for high sediment and nutrient loads from mid-Atlantic watersheds. Biogeochemistry 2018, 141, 333–349. [Google Scholar] [CrossRef] [Green Version]
Figure 1.
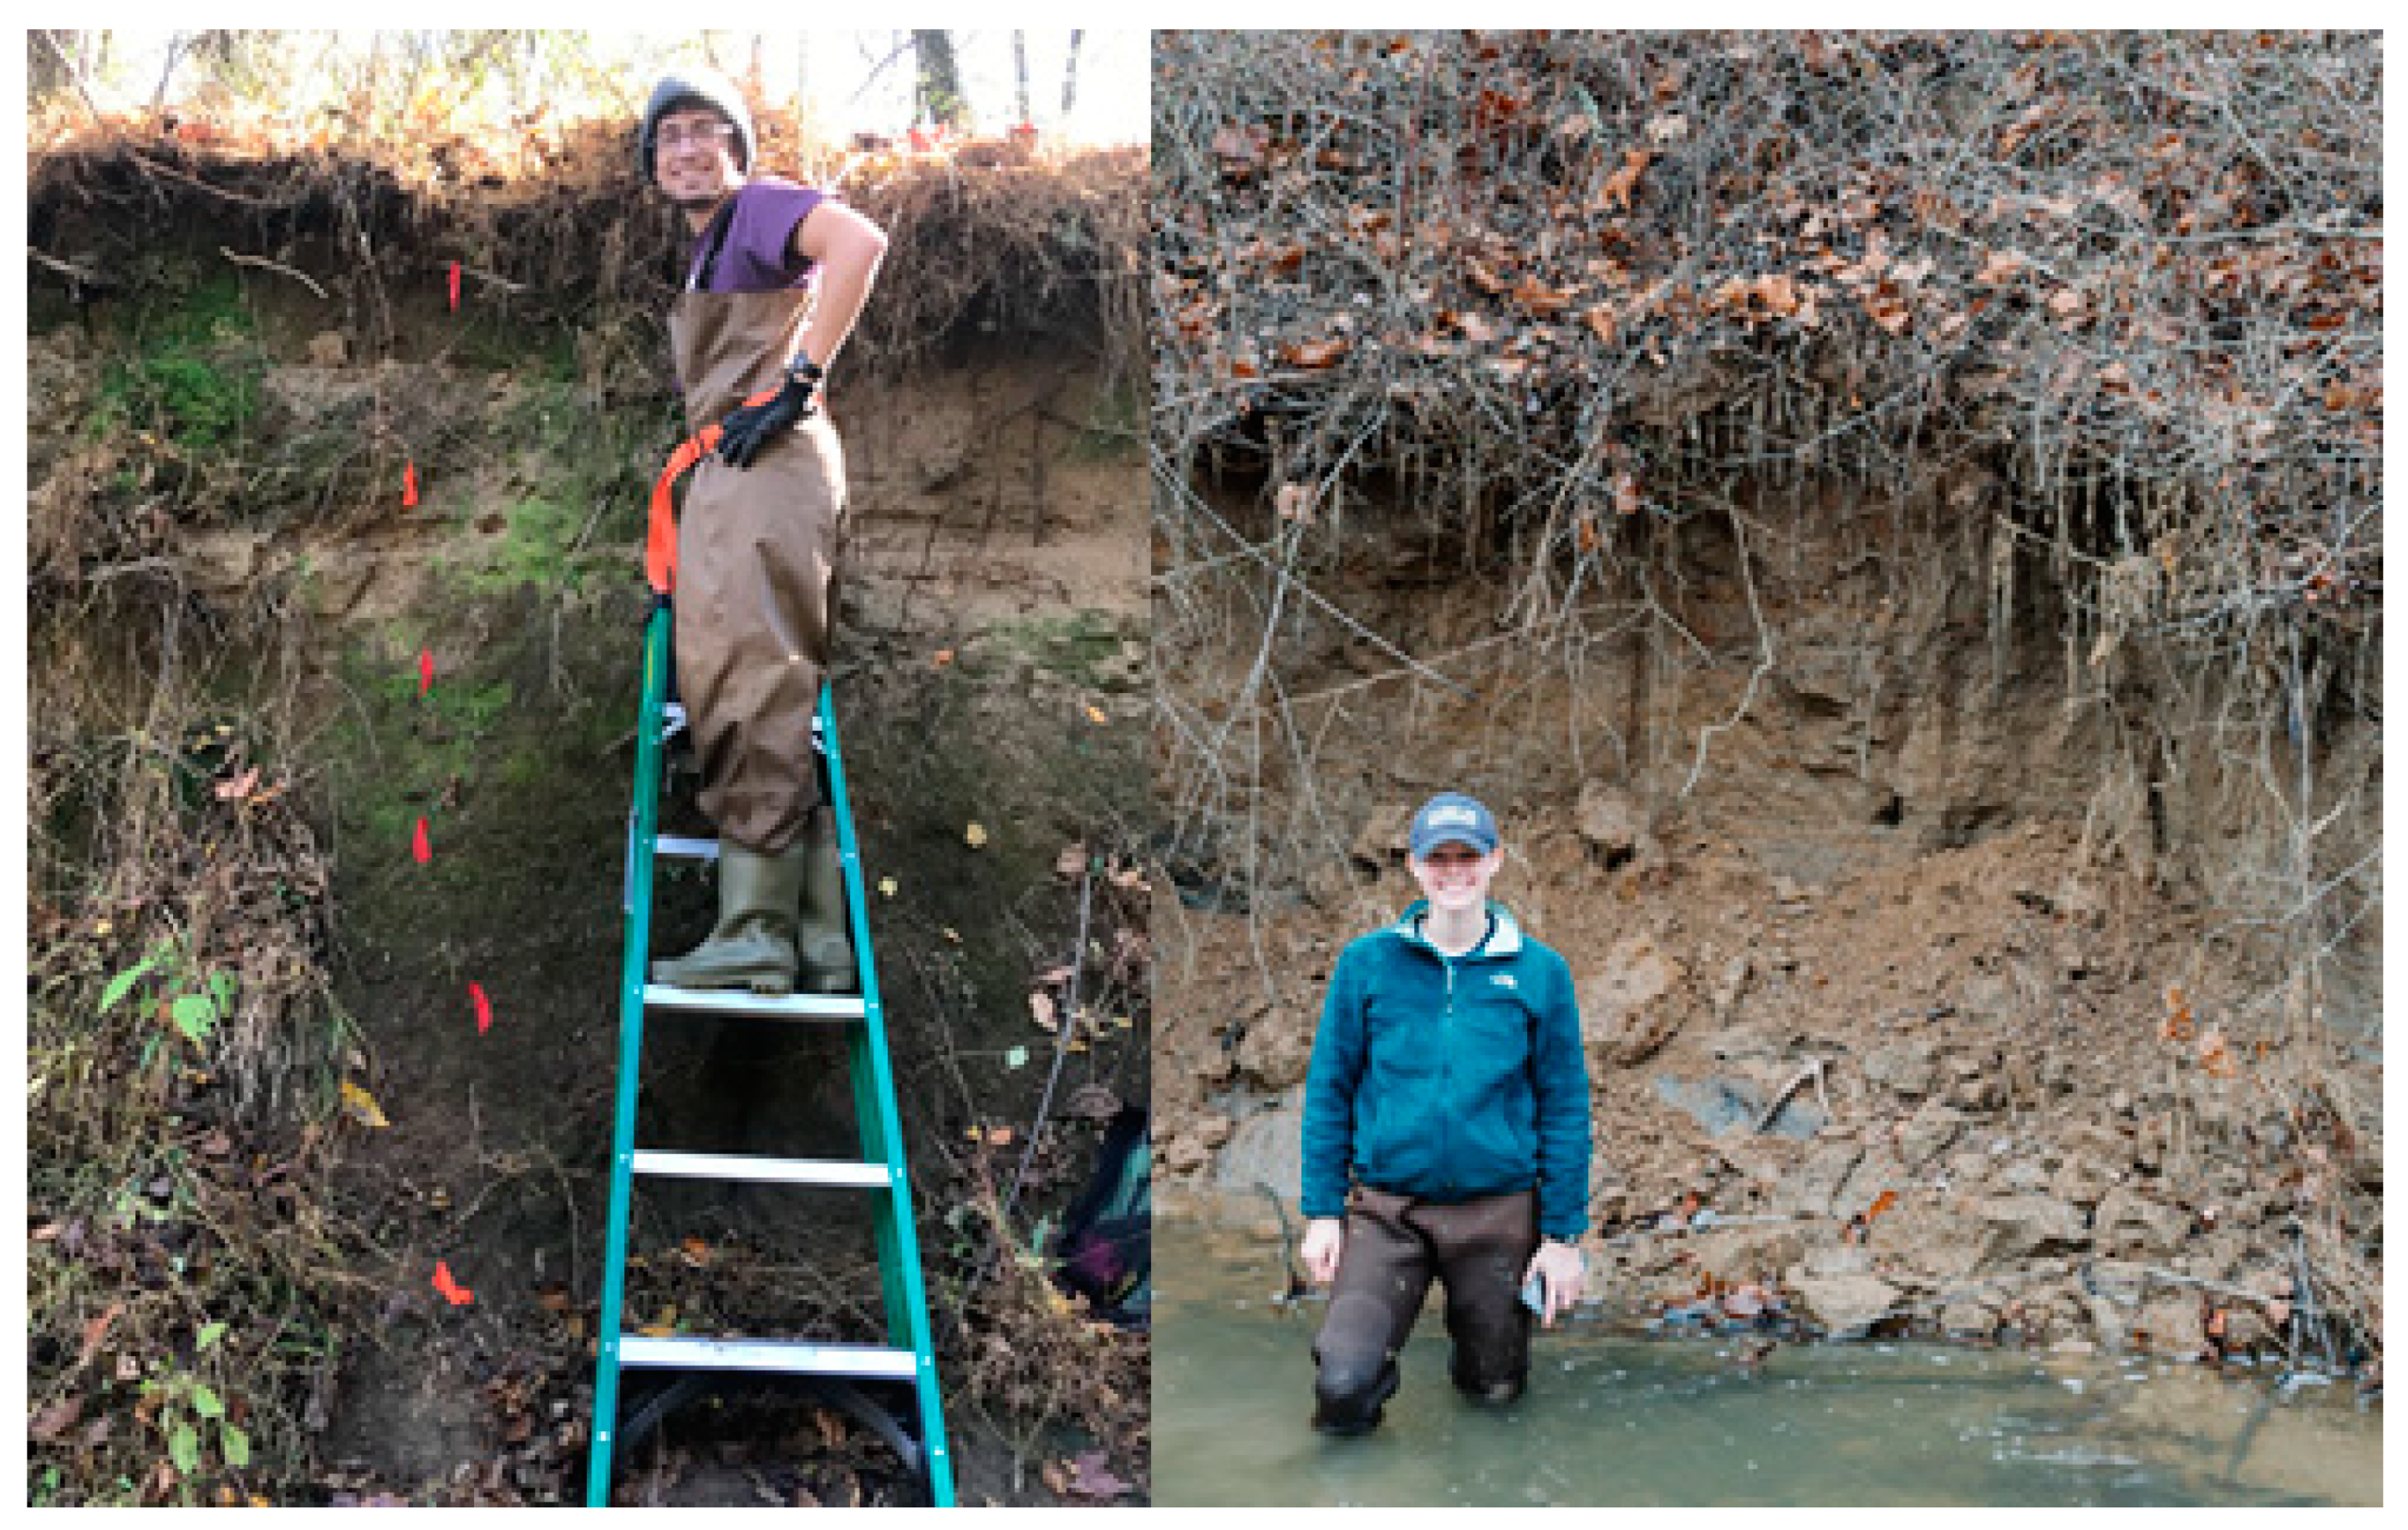
Examples of two streambank legacy sediment sites of the 15 sampled in this study which were upstream of now breached mill dams. Left: Nate Sienkiewicz at the streambank at Nature Center Beach (NCB; bank height 2.59 m). Red flags indicate locations for bank sampling. Right: Alyssa Lutgen in front of the eroding/slumping streambank at Scotts Mill Dam (SM2; bank height 2.74 m).
Figure 1.
Examples of two streambank legacy sediment sites of the 15 sampled in this study which were upstream of now breached mill dams. Left: Nate Sienkiewicz at the streambank at Nature Center Beach (NCB; bank height 2.59 m). Red flags indicate locations for bank sampling. Right: Alyssa Lutgen in front of the eroding/slumping streambank at Scotts Mill Dam (SM2; bank height 2.74 m).

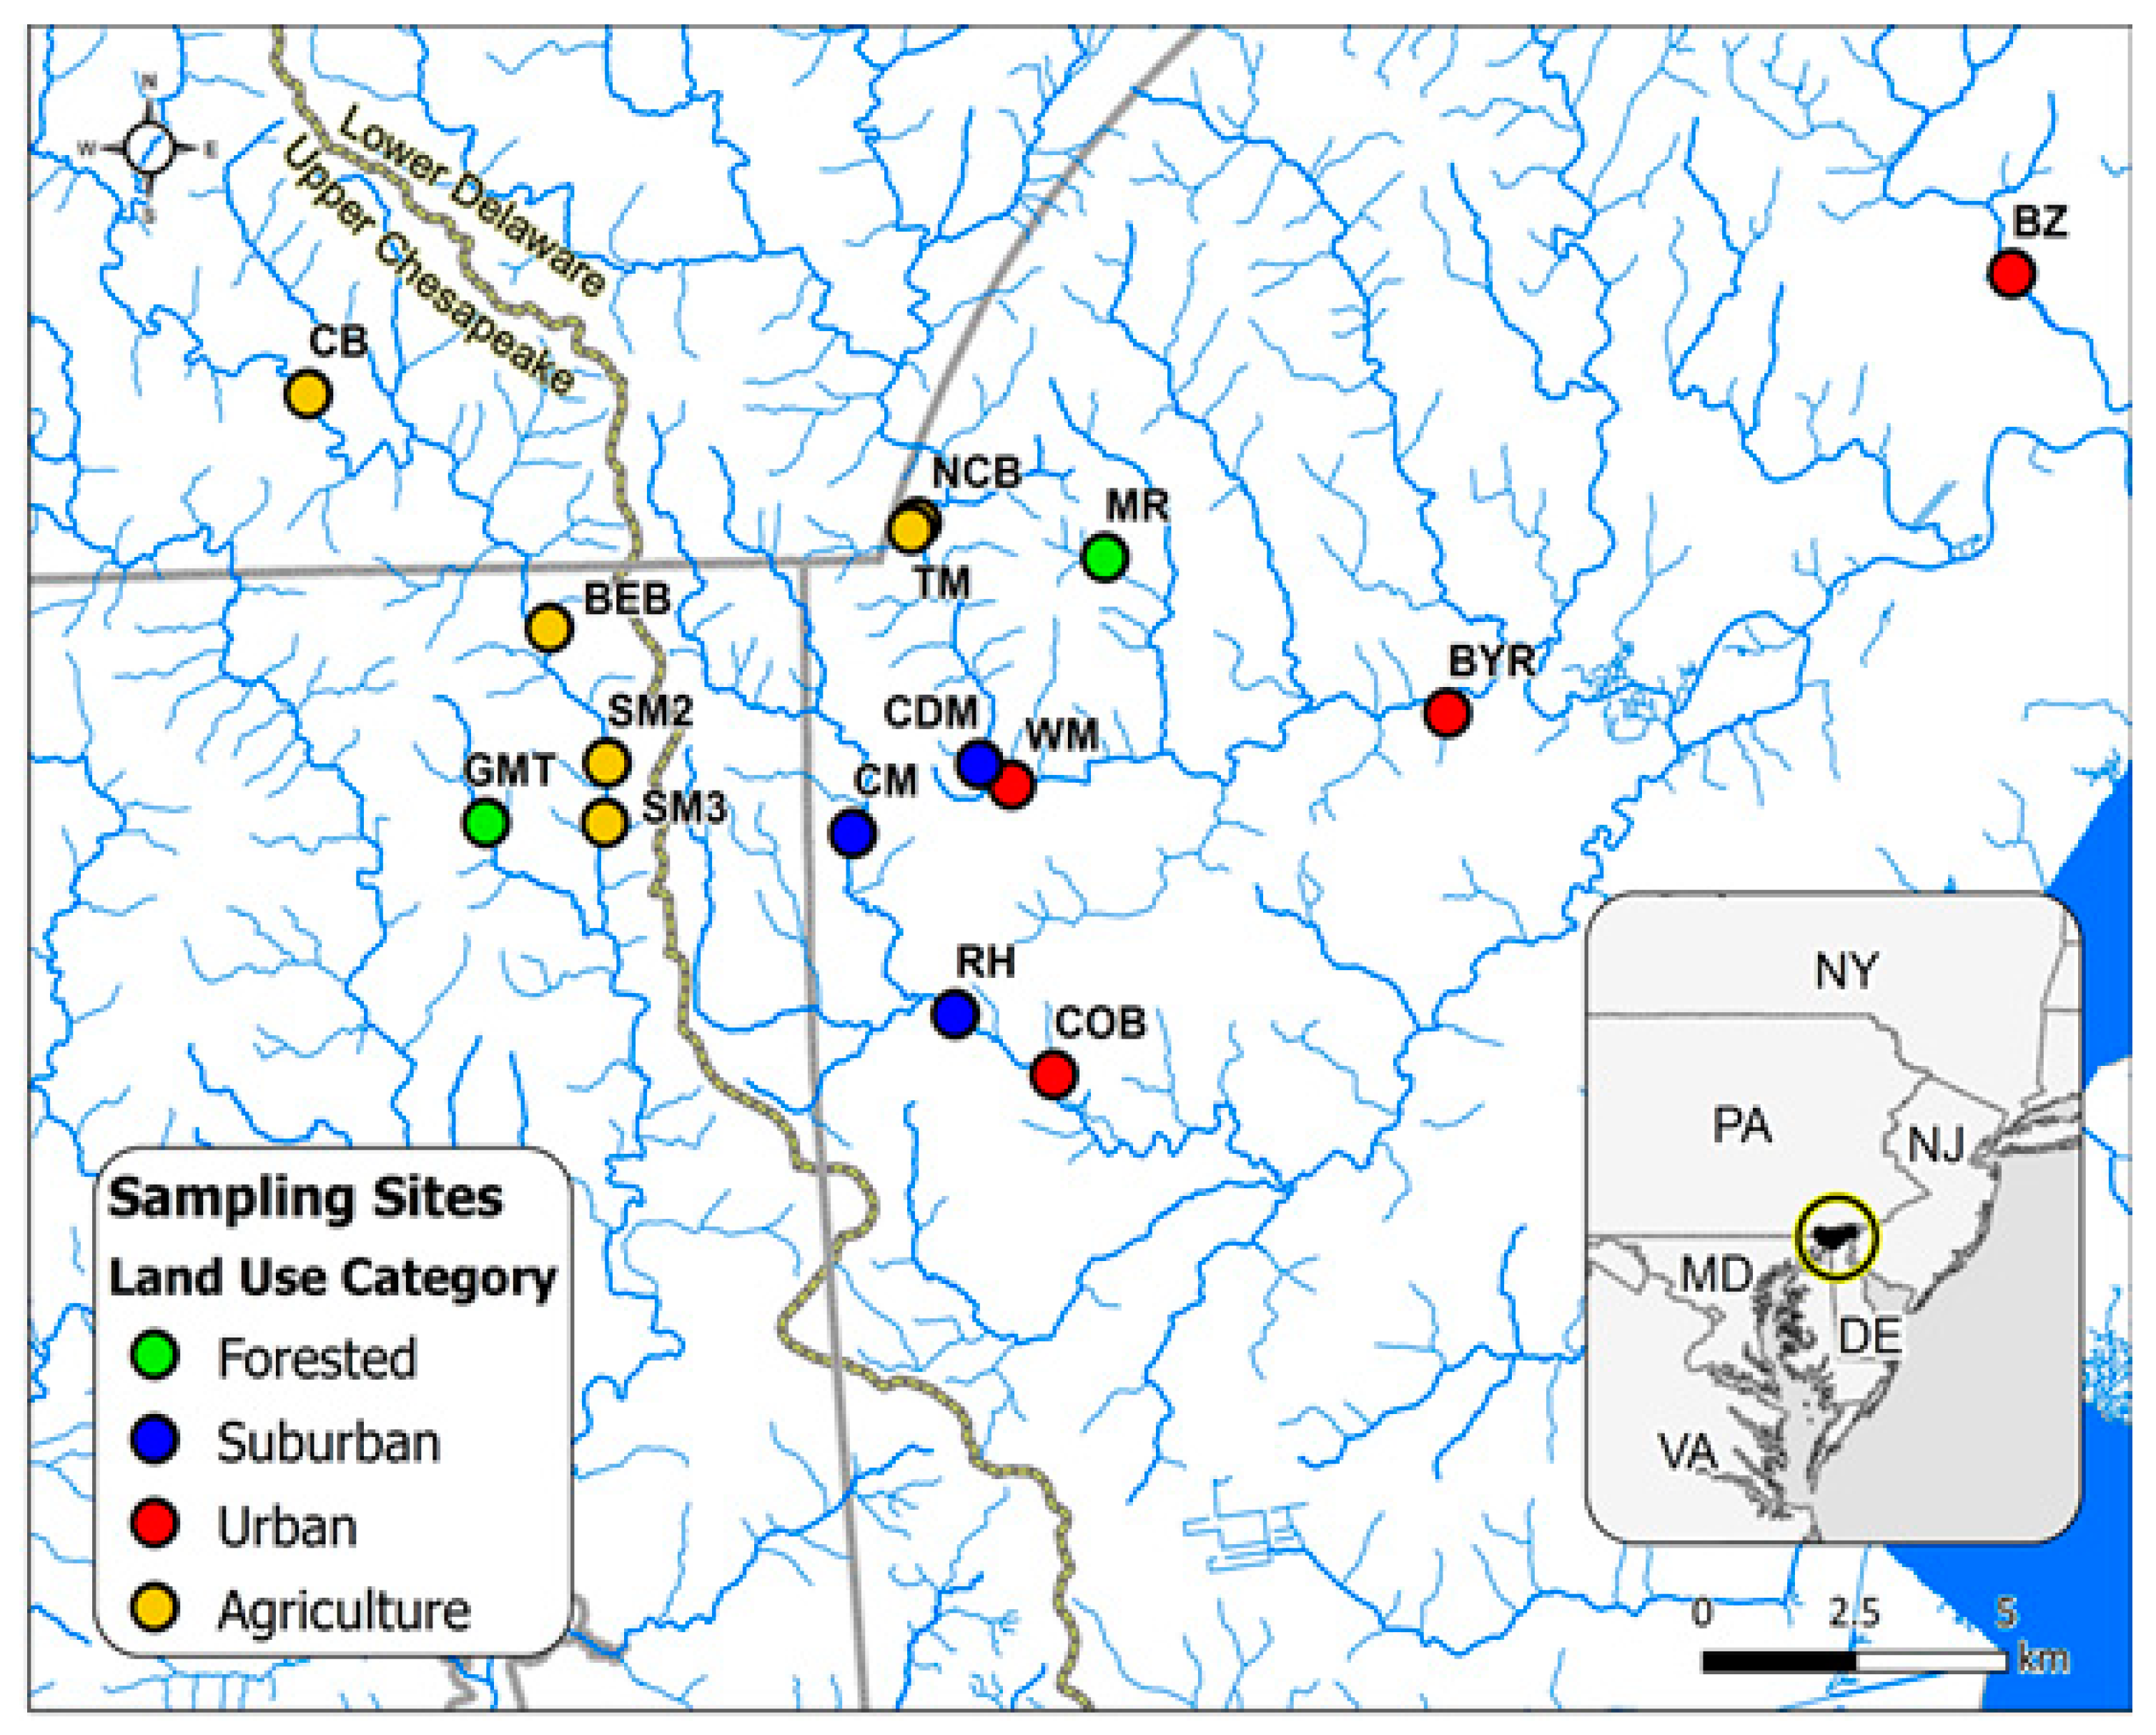
Figure 2.
Map showing locations of 15 stream bank sampling sites for legacy sediments across Delaware, Maryland, and Pennsylvania. These sites included: BEB = Big Elk Bridge (Agriculture), CB = Camp Bonsul (Agriculture), NCB = Nature Center Beach (Agriculture), SM2 = Scott’s Mill 2 (Agriculture), SM3 = Scott’s Mill 3 (Agriculture), TM = Tweed’s Mill (Agriculture), RH = Cottage Mill (Suburban), CM = Casho Mill (Suburban), CDM = Cider Mill (Suburban), BZ = Brandywine Zoo (Urban), BYR = Byrnes Mill (Urban), COB = Cooch’s Bridge (Urban), GMT = Gramies Run (Forested) and MR = Middle Run (Forested). Inset: Location of study sites in the mid-Atlantic tristate area.

Figure 3.
Solution PO43−P (mg P L−1) concentrations after 24-hour incubation for coarse fraction and fine fraction sediments. The dashed line represents the starting solution concentration (75 mg PO43−P L−1). Larger decreases below this value indicate greater sorption by sediments. The labels on the x-axis include site name and bank sampling depth in cm.

Figure 4.
Comparison of sediment EPC0 values for four depths for stream bank site BEB against stream water PO43− concentrations over the period August 2017 to July 2018. Sediment sampling was done only one time in October–November 2017. EPC0 values for four depths 60, 122, 183, and 260 cm from the top were 0.032, 0.028, 0.002, and 0.032, respectively.

Figure 5.
Solution PO43− concentrations after a 24-hour incubation of P-sorbed legacy sediments in oxic and anoxic conditions. Site IDs along with their depths (in cm) are listed. Solution PO43− concentrations under anoxic conditions (mean = 1.40 ± 0.32 mg P L−1) for sediment treatments were significantly greater (t-test, p < 0.001) than those measured under oxic conditions (mean = 0.26 ± 0.19 mg P L−1). Control treatment did not contain any sediments.

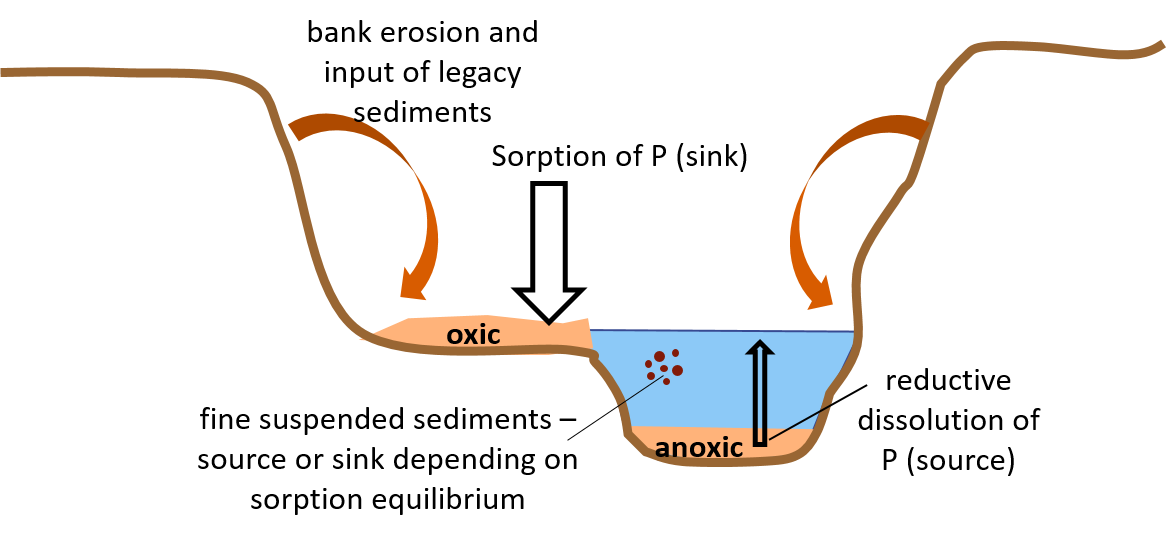
Figure 6.
Conceptual model illustrating how stream bank legacy sediments could act as either a source or sink for P at various fluvial positions. Sorption (P sink) could occur on oxygenated floodplains if sediment EPC0 values are below stream water P concentrations. In contrast, sediments could become a source of P due to reductive dissolution of iron oxides under anoxic conditions or when EPC0 values are greater than stream water P concentrations. Deposition of legacy sediments in the channel could occur due to fluvial and/or subaerial bank erosion or mass wasting of the bank material.


Table 1.
Comparison of legacy sediment P concentrations against other soil/sediment sources. Comparisons are made for particle size class (<63 μm: fine), coarse, and bulk sediments. Concentrations include a range of values and mean in brackets ( ). Where available, sample numbers are indicated in square brackets [ ]. Table modified from [22].
| Reference | Sample Description | Grain Size (μm) | P (mg/kg) | M3-P (mg/kg) | % DPS |
|---|---|---|---|---|---|
| [22] | streambank legacy sediment | <63 | 80–1293 | 0.25–52.8 | 4.6–16 |
| [67] | (551) | (11.8) | (6.8) | ||
| >63 | 25–668 | 0.51–48.8 | 4.7–19.7 | ||
| [67] | (255) | (10.3) | (7.7) | ||
| [23] | streambank legacy sediment | Bulk | 340–958 (556) | - | - |
| [36] | streambanks bed sediments | Bulk | 209–306 | 26–68 | 3–8 |
| (269) | (39) | (5) | |||
| 177–454 | 17–37 | 5–8 | |||
| (315) | (29) | (6) | |||
| [39] | streambanks bed sediment | Bulk | 417 ± 28.7 | 14 ± 2.4 | - |
| bulk | 281 ± 37 | 22 ± 2.7 | - | ||
| [40] | streambanks bed sediment | Bulk | 370–847 | 5–55 | - |
| Bulk | 558–1134 | 13–85 | - | ||
| [41] | streambanks | bulk | 710 ± 203 | - | 15–21 |
| [42] | streambanks | bulk | 138–1140 (621) | - | 15.7–17.3 |
| [21] | forest | <63 | 368–1229 | 6.4–26.8 | 5.6–7.9 |
| [7] | (850) | (15.4) | (6.7) | ||
| >63 | 136–620 | 5.6–36.3 | 6.2–10 | ||
| [7] | (372) | (17.4) | (8) | ||
| cropland | <63 | 924–1780 | 30–237 | 10.3–60 | |
| [7] | (1260) | (149.6) | (40.4) | ||
| >63 | 280–1142 | 23–223 | 10–92 | ||
| [7] | (781) | (126) | (49) | ||
| developed | <63 | 231–2594 | 17.5–871 | 7.1–275.3 | |
| [6] | (548) | (27.7) | (12.9) | ||
| >63 | 66–911 | 6.4–380 | 8.4–293 | ||
| [6] | (192) | (14.5) | (14.2) | ||
| streambank legacy sediment | <63 | 79–719 | 0.25–28 | 4.6–8.9 | |
| [23] | (549) | (9.8) | (6.1) | ||
| >63 | 34–526 | 0.5–16.9 | 4.7–10.4 | ||
| [23] | (248) | (8.8) | (7) | ||
| bed sediment | <63 | 252–921 | 14–36 | 0–12 | |
| [32] | (668) | (25) | (9.1) | ||
| >63 | 99–611 | 7.6–23 | 10–16 | ||
| [23] | (199) | (15) | (13) |
Table 2.
PSI (mg/kg) values for agricultural and streambank soils in the Mid-Atlantic Region.
| Location | Soil Depth | Soil Type | PSI (mg/kg) | Reference |
|---|---|---|---|---|
| Mid-Atlantic watersheds | Stream bank legacy sediments (Coarse) | 293 | This study | |
| Stream bank legacy sediments (Fine) | 652 | |||
| Delaware Inland Bays Watershed | 0–20 cm | Evesboro loamy-sand * | 149 | [46] |
| 20–40 cm | Evesboro loamy-sand * | 136 | ||
| 40–60 cm | Evesboro loamy-sand * | 217 | ||
| 60–80 cm | Evesboro loamy-sand * | 263 | ||
| 0–20 cm | Matawan sandy loam * | 588 | ||
| 20–40 cm | Matawan sandy loam * | 2083 | ||
| 40–60 cm | Matawan sandy loam * | 2564 | ||
| 60–80 cm | Matawan sandy loam * | 1886 | ||
| 0–20 cm | Matawan sandy loam ** | 434 | ||
| 20–40 cm | Matawan sandy loam ** | 1562 | ||
| 40–60 cm | Matawan sandy loam ** | 2000 | ||
| 60–80 cm | Matawan sandy loam ** | 1923 | ||
| 0–20 cm | Pocomoke sandy clay loam * | 95 | ||
| 20–40 cm | Pocomoke sandy clay loam * | 714 | ||
| 40–60 cm | Pocomoke sandy clay loam * | 212 | ||
| 60–80 cm | Pocomoke sandy clay loam * | 303 | ||
| Mahantango Creek Catchment (Central PA) | Agricultural catchment exposed stream bank | 259 | [39] | |
| Agricultural catchment submerged bank sediment | 214 |
* Agricultural soils; ** Field Border areas separate crop fields from drainage ditches.
Table 3.
Sediment EPC0 concentrations for the 15 streambank legacy sediment sites (one selected depth) and comparisons against baseflow stream water PO43− concentrations to determine if sediments would act as a source or sink for P.
Table 3.
Sediment EPC0 concentrations for the 15 streambank legacy sediment sites (one selected depth) and comparisons against baseflow stream water PO43− concentrations to determine if sediments would act as a source or sink for P.
| Site Name | Depth (cm) | EPC0 (mg/L) | Stream PO43− Concentration (mg/L) | Land Use | Sink or Source |
|---|---|---|---|---|---|
| Gramies Run (GMT) | 107 | 0.028 | 0 | Forest | Source |
| Middle Run (MR) | 91 | 0.044 | 0.036 | Forest | Source |
| Cider Mill (CDM) | 183 | 0.024 | 0.01 | Suburban | Source |
| Casho Mill (CM) | 102 | 0.020 | 0.005 | Suburban | Source |
| Cottage Mill (RH) | 76 | 0.000 | 0.001 | Suburban | Sink |
| Byrnes Mill (BYR) | 163 | 0.035 | 0.023 | Urban | Source |
| Brandywine Zoo (BZ) | 76 | 0.240 | 0.064 | Urban | Source |
| Cooch’s Bridge (COB) | 38 | 0.136 | 0.004 | Urban | Source |
| Woolen Mill (WM) | 61 | 0.001 | 0.205 | Urban | Sink |
| Big Elk Bridge (BEB) | 122 | 0.027 | 0.004 | Agriculture | Source |
| Camp Bonsul Road (CB) | 137 | 0.010 | 0.066 | Agriculture | Sink |
| Nature Center Beach (NCB) | 114 | 0.027 | 0.032 | Agriculture | Sink |
| Scotts Mill 2 (SM2) | 122 | 0.011 | 0.002 | Agriculture | Source |
| Scotts Mill 3 (SM3) | 183 | 0.033 | 0.002 | Agriculture | Source |
| Tweeds Mill (TM) | 81 | 0.026 | 0.039 | Agriculture | Sink |
| 10 sources and 5 sinks | |||||
Table 4.
Comparison of EPC0 values from various sites and sediments types reported in the literature.
Table 4.
Comparison of EPC0 values from various sites and sediments types reported in the literature.
| Location | EPC0 (mg/L) | Reference |
|---|---|---|
| Delaware, Maryland, & Pennsylvania Legacy Sediment (mean) | 0.044 | This study |
| Lake Pepin stream bank till sediment | <0.1 | [48] |
| River Wensum Catchment (UK) | 0.085 | [49] |
| Mahantango Creek Catchment (Central PA) | [39] | |
| Bed sediment | 0.043 | |
| Bank sediment | 0.02 | |
| Courthouse Creek Sediment VA | 0.090 | [47] |
| Kimages Creek Sediment VA (Legacy sediment) | 0.010 | [47] |
| Rathburn Lake Watershed (Iowa): | [36] | |
| Bed sediments (mean) | 0.09 | |
| Bank sediments (mean) | 0.06 |
© 2020 by the authors. Licensee MDPI, Basel, Switzerland. This article is an open access article distributed under the terms and conditions of the Creative Commons Attribution (CC BY) license (http://creativecommons.org/licenses/by/4.0/).
Share and Cite
MDPI and ACS Style
Inamdar, S.; Sienkiewicz, N.; Lutgen, A.; Jiang, G.; Kan, J. Streambank Legacy Sediments in Surface Waters: Phosphorus Sources or Sinks? Soil Syst. 2020, 4, 30. https://0-doi-org.brum.beds.ac.uk/10.3390/soilsystems4020030
AMA Style
Inamdar S, Sienkiewicz N, Lutgen A, Jiang G, Kan J. Streambank Legacy Sediments in Surface Waters: Phosphorus Sources or Sinks? Soil Systems. 2020; 4(2):30. https://0-doi-org.brum.beds.ac.uk/10.3390/soilsystems4020030
Chicago/Turabian StyleInamdar, Shreeram, Nathan Sienkiewicz, Alyssa Lutgen, Grant Jiang, and Jinjun Kan. 2020. "Streambank Legacy Sediments in Surface Waters: Phosphorus Sources or Sinks?" Soil Systems 4, no. 2: 30. https://0-doi-org.brum.beds.ac.uk/10.3390/soilsystems4020030