Microbe Biomass in Relation to Organic Carbon and Clay in Soil


1
Department of Biology, Brandon University, 18th Street Brandon, Brandon, MB R7A 6A9, Canada
2
Department of Geography and Environment, Brandon University, 18th Street Brandon, Brandon, MB R7A 6A9, Canada
*
Author to whom correspondence should be addressed.
†
Present address: Department of Plant Sciences, University of Manitoba, 66 Chancellors Cir, Winnipeg, MB R3T 2N2, Canada.
Soil Syst. 2020, 4(3), 41; https://0-doi-org.brum.beds.ac.uk/10.3390/soilsystems4030041
Submission received: 29 May 2020
/
Revised: 21 June 2020
/
Accepted: 4 July 2020
/
Published: 8 July 2020
(This article belongs to the Special Issue Role of Soil Organisms in Modification of their Environment, Nutrient Cycling and Soil Formation)
Abstract
:Soil microbes are key to nutrient cycling and soil formation, yet the impact of soil properties on microbe biomass remains unclear. Using 240 soil cores of 0–15 cm depth, taken at random points across six cattle-grazed pastures on an undulating landscape, we evaluated the biomass of microbes in soil as affected by naturally occurring variation in soil organic carbon (SOC), clay content, and local topography. The study pastures varied in historic land-use for crops or forage seeding. SOC was found to be greater in topographically low areas. In contrast, clay content was not related to topography, and clay deposition possibly varies with glaciation legacy. Microbial biomass carbon (MBC) was correlated positively with SOC, increasing from 700 mg kg−1 MBC at 25 g kg−1 SOC to 2240 mg kg−1 MBC at 90 g kg−1 SOC. Most likely, SOC promotes MBC through the release of water-soluble organic carbon. However, the response of MBC to clay content was negative, decreasing from 1340 mg kg−1 MBC at 5% clay to 880 mg kg−1 MBC at 30% clay. Small voids in association with clay particles likely restrict the access of microbes to SOC. The relationship between SOC and MBC illustrates the important role of SOC for soil function, in terms of nutrient availability and development of soil structure via the contribution of microbes. Lastly, there was considerable spatial variability in MBC across the 65 ha site, highlighting the importance of land-use histories and gradients in environmental variables, to determine the biomass of microbes in soil.
1. Introduction
Data on soil biota is limited markedly compared to aboveground systems, and to build our understanding of functional relationships will require more information about soil organisms and their effects on ecosystem services [1]. Microbial biomass carbon (MBC) can be determined by measuring the flush of carbon released from soil, in response to chloroform fumigation, and it corresponds to the entirety of microorganisms therein [2]. Soil microbial biomass can immobilize and mineralize nutrients [3,4]. Although MBC corresponds to only 1–3% [5] of soil organic carbon (SOC), microbes play a central role in aggregate formation during soil structural development [6]. Specifically, microaggregates of less than 250 µm diameter are formed from clays and other minerals, sesquioxides, SOC, and microbes [7]. It is well-established that SOC comprises a passive fraction of long-term stability and an active fraction of swift turnover; the latter concentrated in the surface soil [8], while MBC is considered part of the active fraction [9].
The relationship of MBC to soil physical and biogeochemical properties is somewhat variable. Although MBC typically increases in tandem with SOC [10,11], an increase in MBC in response to higher soil pH might or might not occur [12]. With regards to the response of MBC to increasing clay content, some studies have found a positive [13,14] and others have found a negative relationship [15,16]. Explanations for these opposing outcomes relate to the greater quantity of finer pore spaces in soils with higher clay content. When MBC is high, fine pores protect the microbes from animal grazers [13]; yet, when MBC is low, fine pores protect SOC from the microbes [15].
The purpose of the present study was to evaluate soil MBC in relation to SOC and clay content across the topographic variability of a pasture landscape. Our aim was to improve the understanding of the fundamental relationships among MBC and soil properties. The study site was a grazing-systems field experiment in the establishment year. In consequence, no impact of the grazing treatments themselves on any response variable was anticipated. The sampling regimen was designed to provide both a background evaluation of the grazing experiment, while at the same time allowing exploration of the fundamental relationships between soil properties and MBC, to meet our objectives herein.
2. Materials and Methods
The study took place during the summer of 2016 at Brookdale Research Farm (BRF), which is operated by Manitoba Beef and Forage Initiatives (MBFI) and is located 25 km north of Brandon, Manitoba, Canada. Temperature and rainfall data for the study period and long-term averages were recorded at the nearby weather station of the Brandon Airport (Climate ID 5010480 [17]). BRF is within the prairie-pothole region of the Great Plains, which is characterized by numerous water-holding depressions that were formed during glacial retreat [18]. Prairie potholes at BRF that are large enough to hold permanent water were excluded from grazing by fences. The grazed portion of the site had undulating topography, often with temporary standing water in low areas following snowmelt.
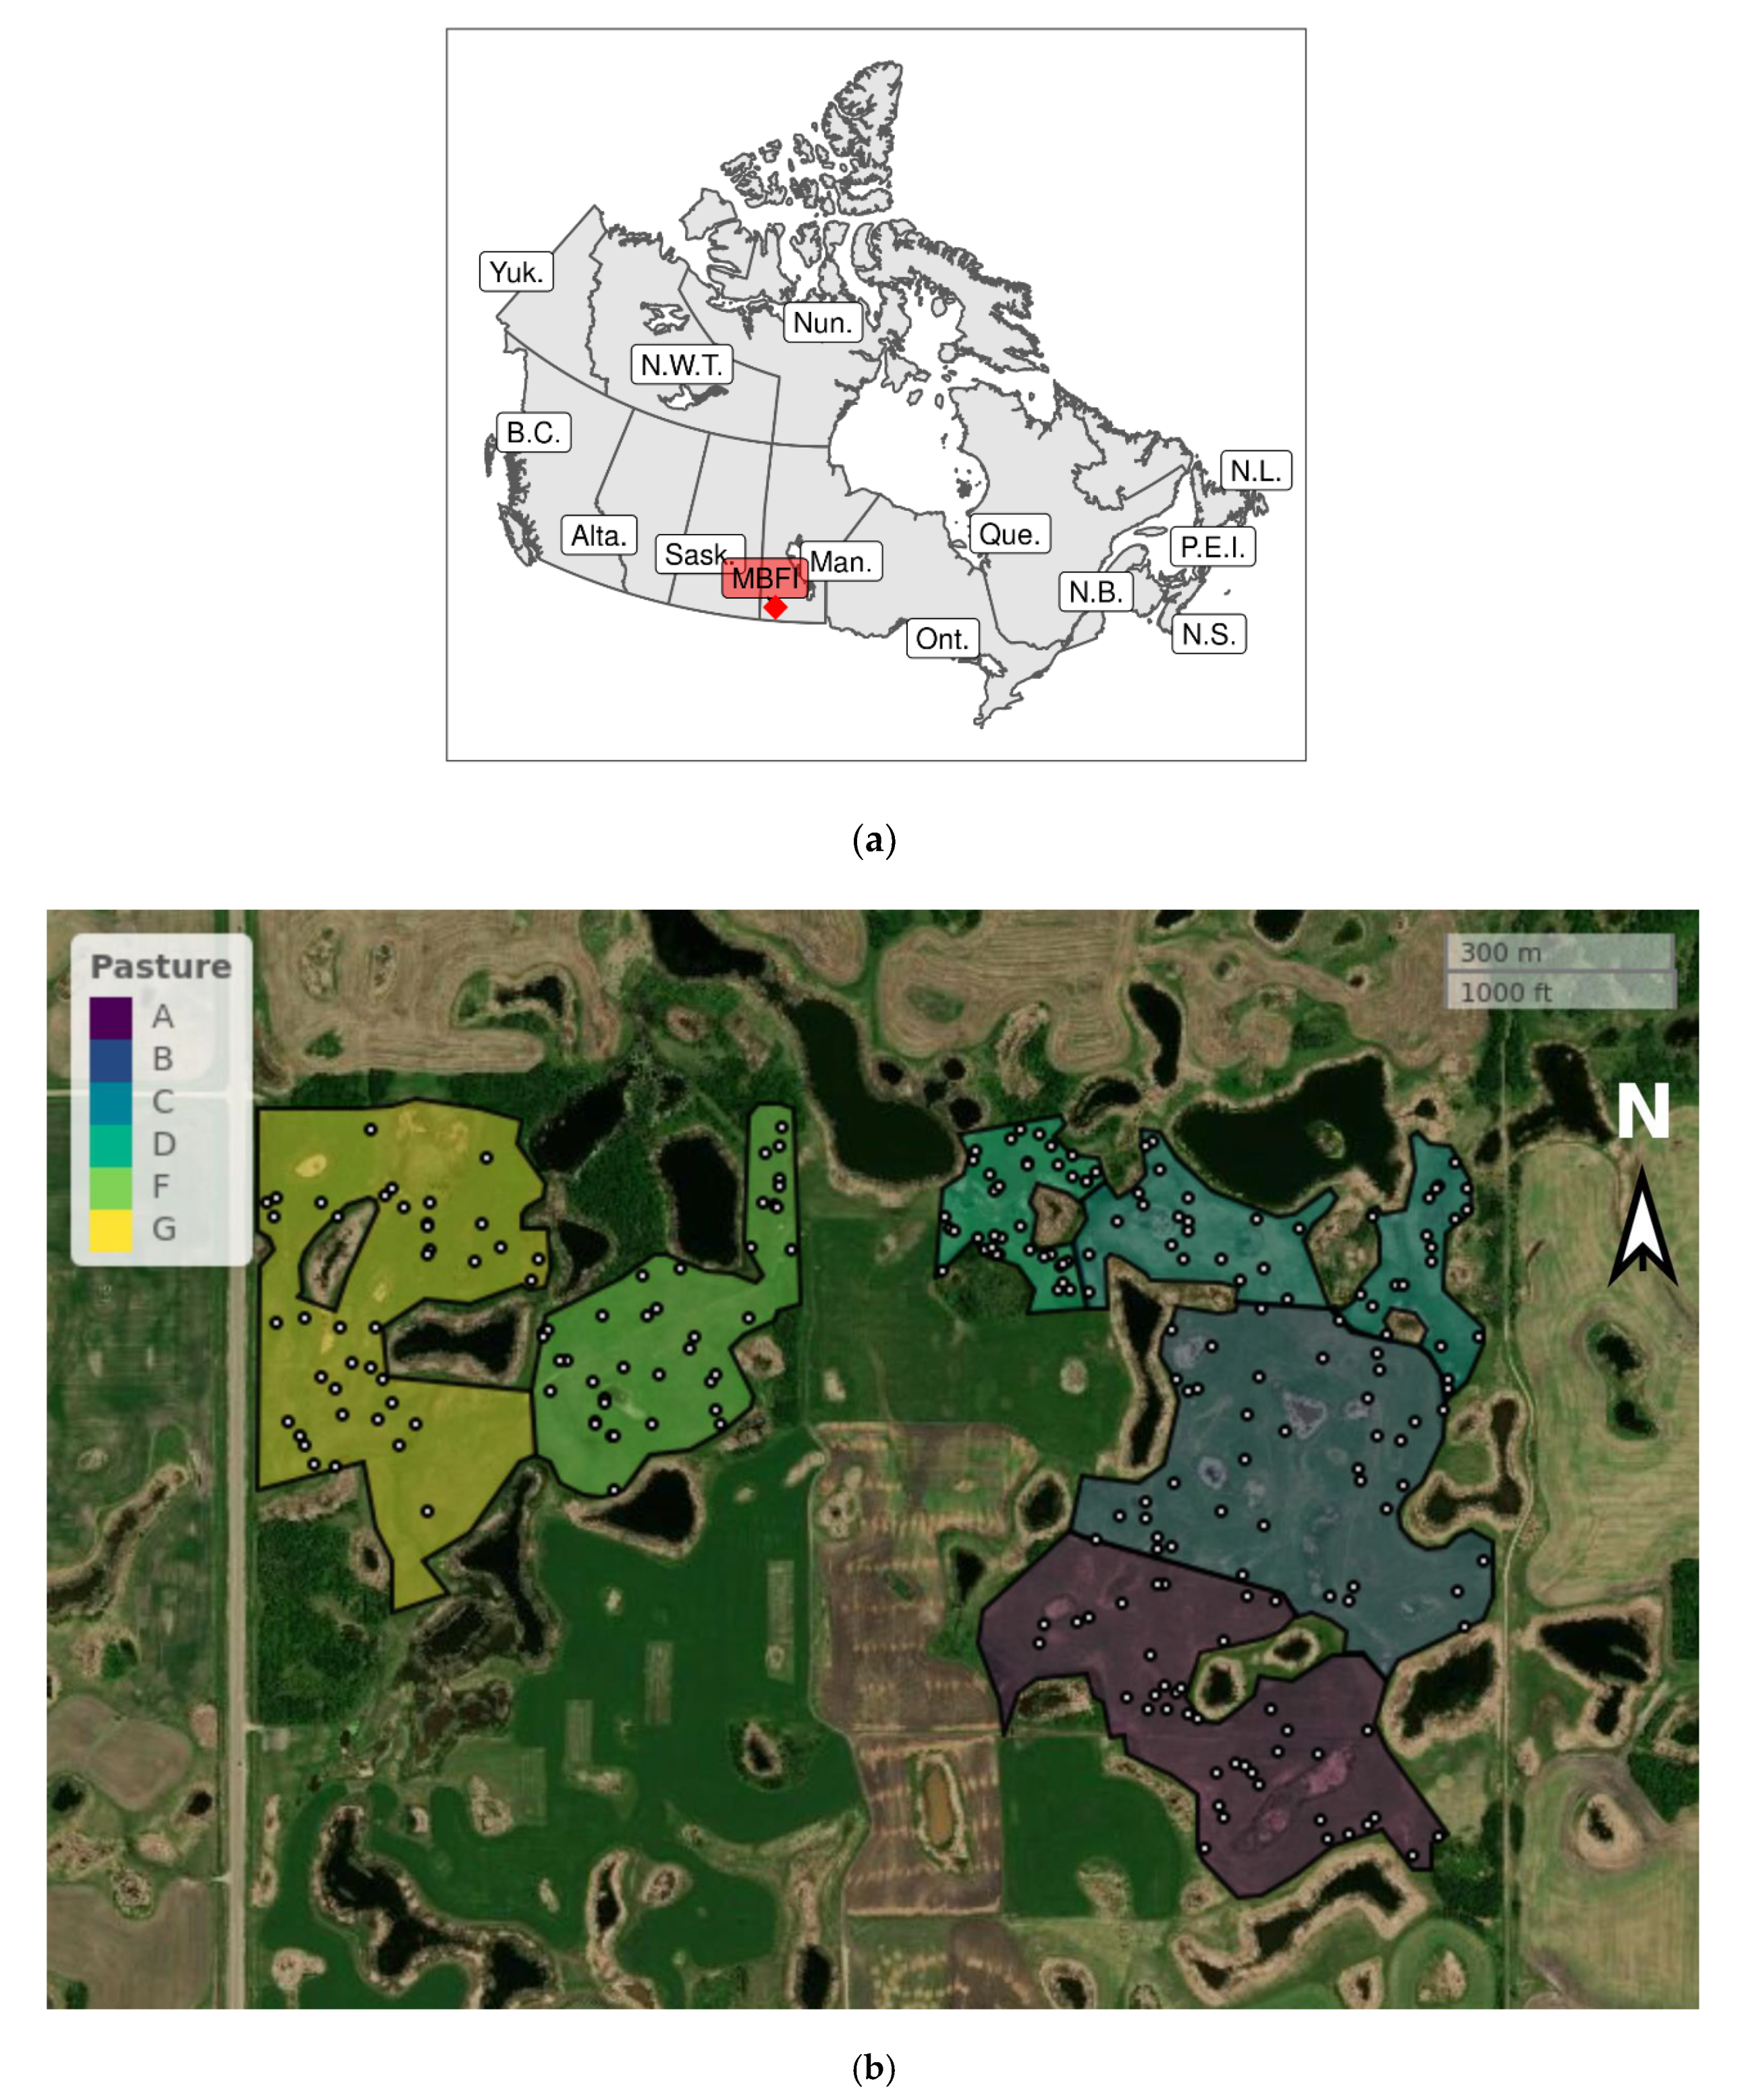
A multi-year grazing trial was established at BRF in 2016, with seven pastures designated as A–G (Figure 1). The northwest corner of G was located at 50°03.803′N 99°56.091′W. Pastures varied in area from D at 4.4 ha to G at 16.6 ha. Almost the entire site was grazed by cattle in 2016, although part of Pasture E was set aside for hay, in this year. In consequence, E was excluded from soil collection in 2016. Pasture management prior to 2016 was known to have varied across the site, but available details are limited. Pastures A and B were converted from cropland to pasture in 2013, whereas Pastures C and D were native forage. Pastures F and G were native forage augmented with seeding. The principal vegetation differences among pastures could be summarized as follows. C and D had abundant Kentucky bluegrass (Poa pratensis L.) but no meadow brome (Bromus riparius Rehmann), no cicer milkvetch (Astragalus cicer L.), and no alfalfa (Medicago sativa L.). In contrast, the remaining pastures had similar or less Kentucky bluegrass compared to C and D, but with the three listed tame forages. Each pasture received two experimental grazing treatments beginning in 2016, with the pastures corresponding to replicates within a randomized complete block design. Each pasture was divided into two halves of approximately equal area, each half being allocated at random to one of the two grazing treatments. However, the grazing treatments were in their establishment year in 2016 and are not considered further herein.
Twenty 34-mm diameter by 15-cm depth soil cores were taken at GPS coordinates generated by random numbers, within each grazing treatment within each pasture. Collection dates in 2016 were as follows: A on 10 June, B on 17 June, C on 27 June, D 18 July, F on 28 July, and G on 2 August. Each of the 240 soil cores were kept separate. Within 24 h following collection, all soil samples were periodically mixed during partial air-drying, to achieve the onset of friability, at which point they were passed through a 2-mm sieve. The sieved samples were stored in the dark at 5 °C. Elevation was determined to the nearest cm, at each sample point, using a Leica Viva GS14 GNSS Smart Antenna real-time kinematic rover (Leica Geosystems, Heerbrugg, Switzerland). To remove the effect of the overall north-south slope across the pastures, an elevation differential (ED) was calculated as the difference between the elevation at a sample point and the mean elevation for a given pasture. ED was used as a proxy for soil moisture and flooding. Negative ED values were aligned with the wetter depressions and lower slopes, whereas positive ED values corresponded to the drier hilltops and upper slopes.
MBC was determined on each 2-mm sieved soil sample, using the fumigation–extraction method [19]. In brief, chloroform vapor was used to fumigate soil in a vacuum desiccator for 24 h. Soils were then extracted in a 10:1 extract-to-soil volume-to-mass ratio, using 0.5 M K2SO4 at 300 rpm on a shaker for two hours. Extracts were filtered using Whatman No. 42 paper (Cytiva-Danaher, Washington, DC, USA). Filtrates were frozen until analysis using a TOC-VCPH total organic-carbon instrument (Shimadzu, Kyoto, Japan). The carbon flush corresponding to the difference between fumigated and non-fumigated sample pairs was used to calculate MBC, with a denominator of 0.45, to account for the insoluble portion of the microbes [2]. SOC was determined for soil samples by loss-on-ignition [20]. Clay percentage determination used the hydrometer method, following dispersion with sodium hexametaphosphate [21].
Additional soil samples were taken on 19 September 2019 for nutrient analyses, to characterize the site beyond the main study on MBC, SOC, and clay content. Twenty 20-mm diameter by 15-cm depth cores were taken at additional random locations, from within each half of each of Pastures A–G. Cores for a given half pasture were then combined and mixed, giving 14 samples for determination of soil nitrate-N [22] and plant-available-P [23].
All statistical analysis was undertaken using the R Statistical Software v3.6.3 [24], through the RStudio Integrated Development Environment v1.2.5033 [25]. Linear mixed models (R package lme4 v1.1-23 [26]) were used to investigate the relation between MBC and SOC, clay content, and ED. Pasture was included as a random factor to control for the unique farming history within each pasture and for any farm-scale gradients in other environmental variables, such as fertility. The R package lmerTest (v3.1-2 [27]) was used to calculate probability values and degrees of freedom, using the Satterthwaite approximation. To improve the interpretation of the main effects, data were centered prior to analysis, to ensure that the predictors had a mean of zero. The interaction between variables can influence the interpretation of main effects, and so all two-way interactions were investigated to allow any non-significant (α = 0.1) interactions to be removed from the model. Homogeneity of variance and normality were assessed by visual inspection of residuals and the q–q plot, respectively. The response variable MBC was log10 transformed to meet these assumptions. The model was checked for multiple collinearity, such that all variation inflation factors were less than two and the condition numbers that denoted kappa were less than 12 [28]. Marginal and conditional r2 values [29] were calculated using the MuMIn R package (v1.43.17 [30]). Plots were created with non-transformed data, and they show the model relation as the regression line. Each relation was plotted while holding all other variables constant. The relation among the fixed effects was further investigated by calculating Pearson’s correlation coefficients across all pastures.
3. Results
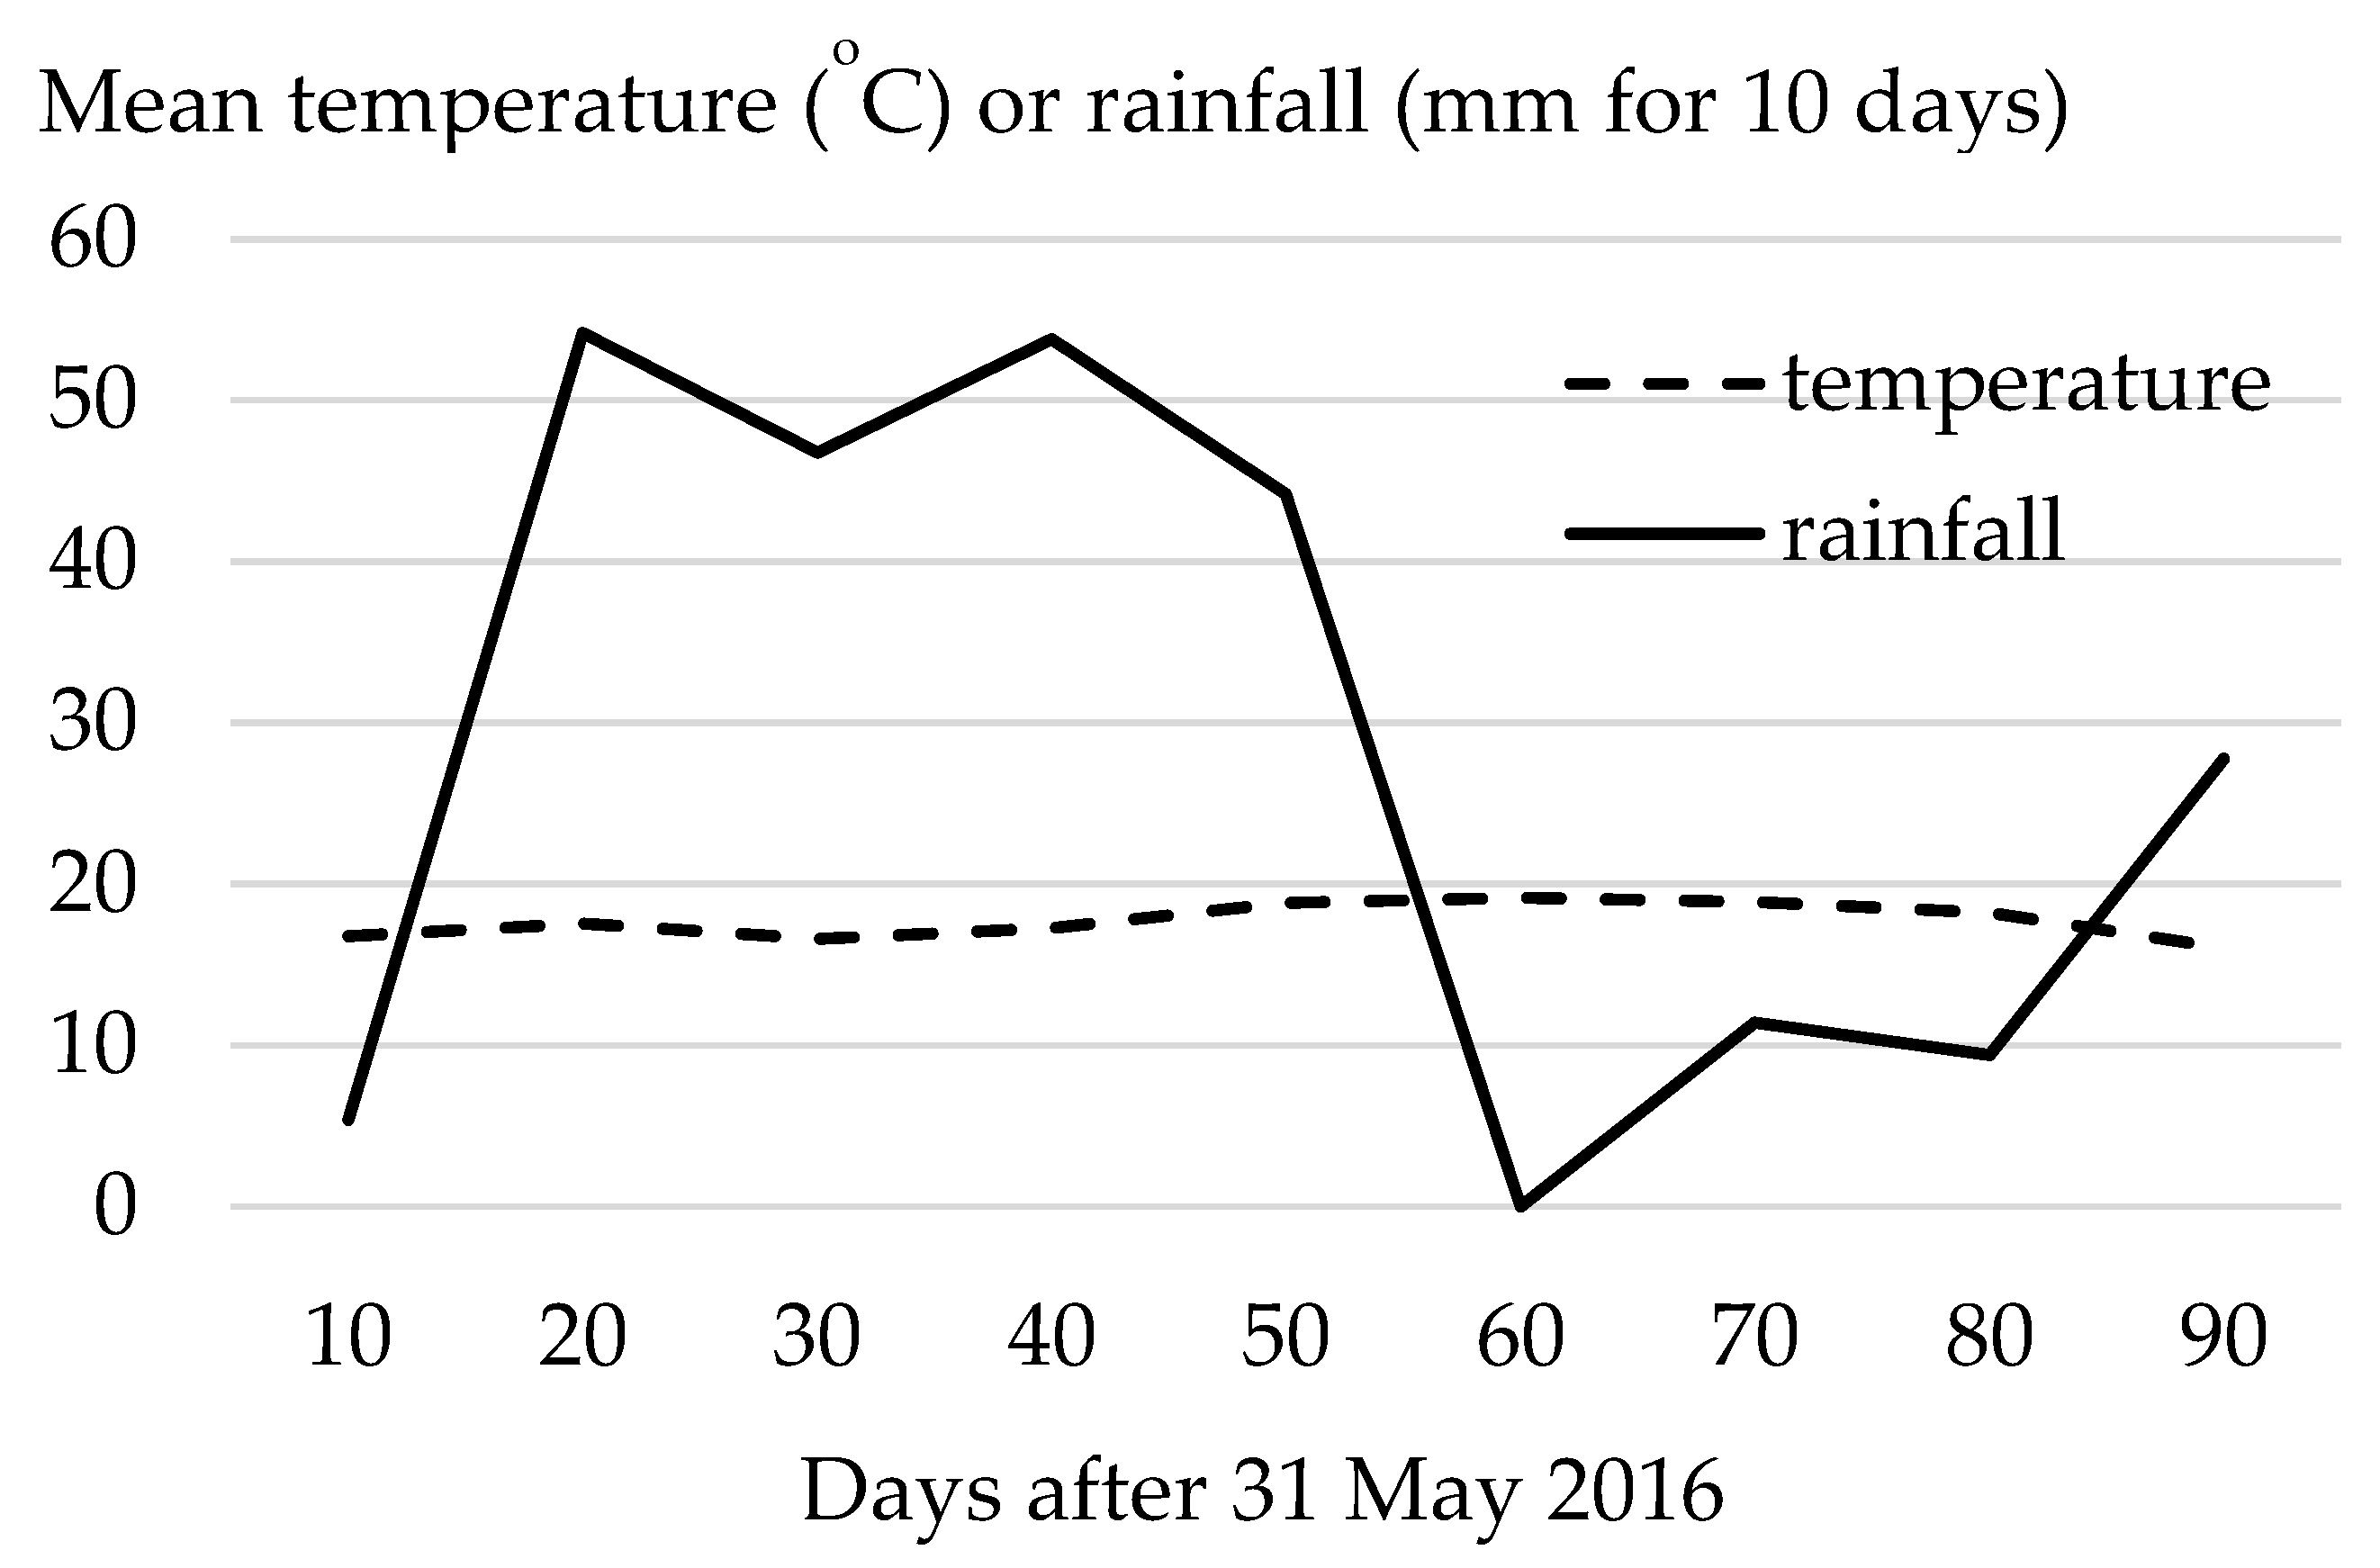
Reported climate normals [17] averaged from 1981–2010 for the growing season in the region are characterized by an average monthly temperature in May of 10.6 °C, rising to a maximum of 18.5 °C in July and declining to 11.8 °C in September. Between May and September, the corresponding normal for monthly precipitation ranged between 43.7 and 80.7 mm, with a cumulative rainfall of 322.8 mm. Mean monthly temperatures for the site in 2016 were typical, rising from 13.0 °C in May to a maximum of 18.6 °C in July, and falling to 12.7 °C in September. A total of 400 mm rainfall was recorded for these five months in 2016, although about half of this rain fell from mid-June to mid-July (Figure 2).
Nutrient analysis for the pastures had mean values (n = 14) of 7.4 mg P kg−1 through NaHCO3-extraction and 6.3 mg nitrate-N kg−1 through KCl-extraction. The pasture averages for particle-size analyses ranged as follows-sand, 49–60%; silt, 27–32%; and clay, 13–19%. Based on these pasture averages, the resulting textural classification for the site varied from sandy loam to loam. Clay content varied among individual samples from approximately 5% to close to 30%, and the ED ranged between 2.3 m and 4.0 m, but there was no significant correlation between the clay content and the ED (Table 1). SOC ranged between 25.9 and 89.6 g kg−1, and it was negatively correlated with, both, the clay content and ED (Table 1). However, the correlation coefficients between SOC and both clay content and ED were low, despite being significant (Table 1).
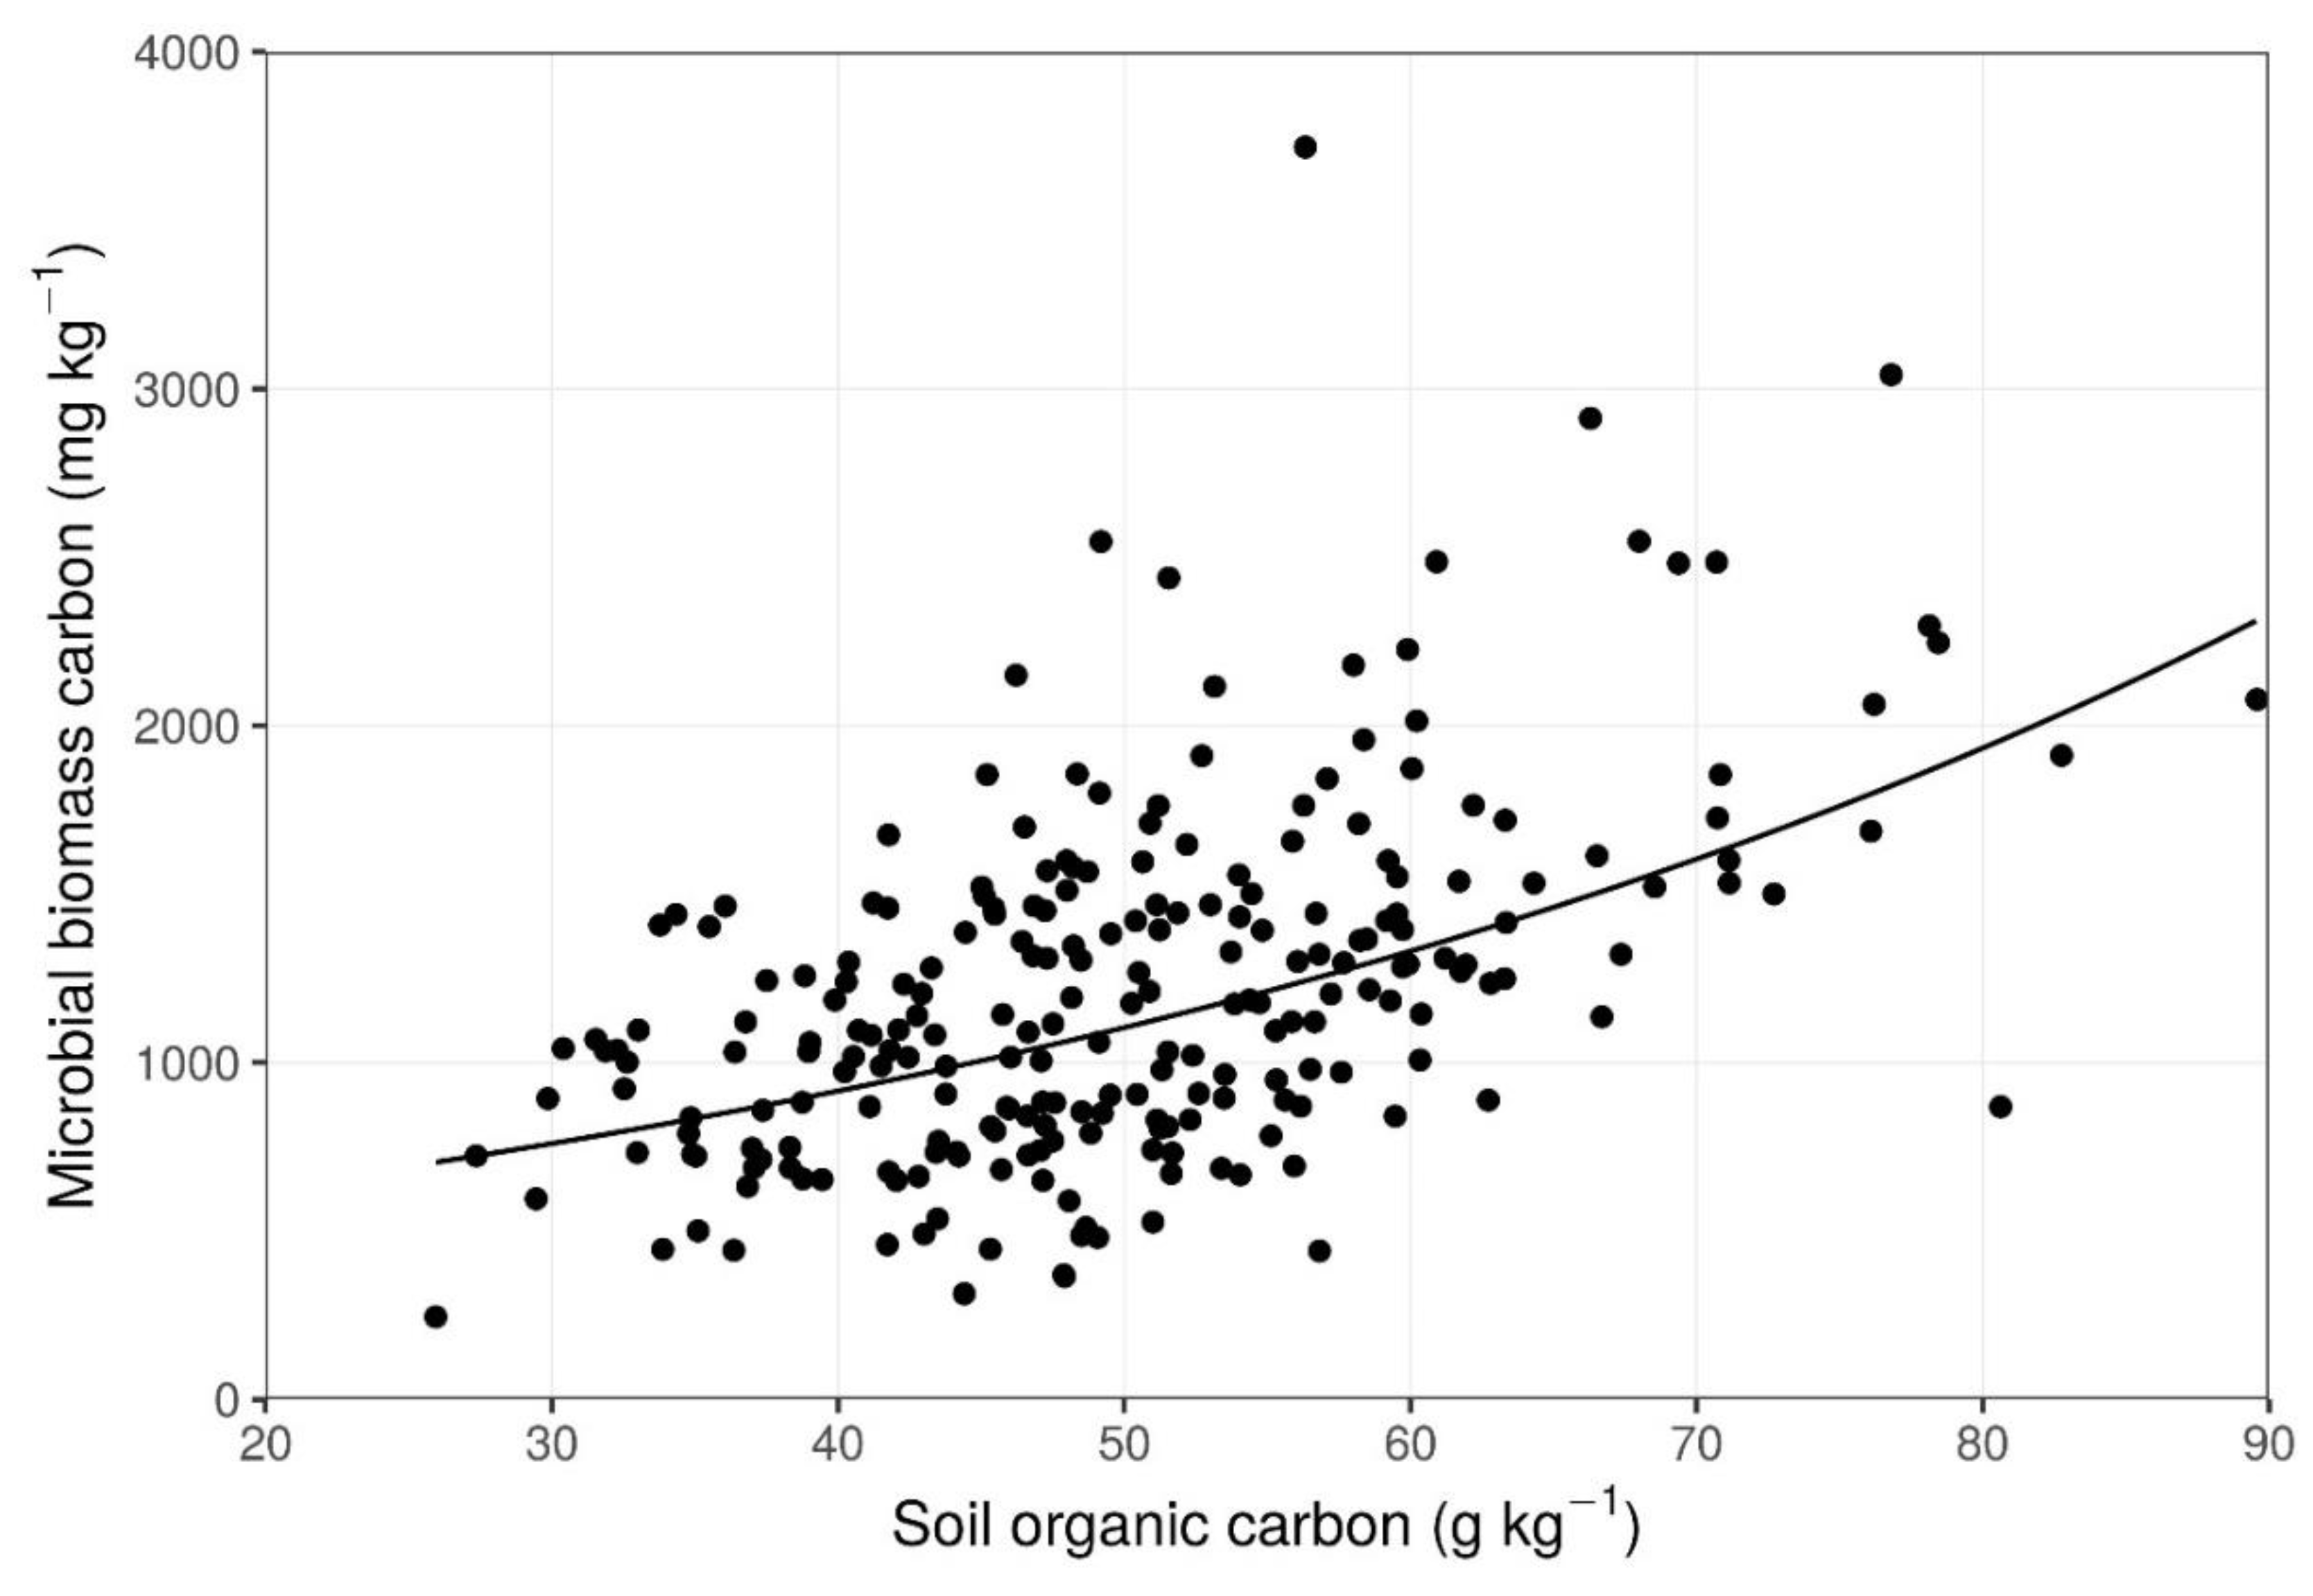
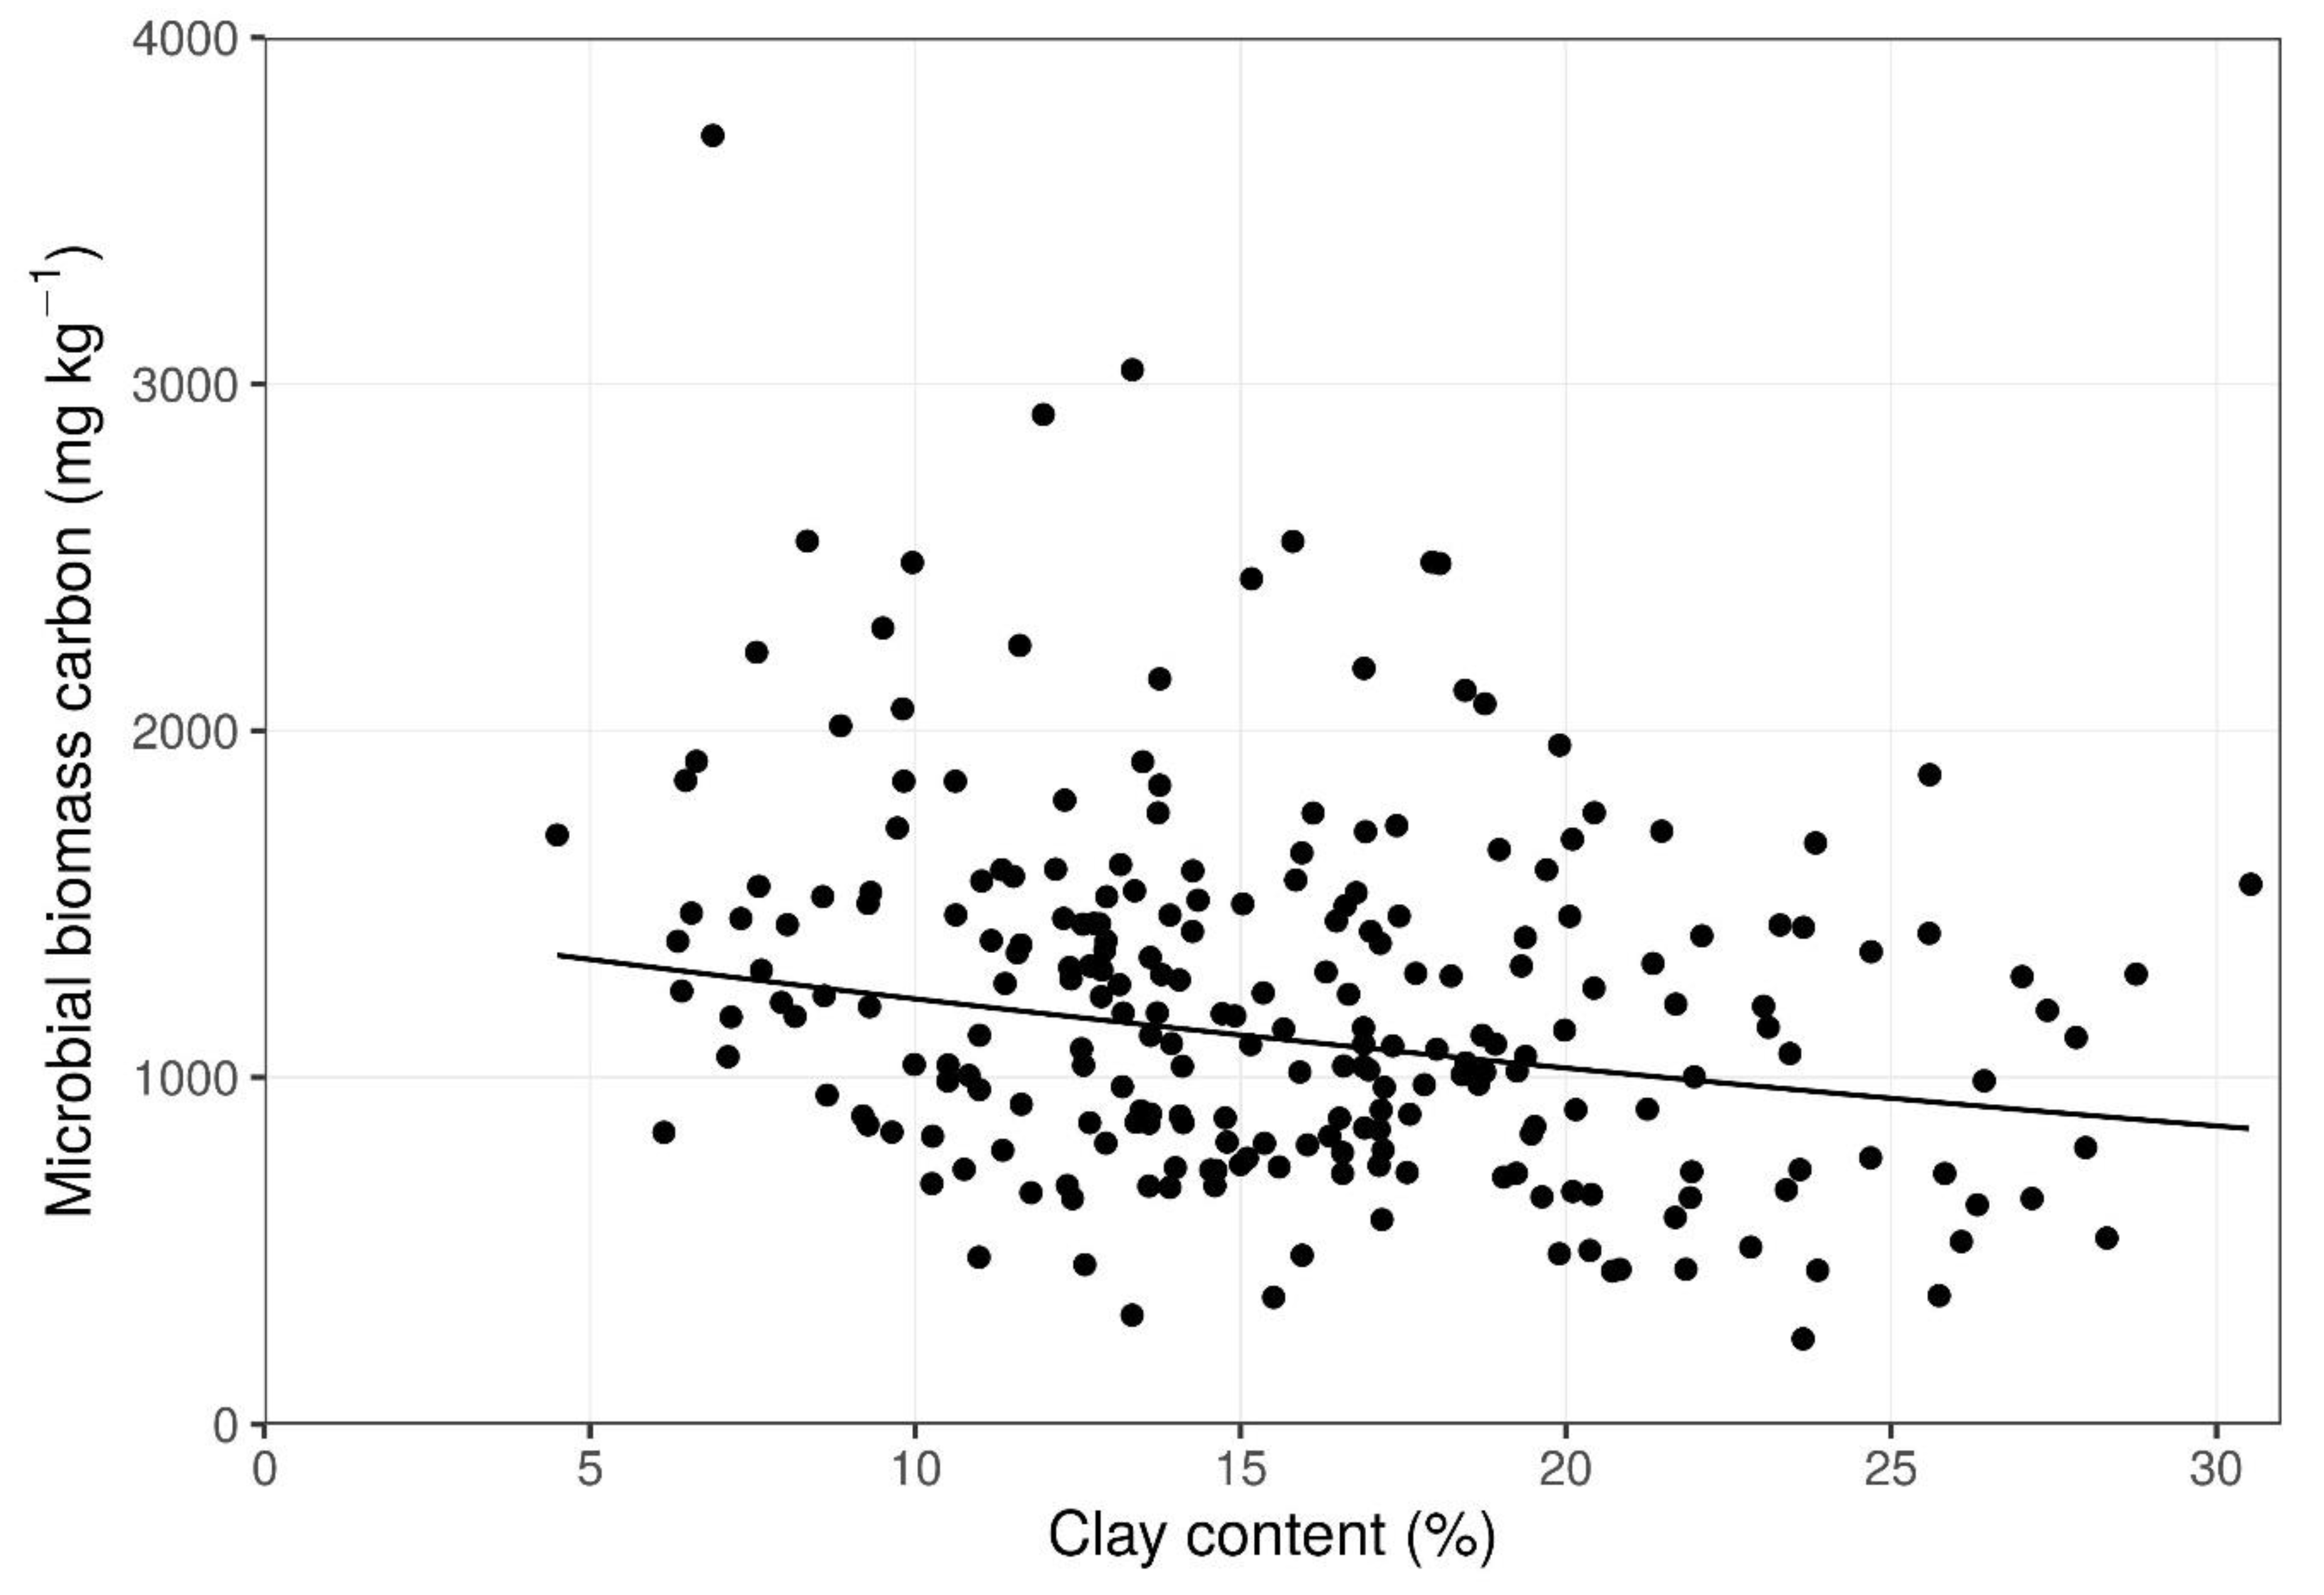
MBC ranged from 245 mg kg−1 to 3720 mg kg−1 among the 240 soil cores. Both clay content and SOC had a significant effect on MBC; however, both the magnitude and direction of this relation differed between these two variables (Figure 3 and Figure 4; Table 2). In contrast, ED had no effect on MBC. Furthermore, there were no significant interactions between these three variables, with regard to MBC.
4. Discussion
Compared to greater elevation, SOC was higher in topographic depressions in the pastures of the prairie-pothole landscape at BRF. Previously, higher SOC in lower slope positions was attributed to more moisture [31] or the accumulation of organic matter [32]. The observed variability in rainfall though the growth season was typical for the Canadian Prairies, and the use of ED, although not ideal, was shown to be a helpful as a proxy measure for use in prairie-potholes landscapes where limited resources are not directed to extensive direct monitoring and modeling of soil moisture. Clay content was not correlated to topography at BRF, as measured in terms of ED, which was consistent with the patterns observed on prairie sites in Canada [31] and Spain [33] that have similar rainfall. Soil texture across landscapes in Manitoba often vary extensively from differences in glacial-till composition [34]. Spatial variability of SOC could be mapped using various modeling approaches, but considerable effort for grid sampling of soil is required [35]. Alternatively, both SOC [36] and clay content [33] could be estimated using a vehicle-mounted sensor for electrical conductivity, although the relationships between soil properties and electrical conductivity appeared to be field-specific [36]. Future evaluation of variability at BRF would benefit from grid sampling or vehicle-mounted sensor systems to allow spatial analysis.
The negative relation between MBC and clay content indicated that the clay minerals physically protect SOC from attack by microbes [37]. Indeed, soils rich in clay experience less mineralization of SOC, as compared to sandy soils [38,39]. Organic compounds can adhere to clay particles [40], and so SOC in association with the small pore sizes related to clay minerals could become shielded from microorganisms [41]. Pores in sandy soils are in the range of 6–30 µm, whereas clay soils and loamy soils have pores of the order of 0.2 µm and 1.2 µm, respectively [42].Typically, soil bacteria and fungal hyphae have a diameter of the order of 0.5 µm and 5 µm, respectively [43]. The reduction in MBC in response to clay at BRF (Figure 4) shows that local enrichment of clay content up to 30% can restrict microbe growth, even if the broader landscape is a loam or sandy loam. The differential impact of varying clay content among sample points within the field makes sense, because the microbes experience the conditions in the immediate environment.
However, the larger effect size of SOC on MBC suggests that SOC is the greater determinant of MBC, rather than clay content. Water-soluble organic carbon is released into the soil solution in proportion to the quantity of SOC present [32]. This water-soluble organic carbon is released from an outer layer of SOC, in association with clay particles [44]. Water-soluble organic carbon in the soil solution is then consumed by microbes in-so-far-as nitrogen is available to combine with the carbon to build microbial biomass. Alternatively, the water-soluble organic carbon will be exported from the ecosystem via surface waters or groundwater if nitrogen availability is not sufficient to meet local demand for microbe growth [45]. Additionally, water-soluble organic carbon can be released directly from the breakdown of fresh residues [44]. The dependence of MBC on SOC at the BRF prairie-pothole site suggests that the release of water-soluble organic carbon from SOC is the more important pathway than the breakdown of litter.
The reduction in SOC with increasing clay content in the present study seemed to not be related to plant growth. Reduced plant growth in clay-rich soils often results from a shortened growth season caused by waterlogging in spring, combined with restricted availability of soil water during the drought conditions of high season in dry years [46]. However, clay content was not high enough at BRF to be expected to limit production, with textural classifications corresponding to either sandy loam or loam.
There was considerable variation in MBC that is not captured by the parameters of SOC, clay content, and ED. The marginal r2 value corresponding to the variance explained by fixed factors was 29%, and the conditional r2 value corresponding to the variance explained by both fixed factors and random factors was 59%. These r2 values demonstrated that the random effect of pasture explains much of the variation in MBC at BRF. This variation might relate to different farming histories among the pastures, including features of cropping, fertilization, tillage, and erosion. Variability in MBC is also generated by the changing environmental conditions. MBC was related negatively to air temperature in an alpine meadow [47], whereas MBC was related positively to seasonal rainfall in steppe grassland [48]. Further investigation is needed to understand the variation in MBC at the field-scale at this prairie-pothole site.
The positive relation between MBC and SOC has important consequences. Specifically, soils with an enrichment of SOC have more microbes to promote nutrient availability and development of soil structure. The present study advances our understanding of the variability in MBC across the landscape of the study site by revealing a dominating effect of SOC on MBC and a smaller but meaningful effect of clay on MBC. Furthermore, farm-scale variability in MBC is an important aspect to consider when assessing MBC and the role of microbes in ecosystem function.
Author Contributions
Conceptualization, T.M.; methodology, K.L., T.M., and A.K.; investigation, K.L., T.M., and A.K.; data curation, K.L., T.M., and A.K.; writing—original draft preparation, K.L., T.M., and A.K.; writing—review and editing, K.L., T.M., and A.K.; supervision, T.M.; project administration, T.M.; funding acquisition, T.M. All authors have read and agreed to the published version of the manuscript.
Funding
This research was funded by an award from MBFI to support the M.Sc. study of K.L.
Acknowledgments
Thank you to all staff at MBFI for support throughout this project.
Conflicts of Interest
The authors declare no conflict of interest.
References
- Bach, E.M.; Ramirez, K.S.; Fraser, T.D.; Wall, D.H. Soil biodiversity integrates solutions for a sustainable future. Sustainability 2020, 12, 2662. [Google Scholar] [CrossRef] [Green Version]
- Jenkinson, D.S.; Brookes, P.C.; Powlson, D.S. Measuring soil microbial biomass. Soil Biol. Biochem. 2004, 36, 5–7. [Google Scholar] [CrossRef]
- Hassink, J. Density fractions of soil macroorganic matter and microbial biomass as predictors of C and N mineralization. Soil Biol. Biochem. 1995, 27, 1099–1108. [Google Scholar] [CrossRef]
- Murphy, D.V.; Sparling, G.P.; Fillery, I.R.P. Stratification of microbial biomass C and N and gross N mineralization with soil depth in two contrasting Western Australian agricultural soils. Aust. J. Soil Res. 1998, 36, 45–55. [Google Scholar] [CrossRef]
- McGonigle, T.P.; Turner, W.G. Grasslands and croplands have different microbial biomass carbon levels per unit soil organic carbon. Agriculture 2017, 7, 57. [Google Scholar] [CrossRef] [Green Version]
- Gupta, V.V.S.R.; Germida, J.J. Soil aggregation: Influence on microbial biomass and implications for biological processes. Soil Biol. Biochem. 2015, 80, A3–A9. [Google Scholar] [CrossRef]
- Totsche, K.U.; Amelung, W.; Gerzabek, M.H.; Guggenberger, G.; Klumpp, E.; Knief, C.; Lehndorff, E.; Mikutta, R.; Peth, S.; Prechtel, A.; et al. Microaggregates in soils. J. Plant Nutr. Soil Sci. 2018, 181, 104–136. [Google Scholar] [CrossRef] [Green Version]
- Diochon, A.C.; Kellman, L. Physical fractionation of soil organic matter: Destabilization of deep soil carbon following harvesting of a temperate coniferous forest. J. Geophys. Res. Biogeosci. 2009, 114, 1–9. [Google Scholar] [CrossRef] [Green Version]
- Alvarez, C.R.; Alvarez, R. Are active organic matter fractions suitable indices of management effects on soil carbon? A meta-analysis from the Pampas. Arch. Agron. Soil Sci. 2016, 62, 1592–1601. [Google Scholar] [CrossRef]
- Carter, M.R. The influence of tillage on the proportion of organic carbon and nitrogen in the microbial biomass of medium-textured soils in a humid climate. Biol. Fert. Soils 1991, 11, 135–139. [Google Scholar] [CrossRef]
- Moore, J.M.; Klose, S.; Tabatabai, M.A. Soil microbial biomass carbon and nitrogen as affected by cropping systems. Biol. Fert. Soils 2000, 31, 200–210. [Google Scholar] [CrossRef]
- Sawada, K.; Funakawa, S.; Kosaki, T. Different effects of pH on microbial biomass carbon and metabolic quotients by fumigation–Extraction and substrate-induced respiration methods in soils under different climatic conditions. Soil Sci. Plant. Nutr. 2009, 55, 363–374. [Google Scholar] [CrossRef]
- Franzluebbers, A.J.; Haney, R.L.; Hons, F.M.; Zuberer, D.A. Active fractions of organic matter in soils with different texture. Soil Biol. Biochem. 1996, 28, 1367–1372. [Google Scholar] [CrossRef]
- Seita, R.; Verma, S.L.; Marschner, P. Measuring microbial biomass carbon by direct extraction—Comparison with chloroform fumigation-extraction. Eur. J. Soil Biol. 2012, 53, 103–106. [Google Scholar]
- Hassink, J. Effects of soil texture and structure on carbon and nitrogen mineralization in grassland soils. Biol. Fert. Soil 1992, 14, 126–134. [Google Scholar] [CrossRef]
- Sparling, G.P. Ratio of microbial biomass carbon to soil organic carbon as a sensitive indicator of changes in soil organic matter. Aust. J. Soil Res. 1992, 30, 195–207. [Google Scholar] [CrossRef]
- Environment Canada. Canadian Climate Normals. Available online: https://climate.weather.gc.ca/climate_normals (accessed on 28 May 2020).
- Sloan, C.E. Ground-Water Hydrology of Prairie Potholes in North Dakota; U.S. Geological Survey: Washington, DC, USA, 1972; pp. 1–28. [CrossRef]
- Vance, E.D.; Brookes, P.C.; Jenkinson, D.S. An extraction method for measuring soil microbial biomass carbon. Soil Biol. Biochem. 1987, 19, 703–707. [Google Scholar] [CrossRef]
- Nelson, D.W.; Sommers, L.E. Total carbon, organic carbon, and organic matter. In Methods of Soil Analysis. Part 3. Chemical Methods; Sparks, D.L., Ed.; Soil Science Society of America: Madison, WI, USA, 1996; pp. 961–1010. [Google Scholar]
- Gee, G.W.; Or, D. Particle-size analysis. In Methods of Soil Analysis. Part 4. Physical Methods; Dane, G.H., Topp, G.C., Eds.; Soil Science Society of America: Madison, WI, USA, 2002; pp. 255–293. [Google Scholar]
- Maynard, D.G.; Kalra, Y.P. Nitrate and exchangeable ammonium nitrogen. In Soil Sampling and Methods of Analysis; Carter, M.R., Ed.; Lewis: Boca Raton, FL, USA, 1993; pp. 25–38. [Google Scholar]
- Schoenau, J.J.; Karamanos, R.E. Sodium bicarbonate-extractable P, K, and N. In Soil Sampling and Methods of Analysis; Carter, M.R., Ed.; Lewis: Boca Raton, FL, USA, 1993; pp. 51–58. [Google Scholar]
- R Core Team. R: A Language and Environment for Statistical Computing. R Foundation for Statistical Computing. Available online: http://www.R-project.org (accessed on 28 May 2020).
- RStudio. RStudio: Integrated Development Environment for R. Available online: http://www.rstudio.org/ (accessed on 28 May 2020).
- Bates, D.; Maechler, M.; Bolker, B.; Walker, S. Fitting linear mixed-effects models using lme4. J. Stat. Software 2015, 67, 1–48. [Google Scholar] [CrossRef]
- Kuznetsova, A.; Brockhoff, P.B.; Christensen, R.H.B. lmerTest package: Tests in linear mixed effects models. J. Stat. Softw. 2017, 82, 1–26. [Google Scholar] [CrossRef] [Green Version]
- Quinn, G.P.; Keough, M.J. Experimental Design and Data Analysis for Biologists; Cambridge University Press: Cambridge, UK, 2002. [Google Scholar]
- Nakagawa, S.; Johnson, P.C.D.; Schielzeth, H. The coefficient of determination R² and intra-class correlation coefficient from generalized linear mixed-effects models revisited and expanded. J. R. Soc. Interface 2017, 14, 20170213. [Google Scholar] [CrossRef] [PubMed] [Green Version]
- Bartoń, K. MuMIn: Multi-Model Inference. R Package Version 1.43.17. Available online: https://CRAN.R-project.org/package=MuMIn (accessed on 28 May 2020).
- Roberts, T.L.; Stewart, J.W.B.; Bettany, J.R. The influence of topography on the distribution of organic and inorganic soil phosphorus across a narrow environmental gradient. Can. J. Soil Sci. 1985, 65, 651–665. [Google Scholar] [CrossRef]
- Fissore, C.; Dazell, B.J.; Berhe, A.A.; Voegtle, M.; Evans, M.; Wu, A. Influence of topography on soil organic carbon dynamics in a Southern California grassland. Catena 2017, 149, 140–149. [Google Scholar] [CrossRef]
- Garcia-Tomillo, A.; Miras-Avalos, J.M.; Dafonte-Dafonte, J.; Paz-Gonzalez, A. Mapping soil texture using geostatistical interpolation combined with electromagnetic induction measurements. Soil Sci. 2017, 182, 278–284. [Google Scholar] [CrossRef]
- Teller, J.T. The ice age and its legacy. In Natural Heritage of Manitoba: Legacy of the Ice Age; Teller, J.T., Ed.; Manitoba Museum of Man and Nature: Winnipeg, MB, Canada, 1984; pp. 23–47. [Google Scholar]
- Li, X.; McCarty, G.W.; Du, L.; Lee, S. Use of topographic models for mapping soil properties and processes. Soil Syst. 2020, 4, 32. [Google Scholar] [CrossRef]
- Garcia-Tomillo, A.; Miras-Avalos, J.M.; Dafonte-Dafonte, J.; Paz-Gonzalez, A. Estimating soil organic matter using interpolation methods with an electromagnetic induction sensor and topographic parameters: A case study in a humid region. Precis. Agric. 2017, 18, 882–897. [Google Scholar] [CrossRef]
- Ladd, J.N.; Foster, R.C.; Nannipieri, P.; Oades, J.M. Soil structure and biological activity. Soil Biochem. 1996, 9, 23–78. [Google Scholar]
- Catroux, G.; Chaussod, R.; Nicolardot, B. Assessment of nitrogen supply form the soil. C.R. Acad. Agric. Fr. 1987, 3, 71–79. [Google Scholar]
- Verberne, E.L.J.; Hassink, J.; de Willigen, P.; Groot, J.J.R.; van Veen, J.A. 1990. Modelling organic matter dynamics in different soils. Neth. J. Agric. Sci. 1990, 38, 221–238. [Google Scholar]
- Tisdall, J.M.; Oades, J.M. Organic matter and water-stable aggregates in soils. Eur. J. Soil Sci. 1982, 33, 141–163. [Google Scholar] [CrossRef]
- Elliott, E.T.; Coleman, D.C. Let the soil work for us. Ecol. Bull. 1988, 39, 2–32. [Google Scholar]
- Hassink, J.; Bouwman, L.A.; Zwart, K.B.; Bloem, J.; Brussaard, L. Relationships between soil texture, physical protection of organic matter, soil biota, and C and N mineralization in grassland soils. Geoderma 1993, 57, 105–128. [Google Scholar] [CrossRef]
- Bae, H.C.; Cota-Robles, E.H.; Casida, L.E. Microflora of soil as viewed by transmission electron microscopy. Appl. Microbiol. 1972, 23, 637–648. [Google Scholar] [CrossRef] [PubMed] [Green Version]
- Blankinship, J.C.; Schimel, J.P. Biotic versus abiotic controls on bioavailable soil organic carbon. Soil Syst. 2018, 2, 10. [Google Scholar] [CrossRef] [Green Version]
- Aitkenhead, J.A.; McDowell, W.H. Soil C:N as a predictor of annual riverine DOC flux at local and global scales. Glob. Biogeo. Cycles 2000, 14, 127–138. [Google Scholar] [CrossRef]
- Gales, K.; Ayling, S.M.; Cannell, R.Q. Effects of waterlogging and drought on winter wheat and winter barley grown on a clay and sandy loam soil. II. Soil and plant water relationships. Plant. Soil 1984, 80, 67–78. [Google Scholar] [CrossRef]
- Wu, J. Change in soil microbial biomass and regulating factors in an alpine meadow site on the Qinghai-Tibetan Plateau. Soil Sci. Plant. Nutr. 2020, 66, 177–194. [Google Scholar] [CrossRef]
- Liu, N.; Zhang, Y.; Chang, S.; Kan, H.; Lin, L. Impact of grazing on soil carbon and microbial biomass in typical steppe and desert steppe of Inner Mongolia. PLoS ONE 2012, 7, e36434. [Google Scholar] [CrossRef] [Green Version]
Figure 1.
(a) Regional context and (b) Pastures A–G at the field site. For (a), the site location is marked as Manitoba Beef and Forage Initiatives (MBFI) within Manitoba (Man.), with abbreviations given for other provinces and territories in Canada. For (b), dark areas are prairie potholes with permanent water. Each sample point is indicated as a white circle with a dark ring. North is shown as the arrow to N. Scale is shown to the uppermost right.

Figure 2.
Mean temperature and cumulative rainfall for 10-day intervals from 1 June to 29 August 2016.
Figure 2.
Mean temperature and cumulative rainfall for 10-day intervals from 1 June to 29 August 2016.

Figure 3.
Response of microbial biomass carbon to soil organic carbon. See Table 2 for additional information.
Figure 3.
Response of microbial biomass carbon to soil organic carbon. See Table 2 for additional information.

Figure 4.
Response of microbial biomass carbon to clay content. See Table 2 for additional information.
Figure 4.
Response of microbial biomass carbon to clay content. See Table 2 for additional information.


Table 1.
Matrix of Pearson Correlation coefficients among clay content, soil organic carbon (SOC), and elevation differential (ED). Bold values indicate significance at p < 0.001.
Table 1.
Matrix of Pearson Correlation coefficients among clay content, soil organic carbon (SOC), and elevation differential (ED). Bold values indicate significance at p < 0.001.
| Parameter | Clay (%) | SOC (g kg−1) | ED (m) |
|---|---|---|---|
| Clay (%) | 1.00 | −0.27 | 0.07 |
| SOC (g kg−1) | −0.27 | 1.00 | −0.28 |
| ED (m) | 0.07 | −0.28 | 1.00 |
Table 2.
Results of linear mixed effects model looking at the relation of microbial biomass carbon MBC to soil organic carbon (SOC), clay content, and elevation differential (ED).
Table 2.
Results of linear mixed effects model looking at the relation of microbial biomass carbon MBC to soil organic carbon (SOC), clay content, and elevation differential (ED).
| Analysis | Parameter | Estimate | Std. Error | df | t Value | p-Value |
|---|---|---|---|---|---|---|
| MBC | Intercept | 3.045 | 0.043 | 4.9 | 68.779 | <0.001 |
| log10 | Clay (%) | −0.007 | 0.002 | 230.4 | −4.273 | <0.001 |
| (mg kg−1) | SOC (g kg−1) | 0.008 | 0.001 | 230.0 | 9.174 | <0.001 |
| ED (m) | −0.003 | 0.007 | 228.2 | −0.370 | 0.712 |
© 2020 by the authors. Licensee MDPI, Basel, Switzerland. This article is an open access article distributed under the terms and conditions of the Creative Commons Attribution (CC BY) license (http://creativecommons.org/licenses/by/4.0/).
Share and Cite
MDPI and ACS Style
Liddle, K.; McGonigle, T.; Koiter, A. Microbe Biomass in Relation to Organic Carbon and Clay in Soil. Soil Syst. 2020, 4, 41. https://0-doi-org.brum.beds.ac.uk/10.3390/soilsystems4030041
AMA Style
Liddle K, McGonigle T, Koiter A. Microbe Biomass in Relation to Organic Carbon and Clay in Soil. Soil Systems. 2020; 4(3):41. https://0-doi-org.brum.beds.ac.uk/10.3390/soilsystems4030041
Chicago/Turabian StyleLiddle, Kaylin, Terence McGonigle, and Alexander Koiter. 2020. "Microbe Biomass in Relation to Organic Carbon and Clay in Soil" Soil Systems 4, no. 3: 41. https://0-doi-org.brum.beds.ac.uk/10.3390/soilsystems4030041