Article

Stratified Soil Sampling Improves Predictions of P Concentration in Surface Runoff and Tile Discharge

1
United States Department of Agriculture-Agricultural Research Service (USDA-ARS) Soil Drainage Research Unit, 590 Woody Hayes Dr., Columbus, OH 43210, USA
2
USDA-ARS National Soil Erosion Research Laboratory, 275 South Russell Street, West Lafayette, IN 47907, USA
3
Los Angeles Regional Water Quality Control Board, Los Angeles, CA 90013, USA
*
Author to whom correspondence should be addressed.
Submission received: 21 August 2020 / Revised: 26 October 2020 / Accepted: 13 November 2020 / Published: 19 November 2020

Abstract

:
Phosphorus (P) stratification in agricultural soils has been proposed to increase the risk of P loss to surface waters. Stratified soil sampling that assesses soil test P (STP) in a shallow soil horizon may improve predictions of P concentrations in surface and subsurface discharge compared to single depth agronomic soil sampling. However, the utility of stratified sampling efforts for enhancing understanding of environmental P losses remains uncertain. In this study, we examined the potential benefit of integrating stratified sampling into existing agronomic soil testing efforts for predicting P concentrations in discharge from 39 crop fields in NW Ohio, USA. Edge-of-field (EoF) dissolved reactive P (DRP) and total P (TP) flow-weighted mean concentrations in surface runoff and tile drainage were positively related to soil test P (STP) measured in both the agronomic sampling depth (0–20 cm) and shallow sampling depth (0–5 cm). Tile and surface DRP and TP were more closely related to shallow depth STP than agronomic STP, as indicated by regression models with greater coefficients of determination (R2) and lesser root-mean square errors (RMSE). A multiple regression model including the agronomic STP and P stratification ratio (Pstrat) provided the best model fit for DRP in surface runoff and tile drainage and TP in tile drainage. Additionally, STP often varied significantly between soil sampling events at individual sites and these differences were only partially explained by management practices, highlighting the challenge of assessing STP at the field scale. Overall, the linkages between shallow STP and P transport persisted over time across agricultural fields and incorporating stratified soil sampling approaches showed potential for improving predictions of P concentrations in surface runoff and tile drainage.

1. Introduction

Phosphorus (P) losses from croplands are a major driver of hypoxia and harmful and nuisance algal blooms in waterbodies worldwide [1,2]. Dissolved reactive P (DRP) is the P fraction that primarily drives these algal blooms as it is readily bioavailable, though other fractions of total P (TP) also contribute bioavailable P and so play a secondary role [3]. Phosphorus lost from croplands can be directly derived from recent fertilizers (i.e., incidental P) [4] or from P stored in soil pools (i.e., legacy soil P) [5], but recent research suggests legacy soil P is the dominant P source in the Western Lake Erie Basin (WLEB) [6]. Previous studies have shown that DRP and TP are readily transported via both the artificial subsurface tile drainage network (i.e., tile drainage) as well as overland surface runoff in the WLEB [7,8,9]. Thus, to improve predictions of environmental P losses it is necessary to further our understanding of how soil P pools relate to surface and subsurface edge-of-field P losses.
Soil P is routinely measured in agricultural systems as a component of agronomic soil testing to estimate crop fertility requirements [10]. Agronomic soil testing was designed to estimate potential crop nutrient demand and yield response to fertilizer applications, so sampling depths typically target the crop’s primary rooting zone. For example, in Ohio, Michigan, and Indiana, USA, the 0–20 cm depth is the typical agronomic soil testing depth and is the basis of university extension fertilizer recommendations [11]. Results of these tests are also useful for predicting the potential risk of P loss; P risk assessment tools typically use STP as a risk prediction factor [12,13,14], and previous studies have reported positive relationships between agronomic soil test P (STP) and P concentrations in surface runoff and tile drainage [15,16,17,18,19,20]. However, agronomic testing programs were not designed to monitor potential water quality impacts of soil P, so modifications to these agronomic sampling approaches hold the potential to improve soil testing for environmental purposes.
Depth of sampling is one component of agronomic soil testing that could be adapted to better understand environmental P losses. Soil P can be highly stratified with greater P concentrations in the surface layer, particularly in no-till or reduced tillage systems [21,22,23]. In the WLEB, stratification of soil P in croplands was shown to be prevalent across the Sandusky river watershed, and was hypothesized to be a contributing factor to increasing DRP concentration trends in surface waters [18]. The shallow surface soil horizon is the dominant zone of interaction between soil P and surface runoff water and thus has a disproportionate influence on surface runoff P concentrations [24,25,26,27]. In contrast, water discharged via subsurface tile drains passes through the soil matrix thereby expanding the zone of interaction and increasing opportunities for P sorption or assimilation. However, the interaction between water and the soil matrix decreases where preferential macropore flow dominates, particularly in medium- and fine-textured soils, resulting in elevated P concentrations in tile discharge [28,29,30,31]. In these situations, tile drainage water chemistry may largely reflect the surface soil characteristics. Stratified soil sampling that quantifies soil P in the shallow zone of interaction (0–5 cm) in addition to the agronomic depth (0–20 cm) has the potential to better predict environmental P loss in surface runoff and tile drainage as compared to traditional soil sampling approaches that only quantify soil P in the agronomic depth.
The objective of this study was to determine whether a stratified soil sampling regime could explain more variability in environmental P losses than traditional agronomic depth samples. Stratified soil sampling was conducted on 39 fields distributed throughout NW Ohio, USA instrumented with edge-of-field (EoF) water quality monitoring, which enabled examination of relationships between STP and EoF P losses across a broad range of soil characteristics and management regimes. The hypothesis tested was that STP from shallow (0–5 cm) soil samples will better predict DRP and TP concentrations in both surface runoff and tile drainage compared to STP from agronomic (0–20 cm) soil samples. In addition, repeated soil sampling in individual fields enabled assessments of changes in STP and P stratification ratio (0–5 cm STP/0–20 cm STP; Pstrat) over the course of a 3-year study period.

2. Materials and Methods

2.1. Experimental Sites

Edge-of-field water quality monitoring was used to assess relationships between STP and surface runoff and tile drainage P concentrations across a network of 39 crop fields in the NW quadrant of Ohio underlain with artificial subsurface tile drainage systems. Field locations and management were previously described in detail [32,33]. Soils were medium to fine textured, with drainage classification of somewhat poorly drained to very poorly drained. Fields were nearly level to gently sloping (average slope range 0.4–5.1%; mean 1.6%), and were generally representative of regional topography, soils, and management practices (i.e., nutrient management, tillage, and subsurface drainage). General soil characteristics (textural class, slope, pH, soil organic matter) of the fields in this study are presented in Table S1. Field management was performed by farmers and followed common practices in the region. Soybean (Glycine max, (L.) Merr)-corn (Zea mays, L) rotations were the primary cropping system, but winter wheat (Triticum aestivum, L.), alfalfa (Medicago sativa, L.), and winter cover crops (various species) were also included in a subset of fields. Tillage practices ranged from multiple tillage passes each year to long-term no tillage. Soil fertility management typically consisted of springtime N fertilizer applications to corn and wheat and fall broadcast applications of P and K fertilizers once per crop rotation. Starter fertilizers containing N, P, and K were commonly applied at crop planting. Additionally, several fields received manure applications within 2 years of this study.

2.2. Runoff Phosphorus Concentrations

Surface and subsurface water quality was monitored from outlets at the edge of fields; sampling approach and instrumentation were described in depth by Williams et al. 2016 [32]. Contributing drainage areas for surface and subsurface flow were between 1.1–18.5 ha (mean = 8.1 ± 4.6 ha). Water quality data were collected via automated measurement of flow rate at 10-min intervals and automated collection of water samples using both time- and flow-weighted basis. Tile drain flow was monitored with compound weirs (Thel-Mar, Brevard NC, USA) and bubbler modules (Teledyne ISCO, Lincoln NE, USA), while surface runoff was measured with 0.6 m H-flumes (Tracom, Alpharetta GA, USA) and bubbler modules. Water samples were collected with Teledyne Isco (Lincoln, NE, USA) automated samplers. Event-based water samples were automatically collected on a flow-weighted basis from surface flumes for the entire period of record. For tile drainage and prior to 2015, samples were automatically collected on a time interval approach (aliquots collected every 6 h and composited for a 24 h period). Starting in 2015, the time interval samples were supplemented with additional event-based samples collected over the rise and fall of the hydrograph to better represent the discharge events. Event sampling was triggered by increased discharge, with a 200 mL aliquot taken for each 1 mm of volumetric depth. Ten aliquots were combined into a single 2 L sample. Event sampling ceased when flow ceased (surface runoff) or when flow declined to baseline levels (tile drainage). Water samples were retrieved from the field at least weekly and were stored at 4 °C until laboratory analysis.
Water samples were analyzed for both DRP and TP concentrations. Briefly, samples were split into two aliquots, with one filtered at 0.45 um for DRP analysis, and an unfiltered sample used for TP analysis. The unfiltered sample underwent alkaline-persulfate digestion prior to TP analysis [34]. The filtered (DRP) and digested (TP) samples were analyzed for orthophosphate concentration using a flow injection analyzer (Lachat Instruments, Loveland, CO, USA) via the ascorbic acid reduction method. The resulting discrete P concentration data were converted into 10 min P concentrations by linear interpolation. The 10 min constructed P concentration values were then multiplied by the corresponding 10 min flow values to calculate 10 min P loads [35]. Resulting load data were summed into daily cumulative P loads. Daily estimates of flow and P load were summed into total flow and P load for the relevant period of each soil sampling event (described below). The total P load over the period of a given soil sampling event was then divided by total flow from that period to calculate the flow-weighted mean DRP (FWM DRP) and TP concentrations (FWM TP) associated with the soil sampling event.

2.3. Soil Test Phosphorus

Stratified soil samples were collected from contributing field areas of each monitored outlet between December 2014 and December 2017. The frequency of soil sampling events within a given field depended on crop rotation, establishment of EoF water quality monitoring instrumentation, and resource availability; 14 EoF sites were sampled on three occasions, 24 sites were sampled twice, and two were sampled once. The surface runoff dataset included a total of 52 individual soil sampling events, while 86 soil sampling events were included in the tile drainage dataset. Each soil sampling event consisted of taking three to nine samples at discrete locations within a given field. Sampling locations were selected based on USDA-NRCS soil maps and local topography to ensure the sampling captured the variability in soils across the areas contributing to discharge at the field outlets. On average, one sample was collected for each 1.5 ha of contributing field area. Individual soil sampling locations were somewhat consistent from year to year, but limited precision of GPS coordinates meant subsequent samples were likely >10 m apart. Samples collected from 2014–2016 were taken with hand-held push probes (2 cm diameter) and the 2017 samples were collected using a hydraulic soil probe (5 cm diameter). At each location, five individual cores, distributed within ~2 m of a central point, were collected, split into 0–5 cm and 5–20 cm depths, and combined into one sample. Soil samples were air dried, ground, and analyzed for STP with Mehlich-3 extractant by the Ohio State University Service Testing and Research laboratory (Wooster, OH, USA). A simple average of the discrete STP data was used to estimate the field average STP concentration values, and within field variation in STP was characterized with the coefficient of variation (CV). The field average STP data were used to calculate the Pstrat for each field according to Equation (1):
P s t r a t =   [ STP ] 0 5   c m [ STP ] 5 20   c m
Management information was used to assign a range of dates for each soil sampling event for which the STP measurements were considered most relevant for predicting EoF runoff P concentrations. The period of relevance for a given soil sampling event could extend up to one year before and after the sampling date, which would correspond to soil sampling occurring once in a 2-year crop rotation. This period was truncated to less than 2 years if the field was subjected to either a tillage operation or a P fertilizer or manure application as these operations were expected to alter the STP concentrations and Pstrat. Additionally, if a P fertilizer or manure application occurred prior to the soil sampling event, the first 2 weeks following the application were also excluded from date range to restrict the influence of short-lived direct P fertilizer losses [4]. Thus, no P applications or tillage operations occurred during the period of relevance for the soil sampling events. Resulting lengths of the date ranges were from 159 to 673 days, with an average length of 384 days.

2.4. Statistical Analysis

Relationships between STP and FWM P concentrations were examined with ordinary least squares regressions. Prior to regression analysis, the FWM DRP and TP concentrations were natural log transformed to comply with normality assumptions. The goodness of fit of the resulting regressions was assessed using the coefficient of determination (R2) and root mean square error (RMSE; the standard deviation of the model residuals). The field average STP and the maximum STP value in each field were both tested as predictors of FWM DRP and TP, and regression model fits were compared. Residuals from the field average agronomic STP-FWM P concentration regressions were extracted and subsequently correlated with Pstrat, with Pearson’s r used to assess correlation strength. Multiple linear regressions were constructed in a stepwise manner from two predictor variables: agronomic STP and Pstrat. These predictor variables were checked for multicollinearity. The improvement in model fit provided by the addition of Pstrat to the agronomic STP model was further examined by extracting residuals from the simple regressions of agronomic STP vs. FWM-P concentration, as well as the multiple linear regression. For a given observation, the magnitude of the two model residuals were compared and the difference between residuals was analyzed for simple linear relationships to soil textural class, field average slope, agronomic STP, and average daily discharge.
In fields with more than one soil sampling event, the influence of management practices on changes in STP and Pstrat within the fields was examined. The effects of management factors on changes in STP and Pstrat (e.g., STP in soil sampling period 1—STP in soil sampling period 2) were tested with t-tests for three class variables (+/− P fertilizer, +/− manure, +/− tillage) and with ordinary least squares regression for the rate of P applied (only for fields that received manure or P fertilizer). Analyses were conducted in SAS v. 9.4 (SAS Institute, Cary NC, USA) and Sigmaplot (Systat Software, San Jose, CA, USA).

3. Results

3.1. Soil Test P

Shallow depth (0–5 cm) STP averaged 61 mg P kg−1 across the fields and agronomic depth (0–20 cm) STP averaged 40 mg P kg−1 for the tile drainage dataset (Table 1). Soil test P of individual fields ranged from 19–202 and 12–150 mg P kg−1 for the shallow and agronomic depths, respectively. Variability of STP within fields was high, with an average CV of 32–39% across all the sampling events and both depths, while 14% of the sampling events surpassed a CV of 50% (data not shown). The field average Pstrat was 1.88, with large variation among the studied fields (range 1.18–3.35).
Soil test P and Pstrat within individual fields showed a high degree of variability between subsequent soil sampling events (Table 2). The agronomic STP in a given field increased or decreased between subsequent soil sampling events by >15 mg P kg−1 in 12% of cases (average STP change: 9.4 ± 1.1 mg P kg−1). Shallow STP changed by >15 mg P kg−1 in 23% of cases (average STP change: 13.6 ± 2.1 mg P kg−1). Averaged across all fields and sampling events, the absolute change in STP was an increase of 1.8 ± 1.7 and 4.3 ± 3.1 mg P kg−1 for agronomic and shallow depths, respectively. Furthermore, in many fields the within field variability in STP demonstrated large changes between subsequent soil sampling events; for example, the CV for agronomic STP differed by >20% in 15 of the 48 soil sampling event comparisons (average CV change: 15.1 ± 2.1% for agronomic depth, 13.6 ± 1.8% for shallow depth). Similarly, the Pstrat often demonstrated significant within field changes, with 21% of cases changing by >0.50 between soil sampling events (average change: 0.43 ± 0.07).
Management practices occurring between soil sampling events generally did not consistently explain the observed changes in STP or Pstrat (Table S2). Manure application between soil sampling events was the only management factor that significantly influenced STP changes, where shallow and agronomic STP were 13.3 and 10.6 mg kg−1 greater, respectively, in fields with manure compared to those without (t test; t-statistics −2.3 and −3.4, P = 0.029 and P = 0.0014 for shallow and agronomic depths, respectively). However, neither chemical P fertilizer application (t test; t-statistics 0.41 and 1.1, P = 0.68 and P = 0.26 for shallow and agronomic depths, respectively) nor the amount of P applied between soil sampling events (regression; t-statistics 1.04 and 1.04, P = 0.3 and P = 0.3 for shallow and agronomic depths, respectively) influenced changes in STP. Similarly, changes in STP were not different in fields that were tilled between sampling events compared to fields that did not undergo a tillage operation (t test, t-statistic −0.35 and 0.01, P = 0.7 and P = 0.9 for shallow and agronomic depths, respectively). Additionally, changes in Pstrat were not related to form or amount of P applied or tillage (t-tests and regression, p-values > 0.52 for all).

3.2. Surface Runoff and Tile Drainage Phosphorus Concentrations

The average FWM DRP concentration in surface runoff across all soil sampling windows was 0.19 ± 0.02 mg DRP L−1, and the FWM TP concentration averaged 0.65 ± 0.05 mg TP L−1 (Table 1). Phosphorus concentrations were lower in tile drainage and averaged 0.066 ± 0.008 mg DRP L−1 and 0.28 ± 0.02 mg TP L−1. There was a high degree of variability in FWM P concentrations between the sampling windows, for example DRP concentrations ranged from 0.02–0.66 mg DRP L−1 for surface runoff and 0.01–0.27 mg DRP L−1 for tile drainage.

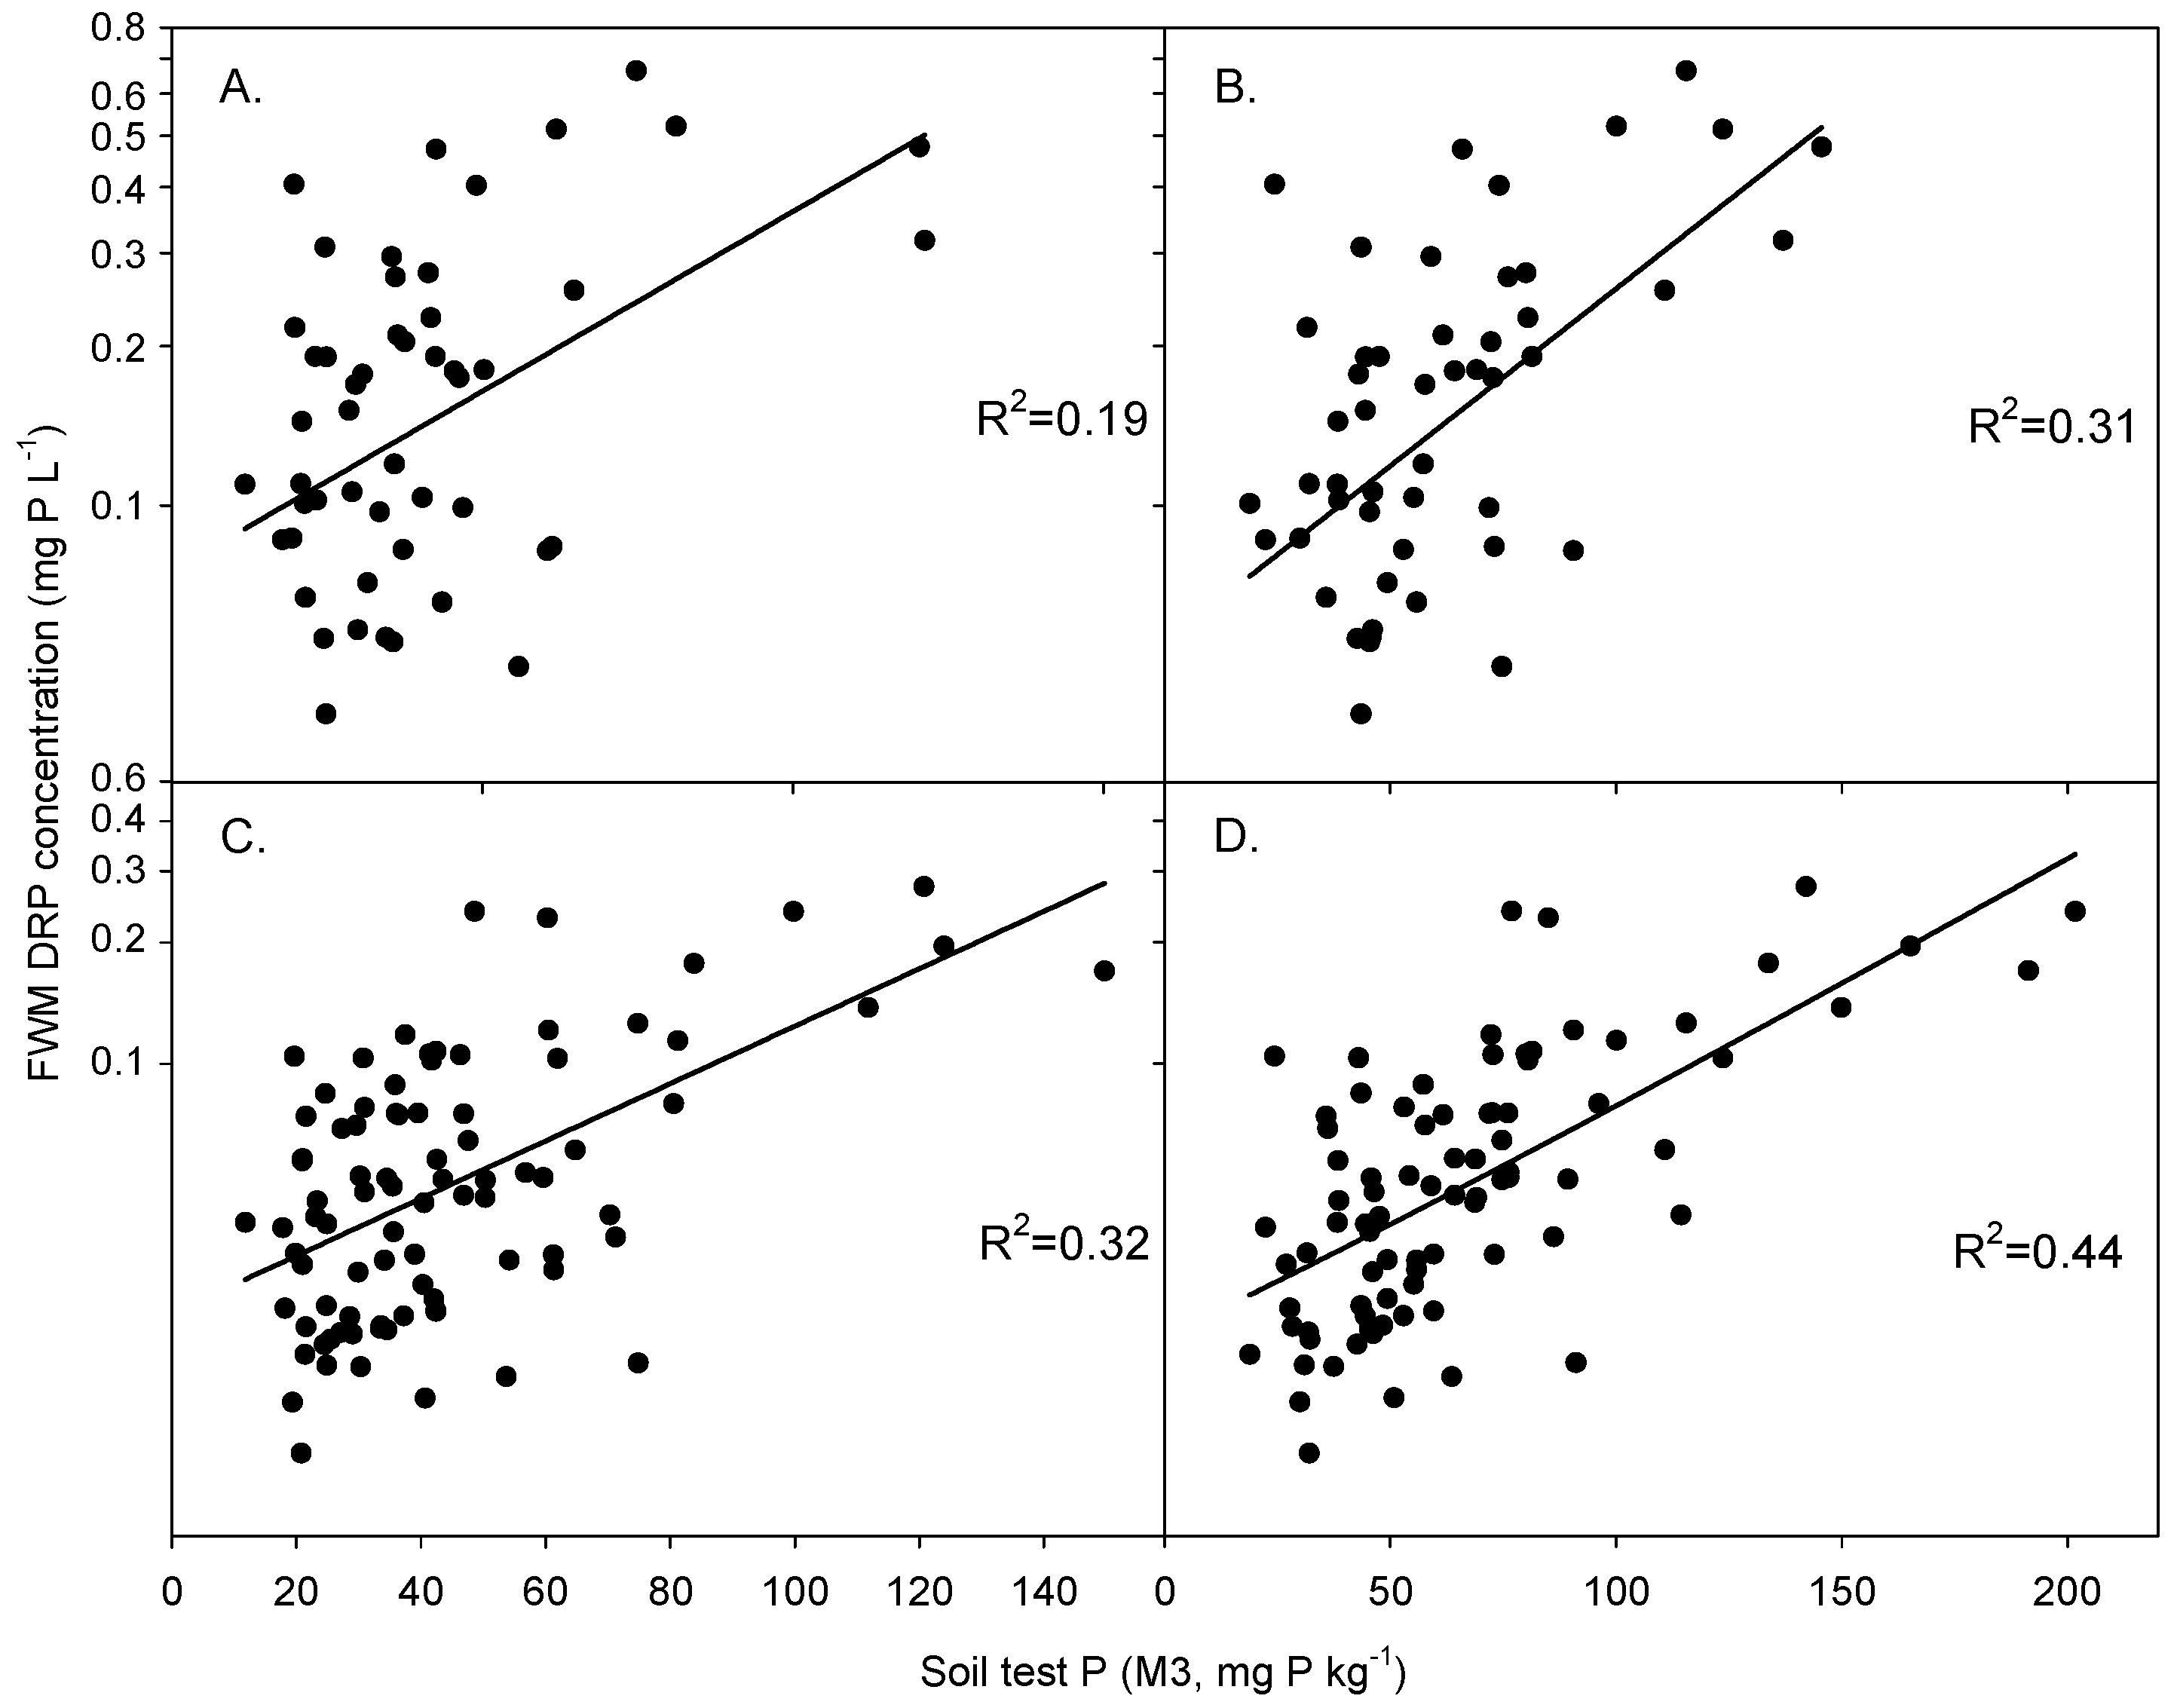
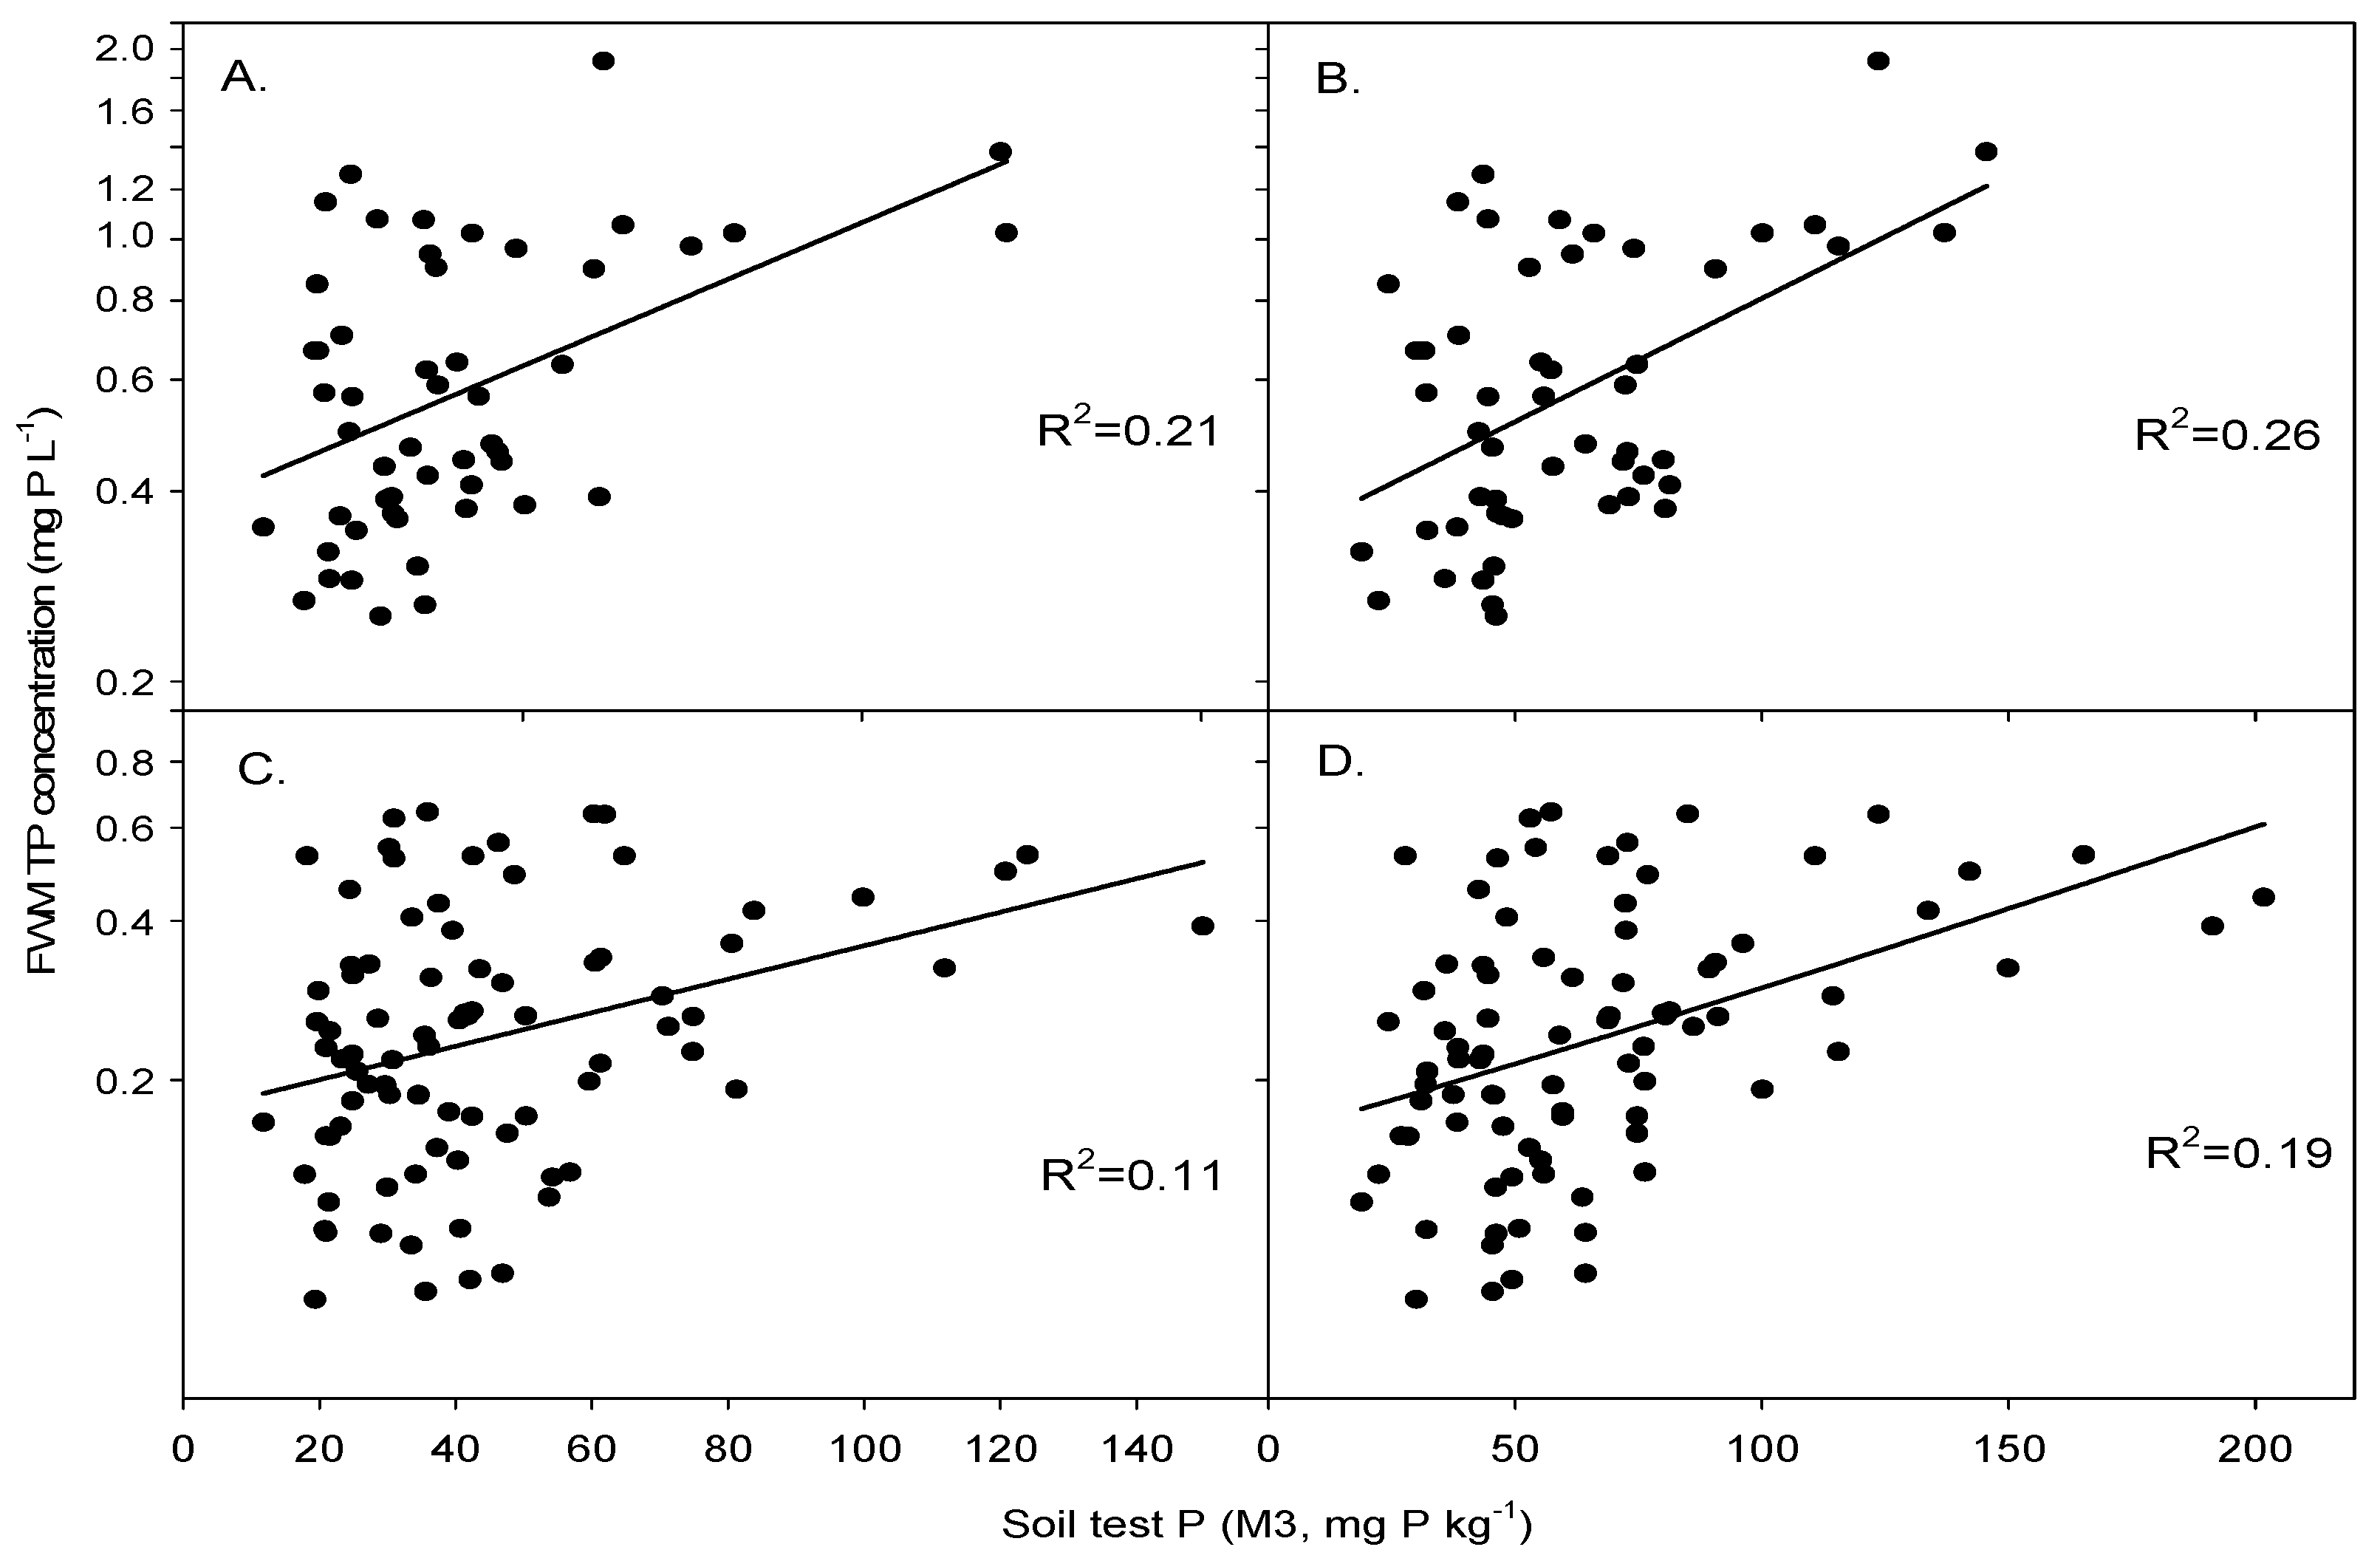
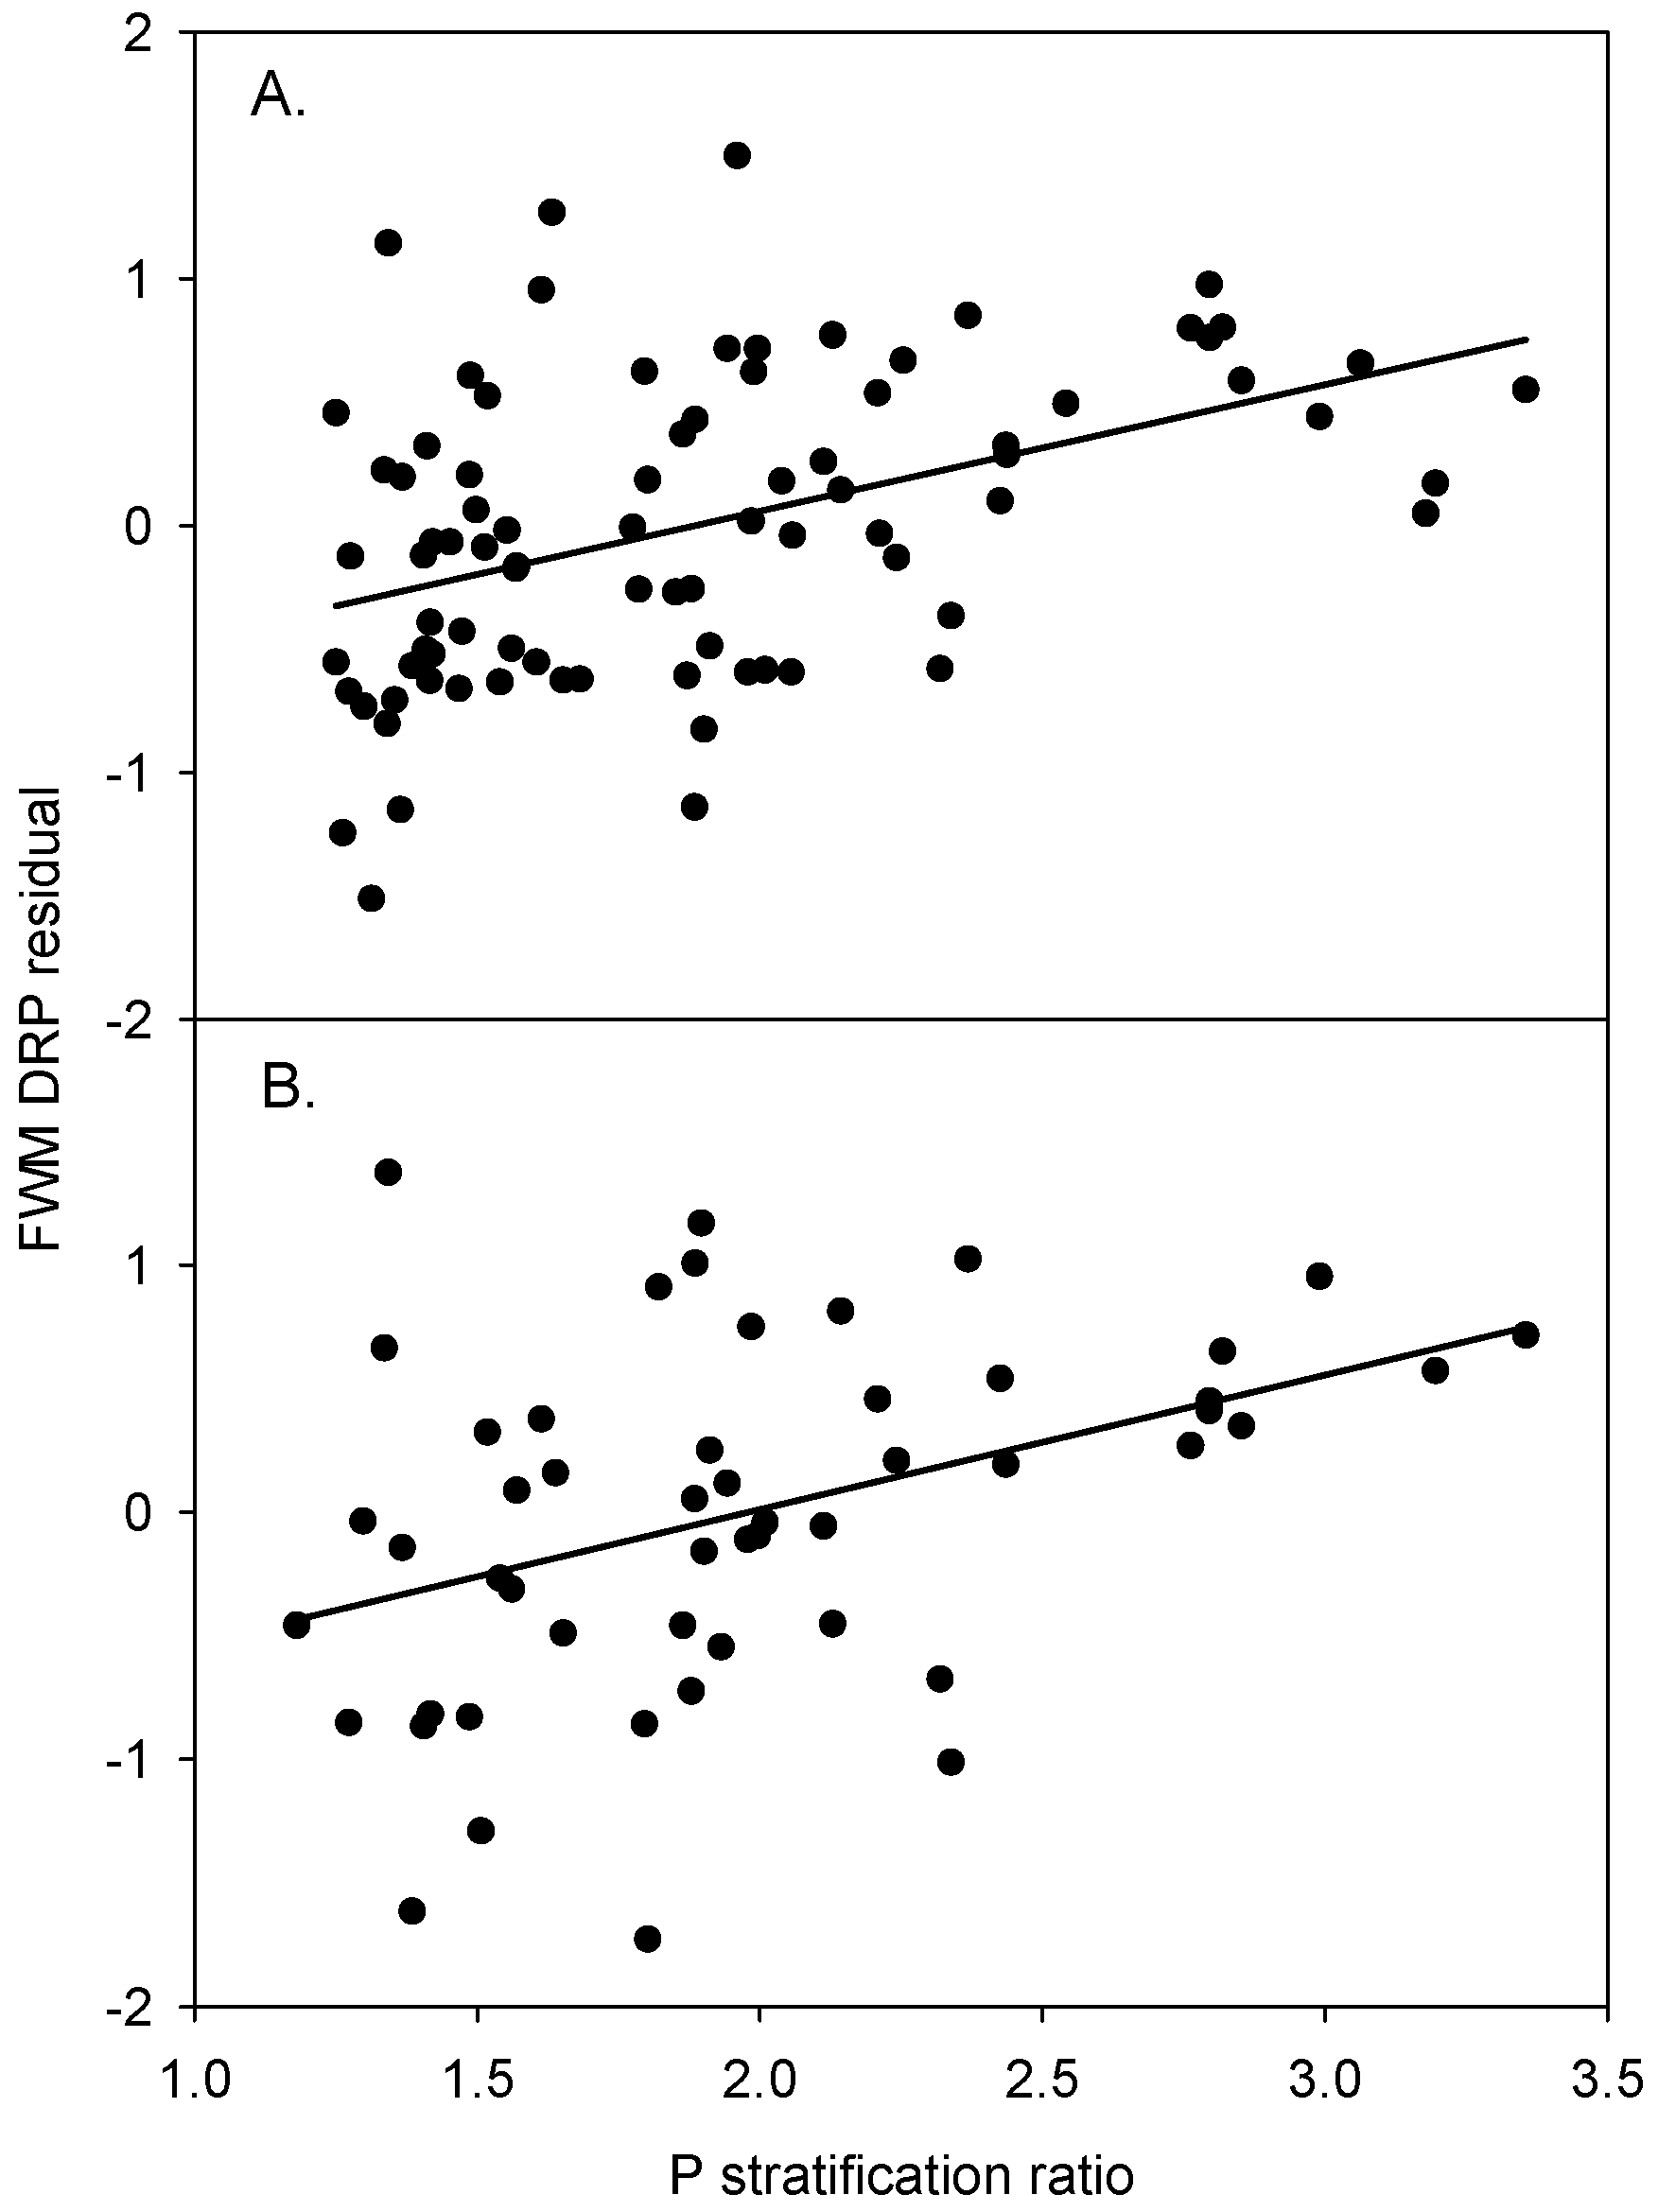
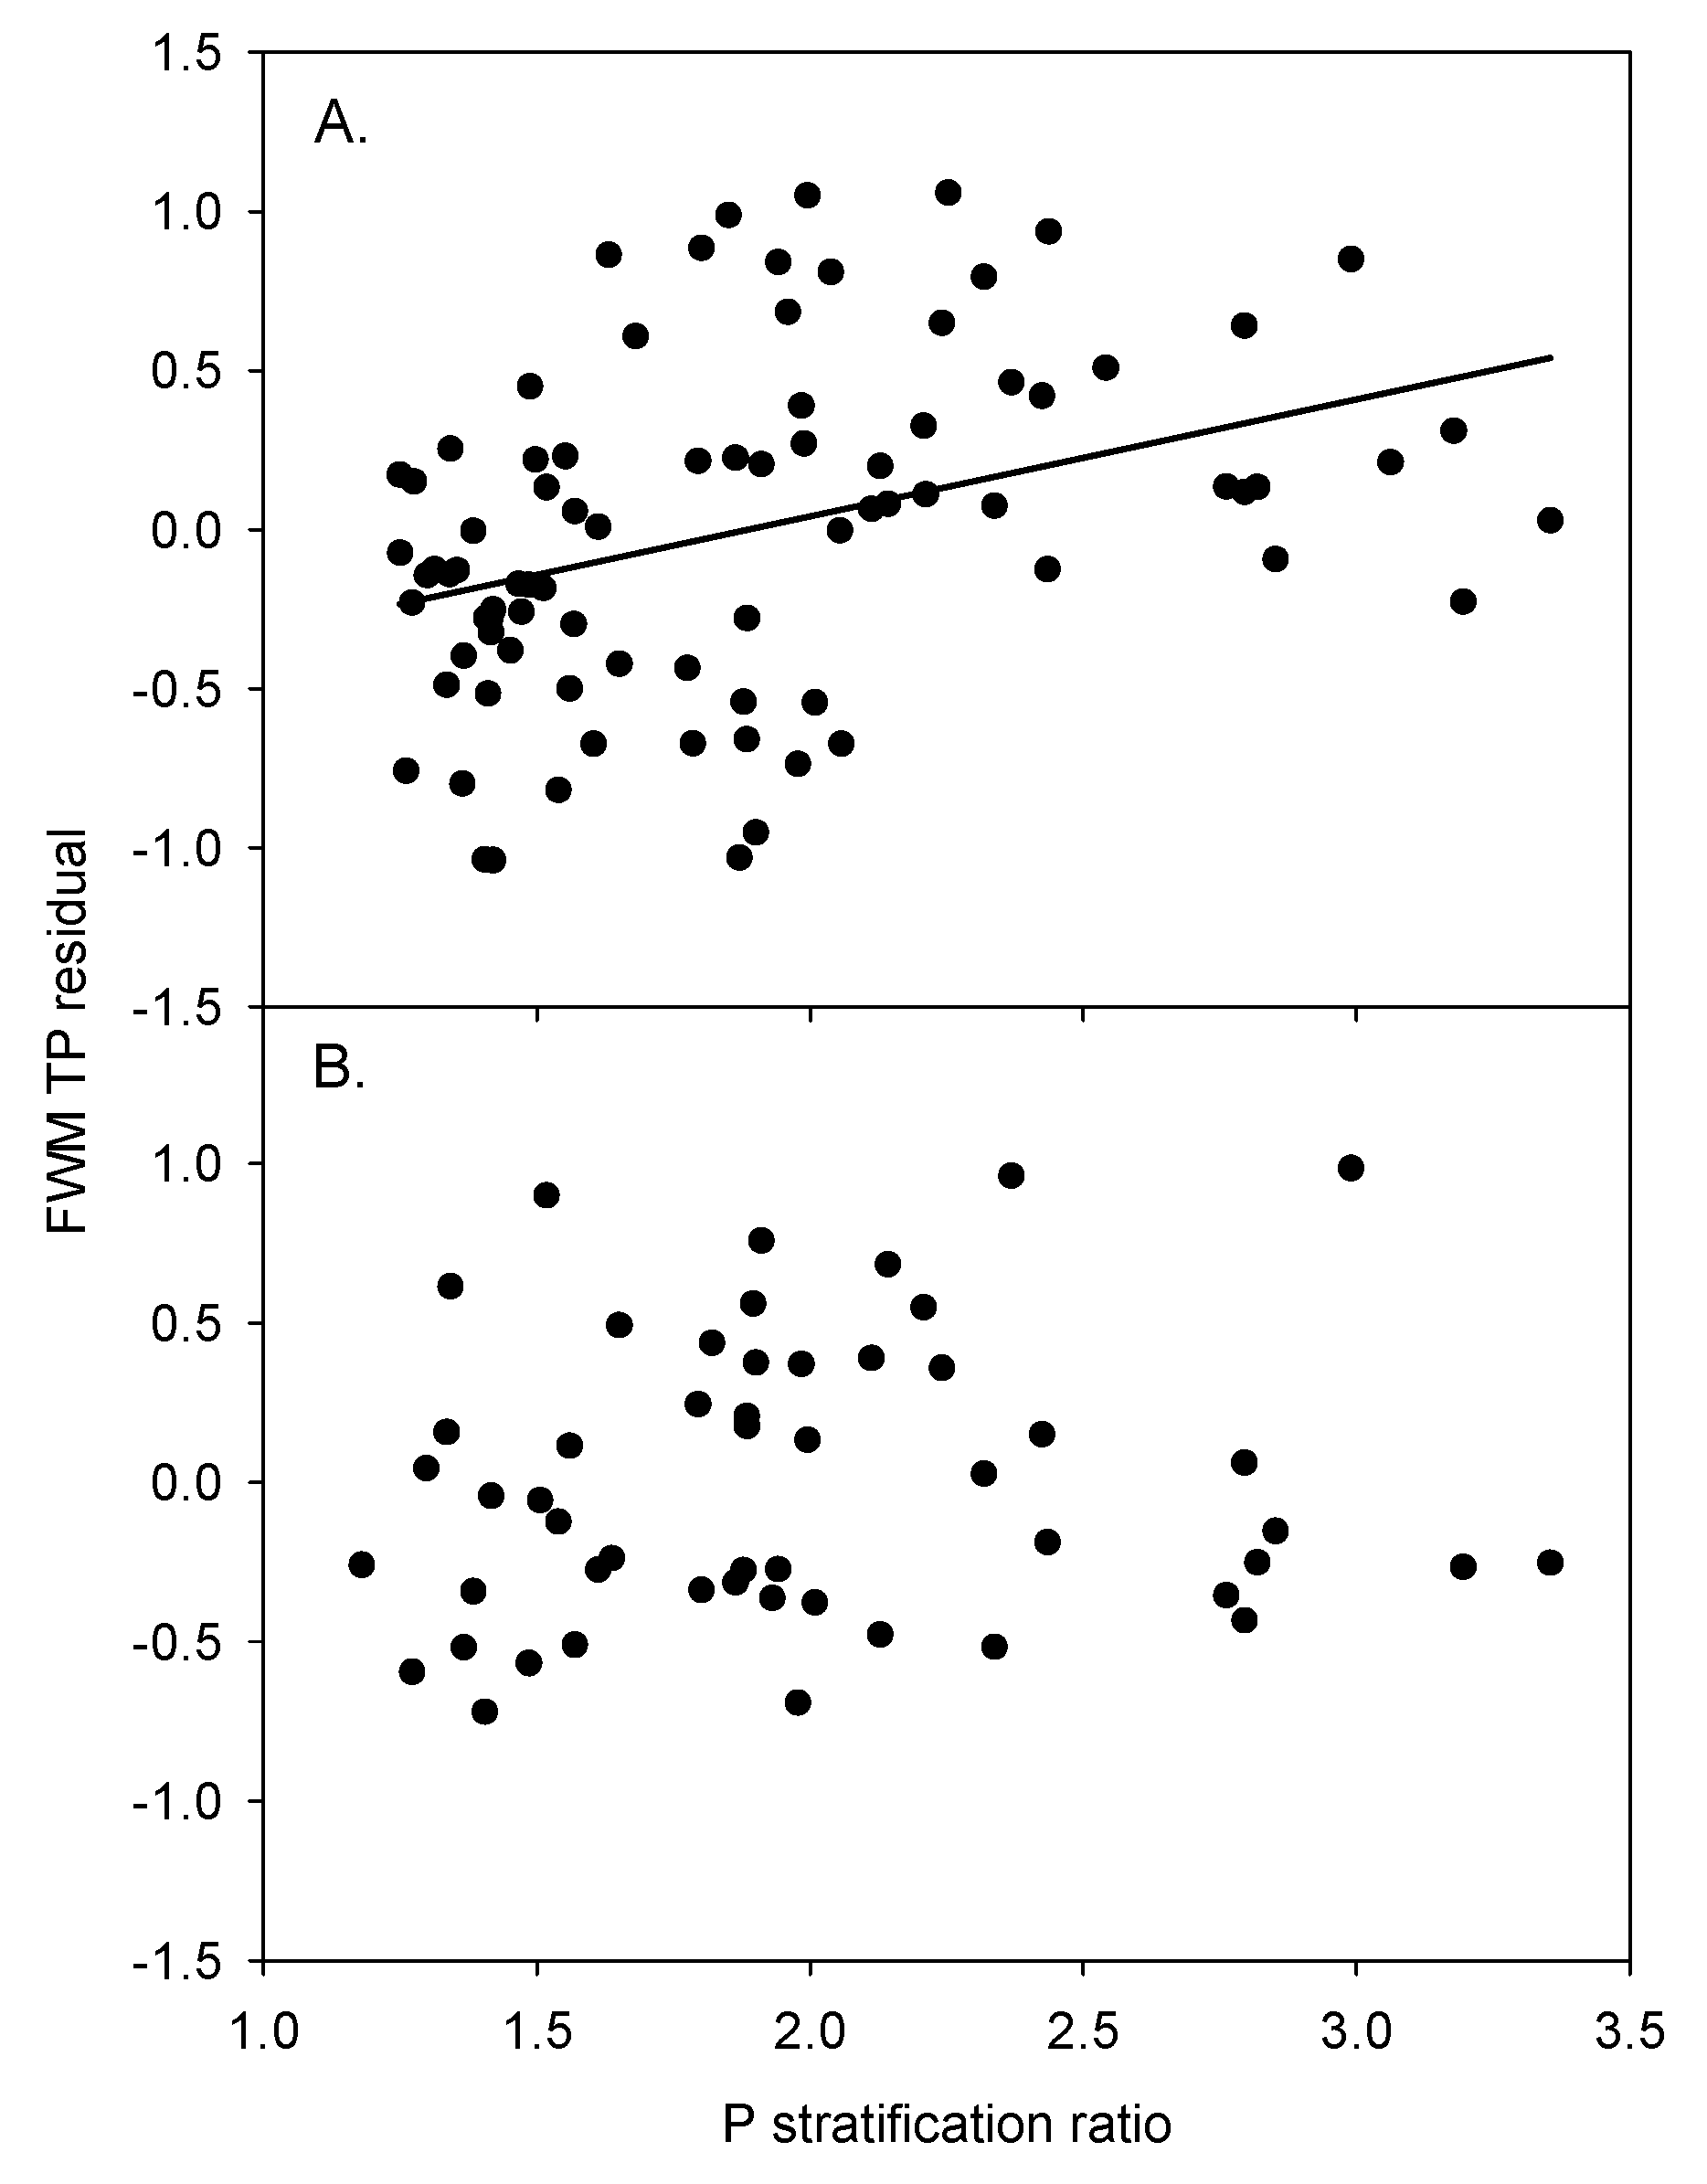
3.3. Relationships between STP and FWM P Concentrations

Positive relationships were observed between STP in both sampling depths and the FWM DRP concentrations in both surface runoff and tile drainage (Figure 1). For surface runoff DRP, similar regression slopes (0.015 vs. 0.016) were observed from relationships with shallow vs. agronomic STP, indicating that increases in agronomic or shallow STP resulted in similar increases in FWM DRP concentration (Table 3). However, shallow STP explained more variation in surface DRP concentration (R2 of 0.31 vs. 0.19) and improved the predictions of surface DRP concentration (RMSE of 0.66 vs. 0.72) compared to agronomic STP. For tile drainage DRP, regression slopes were also similar for relationships using both soil sampling depths (0.014 vs. 0.016). Greater variation in tile drainage DRP was explained with shallow STP (R2 of 0.44 vs. 0.32) and predictions likewise improved (0.56 vs. 0.62) (Table 2). Comparing R2 and RMSE values between surface and tile DRP models demonstrated that STP, measured from shallow and agronomic depths, was a stronger predictor of tile drainage DRP than surface DRP.
Flow-weighted mean TP concentrations in surface runoff and tile drainage was also positively related to STP in both sampling depths (Figure 2). However, the R2 of the regression models indicated that less variation in TP concentrations was explained by shallow and agronomic STP compared to DRP (Table 3). As observed with DRP, the slopes of both the surface runoff and tile drainage TP regressions were similar for agronomic and shallow depth samples. More variation in surface runoff TP was explained with shallow STP compared to agronomic STP (R2 0.26 and 0.21, respectively), but prediction accuracy similar (RMSE 0.44 and 0.45, respectively). The tile drainage TP showed similar patterns as surface runoff, with greater variation explained by shallow STP compared to agronomic STP (R2 0.19 and 0.11) and similar prediction accuracy (RMSE of 0.50 and 0.53). In general, differences between the predictive power of agronomic and shallow depth samples were lesser for TP than those observed for DRP.
Additionally, the maximum agronomic and shallow STP values in each field were also tested as a predictors of EoF P concentrations (Table S3). Maximum STP at both sampling depths was positively and significantly related to DRP and TP concentrations in surface runoff and tile drainage (regressions; R2 range 0.07 to 0.38, p < 0.05 for all). However, the field average shallow and agronomic STP model explained more variation and improved predictions of EoF P concentration data in all cases.
Residuals of the regression of DRP concentration against agronomic STP were positively correlated with Pstrat for both surface runoff (r = 0.34, p = 0.01) and tile drainage (r = 0.36, p < 0.001; Figure 3). A significant positive correlation between residual TP and Pstrat was also observed in tile drainage (r = 0.28, p < 0.01) but not surface runoff (Figure 4). The positive correlations indicate that fields with greater Pstrat tended to also have more positive residuals, i.e., runoff P concentrations were prone to underprediction by the agronomic STP. Likewise, runoff P concentrations in fields with lesser Pstrat were prone to over-prediction by agronomic STP.
Phosphorus stratification ratio was a significant factor when added to the regressions of agronomic STP vs. EoF P concentrations for surface DRP, tile DRP, and tile TP concentrations (Table 4). Interactions between STP and Pstrat were not significant and so were not included in the final model. However, Pstrat was not significant when added to the surface TP model. Model fit and explanatory power of the two factor models was similar or slightly better to that of the single factor shallow sample models (Table 3). In addition, comparison of residuals from the agronomic STP models to residuals from the agronomic STP + Pstrat models showed that the improvement in fit provided by addition of Pstrat was not related to soil texture class, field slope, STP, or average daily discharge for either DRP or TP (ANOVA and regressions; p > 0.05 for all; data not shown).

4. Discussion

4.1. Soil Test P

Soil test P values and Pstrat of individual fields were highly dynamic over the 3 years of this study, highlighting the importance of frequent soil sampling. A large portion of the observed STP changes between sampling events was presumably due to inherent within-field spatial variability in STP. This study used field average STPs derived from multiple samples that were taken at a sampling intensity (average of 1 sample per 1.5 ha) similar to that of commercial agronomic soil sampling in the WLEB. Other studies have shown agronomic STP frequently varies dramatically at the scale of 10 s of meters [36,37,38], so more intensive sampling may be required to improve the accuracy of calculated field average STP. This study was not designed to quantify the relationship between sampling intensity and STP variability, so further research will be required to quantify the soil sampling intensity needed to achieve acceptable precision of field average STP values.
Changes in STP and Pstrat can also be caused by management activities such as tillage and P fertilizer management (e.g., P rate, fertilizer placement) [21,39], and soil sampling schemes should take into account these management activities. However, in this study we did not see a large influence of management practices on changes in STP or Pstrat. For example, the amount of P applied between two soil sampling events, which ranged from 0–119 kg P ha−1 (Table S2), was not associated with statistically significant changes in STP, indicating that recent (i.e., within the past 3 years) P application rate was not a primary driver of STP over that period. Relatively large additions of P fertilizer are required to substantially increase STP. For instance, annual P applications of 44 kg ha−1 increased STP by only 2.5 mg kg−1 yr−1 at a location in Iowa [40] and, in Ohio, P fertilizer rates double the crop removal rate did not substantially increase STP after 9 years at three locations [41]. It is likely that within field variability in STP was much greater than changes induced by P fertilizer applications and consequently overwhelmed observation of these changes. In contrast, manure application was associated with increases in STP in subsequent soil sampling events, likely due in part to the relatively large amounts of P (average 44 kg P ha−1) added to the manured fields. Additionally, compared to chemical P fertilizer, manure may maintain a greater proportion of P in labile forms that are extracted by the Mehlich-3 extractant over a period of at least several months after application [42]. Manure application has been previously identified as a major factor driving P losses in runoff and tile drainage [43,44]. Interestingly, an earlier analysis of EoF water quality from the same fields used this study found that P losses were significantly greater in fields that received manure applications [45]. These results highlight the importance of manure management for addressing agricultural P losses, and affirm that the connections between manure application, STP, and P losses should be a priority for future research.
Tillage operations prior to a soil sampling event was not related to changes in STP or Pstrat. However, it is important to note that the tillage operations used were either vertical, non-inversion tillage or shallow tillage. Such conservation tillage operations limit the mixing of surface and deeper soil horizons, and thus typically maintain significant soil stratification [46,47]. A previous study suggested that one-time inversion tillage that fully eliminated P stratification could greatly reduce EoF P losses [18]. Our results provide evidence that non-inversion tillage practices will not substantially mitigate P stratification, but more intensive inversion tillage will be required to reduce the level of P stratification.
The limited influence of management on STP changes in this study is likely due in part to the soil sampling intensity and frequency. More intensive or frequent sampling may have strengthened our ability to identify management influences, but this study used a soil sampling intensity similar to commercial farms in the region so these results may be a reasonable approximation for the strength of individual fertilization and non-inversion tillage effects on STP that could be expected from commercially collected STP data across individual crop fields.

4.2. Relationships between STP and FWM P Concentrations

Stratified soil sampling provided improved prediction of environmental P losses compared to typical agronomic soil sampling. Shallow sample STP accounted for more variability in both surface runoff and tile drainage FWM P concentrations (DRP and TP) compared to agronomic sample STP. Additionally, the best model fits for surface runoff DRP and tile drainage DRP and TP were obtained with regressions using agronomic sample STP combined with Pstrat. Thus, widespread testing of stratified soil samples could be used to improve identification of fields in the WLEB with increased risk of environmental P losses due to high P stratification. Agronomic soil testing is currently widely employed by producers in the WLEB [48], so stratified soil sample collection and analysis could be readily integrated into existing soil testing efforts. However, producer incentives may be required to encourage widespread implementation since stratified soil sampling increases soil testing costs and provides little direct benefit to producers.
This study provided new evidence that stratified sampling was useful for improving predictions of P loss risk for soil types and geography common in the WLEB, but previous research from small experimental plots has provided mixed evidence that stratified soil sampling can improve relationships between environmental P losses and STP. For example, a rainfall simulation experiment on 4 soils in Texas showed that 0–5 cm soil samples produced stronger relationships between surface runoff DRP and STP compared to 0–15 cm samples for two soil types, but on two other soils the 0–15 cm samples produced the stronger relationships [26]. In Manitoba, surface runoff DRP from snowmelt was better predicted by 0–5 cm STP than 0–15 cm STP ([49] Wilson et al., 2019). Conversely, a rainfall simulation study in Wisconsin showed that shallow samples (0–2 cm) did not provide consistent improvements in relationships between surface runoff DRP and STP, relative to 0–15 cm samples [15]. Similarly in pasture soils shallow (0–2 cm) samples were not better predictors of surface runoff DRP than deeper (0–10 cm) samples [50]. Finally, sandy pasture soils under simulated rainfall showed no change in the relationship between surface runoff P concentrations and STP between several sample depths (0–2, 0–5, or 0–10 cm), but the soils in that study had relatively little P stratification [51]. The depth of agronomic sampling in this study (20 cm) likely caused greater distinction between sampling depths than studies with shallower sampling depths, enabling differentiation between these soil depths effects on EoF P concentrations. Additionally, removal of EoF observations immediately following P applications may have reduced variability in EoF P concentrations and enhanced our ability to identify differences in the relationships between STP and EoF P concentrations. Furthermore, the finely textured soils that dominate NW Ohio may favor the enhanced importance of surface soil layers to EoF water quality, as the zone of interaction with water is likely more limited than in coarsely textured soils with greater infiltration rates. Finally, this study encompassed a relatively large number of fields with a wide range of STP and Pstrat, which provided a sufficient range of conditions from which we were able to observe significant relationships between STP and EoF P concentrations. The predictive benefit of adding Pstrat to the agronomic STP models was not related to differences in soil texture, slope, or hydrologic conditions within this study, suggesting that soil P stratification was important across the full range of conditions in the studied fields. However, it should be noted that the patterns observed here may not extend to regions with differing climates, management regimes, and soil characteristics.
Concentrations of DRP were more closely related to STP and P stratification than TP concentrations, indicating that STP is relatively more important for understanding DRP losses compared to TP losses. Agronomic soil tests use extractants, including the Mehlich-3 extractant used in this study, that aim to indicate the plant availability of orthophosphate over the period of a growing season, and thus can be expected to relate relatively closely to DRP concentrations in runoff [51,52]. In contrast, TP in runoff typically includes a significant portion of sediment-bound particulate P that is not measured by soil tests. Surface runoff TP loss has been shown to be closely related to sediment loss which is controlled by multiple factors in addition to STP, such as soil erodibility, ground cover, and conservation practices [15,53]. Incorporating these factors into runoff P concentration predictions (in addition to STP) could further improve model predictive power, particularly for TP loss.
The relationships between STP and P concentrations in runoff reported in this work were based on EoF monitoring, and were unsurprisingly weaker than STP-runoff P concentration relationships previously reported from more controlled rainfall simulator studies (e.g., [15,26]). In this study, the variability in runoff P concentrations that was unexplained by STP is likely in large part a result of the EoF data collection effort occurring over the broad range of environmental conditions and management practices included in the USDA EoF network. Management and environmental factors are known to influence DRP and TP concentrations in runoff, and recent research has identified crop rotation [54], soil texture [55,56], tillage [57,58], and precipitation characteristics [59,60,61] as important factors that can influence surface runoff or tile drainage P concentrations. Regardless, this study demonstrated that the influence of STP on EoF P concentrations was readily observed despite the variability in management and environmental characteristics over time and space. Similarly, the benefits of stratified soil sampling were robust enough to be observed across a wide range of crop production scenarios. Thus, predictions of P losses, whether made using empirical relationships or process-based models, could be improved by enhanced efforts to gather and use information on soil P stratification.
An additional challenge of developing relationships at the field scale is the limited understanding of the variability in contributions to EoF water quality across a large field area with variable soil properties and topography. Improving the accuracy of predictions of environmental P losses from heterogeneous fields can be achieved through soil testing regimes that account for disproportionate contributions of field areas P losses, particularly through surface runoff [62,63]. Furthermore, in soils where macropores play a role in drainage, subsurface tile drains have been shown to have direct connection with surface soils above the drains [64,65]. Additionally, small “hotspots” of high STP within fields could potentially play a disproportionate role in determining EoF P concentrations [38,66]. In this study, the maximum observed STP did not provide better predictions of EoF P concentrations than the field average STP for either surface runoff or tile discharge, but a more intensive soil sampling regime may be necessary to effectively characterize P hotspots. While this study did not take into account any spatial variation in contributions to EoF water quality across the field areas, future research should investigate the feasibility of designing targeted environmental soil testing to account for spatial differences in contributions to EoF water quality in tile drained landscapes.
Soil P and runoff P concentrations were measured in a relatively large number of crop fields (39) in this study, yet how closely these fields represent the broader landscape of the WLEB remains an important question. A recent study of STP stratification in croplands in the WLEB presented results of over 140,000 soil samples [18]. The region-wide average STP presented in that study was similar to the average of the fields studied in this research; the agronomic (0–20 cm) STP averaged 48.1 mg kg−1 compared to 44 mg kg−1 in this study. Furthermore, in Baker et al., (2017) [18] 71% of agronomic STPs were <47 mg P kg−1, i.e., the state extension recommended range for “build-up” and “maintenance” of STP for corn, whereas in this study 69% of field average STPs were also below that threshold. Finally, on average surface (0–5 cm) STP was 68% higher compared to the 5–20 cm depth, resulting in an average Pstrat of 1.68 in Baker et al. (2017) [18], which was somewhat less than in this study (1.88). The greater P stratification in this study may be due to the high prevalence of no-till and non-inversion tillage in the fields included in the USDA-ARS EoF network [9]. However, the relatively close agreement between our study and the findings of Baker et al. (2017) [18] indicates that the relationships observed in this study should be expected to hold true across the broader WLEB.

5. Conclusions

Robust relationships between agronomic STP and P concentrations were observed across 39 production crop fields in Ohio. Phosphorus stratification varied widely across the fields, and P concentrations in both tile discharge and surface runoff were found to be related more closely to STP of shallow samples (0–5 cm) compared to the agronomic samples (0–20 cm). In fields with greater Pstrat, predicted EoF P concentrations using the agronomic sample STP resulted in systematic underestimation of tile discharge DRP and TP concentrations and surface runoff DRP concentration. The improvement in model predictive power from using shallow sample STP rather than agronomic sample STP was greater for DRP compared to TP. Additionally, both STP and Pstrat varied significantly within fields and were dynamic over time, highlighting the need for frequent and intensive soil sampling to accurately estimate the P status and risk of environmental P loss of fields. Overall, our results suggest stratified soil sampling can be a readily implemented method to improve understanding of the risk of environmental P losses in the WLEB.

Supplementary Materials

The following are available online at https://0-www-mdpi-com.brum.beds.ac.uk/2571-8789/4/4/67/s1, Table S1: Soil characteristics of fields monitored for edge-of-field P losses; Table S2: Initial values and changes (delta) in soil test phosphorus (STP), CV of STP, and P stratification ratio (Pstrat); Table S3: Linear regression results for field maximum STP vs. FWM P concentrations.

Author Contributions

K.K. conceived and designed the experiments; K.K., M.W., and E.D. performed the experiments; W.O., and E.D. analyzed the data; W.O. and B.H. wrote the paper. All authors have read and agreed to the published version of the manuscript.

Funding

The Ohio State University helped support this research through hosting the USDA ARS Soil Drainage Research Unit and providing academic access to faculty resources, libraries, and students. Funding for this project was provided by several sources including the 4R Research Fund (IPNI-2014- USA-4RN09), USEPA (DW-12-92342501-0), Conservation Innovation Grants (The Ohio State University: 69-3A75-12-231; Heidelberg University: 69-3A75-13-216), the Ohio Corn and Wheat Growers Association, the Ohio Soybean Association, the Ohio Farm Bureau, the NRCS Mississippi River Basin Initiative, the Nature Conservancy, the NRCS Cooperative Conservation Partnership Initiative, and the USDA Conservation Effects Assessment Project.

Acknowledgments

The authors would like to thank the landowners of the study sites who provided access to the fields and management data; Jedediah Stinner, Katie Rumora, Marie Pollock, Phil Levison and Sara Henderson for their help in data collection and site maintenance; and Eric Fischer for analytical expertise. This research was a contribution from the Long-term Agroecosystem Research (LTAR) network. The LTAR network is supported by the USDA. Mention of trade names or commercial products in this publication is solely for the purpose of providing specific information and does not imply recommendation or endorsement by the U.S. Department of Agriculture.

Conflicts of Interest

The authors declare no conflict of interest.

References

  1. Maccoux, M.J.; Dove, A.; Backus, S.M.; Dolan, D.M. Total and soluble reactive phosphorus loadings to Lake Erie. J. Great Lakes Res. 2016, 42, 1151–1165. [Google Scholar] [CrossRef] [Green Version]
  2. Scavia, D.; David Allan, J.; Arend, K.K.; Bartell, S.; Beletsky, D.; Bosch, N.S.; Brandt, S.B.; Briland, R.D.; Daloğlu, I.; DePinto, J.V.; et al. Assessing and addressing the re-eutrophication of lake erie: Central basin hypoxia. J. Great Lakes Res. 2014, 40, 226–246. [Google Scholar] [CrossRef]
  3. Stumpf, R.P.; Johnson, L.T.; Wynne, T.T.; Baker, D.B. Forecasting annual cyanobacterial bloom biomass to inform management decisions in Lake Erie. J. Great Lakes Res. 2016, 42, 1174–1183. [Google Scholar] [CrossRef]
  4. Withers, P.J.A.; Ulén, B.; Stamm, C.; Bechmann, M. Incidental phosphorus losses–are they significant and can they be predicted? J. Plant Nutr. Soil Sci. 2003, 166, 459–468. [Google Scholar] [CrossRef]
  5. Rowe, H.; Withers, P.J.A.; Baas, P.; Chan, N.I.; Doody, D.; Holiman, J.; Jacobs, B.; Li, H.; MacDonald, G.K.; McDowell, R.; et al. Integrating legacy soil phosphorus into sustainable nutrient management strategies for future food, bioenergy and water security. Nutr. Cycl. Agroecosyst. 2016, 104, 393–412. [Google Scholar] [CrossRef]
  6. King, K.W.; Williams, M.R.; Johnson, L.T.; Smith, D.R.; LaBarge, G.A.; Fausey, N.R. Phosphorus availability in western lake erie basin drainage waters: Legacy evidence across spatial scales. J. Environ. Qual. 2017, 46, 466–469. [Google Scholar] [CrossRef]
  7. Smith, D.R.; King, K.W.; Johnson, L.; Francesconi, W.; Richards, P.; Baker, D.; Sharpley, A.N. Surface runoff and tile drainage transport of phosphorus in the midwestern USA. J. Environ. Qual. 2015, 44, 495–502. [Google Scholar] [CrossRef]
  8. Van Esbroeck, C.J.; Macrae, M.L.; Brunke, R.I.; McKague, K. Annual and seasonal phosphorus export in surface runoff and tile drainage from agricultural fields with cold temperate climates. J. Great Lakes Res. 2016, 42, 1271–1280. [Google Scholar] [CrossRef]
  9. Pease, L.A.; King, K.W.; Williams, M.R.; LaBarge, G.A.; Duncan, E.W.; Fausey, N.R. Phosphorus export from artificially drained fields across the eastern corn belt. J. Great Lakes Res. 2018, 44, 43–53. [Google Scholar] [CrossRef]
  10. Beetstra, M.A.; Tellez, C.; Wilson, R. 4R Nutrient Stewardship in the Western Lake Erie Basin Part II: A Panel Study; The Ohio State University: Columbus, OH, USA, 2017. [Google Scholar]
  11. Vitosh, M.L.; Johnson, J.W.; Mengel, D.B. Tri-State Fertilizer Recommendations for Corn, Soybeans, Wheat, and Alfalfa; Ohio State University Agricultural Extension Bulletin E-2567: Columbus, OH, USA, 1995. [Google Scholar]
  12. Williams, M.R.; King, K.W.; Dayton, E.; LaBarge, G.A. Sensitivity analysis of the ohio phosphorus risk index. Trans. ASABE 2015, 58, 93–102. [Google Scholar] [CrossRef]
  13. Kleinman, P.J.A.; Sharpley, A.N.; Buda, A.R.; Easton, Z.M.; Lory, J.A.; Osmond, D.L.; Radcliffe, D.E.; Nelson, N.O.; Veith, T.L.; Doody, D.G. The promise, practice, and state of planning tools to assess site vulnerability to runoff phosphorus loss. J. Environ. Qual. 2017, 46, 1243–1249. [Google Scholar] [CrossRef] [PubMed] [Green Version]
  14. Reid, K.; Schneider, K.; McConkey, B. Components of phosphorus loss from agricultural landscapes, and how to incorporate them into risk assessment tools. Front. Earth Sci. 2018, 6, 135. [Google Scholar] [CrossRef] [Green Version]
  15. Andraski, T.W.; Bundy, L.G. Relationships between phosphorus levels in soil and in runoff from corn production systems. J. Environ. Qual. 2003, 32, 310–316. [Google Scholar] [CrossRef] [PubMed]
  16. Djodjic, F. Phosphorus leaching in relation to soil type and soil phosphorus content. J. Environ. Qual. 2004, 33, 7. [Google Scholar] [CrossRef]
  17. Vadas, P.A.; Kleinman, P.J.A.; Sharpley, A.N.; Turner, B.L. Relating soil phosphorus to dissolved phosphorus in runoff: A single extraction coefficient for water quality modeling. J. Environ. Qual. 2005, 34, 572–580. [Google Scholar] [CrossRef] [Green Version]
  18. Baker, D.B.; Johnson, L.T.; Confesor, R.B.; Crumrine, J.P. Vertical stratification of soil phosphorus as a concern for dissolved phosphorus runoff in the Lake Erie basin. J. Environ. Qual. 2017, 46, 1287–1295. [Google Scholar] [CrossRef] [Green Version]
  19. Duncan, E.W.; King, K.W.; Williams, M.R.; LaBarge, G.; Pease, L.A.; Smith, D.R.; Fausey, N.R. Linking soil phosphorus to dissolved phosphorus losses in the midwest. Agric. Environ. Lett. 2017, 2, 170004. [Google Scholar] [CrossRef]
  20. Osterholz, W.R.; Hanrahan, B.R.; King, K.W. Legacy Phosphorus concentration–discharge relationships in surface runoff and tile drainage from Ohio crop fields. J. Environ. Qual. 2020, 49, 675–687. [Google Scholar] [CrossRef]
  21. Sharpley, A.N. Soil mixing to decrease surface stratification of phosphorus in manured soils. J. Environ. Qual. 2003, 32, 1375. [Google Scholar] [CrossRef]
  22. Messiga, A.J.; Ziadi, N.; Morel, C.; Grant, C.; Tremblay, G.; Lamarre, G.; Parent, L.-E. Long term impact of tillage practices and biennial p and n fertilization on maize and soybean yields and soil P status. Field Crops Res. 2012, 133, 10–22. [Google Scholar] [CrossRef]
  23. Smith, D.R.; Huang, C.; Haney, R.L. Phosphorus fertilization, soil stratification, and potential water quality impacts. J. Soil Water Conserv. 2017, 72, 417–424. [Google Scholar] [CrossRef] [Green Version]
  24. Ahuja, L.R.; Sharpley, A.N.; Yamamoto, M.; Menzel, R.G. The depth of rainfall-runoff-soil interaction as determined by 32 P. Water Resour. Res. 1981, 17, 969–974. [Google Scholar] [CrossRef]
  25. Daniel, T.C.; Edwards, D.R.; Sharpley, A.N. Effect of extractable soil surface phosphorus on runoff water quality. Trans. ASAE 1993, 36, 1079–1085. [Google Scholar] [CrossRef] [Green Version]
  26. Torbert, H.A.; Daniel, T.C.; Lemunyon, J.L.; Jones, R.M. Relationship of soil test phosphorus and sampling depth to runoff phosphorus in calcareous and noncalcareous soils. J. Environ. Qual. 2002, 31, 1380–1387. [Google Scholar] [CrossRef]
  27. Kleinman, P.; Sharpley, A.; Buda, A.; McDowell, R.; Allen, A. Soil Controls of phosphorus in runoff: Management barriers and opportunities. Can. J. Soil Sci. 2011, 91, 329–338. [Google Scholar] [CrossRef]
  28. Gächter, R.; Ngatiah, J.M.; Stamm, C. Transport of phosphate from soil to surface waters by preferential flow. Environ. Sci. Technol. 1998, 32, 1865–1869. [Google Scholar] [CrossRef]
  29. Williams, M.R.; King, K.W.; Ford, W.; Buda, A.R.; Kennedy, C.D. Effect of tillage on macropore flow and phosphorus transport to tile drains: Tillage, macropore flow, and phosphorus. Water Resour. Res. 2016, 52, 2868–2882. [Google Scholar] [CrossRef] [Green Version]
  30. Plach, J.M.; Macrae, M.L.; Williams, M.R.; Lee, B.D.; King, K.W. Dominant glacial landforms of the lower great lakes region exhibit different soil phosphorus chemistry and potential risk for phosphorus loss. J. Great Lakes Res. 2018, 44, 1057–1067. [Google Scholar] [CrossRef]
  31. Williams, M.R.; King, K.W.; Duncan, E.W.; Pease, L.A.; Penn, C.J. Fertilizer placement and tillage effects on phosphorus concentration in leachate from fine-textured soils. Soil Tillage Res. 2018, 178, 130–138. [Google Scholar] [CrossRef]
  32. Williams, M.R.; King, K.W.; Ford, W.; Fausey, N.R. Edge-of-Field research to quantify the impacts of agricultural practices on water quality in Ohio. J. Soil Water Conserv. 2016, 71, 9A–12A. [Google Scholar] [CrossRef] [Green Version]
  33. King, K.W.; Williams, M.R.; LaBarge, G.A.; Smith, D.R.; Reutter, J.M.; Duncan, E.W.; Pease, L.A. Addressing agricultural phosphorus loss in artificially drained landscapes with 4R nutrient management practices. J. Soil Water Conserv. 2018, 73, 35–47. [Google Scholar] [CrossRef]
  34. Patton, C.J.; Kryskalla, J.R. Methods of Analysis by the U.S. Geological Survey National Water Quality Laboratory: Evaluation of Alkaline Persulfate Digestion as an Alternative to Kjeldahl Digestion for the Determination of Total and Dissolved Nitrogen and Phosphorus in Water; Water Resources Investigations Report 03-4174; United States Geological Survey: Denver, CO, USA, 2003.
  35. Williams, M.R.; King, K.W.; Macrae, M.L.; Ford, W.; Van Esbroeck, C.; Brunke, R.I.; English, M.C.; Schiff, S.L. Uncertainty in nutrient loads from tile-drained landscapes: Effect of sampling frequency, calculation algorithm, and compositing strategy. J. Hydrol. 2015, 530, 306–316. [Google Scholar] [CrossRef]
  36. Mallarino, A.P. Spatial variability patterns of phosphorus and potassium in no-tilled soils for two sampling scales. Soil Sci. Soc. Am. J. 1996, 60, 1473–1481. [Google Scholar] [CrossRef]
  37. Lauzon, J.D.; O’Halloran, I.P.; Fallow, D.J.; von Bertoldi, A.P.; Aspinall, D. Spatial variability of soil test phosphorus, potassium, and ph of ontario soils. Agron. J. 2005, 97, 524–532. [Google Scholar] [CrossRef]
  38. Grandt, S.; Ketterings, Q.M.; Lembo, A.J.; Vermeylen, F. In-field variability of soil test phosphorus and implications for agronomic and environmental phosphorus management. Soil Sci. Soc. Am. J. 2010, 74, 1800–1807. [Google Scholar] [CrossRef]
  39. Mallarino, A.P.; Borges, R. Phosphorus and potassium distribution in soil following long-term deep-band fertilization in different tillage systems. Soil Sci. Soc. Am. J. 2006, 70, 702–707. [Google Scholar] [CrossRef]
  40. Dodd, J.R.; Mallarino, A.P. Soil-Test phosphorus and crop grain yield responses to long-term phosphorus fertilization for corn-soybean rotations. Soil Sci. Soc. Am. J. 2005, 69, 1118–1128. [Google Scholar] [CrossRef]
  41. Fulford, A.M.; Culman, S.W. Over-fertilization does not build soil test phosphorus and potassium in ohio. Agron. J. 2018, 110, 56–65. [Google Scholar] [CrossRef] [Green Version]
  42. Laboski, C.A.M.; Lamb, J.A. Changes in soil test phosphorus concentration after application of manure or fertilizer. Soil Sci. Soc. Am. J. 2003, 67, 544–554. [Google Scholar] [CrossRef]
  43. Kleinman, P.J.A.; Sharpley, A.N.; Moyer, B.G.; Elwinger, G.F. Effect of mineral and manure phosphorus sources on runoff phosphorus. J. Environ. Qual. 2002, 31, 2026–2033. [Google Scholar] [CrossRef]
  44. Macrae, M.L.; English, M.C.; Schiff, S.L.; Stone, M. Intra-annual variability in the contribution of tile drains to basin discharge and phosphorus export in a first-order agricultural catchment. Agric. Water Manag. 2007, 92, 171–182. [Google Scholar] [CrossRef]
  45. Hanrahan, B.R.; King, K.W.; Williams, M.R.; Duncan, E.W.; Pease, L.A.; LaBarge, G.A. Nutrient balances influence hydrologic losses of nitrogen and phosphorus across agricultural fields in northwestern Ohio. Nutr. Cycl. Agroecosyst. 2019, 113, 231–245. [Google Scholar] [CrossRef]
  46. Deubel, A.; Hofmann, B.; Orzessek, D. Long-term effects of tillage on stratification and plant availability of phosphate and potassium in a loess chernozem. Soil Tillage Res. 2011, 117, 85–92. [Google Scholar] [CrossRef]
  47. Büchi, L.; Wendling, M.; Amossé, C.; Jeangros, B.; Sinaj, S.; Charles, R. Long and short term changes in crop yield and soil properties induced by the reduction of soil tillage in a long term experiment in Switzerland. Soil Tillage Res. 2017, 174, 120–129. [Google Scholar] [CrossRef]
  48. Wilson, R.S.; Beetstra, M.A.; Reutter, J.M.; Hesse, G.; Fussell, K.M.D.; Johnson, L.T.; King, K.W.; LaBarge, G.A.; Martin, J.F.; Winslow, C. Commentary: Achieving phosphorus reduction targets for Lake Erie. J. Great Lakes Res. 2019, 45, 4–11. [Google Scholar] [CrossRef]
  49. Wilson, H.; Elliott, J.; Macrae, M.; Glenn, A. Near-surface soils as a source of phosphorus in snowmelt runoff from cropland. J. Environ. Qual. 2019, 48, 921–930. [Google Scholar] [CrossRef] [Green Version]
  50. Hart, M.R.; Cornish, P.S. Soil sample depth in pasture soils for environmental soil phosphorus testing. Commun. Soil Sci. Plant Anal. 2010, 42, 100–110. [Google Scholar] [CrossRef]
  51. Schroeder, P.D.; Radcliffe, D.E.; Cabrera, M.L. Rainfall timing and poultry litter application rate effects on phosphorus loss in surface runoff. J. Environ. Qual. 2004, 33, 2201–2209. [Google Scholar] [CrossRef]
  52. Pote, D.H.; Daniel, T.C.; Sharpley, A.N.; Moore, P.A.; Edwards, D.R.; Nichols, D.J. Relating extractable soil phosphorus to phosphorus losses in runoff. SOIL Sci. Soc. Am. J. 1996, 60, 855–859. [Google Scholar] [CrossRef]
  53. Renard, K.; Foster, G.; Weesies, G.; McCool, D.; Yoder, D. Predicting Soil Erosion by Water: A Guide to Conservation Planning with the Revised Universal Soil Loss Equation (RUSLE); Agriculture Handbook; U.S. Department of Agriculture: Washington DC, USA, 1997.
  54. Smith, D.R.; Francesconi, W.; Livingston, S.J.; Huang, C. Phosphorus losses from monitored fields with conservation practices in the Lake Erie basin, USA. AMBIO 2015, 44, 319–331. [Google Scholar] [CrossRef] [Green Version]
  55. Cox, F.R.; Hendricks, S.E. Soil test phosphorus and clay content effects on runoff water quality. J. Environ. Qual. 2000, 29, 1582–1586. [Google Scholar] [CrossRef]
  56. Penn, C.J.; Mullins, G.L.; Zelazny, L.W. Mineralogy in relation to phosphorus sorption and dissolved phosphorus losses in runoff. Soil Sci. Soc. Am. J. 2005, 69, 1532–1540. [Google Scholar] [CrossRef] [Green Version]
  57. Gaynor, J.D.; Findlay, W.I. Soil and phosphorus loss from conservation and conventional tillage in corn production. J. Environ. Qual. 1995, 24, 734–741. [Google Scholar] [CrossRef]
  58. Jarvie, H.P.; Johnson, L.T.; Sharpley, A.N.; Smith, D.R.; Baker, D.B.; Bruulsema, T.W.; Confesor, R. Increased soluble phosphorus loads to Lake Erie: Unintended consequences of conservation practices? J. Environ. Qual. 2017, 46, 123–132. [Google Scholar] [CrossRef] [PubMed] [Green Version]
  59. Vidon, P.; Cuadra, P.E. Phosphorus dynamics in tile-drain flow during storms in The US Midwest. Agric. Water Manag. 2011, 98, 532–540. [Google Scholar] [CrossRef]
  60. Williams, M.R.; King, K.W.; Baker, D.B.; Johnson, L.T.; Smith, D.R.; Fausey, N.R. Hydrologic and biogeochemical controls on phosphorus export from western Lake Erie tributaries. J. Great Lakes Res. 2016, 42, 1403–1411. [Google Scholar] [CrossRef] [Green Version]
  61. Pease, L.A.; Fausey, N.R.; Martin, J.F.; Brown, L.C. Weather, landscape, and management effects on nitrate and soluble phosphorus concentrations in subsurface drainage in the western Lake Erie basin. Trans. ASABE 2018, 61, 223–232. [Google Scholar] [CrossRef]
  62. Buda, A.R.; Kleinman, P.J.A.; Srinivasan, M.S.; Bryant, R.B.; Feyereisen, G.W. Effects of hydrology and field management on phosphorus transport in surface runoff. J. Environ. Qual. 2009, 38, 2273–2284. [Google Scholar] [CrossRef] [Green Version]
  63. Sharpley, A.; Jarvie, H.P.; Buda, A.; May, L.; Spears, B.; Kleinman, P. Phosphorus legacy: Overcoming the effects of past management practices to mitigate future water quality impairment. J. Environ. Qual. 2013, 42, 1308–1326. [Google Scholar] [CrossRef] [Green Version]
  64. Shipitalo, M.J.; Gibbs, F. Potential of earthworm burrows to transmit injected animal wastes to tile drains. Soil Sci. Soc. Am. J. 2000, 64, 2103–2109. [Google Scholar] [CrossRef]
  65. Frey, S.K.; Rudolph, D.L.; Conant, B. Bromide and chloride tracer movement in macroporous tile-drained agricultural soil during an annual climatic cycle. J. Hydrol. 2012, 460–461, 77–89. [Google Scholar] [CrossRef]
  66. Penn, C.J.; Bryant, R.B.; Needelman, B.; Kleinman, P. Spatial distribution of soil phosphorus across selected New York dairy farm pastures and hay fields. Soil Sci. 2007, 172, 797–810. [Google Scholar] [CrossRef]
Figure 1. Regression relationships between soil test P (STP) and flow-weighted mean dissolved reactive P (FWM DRP) concentrations. Surface runoff FWM DRP vs. STP in the (A) agronomic soil horizon (0–20 cm) and (B) the shallow soil horizon (0–5 cm). Tile drainage FWM DRP vs. STP in the (C) agronomic soil horizon and the (D) shallow soil horizon. Regressions were performed on log transformed runoff P concentrations; data are plotted in original units with log-scale x-axis.
Soilsystems 04 00067 g001
Figure 2. Regression relationships between soil test P (STP) and flow weighted mean total P (FWM TP) concentrations (natural log transformed). Surface runoff FWM TP vs. STP for the (A) agronomic soil horizon (0–20 cm) and the (B) surface cm soil horizon (0–5 cm). Tile drainage FWM TP vs. STP for the (C) agronomic soil horizon and the (D) surface soil horizon. Regressions were performed on log transformed runoff P concentrations; data are plotted in original units with log-scale x-axis.
Soilsystems 04 00067 g002
Figure 3. Correlation between residual FWM DRP (from regression of agronomic STP (0–20 cm depth) vs. natural log transformed FWM DRP concentrations) and the P stratification ratio for tile drainage (A) and surface runoff (B).
Soilsystems 04 00067 g003
Figure 4. Correlation between residual FWM TP (from regression of agronomic STP (0–20 cm depth) vs. natural log transformed FWM TP concentrations) and the P stratification ratio for tile drainage (A) and surface runoff (B).
Soilsystems 04 00067 g004
Table 1. Soil test P (STP) concentrations and P stratification ratios (Pstrat) across soil sampling events at 39 fields, and edge-of-field discharge and dissolved reactive P (DRP) and total P (TP) flow weighted mean (FWM) concentrations during the relevant sampling windows.
Surface Runoff *Tile Drainage *
MeanMedianMin.Max.MeanMedianMin.Max.
STP (mg P kg−1)0–5 cm615419145665719202
0–20 cm403512121443712150
STP coefficient of variation (%)0–5 cm35316833229283
0–20 cm3934710836331108
Pstrat 1.981.901.183.351.881.801.253.35
FWM DRP Conc (mg L−1)0.190.150.020.660.070.050.010.27
FWM TP Conc (mg L−1)0.650.530.251.910.280.240.080.64
Total discharge (mm)2832422073587649279
* Surface runoff soil sampling windows n = 52; tile drainage n = 86 P stratification ratio.
Table 2. Summary of changes in soil test P (STP), STP coefficient of variation, and P stratification ratio (Pstrat) between subsequent soil sampling events in individual fields.
Observed Increases (#)Observed Decreases (#)Mean of Absolute Values *Largest Decrease *Largest Increase *
STP0–5 cm301814−52102
0–20 cm31179−3225
STP coefficient of variation0–5 cm301814−5337
0–20 cm252315−7853
Pstrat 25230.43−1.551.87
* STP = mg P kg−1, coefficient of variation = % P stratification ratio.
Table 3. Regression results for field average soil test P vs. flow weighted mean dissolved reactive P (DRP) and total P (TP) concentrations. Regressions were performed on natural log transformed FWM P concentrations.
DRPTP
Regression Slope *Regression Intercept *R2RMSERegression Slope *Regression Intercept *R2RMSE
Surface runoff
0–5 cm samples0.015−2.900.310.660.009−1.110.260.44
0–20 cm samples0.016−2.590.190.720.01−0.980.210.45
Tile drainage
0–5 cm samples0.014−3.900.440.560.007−1.870.190.50
0–20 cm samples0.016−3.730.320.620.007−1.750.110.53
* P concentration data were log transformed prior to regression; all regression slopes and intercepts were significant at the p < 0.01 level.
Table 4. Multiple linear regression results predicting edge-of-field FWM P concentrations with agronomic soil test P (STP) and P stratification ratio (Pstrat). Regressions were performed on natural log transformed FWM P concentrations.
Model *R2RMSE
Surface runoff
FWM DRP0.020 × STP + 0.59 × Pstrat − 3.920.340.66
FWM TP0.010 × STP − 0.980.210.45
Tile drainage
FWM DRP0.019 × STP + 0.53 × Pstrat − 4.810.460.56
FWM TP0.009 × STP + 0.38 × Pstrat − 2.530.240.49
* Model factors were significant at the p < 0.01 level.
Publisher’s Note: MDPI stays neutral with regard to jurisdictional claims in published maps and institutional affiliations.

