Article

Biochar Effects on Soil Physiochemical Properties in Degraded Managed Ecosystems in Northeastern Bangladesh

1
Department of Forestry and Environmental Science, Shahjalal University of Science and Technology, Sylhet 3114, Bangladesh
2
Institute of Forestry and Conservation, John H. Daniels Faculty of Architecture, Landscape, and Design, University of Toronto, 33 Willcocks Street, Toronto, ON M5S 3B3, Canada
*
Author to whom correspondence should be addressed.
Submission received: 18 October 2020 / Revised: 24 November 2020 / Accepted: 24 November 2020 / Published: 27 November 2020

Abstract

:
A body of emerging research shows the promise of charcoal soil amendments (“biochars”) in restoring fertility in degraded agricultural and forest soils. “Sustainable biochars” derived from locally produced waste biomass and produced near the application site are of particular interest. We tested the effects of surface applications of wood-derived biochars (applied at 7.5 t·ha−1) on soil physiochemical properties (N, P, K, pH, soil moisture content, organic matter content, and bulk density) in three land-use types: agriculture (Camellia sinensis monoculture), agroforestry (C. sinensis with shade trees), and secondary forest (Dipterocarpus dominated) assessed over seven months. We found significant positive effects of biochar on soil physiochemical properties in all land-use types, with the strongest responses in the most degraded tea monoculture sites. Although biochar had no significant effect on soil N and K, it improved soil P—the primary nutrient most commonly limiting in tropical soils. Biochar also enhanced soil moisture and organic matter content, reduced bulk density, and increased soil pH in monoculture sites. Our results support the general hypothesis that biochar can improve the fertility of degraded soils in agricultural and forest systems in Bangladesh and suggest that biochar additions may be of great benefit to the most degraded soils.

1. Introduction

Soil degradation is an acute problem in managed tropical soils, which can substantially decrease crop production and soil ecosystem services [1]. Soil remediation tools such as biochars, or charcoals used to amend soils, have been suggested as a means to help overcome limitations common in tropical systems. Biochars are recalcitrant forms of pyrogenic carbon produced via pyrolysis, i.e., the thermal degradation of biomass in atmospheres devoid of oxygen [2]. They are porous and have high surface areas with substantial negative charges, properties that can substantially increase soil cation exchange capacity (CEC) [3] and nutrient and water retention [4]. Biochars are also capable of sorbing or otherwise reducing the bioavailability of a variety of phytotoxic soil contaminants, including residual pesticides [5], allelochemicals [6], metals [7], and salts [8]. Freshly applied biochars readily leach ash rich in carbonates of K, Ca, and Mg, which often significantly lime soils [9], which can enhance the availability of P and K in nutrient-deficient acidic tropical soils [4,10]. Biochars also enhance soil organic matter and may mitigate compaction in degraded tropical soils [11]. Biochars also offer a potential solution to maintaining soil fertility: they have higher CEC than most other forms of organic matter (OM), mobilize pulses of nutrients, in particular base cations [12], and are resistant to mineralization [13]. Data syntheses report the largest positive biochar effects on crops in tropical agricultural soils, resulting from strong liming and supply of base cations to (relatively) acidic and nutrient-deficient tropical soils [14]. However, while biochar has been reported to increase the pH of acidic tropical agricultural soils in lab incubations, it is unclear whether liming and base-cation-supply effects persist under field conditions [15].
“Sustainable biochar” is a term given to biochar derived from locally procured waste biomass such as crop residues, composts, and forestry by-products [16]. A significant benefit associated with biochar use as a soil amendment is its ability to sequester carbon from the atmosphere and transfer it to the soil—potentially for centuries due to its recalcitrance [17]. In addition to net sequestration of CO2 [16], biochar may reduce soil emissions of other more potent greenhouse gases such as N2O and CH4 [18]. In tropical countries with enormous demand for food and fuelwood, two key factors constrain soil fertility and sustainable management of soils: rapid mineralization of soil OM and pervasive nutrient leaching. The most pronounced limitations are for alluvial soils where frequent flooding (often exacerbated by climate change: [19]) depletes both the pool of nutrients available for plant uptake and OM in the substrate, thus reducing the potential to retain future nutrient inputs [20]. Indeed, some soils in tropical agricultural systems are estimated to have lost as much as 20–80 tC·ha−1 over ~20 years [21]. To mitigate these losses, soil amendments high in OM, such as compost or woodchips, are regularly used, but enhancements are transient, as OM is rapidly decomposed [22]. Sustainable biochars produced from locally made kilns are potentially a low-tech and scalable option to address these problems.
Tropical forests, including managed plantations, are threatened by intensifying natural and anthropogenic disturbance regimes, and dry deciduous forests in Indo–Burma ecosystems are especially understudied and vulnerable to anthropogenic impacts. Soil physiochemical characteristics have been greatly altered due to the removal of forest vegetation [23]. Several studies have reported that deforestation reduces soil quality through the loss of soil organic matter (SOM) and CEC [24], loss of N and other nutrients [25], reduced porosity, infiltration and water holding capacity [26], increased pH [27], and increased bulk density [28]. As with degraded agricultural soils, biochar amendments may enhance soil quality and productivity in forest restoration. Meta-analyses of tree growth responses to biochar revealed the greatest positive effects for tropical trees compared to temperate and boreal species [29], a pattern consistent with pervasive P limitation in tropical soils [30]. However, there are very few field trials examining biochar effects on woody plants in the tropics. In situ tests of biochar effects on the soils of degraded dry deciduous forests of Asia are nonexistent, as are biochar trials in agroforestry systems in this region.
Progressive degradation of soils has been a major concern in Bangladesh for decades [31]. SOM content in Bangladesh commonly falls below the 2% (mass-based) threshold considered necessary for successful crop production in the region [32,33]. The SOM-deficient area in Bangladesh is about 7.6 million ha, of which 54% is severely deficient. Moreover, a good portion of this soil is low in secondary nutrients (e.g., S, Ca, Mg) and micronutrients (e.g., B, Zn, Cu, Fe) [34]. Repeated chemical fertilization has deposited salts in potentially phytotoxic concentrations in many agricultural soils in the region [35]. Degradation of forest soil is also widespread in Bangladesh, and deforestation is vastly outpacing renewal [36]; nearly half of the total forest area is estimated to be plantation forests [37]. Thus, biochar applications are of broad interest as a potentially cost-effective and sustainable means to enhance soil fertility in various managed ecosystems, including agricultural crops, agroforestry systems, and plantation forests.
This study assesses the effects of sustainably produced biochar additions as surface applications on the physiochemical properties of representative agricultural, agroforestry, and regenerating forest soils in northeastern Bangladesh in field trials monitored over seven months. Differences in the nature and degree of soil degradation among these systems will likely result in distinct responses to biochar addition. We hypothesized that biochar addition would improve soil nutrient availability and retention as well as increase pH and organic matter content across all systems. We also hypothesized that the greatest magnitude of effects on soil properties would occur soon after application and would be most pronounced in the most degraded soils.

2. Materials and Methods
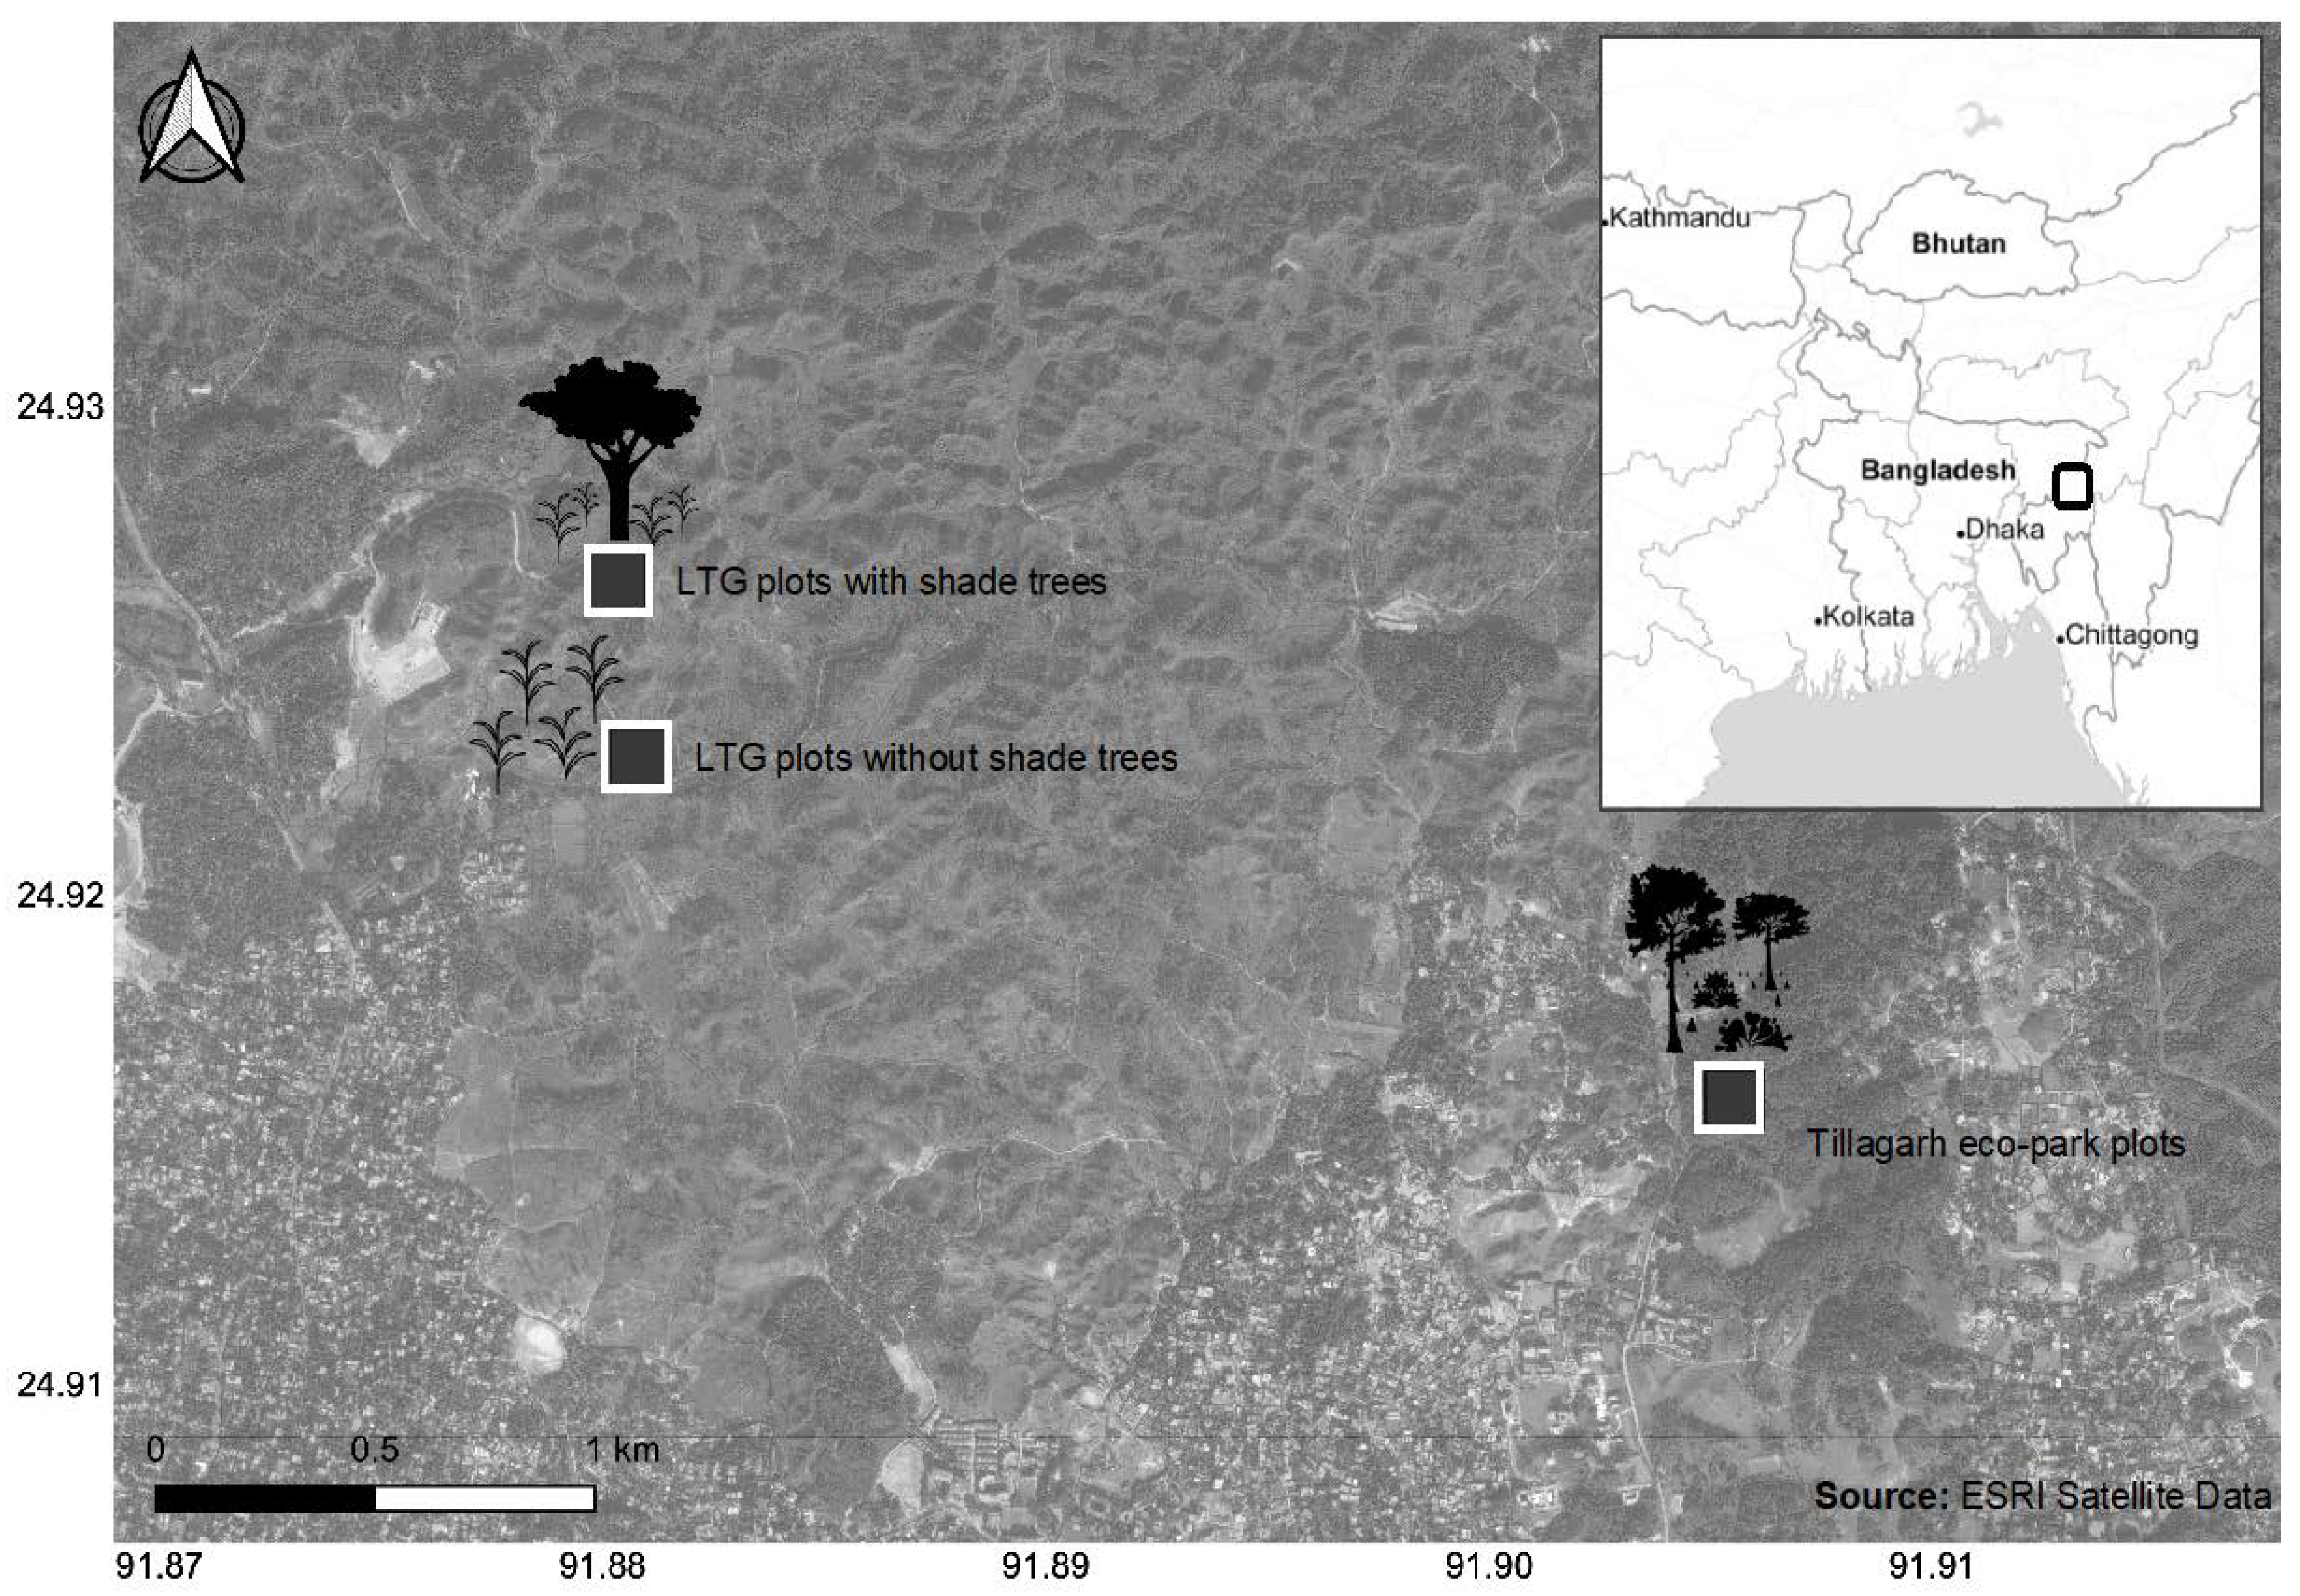
2.1. Study Area

The experiment was conducted at two locations, separated by approximately 5 km in the northeastern region of Bangladesh (Sylhet). The first location, Lakkatura tea garden (24.91°–24.92° N and 91.90°–91.91° E; hereafter “LTG”), is among the largest federal producers of tea (Bangladesh National Tea Board) with an area of ~1293 ha (Figure 1). LTG cultivates tea (monocultures of Camellia sinensis), sometimes with shade trees (Albizia odoratissima (L.f.) Benth. (Leguminosae) and Melia azedarach L. (Meliaceae)) planted between rows of tea (~100 trees·ha−1). In May 2016, we established the “agricultural” and “agroforestry” land-use plots at LTG, nine years after the combined planting of the tea plants and intercropped shade trees.
In the second location, also in May 2016, we established the “forest” land-use type plots at Tilagarh eco-park (23°55′–25°02′ N and 90°55′–92°30′ E; hereafter “TLG”) (Figure 1). TLG has a total bounded area of 44 ha of protected forests—the result of significant planting of sal (Shorea robusta Roth) and garjan (Dipterocarpus turbinatus C.F. Gaertn.) in 1965, 1975, and 1985. Since then, the secondary forests have reached the understory re-initiation stage of stand development (sensu [38]) and are colonized by natural recruits from the adjacent mature tropical evergreen and semi-evergreen forests. Notably, chapalish (Artocarpus chama Buch. Ham.) has reached canopy and shares equal dominance with sal and garjan as the dominant species mixture (~75%); stem diameter of canopy trees ranges from 11–50 cm [39]. The understory is a mixture of woody plants and herbs with some vertical stratification. Common natural recruits are, in order of their relative abundance: Licuala spinosa Roxb., Rhynchanthus longiflorus Hook., Lagerstroemia speciose Pers., Mesua ferrea L., and Bombax ceiba L. The topography of TLG is undulating, with heterogeneous hillocks of varied elevations, i.e., peaks at ~51 m and low-lying valleys at ~26 m (Google Maps). Like the tea garden, the operations of TLG are managed federally (by the Bangladesh Forest Department).
Most Bangladeshi soils can be generally classified as “alluvial soils”—seasonal flooding and drought make them poorly developed, eroded, and highly leached. These soils typically lack organic matter and vary in nutritional status depending on the history of land-use. Soils in the northeastern region of Bangladesh are either Entisols or Inceptisols, which are locally classified as eastern Surma-Kushiyara floodplain soils [40]. Forest soils in the hillocks of TLG have calcareous parent material composed of siltstone and mudstones; the texture is spatially variable in ranging from clay to sandy loams. The soils of LTG are more acidic, sandy, and originate from alluvial sediments belonging to Agro-ecological Zone 20 [41].
The climate of the region (in both locations) is subtropical with predominant hot summers and monsoon rains (May–Oct) with average maximum temperatures of 31 °C, and dry winters (Dec–Jan) with a minimum average temperature of 19 °C [42]. Nearly 80% of the annual average rainfall of 3000–4000 mm occurs between May and September [39]. All three land-uses considered in this experiment have almost identical climatic conditions.

2.2. Sampling Design

The experiment involved 18 plots of 20 m × 20 m in size across the two locations. In May 2016, two biochar treatments, 0 (control) and 7.5 t·ha−1, were applied to these plots. At LTG: 2 land-use types × 3 replicates × 2 biochar dosages = 12 plots; and at TLG: 1 land-use type × 3 replicates × 2 biochar dosages = 6 plots. At each of the locations, a randomized block design was used. Plots for each land-use type were separated by a minimum of two meters and were established on flat terrain.

2.3. Biochar Production and Characterization of Physiochemical Properties

We produced biochar using locally available and accessible biomass and pyrolysis technologies. The feedstock used consisted of “offcuts” from a small sawmill of a commonly planted legume, Acacia auriculiformis A.Cunn. ex Benth. The pyrolysis unit used to produce charcoal from wood biomass was low-tech: an open conical “flame curtain” kiln similar in design to the “Kon Tiki” kiln [43]. The truncated-cone-shaped kiln had 1.65 m top diameter, 0.80 m bottom diameter, 0.90 m height, and a total volume of 1.10 m3. To initiate pyrolysis, we filled the kiln to ~25% capacity with feedstock and ignited the feedstock from the top. Once a vortex sufficient to expel oxygen (as indicated by the absence of smoke in the off-gases) was created, feedstock was continuously added until the kiln was filled to ~80% capacity. The average pyrolysis time was ~3.5 h with an average and maximum temperature of ~450 °C and ~550 °C, respectively (measured with an infrared thermometer). To reduce the concentration of low molecular weight organic compounds inherent within biochars [44], we water-washed biochars for 30 min immediately after removal from the kiln and then sun-dried for three days before their application in plots by hand to the soil surface.
Mass-based concentrations of total C (%) and N (%) inherent in the Acacia biochars were determined through combustion analyses. Two milligrams of dry ground samples were analyzed on a LECO 628 CN analyzer (LECO Corporation, St. Joseph, MI, USA). Oven-dried samples were used for the elemental analysis to determine Al, Ag, As, Au, Ba, Be, Bi, Ca, Cd, Ce, Co, Cr, Cu, Cs, Fe, Hf, K, La, Li, Na, Nb, Ni, P, Rb, Pb, S, Mg, Mn, Mo, Sb, Sc, Sn, Sr, Ta, Th, Ti, U, V, W, Y, and Zn. Biochar samples were ground to a fine powder and then analyzed by 4-acid digestion (hydrofluoric acid, followed by a mixture of nitric and perchloric acids, and solubilized using a mixture of nitric and hydrochloric acid) followed by inductively coupled plasma mass spectrometry (ICP-MS) performed by Activation Laboratories Ltd. (Ancaster, ON, Canada). Oven-dried (at 105 °C until the mass change was stable at ≤0.0005 g) biochar samples were used to determine volatile matter and ash content following standardized methodology (ASTM D1762-84) using a muffle furnace. Biochar samples were heated with the furnace door open for 2 min at 300 °C, then for 3 min at 500 °C, and finally for 6 min at the same temperature with the furnace door closed to determine the volatile matter (%). The same samples were used to determine ash content by heating them overnight in the muffle furnace at 750 °C. pH and EC (electrical conductivity) were determined on dry biochar samples mixed with deionized water at a ratio of 1:10 using an Orion Star A112 Benchtop pH/EC meter (Thermo Fisher Scientific, Waltham, MA, USA). Bulk density (g.cm−3) was determined using the uncompacted volume of biochar (cm3) and its dry mass (g). The physiochemical properties of the Acacia wood-derived biochars are listed in Table 1.

2.4. Collection of Soil Samples In-Situ

Since the uppermost 10 cm of mineral soil is most relevant to plant mineral nutrient availability in these systems [42], we collected samples from 0–10 cm of the mineral layer three times throughout the experiment: at 15, 145, and 219 days (June 5, Oct. 13, and Dec. 26) following the application of biochars (7.5 t·ha−1). The timing was such that the samples were collected near the start and end of the rainy season, and the mid-point of the dry season. Within each 20 m × 20 m plot on each sampling date, 15 soil samples were collected at random locations, using a soil corer with a diameter of 5 cm. Three composite samples (per plot) made of these 15 samples were used for analysis. Overall, we analyzed a total of 54 samples (sampling dates × no. of samples × plots = 3 × 3 × 6) from each land-use type throughout this experiment. Forest soil samples collected 145 days after biochar application were damaged in the lab, leaving us with 36 samples (2 × 3 × 6 = 36) from this land-use.

2.5. Determination of Soil Physiochemical Properties

Gravimetric soil moisture content (%) was determined immediately after soil samples were brought back to the lab following oven drying at 60 °C for 48 h. To determine soil bulk density (g·cm−3), we oven-dried the soil at 105 °C for 24 h and divided the dry mass (g) with volume (πr2h = π × 2.52 × 10 = 196.35 cm3) of the soil. Soil organic matter content (%) was determined by a loss on ignition method by combusting for six hours at 600 °C in a muffle furnace [45]. We measured soil pH in a 1:2 solution (soil: deionized water) using a Kelway MA-78 pH meter (Kel Instruments, Wyckoff, NJ, USA). We analyzed soils for mass-based concentrations of the primary nutrients. Total soil N (%) was determined by the semi-micro Kjeldahl method by digesting soil samples with concentrated H2SO4 and catalyst mixture (K2SO4:CuSO4.5H2O:Se = 10:1:0.1) and determined the NH4-N in the digest by colorimetric titration [46]. To determine the available P (µg·g−1 soil) in sample soils collected across land-use types, we used Bray and Kurtz 1 extraction due to acidic sample soil (pH < 7) [47]. The extracted phosphorus was measured colorimetrically based on the reaction with ammonium molybdate [(NH4)6Mo7O24.4H2O] and development of the Molybdenum Blue color. The absorbance of the compound was measured at 882 nm by Varian 710-ES optical emission spectrometers (Varian Inc., California, USA) and was directly proportional to the amount of phosphorus extracted from the soil. Available soil K (meq.100g−1) was determined by the extraction with ammonium acetate (CH3COONH4; pH = 7.0) by using a Jenway PFP7/C flame photometer (Cole-Parmer, Staffordshire, UK) at the wavelength of 766.5 to 769.5 nm [48].

2.6. Statistical Analysis

To test biochar effects on the physiochemical properties of soils in degraded, managed tropical systems, we used linear mixed-effects models performed via the lme() function of the “nlme” package [49] in the R statistical programming environment [50]. We initially considered soil properties (raw values) as dependent variables, treatments (biochar and land-use) as fixed effects, with replicated samples nested within each plot and plots nested within the number of measurements (to address repeated measurement) as the random effect in these models. Each land-use type was represented by a single site, so land-use effects per se cannot be distinguished from spatial effects and other sources of variation.
To assess the effect of biochar (without considering land-use types), we ran ANOVAs (with likelihood comparison of fitted models) on the linear mixed-effects models of soil physiochemical properties throughout the experiment. For multiple comparisons of land-use × biochar combinations, we compared estimated marginal means using the emmeans() and contrast() (with method = “pairwise”) functions of the R-package “emmeans” [51]. Residual normality of linear mixed-effects models was assessed graphically using histograms and Q-Q probability plots and were found to be normal for all models.

3. Results

3.1. Properties of Biochar Used in This Experiment

The open-kiln biochar produced had physiochemical properties generally favorable for use as a soil amendment (Table 1). Carbon concentration was 72%, pH was moderate (7.6), and concentrations of P and K were 0.24% and 1.2%, respectively. Concentrations of metals of toxicity concern (Cd, Cr, Cu, Ni, Pb, Mo, Zn) were generally substantially below recognized toxicity thresholds [52]. The only element of toxicity concern that was in the “range of allowable thresholds” given by IBI was Zn—and here, the concentration was in the lowest end of this range (416–7400 ppm).

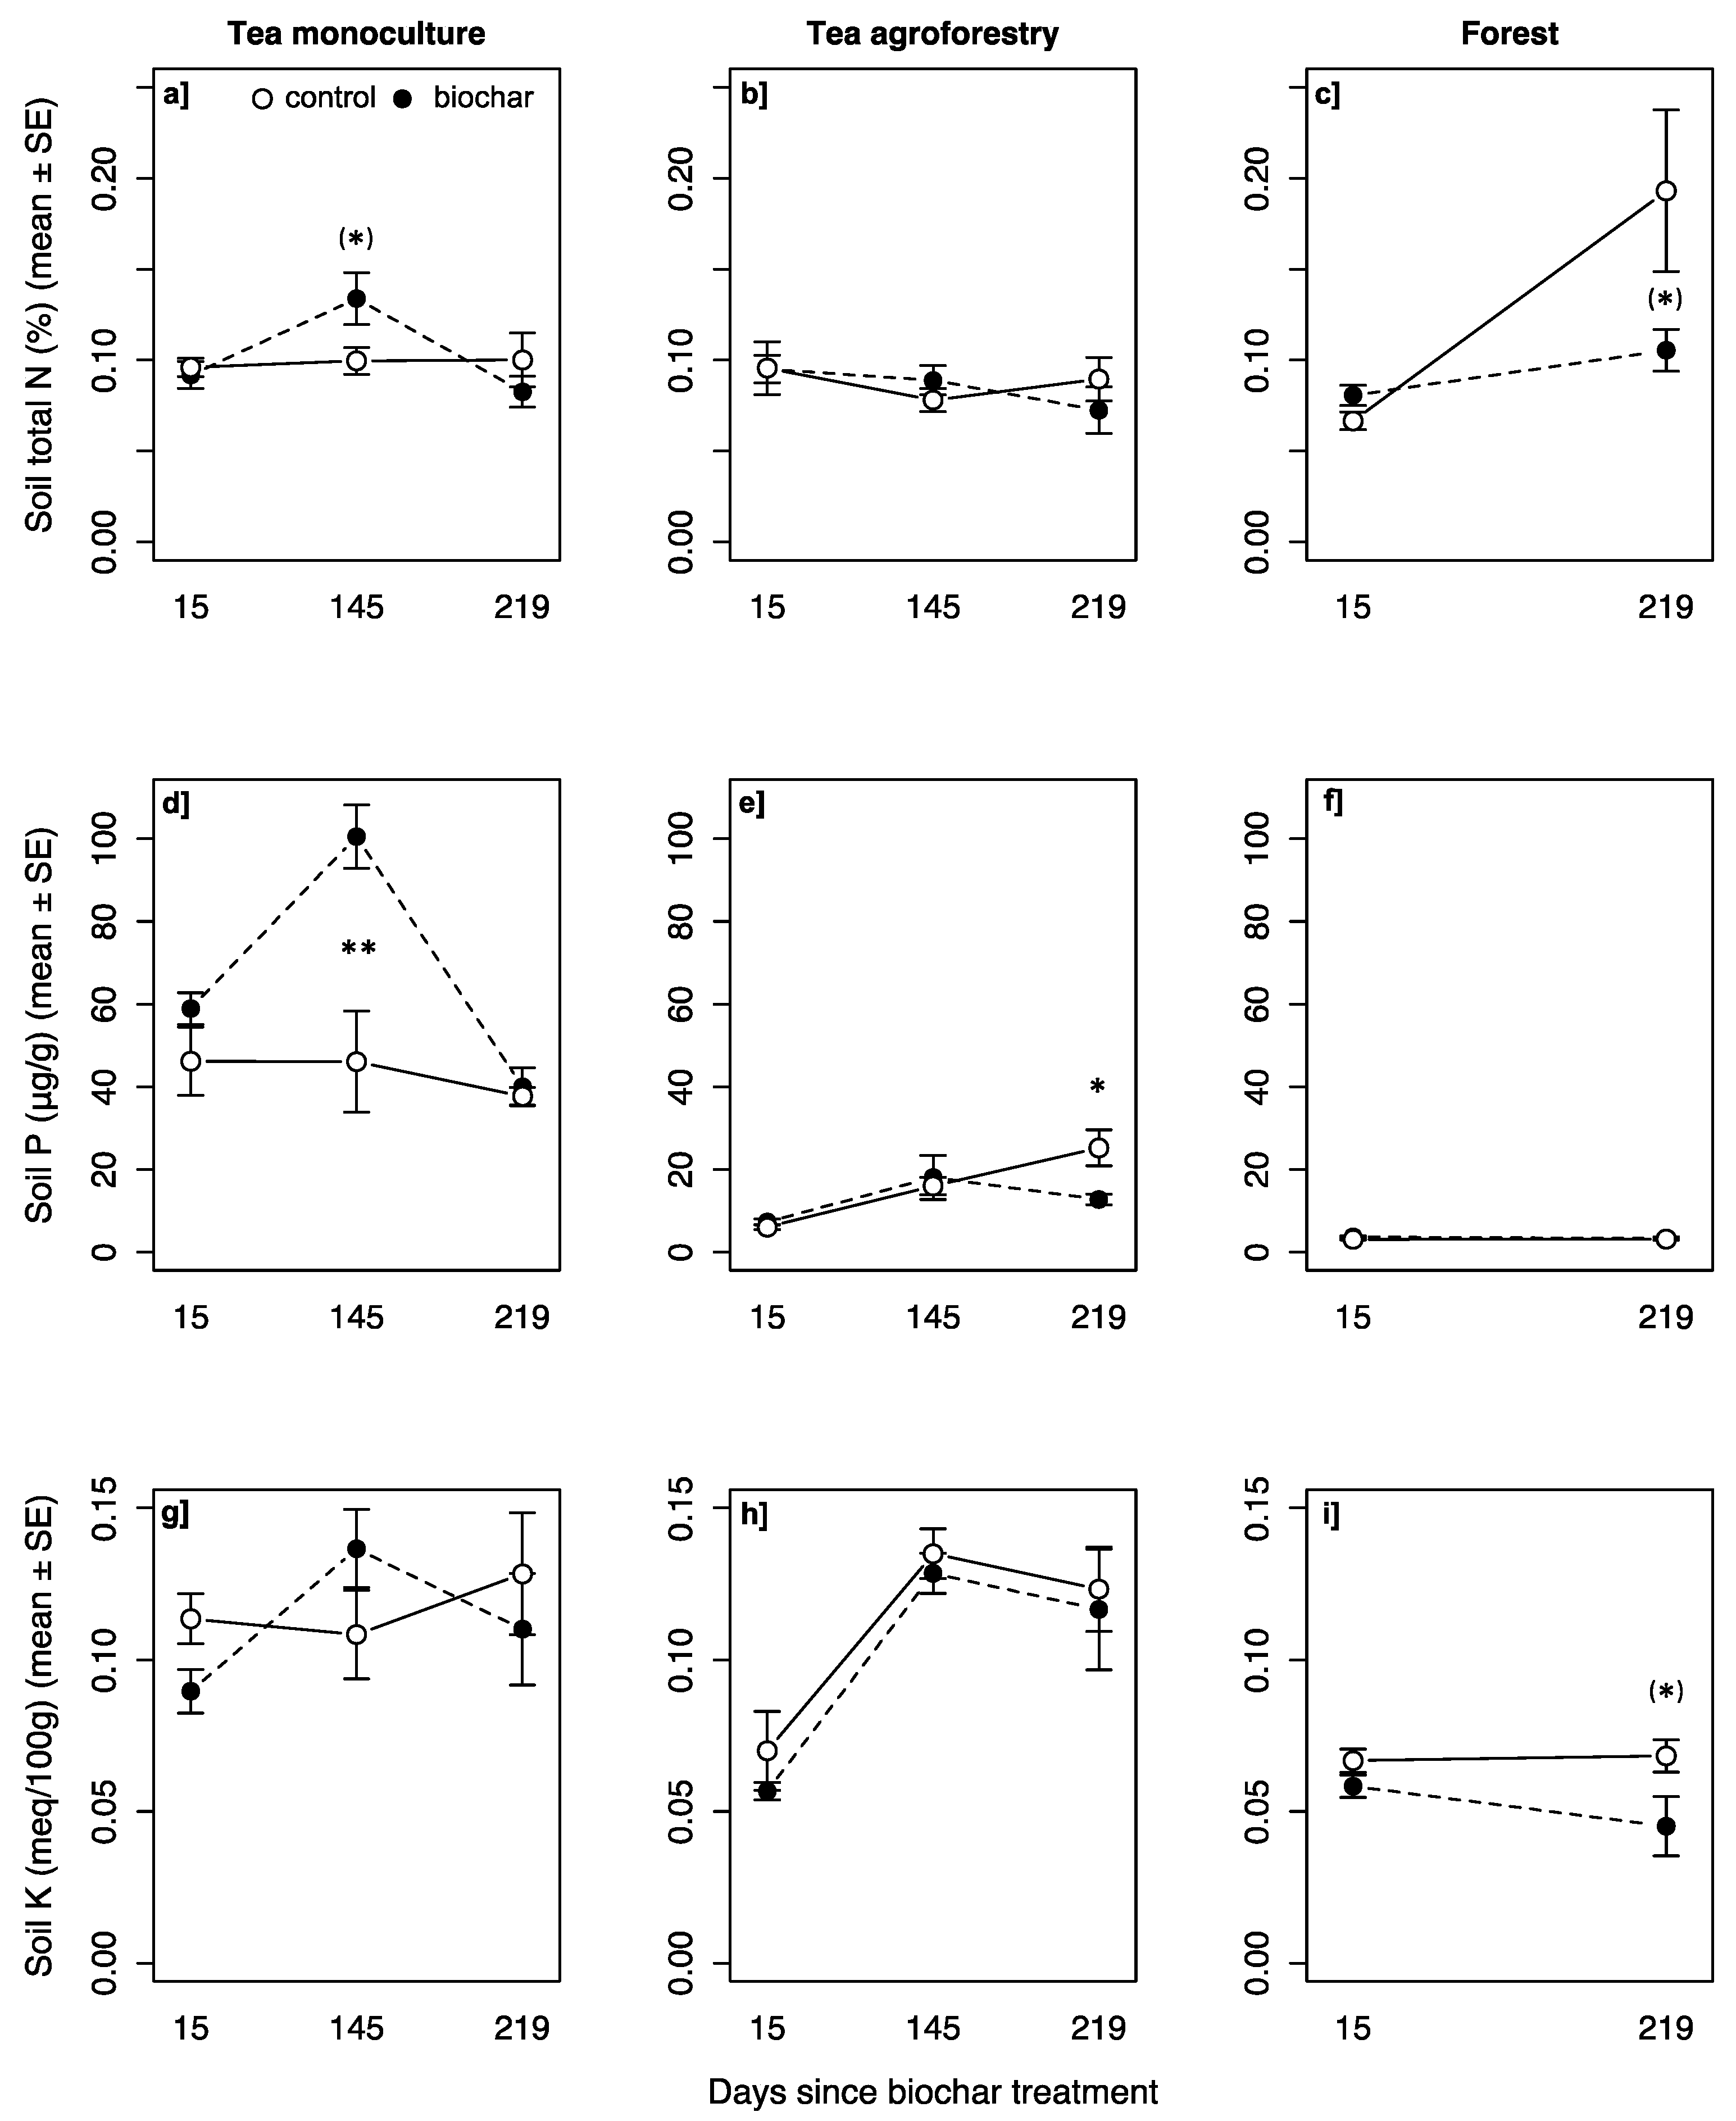
3.2. Effects of Biochar on Soil Macronutrients (N, P, and K)

Our results revealed no consistent biochar effects on total soil N (Figure 2a–c; Table 2). Overall, the highest total N values were observed in forest control plots in the dry season, and the contrast between treatments was close to significant at this date (p = 0.07).
In contrast, biochar addition plots generally showed increased available P (Figure 2d–f). The biochar × land-use interaction was significant in this case (Table 2), indicating different responses among land-use types. The P-enhancement effect was strongest (74% on average) in tea monoculture plots, particularly at 145 days (118%) following treatments (Figure 2d). The biochar effects on soil available-P in these plots were substantial in the short term and not apparent at the final sampling date. P levels were highest in the tea monocultures and lowest in forest plots, likely because of fertilizer addition.
There were no clear trends in biochar effects on soil available K (meq·100g−1) through the experiment (Figure 2g–i). Soil K was generally lowest in forest plots and showed a trend toward a reduction in biochar plots compared to control plots in this environment (Figure 2i).

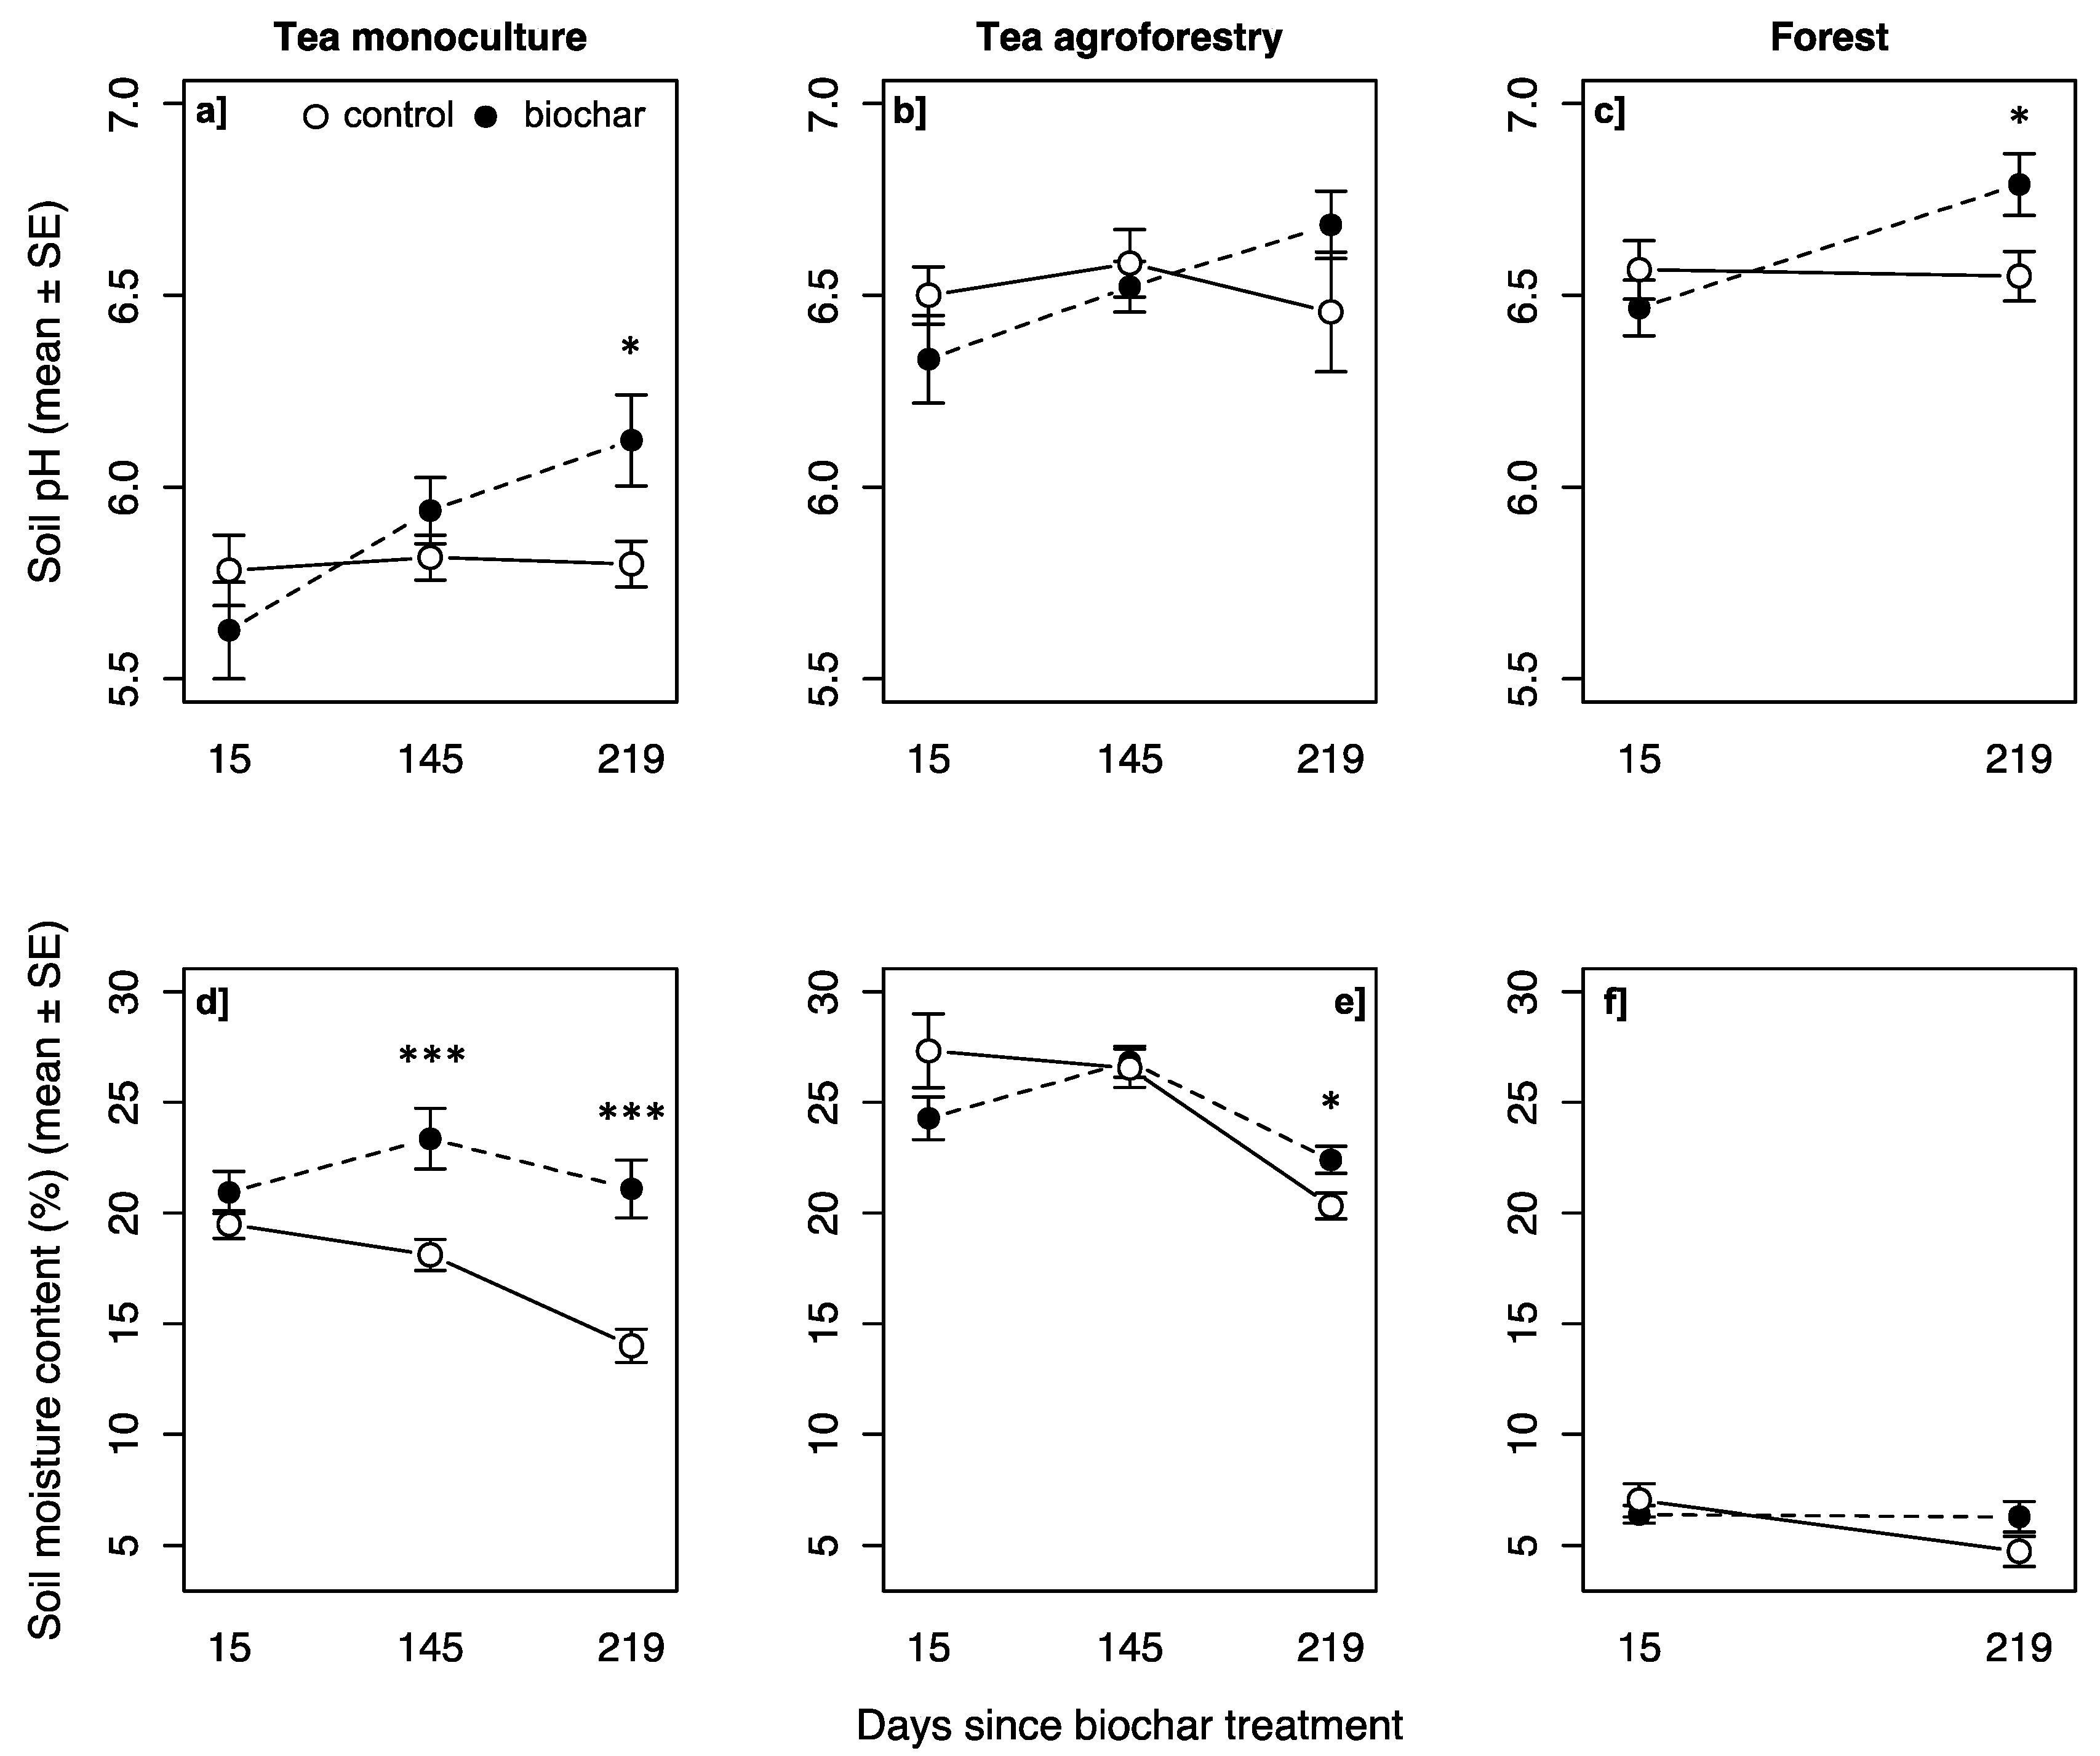
3.3. Effects of Biochar on Soil pH

Biochar plots showed an increasing trend in soil pH in different land-uses compared to controls, consistent with a gradual liming effect (Figure 3a–c). The magnitude of this overall relative change in soil pH was highest in the tea monoculture plots (Figure 3a) compared to tea agroforestry and forest plots (Figure 3b,c). Soil pH was also significantly different between land-use types, and the effect of biochar on soil pH also varied with land-use (i.e., a significant interaction term) (Table 2). The tea monoculture showed the lowest pH values and the largest pH response to biochar additions (Figure 3).

3.4. Effects of Biochar on Soil Moisture Content

Biochar additions resulted in increased soil moisture (%), with significant effects in the tea monoculture and tea agroforestry land-uses (Figure 3d–f). At the initial sampling date (day 15), soil moisture contents were generally lower or similar in biochar plots relative to control plots. As biochar residence time increased (~150 days onwards), soil moisture contents increased on average by 11% in biochar plots compared to control plots across land-use types. This effect was strongest in the tea monoculture (Figure 3d) compared to other land-uses (Figure 3e,f). There were, correspondingly, significant terms for biochar and for the biochar × land-use interaction term in the linear mixed effects models (Table 2).

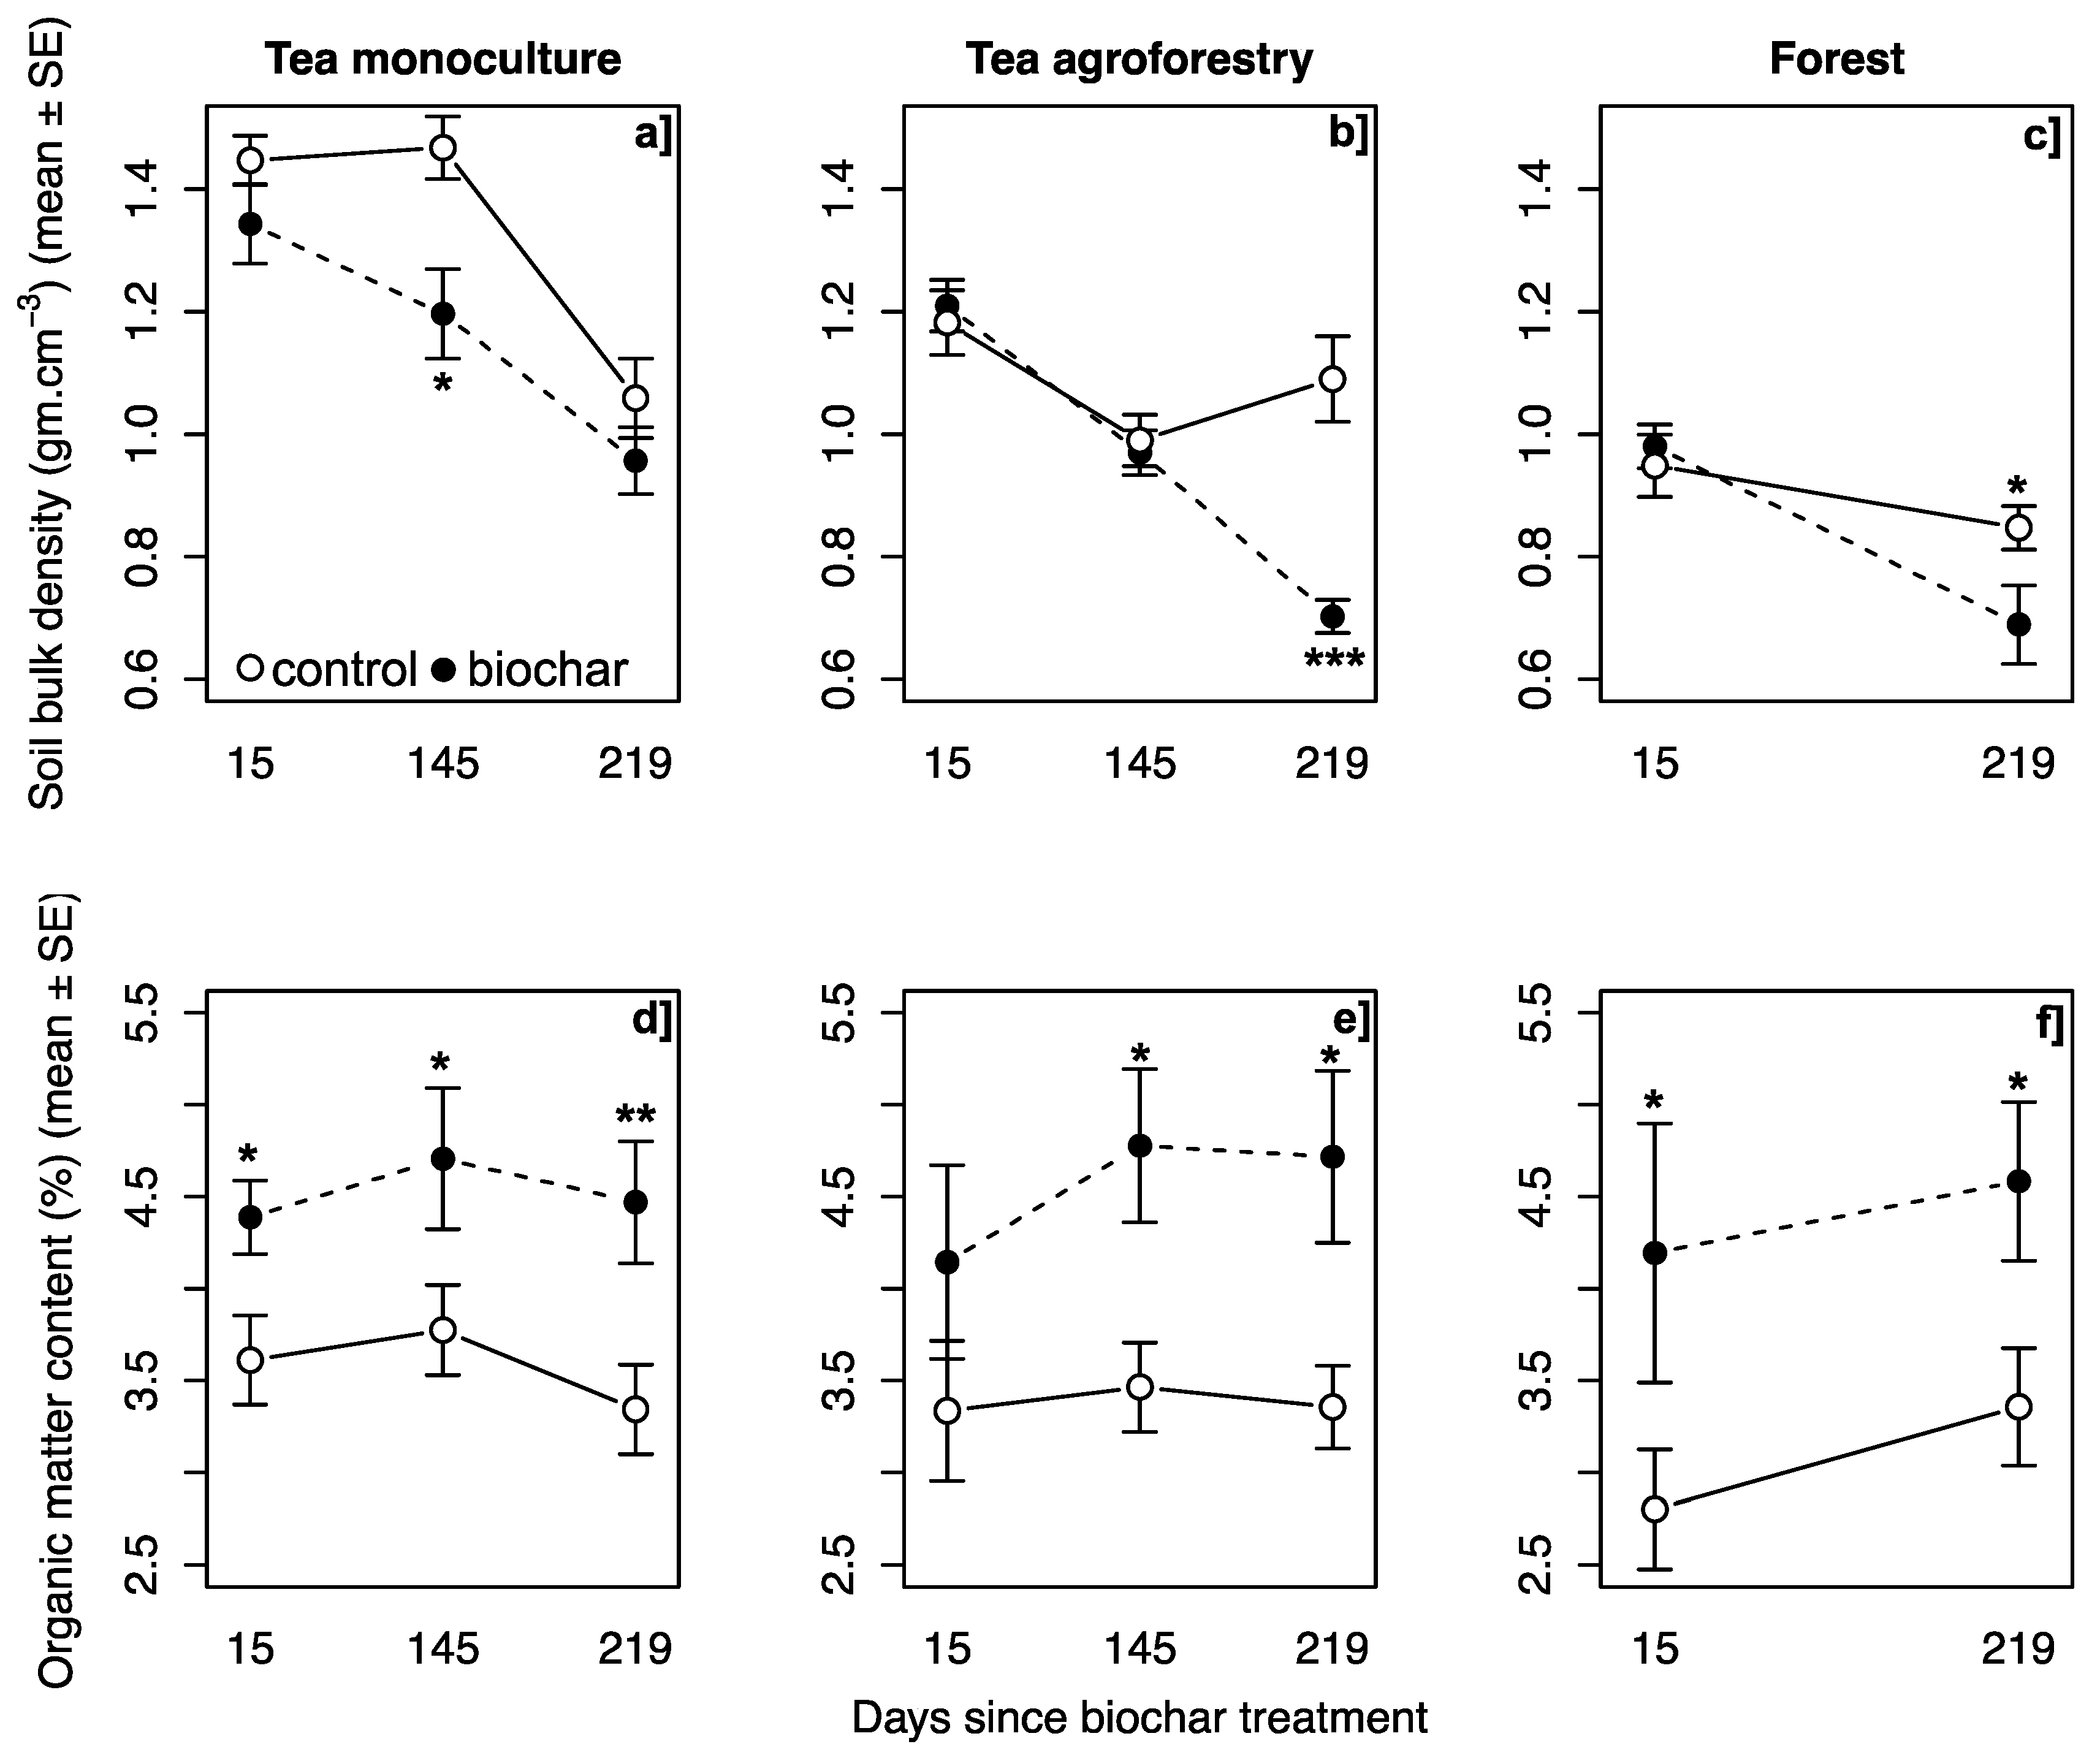
3.5. Effects Biochar on Soil Bulk Density

Biochar generally reduced soil bulk density (g·cm−3) in all land-use types (Figure 4a–c), with an 8% reduction on average. Tea monoculture and tea agroforestry plots (Figure 4a,b) showed the strongest relative responses (Figure 4c). Soil bulk densities differed substantially among land-uses, as did the effects of biochar on soil bulk density (Table 2).

3.6. Effects of Biochar on Soil Organic Matter Content

Soil organic matter contents (%) in the study plots were generally patchy (high standard errors); however, despite high variability, biochar additions resulted in significantly increased SOM values that persisted through the measurement period (Figure 4d–f). The temporal trends of biochar effect on soil organic matter content were similar across land-use types (Figure 4f).

4. Discussion

We found pronounced biochar effects on several soil properties essential for maintaining soil fertility. Biochar additions substantially enhanced SOM at all sites. In the tea monoculture plots, biochar increased soil moisture content, reduced soil bulk density, and increased soil P and pH. The tea monoculture was the site with the most degraded soil by most measures, particularly soil pH and bulk density. We did not detect significant effects of biochar additions on soil N or K. Although the observed increase in soil P at the tea garden sites was transient, other changes in soil properties persisted throughout the 7-month study period. It is important to note that although our statistical models incorporated land-use effects on soil properties, these effects cannot be distinguished from other sources of variation as each land-use type was represented by a single site.
Biochar can act as an alternative and/or complementary source of P fertilizer in the soil, with its effect depending on the nature of feedstock, pyrolysis temperature, and dosage [53,54]. In addition to directly providing P, biochar can enhance P sorption of the soil and help to extend the supply of mineralized P [10]. Several field studies have reported improvements in soil P in response to biochar applications in tropical soils [10,55]. In the present experiment, biochar enhanced available P within the first few months following biochar additions. This transient effect was stronger in the tea garden plots compared to other land-uses. Islam et al. [41] found that various measures of available P were highly correlated with measures of total P in this study system. The pyrolysis temperature of the biochar used in our study was relatively high (reaching a peak of ~550 °C), thus enhancing P concentration [56], and was prepared from wood materials, which commonly show higher P sorption than other feedstocks.
Biochars are usually high in K and can increase soil K availability by providing K-containing salts (e.g., KHCO3) [57]. Several tropical field trials in agricultural systems have documented an increase in soil K following biochar application [4,58]; however, effects are influenced by several soil properties, including native K-supplying capacity and clay mineralogy [59]. The applied biochar had high K content (2.06 ± 0.04 %) (Table 1); thus, the lack of a significant effect on soil-available K in all three study systems was possibly due to K+ losses via leaching. The high solubility of K+ and high rainfall in the study area likely accelerated the leaching process.
In general, biochar is not a direct source of available N and can reduce the availability of nitrate and ammonium [54]; however, biochar has been reported to improve total soil N status in several previous tropical studies [60,61]. Results may depend strongly on soil type [62]. There was no clear trend in biochar effects on total soil N in the present study, possibly due to the moderate biochar dose (7.5 t·ha−1). Biochar commonly stimulates N fixation [63], and soil N would be expected to show more positive responses in systems with legumes grown as crop or companion species [64].
Many biochars are highly alkaline and can increase soil pH by a liming effect driven mainly by the formation of carbonates [65]; in the long term, biochar enhancement of CEC may also maintain higher pH due to increased retention of calcium and other alkaline elements [66]. Several tropical field trials in agricultural systems have documented increases in soil pH following biochar application [15,67]; however, pronounced effects may require high biochar dosages [15]. We found significant effects of biochar application on soil pH only in the tea monoculture, which initially showed a lower pH level than tea agroforestry and forest soils. Tree species show marked variation in the Ca and Mg concentration in wood, with pronounced carry-over effects on the chemistry and liming capacity of produced biochar [56]. This suggests that biochars generated from specific wood feedstocks should be selected as a liming agent for degraded high-acidity soils.
Application of biochar improves soil moisture content because biochar is highly porous, and, depending on particle size and geometry, it may also enhance the volume of soil inter-pores [68,69]. However, biochar porosity varies with pyrolysis temperature and feedstock [70]. Biochar applications have been found to improve soil water-holding capacity in several field trials in tropical soils [71,72,73]. In our findings, biochar plots clearly showed an increase in soil moisture content in the tea monoculture. This response was closely linked to observed reductions in bulk density in biochar-amended plots. Biochars reduce soil bulk density by their own porosity and indirectly by improving soil aggregation [74] due to high porosity. This is associated with enhanced soil drainage and aeration and reduced mechanical impedance of root growth in soils [75]. Several prior field studies have also reported reduced bulk density in response to biochar applications in tropical soils [71,72,73]; biochar application rates are proportional to this change [76]. In the present experiment, biochar amendments resulted in the strongest responses in the tea agroforestry and tea monoculture plots in which soil compaction was severe.
Increases in soil OM and carbon are among the most consistent responses to biochar additions due to the organic matter directly embodied in biochar [77]. Increased soil OM may also reflect microbial C responses [77], as biochar is commonly colonized by bacteria, actinomycetes, and arbuscular mycorrhizal fungi [74,78]. In the present study, biochar addition plots showed increased soil OM in all land-use types, with an increasing temporal response through the experiment (Figure 4d,e), possibly reflecting microbial colonization or reduced organic matter turnover. The results thus support the viability of biochar additions to restore degraded tropical soils deficient in OM [79].
In conclusion, “sustainable biochar” amendments (sensu [43]) based on local waste wood feedstocks and pyrolyzed with a simple flame curtain kiln enhanced the condition of representative degraded soils in a variety of managed ecosystems in Bangladesh. The most consistent responses were in soil OM, bulk density, soil moisture, and P availability. Improvements in soil conditions were most pronounced in tea monocultures, which also showed the greatest degree of soil degradation prior to the treatments. Our results thus suggest biochar as a viable option for the restoration of degraded soils in the region. Farmers can manufacture biochar themselves at low cost and modest labor inputs from waste wood materials, using open conical flame curtain pyrolysis kilns. Crop species vary substantially in responses, e.g., [58], so additional work (possibly with replicated sites) on agronomic responses is important; however, local “folk science” experimentation may be efficient at discovering crops and soil conditions that are most responsive. The practical importance of enhancing nutrient and water retention, crop productivity, carbon sequestration, and rural livelihoods dependent on degraded tropical soils can hardly be overstated.

Author Contributions

Conceptualization, M.A.H., N.V.G., and S.C.T.; methodology, M.R.K., M.A.H., N.V.G., and S.C.T.; formal analysis, M.R.K., M.A.H., and S.C.T.; investigation, M.R.K.; data curation, M.R.K.; writing—original draft preparation, M.R.K., and M.A.H.; writing—review and editing, N.V.G., and S.C.T.; supervision, M.A.H., N.V.G., and S.C.T.; funding acquisition, M.A.H., N.V.G., and S.C.T. All authors have read and agreed to the published version of the manuscript.

Funding

This research was supported through grants by Experiment.com and the University of Toronto Centre for Global Change Research, with additional funding from the Natural Sciences and Engineering Research Council of Canada.

Acknowledgments

We thank Lakkatura Tea Garden and Tilagarh Eco-park and their staffs for research support, including property use. We also thank Dr. Narayan Saha for oversight and helpful conversations about the research, and Akib Hasan Moon, Shamim Reza Saimun, Rupon Kumar Nath, Farhana Binte Hye, Sonchita Biswas, Md Abuzar Gefari Shohag, Mahabud Rana Torun, as well as other students at the Department of Forestry and Environmental Science, Shahjalal University of Science and Technology, Bangladesh for their enthusiasm and steadfast data collection and in-field support.

Conflicts of Interest

The authors declare no conflict of interests.

References

  1. Lal, R. Restoring soil quality to mitigate soil degradation. Sustainability 2015, 7, 5875–5895. [Google Scholar] [CrossRef] [Green Version]
  2. Laird, D.A.; Brown, R.C.; Amonette, J.E.; Lehmann, J. Review of the pyrolysis platform for coproducing bio-oil and biochar. Biofuels Bioproducts Biorefining 2009, 3, 547–562. [Google Scholar] [CrossRef]
  3. Hailegnaw, N.S.; Mercl, F.; Pračke, K.; Száková, J.; Tlustoš, P. Mutual relationships of biochar and soil pH, CEC, and exchangeable base cations in a model laboratory experiment. J. Soils Sediments 2019, 19, 2405–2416. [Google Scholar] [CrossRef]
  4. Alling, V.; Hale, S.E.; Martinsen, V.; Mulder, J.; Smebye, A.; Breedveld, G.D.; Cornelissen, G. The role of biochar in retaining nutrients in amended tropical soils. J. Plant Nutr. Soil Sci. 2014, 177, 671–680. [Google Scholar] [CrossRef]
  5. Yang, Y.; Sheng, G. Enhanced Pesticide Sorption by Soils Containing Particulate Matter from Crop Residue Burns. Environ. Sci. Technol. 2003, 37, 3635–3639. [Google Scholar] [CrossRef] [PubMed]
  6. Sujeeun, L.; Thomas, S.C. Potential of biochar to mitigate allelopathic effects in tropical island invasive plants: Evidence from seed germination trials. Trop. Conserv. Sci. 2017, 10, 1–14. [Google Scholar] [CrossRef] [Green Version]
  7. Zhao, J.; Shen, X.-J.; Domene, X.; Alcañiz, J.-M.; Liao, X.; Palet, C. Comparison of biochars derived from different types of feedstock and their potential for heavy metal removal in multiple-metal solutions. Sci. Rep. 2019, 9, 9869. [Google Scholar] [CrossRef] [PubMed] [Green Version]
  8. Thomas, S.C.; Frye, S.; Gale, N.; Garmon, M.; Launchbury, R.; Machado, N.; Melamed, S.; Murray, J.; Petroff, A.; Winsborough, C. Biochar mitigates negative effects of salt additions on two herbaceous plant species. J. Environ. Manag. 2013, 129, 62–68. [Google Scholar] [CrossRef]
  9. Wang, L.; Butterly, C.R.; Wang, Y.; Herath, H.M.S.K.; Xi, Y.G.; Xiao, X.J. Effect of crop residue biochar on soil acidity amelioration in strongly acidic tea garden soils. Soil Use Manag. 2014, 30, 119–128. [Google Scholar] [CrossRef]
  10. Hong, C.; Lu, S. Does biochar affect the availability and chemical fractionation of phosphate in soils? Environ. Sci. Pollut. Res. 2018, 25, 8725–8734. [Google Scholar] [CrossRef]
  11. Mukherjee, A.; Lal, R. Biochar impacts on soil physical properties and greenhouse gas emissions. Agronomy 2013, 3, 313–339. [Google Scholar] [CrossRef] [Green Version]
  12. Glaser, B.; Lehmann, J.; Zech, W. Ameliorating physical and chemical properties of highly weathered soils in the tropics with charcoal—A review. Biolo. Fertil. Soils 2002, 35, 219–230. [Google Scholar] [CrossRef]
  13. Bruun, S.; El-Zehery, T. Biochar effect on the mineralization of soil organic matter. Pesquisa Agropecuária Brasileira 2012, 47, 665–671. [Google Scholar] [CrossRef] [Green Version]
  14. Jeffery, S.; Abalos, D.; Prodana, M.; Bastos, A.C.; van Groenigen, J.W.; Hungate, B.A.; Verheijen, F. Biochar boosts tropical but not temperate crop yields. Environ. Res. Lett. 2017, 12, 053001. [Google Scholar] [CrossRef]
  15. Raboin, L.-M.; Razafimahafaly, A.H.D.; Rabenjarisoa, M.B.; Rabary, B.; Dusserre, J.; Becquer, T. Improving the fertility of tropical acid soils: Liming versus biochar application? A long term comparison in the highlands of Madagascar. Field Crops Res. 2016, 199, 99–108. [Google Scholar] [CrossRef]
  16. Woolf, D.; Amonette, J.E.; Street-Perrott, F.A.; Lehmann, J.; Joseph, S. Sustainable biochar to mitigate global climate change. Nat. Commun. 2010, 1, 56. [Google Scholar] [CrossRef] [Green Version]
  17. Laird, D.A. The charcoal vision: A win–win–win scenario for simultaneously producing bioenergy, permanently sequestering carbon, while improving soil and water quality. Agronomy J. 2008, 100, 178–181. [Google Scholar]
  18. Spokas, K.A. Impacts of sixteen different biochars on soil greenhouse gas production. Annals Environ. Sci. 2009, 3, 179–193. [Google Scholar]
  19. Sridhar, A.; Thakur, B.; Basavaiah, N.; Seth, P.; Tiwari, P.; Chamyal, L.S. Lacustrine record of high magnitude flood events and climate variability during mid to late Holocene in the semiarid alluvial plains, western India. Palaeogeography Palaeoclimatol. Palaeoecol. 2020, 542, 109581. [Google Scholar] [CrossRef]
  20. Renner, R. Rethinking biochar. Environ. Sci. Technol. 2007, 41, 5932–5933. [Google Scholar] [CrossRef] [Green Version]
  21. Cerri, C.E.P.; Sparovek, G.; Bernoux, M.; Easterling, W.E.; Melillo, J.M.; Cerri, C.C. Tropical agriculture and global warming: Impacts and mitigation options. Sci. Agricola 2007, 64, 83–99. [Google Scholar] [CrossRef]
  22. Bolan, N.S.; Kunhikrishnan, A.; Choppala, G.K.; Thangarajan, R.; Chung, J.W. Stabilization of carbon in composts and biochars in relation to carbon sequestration and soil fertility. Sci. Total Environ. 2012, 424, 264–270. [Google Scholar] [CrossRef] [PubMed]
  23. Islam, K.R.; Weil, R.R. Land use effects on soil quality in a tropical forest ecosystem of Bangladesh. Agric. Ecosyst. Environ. 2000, 79, 9–16. [Google Scholar] [CrossRef]
  24. Cerri, C.C.; Volkoff, B.; Andreaux, F. Nature and behaviour of organic matter in soils under natural forest, and after deforestation, burning and cultivation, near Manaus. For. Ecol. Manag. 1991, 38, 247–257. [Google Scholar] [CrossRef]
  25. Dechert, G.; Veldkamp, E.; Anas, I. Is soil degradation unrelated to deforestation? Examining soil parameters of land use systems in upland Central Sulawesi, Indonesia. Plant Soil 2004, 265, 197–209. [Google Scholar] [CrossRef]
  26. Sahani, U.; Behera, N. Impact of deforestation on soil physicochemical characteristics, microbial biomass and microbial activity of tropical soil. Land Degrad. Dev. 2001, 12, 93–105. [Google Scholar] [CrossRef]
  27. Hossain, M.; Saha, M.; Aziz, C.; Hoque, S. Effects of deforestation on the properties of soil of Sal forests in Bangladesh. Dhaka Univ. J. Biol. Sci. 2010, 19, 63–72. [Google Scholar] [CrossRef] [Green Version]
  28. Rasiah, V.; Florentine, S.K.; Williams, B.L.; Westbrooke, M.E. The impact of deforestation and pasture abandonment on soil properties in the wet tropics of Australia. Geoderma 2004, 120, 35–45. [Google Scholar] [CrossRef] [Green Version]
  29. Thomas, S.C.; Gale, N. Biochar and forest restoration: A review and meta-analysis of tree growth responses. New For. 2015, 46, 931–946. [Google Scholar] [CrossRef]
  30. Vitousek, P.M. Litterfall, nutrient cycling, and nutrient limitation in tropical forests. Ecology 1984, 65, 285–298. [Google Scholar] [CrossRef]
  31. Ali, M.M.; Saheed, S.M.; Kubota, D.; Masunaga, T.; Wakatsuki, T. Soil degradation during the period 1967–1995 in Bangladesh. Soil Sci. Plant Nutr. 1997, 43, 863–878. [Google Scholar] [CrossRef]
  32. Bhuiya, Z.H. Organic matter status and organic recycling in Bangladesh soils. Resour. Conserv. 1987, 13, 117–124. [Google Scholar] [CrossRef]
  33. Islam, A.; Arnin, M.S.; Anwar, M.N. Review of Soil Fertility Research in Bangladesh; Hussain, M.S., Imamul-Huq, S.M., AnwarIqbal, M., Khan, T.H., Eds.; Bangladesh Agriculture Research Council: Faridpur, Bangladesh, 1992; pp. 1–18.
  34. Biswas, J.C.; Naher, U.A. Soil nutrient stress and rice production in Bangladesh. In Advances in Rice Research for Abiotic Stress Tolerance; Hasanuzzaman, M., Fujita, M., Nahar, K., Biswas, J.K., Eds.; Woodhead Publishing: Cambridge, UK, 2019; pp. 431–445. ISBN 9780128143322. [Google Scholar]
  35. Hariprasad, V.N.; Dayananda, S.H. Environmental impact due to agricultural runoff containing heavy metals—A review. Int. J. Sci. Res. Publ. 2013, 3, 224–280. [Google Scholar]
  36. Iftekhar, M.S.; Hoque, A.K.F. Causes of Forest Encroachment: An Analysis of Bangladesh. GeoJournal 2005, 62, 95–106. [Google Scholar] [CrossRef]
  37. Contreas-Hermosella, A. Illegal activities and corruption in the forest sector. In State of the World’s Forests; FAO, Ed.; Food and Agriculture Organization (FAO): Rome, Italy, 2001; pp. 76–89. [Google Scholar]
  38. Oliver, C.D.; Larson, B.C.; Oliver, C.D. Forest Stand Dynamics; Wiley New York: New York, NY, USA, 1996; ISBN 9780471138334. [Google Scholar]
  39. Deb, J.C.; Salman, M.H.R.; Halim, M.A.; Chowdhury, M.Q.; Roy, A. Characterising the diameter distribution of sal plantations by comparing normal, lognormal and weibull distributions at tilagarh eco-park, Bangladesh. Southern For. J. For. Sci. 2014, 76, 201–208. [Google Scholar] [CrossRef]
  40. Imamul Huq, S.M.; Md. Shoaib, J.U. Soil Classification. In The Soils of Bangladesh; Huq, S.M.I., Shoaib, J.U., Eds.; Springer Netherlands: Dordrecht, The Netherlands, 2013; pp. 71–82. ISBN 9789400711280. [Google Scholar]
  41. Islam, M.M.R.; Afroz, H.; Khatun, R.; Islam, M.; Hoque, M. Phosphorus fractionation in acid soil of Lakkatura tea garden, Sylhet, Bangladesh. J. Soil Nat. 2014, 7, 1–6. [Google Scholar]
  42. Rahman, M.H.; Bahauddin, M.; Khan, M.A.S.A.; Islam, M.J.; Uddin, M.B. Assessment of soil physical properties under plantation and deforested sites in a biodiversity conservation area of north-eastern Bangladesh. Int. J. Environ. Sci. 2012, 3, 1079–1088. [Google Scholar]
  43. Cornelissen, G.; Pandit, N.R.; Taylor, P.; Pandit, B.H.; Sparrevik, M.; Schmidt, H.P. Emissions and char quality of flame-curtain Kon Tiki kilns for farmer-scale charcoal/biochar production. PLoS ONE 2016, 11, e0154617. [Google Scholar] [CrossRef] [Green Version]
  44. Gale, N.V.; Sackett, T.E.; Thomas, S.C. Thermal treatment and leaching of biochar alleviates plant growth inhibition from mobile organic compounds. PeerJ 2016, 4, e2385. [Google Scholar] [CrossRef]
  45. Hoogsteen, M.J.J.; Lantinga, E.A.; Bakker, E.J.; Groot, J.C.J.; Tittonell, P.A. Estimating soil organic carbon through loss on ignition: Effects of ignition conditions and structural water loss. Eur. J. Soil Sci. 2015, 66, 320–328. [Google Scholar] [CrossRef]
  46. Bremner, J.M. Nitrogen-Total. In Methods of Soil Analysis: Part 3 Chemical Methods, 5.3; SSSA Book Series; Sparks, D., Page, A., Helmke, P., Loeppert, R., Soltanpour, P.N., Tabatabai, M.A., Johnston, C.T., Sumner, M.E., Eds.; Wiley & Sons: Madison, WI, USA, 1996; pp. 1085–1121. ISBN 9780891188667. [Google Scholar]
  47. Bray, R.H.; Kurtz, L.T. Determination of total, organic, and available forms of phosphorus in soils. Soil Sci. 1945, 59, 39–46. [Google Scholar] [CrossRef]
  48. Pratt, P.F. Potassium. In Methods of Soil Analysis: Part 2 Chemical and Microbiological Properties, 9.2; Agronomy Monographs; Norman, A.G., Ed.; Wiley & Sons: Madison, WI, USA, 1965; pp. 1022–1030. ISBN 9780891182047. [Google Scholar]
  49. Pinheiro, J.; Bates, D.; DebRoy, S.; Sarkar, D.; R Core Team. Nlme: Linear and Nonlinear Mixed Effects Models; R Core Team: Vienna, Austria, 2020. [Google Scholar]
  50. R Core Team. R: A Language and Environment for Statistical Computing; R Core Team: Vienna, Austria, 2020. [Google Scholar]
  51. Lenth, R. Emmeans: Estimated Marginal Means, aka Least-Squares Means. 2020. Available online: https://cran.r-project.org/web/packages/emmeans/emmeans.pdf (accessed on 26 November 2020).
  52. International Biochar Initiative. Standardized Product Definition and Product Testing Guidelines for Biochar That Is Used in Soil, V.2.1; International Biochar Initiative: Westerville, OH, USA, 2015; Available online: https://www.biochar-international.org/wp-content/uploads/2018/04/IBI_Biochar_Standards_V2.1_Final.pdf (accessed on 26 November 2020).
  53. Glaser, B.; Lehr, V.-I. Biochar effects on phosphorus availability in agricultural soils: A meta-analysis. Sci. Rep. 2019, 9, 9338. [Google Scholar] [CrossRef] [PubMed] [Green Version]
  54. Gao, S.; DeLuca, T.H.; Cleveland, C.C. Biochar additions alter phosphorus and nitrogen availability in agricultural ecosystems: A meta-analysis. Sci. Total Environ. 2019, 654, 463–472. [Google Scholar] [CrossRef] [PubMed]
  55. Ch’ng, H.Y.; Ahmed, O.H.; Majid, N.M.A.; Jalloh, M.B. Reducing soil phosphorus fixation to improve yield of maize on a tropical acid soil using compost and biochar derived from agro-industrial wastes. Compost Sci. Util. 2017, 25, 82–94. [Google Scholar] [CrossRef]
  56. Gezahegn, S.; Sain, M.; Thomas, S. Variation in feedstock wood chemistry strongly influences biochar liming potential. Soil Syst. 2019, 3, 26. [Google Scholar] [CrossRef] [Green Version]
  57. Karim, A.A.; Kumar, M.; Singh, S.K.; Panda, C.R.; Mishra, B.K. Potassium enriched biochar production by thermal plasma processing of banana peduncle for soil application. J. Anal. Appl. Pyrolysis 2017, 123, 165–172. [Google Scholar] [CrossRef]
  58. Bass, A.M.; Bird, M.I.; Kay, G.; Muirhead, B. Soil properties, greenhouse gas emissions and crop yield under compost, biochar and co-composted biochar in two tropical agronomic systems. Sci. Total Environ. 2016, 550, 459–470. [Google Scholar] [CrossRef]
  59. Li, X.; Lu, J.; Wu, L.; Chen, F. The difference of potassium dynamics between yellowish red soil and yellow cinnamon soil under rapeseed (Brassica napus L.)–rice (Oryza sativa L.) rotation. Plant Soil 2009, 320, 141–151. [Google Scholar] [CrossRef]
  60. Mensah, A.K.; Frimpong, K.A. Biochar and/or compost applications improve soil properties, growth, and yield of maize grown in acidic rainforest and coastal savannah soils in Ghana. Int. J. Agron. 2018, 2018, 6837404. [Google Scholar] [CrossRef] [Green Version]
  61. Agegnehu, G.; Bass, A.M.; Nelson, P.N.; Bird, M.I. Benefits of biochar, compost and biochar–compost for soil quality, maize yield and greenhouse gas emissions in a tropical agricultural soil. Sci. Total Environ. 2016, 543, 295–306. [Google Scholar] [CrossRef]
  62. Zhu, Q.; Peng, X.; Huang, T. Contrasted effects of biochar on maize growth and N use efficiency depending on soil conditions. Int. Agrophysics 2015, 29, 257–266. [Google Scholar] [CrossRef]
  63. Rondon, M.A.; Lehmann, J.; Ramírez, J.; Hurtado, M. Biological nitrogen fixation by common beans (Phaseolus vulgaris L.) increases with bio-char additions. Biol. Fertil. Soils 2007, 43, 699–708. [Google Scholar] [CrossRef]
  64. Thomas, S.C.; Halim, M.A.; Gale, N.V.; Sujeeun, L. Biochar enhancement of facilitation effects in agroforestry: Early growth and physiological responses in a maize-leucaena model system. Agrofor. Syst. 2018. [Google Scholar] [CrossRef]
  65. Yuan, J.-H.; Xu, R.-K.; Wang, N.; Li, J.-Y. Amendment of acid soils with crop residues and biochars. Pedosphere 2011, 21, 302–308. [Google Scholar] [CrossRef]
  66. Sparks, D.L. Ion exchange processes. In Environmental Soil Chemistry; Sparks, D.L., Ed.; Academic Press: Burlington, VT, USA, 2003; pp. 187–205. ISBN 9780126564464. [Google Scholar]
  67. Major, J.; Rondon, M.; Molina, D.; Riha, S.J.; Lehmann, J. Maize yield and nutrition during 4 years after biochar application to a Colombian savanna oxisol. Plant Soil 2010, 333, 117–128. [Google Scholar] [CrossRef]
  68. Liao, W.; Thomas, S. Biochar particle size and post-pyrolysis mechanical processing affect soil pH, water retention capacity, and plant performance. Soil Syst. 2019, 3, 14. [Google Scholar] [CrossRef] [Green Version]
  69. Lim, T.J.; Spokas, K.A.; Feyereisen, G.W.; Weis, R.; Koskinen, W.C. Influence of biochar particle size and shape on soil hydraulic properties. J. Environ. Sci. Eng. 2017, 5, 8–15. [Google Scholar]
  70. Lei, O.; Zhang, R. Effects of biochars derived from different feedstocks and pyrolysis temperatures on soil physical and hydraulic properties. J. Soils Sedim. 2013, 13, 1561–1572. [Google Scholar] [CrossRef]
  71. Xiao, Q.; Zhu, L.-X.; Shen, Y.-F.; Li, S.-Q. Sensitivity of soil water retention and availability to biochar addition in rainfed semi-arid farmland during a three-year field experiment. Field Crops Res. 2016, 196, 284–293. [Google Scholar] [CrossRef]
  72. Obia, A.; Mulder, J.; Martinsen, V.; Cornelissen, G.; Børresen, T. In situ effects of biochar on aggregation, water retention and porosity in light-textured tropical soils. Soil Tillage Res. 2016, 155, 35–44. [Google Scholar] [CrossRef]
  73. Abel, S.; Peters, A.; Trinks, S.; Schonsky, H.; Facklam, M.; Wessolek, G. Impact of biochar and hydrochar addition on water retention and water repellency of sandy soil. Geoderma 2013, 202–203, 183–191. [Google Scholar] [CrossRef]
  74. Lehmann, J.; Rillig, M.C.; Thies, J.; Masiello, C.A.; Hockaday, W.C.; Crowley, D. Biochar effects on soil biota—A review. Soil Biol. Biochem. 2011, 43, 1812–1836. [Google Scholar] [CrossRef]
  75. Blanco-Canqui, H. Biochar and soil physical properties. Soil Sci. Soc. Am. J. 2017, 81, 687–711. [Google Scholar] [CrossRef] [Green Version]
  76. Omondi, M.O.; Xia, X.; Nahayo, A.; Liu, X.; Korai, P.K.; Pan, G. Quantification of biochar effects on soil hydrological properties using meta-analysis of literature data. Geoderma 2016, 274, 28–34. [Google Scholar] [CrossRef]
  77. Liu, S.; Zhang, Y.; Zong, Y.; Hu, Z.; Wu, S.; Zhou, J.; Jin, Y.; Zou, J. Response of soil carbon dioxide fluxes, soil organic carbon and microbial biomass carbon to biochar amendment: A meta-analysis. GCB Bioenergy 2016, 8, 392–406. [Google Scholar] [CrossRef]
  78. Kimetu, J.M.; Lehmann, J. Stability and stabilisation of biochar and green manure in soil with different organic carbon contents. Soil Res. 2010, 48, 577–585. [Google Scholar] [CrossRef]
  79. Glaser, B.; Wiedner, K.; Seelig, S.; Schmidt, H.-P.; Gerber, H. Biochar organic fertilizers from natural resources as substitute for mineral fertilizers. Agron. Sustain. Dev. 2015, 35, 667–678. [Google Scholar] [CrossRef] [Green Version]
Figure 1. Map of the plot locations (latitude on the y-axis and longitude on the x-axis) of three land-use types in northeastern Bangladesh. Two land-use types in which biochar was applied (7.5 t/ha) were established at Lakkatura tea garden (LTG): agriculture (monoculture of C. sinensis) and agroforestry (C. sinensis with shade-trees of A. odoratissima and M. azedarach). The third set of experimental plots, the forest land-use type (plantations of S. robusta and D. turbinatus), were implemented at Tilagarh eco-park (TLG). Inset panel: The location of the overall study area in Bangladesh.
Soilsystems 04 00069 g001
Figure 2. Effects of biochar on total soil N (%) (ac), P (µg·g−1) (df), and K (meq·100g−1) (gi) in degraded managed systems in northeastern Bangladesh. Each data point represents the mean (±SE) value of the soil property calculated from 18 (no. of samples × plots = 3 × 6) composite samples; each composite sample was derived from 5 samples from each plot at 10 cm depth. Post hoc comparisons within sampling dates are indicated by asterisks: (*): p < 0.10; * p < 0.05; ** p < 0.01.
Soilsystems 04 00069 g002
Figure 3. Effects of biochar on soil pH (ac) and moisture content (%) (df) in degraded managed systems in northeastern Bangladesh. Each data point represents the mean (±SE) value of the soil property calculated from 18 (no. of samples × plots = 3 × 6) composite samples; each composite sample was derived from 5 samples from each plot at 10 cm depth. Post hoc comparisons within sampling dates are indicated by asterisks: (*): p < 0.10; * p < 0.05; *** p < 0.001.
Soilsystems 04 00069 g003
Figure 4. Biochar effects on soil bulk density (g·cm−3) (ac) and organic matter content (%) (df) in degraded managed systems in northeastern Bangladesh. Each data point represents the mean (±SE) value of the soil property calculated from 18 (no. of samples × plots = 3 × 6) composite samples; each composite sample was derived from 5 samples from each plot at 10 cm depth. Post hoc comparisons within sampling dates are indicated by asterisks: (*): p < 0.10; * p < 0.05; ** p < 0.01; *** p < 0.001.
Soilsystems 04 00069 g004
Table 1. Physiochemical properties of the Acacia-wood biochar (max temperature 550 °C, kiln derived) used in the experiment.
PropertiesUnitMean Value ± SE (n = 3)
Al%0.083 ± 0.003
Asppm1.000 ± 0.000
Bappm17.667 ± 0.333
Total C%72.1 ± 0.073
Ca%1.820 ± 0.031
Cdppm0.150 ± 0.041
Ceppm1.000 ± 0.000
Coppm0.467 ± 0.033
Crppm11.000 ± 2.517
Cuppm16.200 ± 0.208
Fe%0.900 ± 0.015
K%2.060 ± 0.038
Lappm0.533 ± 0.033
Lippm0.433 ± 0.033
Total N%1.8 ± 0.014
Na%0.051 ± 0.002
Nbppm1.067 ± 0.033
Nippm4.333 ± 0.133
P%0.235 ± 0.002
Rbppm25.000 ± 0.404
Pbppm3.167 ± 0.067
Mg%0.120 ± 0.000
Mnppm131.667 ± 2.728
Moppm1.767 ± 0.033
Sbppm0.100 ± 0.000
Snppm1.467 ± 0.088
Srppm70.333 ± 1.453
Thppm0.133 ± 0.033
Tlppm< 0.05
Wppm0.200 ± 0.000
Yppm0.333 ± 0.033
Znppm799.667 ± 35.751
Zrppm2.233 ± 0.393
Volatile matter%70.2 ± 0.89
Ash content%7.9 ± 0.12
pH-7.6 ± 0.11
ECµS.cm−1532.3 ± 17.6
Bulk densityg·cm−30.141 ± 0.005
Notes: Ag, Be, Bi, Cs, Hf, Sc, Ta, Tl, U, and V were below detection limits (<0.05 ppm for Tl; <0.1 ppm for Ag, Bi, Cs, Hf, Ta, and U; <1 ppm for Be and Sc; <4 ppm for V; and < 1% for S).
Table 2. Results of linear mixed-effects models examining biochar effects on various soil properties by land-use. Significant terms in linear mixed-effects models and multiple contrast comparisons (i.e., p < 0.05) are denoted in bold-faced type.
FactorTermF-Value (DF)Adj.
p-Value
ContrastEstimate ± SEAdj.
p-Value
Total N (%)Tmt0.39 (40)0.53b—c−0.01 ± 0.010.53
LU1.06 (40)0.35
Tmt × LU0.75 (40)0.47b_tea_mc—c_tea_mc0.004 ± 0.021.00
b_tea_af—c_tea_af−0.002 ± 0.021.00
b_for—c_for−0.037 ± 0.020.75
Available P (%)Tmt2.1 (40)0.15b—c7.64 ± 8.190.15
LU31.96 (40)<0.01
Tmt × LU2.63 (40)<0.01b_tea_mc—c_tea_mc23.17 ± 8.610.01
b_tea_af—c_tea_af−3.05 ± 8.610.99
b_for—c_for0.37 ± 10.541.00
Available K (%)Tmt0.92 (40)0.34b—c−0.009 ± 0.010.34
LU7.78 (4)<0.01
Tmt × LU0.11 (40)0.89b_tea_mc—c_tea_mc−0.005 ± 0.010.99
b_tea_af—c_tea_af−0.009 ± 0.020.99
b_for—c_for−0.016 ± 0.020.95
pHTmt0.91 (40)0.34b—c0.053 ± 0.120.34
LU72.72 (40)<0.01
Tmt × LU29.10 (40)<0.01b_tea_mc—c_tea_mc0.1 ± 0.090.09
b_tea_af—c_tea_af−0.001 ± 0.091.00
b_for—c_for0.069 ± 0.110.98
Moisture Content (%)Tmt5.53 (40)0.02b—c1.75 ± 2.130.02
LU158.59 (4)<0.01
Tmt × LU4.42 (40)<0.01b_tea_mc—c_tea_mc4.56 ± 1.220.006
b_tea_af—c_tea_af−0.225 ± 1.221.00
b_for—c_for0.46 ± 1.490.99
Bulk density
(g·cm−3)
Tmt8.53 (40)<0.01b—c−0.123 ± 0.050.03
LU23.00 (40)<0.01
Tmt × LU0.40 (40)<0.01b_tea_mc—c_tea_mc−0.16 ± 0.060.08
b_tea_af—c_tea_af−0.13 ± 0.060.03
b_for—c_for−0.06 ± 0.080.97
Organic Matter (%)Tmt13.11 (40)<0.01b—c1.12 ± 0.29<0.01
LU0.32 (40)0.72
Tmt × LU2.8 (40)0.02b_tea_mc—c_tea_mc0.95 ± 0.50 0.04
b_tea_af—c_tea_af1.16 ± 0.500.02
b_for—c_for1.31 ± 0.610.14
Notes: Tmt: treatments; LU: landuse; DF: degrees of freedom; b-c: biochar—control; b/c_tea_mc: biochar/control × tea monoculture; b/c_tea_af: biochar/control × tea agroforestry; b/c_for: biochar/control × forest.
Publisher’s Note: MDPI stays neutral with regard to jurisdictional claims in published maps and institutional affiliations.

