Article

Correlations of Soil Fungi, Soil Structure and Tree Vigour on an Apple Orchard with Replant Soil

1
Leibniz Centre of Agricultural Landscape Research (ZALF), 15374 Müncheberg, Germany
2
Johann Heinrich von Thünen-Institut, 38116 Braunschweig, Germany
3
Department of Soil Science, Institute of Ecology, Faculty VI Planning Building Environment, Technische Universitat Berlin, 10623 Berlin, Germany
*
Author to whom correspondence should be addressed.
Submission received: 8 October 2020 / Revised: 24 November 2020 / Accepted: 27 November 2020 / Published: 3 December 2020

Abstract

:
The soil-borne apple replant disease (ARD) is caused by biotic agents and affected by abiotic properties. There is evidence for the interrelation of the soil fungal population and soil aggregate structure. The aim of this study conducted between March and October 2020 on an orchard in north-east Germany was to detect the correlations of soil fungal density, soil structure and tree vigour under replant conditions in a series of time intervals. By using the replant system as the subject matter of investigation, we found that replanting had an impact on the increase of soil fungal DNA, which correlated with a mass decrease of large macro-aggregates and an increase of small macro- and large micro-aggregates in the late summer. Increased proportions of water-stable aggregates (WS) with binding forces ≤ 50 J mL−1, decreased proportions of WS > 100 J mL−1 and a decrease of the mean weight diameter of aggregates (MWD) emphasised a reduction of aggregate stability in replant soils. Correlation analyses highlighted interactions between replant-sensitive soil fungi (Alternaria-group), the loss of soil structure and suppressed tree vigour, which become obvious only at specific time intervals.

1. Introduction

Replant disease describes a phenomenon of disturbed physiological and morphological reactions of plants after replanting crop species at sites previously used for similar crop cultures [1]. Replant disease has been reported for several horticultural crops, including apples, peaches and cherries in nurseries and orchards all over the world [2,3]. On apple trees, symptoms of replant disease include damaged root systems; stunted growth above and below ground; and reduced fruit yields [1,4]. While the direct cause of the soil-borne replant disease has not been revealed, it has been attributed to a plethora of potential biotic and also abiotic factors. Biotic factors are generally believed to be the predominate causal agents of replant disorders, since replant soils treated with soil fumigation, soil pasteurisation and soil sterilisation have shown restored regular plant growth [5,6,7,8]. Convergence has evolved around genera of oomycetes (Pythium, Phytophthora); actinomycetes or bacteria (Bacillus, Pseudomonas); and multiple fungal species (e.g., Cylindrocarpon-like fungi, Rhizoctonia, Fusarium) that appear to contribute to the complex disease [9,10,11]. However, a definite relation between sequence data and replant disease in the microbiome of replant soils has not been shown yet [12].
Abiotic factors, on the other hand, are understood as influences regulating the extent of the symptomatic effect of replant on tree vigour, rather than a primary cause [1,4]. Abiotic factors include water logging, soil pH and (micro)nutrient deficiencies [1,13,14]. Replant-sensitivity of apple trees has been found to differ by soil type [13,15] and soil texture [11,16]. Tewoldemedhin et al. (2011), for example, grouped the status of the apple replant disease (ARD) by growth response in non-treated versus pasteurised replant soil: low ARD—status on soils of clay and loamy texture; moderate ARD—status on soils of loamy texture; and severe ARD—status on soils of sandy texture [11].
Replant-related suppression of apple tree growth performance has been found individually pronounced between apple understocks and trees, respectively [17,18]. The suppression results in an uneven growth by heterogeneous distribution of more or less replant, symptomatic apple plants across replanted apple orchards. The suppression of tree vigour in apple trees, and the consequential lack of a development of best-performing trees across the orchard, leads to decreased profitability of yields that can add up to 50% throughout the life cycle of replanted orchards [19,20].
By meta-analysis, Nicola et al. (2018) showed that the soil microbial community significantly differs under replant conditions [12]. However, shifted microbial communities show relatively small overlaps of microbial constituents between geographically distantly located replant sites, indicating site-specific replant effects on the soil microbiome [12]. In field studies, ARD-symptomatic and non-symptomatic trees have been associated with shifts in the density of several soil fungi, including the class Dothideomycetes, and more specifically in the order Pleosporales [18]. The genetically determined Alternaria-group (Ag) (order Pleosporales, family Pleosporaceae) has been identified as a replant-sensitive soil fungal population which responds to replanting by abundance [19]. The proportion of Ag on the total soil fungal population was found to be 2% in replant soil; this was found to be 10-fold greater compared to no-replant soil. Such slight shifts in the Ag population can reflect larger shifts in the soil fungal community (beyond Ag) and thus be indicative for shifts in the distribution of sieve-size fractions and aggregate stabilities.
Most microbial studies indicating replant-related or even causal agent(s) of replant disorder have focussed on homogenized soil samples. Soil microbial interactions, however, occur in habitats much smaller than those generally captured in homogenized soil cores [21]. Microbial community composition is strongly mediated by soil structure [22,23]. The general heterogeneity of the soil structure supports a high diversity of microhabitats with different physico-chemical gradients and discontinuous environmental conditions [24,25], even when the overall environment of the soil is constant [23]. Specific microbial taxa have habitat preferences that are linked to the morphological, chemical and physical properties of the interior and exterior interfaces of soil aggregates [26,27]. In general, the proportion of fungi within soil aggregates varies within aggregate size, as a greater proportion of fungi have been associated with macro-aggregates (>250 µm), whereas bacteria were mainly associated with micro-aggregates (≤250 µm) [21,28]. The microbial community was also found to vary within and among aggregate fractions of the same soil under different management and tillage practices [29,30].
Soil microorganisms effect the formation and stabilisation of soil aggregates, and thereby significantly involve themselves in the processes of building soil structure [31,32,33]. Microbes release excretions, including extracellular polymeric substances, which enmesh soil particles into aggregates. Similarly, soil particles can also be enmeshed into aggregates by fungal hyphae [34]. Fungi have been found involved in the binding of larger particles, and are predominantly responsible for stabilization of macro-aggregates due to their hyphae structure [27,35,36]. The influence of fungi and bacteria on aggregate stabilization varies widely among species and depends considerably on the nature of the available substrates [37]. In general, fungi are better correlated with aggregate stability and lead to stronger binding forces between soil particles than with bacteria [38].
Soil physical structures and microbial community composition shift in short timescales (weeks) depending on environmental conditions, such as (soil-)climate and related soil ecosystem conditions, e.g., soil moisture. The extents of the shifts in soil abiotic and biotic properties differ depending on the crop and the management system of the cultivation [39,40,41].
Overall, this indicates a seasonal connection between the soil fungal population and the soil structure, particularly the size and mass distribution of aggregates. Our aim was to explore this possible correlation between the soil fungal population and the soil structure in a case study for apple replant disease. This was done by analysing the sizes and mass distributions of soil sieve-size fractions, and their physical stability, and contrasting the results with the replant effects on tree vigour. For this, we analysed and compared the soils of an apple orchard where apples were cultivated on initially planted and repeatedly planted soils in the direct vicinity and under identical cultivation management. The data were collected over four time intervals in one growing season from March to October in 2018.

2. Materials and Methods

2.1. Test Site and Sampling Design

The study was conducted on an intensively managed commercial fruit orchard, located east of Berlin in the district Märkisch Oderland (Altlandsberg, longitude: 52.62623, latitude: 13.804264) in Brandenburg, a state in north-eastern Germany. On this orchard, a variety of fruit trees, including different varieties of dessert apples, are cultivated on sandy brown, dry and warm diluvial Eutric Retisols (Geoabruptic, Arenic, Aric) and physico-chemically very similar Geoabruptic Luvisols (Arenic, Aric, Cutanic) (according to World Reference Base for Soil Resources, WRB) [42]. Within the orchard we selected two test fields, one with initial apple cultivation (no-replant, nr) and one with repeated apple cultivation (replant, r), both in the direct vicinity of one another and identically managed. Both cultivations were set up in 2009 with tall spindles from apple scions ROHO 3615 EVELINA® cultivated on understock of M.9.
On both test areas we periodically collected data on tree vigour, and sampled soil cores to analyse soil fungal populations, starting in March 2018 with the beginning of the growing season. For the analysis, we selected three tree rows in the replant area and one row on the no-replant area. Within each row we selected a consecutive number of 18 trees. The selected trees stood in parallel with a minimum of inter-row distance of 3.5 m, in order to reduce the influence of the inherent soil-related spatial variability in soil physiochemical properties, and thus, soil microbial structure [18]. Within each row we selected three trees for the analysis of soil. This selection of planting spots for further soil analysis was based on tree vigour, so that the three selected tree spots each represented the strongest, a medium and the lowest tree vigour of the respective 18 trees in line.
We started sampling just after a strong period of ground frost [43] up to 50.0 cm soil depth, and ended in October with vegetation dormancy. Sampling started in week 10 (5 March); was repeated in week 16 (19 April), week 25 (20 June) and in week 31 (2 August); and was last performed in week 43 (22 October). The sequence of sampling aligned with the annual growing season of the apples and the cultivation plan of the farmer.

2.2. Measurement of Tree Vigour

The trunk cross-sectional area (CSA) is a practical and robust parameter for tree vigour [19]. Therefore, trunk circumference was measured by standard folding ruler at 40.0 cm above soil surface and a millimetre tapeline. CSA was calculated using Equation (1):
C S A = π / 4 × t r u n k   c i r c u m f e r e n c e 2

2.3. Soil Sampling

Soil cores were sampled from the top 20.0 cm of the trees, 10.0 cm distance from the tree trunk with a Puerckhauer sampler. Three soil cores were collected from each sampling point in a distance of 15.0 cm at each sampling time. The topmost 2.0 cm of each soil core were removed. Soil cores were stored at 4 °C.

2.4. Size Fractionation of Soil

Soil samples were fractionised to determine the mass distribution of soil fractions across size classes and to quantify soil fungal densities per size fraction. Soil fractionation was performed with dried soil material. As the process of slowly air-drying soils changes the microbial growth and activity [44,45], the soil samples in a moist-field state were dried rapidly by 70 °C in a pre-heated kiln for 2 h to minimise the effect of drying by a rapid reduction of soil moisture. Soil samples were spread out in a thin layer to ensure even drying of soil material. After half time of drying, soil samples were turned and the drying procedure was continued for an additional hour.
Dried soil material was sieved by dry-sieving procedure. Bach and Hofmockel (2014) suggest that dry-sieving is a useful alternative to wet-sieving to more closely capture shorter in situ measures of seasonal and intra-annual soil microbial activity. Soil microorganisms and associated activities have been found to be sensitive to (re-)wetting events, while dry-sieving prevents cross-contamination between fractions due to “washing” [46] and lysis of microbes. Furthermore, different spatial domains of microbial diversity can be distinguished by patterns in the adhesive forces [46]. Wet-sieving can either enhance or diminish these adhesive forces between aggregate particles, and thus alter measured communities.
Dried soil material > 6300 µm was removed using a hand-held flat sieve. Remaining soil material was separated into six sieve-size fractions: 2000–6300, 1000–2000, 500–1000, 250–500, 125–250 and ≤125 µm, corresponding to Wentworth’s (1922) classification scheme of soil particle sizes, which allows for a higher resolution of soil parameters than would be observed by micro (≤250 µm), small (250–1000 µm), medium (1000–2000 µm) and large macro-aggregates (>2000 µm) [47]. The disaggregation of less stable soil structural units due to mechanical stress [48] was largely avoided by applying manual sieving, thereby imitating horizontal movements at a stroke of 20 min−1. Flat sieves were filled with 5 mL soil material and rotated for 3 min. Each sieve-size fraction was separately fractionised to ensure the same time of cycling of soil material on each sieve mesh and weighed. Sieved soil material was locked in bags to avoid moistening during storage at 4 °C. As a concession to the analysis of the microbial community, with this method we did not separate water-stable from water-labile aggregates and non-aggregated primary particles, but measured total aggregate masses. The mass distribution of sieve-size fractions in soil was calculated by using the weighed masses of the sieve-size fractions and normalising them with respect to the total soil material sieved.
The mean weight diameter (MWD) of aggregates was calculated according to Van Bavel (1949) by Equation (2):
M W D = i = 1 n x i w i
where xi is the mean diameter of any sieve-size fraction, and wi is the weight proportion of this fraction [49]. We used the MWD as a parameter of the soil aggregation level.

2.5. Fractionation of Aggregate-Stability Classes

2.5.1. Calibration of the Ultrasonication Device

The dispersion of soil samples was performed using an ultrasonic apparatus (Sonoplus 2070 Ultraschall-Homogenisator, BANDELIN electronics GmbH and Co. KG, Berlin, Germany) with a V 70 T sonotrode (Ø 13.0 mm). The power of the device was 70 W with an oscillation frequency of 20 kHz. The cavitational action of the sonotrode (J s−1) was determined by measuring the heating rate of deionized water inside a Dewar vessel [50]. The calibration was performed by subjecting five replicates of 180 g deionized water to successive ultrasonications of 1, 2, 3, 4 and 5 min with the respective measurement of temperature. The performance of the ultrasonic device was then calculated following Schmidt et al. (1999) [51]. Graf-Rosenfellner et al. (2018) demonstrated that this way of calibrating the power output creates replicable results when applied with different sonication devices and procedural details [52].

2.5.2. Dispersive Treatment

The proportions of water-stable aggregates and their stability in the face of mechanical stress were determined by consecutive applications of 0, 50 and again 50 J mL−1, respectively, for wet-sieving and weighing. Wet-sieving was performed following the operator’s manual (Eijkelkamp Soil and Water, Giesbeek, the Netherlands; stroke length 1.3 cm, at 34 stroke min−1), which is similar to existing methods (e.g., Kemper and Rosenau, 1986 [53]). Each 3.0 g of soil material was placed into a sieve. The mesh size was always the lower limit of the sieve-size fraction tested at the time (125, 250, 500 µm). The soil samples were remoistened with deionized water by capillary action and then submerged. The soil material was wet-sieved for 3 min. Material smaller than the mesh diameter passed the sieve and was caught in stainless steel cans.
Immediately after the wet sieving procedure, the sieves, then containing only the water-stable aggregates, were placed into new cans, each filled with 70.0 g of deionized water. For subsequent ultrasonication, the sonotrode was submerged 1.5 cm into the sieves and 50 J mL−1 was applied. The sieves and cans were placed together into the wet-sieving apparatus and wet-sieving was repeated as described above. Ultrasonication and wet-sieving were then conducted once again. As a result, we gained disaggregated soil material of three distinct stability classes: the water-labile class (WL), the water-stable class with binding forces ≤ 50 J mL−1 (WS ≤ 50 J mL−1) and the water-stable class with binding forces ≤ 100 J mL−1 (WS ≤ 100 J mL−1). A fourth stability class, of water-stable aggregates with binding forces of >100 J mL−1 (WS > 100 J mL−1), comprised the soil sample that remained in the sieve and was not disaggregated by the procedure.
The disaggregated soil fragments were air-dried at 105 °C until the weight remained unchanged by evaporation any further (>17 h). After drying, the masses of the first three stability classes were weighed. The mass of the water-stable class with binding forces > 100 J mL−1 was calculated by subtracting the sum of the fragments from the original dry-weight of the sample. The procedure of disaggregation was repeated three times per sampling point and sieve-size fraction. Repeated measures were standardised for each 3 g of origin soil material.

2.6. Quantification of Soil Fungal Densities

Total DNA was extracted from 0.5 g soil according to the standard protocol of the NucleoSpin soil kit (Macherey-Nagel GmbH and Co. KG, Düren, Germany). The total amounts of purified DNA were assessed using a NanoDrop 1000 microvolume spectrophotometer following the NanoDrop ND-1000 standard protocol (Kisker Biotech GmbH and Co. KG, Steinfurt, Germany). Total fungal DNA was amplified using the highly conserved fungal rRNA gene primers ITS1F and ITS4 [54,55]. The total fungal DNA in a sample was quantified by SYBR green fluorescence qPCR (QuantStudio 12 K flex, Applied Biosystems) using 5 μL of template DNA in a 20 μL reaction mix (qPCR HRM-mix, Solis BioDyne, Tartu, Estonia). The PCR thermal protocol consisted of an initial 15 min denaturation step at 95 °C; 32 amplification cycles of 95 °C for 30 s, 55 °C for 30 s and 72 °C for 60 s; and a final extension step of 72 °C for 10 min.
For the quantification of the Alternaria-group, standard curves were generated based on dilution series of DNA from Alternaria tenuissima GH50t (efficiency > 0.91 and R2 > 0.998) (culture collection of microorganisms of the working group “Fungal Interactions” at the Leibniz Centre of Agricultural Landscape Research Müncheberg). The primers and probes used for detection of Ag were as described by Grube et al. (2015) [56], for the detection of all genetically defined species of Ag according to Lawrence et al. (2013) and Woudenberg et al. (2015) [57,58]. The PCR conditions were adapted to the qPCR mix (3 mM MgCl2, Solis BioDyne, Tartu, Estonia [59]). Different strains of plant-associated fungal species were used as negative controls, as they were reference strains of Verticillium (CBS 130603, CBS 130339, CBS 130340, DSM 12230 and CBS 447.54), Gibellulopsis (CBS 747.83), Trichoderma spp. (St365) and Fusarium [60].

2.7. Statistical Analyses

The data for all soil fungal and soil structural parameters (MWD, mass distribution of sieve-size fractions, aggregate-stability classes) were analysed using ANOVA (analysis of variance) and significant differences between no-replant soil and replant soil were calculated by Games–Howell post-hoc test. p < 0.05 was accepted as significant.
As datasets of plant parameters and soil parameters did not follow a normal distribution, Spearman’s rank correlation coefficient (ρs) was calculated for correlations between plant and soil parameters. Significant correlations were accepted at p < 0.05. Subsequently, significant correlations were calculated using non-linear regression analysis. All statistics were conducted using IBM SPSS Statistics 22.

3. Results

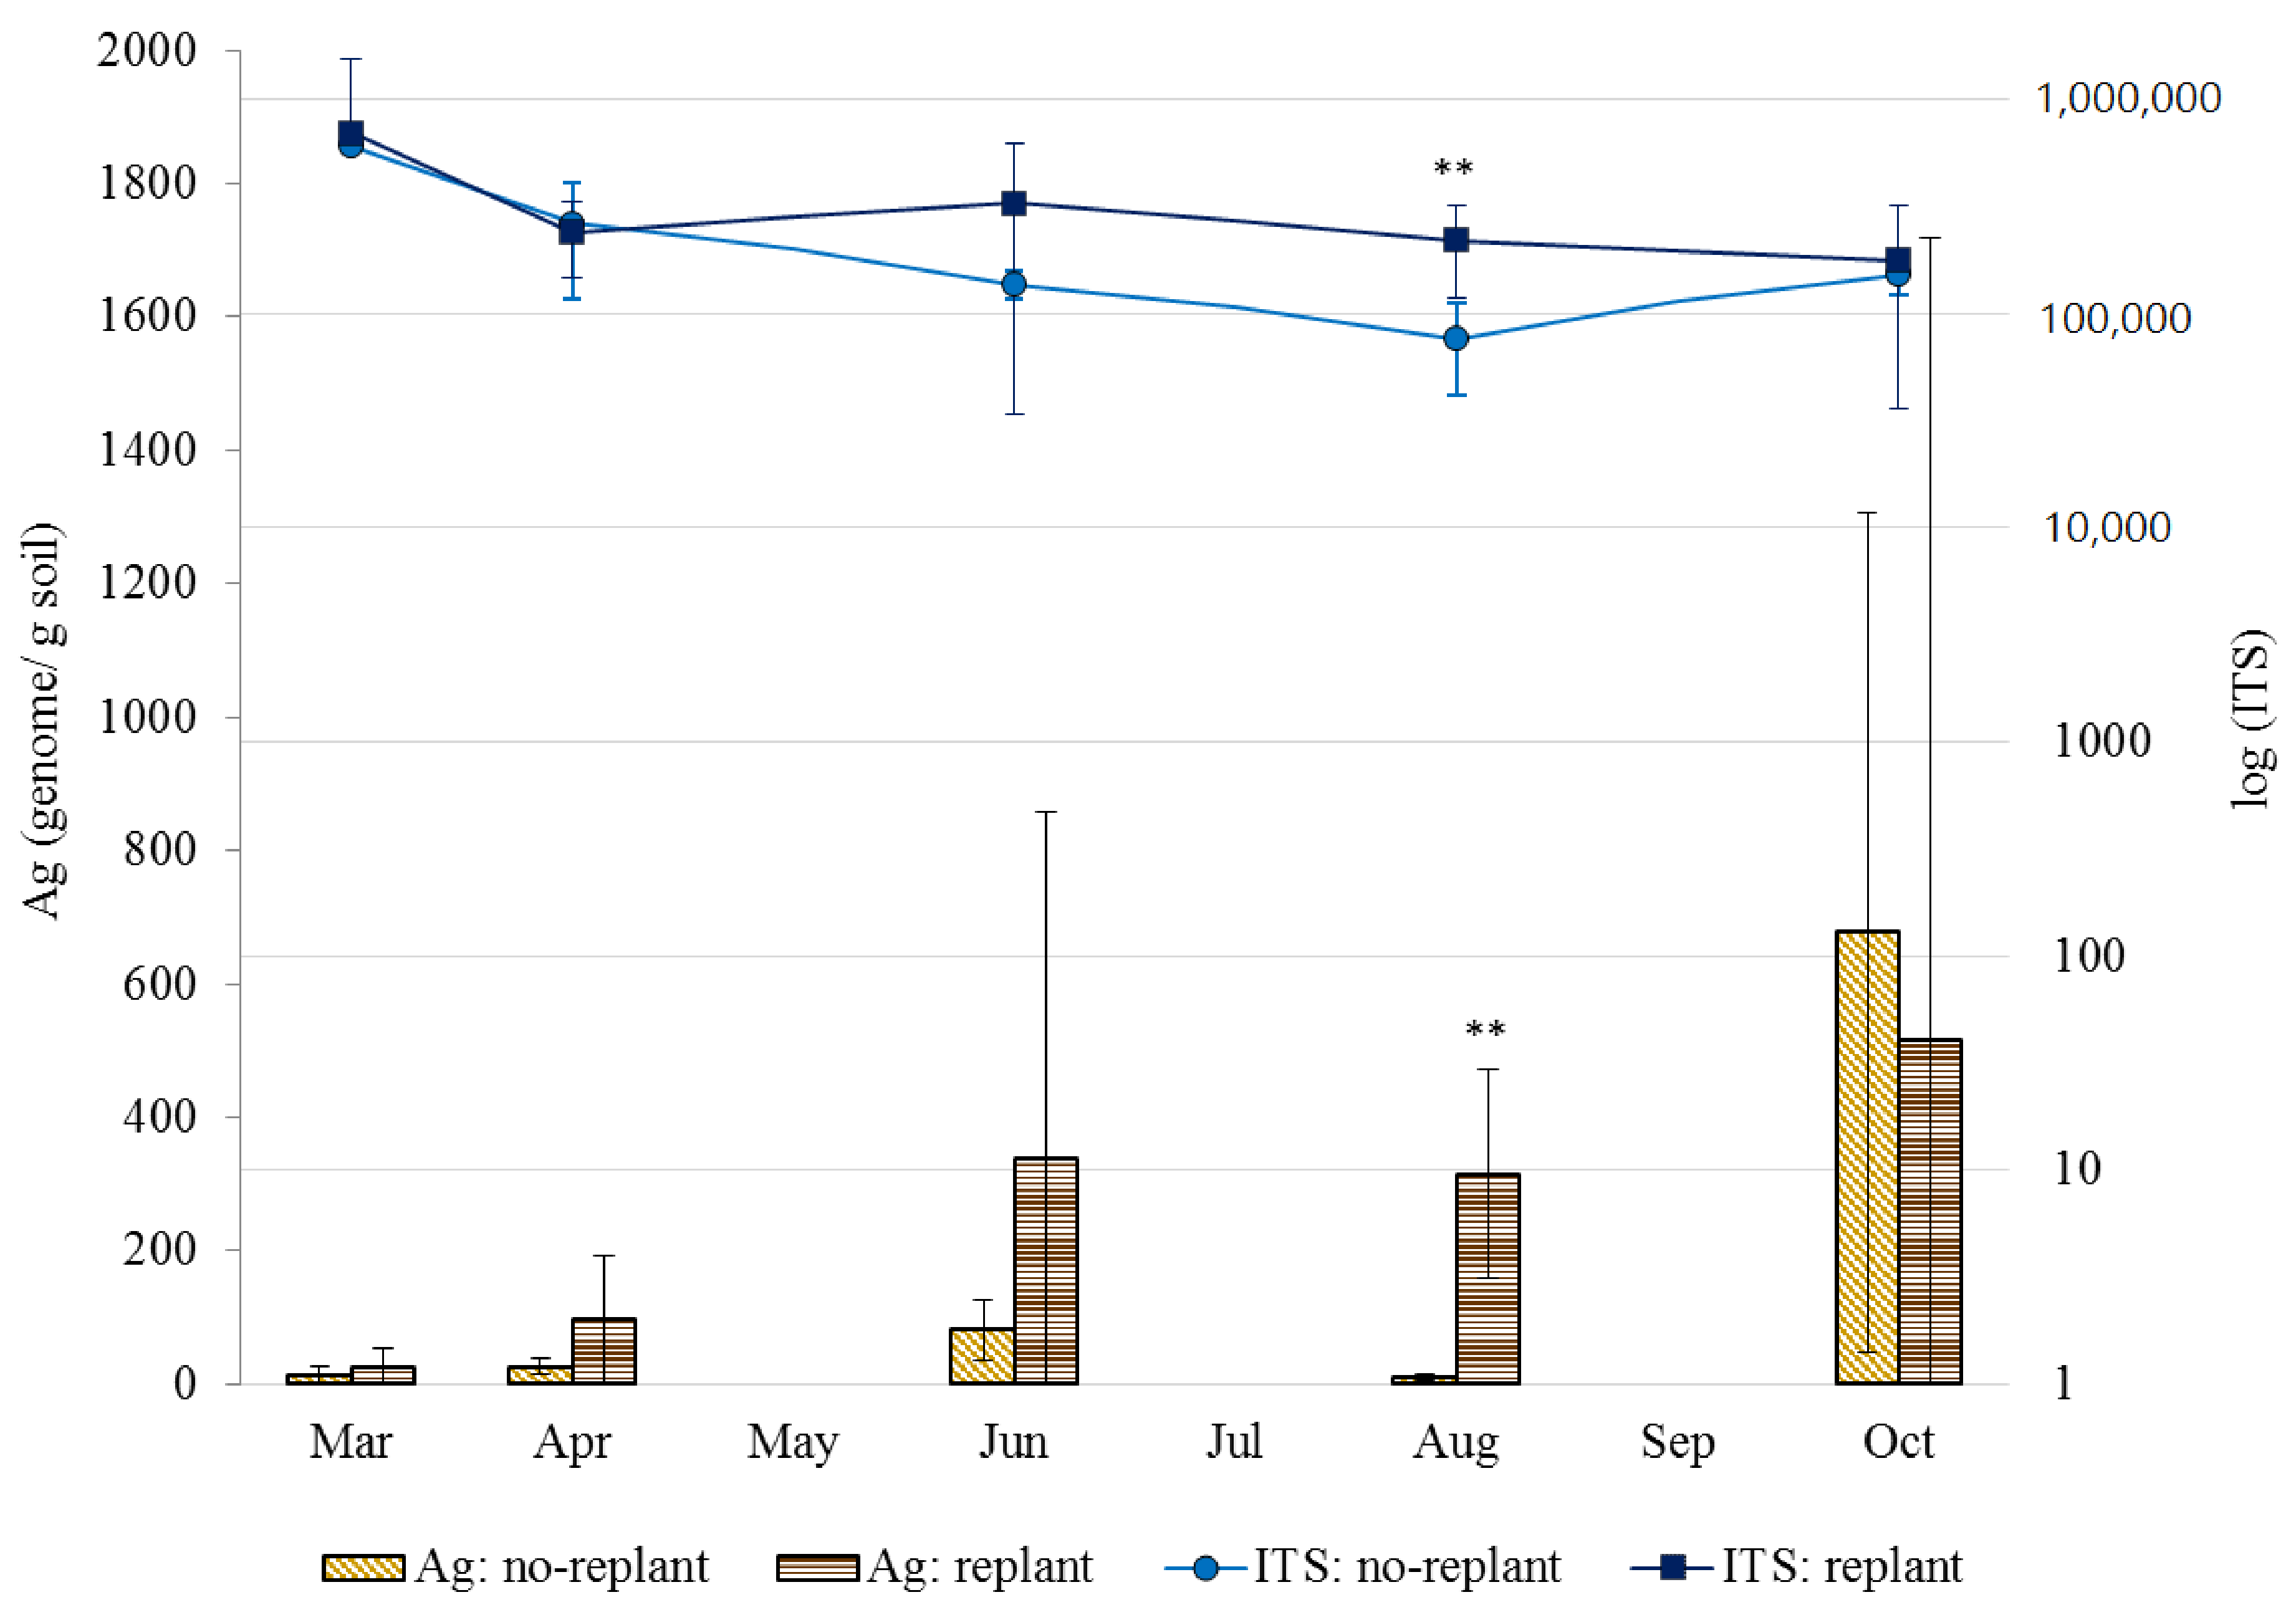
3.1. Soil Fungal Densities in No-Replant Soil and Replant Soil

Densities of soil fungi exhibited seasonal dynamics and differed between no-replant soil and replant soil, with stronger effects by season, as demonstrated for Ag and total fungi (ITS) in Figure 1. The Ag density in no-replant soil differed marginally between sampling dates from March to August, followed by a strong rise with a 70-fold increase until October. Starting from similar fungal densities on both planting areas after strong ground frosts in March, Ag density in replant soil continuously increased 21-fold following a logarithmic scale (R2 = 0.92) to a maximum in October. The differing trends of Ag proportion among total fungi between no-replant soil and replant soil were found most pronounced in August (p ≤ 0.01) and least in October (Figure 2).
In replant soil, the proportion of Ag among total fungal density increased disproportionally, as the increase in total fungal-density was not compensated due to increased Ag density. Total fungal density was at a maximum in March in both soils (no-replant/replant). Density of total fungi decreased by approximately 75% from March to October in soils, resulting in similar densities in no-replant soil and replant soil in October. In no-replant soil, total fungal density decreased at an exponential rate (R2 = 0.50), followed by an increase from August to October. In contrast, the total fungal density in replant soil rapidly decreased from March to April (−66%), followed by an increase up to June (+36%) and a further decrease from June to October (−46%). Different dynamics of fungal densities between no-replant soil and replant soil resulted in increased total fungal density in June (p > 0.05) and significantly increased density in August (p ≤ 0.01) under replant conditions.

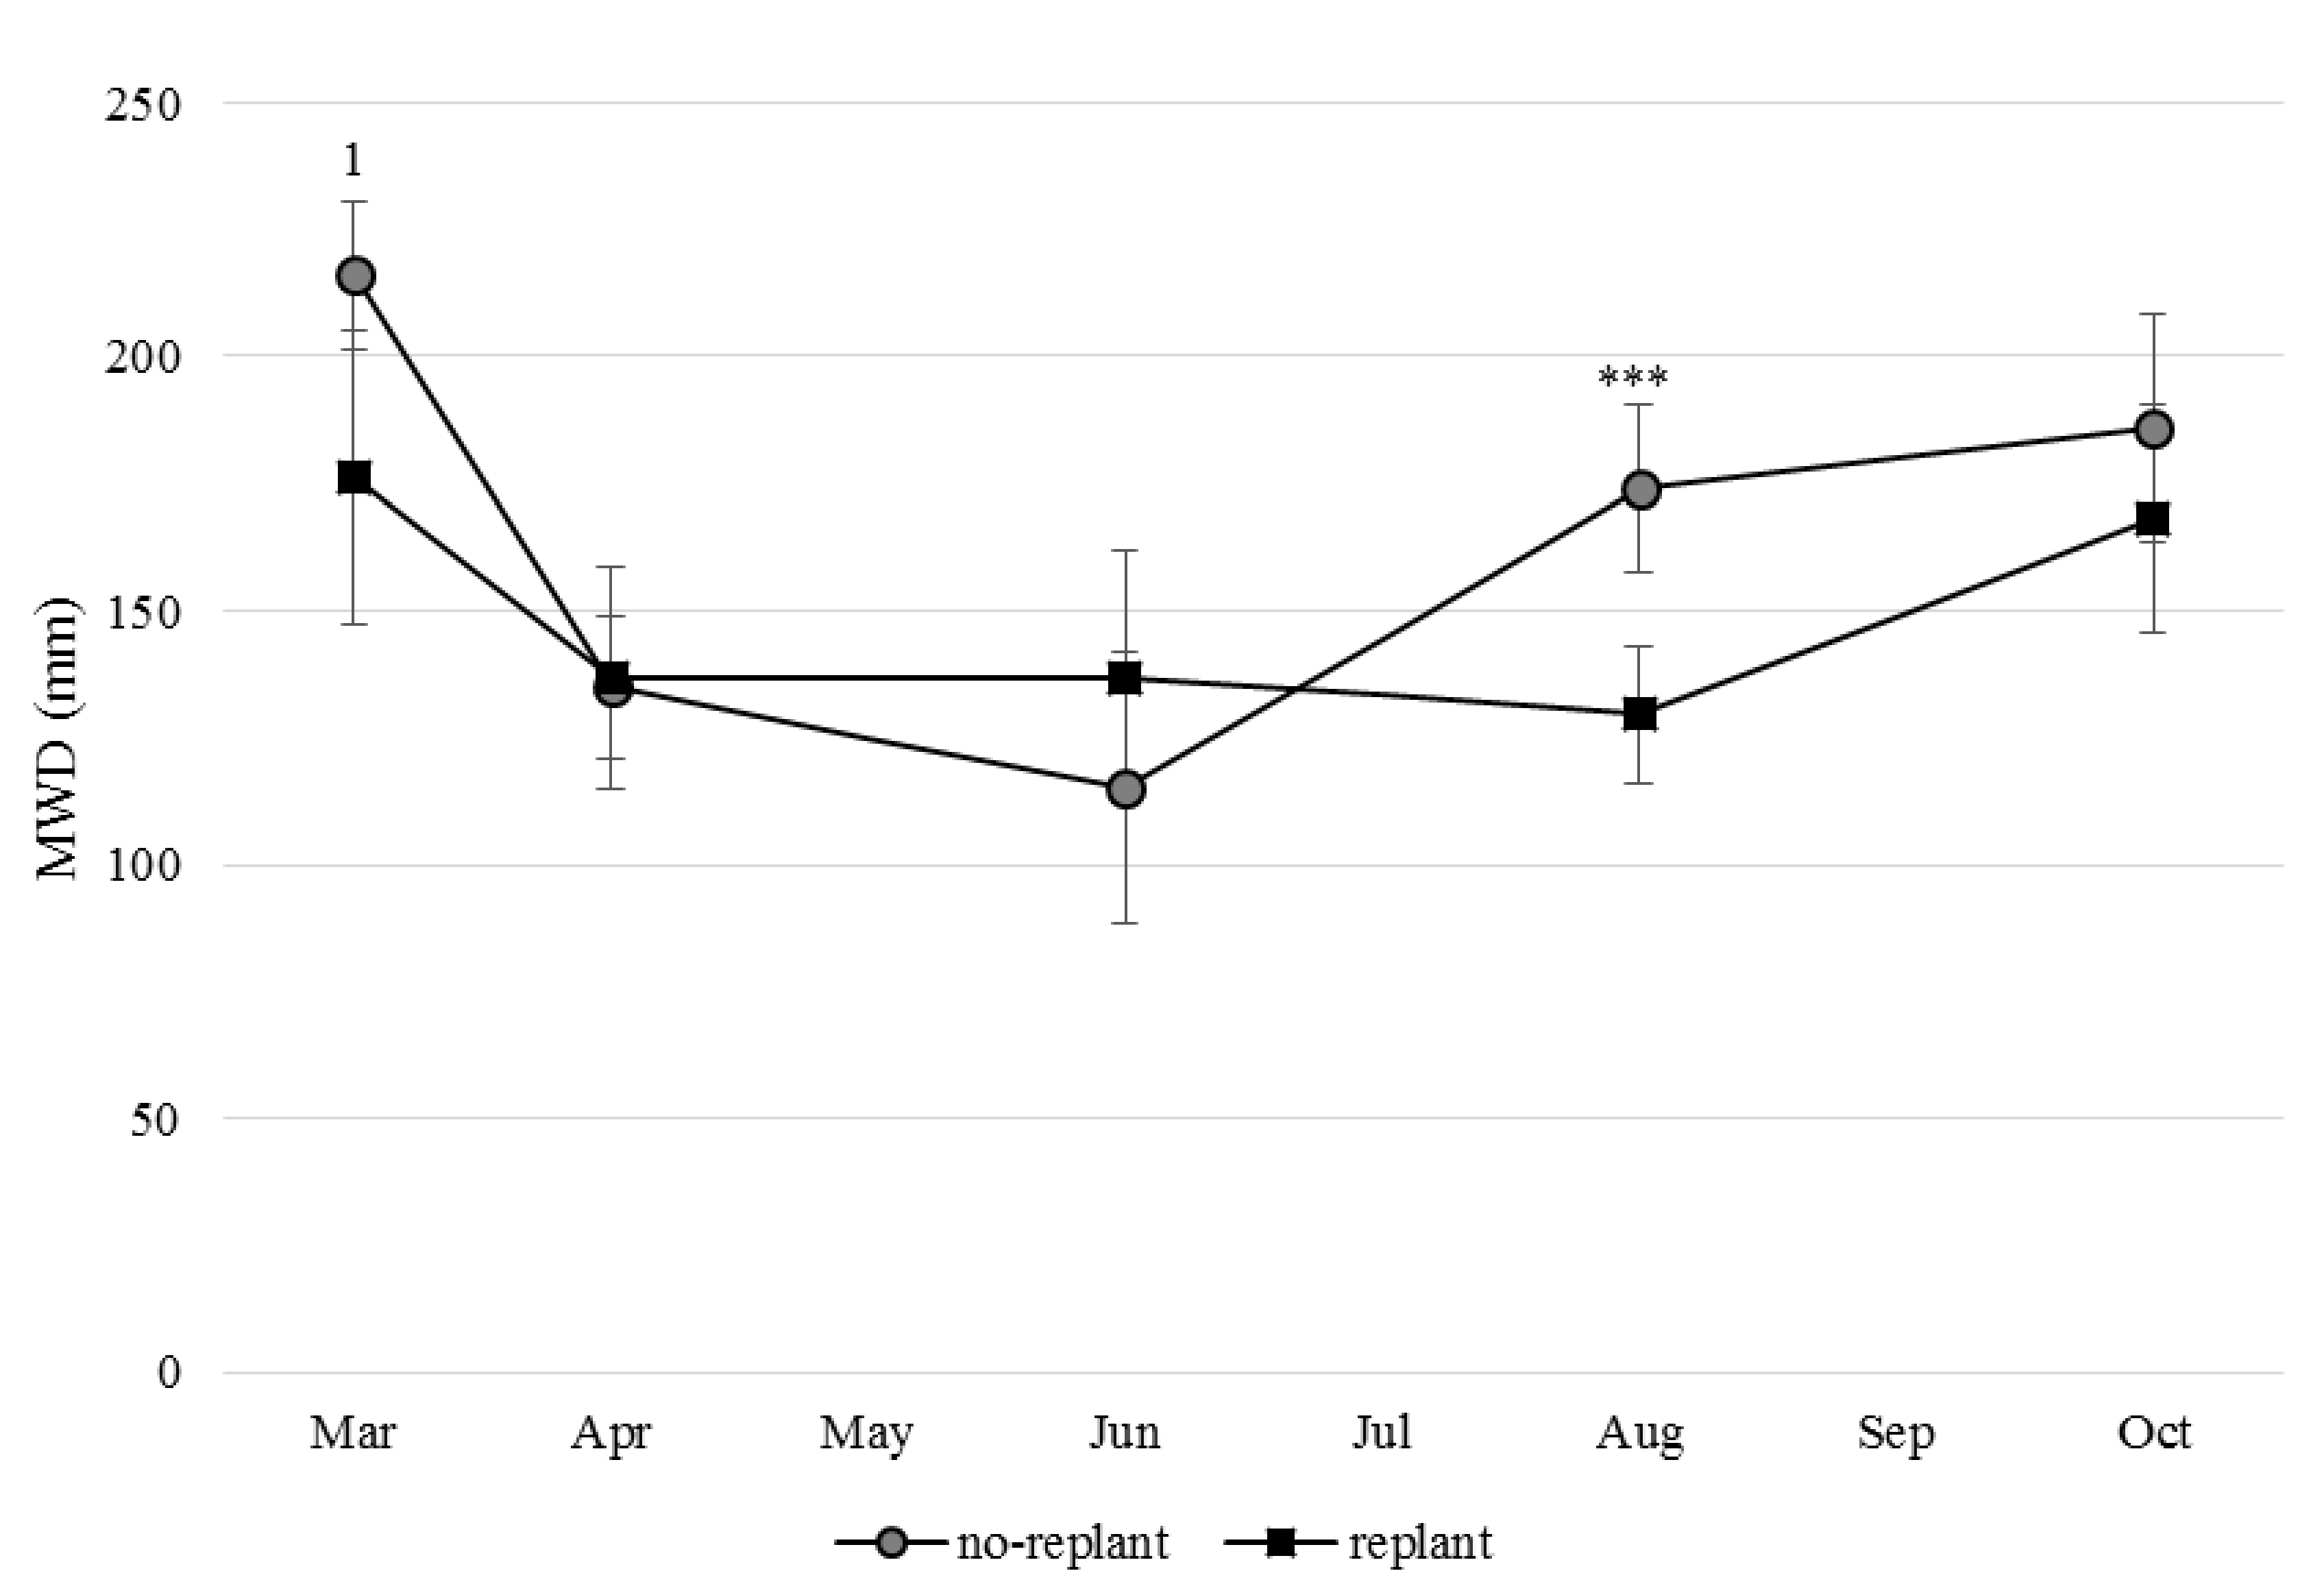
3.2. Aggregation Level in No-Replant and Replant Soil

The soil aggregation level varied over time and between no-replant soil and replant soil (Figure 3). Both soils had the highest MWD in March; however, the aggregates tended to differ by a lower MWD in replant soil (p ≤ 0.10). During the first half of the growing season, the aggregation level of no-replant soil decreased to a minimum in June, and in turn, increased during second half of growing season. In replant soil the soil, aggregation level was at a minimum in April, and then remained at a constant level until August, which was followed by an increase up to October. In August, no-replant soil and replant soil differed significantly due to less soil aggregation of the replant soil.
Seasonal differences in MWD were mainly driven by the 2000–6300 µm fraction. A decrease in MWD in no-replant soil during the first half of the growing season was concomitant with an increase of soil in fractions ≤ 1000 µm, whereas it was concomitant with an increase in soil in fractions from 125 to 2000 µm in replant soil. In the second half of the growing season, an increase in MWD was driven by aggregation of the 125 to 1000 µm fractions in both soils. Throughout, the mass of the 2000–6300 µm fraction was lower, and masses of the 125 to 1000 µm fractions were higher in replant soil than in no-replant soil, with an exception in April (Table 1). Significant differences in the mass distribution of sieve-size fractions between soils (no-replant/replant) were observed in August and October. In August, sieve-size fraction 2000–6300 µm was significantly decreased by 36%, whereas fractions 125–250 µm (+29%), 250–500 µm (+43%) and 500–1000 µm (+54%) were significantly increased under replant conditions. In October, sieve-size fractions ≤ 125 µm (+12%), 500–1000 µm (+57%) and 1000–2000 µm (+17%) were significantly increased in replant soil compared to no-replant soil.

3.3. Aggregate-Stability of No-Replant and Replant Soil

In line with the decreased aggregate size in replant soils observed in August, replant soils also showed a highly significant increase of less stable aggregates (WS ≤ 50 J mL−1) with sizes < 500 µm, and a corresponding decrease of the more stable kind (WS > 100 J mL−1), compared to no-replant soil (Table 2). With 74 to 97%, these two stability classes contain the bulk soil mass, whereas for WL and WS ≤ 100 J mL−1 neither have large masses (except for the coarse sand fraction within the 500–1000 µm fraction) nor show any significant effects.

3.4. Correlations between Soil Fungi and Structural Parameters

We correlated soil fungal densities in moist-field, non-sieved soil with soil structural parameters (MWD and mass distribution of sieve-size fractions), as after soil drying and dry-sieving, the quantification of soil fungal densities for sieve-size fractions did not result in reliable data. As a result, analysis showed correlations in August (Table 3). Indirect correlations between soil fungal parameters and MWD in a logarithmic scale were due to differing correlations between fungal-parameters and mass distributions of sieve-size fractions. Fungal parameters were indirectly correlated with fraction 2000–6300 µm, and with fractions from 125 to 1000 µm.
For fractions 125–250, 250–500 and 500–1000 µm, non-linear correlations on a logarithmic scale was observed between soil fungal parameters and WS ≤ 50 J mL−1 and WS > 100 J mL−1. Ag density was directly correlated with WS ≤ 50 J mL−1 in fractions 125–250 and 250–500 µm, whereas it was indirectly correlated with WS > 100 J mL−1 in fractions 125–250 and 500–100 µm. Total fungal-density was only directly correlated with WS ≤ 50 J mL−1 in fraction 250–500 µm, and indirectly correlated with WS > 100 J mL−1 in fractions 125–250, 250–500 and 500–1000 µm. The proportion of Ag among total fungi was only directly correlated with WS ≤ 50 J mL−1 and tended to an indirect correlation with WS > 100 J mL−1 in fraction 125–250 µm.

3.5. Correlation between Tree Vigour (CSA), Soil Fungi and Soil Structure

The mean CSA of trees on replant soil of 19.0 cm2 was significantly lower compared to the mean CSA of reference trees on no-replant soil of 38.5 cm2 (p ≤ 0.01). The range of tree vigour on replant soils spanned a minimum of 5.4 cm2 to a maximum of 33.8 cm2. For no-replant soil, the range of tree vigour was 34.4 to 39.2 cm2. Differences in the CSA between no-replant soil and replant soil, but also within soil variants (nr/r), were assumed to be reflected by soil fungal densities and related soil structure.
Correlations were observed by a direct comparison of all data between no-replant soil and replant soil (Table 3, nr + r). Correlation analysis of soil fungal parameters and soil structural parameters (MWD and mass distribution of sieve-size fractions) with CSA highlights the significant correlations between parameters in August (Table 4). Indirect correlations on an exponential scale were observed between Ag density, and proportion of Ag among total fungi and CSA. An exponential fitting of regression between MWD and CSA was due to direct correlation of CSA with the mass distribution of fraction 2000–6300 µm and indirect correlation with fractions 250–500 + and 500–1000 µm.

4. Discussion

In this study we investigated correlations between the dynamics of soil fungal populations and soil structure (aggregates) in relation to a gradual impact of replanting on tree vigour in a series of time intervals over one growing season; we used not-replanted and replanted soil. Our results show reduced aggregate size and stability, along with decreasing density of total soil fungal DNA (ITS) and increasing density of Alternaria-group (Ag) for apple trees repeatedly planted on the same site, which suffered a loss of vigour. We found that the density of Ag and soil structure parameters correlate at replant-indicative time intervals—in our study observed in August.
The determination of total fungal densities highlights a replant-related effect in June and August (and shows no replant-related specific behaviour of the total fungal population in March, April or October). One replant-responsive soil fungal group, exemplary for indicating shifts in the soil fungal community, the Alternaria-group (Ag) (class Dothideomycetes, order Pleosporales, family Pleosporaceae) [19], continuously increased its density in replant soil over the growing season, resulting in a distinct difference of Ag density between soils in August. On the same site, the Ag was found to be replant-indicative by density of soil fungal population two years earlier (2019) [19]. However, in 2016 an increased Ag density under replant conditions was observed in April with a two-fold greater Ag density in no-replant soil and a four-fold greater Ag density in replant soil as compared to Ag densities found in April 2018. Inter-annual variations have also been reported for the date of maximum growth difference between treated and non-treated replant soils, and for the effect of soil treatments regarding combating replant-affecting soil microbes [61].
The formation of aggregates exhibits different dynamics between replant soil and no-replant soil during the growing season. While the degree of aggregation follows similar patterns, the aggregate formation process is changed under replant conditions. The steady degree of aggregation between April and August suggests that aggregate turnover processes are prevented over summer under replant conditions. A decreased aggregation of replant soil has previously been reported for the replanting of peaches (Prunus persica) [30,62]. Concomitant with our results, the authors showed that the replant-specific low aggregation was due to a decreased proportion of fraction 2000–6300 µm and increased proportions of fractions 125–250, 250–500 and 500–1000 µm under replant conditions.
Our results show that fractions from 125 to 1000 µm and fraction 2000–6300 µm are replant-sensitive. In contrast, fractions ≤ 125 µm and 1000–2000 µm are replant-inert. The measurements of the mass distribution of sieve-size fractions highlighted differences in the composition of soils regarding soil structures (aggregates) in the replanted and initial planting area, which are significantly pronounced in August and less strong in October. Our indications of replant-sensitive sieve fractions in size ranges of fine sand (125–250 µm), medium sand (250–500 µm) and coarse sand (500–1000 µm), though not fine sand to silt and clay (≤125 µm), are consistent with several studies that state greater replant-related tree vigour suppression in light sandy soils as compared to heavy clay or loamy soils [11,13,15,63]. This result implies that aggregated particles in size range of small and large macroaggregates (sands) may perform as alternative microhabitats for increased densities of soil fungi.
According to our results, the mass distributions of fractions from 125 to 1000 µm, and fractions 2000–6300 µm are linked to increases of soil fungal densities (Ag) in August. The decrease of soil in fractions 2000–6300 µm and the increase of soil in fractions from 125 to 1000 µm, correlate with an increase in the density of soil fungi (Ag) under replant conditions. This observation is supported by a distinct, though not significant replant-specific behaviour of soil fungi also observed in June, but this could not be related to any change in the mass distributions of sieve-size fractions at that time of the year. Nevertheless, the observations suggest an interaction between soil fungi (Ag) and the formation of soil structures (aggregates) during summer. Soil fungi, in particular filamentous fungi, have a well-documented impact on soil structure by formation or disintregration of aggregates, especially of macroaggregates (>250 µm) [64,65]. The relevance of the correlation analysis is the consideration of potential interactions between soil and the apple under replant conditions over time. The ecology of the soil fungal populations and their association with the soil structure may be the next step in understanding causal interlinkages related to replant disease. For this purpose, we understand our case study as a first step that needs to be further tested by annual duplication in repeated studies in the field.
Wet-sieving and ultrasonication highlighted an increased concentration of less stable soil structures in fractions from 125 to 1000 µm in replant soils in August. Less stability of fractions 250–5000, 500–1000 and 2000–4000 µm, though not in fraction 1000–2000 µm, has previously been reported for the replanting of peaches (Prunus persica) [62]. Other observations of replant-specific proportions of aggregates with differing stability, notwithstanding 2 h sterilisation due to autoclaving [30,62], showed a high persistence of aggregate structures under replant conditions, even under extreme abiotic conditions. Persistence of water-stable aggregates for decades to centuries was already proven by Jastrow (1996) [66]. The potential persistence of a replant-sensitive aggregate stability class of WS ≤ 50 J mL−1 could contribute to the strong persistence of replant-effects that have been observed also after grubbing and irrespective of catch crops [67].
Aggregate-disintegrating processes in smaller and less stable aggregates have been found at a high Ag density. Increased Ag density is linked to less stable aggregates and tree vigour suppression in replant soil. The correlation between Ag density, soil structure and tree vigour means that replant-effects can pass unnoticed for most of the vegetation period and become obvious only in specific time intervals. This is relevant for monitoring replant effects by parameters of the soil.
A steady increase of replant-effects on soil parameters in the summer season may potentially match with the sensitive stage of apple nutrition by root performance. For apple understock M.9, steadily increased growth of root has been reported from June until August [68,69]. Root flush has also been reported around bloom [68], approximately in late April to May in Germany [70], in line with replant-specific increased Ag density observed in April 2016 [19]. Interestingly, the soil parameters’ return to a similar density as was determined at the beginning of the growing season in March before the beginning of dormancy season in October, and then did not differ between no-replant soil and replant soil anymore. This suggests that a replant-effect based on a shifted quantitative composition of soil fungal population is in competition with root growth in soil and de facto diminishes tree vigour by an offset of ontogenetic development, probably due to seasonally limited access to nutrients.
Our observations suggest that differences between replant and no-replant soils are pronounced, but may occur at irregular intervals. This in turn would mean that continuous and densely gridded monitoring of soil (and plant) during the whole growing season of apple would be necessary to detect indicative parameters for apple replant disease. It also shows that one-time sampling of orchard test sites and homogenised soil samples taken at few times only can be misleading in detecting interactions of soil fungi and soil structure (and tree vigour), depending on the time of sampling.
An analysis of interrelations between soil fungi, soil structure and apple tree vigour (suppression) will require continuous and densely gridded monitoring of soil to detect replant effects at indicative time intervals, and needs to be performed on single planting spots rather than with homogenised soil samples.

5. Conclusions

Soil structure was found to be replant-sensitive by mass distribution of large and small macroaggregates (2000–6300 µm, from 250 to 1000 µm) and large microaggregates (125–250 µm). Small macroaggregates and large microaggregates are less stable under replant conditions. The statistical analyses suggest that specific replant-responsive soil fungi, here the Alternaria-group (Ag), are involved in replant-related changes in soil structure. Hence, replant-specific aggregate-disintegrating processes seem to be related to densities of soil fungi. A correlation between soil fungi and structure can only be detected at specific time intervals over the growing season. Pronounced differences in soil structure between no-replant soil and replant soil occur together with a selective growth of Ag densities in late summer.
The density of replant-responsive soil fungi (Ag), in particular, is highly correlated with the plant reaction of trees in replant soil, so we conclude that the replant effect is a biologically active process. On the one hand, changes in soil structure contribute to the functional conditions for growth of specific soil fungi, and on the other hand, soil fungi may be involved in the formation of less stable soil aggregates. Our study suggests that the interaction between soil fungi and soil aggregates may be causally linked to interrelations between replant soil and plants.
An analysis of the interrelations between soil fungi, soil structure and apple tree vigour (suppression) will require continuous and densely gridded monitoring of soil to detect replant effects at indicative time intervals, and needs to be performed on single planting spots rather than with homogenised soil samples. In an applied context of the restoration of replant soil, our results provide the first indication that a potentially negative effect of the Ag on soil structure could be managed by good soil aggregators, e.g., mycorrhiza, to restore soil structure under replant conditions.

Author Contributions

Conceptualization, U.C. and P.L.; methodology, U.C., P.T. and P.L.; validation, F.B. and P.L.; formal analysis, U.C. and P.L.; investigation, U.C. and P.T.; resources, U.C., P.T., F.B. and P.L.; data curation, U.C.; writing—original draft preparation, U.C.; writing—review and editing, K.D. and F.B.; visualization, U.C. and P.T.; supervision, P.L.; project administration, K.D.; funding acquisition, K.D. All authors have read and agreed to the published version of the manuscript.

Funding

The research for this paper was financed by the German Federal Ministry of Education and Research (BMBF) within the framework of the BonaRes Initiative (FKZ:031B0025D), www.ordiamur.de.

Acknowledgments

The authors gratefully acknowledge the work of Petra Lange. We also thank Lutz Günzel and his team for providing access and insights into his plantation during our research cooperation.

Conflicts of Interest

The authors declare no conflict of interest.

References

  1. Winkelmann, T.; Smalla, K.; Amelung, W.; Baab, G.; Grunewaldt-Stöcker, G.; Kanfra, X.; Meyhöfer, R.; Reim, S.; Schmitz, M.; Vetterlein, D.; et al. Apple Replant Disease: Causes and Mitigation Strategies. Curr. Issues Mol. Biol. 2019, 30, 89–106. [Google Scholar] [CrossRef] [Green Version]
  2. Rani, G.D. Advances in Soil Borne Plant Diseases; New India Publishing: New Delhi, India, 2008. [Google Scholar]
  3. Verma, L.R.; Sharma, R.C. Diseases of Horticultural Crops: Fruits; Indus Publishing: New Delhi, India, 1999. [Google Scholar]
  4. Mazzola, M.; Manici, L.M. Apple Replant Disease: Role of Microbial Ecology in Cause and Control. Annu. Rev. Phytopathol. 2012, 50, 45–65. [Google Scholar] [CrossRef]
  5. Mai, W.F. Determining the Cause and Extent of Apple, Cherry, and Pear Replant Diseases Under Controlled Conditions. Phytopathology 1978, 68, 1540–1544. [Google Scholar] [CrossRef]
  6. Mazzola, M. Elucidation of the Microbial Complex Having a Causal Role in the Development of Apple Replant Disease in Washington. Phytopathology 1998, 88, 930–938. [Google Scholar] [CrossRef] [Green Version]
  7. Spath, M.; Insam, H.; Peintner, U.; Kelderer, M.; Kuhnert, R.; Franke-Whittle, I.H. Linking Soil Biotic and Abiotic Factors to Apple Replant Disease: A Greenhouse Approach. J. Phytopathol. 2015, 163, 287–299. [Google Scholar] [CrossRef]
  8. Yim, B.; Smalla, K.; Winkelmann, T. Evaluation of apple replant problems based on different soil disinfection treatments—Links to soil microbial community structure? Plant Soil 2013, 366, 617–631. [Google Scholar] [CrossRef]
  9. Franke-Whittle, I.H.; Manici, L.M.; Insam, H.; Stres, B. Rhizosphere bacteria and fungi associated with plant growth in soils of three replanted apple orchards. Plant Soil 2015, 395, 317–333. [Google Scholar] [CrossRef]
  10. Manici, L.; Kelderer, M.; Franke-Whittle, I.; Rühmer, T.; Baab, G.; Nicoletti, F.; Caputo, F.; Topp, A.; Insam, H.; Naef, A. Relationship between root-endophytic microbial communities and replant disease in specialized apple growing areas in Europe. Appl. Soil Ecol. 2013, 72, 207–214. [Google Scholar] [CrossRef]
  11. Tewoldemedhin, Y.T.; Mazzola, M.; Labuschagne, I.; McLeod, A. A multi-phasic approach reveals that apple replant disease is caused by multiple biological agents, with some agents acting synergistically. Soil Biol. Biochem. 2011, 43, 1917–1927. [Google Scholar] [CrossRef]
  12. Nicola, L.; Insam, H.; Pertot, I.; Stres, B. Reanalysis of microbiomes in soils affected by apple replant disease (ARD): Old foes and novel suspects lead to the proposal of extended model of disease development. Appl. Soil Ecol. 2018, 129, 24–33. [Google Scholar] [CrossRef]
  13. Fazio, G.; Kviklys, D.; Grusak, M.A.; Robinson, T.L. Soil pH, soil type and replant disease affect growth and nutrient absorption in apple rootstocks. N. Y. Fruit Q. 2012, 20, 22–28. [Google Scholar]
  14. Utkhede, R.S. Soil sickness, replant problem or replant disease and its integrated control. Allelopath. J. 2006, 18, 23–38. [Google Scholar]
  15. Mahnkopp, F.; Simon, M.; Lehndorff, E.; Pätzold, S.; Wrede, A.; Winkelmann, T. Induction and diagnosis of apple replant disease (ARD): A matter of heterogeneous soil properties? Sci. Hortic. 2018, 241, 167–177. [Google Scholar] [CrossRef]
  16. Sheng, Y.; Wang, H.; Wang, M.; Li, H.; Xiang, L.; Pan, F.; Chen, X.; Shen, X.; Yin, C.; Mao, Z.; et al. Effects of Soil Texture on the Growth of Young Apple Trees and Soil Microbial Community Structure under Replanted Conditions. Hortic. Plant J. 2020, 6, 123–131. [Google Scholar] [CrossRef]
  17. Simon, M.; Lehndorff, E.; Wrede, A.; Amelung, W. In-field heterogeneity of apple replant disease: Relations to abiotic soil properties. Sci. Hortic. 2020, 259, 108809. [Google Scholar] [CrossRef]
  18. Tilston, E.L.; Deakin, G.; Bennett, J.; Passey, T.; Harrison, N.; O’Brien, F.; Fernández-Fernández, F.; Chen, W.-H. Candidate Causal Organisms for Apple Replant Disease in the United Kingdom. Phytobiomes J. 2018, 2, 261–274. [Google Scholar] [CrossRef] [Green Version]
  19. Cavael, U.; Diehl, K.; Lentzsch, P. Assessment of growth suppression in apple production with replant soils. Ecol. Indic. 2020, 109, 105846. [Google Scholar] [CrossRef]
  20. Van Schoor, L.; Denman, S.; Cook, N. Characterisation of apple replant disease under South African conditions and potential biological management strategies. Sci. Hortic. 2009, 119, 153–162. [Google Scholar] [CrossRef]
  21. Bach, E.M.; Williams, R.J.; Hargreaves, S.K.; Yang, F.; Hofmockel, K.S. Greatest soil microbial diversity found in micro-habitats. Soil Biol. Biochem. 2018, 118, 217–226. [Google Scholar] [CrossRef]
  22. Fox, A.; Ikoyi, I.; Torres-Sallan, G.; Lanigan, G.; Schmalenberger, A.; Wakelin, S.; Creamer, R. The influence of aggregate size fraction and horizon position on microbial community composition. Appl. Soil Ecol. 2018, 127, 19–29. [Google Scholar] [CrossRef]
  23. Nunan, N. The microbial habitat in soil: Scale, heterogeneity and functional consequences. J. Plant Nutr. Soil Sci. 2017, 180, 425–429. [Google Scholar] [CrossRef] [Green Version]
  24. Ditterich, F. Microbial Community Structure and Function is Shaped by Microhabitat Characteristics in Soil. Ph.D. Thesis, Universität Hohenheim, Hohenheim, Germany, 2016. [Google Scholar]
  25. Torsvik, V.; Øvreås, L. Microbial diversity and function in soil: From genes to ecosystems. Curr. Opin. Microbiol. 2002, 5, 240–245. [Google Scholar] [CrossRef]
  26. Büks, F.; Rebensburg, P.; Lentzsch, P.; Kaupenjohann, M. Relation of aggregate stability and microbial diversity in an incubated sandy soil. SOIL Discuss. 2016. [Google Scholar] [CrossRef]
  27. Totsche, K.U.; Amelung, W.; Gerzabek, M.H.; Guggenberger, G.; Klumpp, E.; Knief, C.; Lehndorff, E.; Mikutta, R.; Peth, S.; Prechtel, A.; et al. Microaggregates in soils. J. Plant Nutr. Soil Sci. 2017, 181, 104–136. [Google Scholar] [CrossRef] [Green Version]
  28. Kandeler, E.; Tscherko, D.; Bruce, K.D.; Stemmer, M.; Hobbs, P.J.; Bardgett, R.D.; Amelung, W. Structure and function of the soil microbial community in microhabitats of a heavy metal polluted soil. Biol. Fertil. Soils 2000, 32, 390–400. [Google Scholar] [CrossRef]
  29. Kravchenko, A.N.; Negassa, W.; Guber, A.K.; Hildebrandt, B.; Marsh, T.; Rivers, M.L. Intra-aggregate Pore Structure Influences Phylogenetic Composition of Bacterial Community in Macroaggregates. Soil Sci. Soc. Am. J. 2014, 78, 1924–1939. [Google Scholar] [CrossRef]
  30. Lǚ, L.-H.; Zou, Y.-N.; Wu, Q.-S. Mycorrhizas Mitigate Soil Replant Disease of Peach Through Regulating Root Exudates, Soil Microbial Population, and Soil Aggregate Stability. Commun. Soil Sci. Plant Anal. 2019, 50, 909–921. [Google Scholar] [CrossRef]
  31. Büks, F.; Kaupenjohann, M. Enzymatic biofilm detachment causes a loss of aggregate stability in a sandy soil. SOIL Discuss. 2016. [Google Scholar] [CrossRef]
  32. Chotte, J.L. Importance of microorganisms for soil aggregation. In Microorganisms in Soils: Roles in Genesis and Functions; Varma, A., Buscot, F., Eds.; Springer: Berlin/Heidelberg, Germany, 2005; Volume 3, pp. 107–119. [Google Scholar]
  33. Lynch, J.M.; Bragg, E. Microorganisms and Soil Aggregate Stability. In Advances in Soil Science; Stewart, B.A., Ed.; Springer: New York, NY, USA, 1985; pp. 133–171. [Google Scholar]
  34. Helliwell, J.; Miller, A.; Whalley, W.; Mooney, S.; Sturrock, C. Quantifying the impact of microbes on soil structural development and behaviour in wet soils. Soil Biol. Biochem. 2014, 74, 138–147. [Google Scholar] [CrossRef]
  35. Six, J.; Bossuyt, H.; DeGryze, S.; Denef, K. A history of research on the link between (micro)aggregates, soil biota, and soil organic matter dynamics. Soil Tillage Res. 2004, 79, 7–31. [Google Scholar] [CrossRef]
  36. Tisdall, J.M.; Oades, J.M. Organic matter and water-stable aggregates in soils. Eur. J. Soil Sci. 1982, 33, 141–163. [Google Scholar] [CrossRef]
  37. Aspiras, R.; Allen, O.; Harris, R.; Chesters, G. The role of microorganisms in the stabilization of soil aggregates. Soil Biol. Biochem. 1971, 3, 347–353. [Google Scholar] [CrossRef]
  38. Abiven, S.; Menasseri, S.; Chenu, C. The effects of organic inputs over time on soil aggregate stability—A literature analysis. Soil Biol. Biochem. 2009, 41, 1–12. [Google Scholar] [CrossRef]
  39. Bach, E.M.; Hofmockel, K.S. A time for every season: Soil aggregate turnover stimulates decomposition and reduces carbon loss in grasslands managed for bioenergy. GCB Bioenergy 2016, 8, 588–599. [Google Scholar] [CrossRef] [Green Version]
  40. Rumberger, A.; Merwin, I.A.; Thies, J.E. Microbial community development in the rhizosphere of apple trees at a replant disease site. Soil Biol. Biochem. 2007, 39, 1645–1654. [Google Scholar] [CrossRef]
  41. Shishido, M.; Sakamoto, K.; Yokoyama, H.; Momma, N.; Miyashita, S.-I. Changes in microbial communities in an apple orchard and its adjacent bush soil in response to season, land-use, and violet root rot infestation. Soil Biol. Biochem. 2008, 40, 1460–1473. [Google Scholar] [CrossRef]
  42. LBGR (Landesamt für Bergbau, Geologie und Rohstoffe Brandenburg). Bodengeologie Brandenburg—Grundkarten, Boden—Grundkarten. Available online: http://www.geo.brandenburg.de/boden/ (accessed on 1 July 2020).
  43. WetterKontor GmbH. Monats und Jahreswerte. Available online: https://www.wetterkontor.de/de/wetter/deutschland/monatswerte-station.asp (accessed on 1 July 2020).
  44. Roberson, E.B.; Firestone, M.K. Relationship between Desiccation and Exopolysaccharide Production in a Soil Pseudomonas sp. Appl. Environ. Microbiol. 1992, 58, 1284–1291. [Google Scholar] [CrossRef] [Green Version]
  45. Zornoza, R.; Guerrero, C.; Mataix-Solera, J.; Arcenegui, V.; García-Orenes, F.; Mataix-Beneyto, J. Assessing the effects of air-drying and rewetting pre-treatment on soil microbial biomass, basal respiration, metabolic quotient and soluble carbon under Mediterranean conditions. Eur. J. Soil Biol. 2007, 43, 120–129. [Google Scholar] [CrossRef]
  46. Blaud, A.; Menon, M.; Van der Zaan, B.; Lair, G.J.; Banwart, S.A. Effects of dry and wet sieving of soil on identification and interpretation of microbial community composition. In Advances in Agronomy; Banwart, A.S., Sparks, D.L., Eds.; Academic Press: Cambridge, MA, USA, 2017; Volume 142, pp. 119–142. [Google Scholar] [CrossRef]
  47. Wentworth, C.K. A Scale of Grade and Class Terms for Clastic Sediments. J. Geol. 1922, 30, 377–392. [Google Scholar] [CrossRef]
  48. Díaz-Zorita, M.; Villegas, E.I.G.; Grove, A.J.; Perfect, E. Aggregation, fragmentation, and structural stability measurement. In Encyclopedia of Soil Science; Lal, R., Ed.; Marcel Dekker, Inc.: New York, NY, USA, 2002; pp. 37–40. [Google Scholar]
  49. Van Bavel, C.H.M. Mean Weight-Diameter of Soil Aggregates as a Statistical Index of Aggregation. Soil Sci. Soc. Am. J. 1949, 14, 20–23. [Google Scholar] [CrossRef] [Green Version]
  50. North, P.F. Towards an absolute measurement of soil structural stability using ultrasound. Eur. J. Soil Sci. 1976, 27, 451–459. [Google Scholar] [CrossRef]
  51. Schmidt, M.W.I.; Rumpel, C.; Kögel-Knabner, I. Evaluation of an ultrasonic dispersion procedure to isolate primary organomineral complexes from soils. Eur. J. Soil Sci. 1999, 50, 87–94. [Google Scholar] [CrossRef]
  52. Graf-Rosenfellner, M.; Kayser, G.; Guggenberger, G.; Kaiser, K.; Büks, F.; Kaiser, M.; Mueller, C.W.; Schrumpf, M.; Rennert, T.; Welp, G.; et al. Replicability of aggregate disruption by sonication-an inter-laboratory test using three different soils from Germany. J. Plant Nutr. Soil Sci. 2018, 181, 894–904. [Google Scholar] [CrossRef]
  53. Kemper, W.D.; Rosenau, R.C. Aggregate stability and size distribution. In Methods of Soil Analysis: Part 1 Physical and Mineralogical Methods; American Society of Agronomy: Madison, Wisconsin, 1986; Volume 5, pp. 425–442. [Google Scholar]
  54. Gardes, M.; Bruns, T.D. ITS primers with enhanced specificity for basidiomycetes-application to the identification of mycorrhizae and rusts. Mol. Ecol. 1993, 2, 113–118. [Google Scholar] [CrossRef]
  55. White, T.J.; Bruns, T.D.; Lee, S.B.; Taylor, J.W. Amplification and direct sequencing of fungal ribosomal RNA genes for phylogenetics. In PCR Protocols—A Guide to Methods and Applications; Innis, M.A., Gelfand, D.H., Sninsky, J.J., White, T.J., Eds.; Academic Press: San Diego, CA, USA, 1990; pp. 315–322. [Google Scholar]
  56. Grube, S.; Schönling, J.; Prange, A. Evaluation of a triplex real-time PCR system to detect the plant-pathogenic molds Alternaria spp., Fusarium spp. and C. purpurea. J. Microbiol. Methods 2015, 119, 180–188. [Google Scholar] [CrossRef] [PubMed]
  57. Lawrence, D.P.; Gannibal, P.B.; Peever, T.; Pryor, B.M. The sections of Alternaria: Formalizing species-group concepts. Mycologia 2013, 105, 530–546. [Google Scholar] [CrossRef] [Green Version]
  58. Woudenberg, J.; Seidl, M.F.; Groenewald, J.; De Vries, M.; Stielow, J.; Thomma, B.P.H.J.; Crous, P. Alternaria section Alternaria: Species, formae speciales or pathotypes? Stud. Mycol. 2015, 82, 1–21. [Google Scholar] [CrossRef] [Green Version]
  59. Müller, T.; Ruppel, S.; Behrendt, U.; Lentzsch, P.; Müller, M.E.H. Antagonistic Potential of Fluorescent Pseudomonads Colonizing Wheat Heads Against Mycotoxin Producing Alternaria and Fusaria. Front. Microbiol. 2018, 9, 2124. [Google Scholar] [CrossRef]
  60. Korn, U.; Müller, T.; Ulrich, A.; Müller, M.E.H. Impact of aggressiveness of Fusarium graminearum and F. culmorum isolates on yield parameters and mycotoxin production in wheat. Mycotoxin Res. 2011, 27, 195–206. [Google Scholar] [CrossRef]
  61. Hoestra, H. Replant Diseases of Apple in the Netherlands. Ph.D. Thesis, Agricultural University, Wageningen, The Netherlands, 1968. [Google Scholar]
  62. Zhang, Z.Z.; Srivastava, A.K.; Wu, Q.S.; Li, G.H. Growth performance and rhizospheric traits of peach (Prunus persica) in response to mycorrhization on replant versus non-replant soil. Indian J. Agric. Sci. 2015, 85, 125–130. [Google Scholar]
  63. Szczygiel, A.; Zepp, A. An occurrence and importance of apple replant disease in Polish orchards. In: IV International Symposium on Replant Problems. Acta Hortic. 1996, 477, 99–102. [Google Scholar] [CrossRef]
  64. Lehmann, A.; Zheng, W.; Rillig, M.C. Soil biota contributions to soil aggregation. Nat. Ecol. Evol. 2017, 1, 1828–1835. [Google Scholar] [CrossRef]
  65. Lehmann, A.; Zheng, W.; Ryo, M.; Soutschek, K.; Roy, J.; Rongstock, R.; Maaß, S.; Rillig, M.C. Fungal Traits Important for Soil Aggregation. Front. Microbiol. 2020, 10, 2904. [Google Scholar] [CrossRef] [PubMed]
  66. Jastrow, J. Soil aggregate formation and the accrual of particulate and mineral-associated organic matter. Soil Biol. Biochem. 1996, 28, 665–676. [Google Scholar] [CrossRef]
  67. van Marle, G.S. Bodemmoeheid in de fruitteelt; resultaten van een enquete in het rivier kleigebied. Tijdschr. PIZiekt. 1961, 67, 57–68. [Google Scholar]
  68. Eissenstat, D.; Bauerle, T.; Comas, L.; Lakso, A.; Neilsen, D.; Neilsen, G.; Smart, D. Seasonal patterns of root growth in relation to shoot phenology in grape and apple. Proc. Vth International Symposium on Mineral Nutrition of Fruit Plants. Acta Hortic. 2005, 721, 21–26. [Google Scholar] [CrossRef]
  69. Psarras, G.; Merwin, I.A.; Lakso, A.N.; Ray, J.A. Root Growth Phenology, Root Longevity, and Rhizosphere Respiration of Field Grown ‘Mutsu’ Apple Trees on ‘Malling 9’ Rootstock. J. Am. Soc. Hortic. Sci. 2000, 125, 596–602. [Google Scholar] [CrossRef] [Green Version]
  70. Kaspar, F.; Zimmermann, K.; Polte-Rudolf, C. An overview of the phenological observation network and the phenological database of Germany’s national meteorological service (Deutscher Wetterdienst). Adv. Sci. Res. 2014, 11, 93–99. [Google Scholar] [CrossRef] [Green Version]
Figure 1. Concentration of Alternaria-group (Ag) (genome/g soil) and total fungal DNA (log (ITS)) in no-replant soil (nr) and replant soil (r). Significances calculated between nr and r soil. α = 0.05, ** p ≤ 0.01.
Soilsystems 04 00070 g001
Figure 2. Relative differences (%) of proportion of Ag out of total fungal DNA (Ag/ITS) and total fungal DNA (ITS) between no-replant soil and replant soil.
Soilsystems 04 00070 g002
Figure 3. Mean weight diameter (MWD) of no-replant soil (nr) and replant soil (r). Significances calculated between nr and r soil. α = 0.05, *** p ≤ 0.001, 1 p ≤ 0.10.
Soilsystems 04 00070 g003
Table 1. Mean mass values (g) of sieve-size fractions from ≤ 125 µm to 6300 µm in no-replant soil (nr) and replant soil (r).
Sieve-Fraction (µm)SoilMarchAprilJuneAugustOctober
MWSDMWSDMWSDMWSDMWSD
2000–6300nr45.151.2822.343.4218.865.8633.284.1938.586.53
r35.937.1422.394.8222.925.9621.24 ***3.5231.896.78
1000–2000nr11.464.8813.641.4510.962.0413.861.028.343.14
r8.571.0514.842.7314.542.5313.311.1312.70 *2.88
500–1000nr6.562.7615.441.7012.090.859.472.056.812.08
r7.130.5915.811.0813.842.7214.57 ***1.6411.06 *2.99
250–500nr7.987.2415.850.4614.970.8810.571.936.810.71
r11.381.5114.852.3413.613.4815.16 ***1.3410.902.18
125–250nr13.717.7118.162.3423.244.4216.241.2518.210.67
r17.883.3517.543.2318.973.2020.89 **2.0217.681.24
≤125nr15.147.8314.561.9819.883.8316.592.7818.832.90
r19.113.2614.582.5416.121.8514.831.2015.77 *1.73
Significances calculated between nr and r soil. α = 0.05, *** p ≤ 0.001, ** p ≤ 0.01, * p ≤ 0.05.
Table 2. Mean concentration (mg) and proportion (%) of aggregate-stability classes in sieve-size fractions from 125 to 1000 µm in no-replant soil (nr) and replant soil (r) in August.
Aggregate-Stability ClassSoil125–250 µm250–500 µm500–1000 µm
MWSD%MWSD%MWSD%
WLnr42171280841271120024
r5814227960969314023
WS ≤ 50 J mL−1nr4051001489213931120322440
r679 ***81231235 ***7541136912246
WS ≤ 100 J mL−1nr5825218382671232
r7925313257465162
WS > 100 J mL−1nr24949583164524851101514634
r2184 ***90731355 *8245873 *3029
Water labile aggregates (WL), water-stable aggregates with binding forces ≤ 50 J mL−1 (WS ≤ 50 J mL−1), water-stable aggregates with binding forces ≤ 100 J mL−1 (WS ≤ 100 J mL−1) and water-stable aggregates with binding forces > 100 J mL−1 (WS > 100 J mL−1) in sieve-size fractions: (a) 125–250 µm, (b) 250–500 µm, (c) 500–1000 µm. Significances calculated between nr and r soil. α = 0.05, *** p ≤ 0.001, * p ≤ 0.05.
Table 3. Correlation coefficients and regression coefficients (R2) between soil fungal parameters and MWD and mass distributions of sieve-size fractions.
Soil Structure ParameterFungal ParameterMarchAprilJuneAugustOctober
MWDAg/ITS−0.442−0.527−0.147−0.790 **(R2 = 0.674)0.238
Ag−0.624−0.482−0.154−0.895 ***(R2 = 0.825)0.102
ITS−0.055−0.0820.154−0.671 *(R2 = 0.570)−0.140
2000–6300 µmAg/ITS−0.527−0.564−0.049−0.846 0.294
Ag−0.685 * (R2 = 0.215)−0.500−0.140−0.951 **(R2 = 0.827)0.137
ITS−0.079−0.1000.084−0.629 *(R2 = 0.562)−0.133
1000–2000 µmAg/ITS−0.336−0.136−0.294−0.280 −0.483
Ag−0.445−0.227−0.217−0.399 −0.238
ITS0.045−0.3270.154−0.399 0.119
500–1000 µmAg/ITS−0.527−0.564−0.049−0.846 **(R2 = 0.554)0.294
Ag0.309−0.2450.0210.650 *(R2 = 0.675)−0.294
ITS0.027−0.4640.2590.545 0.056
250–500 µmAg/ITS0.4820.182−0.1330.664 *(R2 = 0.598)−0.385
Ag0.700 * (R2 = 0.021)0.1910.0210.797 **(R2 = 0.809)−0.371
ITS0.2640.055−0.0070.762 **(R2 = 0.688)−0.189
125–250 µmAg/ITS0.4180.3910.4130.804 **(R2 = 0.635)0.154
Ag0.5640.3730.3080.867 **(R2 = 0.745)0.186
ITS−0.0360.227−0.2030.605 *(R2 = 0.466)0.168
≤125 µmAg/ITS0.4270.4090.476−0.063 0.552
Ag0.664 * (R2 = 0.007)0.4270.301−0.126 0.406
ITS0.1820.227−0.196−0.399 0.315
Significances calculated for α = 0.05, *** p ≤ 0.001, ** p ≤ 0.01, * p ≤ 0.05.
Table 4. Spearman’s rank correlation coefficient (ρs) among cross-sectional areas (CSA), soil fungal parameters, MWD and mass distributions of sieve-size fractions.
Soil 1MarchAprilJuneAugustOctober
Ag/ITSnr + r−0.109−0.3920.332−0.818 ** (R2 = 0.77)0.574
r−0.059−0.2280.197−0.6790.418
Agnr + r−0.273−0.4690.056−0.782 ** (R2 = 0.70)0.420
r−0.301−0.2870.192−0.4290.117
ITSnr + r0.118−0.255−0.242−0.370−0.018
r−0.059−0.4310.0840.679−0.059
MWDnr + r0.483−0.0270.0210.5950.266
r0.151−0.1560.3600.084−0.033
2000–6300 µmnr + r0.4520.0000.1090.687 *(R2 = 0.51)0.308
r0.101−0.0240.4600.268−0.117
1000–2000 µmnr + r0.487−0.328−0.1860.039−0.447
r0.426−0.3590.209−0.2180.004
500–1000 µmnr + r0.494−0.169−0.613−0.716 ** (R2 = 0.55)−0.550
r0.445−0.539−0.747−0.387−0.226
250–500 µmnr + r−0.1580.200−0.137−0.712 ** (R2 = 0.62)−0.343
r−0.244−0.156−0.510−0.328−0.076
125–250 µmnr + r−0.0950.1730.161−0.4870.028
r−0.1770.252−0.1340.109−0.259
≤125 µmnr + r−0.1260.1830.4830.1060.441
r−0.2260.3830.3510.0290.276
1 No-replant soil (nr) and replant soil (r), significances calculated for α = 0.05, ** p ≤ 0.01, * p ≤ 0.05.
Publisher’s Note: MDPI stays neutral with regard to jurisdictional claims in published maps and institutional affiliations.

