1. Introduction
Soil physical quality (SPQ) determination is a topic of great interest in agro-environmental studies. For instance, some reference works, due to Dexter [
1] or Reynolds et al. [
2], have collected about 643 and 201 citations (in average, about 40 and 18 by year, respectively), with reference to the Scopus platform (reference valid until the end of September 2020). Furthermore, the field-weighted citation impact indicator of Scopus, which shows how well a given document is cited when compared to similar documents, suggests that aforementioned papers were cited, respectively, 7.2 and 2.1 times more than expected when compared to similar documents.
Soil water retention curve estimation, which is the relationship between the volumetric water content of the soil, θ, and the soil pressure head,
h, allows estimating different SPQ indicators used in practical applications, or to compare the agro-environmental sustainability of specific agronomic practices, i.e., conventional tillage or no-tillage of the soil, removal or incorporation of crop residues, protection of bare soil using cover crops, etc. [
3,
4,
5,
6,
7]. As a consequence, some soil indicators that give an account for the optimal proportion between water and air into the soil (i.e., macroporosity, MAC
por, air capacity, AC, relative field capacity, RFC, plant available water capacity, PAWC, Dexter’s S-index) are increasingly applied [
7,
8]. Moreover, other main indicators, such as soil bulk density (BD), soil total organic carbon content, or the structure stability index, are usually added for a more comprehensive SPQ assessment [
9,
10]. A relatively robust comparison, however, is possible because some investigations have coded optimal and/or reference values, to make possible a plausible estimation of the optimal proportions between water and air into the soil [
1,
2]. Among those suggested, some SPQ indicators seem to provide more robust information than others in defining the physical quality of the soil. For instance, in a recent study carried out in a long-term field experiment in southern Italy, Castellini et al. [
10] evaluated the seasonal variability of SPQ on the basis of BD, AC, MAC
por, RFC, and PAWC. The principal component analysis (PCA) and the stepwise discriminant analysis (SDA) allowed to highlight that: (i) RFC has better summarized the soil variability, as compared to the other indicators, and (ii) the RFC findings were clearer for the comparison between conventional tillage and no-tillage of the soil [
10].
The reliability of SPQ estimations, obviously, directly depends on the determination accuracy of the soil water retention curve [
11], and the sampled soil volume could affect such aspects. In this regard, some studies have investigated the effects of sampled soil volume, i.e., height and diameter, on soil water retention estimates [
11,
12], but a lack of knowledge still exists on the effect of the sampling volume on SPQ estimates. In other words, this topic is perceived as relevant, but few references exist to quantify this effect.
The elementary representative volume (REV) represents the smallest soil volume that can be used to obtain a representative measurement of the hydrological variable studied [
13]. Several investigations have considered, directly or indirectly, the effect of REV on θ(
h) estimation [
12,
14,
15,
16]. The size of the sampling volume and the measurements method applied may affect the variability of θ(
h) estimations. Novák and Kňava [
16] stated that since arable soils are usually composed mostly of the fine soil fraction, standard procedures that use relatively small soil cores (100 cm
3) can be applied to evaluate their hydraulic characteristics. On the other hand, Schelle et al. [
11], comparing the performance of four of the most widely used methods for the measurement of soil water retention, i.e., evaporation, suction plates (hanging-water column method or suction plate), pressure plate extractor, and dew point methods, observed that relatively small soil core (100 cm
3; H = 4 cm), used in suction plates, did not meet the REV requirements, determining higher variability of θ(
h) estimations. Conversely, relatively bigger soil cores may not be recommended because the times to reach the hydrostatic equilibrium increase with the size of the sample [
11]. Moreover, the REV concept can have important implications when the effects of agronomic practices on physical and hydraulic properties of the soil must be evaluated [
17]. However, despite the many aspects addressed in this research topic, little (practical) information concerning the sampling soil volume effect on water retention estimates is available. Therefore, investigations aimed at quantifying the aforementioned impact for soil samples with different texture, or with reference to conventional and conservative agricultural systems, can contribute towards knowledge on this topic, providing useful practical information for soil sampling and estimating the physical properties of soil.
The research topics presented so far are well linked to the growing attention of farmers in the Mediterranean area towards conservative cultivation systems on durum wheat. Specifically, no-tillage (NT) of soil instead of conventional tillage (CT) or minimum tillage is receiving increasing acceptance; many recent investigations have highlighted several pros and cons [
18,
19,
20]. However, although some recent investigations addressed the impact of soil management on SPQ estimation [
3,
6,
9], or on soil physical properties as a whole [
21], the effect of sampled soil volume on SPQ estimation was not evaluated so far. Therefore, selecting private or experimental farms, in which different soil management for durum wheat cultivation are considered, seems to be an adequate choice, to obtain: (i) heterogeneous data sets in terms of bulk density, porosity, and other main soil physical properties, and (ii) to contribute towards knowledge on the agro-environmental sustainability of different soil management systems.
The general objective of this study was to investigate the impact of sampled soil volume on soil physical properties (i.e., soil water retention values and capacitive soil indicators), considering two volume sizes usually used for soil sampling and analysis. With this in mind, two sites, which differed in farm characteristics (private or experimental farm), soil texture (clay and silty-clay soil), and soil management (conventional tillage and no-tillage, CT and NT, respectively) were selected to estimate soil physical quality indicators (soil bulk density, macroporosity, air capacity and relative field capacity). Literature references were also considered to assess the SPQ under alternative soil management (CT vs. NT) for durum wheat cultivation.
2. Materials and Methods
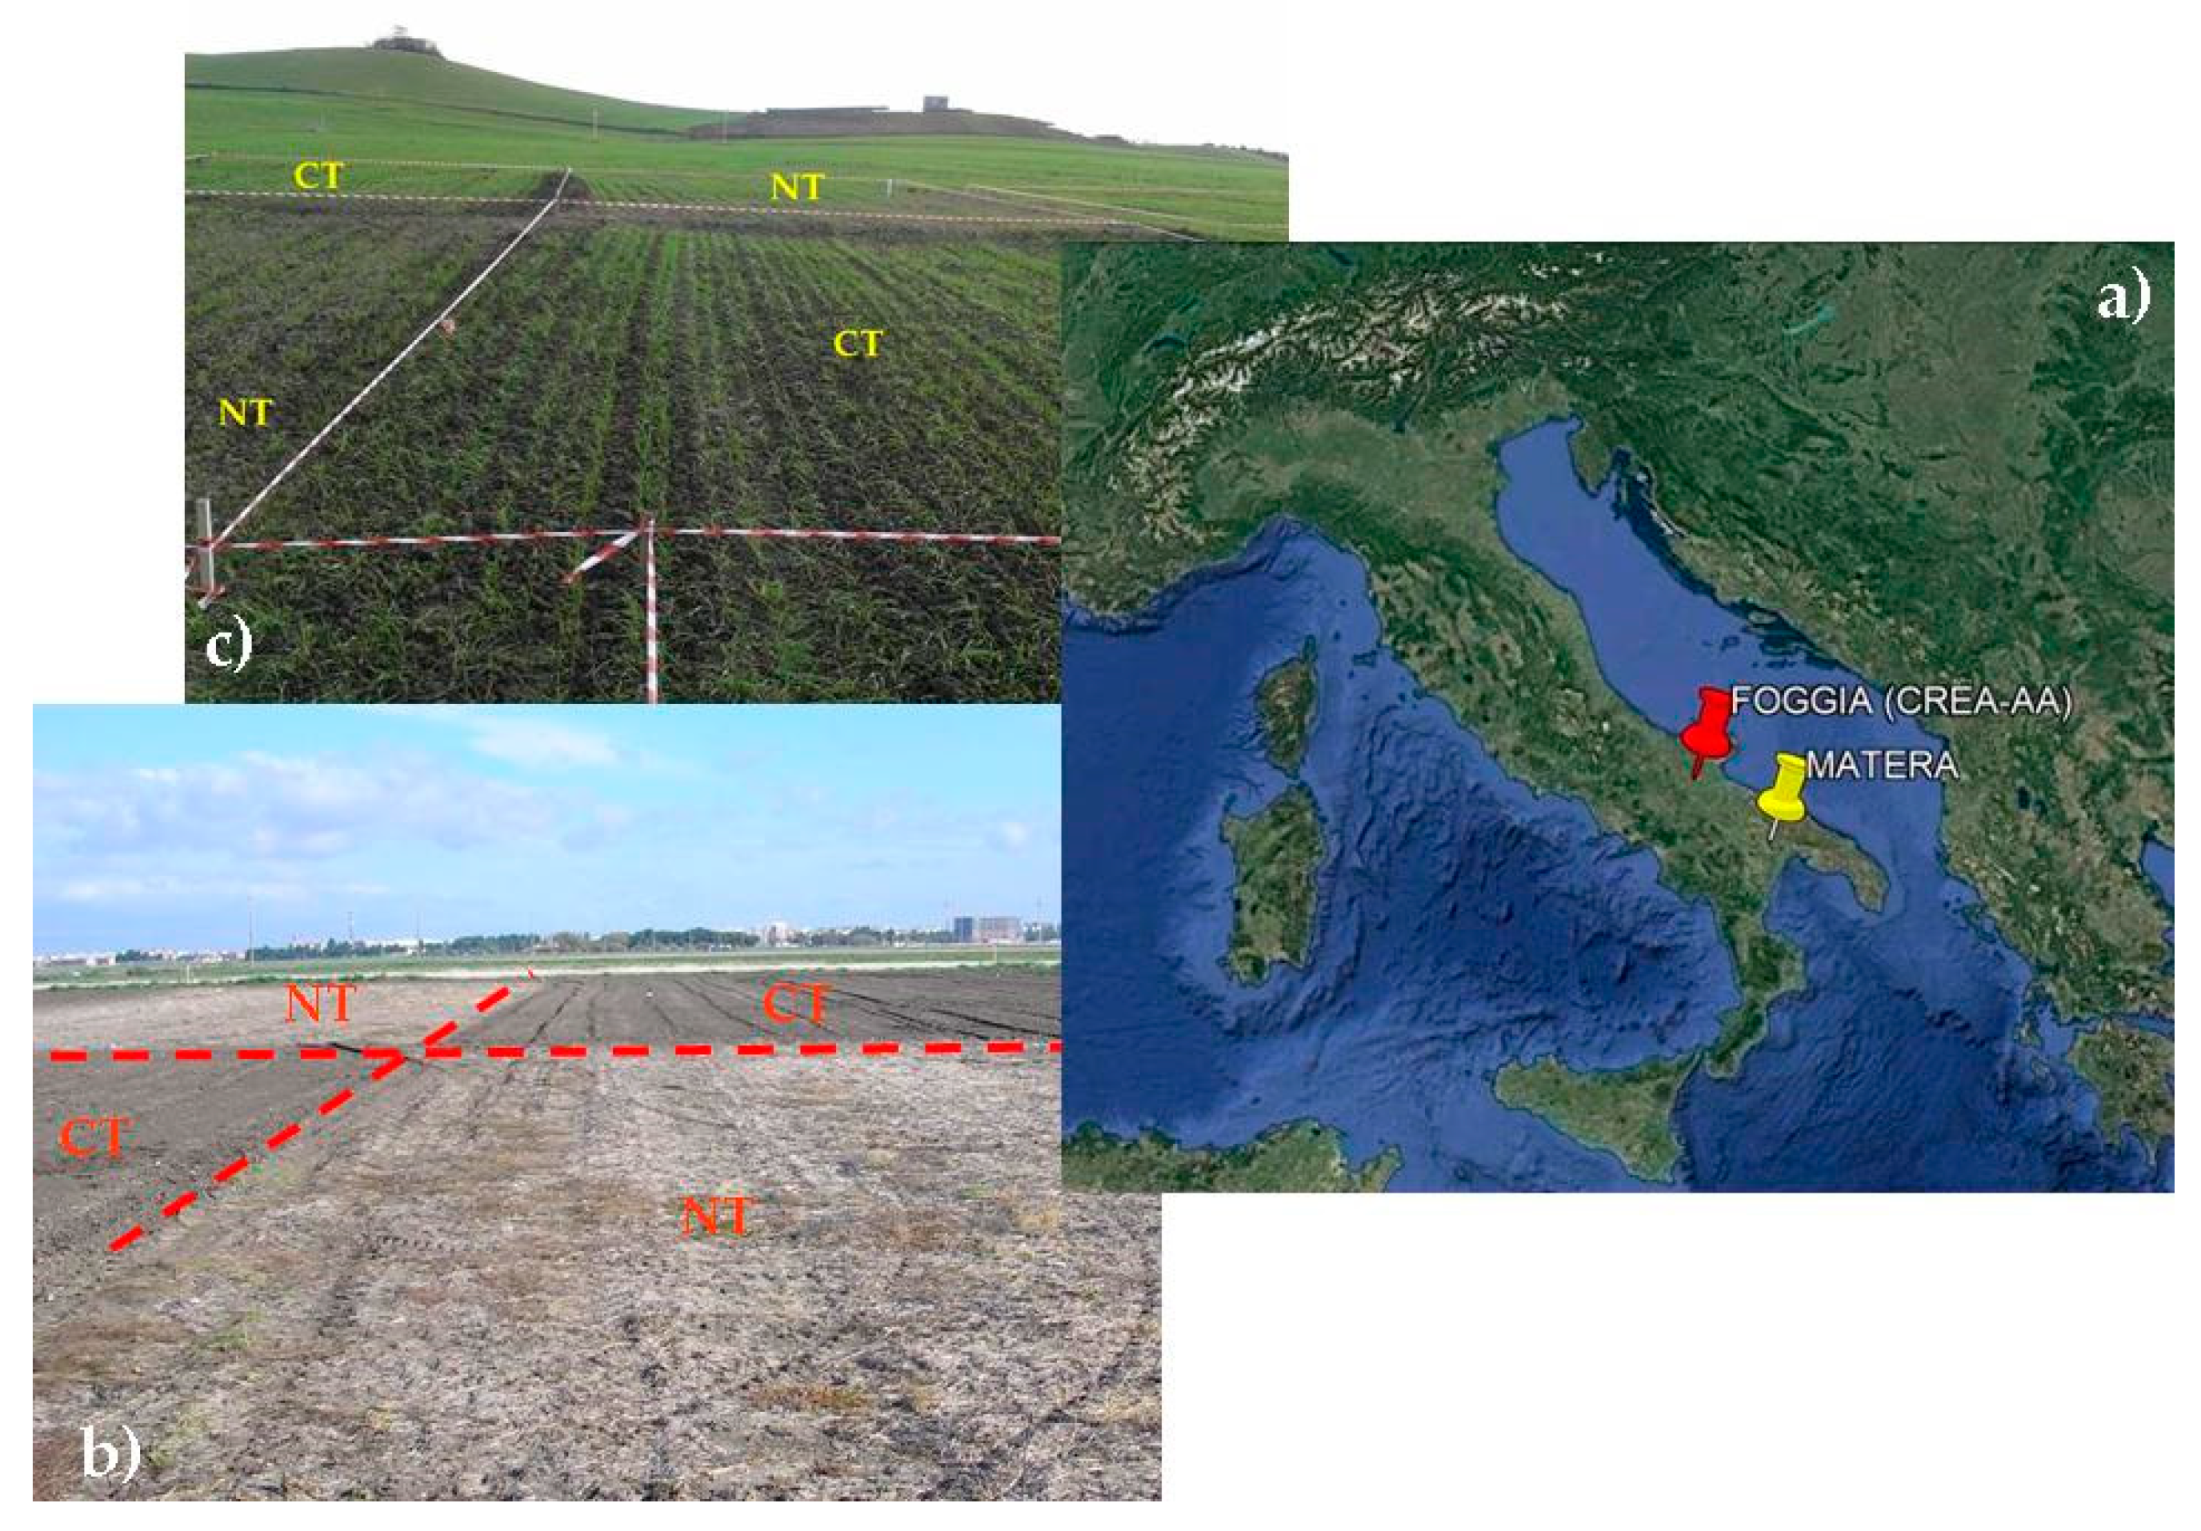
Two fine textured soils of southern Italy for winter wheat cultivation were sampled at Foggia, FO (clay), and Matera, MA (silty-clay) (
Figure 1). The former was a long-term field experiment started over a decade ago (2002) at the experimental farm of the Council for Agricultural Research and Economics (CREA-AA), while the latter was at a private farm. With the goal of obtaining a dataset heterogeneous in terms of soil physical properties, two alternative agronomic systems for the cultivation of durum wheat were selected and sampled: conventional tillage (CT) and no-tillage (NT) of the soil. Mean values of soil total organic carbon (TOC) content and structure stability index (SSI) by Pieri [
22] were equal to 2.0–1.5% and 4.6–3.0%, respectively, for FO–MA sites (
Table 1). Since SSI is a soil indicator that summarizes the overall effect of both organic (organic matter) and mineral (silt and clay) soil colloids, it can provide terms of comparison with similar fine textured soils. Additional information on the soil’s characteristics can be found in Castellini et al. [
10] and Ferrara et al. [
23] for FO and MA, respectively.
For each site and soil management, in the spring of 2015, 4 to 12 undisturbed soil cores were randomly sampled in the layer 0–10 cm, using stainless steel rings with volume approximately equal to 100 and 200 cm3 (precisely, 98 and 204 cm3; H = 5 cm, D = 5.0 or 7.2 cm, respectively). The steel rings with sharp edges were carefully inserted into the soil using a rubber hammer and a wooden board. Once extracted, soil cores were sealed with plastic film and stored in the refrigerator at a constant temperature, of about 5 °C, until processing in the laboratory.
Two different experimental installations, conceptually equivalent in their functioning, were used for measuring some points of the soil water retention curve. In particular, Buchner apparatus [
24], and ceramic suction table (pF laboratory station, ecoTech Umwelt-Meßsysteme, Germany) [
25] methods, were used to trigger a drainage process on an initially saturated soil sample, placed on a synthetic porous septum. Specifically, during the transient of drainage, some values of soil pressure head,
h, were imposed, until the hydrostatic equilibrium corresponded to the imposed
h value was reached. Experiments on Buchner apparatus were carried out using a sequence of seven
h values (i.e., −5, −10, −20, −40, −70, −100, and −130 cm), while those on the suction table were carried out by a sequence of five
h values (i.e., −10, −30, −60, −100, and −600 cm). Therefore, the volumetric water content, θ, corresponding to the final
h value (i.e., −130 and −600 cm), was obtained by the thermogravimetric method, and the other θ values were deduced adding the drained water between successive
h values (as usual in this procedure) [
10]. At the end of the desorption experiments, the undisturbed soil cores were used to determine BD, assuming a particle density of 2.65 g·cm
−3 [
26]. A standard procedure was also applied to obtain θ values at lower pressure heads (i.e.,
h = −1030, −3060, and −15300 cm) on repacked soil samples by the pressure plate method [
27]. Therefore, for each set of θ-
h values, the van Genuchten model [
28] was adopted to parameterize the water retention curve of the soil using the RETC code.
Overall, 36 and 31 water retention curves were considered in this evaluation, respectively, for the soil sampler with small (98 cm
3) and large (204 cm
3) diameters. Finally, the fitted curves were used to estimate the three reference points of the water retention curve (corresponding to saturated soil water content, θ
s and the water content equal to 10 cm, θ
10 and 100 cm, θ
100) to estimate the capacitive indicators (MAC
por, AC, and RFC), which were calculated as follows [
2]:
We chose the aforementioned indicators because they were selected and applied for highlighting any reduction, or improvement, in the macro and meso porosity of the soil (among others, [
2,
4,
29,
30]).
The SPQ assessment was carried out to quantify the impact of soil management on soil physical properties, based on the references of literature [
2,
10]. Specifically, for investigated agricultural soils, (i) an optimal range of soil bulk density was considered when 0.9 < BD < 1.2 g·cm
−3 (optimal mean value equal to 1.05 g·cm
−3); (ii) optimal macroporosity range when 0.05 ≤ MAC
por < 0.10 cm
3·cm
−3 (optimal mean value equal to 0.075 cm
3·cm
−3); (iii) optimal air capacity range when 0.14 ≤ AC < 0.26 cm
3·cm
−3 (optimal mean value equal to 0.20 cm
3·cm
−3); (iv) optimal relative field capacity range when 0.6 < RFC < 0.7 (optimal mean value equal to 0.65). The pore volume distribution function was also considered for the Foggia site, according to the methodology reported by Reynolds et al. [
2].
For each main variable considered in this investigation (θ
s, θ
10, θ
100, BD, MAC
por, AC, and RFC), a given data set was summarized by calculating the arithmetic mean and the associated coefficient of variation, and variables were assumed to be normally distributed, as commonly suggested in the literature (among others, [
29]). Two tailed t-test was used to check the statistical significance of the considered soil properties. A probability level of
P = 0.05 was assumed.
3. Results
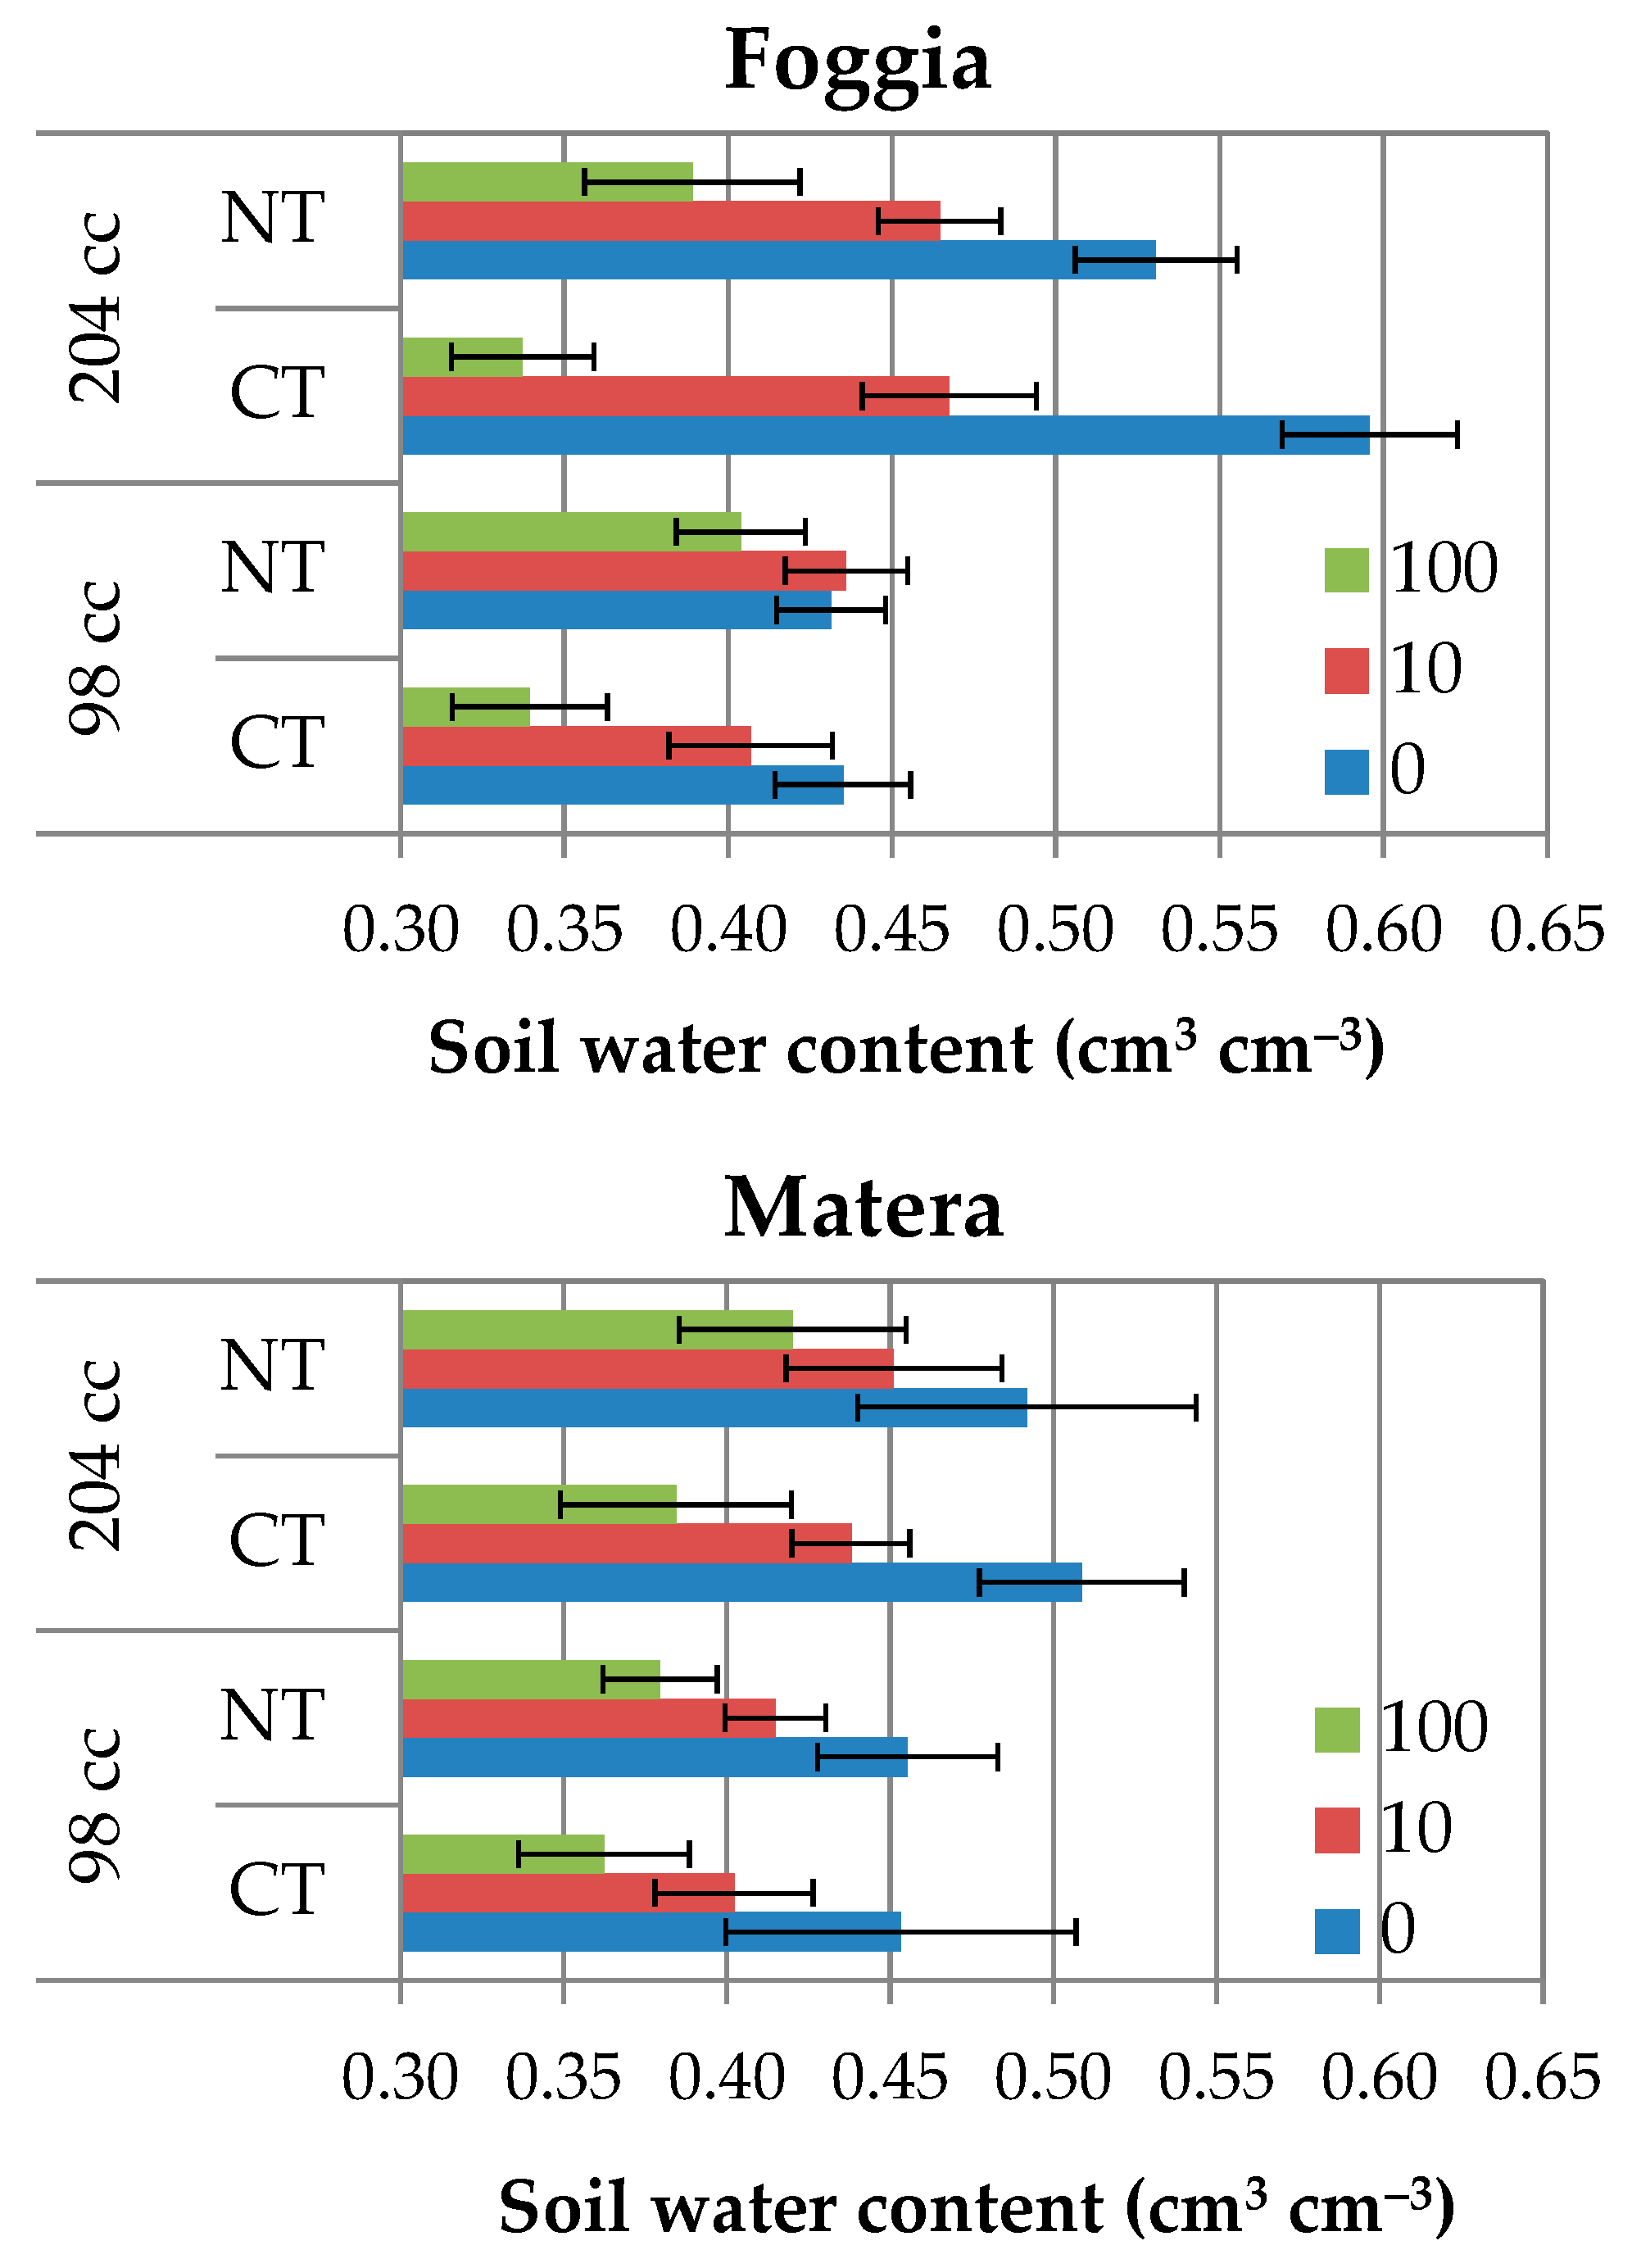
The effect of sampled soil volume on measured soil water content corresponding to selected soil pressure head values (i.e., 0, 10, and 100 cm) was depicted in
Figure 2. Specifically, the ratio between θ measurements obtained with compared soil volumes (i.e., 204 and 98 cm
3; θ
204cm3/θ
98cm3) changed in the range 0.99–1.37 or 0.96–1.23 under CT or NT at Foggia, and 1.06–1.12 or 1.08–1.11 under CT or NT at Matera. This suggests that higher θ values were obtained with bigger diameters as compared to smaller ones. However, the aforementioned differences decreased from saturation to the field capacity, with the exception of NT at Matera, where the opposite was detected.
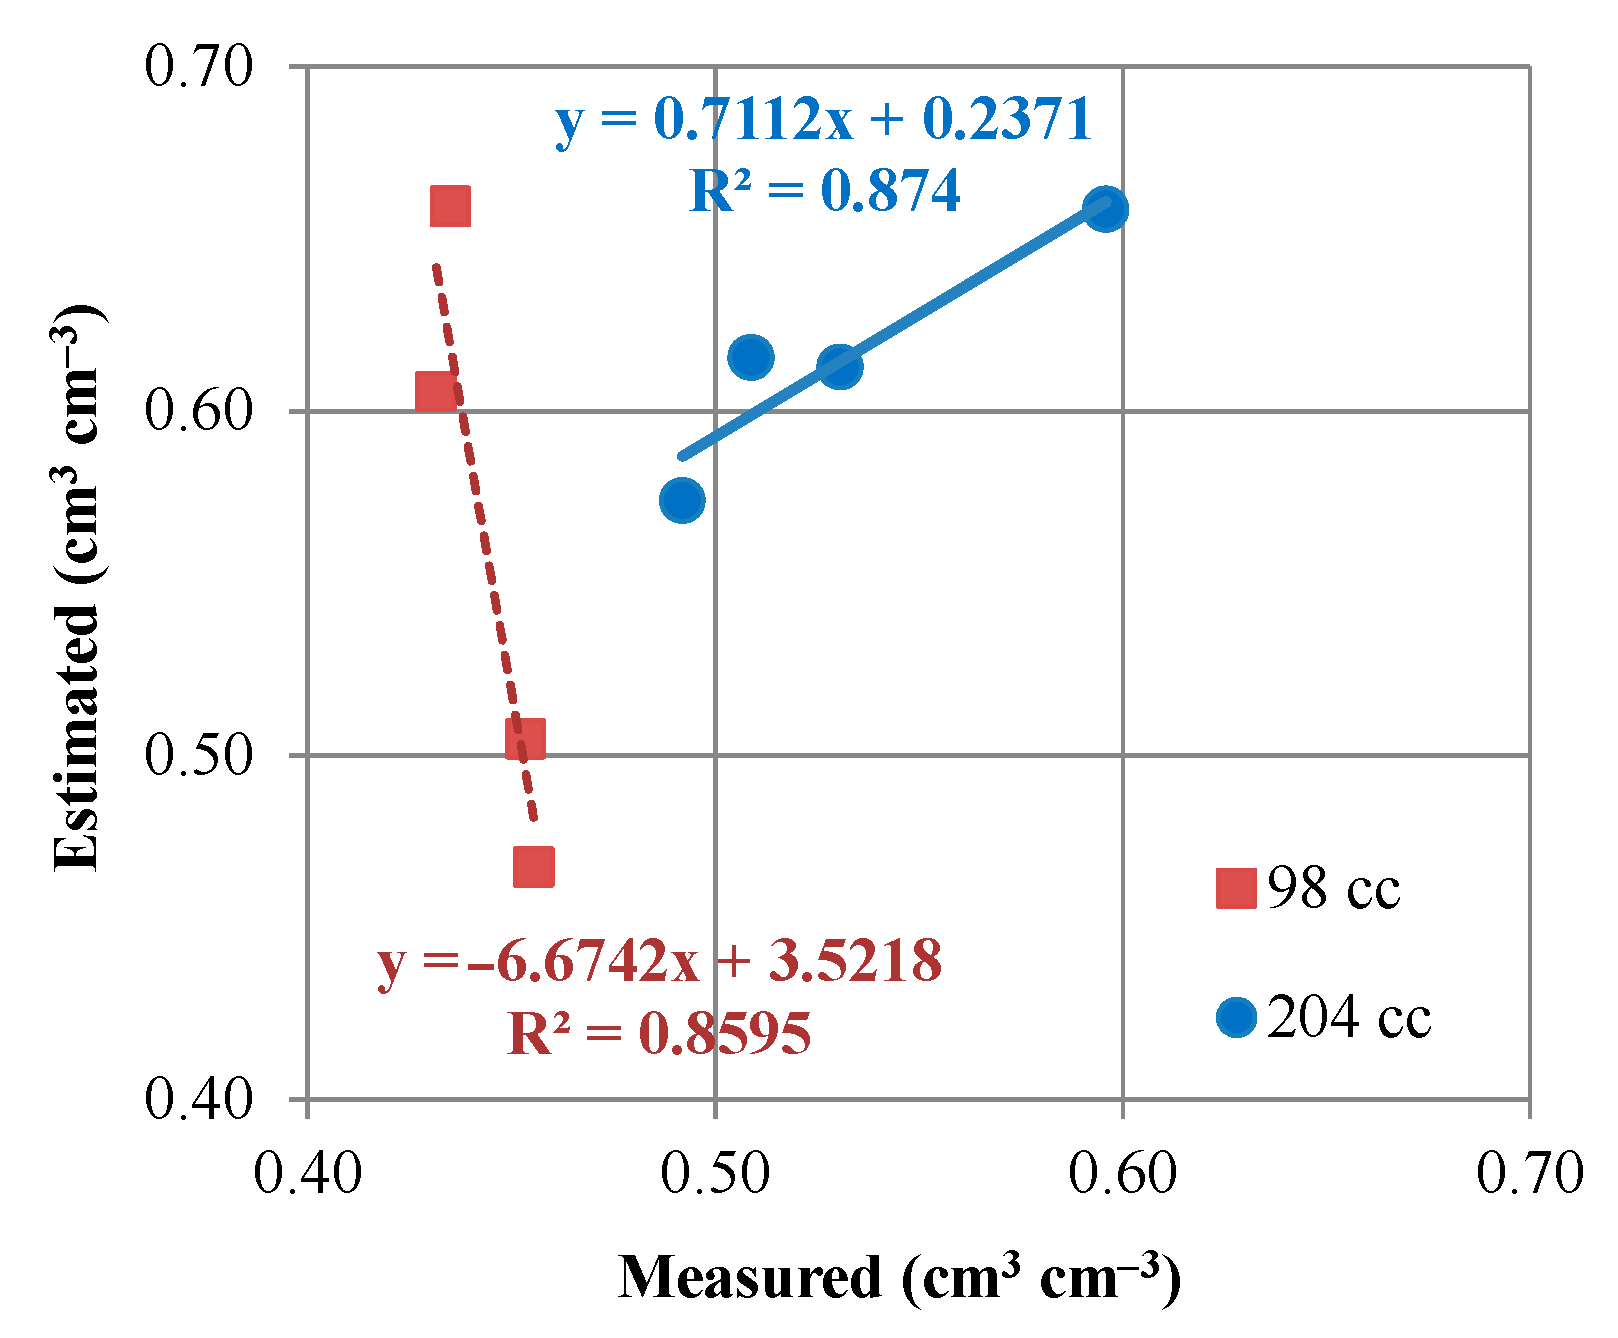
The comparison between the measured saturated soil water content and the corresponding estimations obtained from dry bulk density values also revealed that a different relationship could be shown, according to the sampled soil volume (
Figure 3). Moreover, a comparable θ
s range between measured and estimated values (i.e., 0.10 and 0.08 cm
3·cm
−3, respectively) was detected only for the soil volume of 204 cm
3, while relatively higher discrepancies (0.02 and 0.19 cm
3·cm
−3) were obtained when a smaller one was used (
Figure 3). As a consequence, the relatively small variation in the measured θ
s values (0.02 cm
3·cm
−3) could suggest a lower reliability of the data.
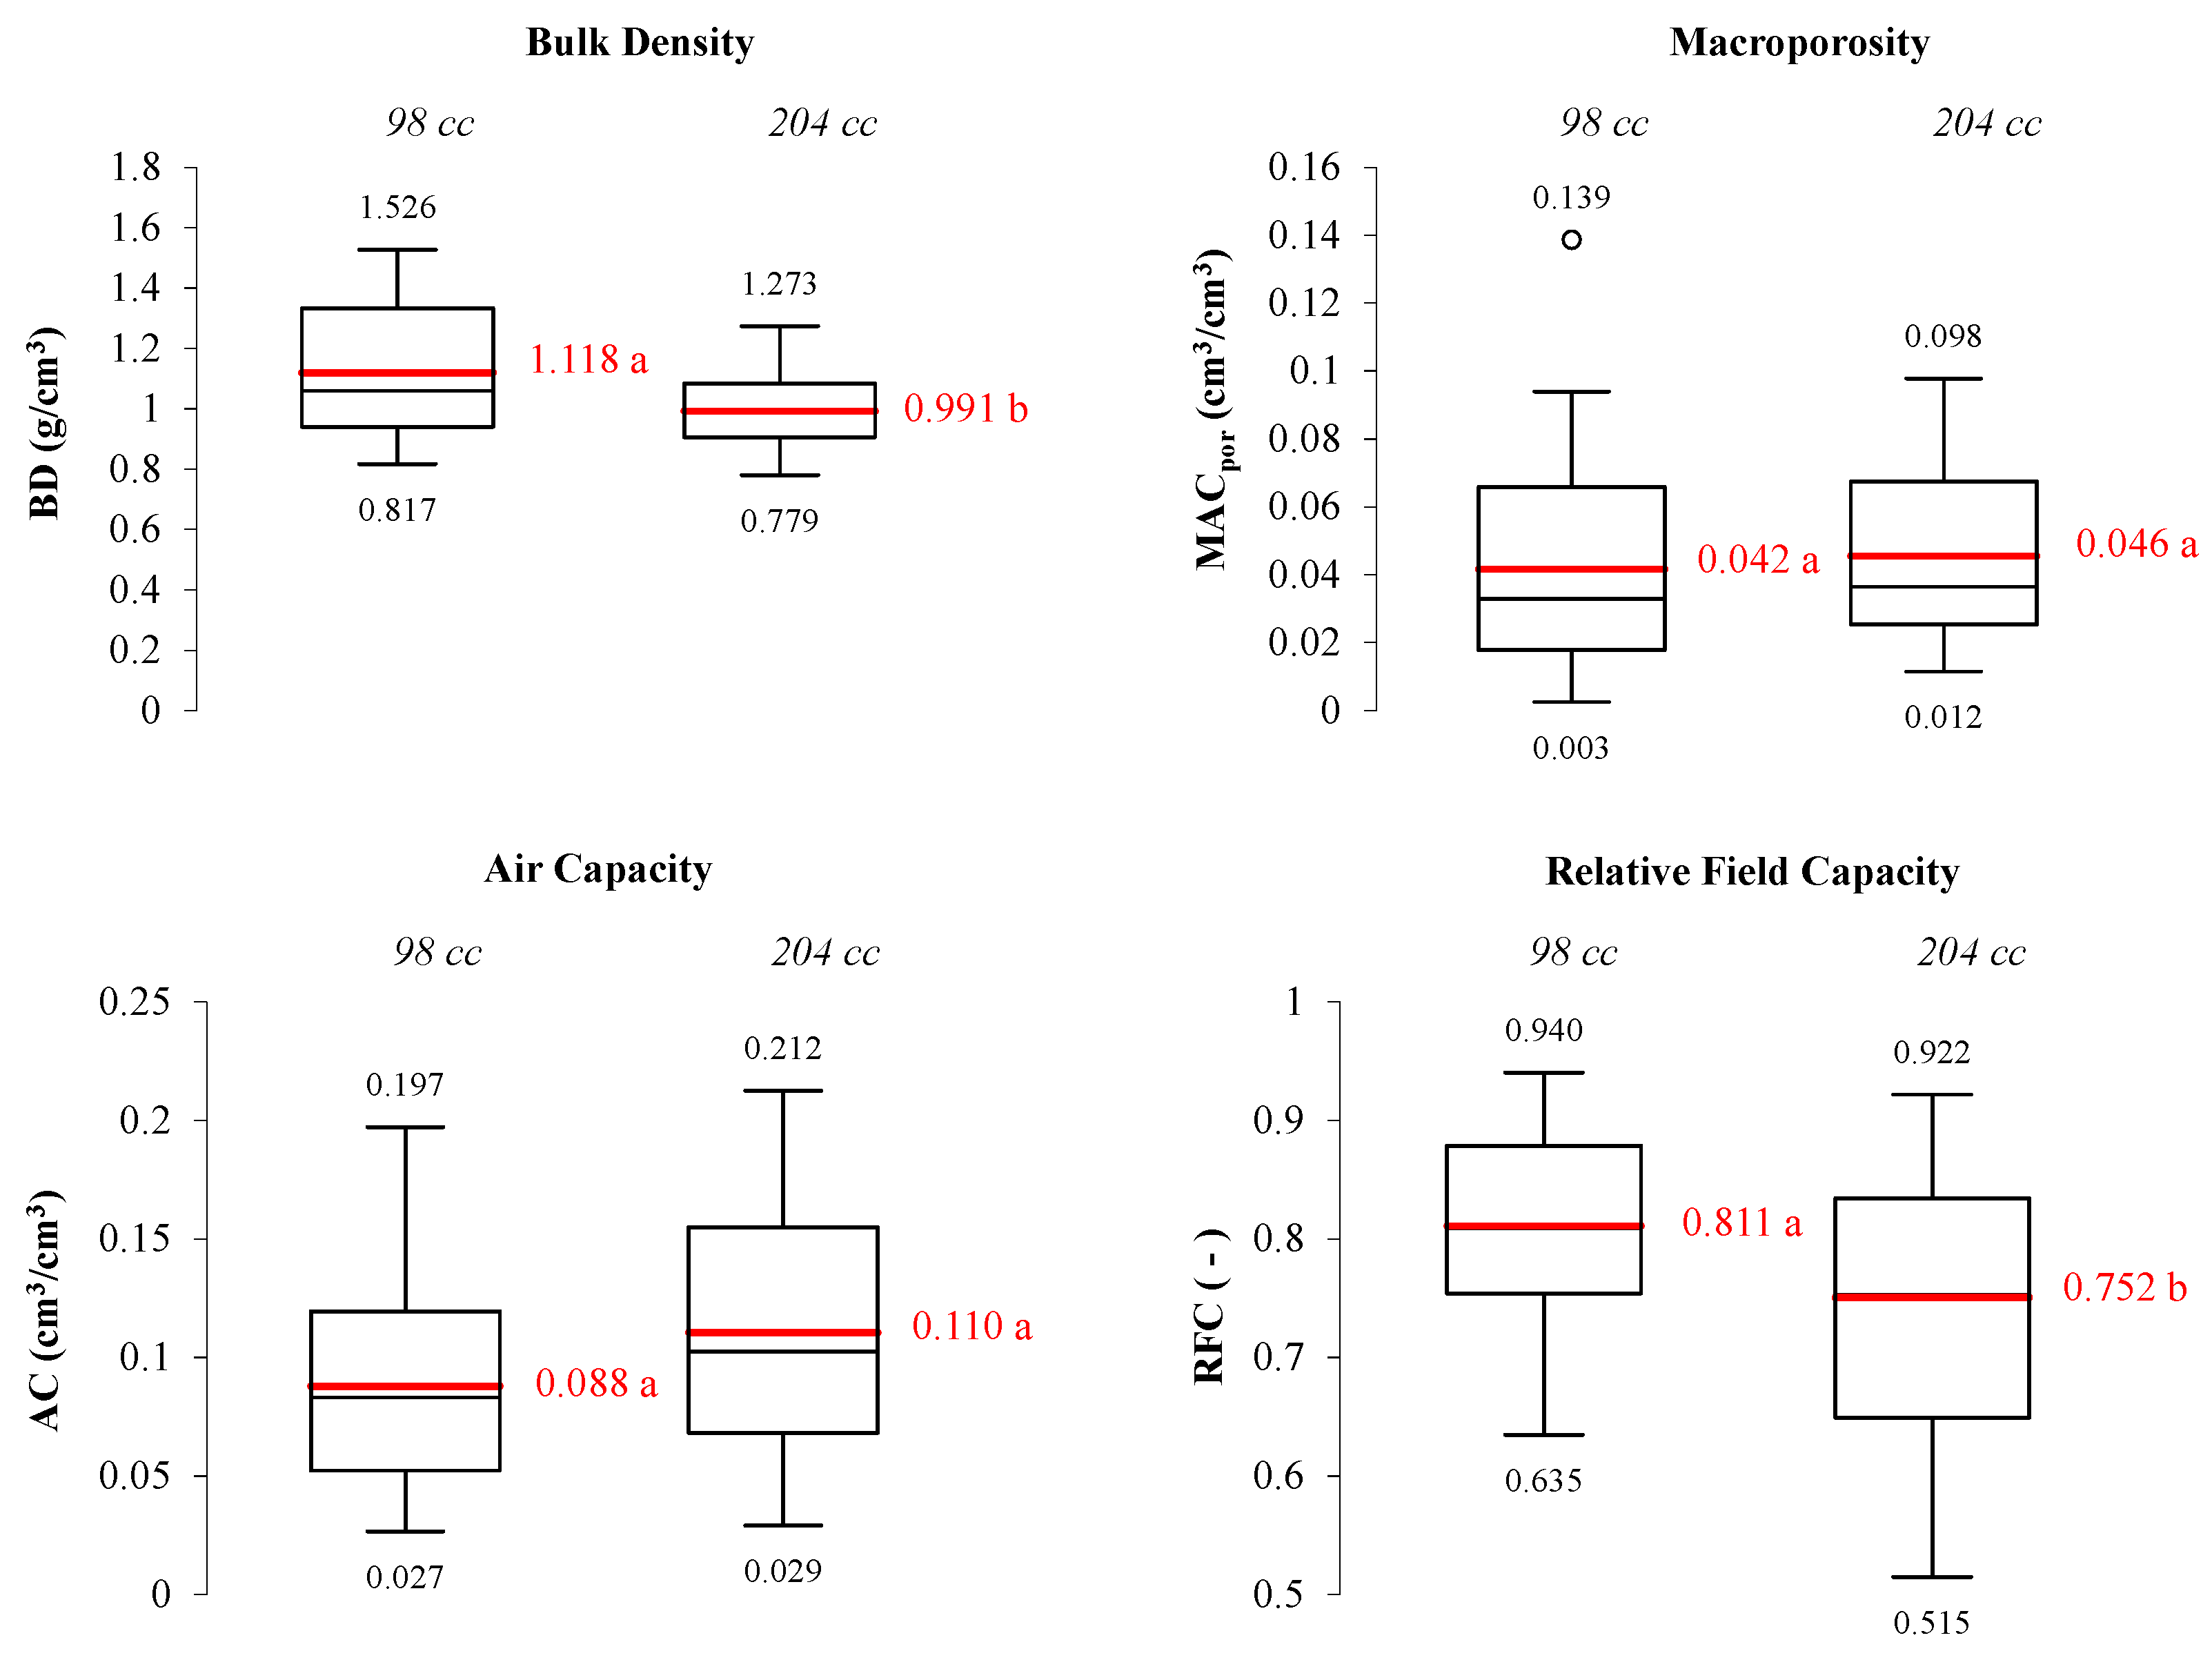
The effect of sampled soil volume on estimated SPQ indicators (i.e., BD, MAC
por, AC, and RFC) was reported in the box plots of
Figure 4. Results were in line with the theoretical expectations, since compared with the bigger soil volume used in this investigation, the smaller one determined higher values of soil bulk density, lower values of air capacity and macroporosity, and higher values of relative field capacity (relatively higher RFC values correspond to a relatively higher density of the porous medium). Moreover, statistically significant differences were only identified for BD and RFC values, while no statistical difference was detected for the remaining soil indicators (
Figure 4).
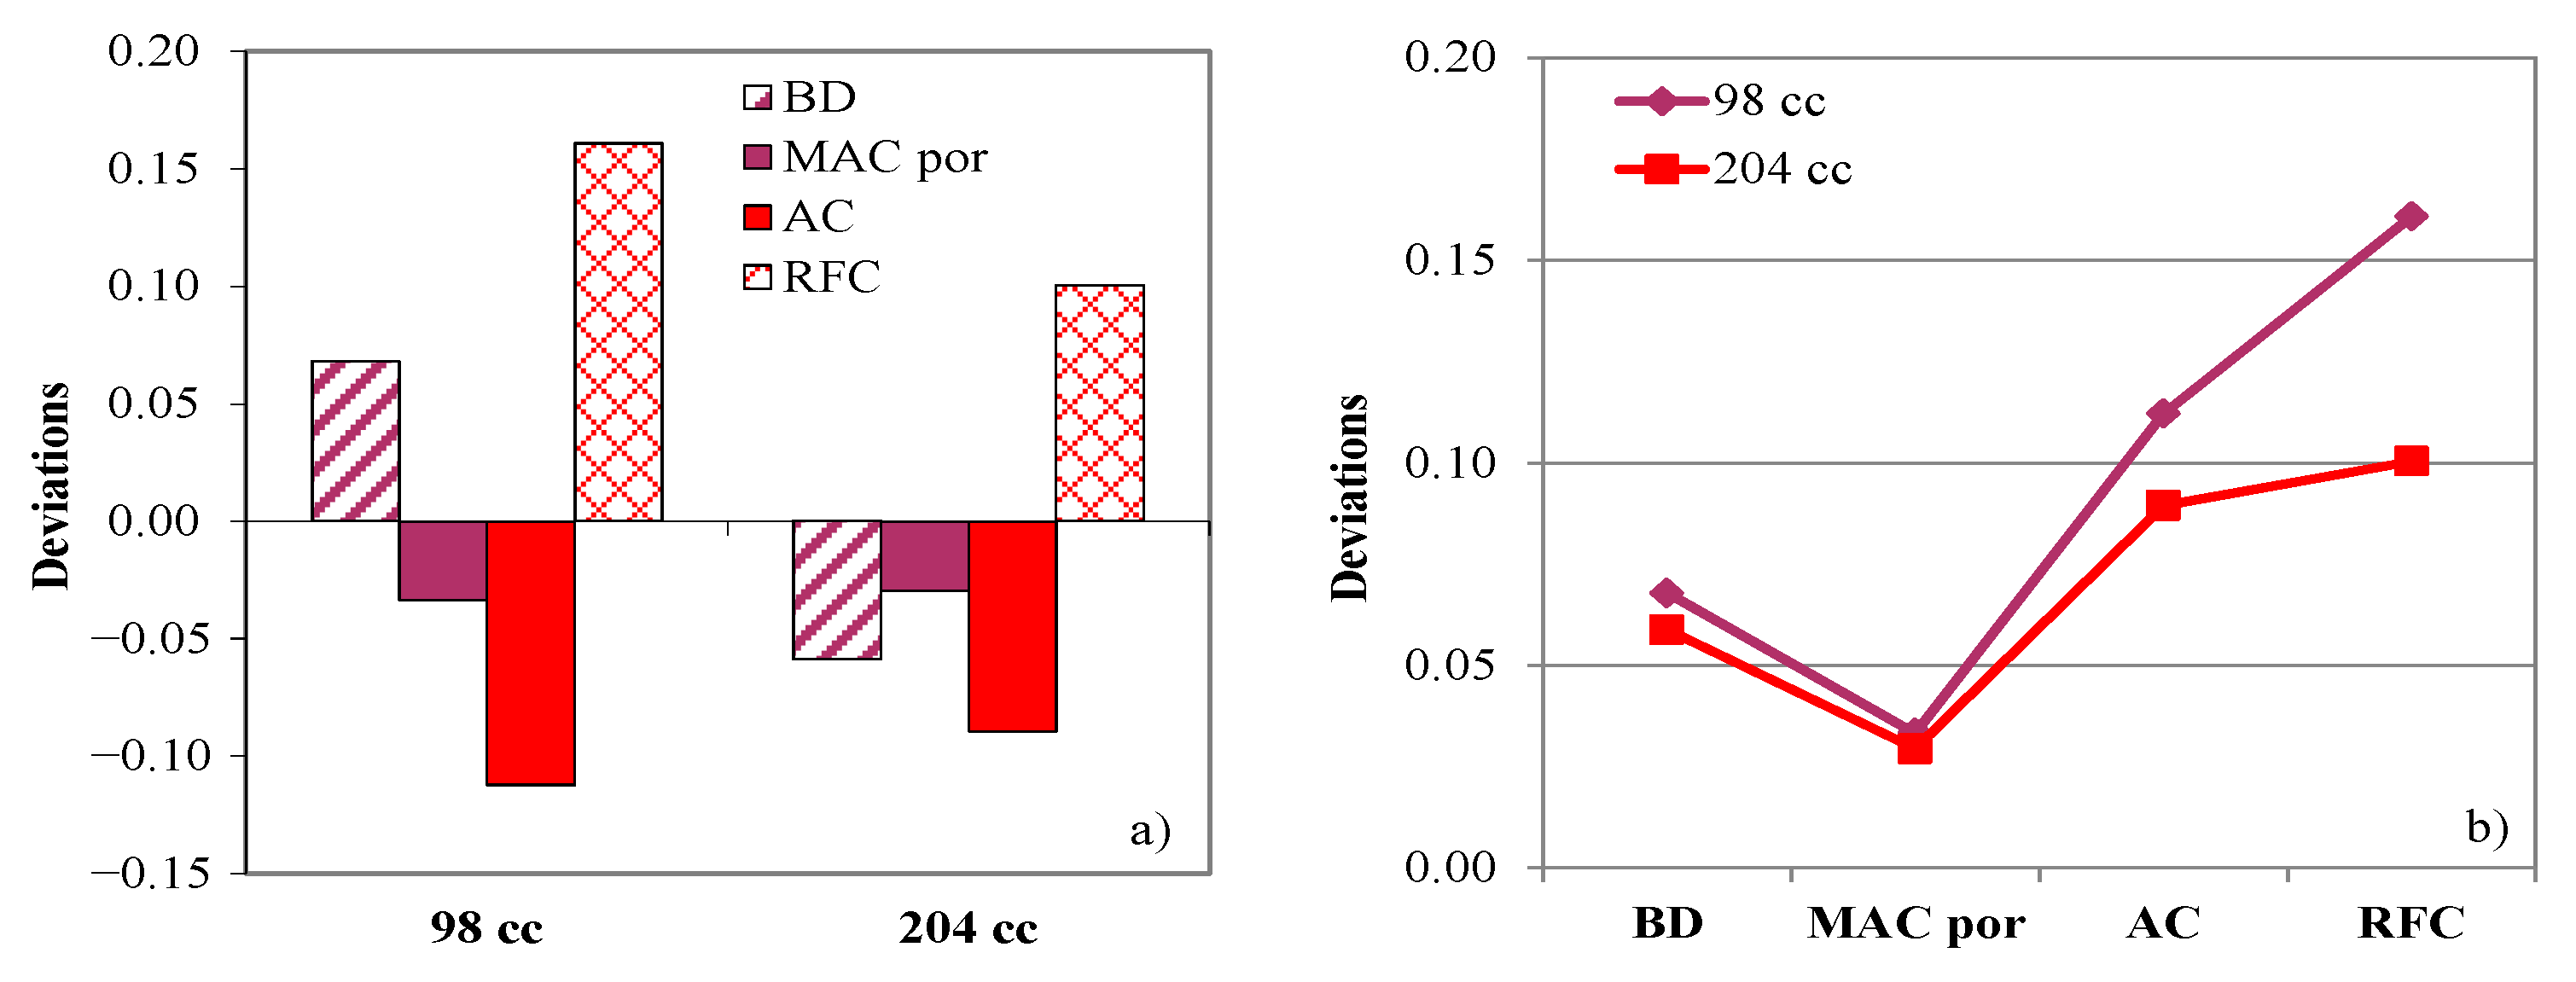
In order to investigate the possible impact of sampled soil volume on SPQ assessment,
Figure 5a shows the deviations between observed SPQ indicators and the corresponding mean optimal values suggested in the literature [
2,
10]. Regardless of the volume considered, investigated soils showed an overestimation of RFC and an underestimation of AC and MAC
por. However, a different result was observed for BD, because both an overestimation (98 cm
3) and an underestimation (204 cm
3) was detected.
Figure 5b summarizes the same effect more clearly. In fact, starting from the hypothesis that a positive or negative difference, with respect to the optimal SPQ values, could be equally acceptable, results showed that a comparable SPQ assessment may be obtained for BD or MAC
por, while the discrepancies increased for AC or RFC; therefore, more uncertain soil quality evaluations could be obtained in term of relative field capacity (
Figure 5b). This suggests that (i) the evaluations of the SPQ may differ depending on the volume of samples used, and (ii) SPQ estimations obtained with larger soil samplers could be considered more reliable, when the purpose is to apply capacitive indicators that require the field capacity estimation.
The comparison between CT and NT, in terms of soil bulk density, macroporosity, air capacity, and relative field capacity was reported
Table 2. Overall, significantly higher values were found for all variables obtained under NT. This means that NT soil was significantly more compact and with a lower macroporosity and air capacity, as compared with CT. The latter finding was also confirmed by the higher values of relative field capacity, as it exceeded the upper limit suggested in the literature (0.85 instead of 0.70). SPQ assessment was comparable between soil management as showed optimal BD values and poor RFC. However, a relatively better evaluation was obtained under CT in terms of MAC
por, because intermediate values of macroporosity values were detected; this suggests a little better air availability, i.e., due to larger pores, for conventionally managed soil (
Table 2). Therefore, soil volume affected SPQ assessment at least for the macroporosity, while it was irrelevant in the estimation of BD, AC, and RFC.
4. Discussion
The topic of soil water retention measurements representativeness is central in agro-environment researches, but little attention was paid, so far, on the effect of sampled soil volume on SPQ estimation. In this study, the impact of the sampled soil volume on SPQ estimation was investigated under alternative soil management, i.e., CT and NT, for two fine textured soils under a durum wheat cultivation.
Results showed that larger soil sampler returned lower mean values of BD–RFC and relatively higher for AC–MAC
por. This result is consistent with theoretical assumptions, since the compaction effect of the sampled soil volume is greater for small cores than for larger ones. Moreover, a more representative ratio “soil pores-soil matrix” is expected using a relatively larger ring. Since it is well known that sample height affects soil water retention curve estimation [
12], observed discrepancies may be mainly linked to the difference (about two centimeters) in soil sampler diameter, because the same sample height (i.e., 5 cm) was used. Moreover, sampled soil volume significantly affected BD and RFC estimation while no significant differences were recognized for AC and MAC
por; this suggests that, with reference to the investigated fine textured soils, the soil volume could affect the estimation of the former indicators, but seems to be more marginal for the latter. This result may be of practical interest for estimating the physical quality of agricultural soils, given that BD is a widespread soil indicator (e.g., [
9,
29]), probably due to ease of estimation. Although this finding was obtained from a relatively large number of soil samples, also accounting for heterogeneous soil conditions, it must be taken with caution, as only two fine textured soils were considered. Furthermore, this finding refers to the effects on hydrostatic soil properties of about six months after the last soil tillage.
The soil physical quality estimation, obtained for CT and NT, showed a comparable assessment in term of soil bulk density, air capacity, and relative field capacity, since optimal or poor values were detected for BD and AC-RFC, respectively. Conversely, relatively better SPQ values were detected under CT in term of MAC
por (intermediate), because a poor macroporosity under NT was detected. This last finding is not surprising because similar results, obtained under no-tilled soils, are widely reported in the literature (e.g., [
9,
30]). For instance, Pranagal and Woźniak [
7] reported, for a sandy clay loam soil (0–10 cm) and wheat cultivation, higher BD (and lower total porosity or AC) values under NT than CT; conversely, RFC was better under NT soil. For two fine textured soils, Castellini et al. [
9] reported always higher (both significant and non-significant) BD values under NT, and generally lower levels of AC and MAC
POR. Signs of excessive soil porosity (CT) or soil compaction (NT) were also identified, because RFC was found to be too low (<0.6) or too high (>0.7), respectively, in one of the investigated sites [
9]. The results of this investigation can be considered an average evaluation as they refer to data obtained in two farms, experimental and private, with two sample sizes. However, summarizing the impact of soil management on the relationship between air and water under CT and NT soils, RFC provides a big picture of soil compaction effect, also with the suggested reference values, because CT was found to have slightly exceeded the upper limit of RFC (i.e., 0.73 instead of 0.7), denoting a slight decrease in soil air capacity, while this condition was more marked in NT soil.
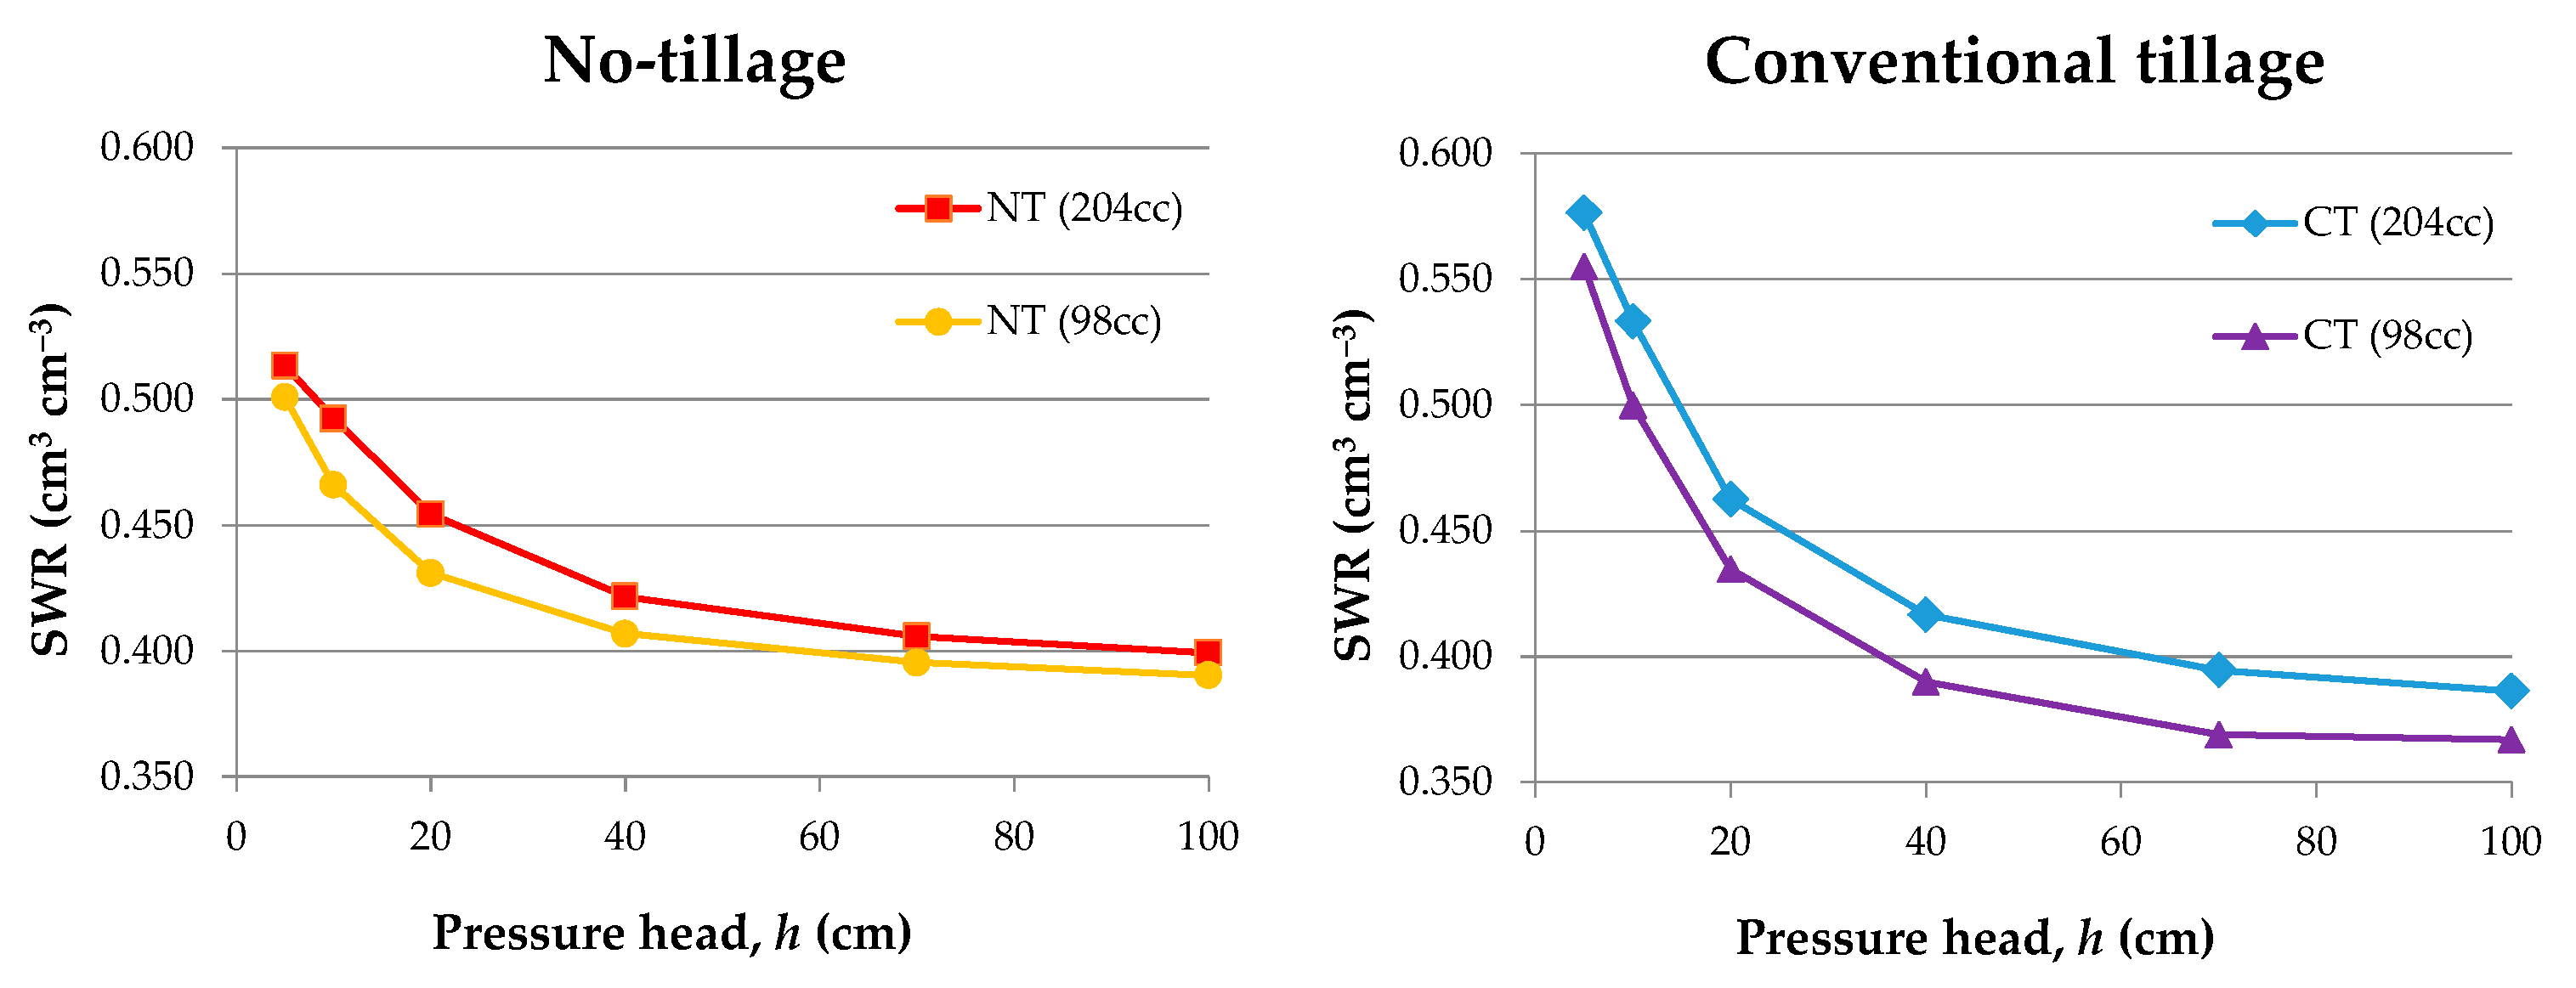
Although the present topic deserves to be further investigated in the future, sampling, for example, other soil textures and different physical conditions in the field, a further check was carried out. At this aim, for each soil management and sampling volume, five soil cores were collected at the Foggia site in 2020 to detect a longer-term effect (about twice as much as before; i.e., 13 months, before the next year’s sowing) on the physical properties of the soil. Overall, the results were in agreement with the previous ones, as the soil water retention curve close to saturation (i.e., until the field capacity) was higher for bigger cores than smaller ones; this result was verified for both soil management systems, but was more evident under CT soil (
Figure 6).
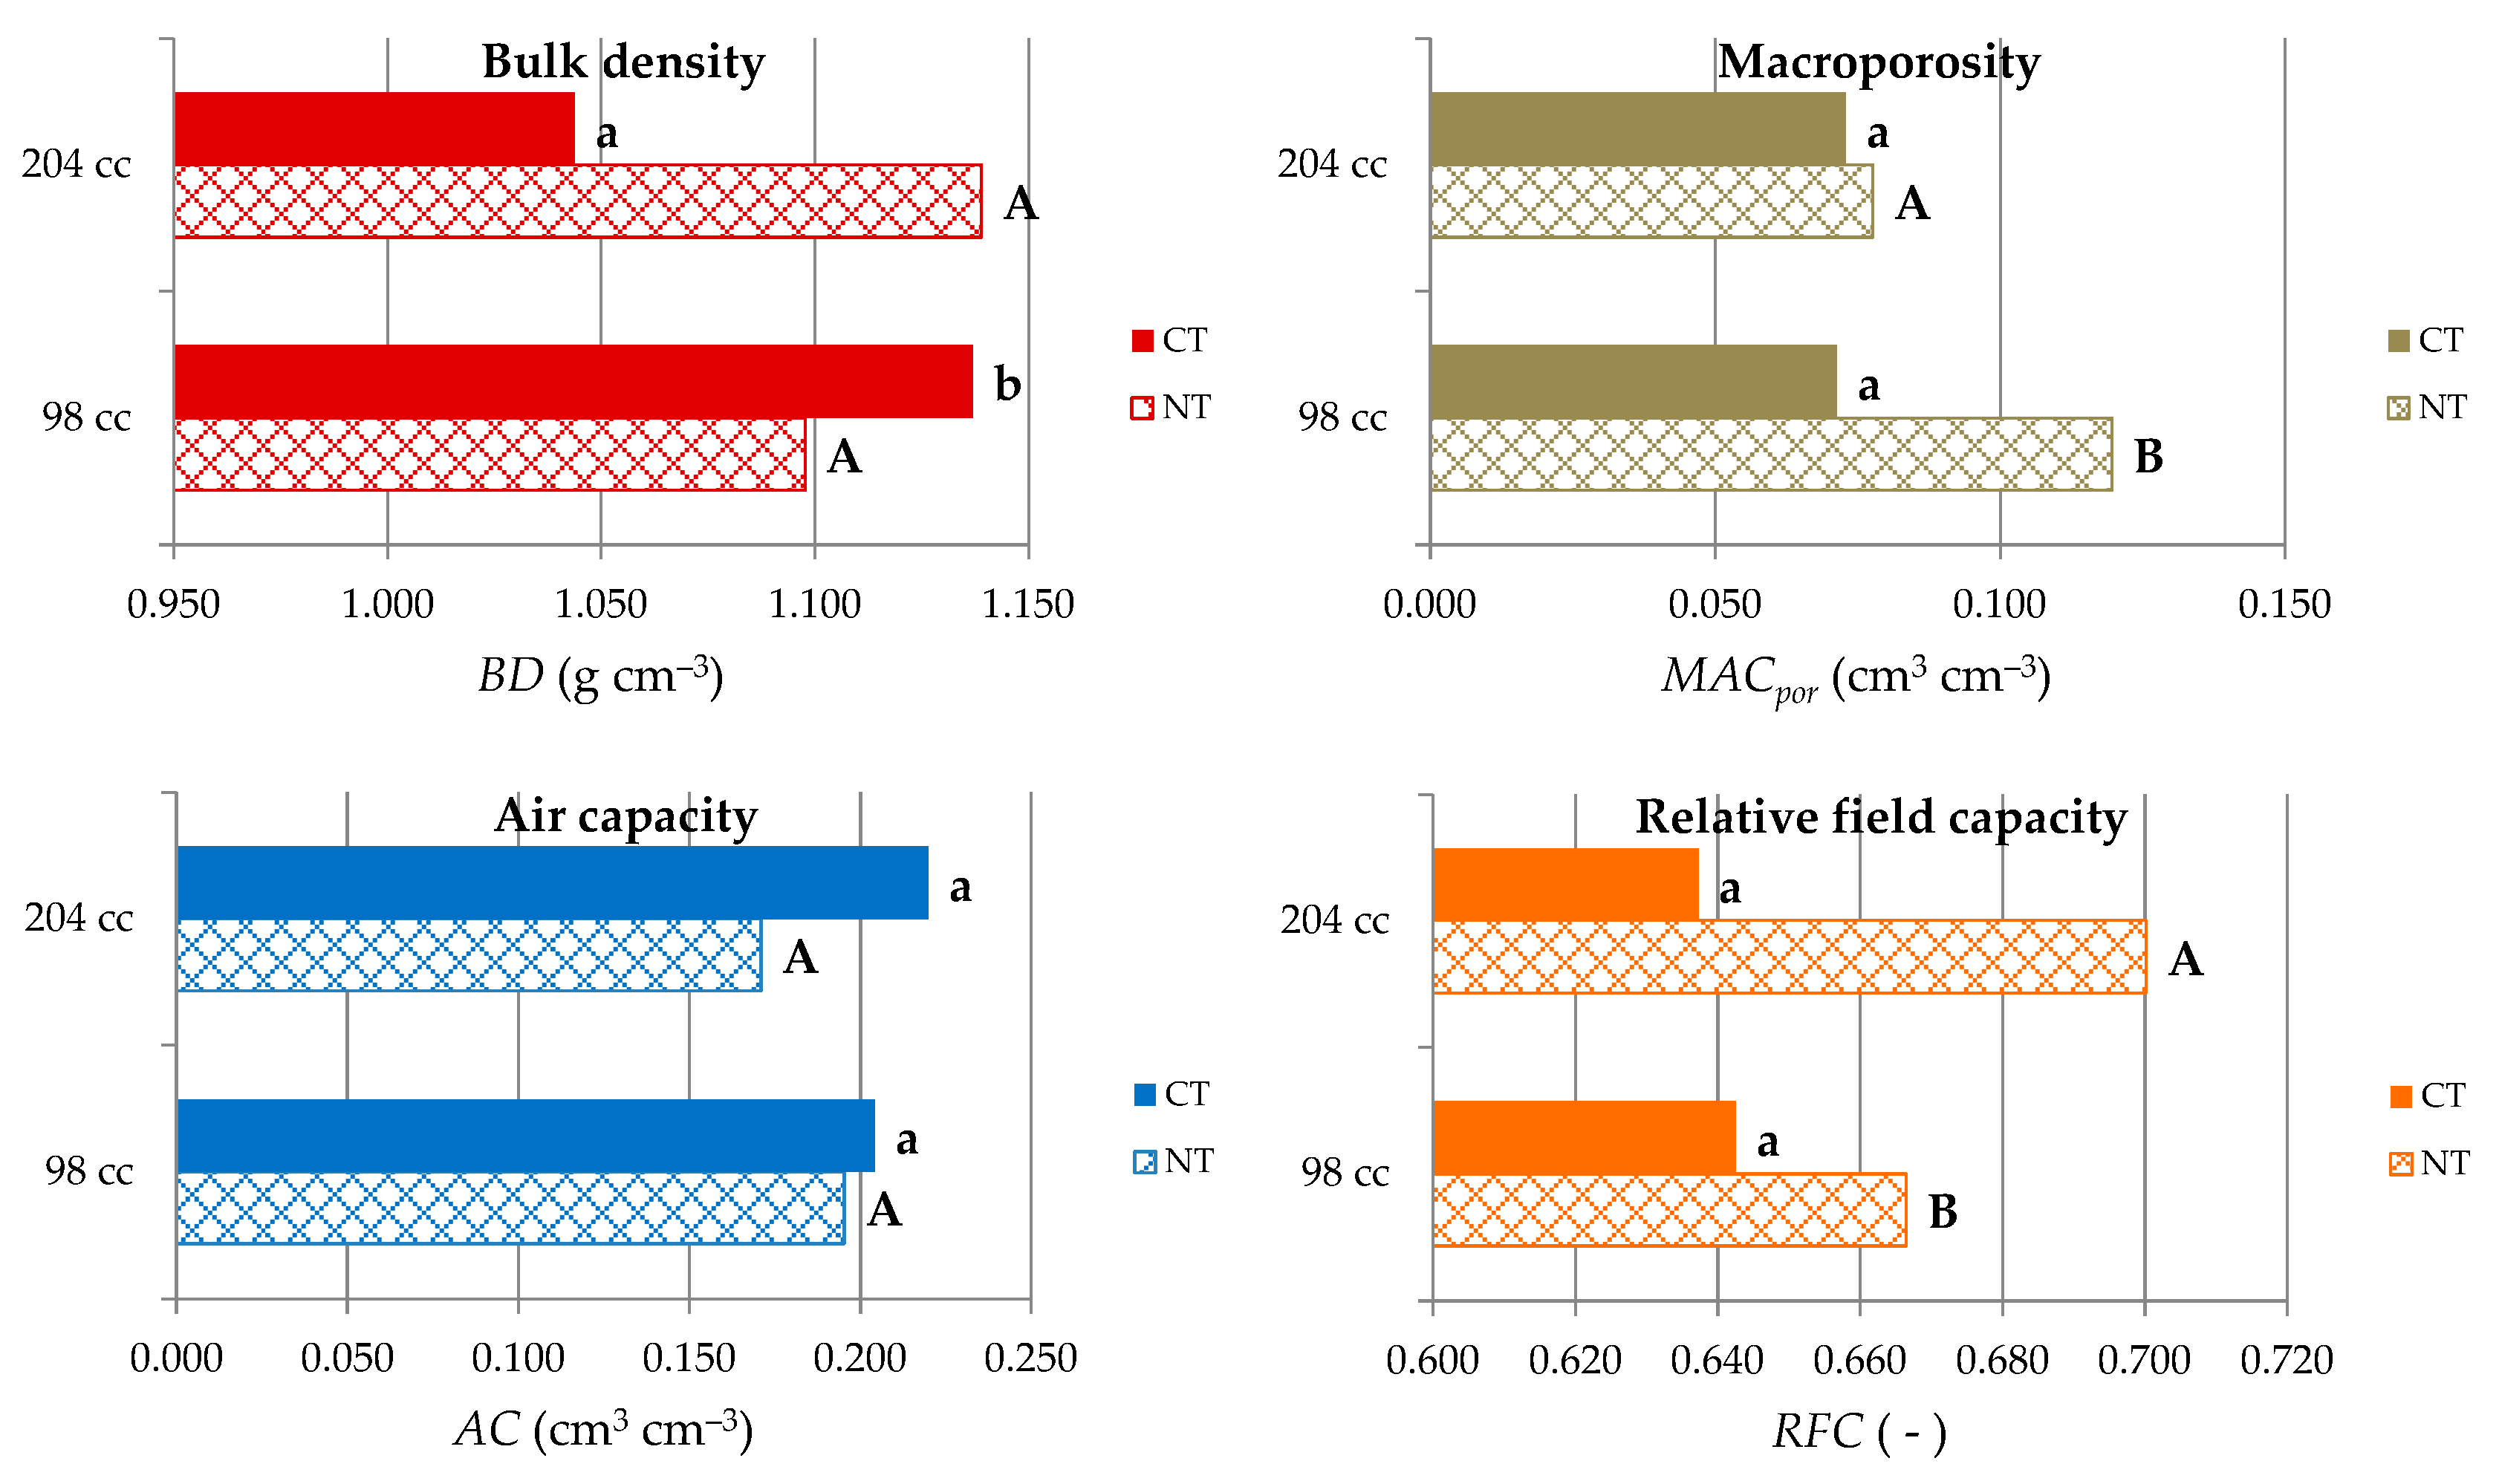
As expected, undisturbed soil conditions affected the CT system more than NT, as the former showed significant differences for BD (
Figure 7). However, a lack of “negative effects” linked to the smaller sampling volume were obtained also in terms of air capacity (AC) or, more in general, under CT soil management (i.e., MAC
por and RFC), because significantly higher values of the variables that account for the availability of air in the soil were obtained when NT was sampled with the smaller sampler (
Figure 7). In other words, not all of the results confirmed the experimental hypothesis, as the NT soil appears to have been sampled more accurately with the smaller sampler. We attributed these results to (i) the high soil moisture at the time of sampling, i.e., 0.351 and 0.397 cm
3·cm
−3, respectively, under CT and NT, and (ii) the higher spatial variability of soil properties under NT; these factors may have determined a random soil compaction, regardless of the sample size used.
From a strictly methodological point of view, the difference in the size of the sampled soil volume should not represent a source of uncertainty when: (i) the soil sampling procedures recommended in the literature, i.e., books, handbooks, papers [
31,
32], are strictly applied; (ii) the soil sampling is carried out in optimal soil moisture conditions. By following the suggested rules, therefore, one should be able to prevent mechanical stress, deformation of the soil volume, or pores volume compression. However, when it is necessary to collect a large number of soil cores in a short time, the sampled soil volume could not represent the real field conditions, and some inaccuracies are possible. Regarding the sampling time, for example, it may be necessary to investigate specific soil conditions in which the porous medium can be too humid (investigations on soil tillage, soil profiles, and trenches), too compact (effects of agricultural machinery, impact of rainfalls) or too dry (investigations in dry seasons).
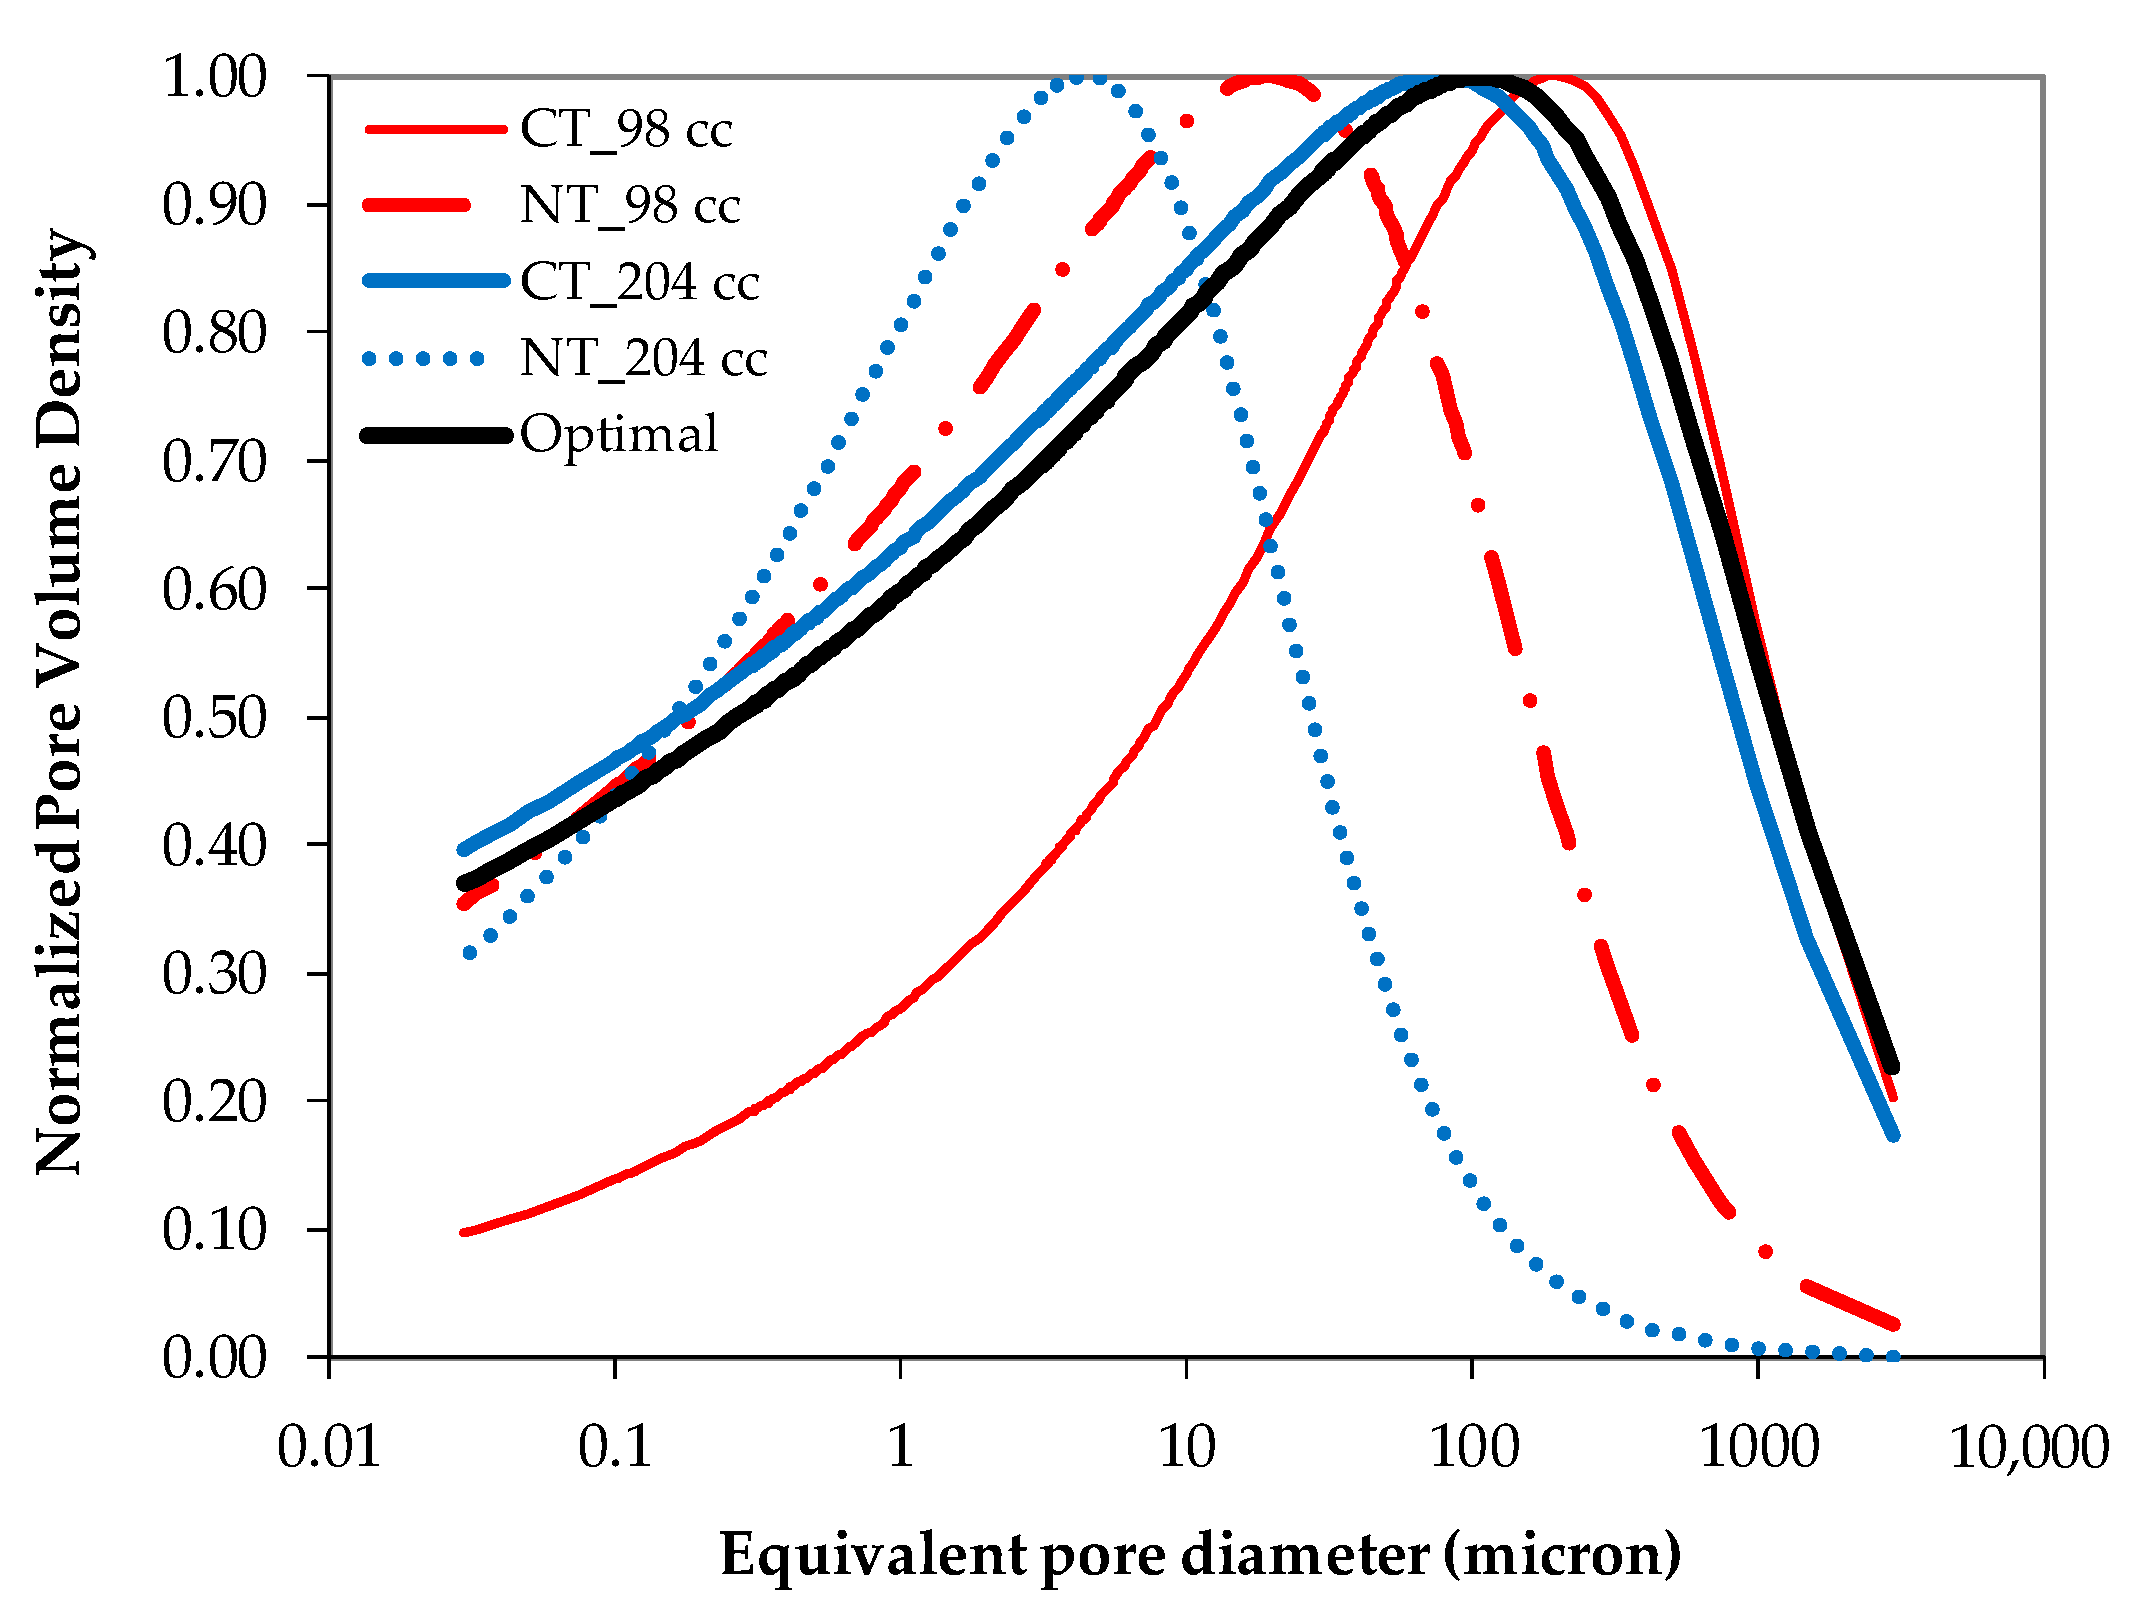
Results of this investigation showed that soil use, i.e., CT or NT, can also play a main role in the quality of water retention measurements, depending on the sampled soil volume. At this aim, for a given sample volume and soil management, a comparison, in terms of mean soil pore volume distribution function, was made for the Foggia site. Moreover, the curves were presented together with the corresponding optimal curve proposed by Reynolds et al. [
2] (
Figure 8). The same evaluation was not done for the Matera site because the available data were not adequate for an optimal curve parameterization.
Overall, NT soil seemed to be more sensitive when compared to CT, because greater differences in soil pore diameters were detected when compared to the reference curve. Specifically, only the CT soil showed a soil pore distribution very similar to the optimal curve proposed by Reynolds et al. [
2] when a representative soil volume (i.e., 204 cm
3) was used. For this curve, a mode, median, and mean diameter of the soil pores were equal to 78, 2.8, and 0.6 μm, respectively; also, values of standard deviation, skewness, and kurtosis were equal to 781, −0.68, and 1.13. Conversely, when a smaller soil core was used under CT, a good correspondence with the optimal curve was observed only for relatively large pores (i.e., higher than about 500 μm); this suggests that, under the specific soil sampling of this study, the smaller sampler does not significantly reduced the larger pores of the CT soil. Moreover, this curve was relatively like that found, for the same soil, in a previous investigation carried out under two residue management systems (i.e., burning and incorporation of wheat straw) [
33]. Poorer and non-optimal values were detected under NT. In this case, the NT curves were shifted to the left and the peak value, equivalent to the modal diameter of the distribution, was equal to 19 and 4 μm, respectively for 98 and 204 cm
3 cases (
Figure 8).
The present case study confirms the great accuracy required to obtain reliable measurements of SPQ and the need to go ahead on these researches to deepen this topic. The available literature references, although improvable in the definition of more accurate optimal intervals to account for a greater number of agronomic and experimental conditions, have represented a useful comparison tool to investigate the impact of soil management on the physical properties of the soil.


