Article

Integrated Geochemical Assessment of Soils and Stream Sediments to Evaluate Source-Sink Relationships and Background Variations in the Parauapebas River Basin, Eastern Amazon

by
Gabriel Negreiros Salomão
1,*,
Danielle de Lima Farias
2,
Prafulla Kumar Sahoo
3,4,
Roberto Dall’Agnol
1,4 and
Dibyendu Sarkar
5,*
1
Programa de Pós-graduação em Geologia e Geoquímica (PPGG), Instituto de Geociências (IG), Universidade Federal do Pará (UFPA), Belém 66075-110, Pará, Brazil
2
Secretaria de Estado de Meio Ambiente e Sustentabilidade (SEMAS), Belém 66093-677, Pará, Brazil
3
Department of Environmental Science and Technology, Central University of Punjab, Ghudda, Bathinda 151401, Punjab, India
4
Instituto Tecnológico Vale (ITV), Belém 66055-090, Pará, Brazil
5
Department of Civil, Environmental and Ocean Engineering, Stevens Institute of Technology, Hoboken, NJ 07030, USA
*
Authors to whom correspondence should be addressed.
Submission received: 15 February 2021 / Revised: 17 March 2021 / Accepted: 17 March 2021 / Published: 22 March 2021

Abstract

:
This study aims to handle an integrated evaluation of soil and stream sediment geochemical data to evaluate source apportionment and to establish geochemical threshold variations for Fe, Al, and 20 selected Potentially Toxic Elements (PTE) in the Parauapebas River Basin (PB), Eastern Amazon. The data set used in this study is from the Itacaiúnas Geochemical Mapping and Background Project (ItacGMBP), which collected 364 surface soil (0–10 cm) samples and 189 stream sediments samples in the entire PB. The <0.177 mm fraction of these samples were analyzed for 51 elements by ICP-MS and ICP-AES, following an aqua regia digestion. The geochemical maps of many elements revealed substantial differences between the north (NPB) and the south (SPB) of PB, mainly due to the geological setting. The new statistically derived threshold values of the NPB and SPB regions were compared to the threshold of the whole PB, reported in previous studies, and to quality guidelines proposed by Brazilian environmental agencies. The natural variation of geochemical background in soils and stream sediments of PB should be considered prior to defining new guideline values. At the regional scale, the local anomalies are mostly influenced by the predominant lithology rather than any anthropogenic impact.

1. Introduction

Multi-element geochemical mapping is useful for both, mineral exploration surveys and environmental studies as previously demonstrated [1,2,3,4]. For both applications, the unusually high concentrations (also known as anomalies) are strong pieces of evidence of a potential mineral deposit or a possible anthropogenic impact. Evaluating the spatial distribution of an element, in a given sampling medium (e.g., soils, sediments, water, and rocks), along with different geographic information (land cover and land use, hydrology, geomorphology, geology, and mineralized zones) may assist in accurately identifying the source of enrichment (for some authors, contamination), whether anthropic or not [5,6,7].
Traditional studies in environmental geochemistry usually carry out impact assessments separately for each sampling medium [8,9,10]. Taking this into consideration, an integrated assessment, using geochemical data from different sampling mediums, might be a powerful strategy for identifying source apportionment and evaluating the geochemical variability in terrestrial environments. In relation to the large geochemical data set, this strategy became more affordable due to recent advances in data analysis using a robust programming language in addition to geoprocessing techniques. Similar approaches have been conducted elsewhere [11,12,13].
Prior to conducting an integrated assessment methodology, it is indispensable to understand the limitations in terms of physicochemical properties and representativeness, regarding the medium of sampling [14]. For instance, soil samples have local representativeness and medium (A horizon) to low (B horizon) susceptibility in terms of changes in local conditions. In general, soils have a strong correlation to the parent geological material. In contrast, stream sediment samples have a wider representativeness, restricted to the whole upstream catchment area of the sampling point, and high susceptibility, not only due to the different lithologies occurring in the catchment area, but also due to changes in the hydrosedimentological dynamics, influenced by local seasonal variations, and changes in land cover and land use [15,16].
In addition, the determination of geochemical background is a mandatory approach for this assessment. The background concept has not been clearly established [17,18,19], but the term is often used as a naturally occurring concentration range of an element or chemical compound [20], determined by a given analytical method [21], which can be established by direct, indirect and integrated methods [6]. Some authors consider that the upper limit of the geochemical background, also known as the threshold value, can be used to distinguish between natural and anthropogenic influences [17]. The threshold concentration value is regularly used as a reference to define action levels in environmental legislation [22,23], whereas, the lower background limit has not been widely discussed, perhaps due to its low relevance for exploration and environmental purposes.
The Parauapebas River Basin (PB) is particularly relevant for geochemical studies because: (i) The basin is located in the Carajás Mineral Province, the largest mineral province of Brazil, and large open pit Fe (N4, N5 and S11D), Cu (Sossego) and Cu-Au (Antas North) mines, besides other mineral deposits, are situated on it (Figure 1d; (ii) The PB has protected areas that are covered by preserved tropical forest but most of it was deforested. Hence, the study area has strong contrasts of land use and cover; (iii) The possible impact in the environment related to mining activities and the effects of deforestation and increase of human occupation, with agricultural development and livestock production, should be evaluated. All these aspects can be evaluated by studying the spatial distribution of chemical elements particularly those of iron, the most voluminous mineral resource produced in the region, and Potentially Toxic Elements (PTE).
This study is associated with the Itacaiúnas Geochemical Mapping and Background Project (ItacGMBP), a large geochemical mapping project carried out by the Instituto Tecnológico Vale (ITV) in the entire Itacaiúnas River Watershed (IRW; Figure 1b). In the PB area (Figure 1c), a previous study about the soil [24] geochemistry has been conducted. However, an integrated and refined interpretation using soil and stream sediment geochemical data sets of the PB is presented here for the first time. To address the source apportionment and establishing geochemical threshold variations, a series of advanced data analyses were implemented, mainly by using geoprocessing techniques and traditional statistical methods. This integrated assessment of geochemical data is of great importance to fill the knowledge gaps identified in previous studies.
This study aims to handle an integrated evaluation of soil and stream sediment geochemical data to evaluate source apportionment and to establish geochemical threshold variations for Fe, Al, and 20 selected PTE (Ag, B, As, Ba, Bi, Cd, Co, Cr, Cu, Hg, Mn, Mo, Ni, Pb, Sb, Se, Sn, U, V, and Zn) in the PB. The study was designed to answer several questions:
  • How is the spatial distribution of the PTE in soils and stream sediments of the PB? Are they similar or not?
  • Are the soil and stream sediment samples correlated? Do they share the same source apportionment?
  • How do the geological domains affect the variations of the geochemical background and distribution of anomalies in the PB and what is their relevance for the definition of environmental guidelines?
  • Is there any evidence of anthropogenic impact in the area?

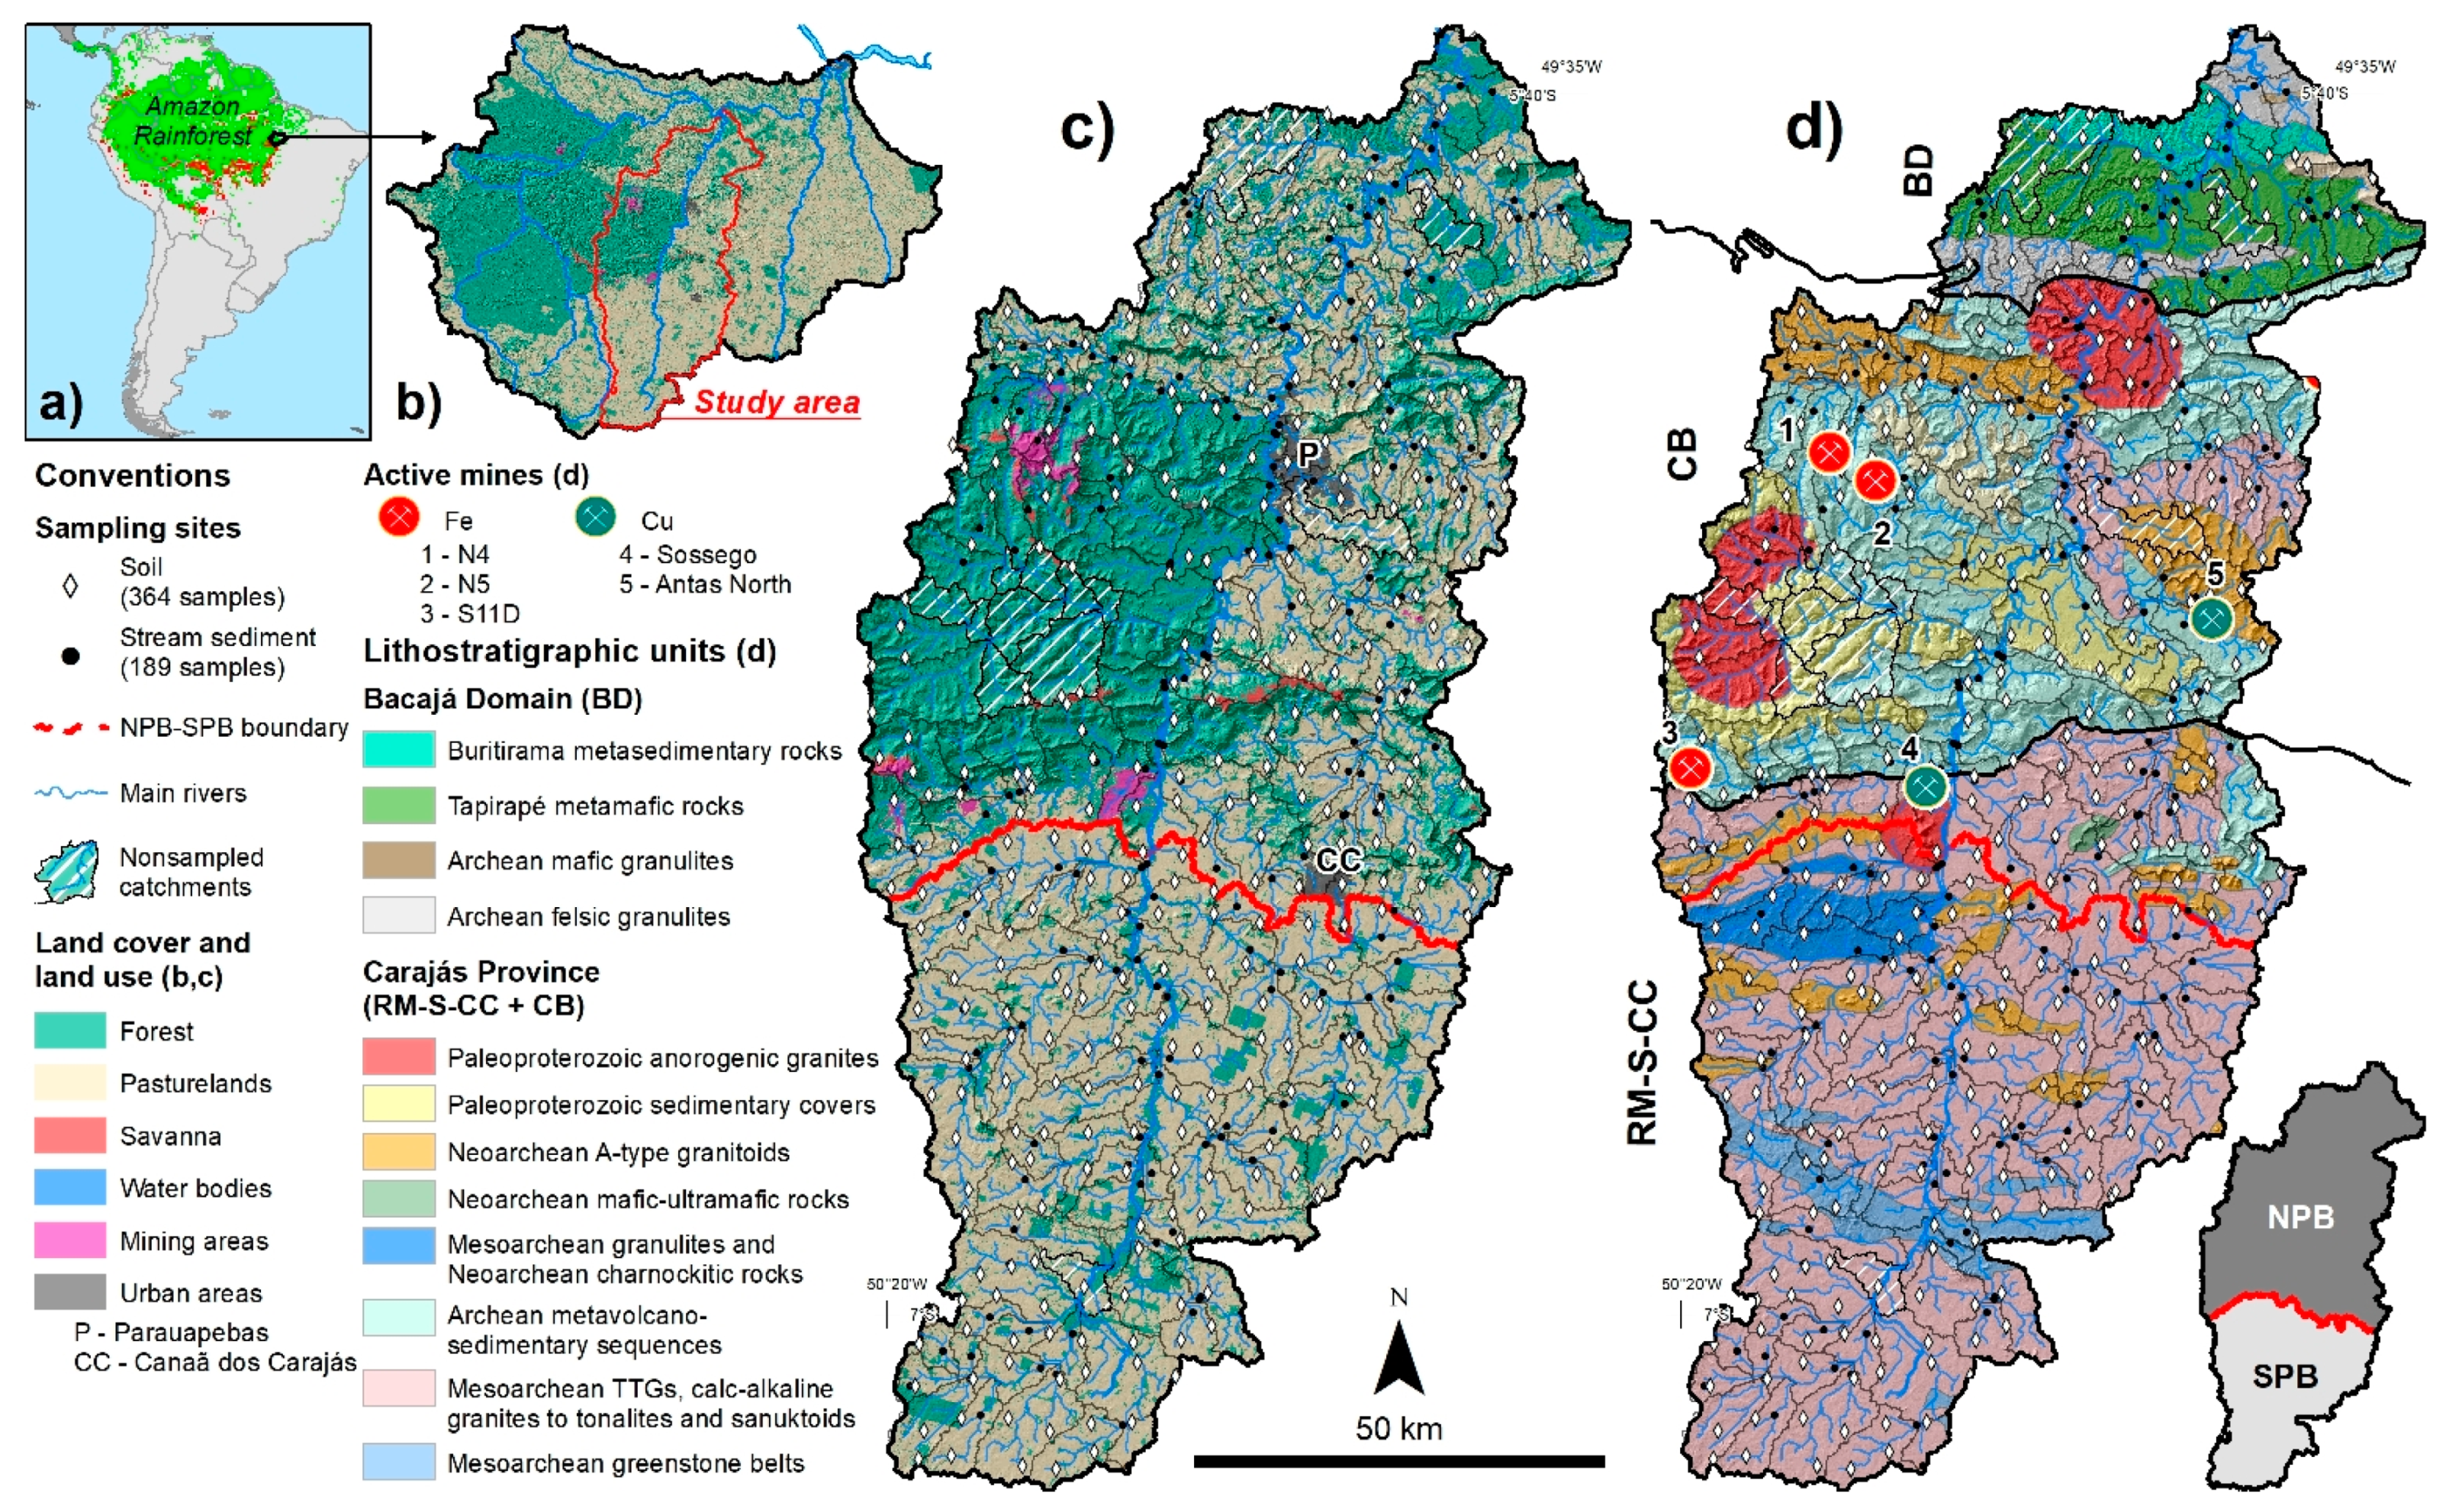
2. Study Area and Geological Setting

The study area of the present research is the Parauapebas River Basin (PB), situated in the eastern Amazon Rainforest (Figure 1a). The PB is classified as one of the eight sub-basins of the IRW (Figure 1b), which covers an area of approximately 9600 km2, encompassing two main urban areas (Parauapebas and Canaã dos Carajás; Figure 1c), parts of conservation areas, represented mainly by the remaining preserved forest in the Center-West of the PB (Figure 1b), and active open-pit Fe (N4, N5, and S11D), Cu (Sossego) and Cu-Au (Antas North) mines (Figure 1d).
For the purpose of the present study, the geology of the PB can be simplified into three different domains (Figure 1d):
  • Rio Maria—Sapucaia—Canaã dos Carajás domains (RM-S-CC): It is restricted to the south of PB (Figure 1d), and is composed essentially of Mesoarchean tonalite—trondhjemite—granodiorite (TTG) series associated with greenstone belt sequences and calc-alkaline granites to tonalites and sanukitoids [25,26,27,28]. Neoarchean A-type like granitoids, charnockitic rocks, mafic-ultramafic bodies, and Paleoproterozoic anorogenic granites crosscut the Mesoarchean units [25,29,30,31,32,33].
  • Carajás Basin (CB): It is restricted to the center of PB (Figure 1d), and is composed dominantly of Neoarchean mafic to felsic metavolcanic rocks and banded-iron formations (BIF), which hold the world-class Fe deposits of Carajás [34,35]. Neoarchean A-type like granite plutons [29,36] and mafic-ultramafic stratified bodies [31,37], as well as Paleoproterozoic anorogenic granites [38,39,40] also occur.
  • Bacajá Domain (BD): It is restricted to the north of PB (Figure 1d), and is mainly composed of high-grade charnockitic rocks, with subordinate mafic orthogranulitesand para-derived granulites [41], supracrustal mafic metamorphic rocks of the Tapirapé Formation, and metasedimentary lithologies of the Buritirama Formation [42].

3. Materials and Methods

3.1. Sampling Procedure

The sampling strategies, data storage, screening, and validation of the ItacGMBP were entirely assisted by a computer-based framework associated with a geographic information system environment. Firstly, a sampling protocol was structured to guide the field teams in storing all field data using tablets in a geochemical database. Further information can be accessed elsewhere [43].
The soil survey was designed on a nominal scale of 1:250,000, with a sampling density of 1 sample/25 km2, using grids of 5 km × 5 km, homogeneously distributed along the whole IRW (Figure 1b). The surface soil samples were collected at a constant depth of 10 cm. Each surface soil sample was collected and then bulked to provide one composite sample (approximately 5 kg).
The stream sediment survey was designed on a nominal scale of 1:1,000,000, with a sampling density of 1 sample/100 km2, using 2nd–3rd order drainage microcatchments along the entire IRW (Figure 1b). The collection of stream sediment samples (approximately 3 kg) was carried out in active sedimentation areas at the catchment outlet, preferably in the middle of the channel to minimize contamination occurring at the margins.
For the quality control procedure, a duplicate sample was collected for every 20 samples collected. Samples were collected as close as possible to the location defined in the planning field map. Most of the unsampled sites are located in remote areas with severe access limitations. The detailed sampling procedure and description of different sampling media used in the ItacGMBP can be found elsewhere [24,43,44,45,46].
In the PB, 364 samples of surface soil and 189 samples of stream sediment were collected. The sampling sites are plotted over the land use and land cover (Figure 1c) and geological layers (Figure 1d) for further inspections.

3.2. Sample Preparation and Chemical Analyses

The ItacGMBP’s analytical program was extensive, but only the relevant analyses for the present study are described. For more information, refer to previous studies [24,43,44,45,46]. Both soil and stream sediment samples were submitted to the same preparation and analytical protocols. The samples were oven-dried at 70 °C, disaggregated, homogenized, and sieved through a <0.177 mm (80 mesh) sieve. Approximately 50 g of the samples were grounded, sieved through a <75 µm (200 mesh) sieve, and submitted to aqua regia (1:3 M HNO3:HCl) digestion. The aqua regia soluble concentrations of 51 elements (the most relevant for the present study are Fe, Al, Ag, B, As, Ba, Bi, Cd, Co, Cr, Cu, Hg, Mn, Mo, Ni, Pb, Sb, Se, Sn, U, V, and Zn) were determined via Inductively Coupled Plasma—Atomic Emission Spectrometry (ICP-AES) and Inductively Coupled Plasma—Mass Spectrometry (ICP-MS). All samples were prepared and analyzed in laboratories of ALS Brasil Ltda (Belo Horizonte, Brazil), a certified/accredited laboratory.

3.3. Data Processing and Statistical Analysis

Firstly, the censored data (values below the lower limit of detection—LLD), commonly observed in the geochemical data set, was replaced by LLD/2) indicated for each element, according to the analytical method. This procedure is widely used in the literature [22,23,45,46]. It is important to highlight that, eventually, two sets of data were used in this study, one for the NPB (soils = 223 samples; stream sediments = 122 samples) and another one for the SPB (soils = 141 samples; stream sediments = 67 samples) (cf. Figure 1). Standard statistical procedures [22,23,47] were undertaken in this research, which involves calculating several descriptive statistics parameters (amount of data below LLD, arithmetic mean, standard deviation—SD, minimum—Min, median—Med, and maximum—Max), constructing graphs based on the exploratory data analysis (e.g., box plots, scatter plot and quantile-quantile plot) and conducting hypothesis test (e.g., Mann–Whitney–Wilcoxon test). Data analysis was performed using the R programming language in RStudio.

3.4. The Determination of Geochemical Background Values

A variety of statistical methods was used for the calculation of geochemical threshold values, which is highly recommended by experts in the field. These methods are described elsewhere [19,20,22,23,48], and the general steps are highlighted herein.
Median + 2 ∗ Median Absolute Deviation (MMAD): The MMAD is considered one of the most prestigious methods for deriving geochemical threshold values [19]. Firstly, a requirement for using the MMAD method is that the raw data should be prior transformed to a common logarithm (log10) scale to get close to a normal distribution, unusually seen in geochemical data set [23]. In this approach, the median absolute deviation (MAD; Equation (1)), leads to a robust estimation of the variability of univariate geochemical data [23].
MAD(y) = 1.48 ∗ mediani|yimedianj(yj)|
Afterward, the MAD value should be multiplied by two and added to the median. At this stage, the result should be back-transformed, from logarithmic scale to natural scale, to derive the MMAD threshold value (Equation (2)):
MMAD(y) = 10(median(y) + 2 ∗ MAD(y))
Tukey’s Inner Fence (TIF): The TIF method depends solely on the data distribution. In addition, background values can be calculated even if no outliers are present in the data set (threshold value greater than the maximum value). Moreover, the threshold value obtained from this approach is most informative if the true number of outliers is below 10% of the data [19,23]. Firstly, the log10 transformation is required prior to using this approach [19]. The TIF method consists of determining the upper (Q3 = 75th percentile) and lower (Q1 = 25th percentile) quartiles of the boxplot. Then, the inner fence is determined as the interquartile range (IQR = Q3 − Q1) extended by 1.5 times. The threshold value based on the TIF method is calculated following Equation (3):
TIF = 10(Q3 + 1.5 ∗ IQR(y))
Percentile-based approaches: These approaches are considered as the most straightforward methods for deriving threshold values [48,49], widely used by many environmental agencies from different countries (e.g., Brazil [50], Australia [51], and Finland [52]). The 98th percentile (P98) has become widespread as a 2% outliers (1 in 50 rate) is deemed acceptable, and it distances the method from the 97.5 percentile, 2.5% 1 in 40 rate, which delivers similar results to the “Mean + 2 ∗ Standard Deviation” (outdated method) when a normal distribution of a given element is satisfied [19]. The 95th percentile (P95) corresponds to a more restricted value, as it considers 5% of all samples as outliers. Other percentile values are also used (e.g., 90th, 85th, and 75th), however, they are not going to be considered as threshold values in the present study.

3.5. Geoprocessing and Spatial Representation of Soil and Stream Sediment Geochemical Data
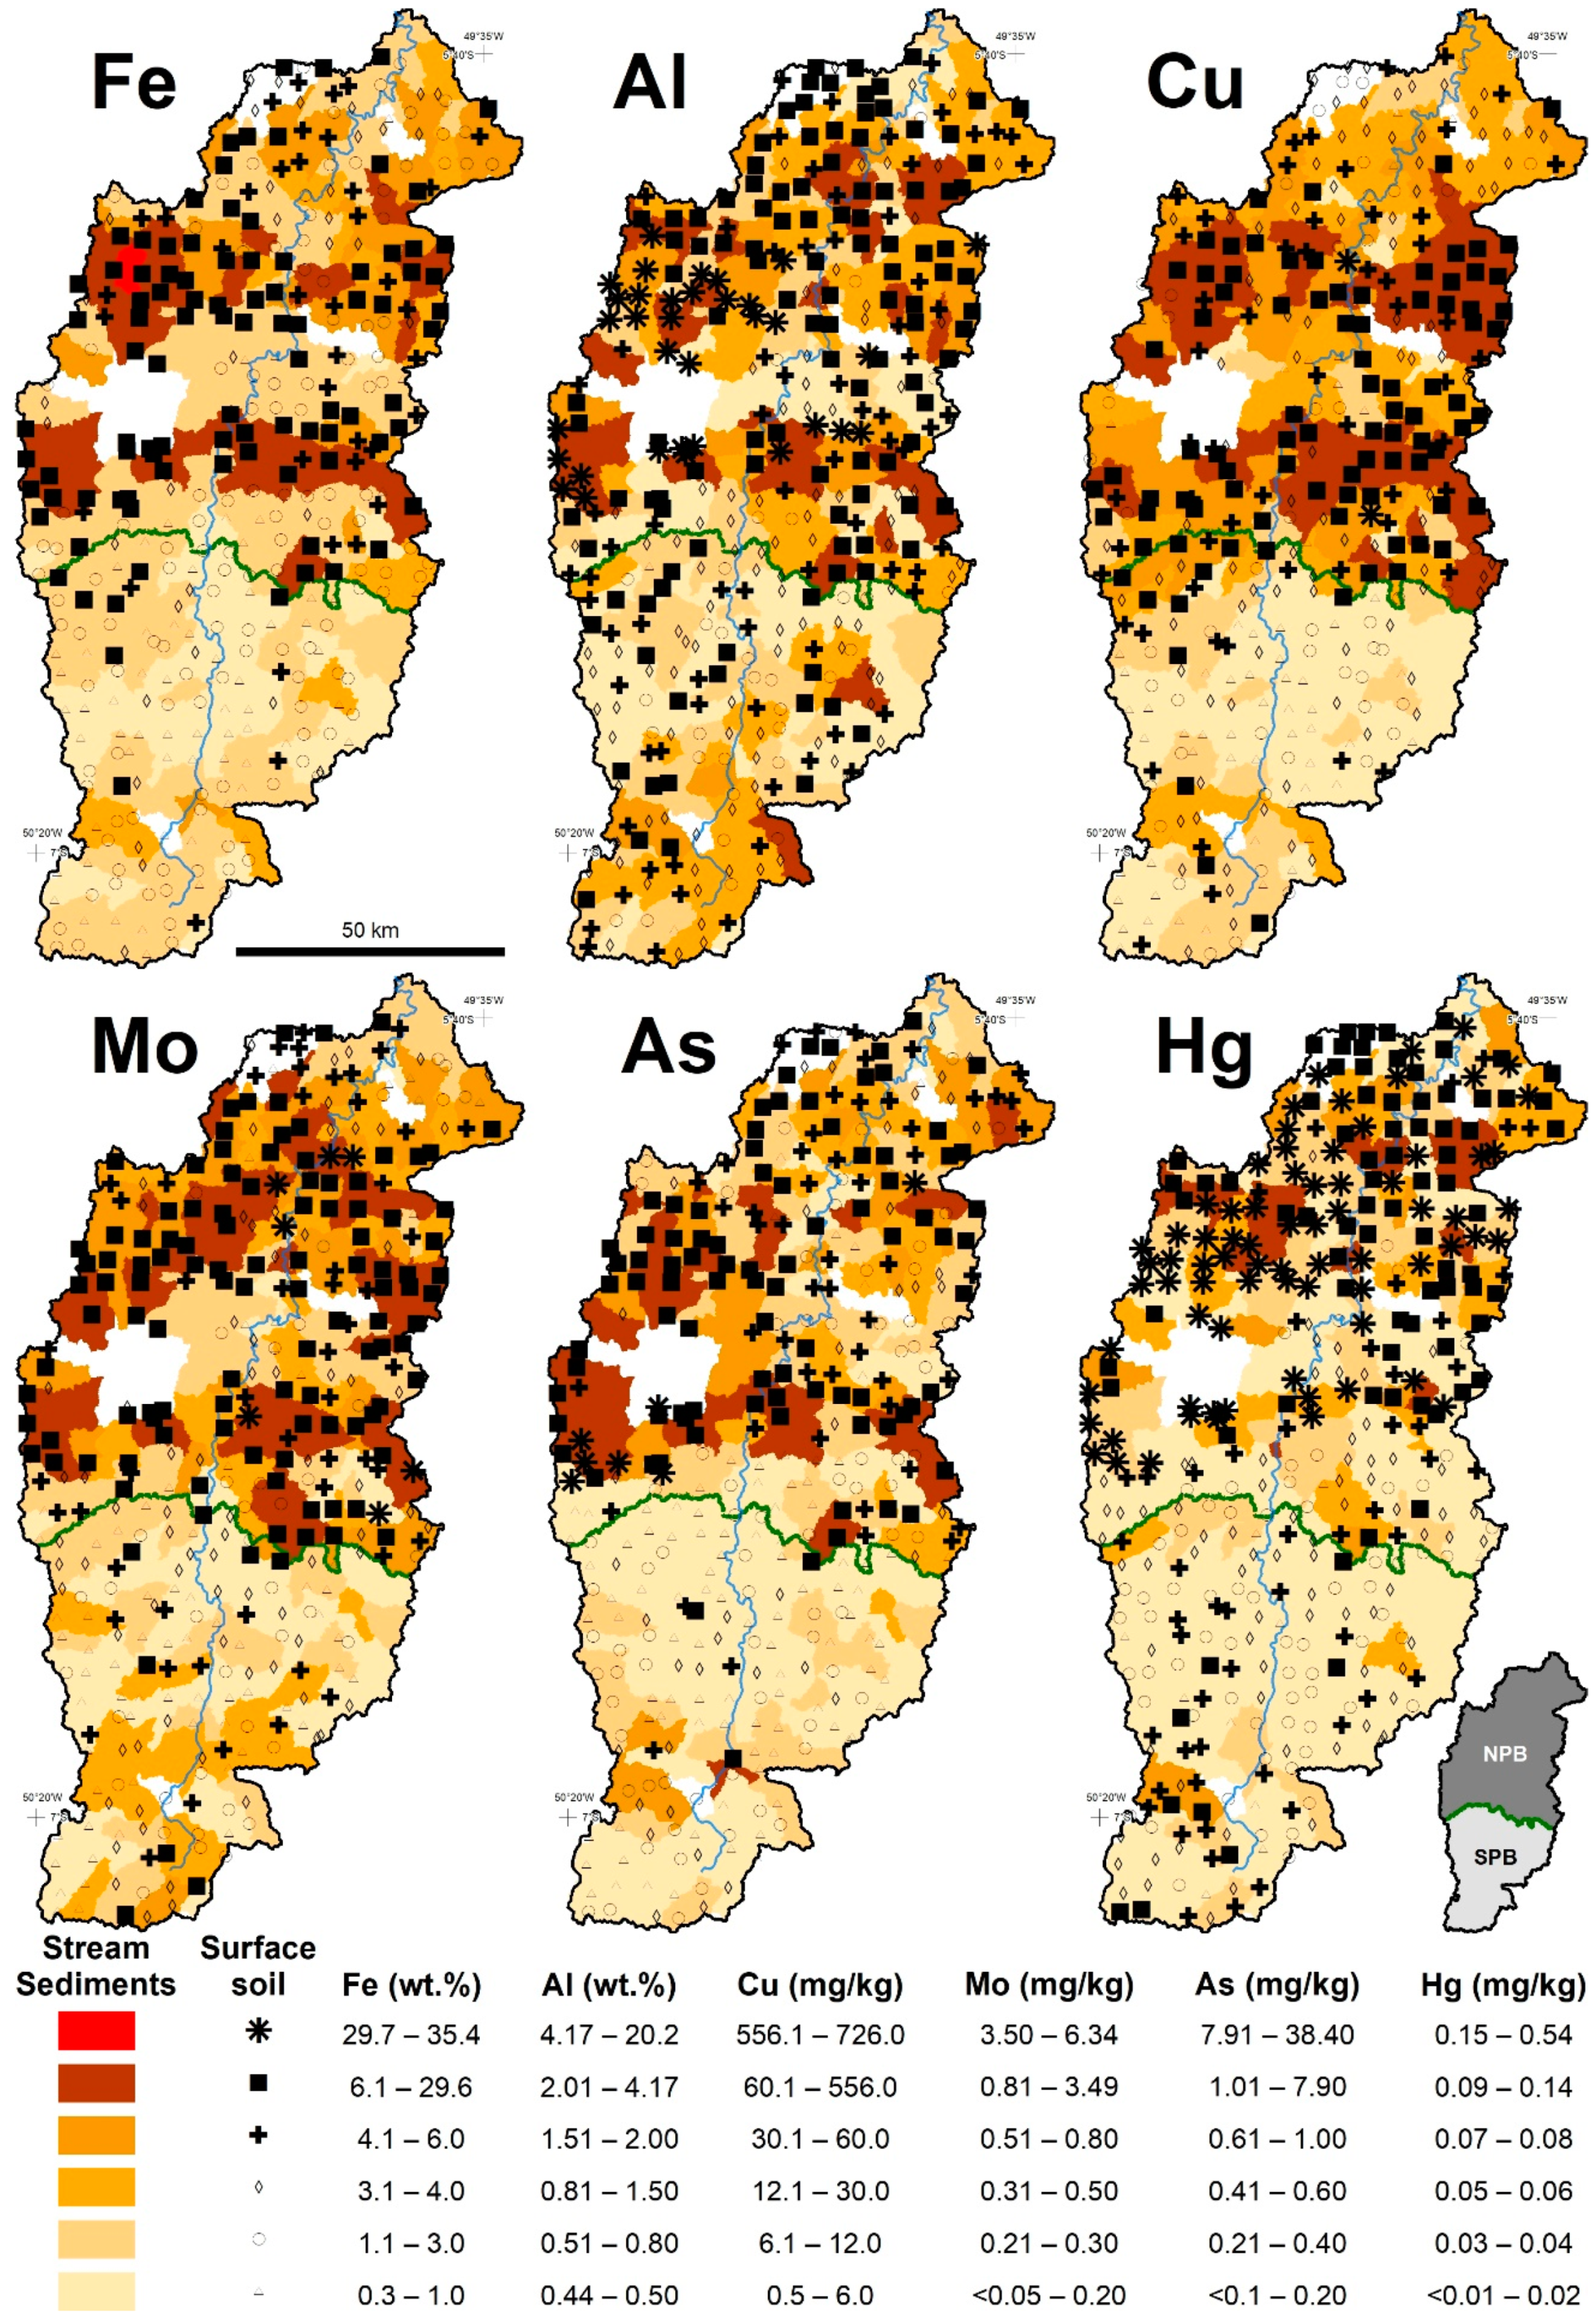
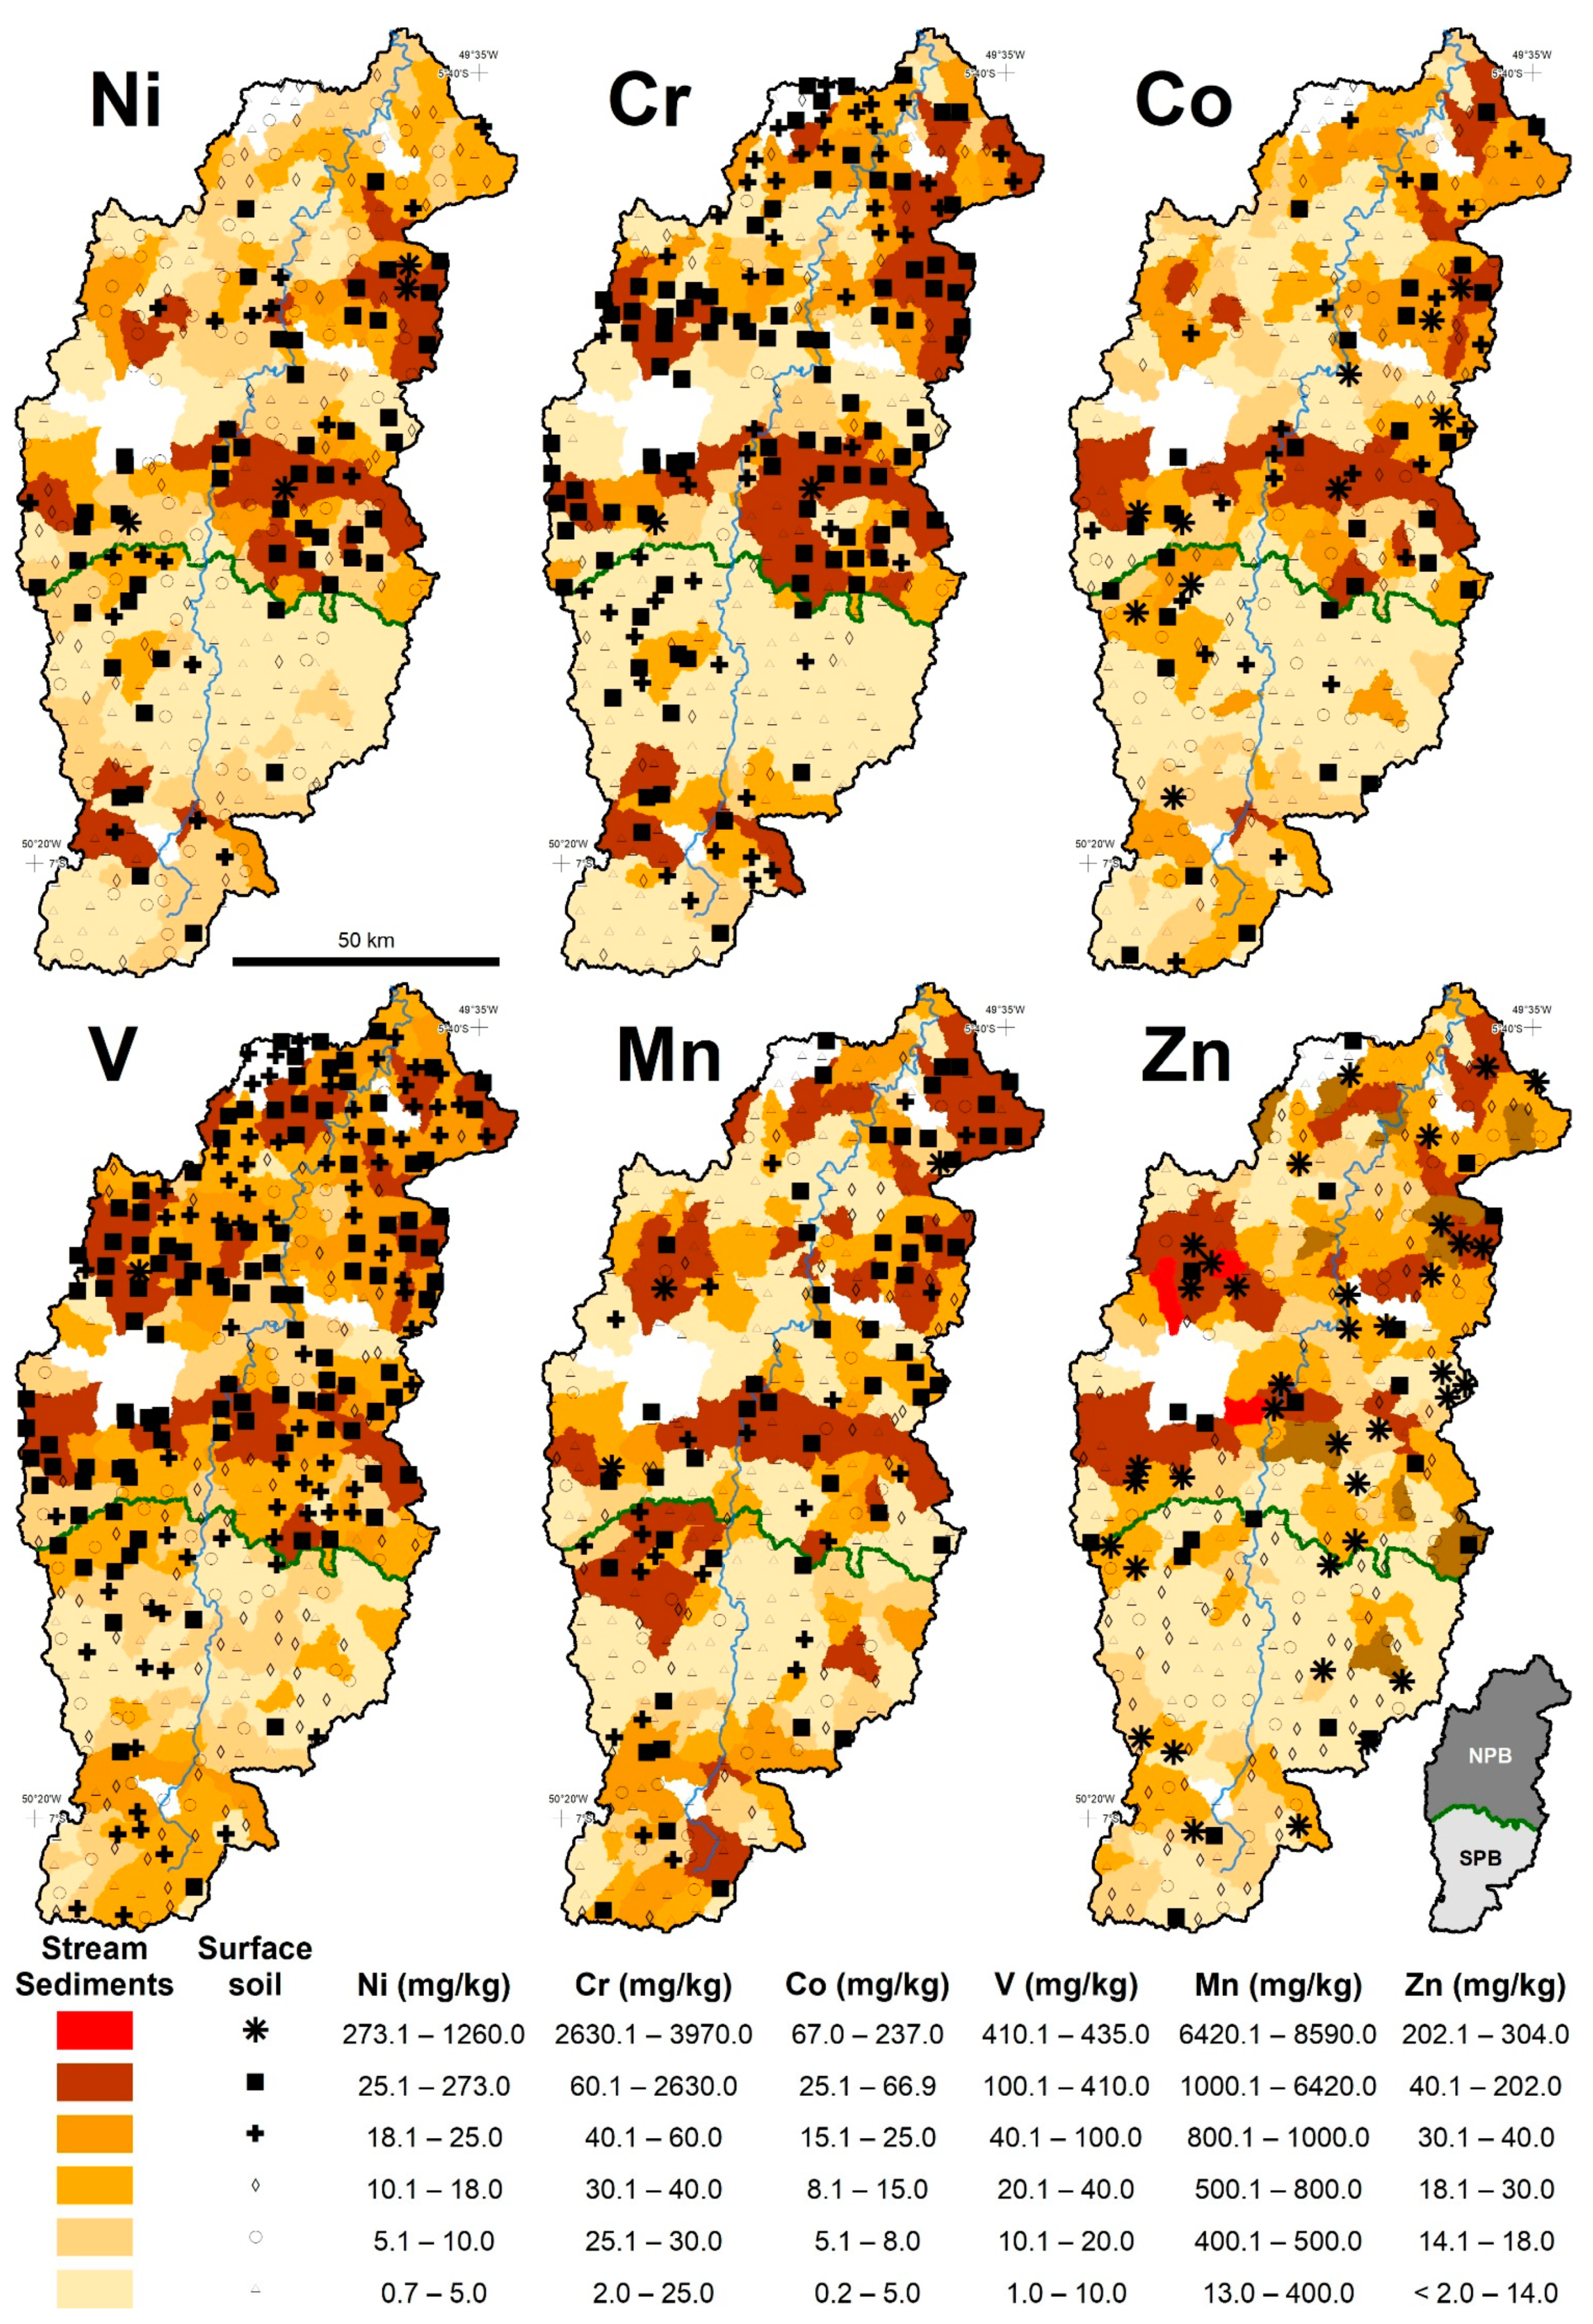
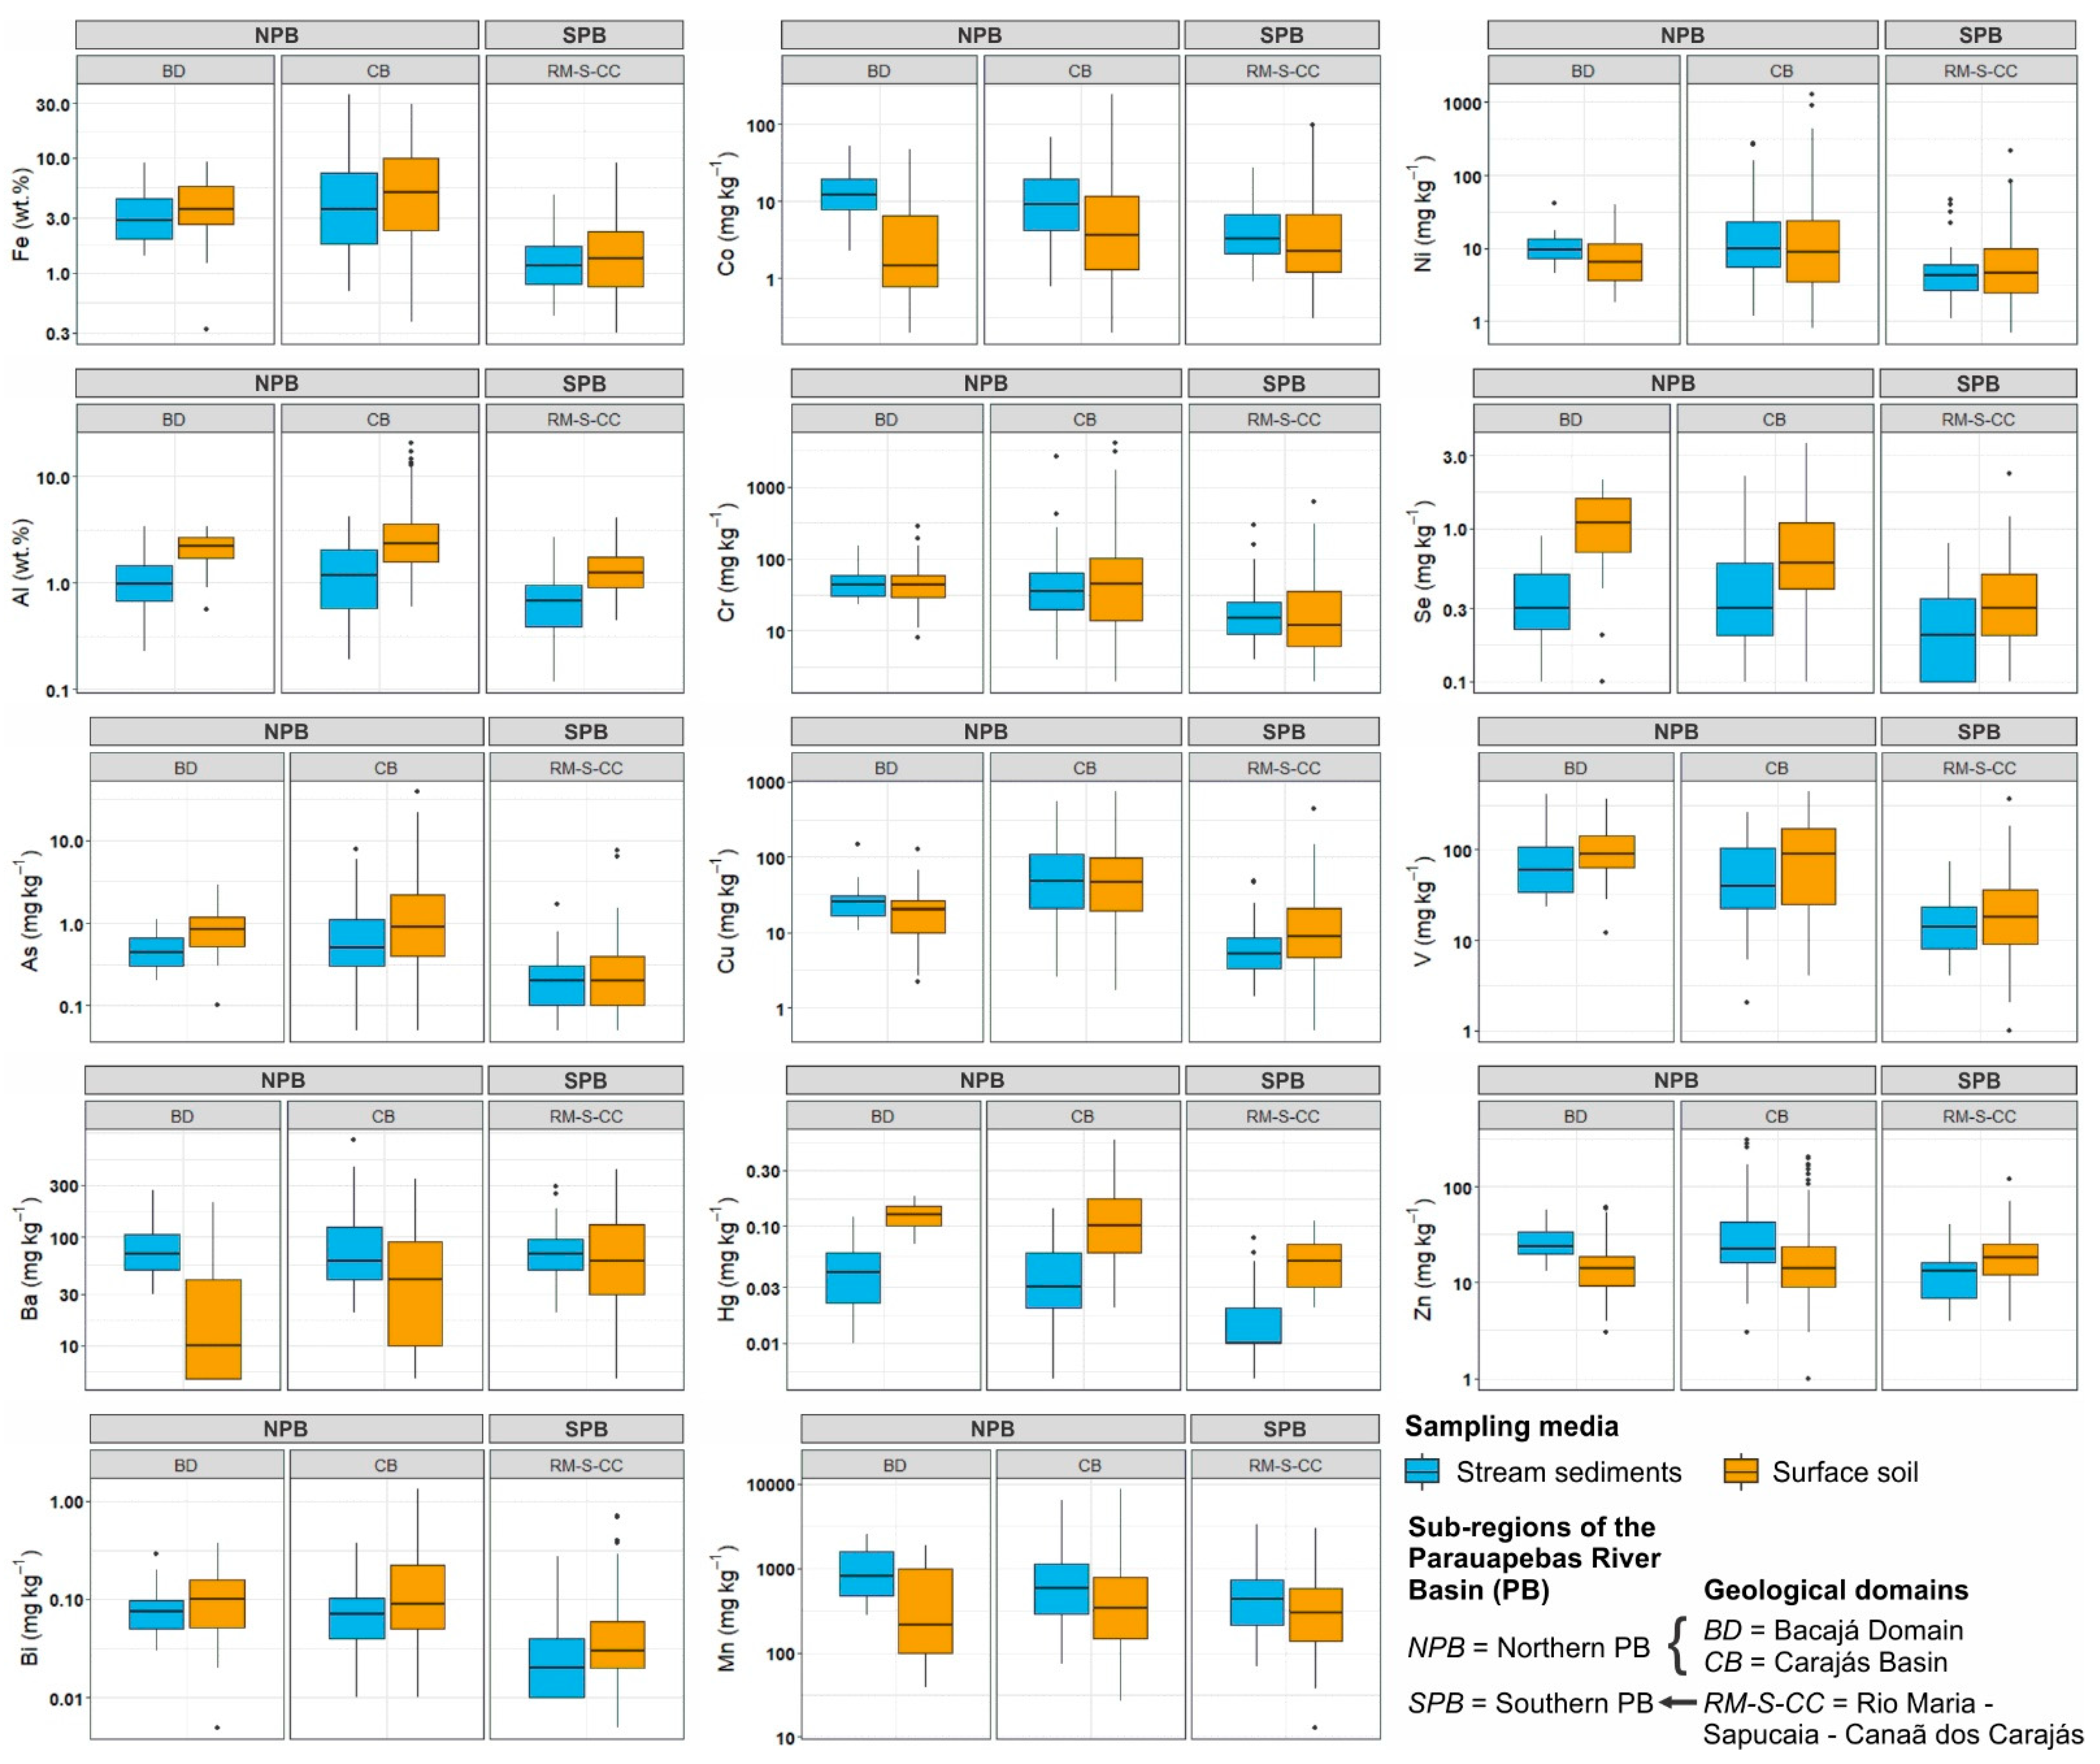
Spatial analyses were processed using the software ArcGIS 10.4.1, under the World Geodetic System 1984 (WGS84) datum. The construction of integrated stream sediment and soil geochemical maps was based on two techniques: (i) Catchment-based representation (polygon) for stream sediment data [53,54,55] which, simply involves attributing the element concentrations to their respective catchment watershed, with the sample collected at the outlet; (ii) Geochemical dot representation (point) for surface soil data, attributing the uni-element concentration to the sampling site [55,56]. The class intervals were defined according to the quantile method, usually applied to right-skewed distribution, commonly seen in geochemical data [57]. For the correct construction of integrated geochemical maps, the same class interval was used for the representation of the concentration (usually in mg kg−1, except for Fe and Al in wt.%) of a given element in soil and in stream sediment. Finally, spatial analyses using geoprocessing techniques (e.g., buffer, clip, intersect and merge) were eventually used for further interpretation.

4. Results

In this study, integrated soil and stream sediments geochemical maps are presented for selected elements (Fe, Al, Cu, Mo, As, and Hg in Figure 2; Ni, Cr, Co, V, Mn, and Zn in Figure 3). Additional geochemical maps for the remaining PTE (Ag, B, Ba, Bi, Cd, Pb, Sb, Se, Sn, and U) are provided in the supplementary material (Figure S1). In these maps, the catchment-based representation (polygons) was used to display the distribution of elements in stream sediment samples, whereas the point representation was used for soil samples.
The spatial distribution of each element (cf. Figure 2 and Figure 3, Figures S1 and S2) revealed a clear difference between the Northern PB (NPB) and Southern PB (SPB). The NPB region corresponds almost exactly to the BD and CB and the SPB to the RM-S-CC. The chemical compositions of soils and stream sediments from those regions are strongly influenced by the dominant lithologies occurring in their respective geological domains (Figure 1d). Boxplots for Fe, Al, and selected PTE (Figure 4) were constructed by taking into account the compositions of soil and stream sediment samples from the three different geological domains distinguished in the PB. Additional boxplots are provided in the supplementary material (Figure S3). It is apparent that the distributions of some elements (e.g., Al, As, Bi, and Cr; Figure 4) are similar in both BD and CB, representing the NPB, and contrast with that observed in the RM-S-CC domains that occupy the SPB. On the contrary, Cu spatial distribution exhibit remarkable differences among all geological domains (Figure 4).
In addition, the MWW test was carried to devaluate if the composition of soil and stream sediment samples from BD and CB are statistically similar. Table 1 summarizes the p-values of the MWW calculated for each element in surface soils and stream sediments separately. In these results, the null hypothesis states that there is no difference between the distribution of a given element in a given sampling media in BD and CB. By assuming a significance level (σ) of 0.05, the p-values below σ imply rejecting the null hypothesis and inform that the distributions of the respective element in BD and CB are statistically different. In summary, Al, Ag, As, Bi, Cr, Hg, Ni, Sn, V, and Zn presented similar distribution in both sampling medium; Fe, B, Ba, Cd, Co, Mo, Pb, Sb, Se, and U presented similar distribution only in stream sediments; Mn presented similar distribution only in soils, and Cu presented different distribution in both sampling medium.
The integrated evaluation of the data (geochemical maps, Figure 2 and Figure 3, Figures S1 and S2; boxplots, Figure 4 and Figure S3; and, MWW results, Table 1) highly indicates that the study area can be divided into two separate geochemical regions, the NPB and SPB. For this reason, the original data set was split into two subsets for further investigation. Table 2 summarizes the descriptive statistics (mean, SD, Min, Med, and Max) of the studied elements in surface soils and stream sediments in the entire PB (soils = 364 samples; stream sediments = 189 samples), which was retrieved from previous studies [24,58] using the same data set, and for each subregion, NPB (soils = 223 samples; stream sediments = 122 samples) and SPB (soils = 141 samples; stream sediments = 67 samples).
The use of intersection function under geoprocessing environment allowed plotting and merging of soil samples with stream sediment catchment areas. It is important to highlight that a single microcatchment, which is represented by only one stream sediment sample, can be merged to multiple soil samples, or even none in the rare cases of no collected samples in the catchment area. Scatter plots comparing the concentrations of selected elements in surface soil (y-axis) and stream sediment (x-axis) samples were constructed to verify a possible relationship between them by using linear regression analysis (Figure 5 and Figure S4). Spearman’s correlation coefficient (ρ) and p-value of the linear regression are presented. In general, the majority of the selected elements presented a significant correlation (p < 0.05), excepting for Cd, Ba, B, and Zn (p > 0.05; Figure S4). Three groups were observed: (i) Strongly (ρ ≥ 0.5) correlated materials: Fe, As, Cu, and U in Figure 5; Bi, Sn, Mo, and V in Figure S4; (ii) Moderately (0.49 < ρ ≤ 0.3) correlated materials: Hg, Ni, Cr, and Sb in Figure 5; (iii) Weakly (ρ ≤ 0.29) to non-significant (p > 0.05) correlated materials: Al, Mn, and Co in Figure 5; Se, Ag, Pb, Cd, Ba, B, and Zn in Figure S4.
In this study, geochemical threshold concentration values were determined for all 22 studied elements in soils and stream sediments, but contrarily to the approach adopted in previous studies [24,58], distinct threshold values for the NPB and SPB were calculated, by using a variety of statistical methods (MMAD, TIF, and percentile-based techniques, e.g., P98 and P95; Table 3). Threshold values of each individual subregion were then compared to threshold values proposed for the whole PB, determined in previous studies of soil [24] and stream sediments [58].

5. Discussion

5.1. Regional Geochemical Distribution of Fe, Al, and PTE in Soils and Stream Sediments

The geochemical signature of an element in a given sampling medium provides important information about external controlling conditions, either natural or anthropic. The geochemical maps for Fe, Al, and 20 PTE (Figure 2 and Figure 3, Figures S1 and S2) in the two-sampling media, as assessed by visual inspection, are notoriously similar. The composition of soils and stream sediments appears to be strongly controlled by bedrock lithologies in the area (Figure 1c), with evident differences between the north and south of the study area. Higher concentrations for the majority of the elements in both sampling media are observed in the NPB in comparison to SPB (Figure 1b).
The spatial distribution of these elements is well-documented in previous studies of soil [24,44] and stream sediment [45,58]. For instance, the concentrations of Fe, V, As (Figure 2) (±Cd, Sb and Ag; Figure S1) and relative concentrations of Al, Ba, Mn, and Zn (Figure 2 and Figure 3, Figure S2), along with two E-W corridors (tectonic trend of the region) in the NPB are controlled by the occurrences of Fe-Al-rich duricrusts, formed by the intense weathering of metamafic rocks and BIF of the Carajás Formation, which hosts the world-class Fe deposits (N4, N5, and S11D) of Carajás [61,62,63].
Similarly, the concentrations of Ni, Cr, Co, and ±V (Figure 3) are strongly controlled by the metavolcanic rocks of the Parauapebas Formation, generally intercalated with rocks from the Carajás Formation, and cross-cut by local mafic to ultramafic rocks of the Cateté Intrusive Suite (the Luanga Complex, located in the NE of the NPB; the Vermelho Complex, in the southern area of the NPB) [37,64]. Local anomalies also occur in the south of the SPB, due to the occurrences of Sapucaia greenstone belt [65].
The spatial distribution of Cu, Mo (Figure 2), and to a lesser extent Se (Figure S1) is a response of mineralization zones along two E-W corridors (northern and southern copper belts [27]) in the NPB, similarly observed for Fe and related elements. To some extent, higher concentrations of Se (Figure S1) were observed in stream sediments and, especially, in soils of the north of NPB, along the northern copper belt in comparison to the southern copper belt. This evidence indicates that these two corridors do not share common surface multi-element signatures, perhaps, due to different metallogenic evolution [27].
Uranium, Pb, and Sn tend to concentrate in quartz-feldspar rocks, such as granites and felsic granulites, particularly those with an alkaline tendency. In the NPB, the main sources for the enrichment of these elements are A-type granitoids (e.g., Estrela and Igarapé Gelado granites) and Paleoproterozoic anorogenic granites (e.g., Seringa and Serra dos Carajás granites) [38]. In addition, unusually high concentrations of Mn, Co, and Ba (Figure 3 and Figure S2) in soils and stream sediments and B in soils (Figure S1) were observed in the NW region of the SPB, under the influence of charnockitic rocks (Figure 1d) of the Diopside-Norite Pium unit [28].
Using integrated geochemical maps is important not only for understanding the regional distribution of a given element but also to compare two (or three) different sampling mediums in terms of concentration magnitude and source. Although, as described, the different lithologies of the area are the main source of enrichment for Fe, Al, and the 20 PTE. However, anthropogenic contributions cannot be disregarded and further studies should be conducted.

5.2. The Geochemical Compartmentation of PB as Subsidy to Territorial and Watershed Management

Watershed management is essential for planning the sustainable use of natural resources. It supports many kinds of human needs in terms of water consumption, food production, recreation, and most importantly the maintenance of ecologic function [66]. Each watershed has its own particularities, for instance, climate conditions, land use, human occupation, and, for the purpose of the present study, geochemical background. All these multidisciplinary concerns have increased the need of developing robust watershed-management strategies aiming for realistic environmental policies [67].
As presented in previous studies, the chemical composition of soils [24,44] and stream sediments [45] changes with the geological domain across the IRW, including the study area (Figure 1b). Nevertheless, minor differences were also observed between the BD and CB in terms of spatial distribution for many elements, as discussed previously. The boxplots for the studied elements (Figure 4 and Figure S3) display the difference among the geological domains of the PB area (Figure 1d), suggesting that many elements actually present similar distribution (e.g., Al, As, Bi, and Cr; Figure 4). For this reason, the element concentration in soil and stream sediment samples from these two domains were statistically compared using the MWW test (Table 1). The obtained results suggest that dividing the study area into NPB and SPB is statistically acceptable, at least for surface geochemical studies at a regional scale. However, the geochemical data of Cu in the PB represents a clear exception to this approach. Not only the MWW test revealed different statistical distribution between BD and CB (p-value < 0.05; cf. Table 1), but also the boxplots (Figure 4 and Figure S3) and the integrated geochemical map (Figure 2). The Cu signature in the PB is a clear response from highly mineralized areas that constitute a geochemical and metallogenic province [68], which cannot be generalized in terms of watershed management.

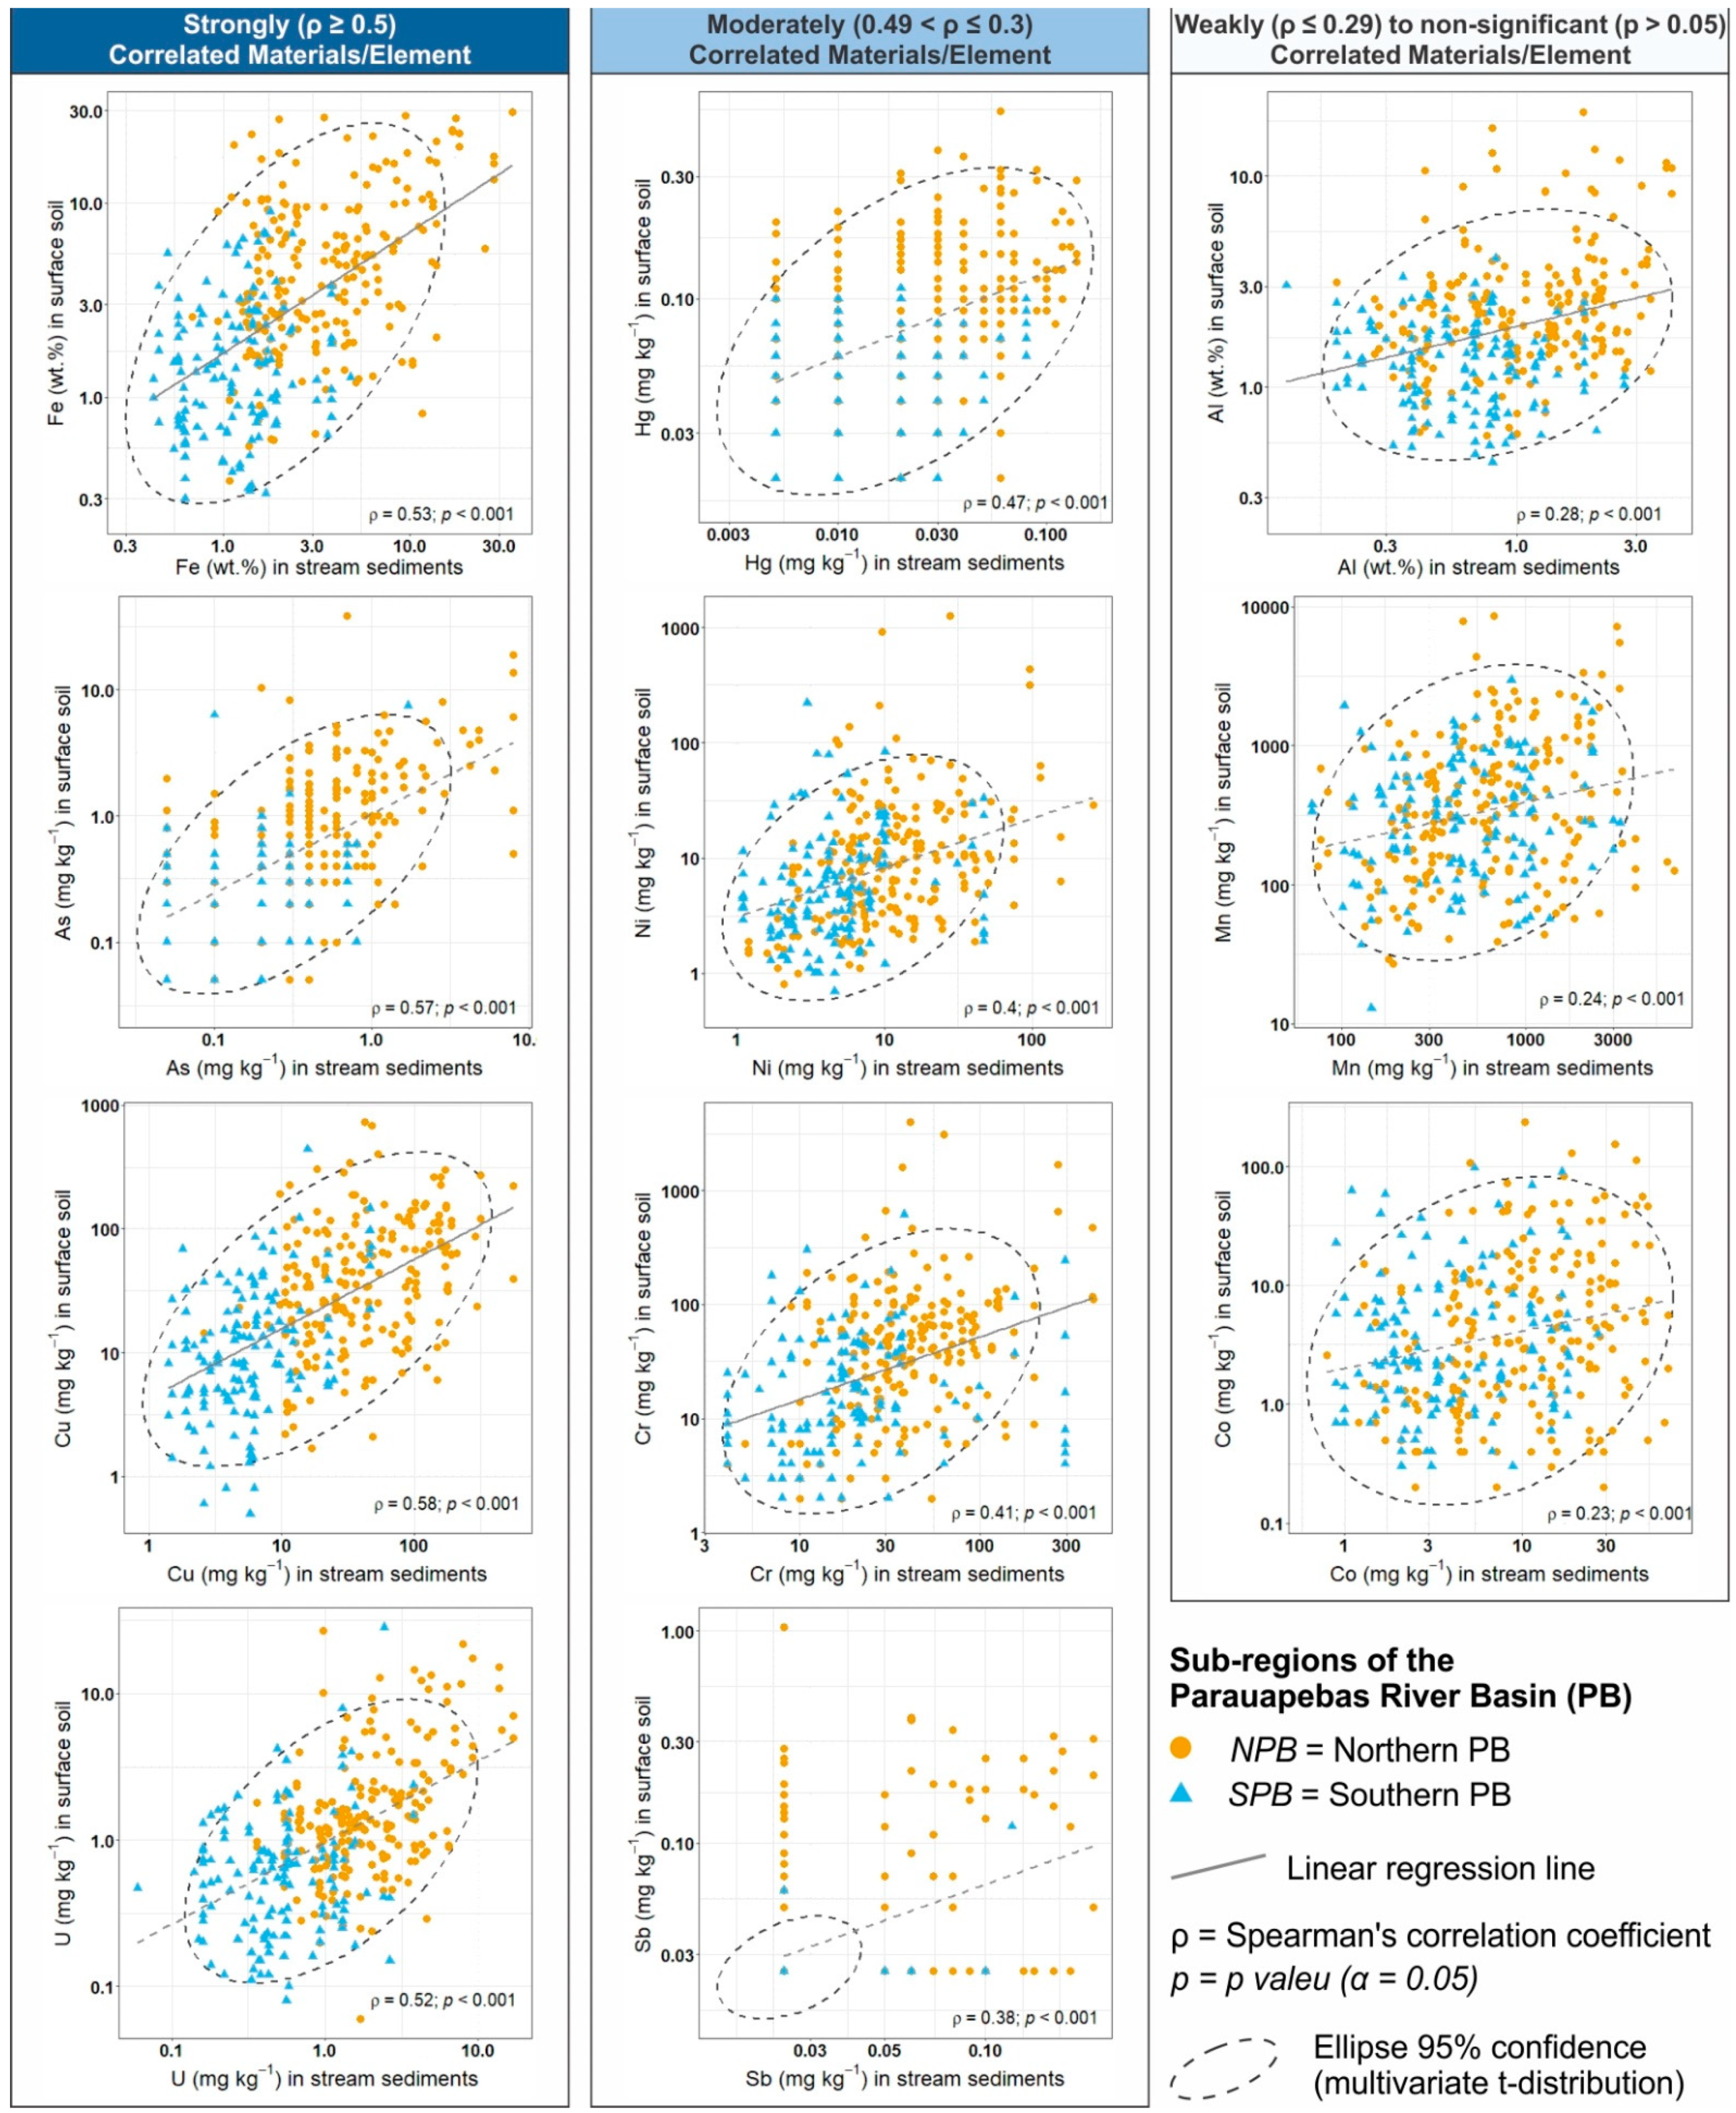
5.3. The Relationship between Surface Soil and Stream Sediment Geochemistry

A visual inspection of the boxplots (Figure 4 and Figure S3) and the comparison of descriptive statistics results (Table 2 and Table S2) revealed that element concentrations in soils are generally greater than in stream sediments of PB. This is particularly true for Fe, Al, Ag, As, B, Bi, Cd, Cr, Cu, Hg, Mo, Sb, V, Se, and Sn, and it is not observed for Ba, Co, Mn, Ni, Zn, Pb, and U. By using geoprocessing techniques, it was possible to identify the soil samples that are geographically located at a given catchment area, which is represented by a stream sediment sample collected at the outlet, and compare them. Scatter plots used to evaluate the relationship between surface soil and stream sediment samples revealed that these sampling media are strongly to moderately correlated for many elements (Fe, As, Bi, Cr, Cu, Hg, Mo, Ni, Sb, Sn, U, and V; Figure 5 and Figure S4), but weakly to other elements (Al, Ag, B, Ba, Cd, Co, Mn, Pb, Se, and Zn; Figure 5 and Figure S4). In terms of source apportionment, in the case of the elements with strong to moderate correlations the composition of soils and stream sediments seems to be both controlled by the bedrock lithologies or, alternatively, the soils themselves are the primary source for the constitution of stream sediment, driven by erosion processes that have been directly influenced by the deforestation in the area over the past decades [69]. The weak correlations may be due to three reasons: (i) Mineralogical sorting during hydrodynamic and sedimentation processes. For instance, Al is a major constituent of kaolinites, which is a naturally occurring mineral in the soils of the Amazon [70], but to a lesser extent in active river sediments; (ii) low sensitivity of the analytical method, which is clearly the case for Ag, B, Ba, Cd, and Se; (iii) Different sources contributing to the enrichment of an element in a given sampling media. For this case, Ba, Co, Mn, Pb, and Zn captured our attention because these elements are well-known for being part of important biogeochemical processes that take place in nature [71].

5.4. Geochemical Threshold Variation in Soils and Stream Sediments vs. Environmental Guidelines

The existence of solid legislations proposing reference-quality guideline values for different regions, demarked by considering a multidisciplinary approach, including the definition of geochemical compartments, instead of simply using political boundaries would be ideal. Under this context, the variation of the background concentrations in soils and stream sediments of the PB and the quality guideline values proposed by Brazilian environmental agencies [50,59,60] should be critically evaluated.
Firstly, the threshold values calculated by using statistical techniques widely applied in geochemical studies [72,73,74] pointed out different results among each statistical method (Table 3 and Table S3). These differences occur due to the statistical approach and the central criteria of the method, which is widely discussed in the literature [17,22,23,44,45]. In general, the highest background values were obtained by the TIF method, with several overestimated values (cf. Table 3 and Table S3). The P98 and P95 deliver threshold values by considering a fixed percentage of outliers, within the range of values in the data set, which is not entirely appropriate. Among the methods used herein to derive threshold concentration values, the MMAD appears to derive more consistent and realistic results. This conclusion has been also achieved in other studies [17,22,23]. For this reason, the following discussion will be addressed by using the MMAD results (Table 3 and Table S3).
The comparison of the threshold values, in both sampling media, between the NPB and the SPB regions revealed significant discrepancies. For instance, the threshold concentrations of Fe in soils of the NPB and SPB are 34.24 and 6.93 wt.%, respectively, and in stream sediment are 22.93 and 3.54 wt.%, respectively (Table 3). Similar behavior is observed for the majority of the studied elements (cf. Table 3 and Table S3). The differences observed in each region are a direct influence of the natural geological/geochemical variation, already described in this study, confirming the consistency of the results presented here.
The previous results demonstrated the existence of a large natural spatial variation of PTE in the territory of PB and indicated that establishing threshold values for the NPB and SPB regions is more adequate than assuming a uniform value for the entire PB. This conclusion is also relevant in terms of defining quality guideline values for large areas elsewhere. For instance, the comparison of threshold values in NPB and SPB (cf. Table 3 and Table S3) for some PTE [As (NPB = 2.3; SPB = 1.6), Cd (NPB = 0.16; SPB = 0.01), Pb (NPB = 24.4; SPB = 14.2), and Zn (NPB = 83; SPB = 47; all values in mg kg−1] contemplated in the Brazilian environmental resolution of stream sediments [60] shows that they have their threshold concentrations below the Level 1 (L1; also known as the Threshold Effect Level—TEL [75]) proposed by the National Council of the Environment (CONAMA) of Brazil [60] for the mentioned elements (cf. Table 3 and Table S3). Mercury exhibits a threshold value in NPB (0.23 mg kg−1) greater than the L1 (0.17 mg kg−1), but the referenced value in SPB (0.08 mg kg−1) is lower than L1. Nickel shows in NPB threshold value (56.4 mg kg−1) greater than the Level 2 (L2, also known as the Probable Effect Level—PEL [75]; L2 of Ni = 35.9 mg kg−1), but in the SPB the obtained value (12.6 mg kg−1) is lower than L1 (18 mg kg−1). The greatest differences were observed for Cu (482.4 mg kg−1) and Cr (160 mg kg−1), for which threshold values in the NPB are considerably greater than the L2 (Cu = 197; Cr = 90 mg kg−1). On the other hand, the threshold values in SPB for Cr (68 mg kg−1) are between the L2 and L1) (respectively, 90 mg kg−1 and 37.3 mg kg−1), and for Cu (20 mg kg−1) below L1 (35.7 mg kg−1).
The quality guidelines of soils in Brazil are based on two resolutions, a Federal resolution [50] applicable for the entire Brazilian territory, which presents Prevention Guideline Values (PGV), and a State resolution for the definition of Quality Reference Value (QRV), which corresponds to the geochemical background. In the absence of QRV for the State of Pará (PA), where the PB is situated, the State Secretariat of the Environment and Sustainability (SEMAS-PA) adopted for the Pará territory the same QRV presented by the São Paulo Sanitation Technology Company (CETESB) [59], derived for the State of São Paulo.
Firstly, it should be emphasized that it is profoundly inadequate to establish geochemical background values for a given area (e.g., the PB situated in the State of Pará) based on values of another region (e.g., the State of São Paulo), with completely different environmental, geological and geochemical characteristics. This is clear when comparing the threshold values of the PTE with the QRV proposed by the State resolution [59]. Among the 14 PTE contemplated in the resolution, ten (As, Ba, Co, Cr, Cu, Hg, Mo, Ni, Pb, and Se) presented generally, in both NPB and SPB, higher threshold values in comparison to the QRV. From this group, when compared to the PGV, which values are somewhat higher than those of QRV (Table 3 and Table S3), the discrepancies with assumed background values of PB are reduced. In contrast, Ag, Cd, and Zn presented lower threshold values than the proposed QRV and PGV, whereas Se showed in NPB and SPB background values higher than QRV and lower than PGV (Table 3 and Table S3).
Secondly, instead of defining realistic threshold values for the entire State and some relevant areas, it appears that environmental agencies tend to define even more conservative QRV values, which is clearly seen by comparing the QRV and PGV values (Table 3 and Table S3). It is highly recommended that new QRV values should be established for the different large geological domains of the State of Pará, in particular for the Carajás region, by using soil samples from the area of investigation and considering the complexity of the geological setting, as similarly conducted in previous studies in the State of Pará [76,77].
The issues addressed above show how understanding the variation of the geochemical background is important for territorial and watershed management. Therefore, the source of the anomalies of the PTE needs to be carefully investigated on a case-by-case basis, considering the local scenario (geology, land use, possible anthropic interventions). It is not demonstrated that high concentrations of some PTE, above the threshold values, are indeed influenced by anthropogenic activities. In the case of PB, the majority of the soil and stream sediment samples with values above the threshold is actually due to bedrock lithologies and hydrothermal mineralized zones (e.g., northern and southern copper belts) that naturally occur in the area. This reinforces the need for new environmental resolutions, which consider the regional characteristics and can thus provide more realistic guideline values.

6. Conclusions

Soils and stream sediments of the PB are strongly influenced by the geological environment of the region. The geochemical maps revealed substantial differences between the NPB and the SPB regions. At the regional scale, the local anomalies are mostly influenced by the bedrock lithologies rather than by any anthropogenic impact. Significant evidence has shown that the metavolcanosedimentary rocks of the CB and, particularly, the mineralizations along the northern and southern Cu belts in the NPB are the main source for several anomalous concentrations of PTE in both sampling media. Considering the elements under investigation in the PB area, the geochemical compositions of soils and, especially, stream sediments of the BD and CB are statistically similar. The soils and stream sediments are strongly to moderately correlated for many elements (Fe, As, Bi, Cr, Cu, Hg, Mo, Ni, Sb, Sn, U, and V), which suggest the same rock source or, in some cases, the soils themselves as the primary source for the constitution of stream sediments, driven by erosion processes and intensified by the deforestation in the area. The comparison between new statistically derived threshold values of the NPB and SPB regions with the threshold values of the whole PB and to quality guidelines proposed by Brazilian environmental agencies demonstrates that a uniform value of quality guideline is not adequate, because it does not consider the natural geological/geochemical variation of the area. For this reason, geochemical compartments, instead of political boundaries, should be considered prior to defining new guideline values. The integrated assessment used here is easily replicated and remarkably useful for territorial and watershed management, important for the Sustainable Development Goals.

Supplementary Materials

The following are available online at https://0-www-mdpi-com.brum.beds.ac.uk/2571-8789/5/1/21/s1, Figure S1 Geochemical maps for Ag, B, Cd, Sb, and Se; Figure S2: Geochemical maps for Ba, Bi, Pb, Sn, and U; Figure S3: Boxplots for 8 potentially toxic elements (PTE; Ag, B, Cd, Mo, Sb, Sn, Pb, and U); Figure S4: Scatter plot comparing the concentrations of the studied elements in surface soil and stream sediment samples; Table S1: Descriptive statistics for 10 potentially toxic elements (PTE; Ag, B, Ba, Bi, Cd, Pb, Sb, Se, Sn, and U) in surface soils and stream sediments; Table S2. Geochemical threshold values for 10 potentially toxic elements (PTE; Ag, B, Ba, Bi, Cd, Pb, Sb, Se, Sn, and U) in surface soils and stream sediments.

Author Contributions

Conceptualization, D.S.; Data curation, G.N.S.; Formal analysis, G.N.S.; Funding acquisition, R.D.; Investigation, D.d.L.F.; Methodology, G.N.S.; Supervision, R.D.; Validation, P.K.S.; Writing—original draft, G.N.S. and D.d.L.F.; Writing—review & editing, P.K.S., R.D. and D.S. All authors have read and agreed to the published version of the manuscript.

Funding

This study was financed mostly with resources of the ITV (Instituto Tecnológico Vale) and Gerência Ambiental de Ferrosos Norte (Vale S.A). This study was financed in part by the Coordenação de Aperfeiçoamento de Pessoal de Nível Superior—Brasil (CAPES)—Finance Code 001. This work was partially supported by Conselho Nacional de Desenvolvimento Científico e Tecnológico—CNPq (306108/2014-3 and 304648/2019-1 to RD; 443247/2015-3 and 402727/2018-5 projects coordinated by RD).

Institutional Review Board Statement

Not applicable.

Informed Consent Statement

Not applicable.

Data Availability Statement

The data presented in this study are available on request from the corresponding author. The data are not publicly available due to privacy restrictions.

Acknowledgments

The Instituto Tecnológico Vale provided the geochemical dataset of the Itacaiúnas Geochemical Mapping and Background Project. The authors acknowledge Pedro Walfir Martins e Souza Filho, Wilson da Rocha Nascimento Junior and Jair da Silva Ferreira Júnior for the project conceptualization and sampling design; Marcio Sousa da Silva and Carlos Augusto de Medeiros Filho for the management of the field work and sampling. Marlene F. da Costa (Vale S.A.) for the financial support to the project development.

Conflicts of Interest

The authors declare no conflict of interest.

References

  1. Caritat, P.; Cooper, M. A continental-scale geochemical atlas for resource exploration and environmental management: The National Geochemical Survey of Australia. Geochem. Explor. Environ. Anal. 2016, 16, 3–13. [Google Scholar] [CrossRef]
  2. Cheng, Z.; Xie, X.; Yao, W.; Feng, J.; Zhang, Q.; Fang, J. Multi-element geochemical mapping in Southern China. J. Geochem. Explor. 2014, 139, 183–192. [Google Scholar] [CrossRef] [Green Version]
  3. Plant, J.; Smith, D.; Smith, B.; Williams, L. Environmental geochemistry at the global scale. Appl. Geochem. 2001, 16, 1291–1308. [Google Scholar] [CrossRef] [Green Version]
  4. Darnley, A.G.; Bjiirklund, A.; Belviken, B.; Gustavsson, N.; Koval, P.V.; Plant, J.A.; Steenfelt, A.; Tauchid, M.; Xuejing, X.; Xie, X. A Global Geochemical Database for Environmental and Resource Management. Recommendations for International Geochemical Mapping—Final Report of IGCP Project 259; UNESCO Publishing: Paris, France, 1995; ISBN 923103085X. [Google Scholar]
  5. Albanese, S.; De Vivo, B.; Lima, A.; Cicchella, D. Geochemical background and baseline values of toxic elements in stream sediments of Campania region (Italy). J. Geochem. Explor. 2007, 93, 21–34. [Google Scholar] [CrossRef]
  6. Gałuszka, A. Different approaches in using and understanding the term “Geochemical background”—Practical implications for environmental studies. Pol. J. Environ. Stud. 2007, 16, 389–395. [Google Scholar]
  7. Gałuszka, A.; Migaszewski, Z.M.; Zalasiewicz, J. Assessing the Anthropocene with geochemical methods. Geol. Soc. London Spec. Publ. 2014, 395, 221–238. [Google Scholar] [CrossRef]
  8. Yuan, G.L.; Sun, T.H.; Han, P.; Li, J. Environmental geochemical mapping and multivariate geostatistical analysis of heavy metals in topsoils of a closed steel smelter: Capital Iron & Steel Factory, Beijing, China. J. Geochem. Explor. 2013, 130, 15–21. [Google Scholar] [CrossRef]
  9. Smith, S.L.; MacDonald, D.D.; Keenleyside, K.A.; Ingersoll, C.G.; Field, L.J. A preliminary evaluation of sediment quality assessment values for freshwater ecosystems. J. Great Lakes Res. 1996, 22, 624–638. [Google Scholar] [CrossRef]
  10. Zhuang, W.; Gao, X. Integrated Assessment of Heavy Metal Pollution in the Surface Sediments of the Laizhou Bay and the Coastal Waters of the Zhangzi Island, China: Comparison among Typical Marine Sediment Quality Indices. PLoS ONE 2014, 9, e94145. [Google Scholar] [CrossRef] [PubMed]
  11. Pereira, V.; Inácio, M.; Ferreira, A.; Pinto, M. Geochemical regional surveys: Comparative analysis of data from soils and stream sediments. In Proceedings of the 19th World Congress of Soil Science, Soil Solutions for a Changing World; International Union of Soil Sciences: Brisbane, Australia, 2010; p. 4. [Google Scholar]
  12. Reimann, C. Comparison of stream sediment and soil sampling for regional exploration in the eastern Alps, Austria. J. Geochem. Explor. 1988, 31, 75–85. [Google Scholar] [CrossRef]
  13. Deschamps, E.; Ciminelli, V.S.T.; Lange, F.T.; Matschullat, J.; Raue, B.; Schmidt, H. Soil and sediment geochemistry of the iron quadrangle, Brazil the case of arsenic. J. Soils Sediments 2002, 2, 216–222. [Google Scholar] [CrossRef]
  14. Demetriades, A.; Smith, D.; Wang, X. General concepts of geochemical mapping at global, regional, and local scales for mineral exploration and environmental purposes. Geochim. Bras. 2018, 32, 136–179. [Google Scholar] [CrossRef]
  15. Licht, O. Geochemical background—What a complex meaning has such a simple expression! Geochim. Bras. 2020, 34, 161–175. [Google Scholar] [CrossRef]
  16. Burenkov, E.; Golovin, A.; Morozova, I.; Filatov, E. Multi-purpose geochemical mapping (1:1,000,000) as a basis for the integrated assessment of natural resources and ecological problems. J. Geochem. Explor. 1999, 66, 159–172. [Google Scholar] [CrossRef]
  17. Matschullat, J.; Ottenstein, R.; Reimann, C. Geochemical background—Can we calculate it? Environ. Geol. 2000, 39, 990–1000. [Google Scholar] [CrossRef]
  18. Reimann, C.; Garrett, R.G. Geochemical background—Concept and reality. Sci. Total Environ. 2005, 350, 12–27. [Google Scholar] [CrossRef]
  19. Reimann, C.; Filzmoser, P.; Garrett, R.G. Background and threshold: Critical comparison of methods of determination. Sci. Total Environ. 2005, 346, 1–16. [Google Scholar] [CrossRef]
  20. Reimann, C.; Caritat, P. Distinguishing between natural and anthropogenic sources for elements in the environment: Regional geochemical surveys versus enrichment factors. Sci. Total Environ. 2005, 337, 91–107. [Google Scholar] [CrossRef]
  21. Johnson, C.C.; Demetriades, A. Urban Geochemical Mapping: A Review of Case Studies in this Volume. In Mapping the Chemical Environment of Urban Areas; John Wiley & Sons, Ltd.: Hoboken, NJ, USA, 2011; pp. 7–27. [Google Scholar] [CrossRef] [Green Version]
  22. Reimann, C.; Caritat, P. Establishing geochemical background variation and threshold values for 59 elements in Australian surface soil. Sci. Total Environ. 2017, 578, 633–648. [Google Scholar] [CrossRef] [Green Version]
  23. Reimann, C.; Fabian, K.; Birke, M.; Filzmoser, P.; Demetriades, A.; Négrel, P.; Oorts, K.; Matschullat, J.; de Caritat, P.; Albanese, S.; et al. GEMAS: Establishing geochemical background and threshold for 53 chemical elements in European agricultural soil. Appl. Geochem. 2018, 88, 302–318. [Google Scholar] [CrossRef] [Green Version]
  24. Sahoo, P.K.; Dall’Agnol, R.; Salomão, G.N.; Ferreira Junior, J.S.; Silva, M.S.; Martins, G.C.; Souza Filho, P.W.M.; Powell, M.A.; Maurity, C.W.; Angelica, R.S.; et al. Source and background threshold values of potentially toxic elements in soils by multivariate statistics and GIS-based mapping: A high density sampling survey in the Parauapebas basin, Brazilian Amazon. Environ. Geochem. Health 2020, 42, 255–282. [Google Scholar] [CrossRef] [PubMed]
  25. Feio, G.R.L.; Dall’Agnol, R.; Dantas, E.L.; Macambira, M.J.B.; Santos, J.O.S.; Althoff, F.J.; Soares, J.E.B. Archean granitoid magmatism in the Canaã dos Carajás area: Implications for crustal evolution of the Carajás Province, Amazonian Craton, Brazil. Precambrian Res. 2013, 227, 157–185. [Google Scholar] [CrossRef]
  26. Marangoanha, B.; Oliveira, D.C.; Oliveira, V.E.S.; Galarza, M.A.; Lamarão, C.N. Neoarchean A-type granitoids from Carajás province (Brazil): New insights from geochemistry, geochronology and microstructural analysis. Precambrian Res. 2019, 324, 86–108. [Google Scholar] [CrossRef]
  27. Moreto, C.P.N.; Monteiro, L.V.S.; Xavier, R.P.; Creaser, R.A.; DuFrane, S.A.; Tassinari, C.C.G.; Sato, K.; Kemp, A.I.S.; Amaral, W.S. Neoarchean and Paleoproterozoic iron oxide-copper-gold events at the Sossego deposit, Carajás Province, Brazil: Re-Os and U-Pb geochronological evidence. Econ. Geol. 2015, 110, 809–835. [Google Scholar] [CrossRef]
  28. Vasquez, M.L.; Sousa, C.S.; Carvalho, K.M.A. Mapa Geológico e de Recursos Minerais do Estado do Pará, escala 1:1.000.000. Programa Geologia do Brasil (PGB), Integração, Atualização e Difusão de Dados da Geologia do Brasil, Mapas Geológicos Estaduais; Serviço Geológico do Brasil (CPRM): Belém, Brasil, 2008. [Google Scholar]
  29. Barros, C.E.M.; Sardinha, A.S.; Barbosa, J.P.O.; Macambira, M.J.B.; Barley, P.; Boullier, A. Structure, petrology, geochemistry and zircon U/Pb and Pb/Pb geochronology of the synkinematic Archean (2.7 Ga) A-type Granities from the Carajás Metallogenic Province, Northern Brazil. Can. Mineral. 2009, 47, 1423–1440. [Google Scholar] [CrossRef]
  30. Dall’Agnol, R.; Cunha, I.R.V.; Guimarães, F.V.; Oliveira, D.C.; Teixeira, M.F.B.; Feio, G.R.L.; Lamarão, C.N. Mineralogy, geochemistry, and petrology of Neoarchean ferroan to magnesian granites of Carajás Province, Amazonian Craton: The origin of hydrated granites associated with charnockites. Lithos 2017, 277, 3–32. [Google Scholar] [CrossRef]
  31. Mansur, E.T.; Ferreira Filho, C.F. Chromitites from the Luanga Complex, Carajás, Brazil: Stratigraphic distribution and clues to processes leading to post-magmatic alteration. Ore Geol. Rev. 2017, 90, 110–130. [Google Scholar] [CrossRef]
  32. Marangoanha, B.; Oliveira, D.C.; Dall’Agnol, R. The Archean granulite-enderbite complex of the northern Carajás province, Amazonian craton (Brazil): Origin and implications for crustal growth and cratonization. Lithos 2019, 350–351, 105275. [Google Scholar] [CrossRef]
  33. Rosa, W.D. Complexos Acamadados da Serra da Onça e Serra do Puma: Geologia e Petrologia de Duas Intrusões Máfico-ultramáficas com Sequência de Cristalização Distinta na Província Arqueana de Carajás, Brasil. Master’s Thesis, Universidade de Brasília, Brasília, Brazil, 2014. [Google Scholar]
  34. Gibbs, A.K.; Wirth, K.R.; Hirata, K.H.; Olszewski Junior, W.J. Age and composition of the Grao Para Group volcanics, Serra dos Carajas, Brazil. Rev. Bras. Geocienc. 1986, 16, 201–211. [Google Scholar] [CrossRef]
  35. Martins, P.L.G.; Toledo, C.L.B.; Silva, A.M.; Chemale, F.; Santos, J.O.S.; Assis, L.M. Neoarchean magmatism in the southeastern Amazonian Craton, Brazil: Petrography, geochemistry and tectonic significance of basalts from the Carajás Basin. Precambrian Res. 2017, 302, 340–357. [Google Scholar] [CrossRef]
  36. Sardinha, A.S.; Barros, C.E.M.; Krymsky, R. Geology, geochemistry, and U-Pb geochronology of the Archean (2.74 Ga) Serra do Rabo granite stocks, Carajás Metallogenetic Province, northern Brazil. J. S. Am. Earth Sci. 2006, 20, 327–339. [Google Scholar] [CrossRef]
  37. Mansur, E.T.; Ferreira Filho, C.F.; Oliveira, D.P.L. The Luanga deposit, Carajás Mineral Province, Brazil: Different styles of PGE mineralization hosted in a medium-size layered intrusion. Ore Geol. Rev. 2020, 103340. [Google Scholar] [CrossRef]
  38. Dall’Agnol, R.; Teixeira, N.P.; Rämö, O.T.; Moura, C.A.V.; Macambira, M.J.B.; Oliveira, D.C. Petrogenesis of the Paleoproterozoic rapakivi A-type granites of the Archean Carajás metallogenic province, Brazil. Lithos 2005, 80, 101–129. [Google Scholar] [CrossRef]
  39. Machado, N.; Lindenmayer, Z.G.; Krogh, T.E.; Lindenmayer, D. U-Pb geochronology of Archean magmatism and basement reactivation in the Carajás area, Amazon shield, Brazil. Precambrian Res. 1991, 49, 329–354. [Google Scholar] [CrossRef]
  40. Teixeira, M.F.B.; Dall’Agnol, R.; Santos, J.O.S.; Kemp, A.; Evans, N. Petrogenesis of the Paleoproterozoic (Orosirian) A-type granites of Carajás Province, Amazon Craton, Brazil: Combined in situ Hf O isotopes of zircon. Lithos 2019, 332–333, 1–22. [Google Scholar] [CrossRef]
  41. Oliveira, F.A.; Almeida, J.A.C.; Figueira, R.L. Magnetic petrology of rocks of the Novolândia Granulite, Cruzeiro do Sul Village, Bacajá Domain. Rev. Sumaúma 2018, 10, 61–74. [Google Scholar]
  42. Macambira, M.J.B.; Vasquez, M.L.; Silva, D.C.C.; Galarza, M.A.; Barros, C.E.M.; Camelo, J.F. Crustal growth of the central-eastern Paleoproterozoic domain, SW Amazonian Craton: Juvenile accretion vs. reworking. J. S. Am. Earth Sci. 2009, 27, 235–246. [Google Scholar] [CrossRef]
  43. Souza-Filho, P.W.M.; Sahoo, P.K.; Silva, M.S.; Medeiros Filho, C.A.; Dall’Agnol, R.; Ferreira Junior, J.S.; Nascimento-Junior, W.; Silva, G.S.; Salomão, G.N.; Sarracini, F.; et al. General guidelines for baselines mapping and geochemical background in the Itacaiúnas River watershed, Carajás Mineral Province, Brazilian Amazon. J. S. Am. Earth Sci. 2020. submitted. [Google Scholar]
  44. Sahoo, P.K.; Dall’Agnol, R.; Salomão, G.N.; Ferreira Junior, J.S.F.; Silva, M.S.; Souza Filho, P.W.M.; Costa, M.L.; Angélica, R.S.; Medeiros Filho, C.A.; Costa, M.F.; et al. Regional-scale mapping for determining geochemical background values in soils of the Itacaiúnas River Basin, Brazil: The use of compositional data analysis (CoDA). Geoderma 2020, 376, 114504. [Google Scholar] [CrossRef]
  45. Salomão, G.N.; Dall’Agnol, R.; Sahoo, P.K.; Angélica, R.S.; Medeiros Filho, C.A.; Ferreira Júnior, J.S.S.; Silva, M.S.S.; e Souza Filho, P.W.M.; Nascimento Junior, W.R.R.; Costa, M.F.; et al. Geochemical mapping in stream sediments of the Carajás Mineral Province: Background values for the Itacaiúnas River watershed, Brazil. Appl. Geochem. 2020, 118, 104608. [Google Scholar] [CrossRef]
  46. Sahoo, P.K.; Dall’Agnol, R.; Salomão, G.N.; Ferreira Junior, J.S.; Silva, M.S.; Souza Filho, P.W.M.; Powell, M.A.; Angélica, R.S.; Pontes, P.R.; Costa, M.F.; et al. High resolution hydrogeochemical survey and estimation of baseline concentrations of trace elements in surface water of the Itacaiúnas River Basin, southeastern Amazonia: Implication for environmental studies. J. Geochem. Explor. 2019, 205, 106321. [Google Scholar] [CrossRef]
  47. Grunsky, E.C.; Caritat, P. Advances in the Use of Geochemical Data for Mineral Exploration. In Proceedings of the Exploration 17: Sixth Decennial International Conference on Mineral Exploration; Tschirhart, V., Thomas, M.D., Eds.; Lakehead University: Orillia, ON, USA, 2017; pp. 441–456. [Google Scholar]
  48. Ander, E.L.; Johnson, C.C.; Cave, M.R.; Palumbo-Roe, B.; Nathanail, C.P.; Lark, R.M. Methodology for the determination of normal background concentrations of contaminants in English soil. Sci. Total Environ. 2013, 454–455, 604–618. [Google Scholar] [CrossRef] [Green Version]
  49. Cave, M.R.; Johnson, C.C.; Ander, E.; Palumbo-Roe, B. Methodology for the determination of normal background contaminant concentrations in English soils. Br. Geol. Surv. Comm. Rep. 2012, CR/12/003, 42. [Google Scholar]
  50. Conselho Nacional do Meio Ambiente—CONAMA. Resolução CONAMA N° 420, de 28 de Dezembro de 2009. Dispõe sobre critérios e valores orientadores de qualidade do solo quanto à presença de substâncias químicas e estabelece diretrizes para o gerenciamento ambiental de áreas contaminadas por essas substâncias em decorrência de atividades antrópicas; Diário Oficial da República Federativa do Brasil: Brasilia, Brasil, 2009; pp. 81–84. [Google Scholar]
  51. DEC (Department of Environment and Conservation). Assessment Levels for Soil, Sediment and Water; Version 4; DEC: Joondalup, Australia, 2010; ISBN 2009641-0110-100. [Google Scholar]
  52. Ministry of the Environment of Finland (MEF) Government Decree on the Assessment of Soil Contamination and Remediation Needs. 214/2007. Available online: http://www.finlex.fi/en/laki/kaannokset/2007/en20070214 (accessed on 19 February 2021).
  53. Bonham-Carter, G.F.; Rogers, P.J.; Ellwood, D.J. Catchment basin analysis applied to surficial geochemical data, Cobequid Highlands, Nova Scotia. J. Geochem. Explor. 1987, 29, 259–278. [Google Scholar] [CrossRef]
  54. Carranza, E.J.M. Geochemical sampling for geological–environmental studies. J. Geochem. Explor. 2011, 111, 57–58. [Google Scholar] [CrossRef]
  55. Lancianese, V.; Dinelli, E. Different spatial methods in regional geochemical mapping at high density sampling: An application on stream sediment of Romagna Apennines, Northern Italy. J. Geochem. Explor. 2015, 154, 143–155. [Google Scholar] [CrossRef]
  56. Reimann, C.; Flem, B.; Gasser, D.; Eggen, O.A.; Birke, M. Background values of gold, potentially toxic elements and emerging high-tech critical elements in surface water collected in a remote northern European environment. Geochem. Explor. Environ. Anal. 2018, 18, 185–195. [Google Scholar] [CrossRef]
  57. Tukey, J.W. Exploratory Data Analysis, 1st ed.; Addison-Wesley Publishing Company: Boston, MA, USA, 1977. [Google Scholar]
  58. Farias, D.L. Geoquímica de Sedimentos Ativos de Corrente e Estimativa de Background Geoquímico na Bacia do Rio Parauapebas—Pará; Instituto Tecnológico Vale: Belém, Brazil, 2020. [Google Scholar]
  59. Companhia Ambiental do Estado de São Paulo—CETESB. Decisão de Diretoria-256/2016/E, de 22-11-2016 Dispõe Sobre a Aprovação dos “Valores Orientadores para Solos e Águas Subterrâneas no Estado de São Paulo—2016” e dá Outras Providências; CETESB: São Paulo, Brazil, 2016; p. 5. [Google Scholar]
  60. Conselho Nacional do Meio Ambiente—CONAMA. Resolução CONAMA N° 454, de 01 de Novembro de 2012. Estabelece as Diretrizes Gerais e os Procedimentos Referenciais Para o Gerenciamento do Material a Ser Dragado Em águas Sob Jurisdição Nacional; Diário Oficial da República Federativa do Brasil: Brasilia, Brasil, 2012; p. 17. [Google Scholar]
  61. Tolbert, G.E.; Tremaine, J.W.; Malcher, G.C.; Gomes, C.B. The Recently Discovered Serra dos Carajás Iron Deposits. Econ. Geol. 1971, 66, 985–994. [Google Scholar] [CrossRef]
  62. Beisiegel, V.R.; Bernardelli, A.L.; Drummond, N.F.; Ruff, A.W.; Tremaine, J.W. Geologia e recursos minerais da Serra dos Carajás. Rev. Bras. Geociências 1973, 3, 215–242. [Google Scholar]
  63. Docegeo (Rio Doce Geologia e Mineração). Revisão litoestratigráfica da Província Mineral de Carajás. In Proceedings of the 35 Congresso Brasileiro de Geologia; CVRD/SBG: Belém, Brazil, 1988; pp. 11–59. [Google Scholar]
  64. Siepierski, L.; Ferreira Filho, C.F. Magmatic structure and petrology of the Vermelho Complex, Carajás Mineral Province, Brazil: Evidence for magmatic processes at the lower portion of a mafic-ultramafic intrusion. J. S. Am. Earth Sci. 2020, 102, 102700. [Google Scholar] [CrossRef]
  65. Sousa, S.D.; Monteiro, L.V.S.; Oliveira, D.C.; Silva, M.A.D.; Moreto, C.P.N.; Juliani, C. O Greenstone Belt Sapucaia na região de Água Azul do Norte, Província Carajás: Contexto geológico e caracterização petrográfica e geoquímica. Contrib. Geol. Amaz. 2015, 9, 317–338. [Google Scholar]
  66. Mander, Ü. Watershed Management. In Encyclopedia of Ecology; Elsevier: Amsterdam, The Netherlands, 2008; pp. 3737–3748. [Google Scholar]
  67. Tomer, M.D. Watershed Management. In Encyclopedia of Soils in the Environment; Elsevier: Amsterdam, The Netherlands, 2005; pp. 306–315. [Google Scholar]
  68. Wang, X.; Chi, Q.; Liu, H.; Nie, L.; Zhang, B. Wide-spaced sampling for delineation of geochemical provinces in desert terrains, northwestern China. Geochem. Explor. Environ. Anal. 2007, 8, 153–161. [Google Scholar] [CrossRef]
  69. Souza-Filho, P.W.M.; Souza, E.B.; Silva Júnior, R.O.; Nascimento, W.R., Jr.; Mendonça, B.R.V.; Guimarães, J.T.F.; Dall’Agnol, R.; Siqueira, J.O. Four decades of land-cover, land-use and hydroclimatology changes in the Itacaiúnas River watershed, southeastern Amazon. J. Environ. Manag. 2016, 167, 175–184. [Google Scholar] [CrossRef]
  70. Souza, E.S.; Fernandes, A.R.; Braz, A.M.S.; Oliveira, F.J.; Alleoni, L.R.F.; Campos, M.C.C. Physical, chemical, and mineralogical attributes of a representative group of soils from the eastern Amazon region in Brazil. Soil 2018, 4, 195–212. [Google Scholar] [CrossRef] [Green Version]
  71. Kabata-pendias, A.; Pendias, H. Trace Elements in Soils and Plants, 3rd ed.; CRC Press: Boca Raton, FL, USA, 2001; ISBN 0849315751. [Google Scholar]
  72. Gałuszka, A.; Migaszewski, Z.; Duczmal-Czernikiewicz, A.; Dołęgowska, S. Geochemical background of potentially toxic trace elements in reclaimed soils of the abandoned pyrite–uranium mine (south-central Poland). Int. J. Environ. Sci. Technol. 2016, 13, 2649–2662. [Google Scholar] [CrossRef] [Green Version]
  73. Yotova, G.; Padareva, M.; Hristova, M.; Astel, A.; Georgieva, M.; Dinev, N.; Tsakovski, S. Establishment of geochemical background and threshold values for 8 potential toxic elements in the Bulgarian soil quality monitoring network. Sci. Total Environ. 2018, 643, 1297–1303. [Google Scholar] [CrossRef]
  74. Urresti-Estala, B.; Carrasco-Cantos, F.; Vadillo-Pérez, I.; Jiménez-Gavilán, P. Determination of background levels on water quality of groundwater bodies: A methodological proposal applied to a Mediterranean River basin (Guadalhorce River, Málaga, southern Spain). J. Environ. Manag. 2013, 117, 121–130. [Google Scholar] [CrossRef]
  75. MacDonald, D.D.; Ingersoll, C.G.; Berger, T.A. Development and evaluation of consensus-based sediment quality guidelines for freshwater ecosystems. Arch. Environ. Contam. Toxicol. 2000, 39, 20–31. [Google Scholar] [CrossRef]
  76. Lima, M.W.; Hamid, S.S.; Souza, E.S.; Teixeira, R.A.; Conceição Palheta, D.; Faial, K.C.F.; Fernandes, A.R. Geochemical background concentrations of potentially toxic elements in soils of the Carajás Mineral Province, southeast of the Amazonian Craton. Environ. Monit. Assess. 2020, 192, 649. [Google Scholar] [CrossRef]
  77. Fernandes, A.R.; Souza, E.S.; Souza Braz, A.M.; Birani, S.M.; Alleoni, L.R.F. Quality reference values and background concentrations of potentially toxic elements in soils from the Eastern Amazon, Brazil. J. Geochem. Explor. 2018, 190, 453–463. [Google Scholar] [CrossRef]
Figure 1. Location of the Parauapebas River Basin (PB) in the eastern Amazon region (a), situated in the Itacaiúnas River watershed (b). the land cover and land use map (c) and the geological map (d) are presented along with the sampling sites for soil and stream sediments. These two maps are overlaid on a shaded-relief digital elevation model (DEM). Inset shows the Northern (NPB) and Southern (SPB) PB. Map coordinates are in degrees (WGS84). Source: modified from [24].
Soilsystems 05 00021 g001
Figure 2. Geochemical maps for Fe, Al, Cu, Mo, As, and Hg in stream sediments (catchment area—polygon) and surface soil (in-situ sampling site—point) in the Parauapebas River Basin (PB). Note that the same concentration range for each element is used for the map representation on both sampling media. Inset shows the Northern (NPB) and Southern (SPB) PB. Refer to Figures S1 and S2 for the geochemical maps of the remaining PTE.
Soilsystems 05 00021 g002
Figure 3. Geochemical maps for Ni, Cr, Co, V, Mn, and Zn in stream sediments (catchment area—polygon) and surface soil (in-situ sampling site—point) in the Parauapebas River Basin (PB). Note that the same concentration range for each element is used for the map representation on both sampling media. Inset shows the Northern (NPB) and Southern (SPB) PB. Refer to Figures S1 and S2 for the geochemical maps of the remaining PTE.
Soilsystems 05 00021 g003
Figure 4. Boxplots for Fe, Al, and 12 potentially toxic elements (PTE; As, Ba, Bi, Co, Cr, Cu, Hg, Mn, Ni, Se, V, and Zn) in surface soils and stream sediments samples of the Parauapebas River Basin (PB), according to the major geological domains of the study area: BD = Bacajá Domain and CB = Carajás Basin, both domains comprised at the Northern PB (NPB); and RM-S-CC = Rio Maria—Sapucaia—Canaã dos Carajás domains, comprised at the Southern PB. Refer to Figure 1 for the geological setting of the study area. Refer to Figure S3 for the boxplot of the remaining PTE.
Soilsystems 05 00021 g004
Figure 5. Scatter plot comparing the concentrations of selected elements in surface soil samples against stream sediment samples. Three groups of elements were observed: (i) Strongly correlated materials (e.g., Fe, As, Cu, and U); (ii) Moderately correlated materials (e.g., Hg, Ni, Cr, and Sb); (iii) Weakly to non-significant correlated materials (e.g., Al, Mn, and Co); Additional scatter plots for the remaining elements are presented in Figure S4.
Soilsystems 05 00021 g005
Table 1. Summary of the p-values obtained from Mann–Whitney–Wilcoxon (MWW) Test used to verify the similarities in the distribution of the studied elements in a sampling medium (Surface soils and stream sediments) from two different geological domains (BD = Bacajá Domain and CB = Carajás Basin). Refer to Figure 1d for the location of the geological domains.
ElementDo the Samples from BD and CB Have Similar Distribution? (p-Values of the MWW Test)ElementDo the Samples from BD and CB Have Similar Distribution? (p-Values of the MWW Test)
Surface SoilsStream SedimentsSurface SoilsStream Sediments
Fe 0.40Hg0.220.21
Al0.130.46Mn0.12
Ag0.180.37Mo 0.29
As0.370.43Ni0.090.90
B 0.12Pb 0.09
Ba 0.93Sb 0.50
Bi0.750.50Se 0.92
Cd 0.59Sn0.430.74
Co 0.20U 0.29
Cr0.880.13V0.300.07
Cu Zn0.800.86
Note: Blank entries indicate p-value < 0.05.
Table 2. Descriptive statistics for Fe, Al, and 10 potentially toxic elements (PTE; As, Co, Cr, Cu, Hg, Mn, Mo, Ni, V, and Zn) in surface soils and stream sediments. Values were calculated for the entire Parauapebas River Basin (PB; soils = 364 samples; stream sediments = 189 samples) and for the northern (NPB; soils = 223 samples; stream sediments = 122 samples) and southern (SPB; soils = 141 samples; stream sediments = 67 samples) regions separately. Refer to Table S1 for the descriptive statistics of the remaining elements.
ElementRegionSurface SoilStream Sediments
LLD (% < LLD)MeanSDMinMedMaxLLD (% < LLD)MeanSDMinMedMax
FePB *0.01 (0)4.965.820.32.7129.60.01 (0)4.015.170.421.9835.4
NPB0.01 (0)6.956.600.324.7529.60.01 (0)5.485.920.683.535.4
SPB0.01 (0)1.841.630.31.349.040.01 (0)1.340.810.421.164.79
AlPB *0.01 (0)2.482.510.441.8020.20.01 (0)1.140.840.120.874.17
NPB0.01 (0)3.172.960.572.2920.20.01 (0)1.370.910.191.114.17
SPB0.01 (0)1.400.660.441.264.060.01 (0)0.740.480.120.672.69
AsPB *0.1 (5.2)1.242.9<0.10.538.40.1 (10.1)0.661.00<0.10.37.9
NPB0.1 (1.8)1.793.50<0.10.938.40.1 (3.3)0.901.17<0.10.57.9
SPB0.1 (10.6)0.370.82<0.10.27.50.1 (22.4)0.220.24<0.10.21.7
CoPB *0.01 (0)10.7122.60.22.92370.01 (0)11.6012.880.86.866.9
NPB0.01 (0)12.2425.980.23.32370.01 (0)14.9614.520.89.766.9
SPB0.01 (0)8.2715.690.32.397.50.01 (0)5.495.210.93.326.8
CrPB *1 (0)82.34296.323139701 (0)58.38196.574302630
NPB1 (0)114.35371.7624439701 (0)75.83241.32437.52630
SPB1 (0)32.6365.822126121 (0)26.6141.41415294
CuPB *0.2 (0)48.88790.521.87260.2 (0)48.9273.691.420556
NPB0.2 (0)66.3690.891.734.97260.2 (0)71.5583.322.641.65556
SPB0.2 (0)21.3942.750.58.74380.2 (0)7.738.491.45.247.4
HgPB *0.01 (0)0.10.10.020.070.540.01 (9.0)0.030.03<0.010.020.14
NPB0.01 (0)0.130.080.020.110.540.01 (5.7)0.040.03<0.010.030.14
SPB0.01 (0)0.050.020.020.050.110.01 (14.9)0.020.01<0.010.010.08
MnPB *5 (0)606.2941.51330885905 (0)826.32933.84695476420
NPB5 (0)710.331136.672731885905 (0)950.101050.4274609.56420
SPB5 (0)440.04453.611330029705 (0)600.94617.48694283270
MoPB *0.05 (0.5)0.850.9<0.050.486.340.05 (0)0.570.600.060.363.49
NPB0.05 (0)1.161.020.060.846.340.05 (0)0.750.680.110.5453.49
SPB0.05 (1.4)0.360.350.0250.262.170.05 (0)0.240.130.060.230.76
NiPB *0.2 (0)21.4787.80.76.312600.2 (0)15.7332.241.16.9273
NPB0.2 (0)28.20110.360.88.312600.2 (0)20.9538.761.29.7273
SPB0.2 (0)10.8922.430.74.62200.2 (0)6.217.971.14.247.1
VPB *1 (0)81.0987.31434351 (0)50.3757.18229410
NPB1 (0)111.4693.794894351 (0)68.5763.63243410
SPB1 (0)33.9045.801183691 (0)17.2212.8141475
ZnPB *2 (0.5)22.3525.7<2162022 (0)30.0440.99319304
NPB2 (0.9)23.5230.92<2142022 (0)39.2848.40324304
SPB2 (0)20.5313.954181202 (0)13.226.8041340
Note: The concentration unit is expressed in mg kg−1, except for Fe and Al in wt.%; DL = Lower limit of detection; % < DL = % of data below LLD; Mean = Arithmetic mean; SD = Standard deviation; Min = Minimum; Med = Median; Max = Maximum; ‘*’ = Surface soil data from [24].
Table 3. Geochemical threshold values for Fe, Al, and 10 potentially toxic elements (PTE; As, Co, Cr, Cu, Hg, Mn, Mo, Ni, V, and Zn) in surface soils and stream sediments, estimated by a variety of methods [Median + 2 Median Absolute Deviation (MMAD), Tukey’s inner fences (TIF), the 98th (P98) and 95th (P95) percentiles]. Values are provided for the entire Parauapebas River Basin (PB, retrieved from previous studies), for the northern (NPB) and the southern (SPB) regions separately, determined in the present study. Guideline values reposted by Brazilian environmental agencies are presented as references. Refer to Table S2 for the results of the remaining elements.
ElementRegionsGeochemical Threshold in Surface SoilSoil GuidelinesGeochemical Threshold in Stream SedimentsStream Sediment Guidelines
MMADTIFP98P95QRV bPGV cMMADTIFP98P95L1 dL2 d
FePB a25.758.2124.5518.2 12.0229.5117.7612.94
NPB34.2468.6327.5122.65 22.9342.8926.7416.73
SPB6.9312.246.925.99 3.545.203.742.88
AlPB a5.628.5111.228.32 3.322.76
NPB6.518.8912.4510.57 6.2510.723.443.16
SPB3.344.743.052.65 2.873.632.011.51
AsPB a7.214.17.24.5 2.44.63.92.4
NPB7.014.99.45.23.5152.36.14.52.95.917
SPB1.63.21.10.6 1.61.60.80.5
CoPB a69.2201.879.447.9 51.442.5
NPB96.4284.996.548.9132593.2190.152.248.3
SPB35.791.764.537.0 16.739.618.316.3
CrPB a5621413468191 191331275138
NPB5641401661254407516027734813937.390
SPB161529204117 6812113489
CuPB a398.11216.2275.4162.2 512.9288.5177.0
NPB365.9926.3302.7223.73560482.41223.9306.0190.535.7197
SPB72.7203.1101.970.7 20.035.137.822.8
HgPB a 0.160.130.10
NPB0.400.550.320.270.050.50.230.310.130.110.170.486
SPB0.140.250.100.09 0.080.060.060.04
MnPB a3890881028841995 3548638333872564
NPB483514,78339082359 4503866037323117
SPB2538508317931250 3079464327661839
MoPB a4.7910.593.312.88 1.952.921.69
NPB6.1111.433.603.14<4302.824.633.022.36
SPB1.101.581.700.99 0.731.020.510.46
NiPB a60.3142.9107.252.5 45.788.1100.346.8
NPB98.8173.0174.264.1133056.4127.0137.371.01835.9
SPB32.680.078.733.5 12.619.536.417.5
VPB a8912512331269 234188162
NPB7691831344284 360931239183
SPB141288160121 611124740
ZnPB a638911565 60882718
NPB5384144746030083169216114123315
SPB54755543 47552724
Note: The concentration unit is expressed in mg kg−1, except for Fe and Al in wt.%; Italic or “⯅” (value not available): threshold values greater than the maximum value; a Results reported in previous studies of soil [24] and stream sediments [58] of the PB; b Quality reference value (QRV) reported by the Sao Paulo Sanitation Technology Company (CETESB) [59]; c Prevention guideline value (PGV) reported by the National Council of the Environment (CONAMA) of Brazil [50]; d Threshold levels 1 (L1) and 2 (L2) reported by CONAMA [60]. Blank entries indicate data not available.
Publisher’s Note: MDPI stays neutral with regard to jurisdictional claims in published maps and institutional affiliations.

