Article

The Use of Unmanned Aerial Vehicles (UAVs) for Estimating Soil Volumes Retained by Check Dams after Wildfires in Mediterranean Forests

by
Bruno Timóteo Rodrigues
1,
Demetrio Antonio Zema
2,*,
Javier González-Romero
3,
Mikael Timóteo Rodrigues
4,5,
Sérgio Campos
1,
Pablo Galletero
3,
Pedro Antonio Plaza-Álvarez
3 and
Manuel Esteban Lucas-Borja
3
1
College of Agronomic Science (FCA), São Paulo State University (UNESP), Botucatu, 01049-010 São Paulo, Brazil
2
Department AGRARIA, Mediterranean University of Reggio Calabria, 89124 Reggio Calabria, Italy
3
Escuela Técnica Superior Ingenieros Agrónomos y Montes, Universidad de Castilla-La Mancha, Campus Universitario, E-02071 Albacete, Spain
4
University Center Dinâmica das Cataratas (UDC), Foz do Iguaçu, 85852-010 Paraná, Brazil
5
Itaipu Technological Park-Brazil (PTI-BR), Foz do Iguaçu, 85853-010 Paraná, Brazil
*
Author to whom correspondence should be addressed.
Submission received: 24 December 2020 / Revised: 28 January 2021 / Accepted: 1 February 2021 / Published: 5 February 2021

Abstract

:
Check dams act as soil collectors during floods, thus retaining a large amount of sediments. The estimation of the soil volumes stored behind a check dam is a key activity for a proper design of these control works and for evaluation of soil delivery after restoration measures at watershed level. Several topographic techniques have been proposed for this activity, but the sediment wedge mapping tools are complex and time consuming. Conversely, the use of unmanned aerial vehicles (UAVs) has been proposed to support aerophotogrammetric techniques for several survey activities with promising results. However, surveys by UAVs have never applied to calculate the size of the sediment wedge behind check dams that are built in fire-affected watersheds, where soil loss and sediment transport may be high after a wildfire. To fill this gap, this study evaluates the efficiency and efficacy of aerophotogrammetric surveys using UAVs to estimate the volume of the sediments stored behind ten check dams, built as post-fire channel treatment in a forest watershed of Castilla La Mancha (Central Eastern Spain). The results of the aerophotogrammetric technique were compared to traditional topographic surveys using a total station and GNSS/RTK, assumed as reference. The estimation of sediment wedge volume provided by UAVs was more accurate (mean RMSE of 0.432), extensive (density of mapped points of 328 m−2) and quick (two days of fieldwork) compared to surveys using the topographic method (RMSE < 0.04 m, six days of field work and density of mapped points of 0.194 m−2) by the topographic method. The differences in the sediment volume estimated by the two methods were not significant, but the UAV method was more accurate for the larger check dams. Moreover, a significant correlation was observed between the volume estimates provided by the two methods, shown by a coefficient of determination close to 0.98. Overall, these results propose a larger use of the aerial surveys for mapping activities in channels regulated by check dams, such as those built for restoration of fire-affected forest watersheds.

1. Introduction

The Mediterranean region is the area that is most heavily subjected to forest fires in Europe [1,2]. In this region, fire is considered as a natural disaster [3,4] enhanced by the intrinsic climatic conditions and land use changes and is also recognized as a factor for soil formation [5]. However, wildfires negatively affect the local economy [6] and ecosystem functions [4,7] that influence important hydrological and ecological processes (e.g., high flooding, erosion, biodiversity loss and soil degradation) [8,9,10,11].
The hydrological impacts of wildfire are related to the complete removal of vegetation cover and the alteration of soil properties (e.g., increased water repellence and decreased infiltration, [12,13]. These factors lead to noticeable changes in the hydrological response of soils to fire, increasing soil’s susceptibility to runoff generation and soil loss as well as transport of polluting compounds [14,15]. These hydrological effects of wildfire are not restricted only to the burned forest area, but also extend to downstream areas of the fire-affected watershed [9,16].
Several post-fire treatments have been proposed to limit the fire impacts on soil hydrology and forest ecology in wildfire affected watersheds. These treatments must be implemented within the so-called “window-of-disturbance” [17], that is, in the first months after the fire, when the soil’s aptitude to generate runoff and erosion increases substantially [18,19]. Hillslope treatments (e.g., afforestation, seeding, mulching, salvage logging, erosion barriers or soil preparation) are targeted to quickly restore the vegetation cover, protect the soil from raindrop impact, reduce overland flow, trap sediments, and increase water infiltration [20]. Channel treatments (such as rock or concrete check dams) aim instead at delaying the flood propagation, reducing the sediment transport in watercourses and retaining eroded sediment [21].
Check dams are built in channels to retain eroded sediments and stabilizing the torrent profile and section [22,23]. The check dams impact not only on torrent geomorphology (e.g., storing bed material, reducing sediment transport downstream, consolidating hillslopes, controlling the debris flows) but also favouring the establishment and growth of the riparian vegetation as well as enhancing its biodiversity [24,25,26,27,28]. An ample body of literature reports several successful examples of check dams for controlling geomorphology and hydrology in torrents as well as restoring vegetation in channels (e.g., [23,24,29,30,31,32,33,34,35,36,37,38,39].
In streams with high soil loss coming from the upstream drainage area (such as in the post-fire conditions) and elevated transport capacity in channels (such as in beds with loose and fine materials), the sediment retention capacity of check dams plays a key role in governing the hydrology of the entire watershed [34,35,36,37,40]. The solid material transported by the water stream along the channel is deposited behind the structure in successive floods, and the channel bed immediately upstream of the check dams is filled, forming long sediment wedges [41]. Once the storing capacity of the check dam is depleted because the sediment wedge is filled, the channel profile becomes gentler, and this reduces the water flow velocity and the sediment transport capacity of the torrent, thus regulating sediment transport [28,42]. Hence, reliable estimation of the sediment wedge volume and morphology is necessary to assess structure effectiveness and for check dam design strategies. Literature reports several methods to quantify the volume and geometric characteristics of the sediment wedge in check dams, ranging from geometric to topographic methods and with various accuracy and complexity [34,35,36,37,43,44,45,46]. However, all these techniques require labour intensive and time-consuming fieldwork for accurate surveys [36,37]. The recent development of remote sensing techniques (using satellites and unmanned aerial vehicles) has opened new tools to make the measurement activities quicker and easier [47]. For instance, the digital photogrammetry through aerial mapping using unmanned aerial vehicles (UAVs), adjusted to GNSS/RTK (Global Navigation Satellite Systems, based on Real-time Kinematic Positioning), is an efficient and low-requiring technique for such measurements, since it is able to map and quantify the sediment wedge from high-resolution and precise orthorectified images, and Digital Elevation Models (DEM) generated by UAVs, covering relatively large areas and providing quick estimations. However, the examples of the use of this technique for estimating the check dam sediment wedge and map its geometric features are very scarce. Only Alfonso-Torreño et al. [47] tested UAVs in combination with Structure-from-Motion photogrammetry to obtain Digital Elevation Models (DEMs) to estimate sediments behind 259 check dams in Western Spain, but this work was carried out at the watershed scale and on the long term, instead of working at the reach scale and with recent control works. Moreover, this technique has never been used for this purpose in fire-affected watershed regulated with check dams, and therefore, its effectiveness in these conditions is unknown.
This study proposes a methodology to analyse the efficiency and accuracy of surveys carried out by UAVs in calculating the volume of sediments behind check dams built in burned forests watersheds of South-eastern Spain. The volume estimated using this methodology is compared to the results of traditional topographic methods, using a total station and GNSS/RTK. The case study adopted for method validation in Mediterranean areas is representative, since in this area a noticeable amount of check dams to restore burned forest watersheds [47]. This makes the study of paramount importance, since it sheds new light on the utility of UAV surveys in mapping and extracting sediment wedge volumes, managing a high amount of topographic data with precision and accuracy as well as optimizing the time and efforts for carrying out the field surveys [48].

2. Materials and Methods
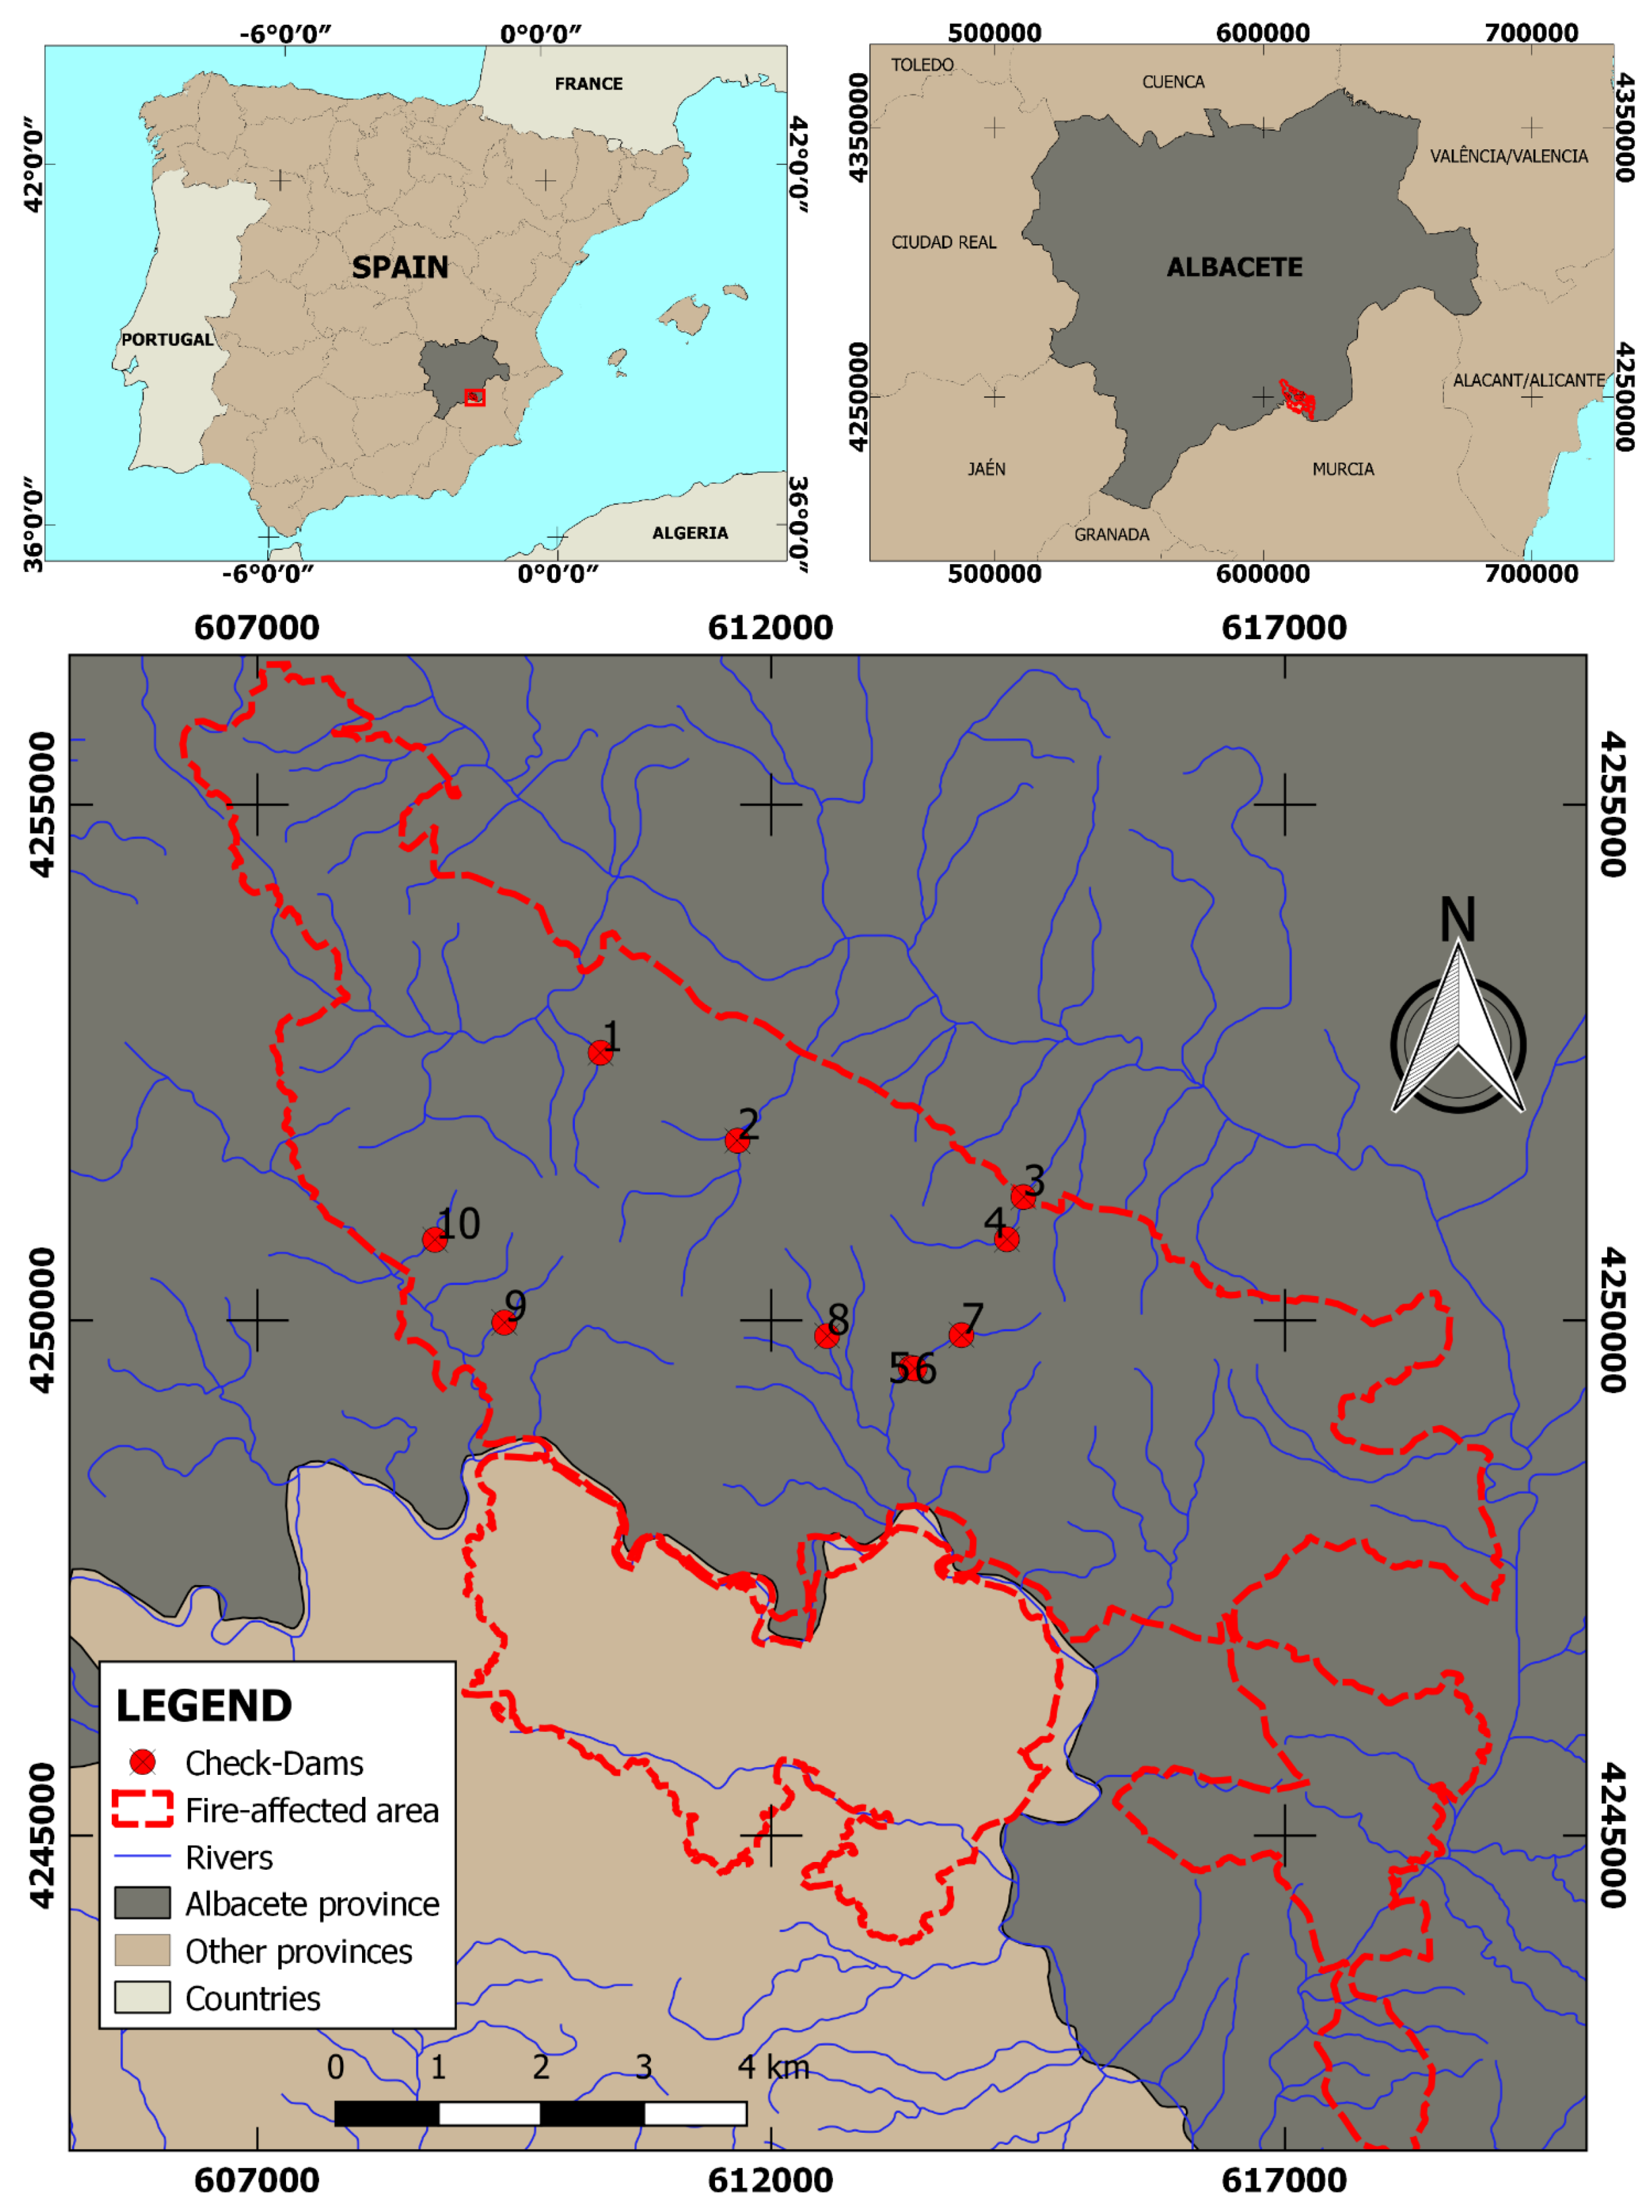
2.1. Study Area

The study was conducted in Sierra de Donceles (38°23′ N, 1°40′ W, Southern Spain) (Figure 1). This forest area was affected by a wildfire in July 2012 for the first time in the last 70 years, which burned roughly 6500 ha [49,50]. Elevation in the study area ranges from 304 m to 808 m with a large variability in terrain slope. The climate of the region is semi-arid Mediterranean (BSk, according to the Köppen–Geiger classification, [51], located in the meso-Mediterranean bioclimatic belt [52]. According to the meteorological records of 1990–2014 (data provided by AEMET, the Spanish Meteorological Agency), the mean annual temperature and precipitation are 16.6 °C and 321 mm, respectively. Maximum precipitation generally occurs in October (44.5 mm) and May (39.6 mm). The dry period lasts from June to September, and the relative air humidity is below 50% [21].
The geology of the area is typical of the pre-baetic mountain with limestone and dolomite outcrops alternating with marly intercalations dating from the Quaternary. According to the Soil Taxonomy System [53] and the Spanish Soil Map of 2000, the soils on hillslopes can be classified as Inceptisols and Aridisols; soils eroded from the hillslopes were deposited in the channels (“Ramblas”), where the check dams were built, and can be classified as Entisols. The main composition of vegetation prior to the fire consisted of Pinus halepensis Mill., with shrubs and associated herbaceous species, such as Rosmarinus officinalis L., Brachypodium retusum (Pers.) Beauv., Cistus clusii Dunal, Lavandula latifolia Medik., Thymus vulgaris L., Helichrysum stoechas (L.), Stipa tenacissima (L.), Thymus vulgaris L., Quercus coccifera L., and Plantago albicans L. After fire, vegetation recovery was homogeneous, with a large proportion of pioneer species recruiting on hillslopes and channels. In the sediment wedge of the built check dams, a proliferation of ruder species that covered almost entirely the channel was observed [21]. Records of forest fires began in Spain in 1968. Since that year, two fires have been recorded in Sierra de Los Donceles forest: a first fire in 1994, which was caused by lightning and affected 46 ha, and a fraudulent fire in July 2012, which devastated roughly 6500 ha of Mediterranean maquis. Ten check dams were built in 2013 in the study area to trap the eroded sediments as part of the post fire emergency restoration works by the government of Castilla-La Mancha Region. The check dams, made of concrete, were 21 to 39 m wide and 4 to 7 m high (Table 1). Part of the sediment eroded and transported by the torrent stream has been deposited in the sediment wedge behind each check dam. In general, only the sediments deposited in the upper surface of the sediment wedge are mobilized only during the extreme rainfall-runoff events; however, this share of solid material is replaced by other sediments transported by stream during less heavy events.

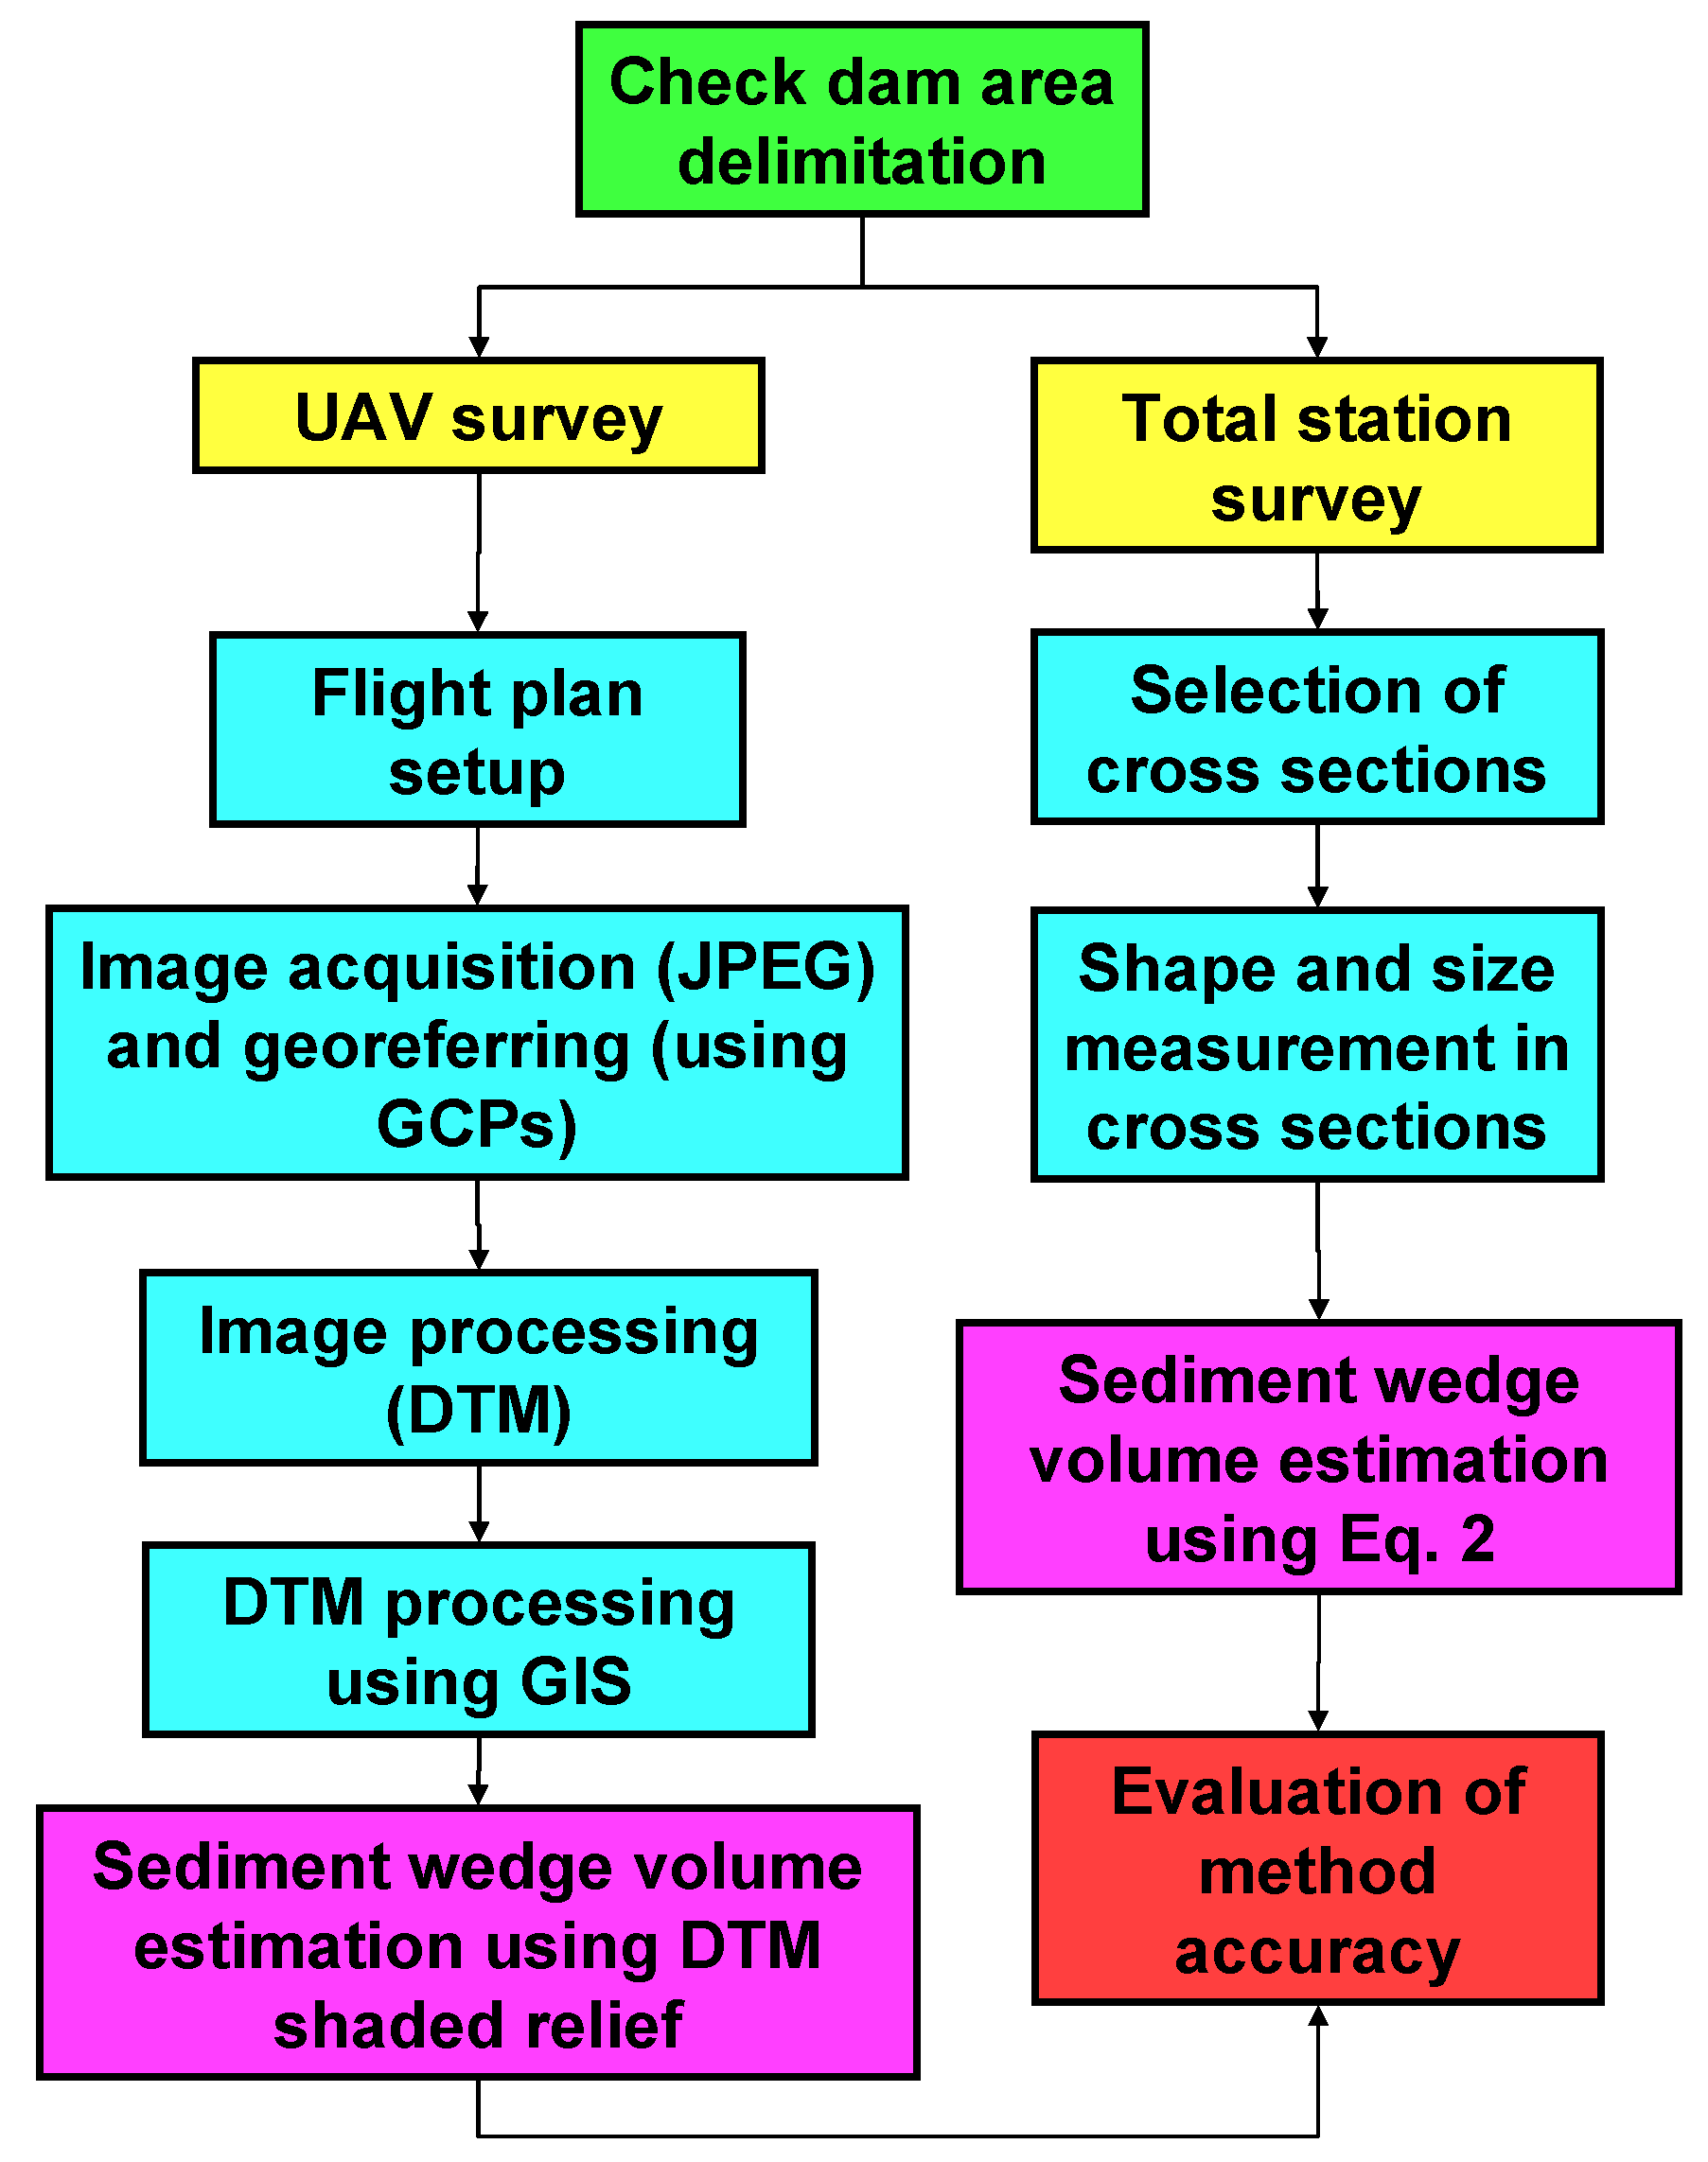
2.2. Check Dams Survey

The workflow of the methodology is illustrated in Figure 2. Before carrying out the field surveys, the perimeter of the sediment wedge for each check dam (evidenced from the evident profile change in the channel hillslopes [27,38]) was visually identified from a recent aerial image. Then, an area containing this perimeter was mapped in field using the two methods. We cared that the external limit of this perimeter was inside the field-surveyed area for not less than five metres.

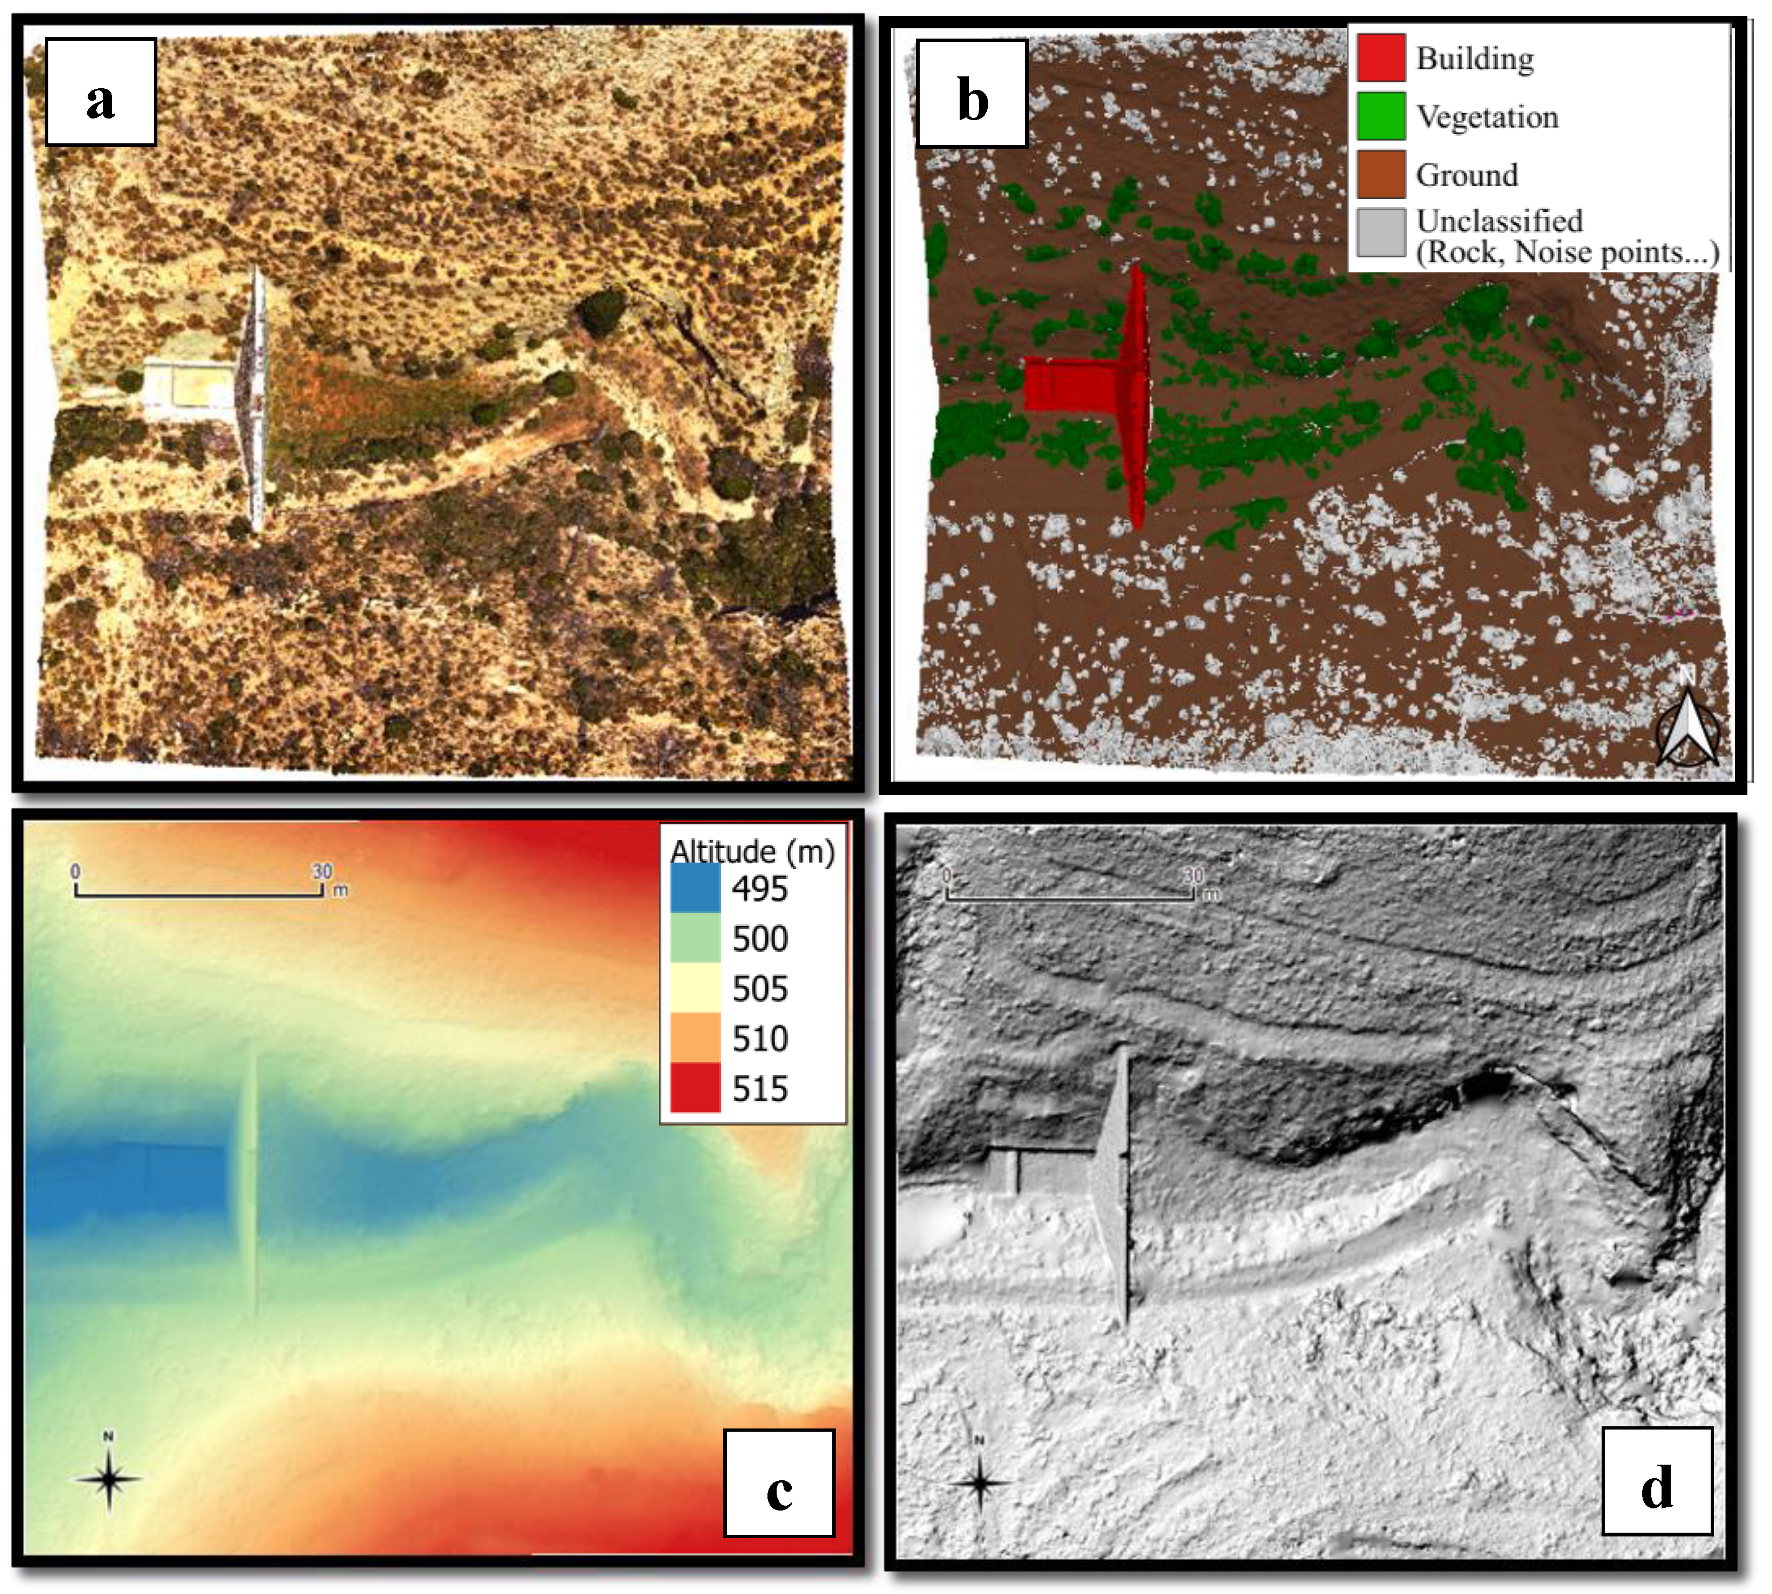
2.2.1. Orthophotogrammetric Method Using UAV

The orthophotogrammetric survey was carried out during the spring of 2019, using a quadrirotor UAV (model “3DR Solo”) equipped with a MAPIR 3 camera. The camera had a resolution of 4000 × 3000 with 12 megapixels and a focal length of 4.73 mm. Its 1/2.3-inch CMOS sensor has six spectrum options and two angles of view (41° and 87°).
One UAV flight was required for each check dam area with the respective sediment wedges. The flight area was defined with the help of the ground station application called “Mission Planner”, a free open-source software. This application helps to schedule UAV flights at the desired height, cruising speed, Ground Sample Distance (GSD) as well as the area and percentage of frontal (“Overlap”) and lateral (“Sidelap”) overlaps (Table 2).
Considering the physical size and focal length of the camera sensor (see below), the maximum flight height was set at 30 m, also according to the air navigation regulations issued by the Spanish Royal Decree 1036/2017. The UAV speed was setup at 5 m/s (about 18 km/h) with small variability due to the wind speed and direction.
In order to calculate the coverage area of the images, the following equation was adopted [54]:
A c = ( A v D f L s ) ( A v D f C s )
where Ac is the covered area, Av is the flight height measured from the ground, Df is the focal length, Ls is the sensor width, and Cs is the sensor length (all measures in m).
The survey produced aerial images in JPEG format, including accessory files for synchronizing each scene. The images have mooring points in the geographic coordinate system (latitude and longitude), which were later converted to the UTM and Datum ETRS89 system. In order to adjust and increase the precision and accuracy of the generated models, 36 control points (Ground Control Points, GCPs) were recorded, about four for each check dam area. A GNSS system was applied to this aim, using a LEICA GPS1200 device with RTK and post-processed solutions set to GLONASS constellations. The GCPs were later used to georeference the 3D models resulting from the aerophotogrammetric surveys. After the field surveys, the Agisoft Metashape photogrammetry software was applied to process the acquired images. The image processing at these intermediate levels had reasonable quality of height resolution and required low time in the workflow. It was also possible to generate and visualize the orthomosaic as well as the other cartographic products needed for calculating the sediment wedge volume. In the first stage of the workflow, the images were systematically acquired by the software, and the coordinates for each JPEG image were input and then converted to the UTM system (zone 30 N) using Datum ETRS89. Then, the photos were aligned, detecting, selecting and matching homologous points of the added images. Special point clouds were thus generated as a result of pre-processing, after establishing the quality level of the intermediate output. Then, after the input of the GCPs and subsequent adjustment of the images, the dense clouds of points were obtained, with a satisfactory precision and detail richness. There, clouds of points were categorized into soil, vegetation, and buildings classes, in order to build a representation of the Digital Terrain Models (DTMs). The final stages of image processing were the DTM processing and the orthomosaic construction.
The point clouds with volumetric densities surveyed in the field with the topographic and UAV surveys were the basis for DTM processing. In more details, the point clouds surveyed in the field had the same source for the two methods, and thus, the difference in methods lies exclusively in the way in which they have developed DTMs. The sampled points were used to represent the surface by a structure formed by interconnected triangles (triangular irregular network, TIN), in order to better represent the non-homogeneous surface with accentuated local variations of the sediment wedge. This cartographic product provided by the aerial surveys as DTMs allowed the extraction of the sediment wedge data for the ten check dams. To this aim, the DTMs were input to a geoprocessing software (QGIS), in which the data was extracted using the “Raster Volume” tool from the “Saga GIS” extension. This tool calculates and extracts the information from a raster support (in our case the built DTMs) and prints the results in a file of TXT type. The processing time of the photographs to obtain the point clouds, as well as the DTMs and the orthomosaics was 2 h and 10 min (using a 2.00 GHz Intel Core i7 CPU with 8 GB of RAM and AMD Radeon HD 7500 M GPU). An additional time of 36 h was used to filter, edit and classify the point clouds. The following cartographic products were generated for each of the ten surveyed check dams: (a) 3D point clouds, (b) classified point clouds, (c) DTM, (d) DTM shaded relief. From the DTM the volume of the check dam sediment wedge was estimated.

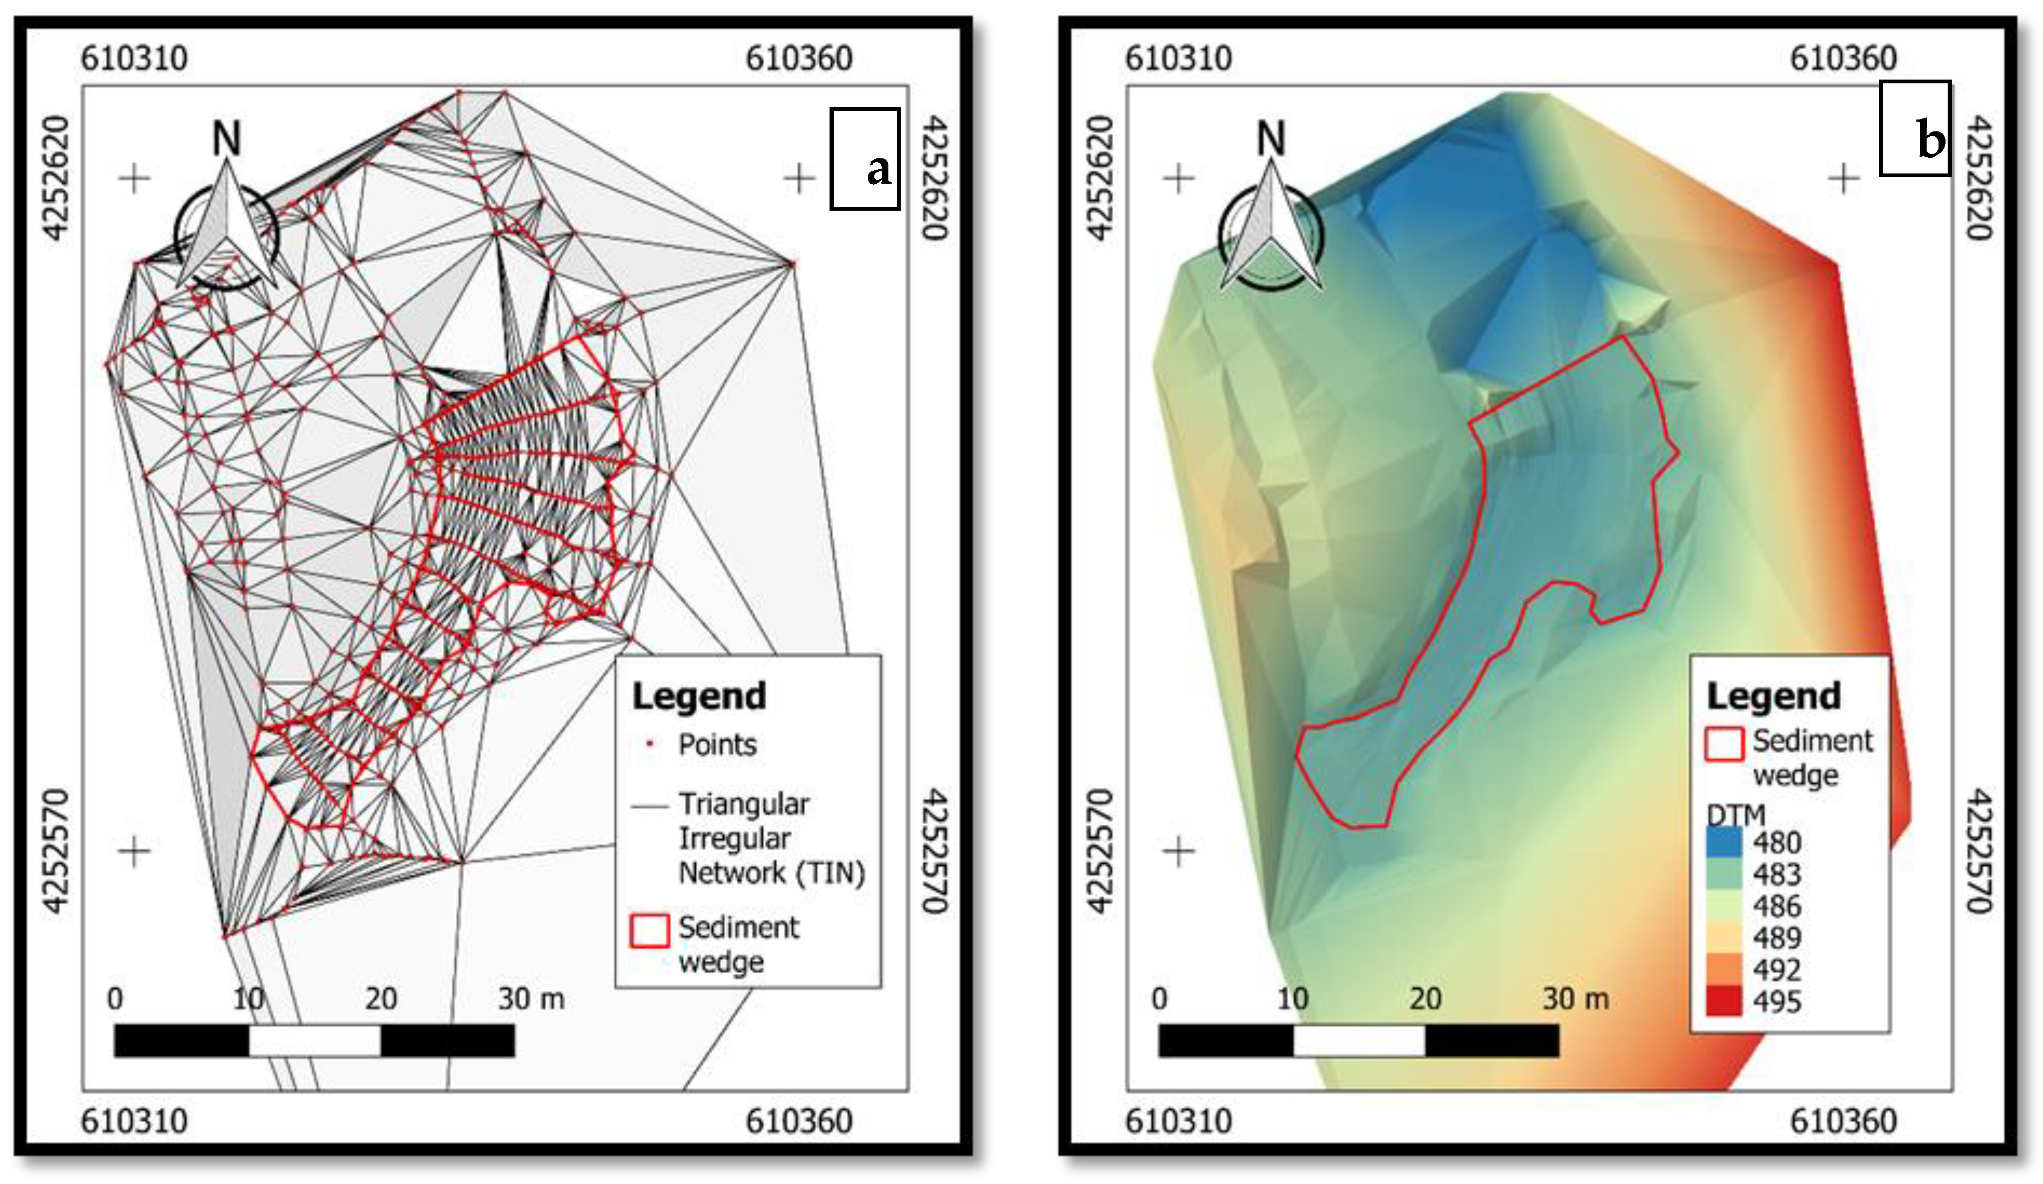
2.2.2. Topographic Method Using Total Station and GNSS/RTK

The topographic field surveys were carried out during the spring of 2019, following the method proposed by Díaz et al. [44]. This method was chosen due to its greater precision in estimating the volume behind the check dams [36,37]. In more detail, a total station (LEICA TC405 model) and a high-performance GNSS device (LEICA GPS1200) were used. Both these devices had a centimetric accuracy. The point cloud and the section data derived from the survey were processed using the Protopo v6.1 software. The method consists of the following steps (Figure 3):
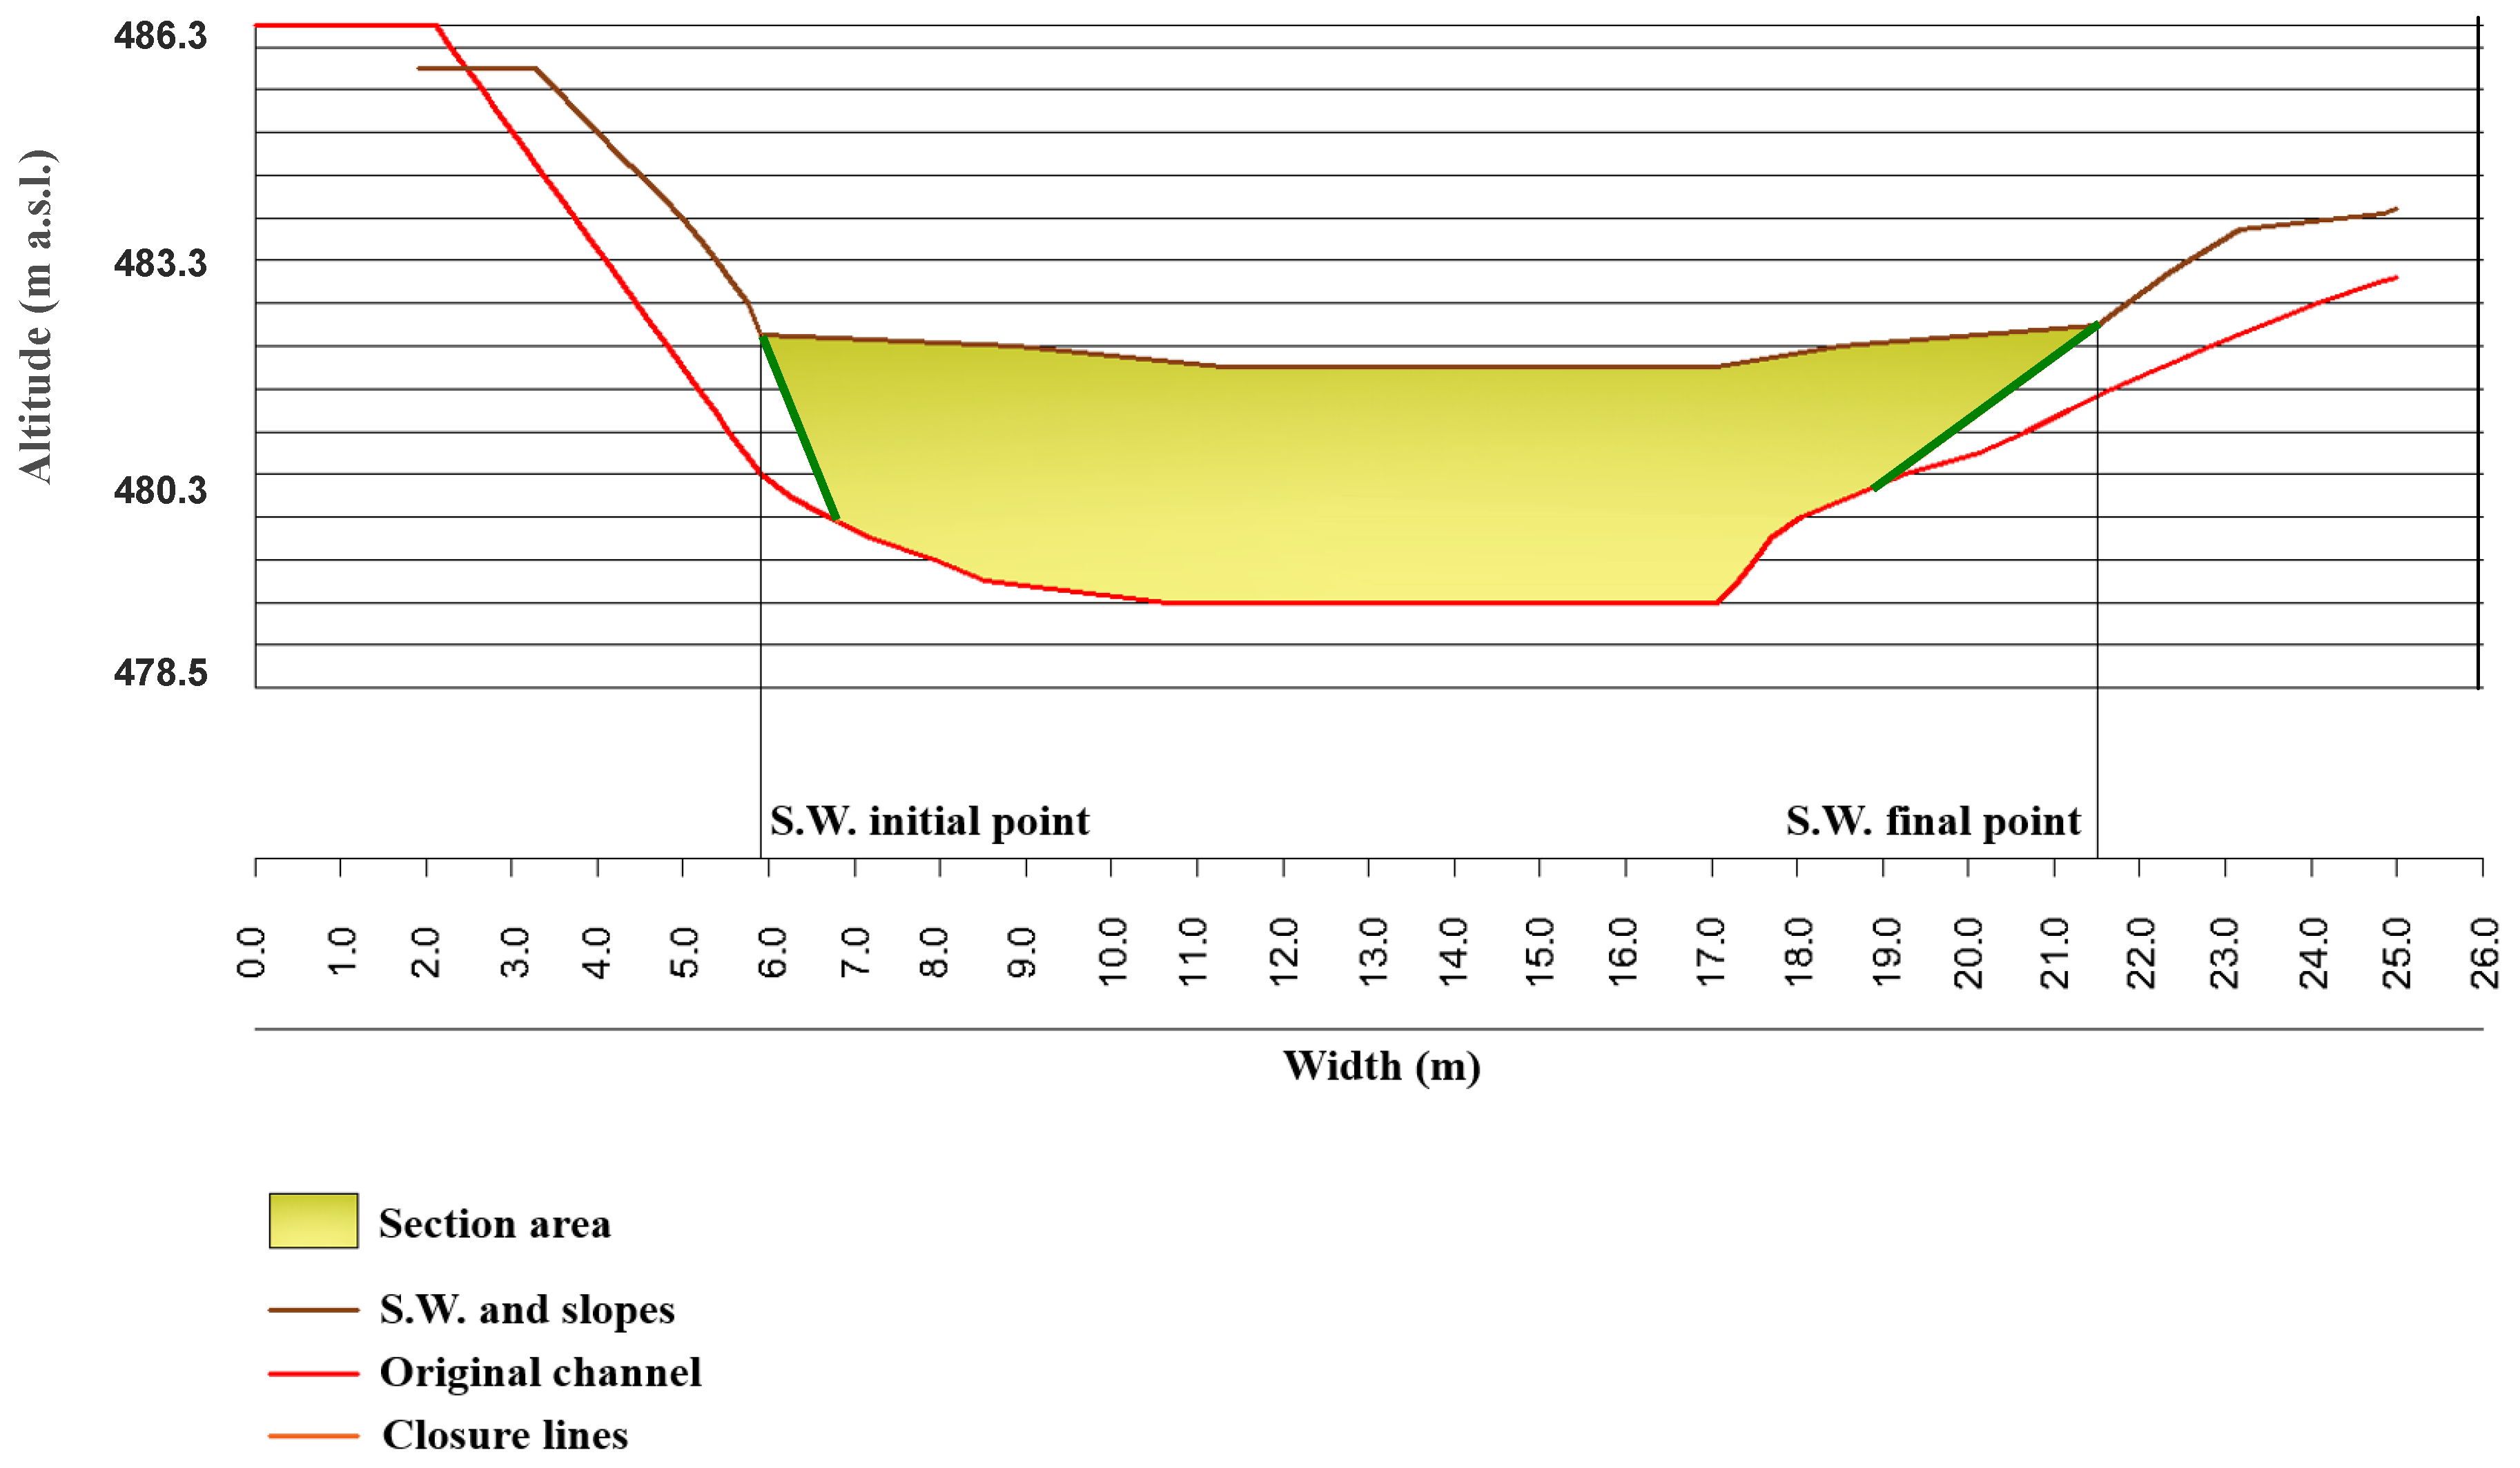
  • Two cross sections were selected in the channel, of which one was located immediately upstream of the check dam, and the second was chosen at the upstream limit of the sediment wedge. The lowest point of each section was used to estimate the profile slope of the channel (thalweg);
  • The cross sections of the sediment wedge were surveyed at a reciprocal distance between 0.5 (S1) and 3 (S2) m (see below), depending on its length, considering always at least two points upstream and downstream of the wedge. For each section, some points were extracted to characterize the adjacent hillslopes;
  • The areas of each cross section were estimated and included into the transverse profile of the sediment wedge and original channel (Figure 3). To adjust the profile of the original channel at each section, the central point of the profile width was taken as a reference, and the height of the profile was adjusted based on the inclination of the channel. If the two profiles (sediment wedge and original channel) did not intersect, a closing line extending to the adjacent slopes of the SW was used to close the polygon (Figure 3).
  • The sediment volume between two consecutive sections of the sediment wedge was estimated using Equation (2), assuming the shape of a prismoid. The final volume of the wedge was calculated as the sum of the volumes between all sections.
V s = d 6 ( S 1 + S 2 + 4 S a v )
where Vs is the sediment wedge volume between two sections, d is the longitudinal distance, S1 and S2 are the areas of each section, and Sav is the average area between the two sections.
In order to reconstruct the original transverse and longitudinal profiles of the channel immediately upstream of the check dams, it was hypothesized that the transverse channel in the section behind the check dam was similar as the downstream section. Therefore, the channel shape and size immediately upstream of the check dam was equal to the section located immediately downstream of the structure (excluding the local scouring below the water jet). According to Ramos-Diez et al. [34,35,36,37] and Zema et al. [41], it was further assumed that, moving upstream from the check dams, the section size was linearly varying. This hypothesis allowed the reconstruction of the size of sections S1 and S2. The elevation of the thalweg was estimated by assuming a constant profile gradient, considering the short distance between the extreme sections.

2.2.3. Evaluation of Method Accuracy

After image processing and DTM extraction, the data related to the number of points and area surveyed by the two methods, processing time, GSD, DTM resolution and RMSE (Root Mean Square Error, in which the accuracy of the results was expressed) were estimated. The point density, equal to the ratio between the number of points and the area surveyed, was calculated.

2.3. Statistical Analysis

The relations between the volume of the sediment wedge of each check dam, estimated by the aerophotogrammetric and topographic surveys, respectively, were explored by a combination of the following statistical methods: (i) simple Analysis Of Variance (one-way ANOVA); (ii) multifactorial ANOVA; (iii) correlation analysis; and (iv) simple regression analysis. In more detail, the simple ANOVA tested whether the differences between the average volumes of the sediment wedge estimated by the two methods were significant at p level < 0.05. Moreover, the Kruskal–Wallis test was used to compare the median values instead of the averages. The multifactorial ANOVA was applied to explore the existence of a statistically significant influence of survey method and check dam size (independent variables) on the sediment wedge volume (dependent variable). For the size factor, the ten check dams were classified in larger (volume > 100 m3) and smaller (<100 m3) structures (measured using UAV). The correlation analysis was applied to find possible correlations among the analysed factors influencing the sediment wedge volume. Finally, the regression analysis was used to identify a linear model to fit the sediment wedge volume of a check dam (Vs, dependent variable) to the corresponding volume estimated using UAV-surveyed data (Vs′, independent variable), identified as above, according to the following equation:
V s = a V s + b
where a is the slope and b is the intercept of the model, while Vs and Vs′ are the actual and UAV-estimated sediment wedge volume of a check dam.
To test for homogeneity of variance, Levene’s test was used at a p level < 0.05.

3. Results and Discussion

3.1. Aerophotogrammetric Survey by UAV

The duration of each aerophotogrammetric survey was in the range 8 (check dam Piñero 2) to 29 (Palomar) minutes (Table 3). During this time, a number of points between 2.8 over an area of 0.63 ha (Piñero 3) and 10 million (Conejo, area of 1.51 ha) was surveyed. Point density (from 183, Grillo 2, to 430, Conejo, m−2) was on the average 328 m−2 and not always proportional to the number of points or area surveyed. The aerophotogrammetric survey produced DTMs with resolution of about 5.63 cm with a mean GSD of 1.27 cm and a mean RMSE of 0.432 m (Table 3). Figure 4 shows an example of 3D and classified point clouds as well as DTMs (shaded or not) of for Conejo (number 1) check dam. The point clouds covered the entire study area for each check dam and the surroundings, showing little variation in density in relation to the location. However, in the channels, having a less rough surface (regardless of slope), the point density was lower compared to the other areas of the sediment wedges (whose relief was less gentle), in which the highest point density was achieved (up to 430 points/m2, Figure 4).
It is interesting to note that RMSE and mainly DTM resolution were well correlated with the point density (r2 = 0.63 and 0.95, respectively, data not shown), which suggests increasing the density of clouds to increase the method accuracy.

3.2. Topographic Survey by Total Station and GNSS/RTK

The times for topographic surveys were longer compared to aerophotogrammetric surveys, the duration ranging from 1.5 to 3 (Palomar) hours; moreover, additional time was required to process the surveyed data (about 25 per check dam) (Table 4). Of course, the number of surveyed points was lower compared to the aerophotogrammetric survey by a 10−5 factor (about 3500 points surveyed against more than 51 million using UAV). Moreover, the total area surveyed was about one tenth of the area surveyed using UAV (1.9 against 10.5 ha). These noticeable differences led to a much lower point density (from 0.151, check dam Rayares 2, to 0.326, Piñero 1), but the RMSE of surveys (<0.04 m) was much lower compared to the value of UAV surveys (<0.6 m) (Table 4).
A sample of the surveyed points and the related TINs as well as the DTM of the sediment wedge of Conejo check dam is shown in Figure 4. For this check dam, as for the remaining none structures, the spatial evaluation of the density of point clouds highlights how this coverage is well dimensioned over the studied areas, both upstream and downstream of the check dams. Despite the limited density of points (0.194 points m−2), the information was concentrated only on the intersection of the points that delimit the sediment wedge and the channel cross sections (Figure 5).

3.3. Comparison of Survey Accuracy

The volume of the sediment wedges surveyed using the topographic method was in the range 45 (check dam Piñero 1a) to 586 (Palomar) m3 (Table 5). Compared to these reference values, the aerophotogrammetric survey provided values affected by an error between −28% (Piñero 2) and 38% (Conejo) with a mean value of 10%. This error was not correlated to the volume of the surveyed check dam (r2 < 0.10). In general, the aerophotogrammetric survey tended to overestimate the sediment wedge volume, except for the Piñero 2 check dam. Presumably, having two more control points at the base or end of the check dam could improve the volume estimates. According to one-way ANOVA, the statistical differences were not significant at p < 0.05, although sometime the extreme values were noticeable; however, in some cases when the check dams are not easily accessible (e.g., very steep areas with sense vegetation), aerophotogrammetric surveys are the only method to map sediment wedges of check dams and a mean error of 10% may be accepted. Neither the median values were different, as shown by Kruskal–Wallis test at the same significance level.
In general, a higher accuracy of the aerophotogrammetric method was noticed for check dams with small volume of the sediment wedge (<100 m3) (Figure 6), for which the absolute error was between 18 and 28%. Processing these data using multifactorial ANOVA, the sediment wedge volumes were different between check dam size but not between survey methods (at p < 0.05). This means that, for both survey methods and in some cases, the larger the size of the sediment wedge, the lower the probability of error. Therefore, the results of the aerophotogrammetric method seem to be more reliable for large-size structures, although more data would be needed to validate this statement.
The distribution of the point cloud characterizes the DTM’s ability to represent the surface of the check dam areas as well as its sediment wedges. From Figure 7 (representing the DTM obtained by the TIN from the aerophotogrammetric and topographic surveys for the Palomar check dam), the terrain model generated using UAV allowed a better geometric representation of the structure and its surroundings with a higher detail of the irregular surfaces of the study area. The DTM generated from the GNSS/RTK points represented the terrain more sparingly, while in the areas without any information, the terrain geometry was simplified (Figure 8).

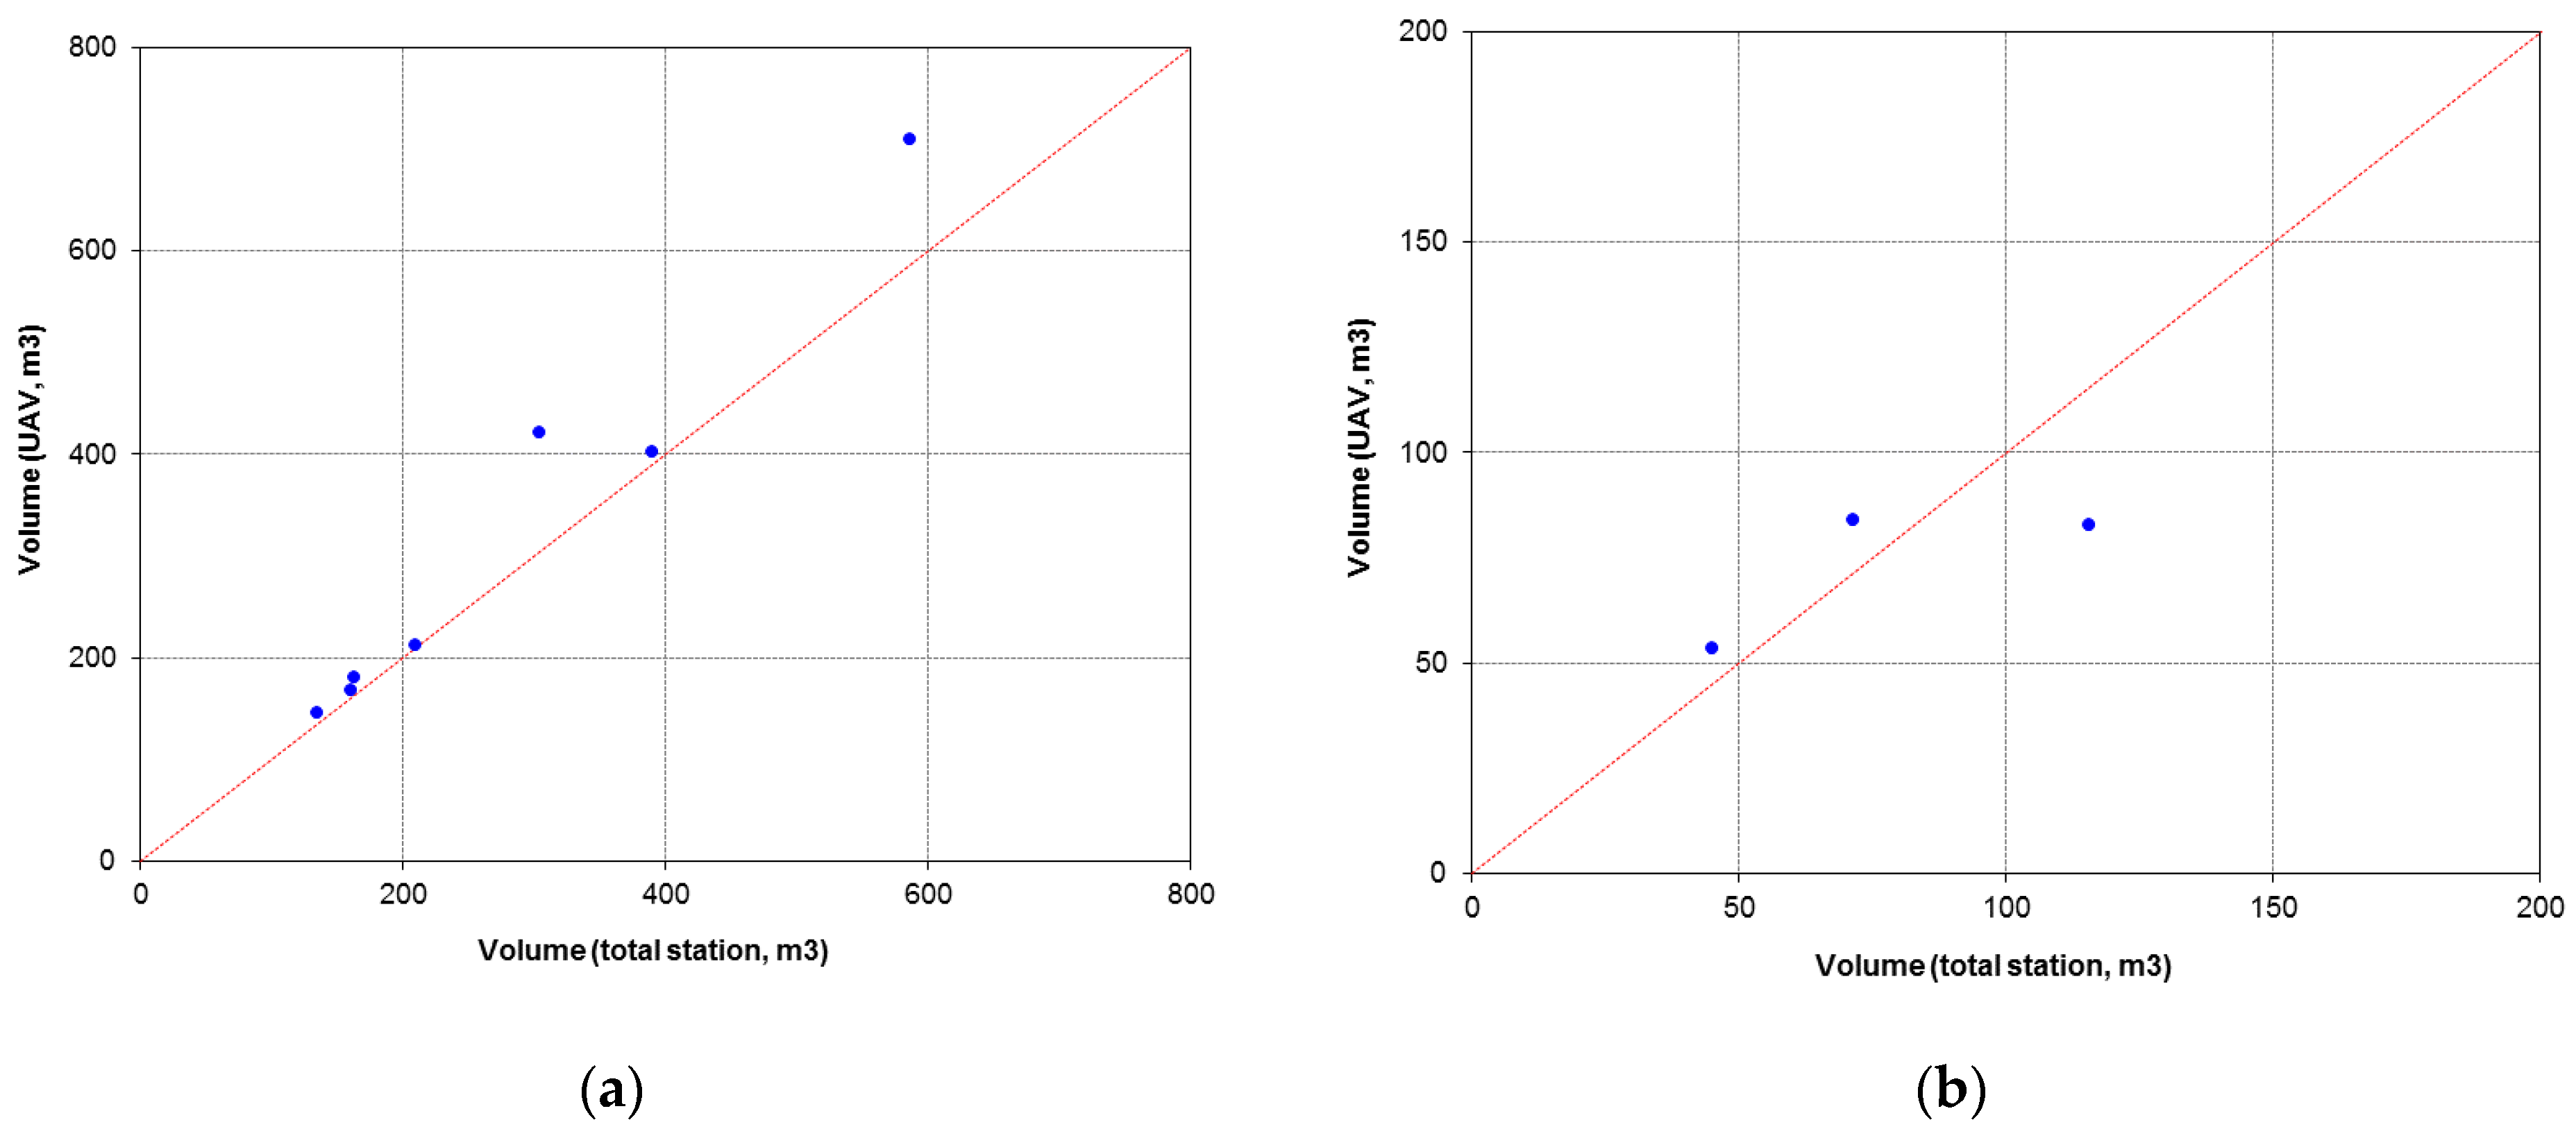
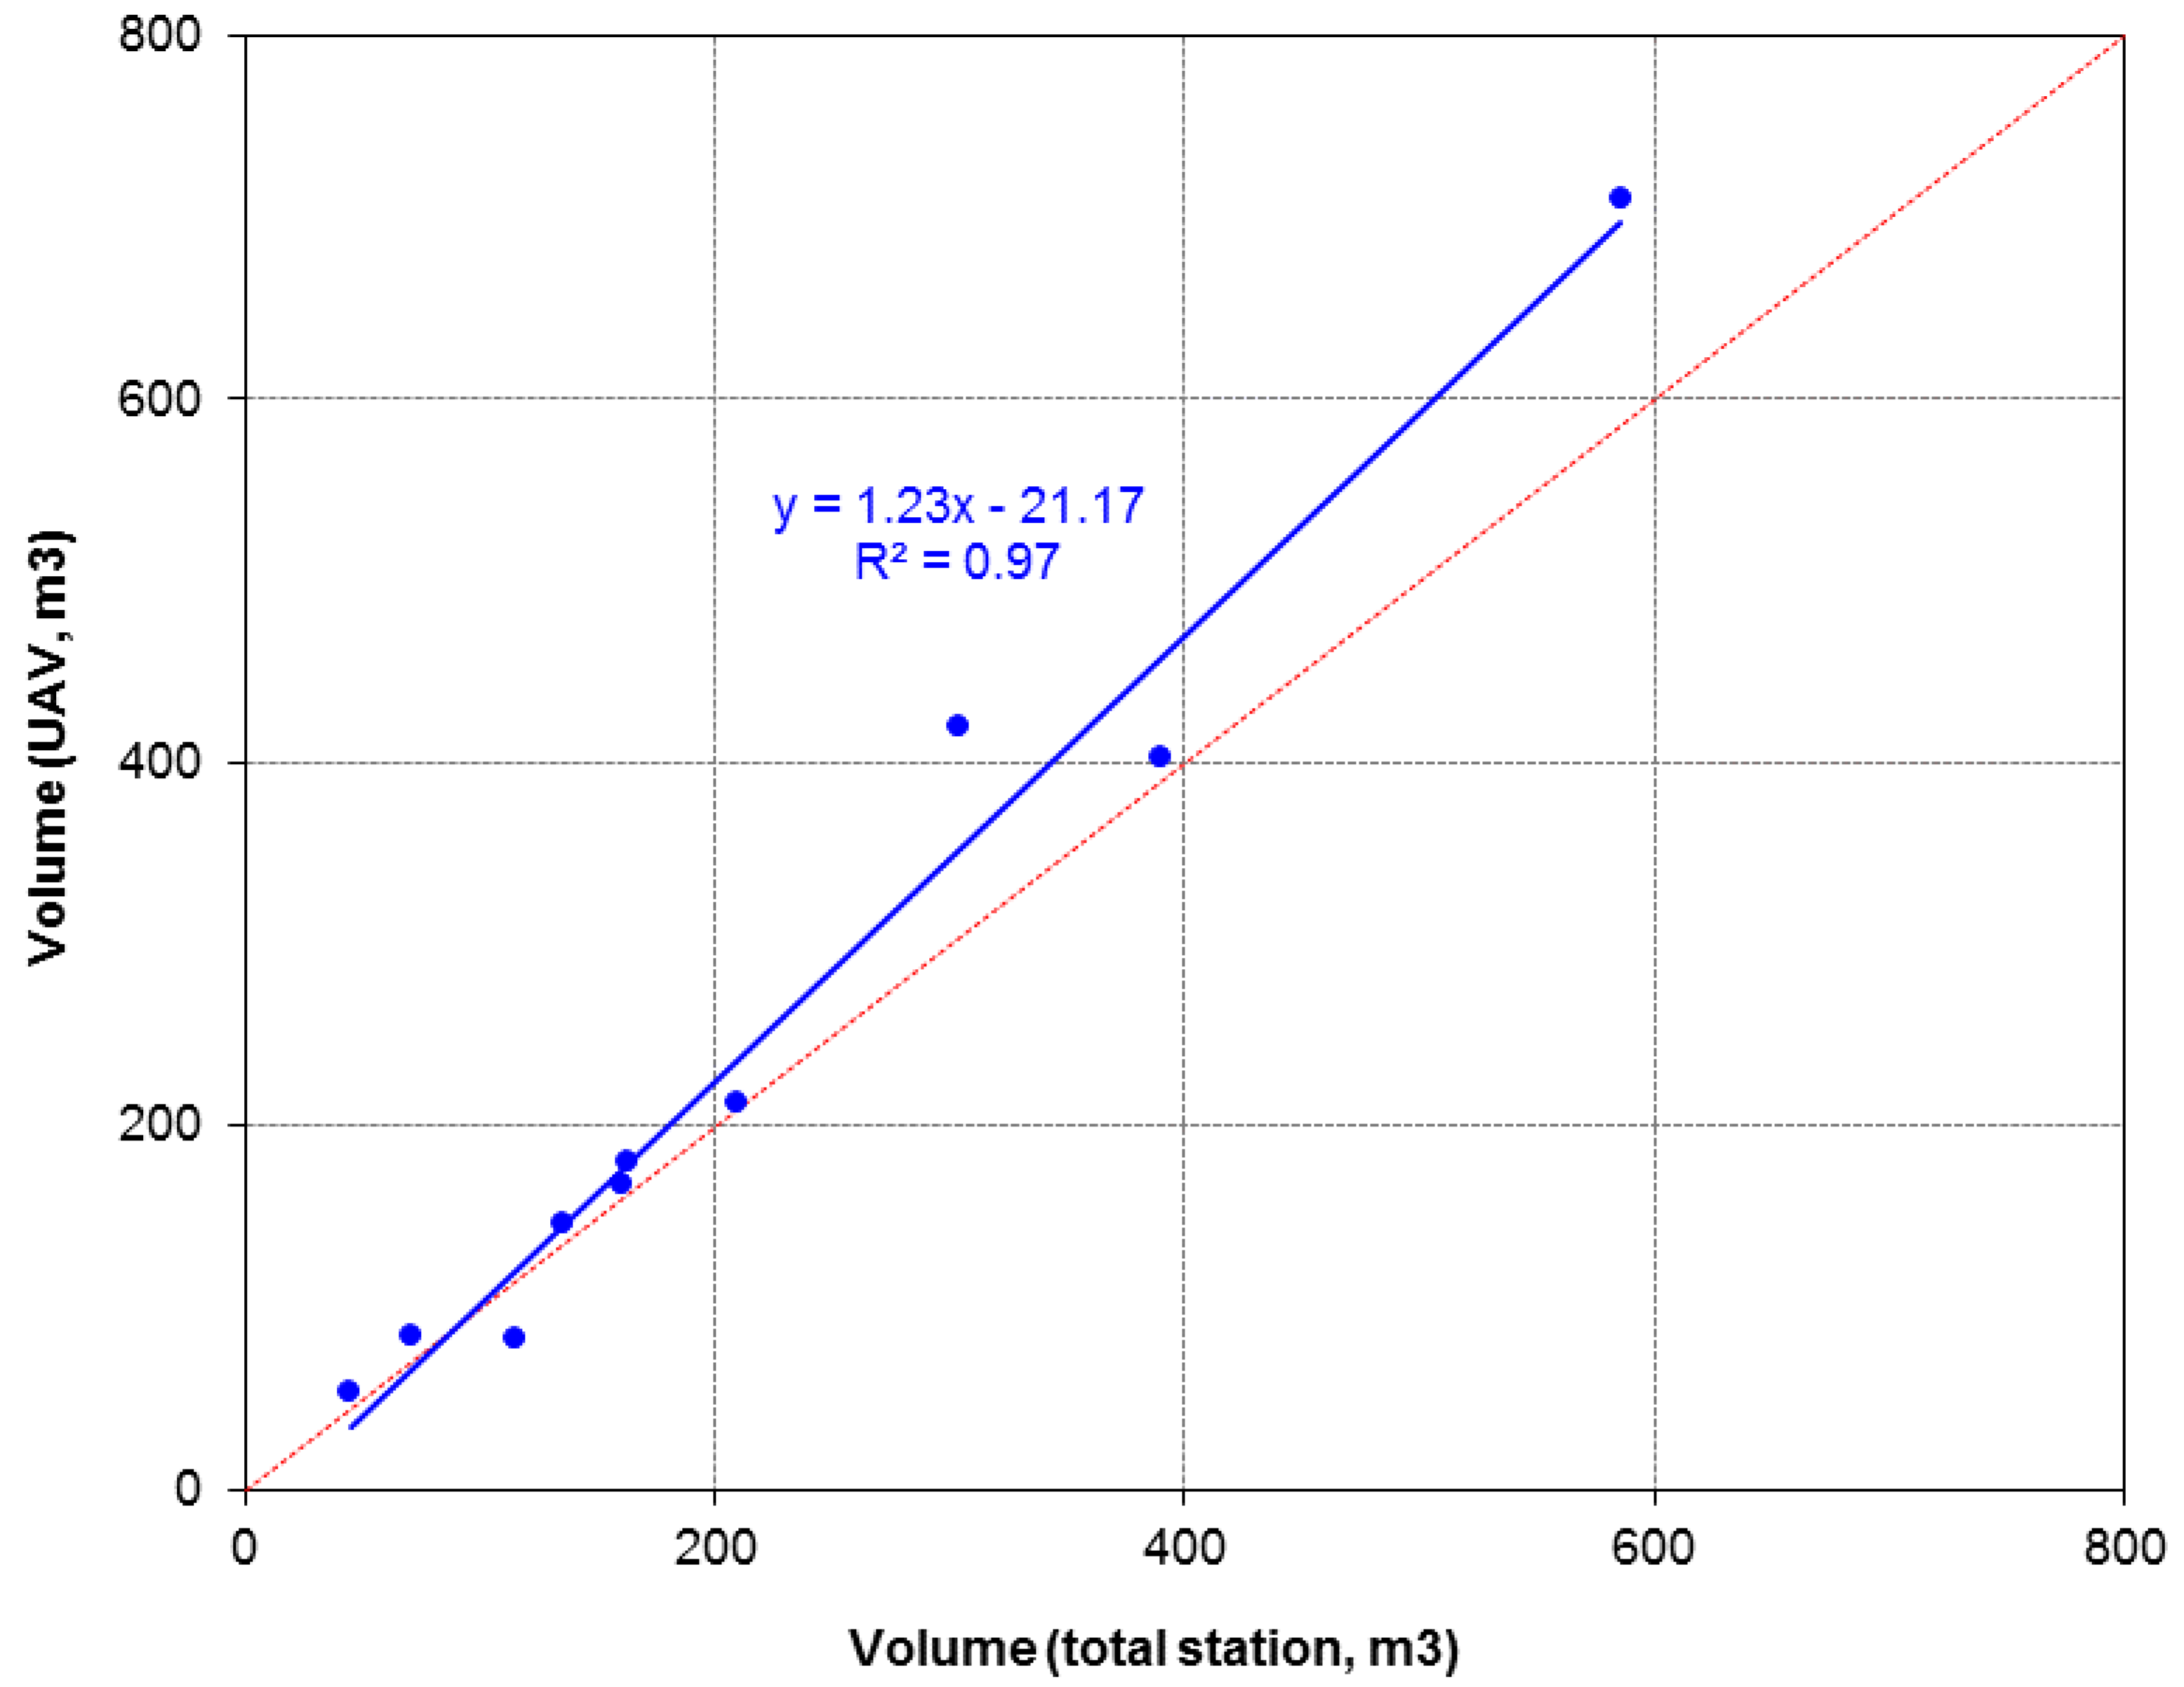
3.4. Correlation and Regression Analyses

A very high and significant (p < 0.05) coefficient of determination (r2 = 0.973) was observed when the sediment wedge volumes surveyed by UAV were linearly regressed on the topographic data (Figure 8). This means that the volume of the sediment stored behind a check dam can be simply estimated using the following linear model applied to data surveyed by UAV:
V s = 1.226 V s 21.171
1.226 and −21.171 being the slope (a) and the intercept (b) of Equation (3). This model explains 97.3% of the variability in Vs′ (Figure 9) with a mean absolute error of 24.19 m3.
Overall, the aerophotogrammetric surveys showed a good efficiency (quick time and low manpower requirement) and accuracy (precision and a high degree of detail) in mapping the surface of sediments stored close to restoration check dams, corroborating the results presented by Alfonso-Torreño et al. [47] and Da Silva et al. [55]. As a matter of fact, the surveys by UAV required only two days of fieldwork of two surveyors in the field compared to a requirement of six days using the GNSS/RTK method; however, the mapped area was wider and the acquired data amount larger. The additional time to filter and to point cloud classification is however important to further increase the method precision compared to the topographic survey. These efficiency and accuracy are very close to the most accurate survey methods proposed in the current literature for estimating sediment deposits (e.g., [36,37,47,55,56,57]), The surveys using UAV appears not only accurate and efficient (except in some cases) but also very practical to obtain 3D topographic information on the surface and the consequent volume of sediments, since these methods allow surveying in areas otherwise inaccessible to topographic methods (e.g., GNSS/RTK). However, a limiting factor against a more versatile use of the mapping methods by aerial survey is the unsuitability for areas with dense vegetation cover and/or very steep hillslopes [31,47,57], which still require terrestrial topography method, with the use of traditional equipment, such as total stations or, even, theodolite [36,37,58].

4. Conclusions

The estimation of sediment wedge volume of ten check dams built for limiting channel erosion and sediment transport in forest watersheds after a wildfire in Castilla La Mancha (Spain) using aerial survey with images generated by UAV was more accurate and efficient compared to surveys using terrestrial topography by GNSS. As a matter of fact, no significant differences in the sediment volume estimated by the two methods, although the UAV method was more accurate for larger check dams. Not only the aerophotogrammetric method was faster (two days of fieldwork against six required by the topographic method), but also the mapped areas were larger, and the density of points was much higher. Moreover, a significant correlation was observed between the volume estimates provided by the two methods, shown by a coefficient of determination close to 0.98. These results propose a larger use of the aerial surveys for mapping activities in channels regulated by check dams, such as those built for restoration of fire-affected forest watersheds. The reliability of these methods in channels with denser vegetation cover must be further explored to consolidate their use.

Author Contributions

Conceptualization, M.E.L.-B.; methodology, B.T.R., S.C., D.A.Z., J.G.-R., P.G., P.A.P.-Á., M.E.L.-B., and M.T.R.; formal analysis, S.C., D.A.Z., and M.E.L.-B.; data curation, B.T.R., S.C., D.A.Z., J.G.-R., P.G., P.A.P.-Á., M.E.L.-B., and M.T.R.; writing—original draft preparation, B.T.R., S.C., D.A.Z., J.G.-R., P.G., P.A.P.-Á., M.E.L.-B., and M.T.R.; writing—review and editing, D.A.Z. and M.E.L.-B.; supervision, M.E.L.-B. All authors have read and agreed to the published version of the manuscript.

Funding

This research received no external funding.

Institutional Review Board Statement

Not applicable.

Informed Consent Statement

Not applicable.

Data Availability Statement

The data presented in this study are available on request from the corresponding author.

Acknowledgments

Bruno Timoteo Rodriguez was supported by CNPq and CAPES (Doctoral Scholarships No 142067/2016-4 and 88881.190461/018-01). This author thanks Sergio Campo for giving guidelines to carry out this activity.

Conflicts of Interest

The authors declare no conflict of interest.

References

  1. Martínez-Fernández, J.; Vega-Garcia, C.; Chuvieco, E. Human-caused wildfire risk rating for prevention planning in Spain. J. Environ. Manag. 2009, 90, 1241–1252. [Google Scholar] [CrossRef] [PubMed]
  2. San-Miguel-Ayanz, J.; Moreno, J.M.; Camia, A. Analysis of large fires in European Mediterranean landscapes: Lessons learned and perspectives. For. Ecol. Manag. 2013, 294, 11–22. [Google Scholar] [CrossRef]
  3. Carvalho, A.; Monteiro, A.; Flannigan, M.; Solman, S.; Miranda, A.I.; Borrego, C. Forest fires in a changing climate and their impacts on air quality. Atmos. Environ. 2011, 45, 5545–5553. [Google Scholar] [CrossRef]
  4. Pechony, O.; Shindell, D.T. Driving forces of global wildfires over the past millennium and the forthcoming century. Proc. Natl. Acad. Sci. USA 2010, 107, 19167–19170. [Google Scholar] [CrossRef] [Green Version]
  5. Certini, G. Fire as a soil-forming factor. Ambio 2014, 43, 191–195. [Google Scholar] [CrossRef] [Green Version]
  6. Mavsar, R.; Varela, E.; Corona, P.; Barbati, A.; Marsh, G. Economic, legal and social aspects of post-fire management. In Managing Forest Ecosystems: The Challenge of Climate Change; Springer Nature: Dordrecht, The Nederlands, 2011; pp. 45–78. [Google Scholar]
  7. Bowman, D.M.J.S.; Balch, J.K.; Artaxo, P.; Bond, W.J.; Carlson, J.M.; Cochrane, M.A.; D’Antonio, C.M.; DeFries, R.S.; Doyle, J.C.; Harrison, S.P.; et al. Fire in the Earth System. Science 2009, 324, 481–484. [Google Scholar] [CrossRef]
  8. Bento-Gonçalves, A.; Vieira, A.; Úbeda, X.; Martin, D. Fire and soils: Key concepts and recent advances. Geoderma 2012, 191, 3–13. [Google Scholar] [CrossRef]
  9. Ferreira, A.J.D.; Prats, S.A.; Coelho, C.O.A.; Shakesby, R.A.; Páscoa, F.M.; Ferreira, C.S.S.; Keizer, J.J.; Ritsema, C. Strategies to prevent forest fires and techniques to reverse degradation processes in burned areas. Catena 2015, 128, 224–237. [Google Scholar] [CrossRef]
  10. Shakesby, R. Post-wildfire soil erosion in the Mediterranean: Review and future research directions. Earth Sci. Rev. 2011, 105, 71–100. [Google Scholar] [CrossRef]
  11. Shakesby, A.R.; Boakes, D.J.; Coelho, C.D.O.; Gonçalves, A.B.; Walsh, R.P. Limiting the soil degradational impacts of wildfire in pine and eucalyptus forests in Portugal. Appl. Geogr. 1996, 16, 337–355. [Google Scholar] [CrossRef]
  12. Plaza-Álvarez, P.A.; Lucas-Borja, M.; Sagra, J.; Moya, D.; Alfaro-Sánchez, R.; González-Romero, J.; Heras, J.D.L. Changes in soil water repellency after prescribed burnings in three different Mediterranean forest ecosystems. Sci. Total Environ. 2018, 644, 247–255. [Google Scholar] [CrossRef]
  13. Plaza-Álvarez, P.; Lucas-Borja, M.; Sagra, J.; Zema, D.; González-Romero, J.; Moya, D.; Heras, J.D.L. Changes in soil hydraulic conductivity after prescribed fires in Mediterranean pine forests. J. Environ. Manag. 2019, 232, 1021–1027. [Google Scholar] [CrossRef]
  14. Lucas-Borja, M.E.; Fonseca, T.; Lousada, J.L.; Santos, P.S.; Martínez García, E.; Abellán, M.A. Natural regeneration of Spanish black pine (Pinus nigra Arn. ssp. salzmannii (Dunal) Franco) at contrasting altitudes in a Mediterranean mountain area. Ecol. Res. 2012, 27, 913–921. [Google Scholar] [CrossRef]
  15. Vieira, D.; Serpa, D.; Nunes, J.; Prats, S.; Neves, R.; Keizer, J. Predicting the effectiveness of different mulching techniques in reducing post-fire runoff and erosion at plot scale with the RUSLE, MMF and PESERA models. Environ. Res. 2018, 165, 365–378. [Google Scholar] [CrossRef]
  16. Martínez-Murillo, J.F.; López-Vicente, M. Effect of salvage logging and check dams on simulated hydrological connectivity in a burned area. Land Degrad. Dev. 2018, 29, 701–712. [Google Scholar] [CrossRef] [Green Version]
  17. Prosser, I.P.; Williams, L. The effect of wildfire on runoff and erosion in native Eucalyptus forest. Hydrol. Process. 1998, 12, 251–265. [Google Scholar] [CrossRef]
  18. Keizer, J.J.; Silva, F.C.; Vieira, D.; González-Pelayo, O.; Campos, I.; Vieira, A.; Valente, S.; Prats, S. The effectiveness of two contrasting mulch application rates to reduce post-fire erosion in a Portuguese eucalypt plantation. Catena 2018, 169, 21–30. [Google Scholar] [CrossRef]
  19. Wilson, C.; Kampf, S.K.; Wagenbrenner, J.W.; Macdonald, L.H. Rainfall thresholds for post-fire runoff and sediment delivery from plot to watershed scales. For. Ecol. Manag. 2018, 430, 346–356. [Google Scholar] [CrossRef]
  20. Brevik, E.C.; Pereira, P.; Muñoz-Rojas, M.; Miller, B.A.; Cerdà, A.; Parras-Alcántara, L.; Lozano-García, B. Historical perspectives on soil mapping and process modeling for sustainable land use management. In Soil Mapping and Process Modeling for Sustainable Land Use Management; Elsevier BV: Amsterdam, The Netherlands, 2017; pp. 3–28. [Google Scholar]
  21. Gonzalez-Romero, J.; Lucas-Borja, M.; Plaza-Álvarez, P.A.; Sagra, J.; Moya, D.; Heras, J.D.L. Temporal effects of post-fire check dam construction on soil functionality in SE Spain. Sci. Total Environ. 2018, 642, 117–124. [Google Scholar] [CrossRef]
  22. Nichols, M.; McReynolds, K.; Reed, C. Short-term soil moisture response to low-tech erosion control structures in a semiarid rangeland. Catena 2012, 98, 104–109. [Google Scholar] [CrossRef]
  23. Lucas-Borja, M.E.; Zema, D.A.; Guzman, M.D.H.; Yang, Y.; Hernández, A.C.; Xiangzhou, X.; Carrà, B.G.; Nichols, M.; Cerdá, A. Exploring the influence of vegetation cover, sediment storage capacity and channel dimensions on stone check dam conditions and effectiveness in a large regulated river in México. Ecol. Eng. 2018, 122, 39–47. [Google Scholar] [CrossRef] [Green Version]
  24. Boix-Fayos, C.; Barberá, G.; López-Bermúdez, F.; Castillo, V. Effects of check dams, reforestation and land-use changes on river channel morphology: Case study of the Rogativa catchment (Murcia, Spain). Geomorphology 2007, 91, 103–123. [Google Scholar] [CrossRef]
  25. Boix-Fayos, C.; De Vente, J.; Martínez-Mena, M.; Barberá, G.G.; Castillo, V. The impact of land use change and check-dams on catchment sediment yield. Hydrol. Process. 2008, 22, 4922–4935. [Google Scholar] [CrossRef]
  26. Bombino, G.; Boix-Fayos, C.; Gurnell, A.M.; Tamburino, V.; Zema, D.A.; Zimbone, S.M. Check dam influence on vegetation species diversity in mountain torrents of the Mediterranean environment. Ecohydrology 2013, 7, 678–691. [Google Scholar] [CrossRef]
  27. Bombino, G.; Zema, D.A.; Denisi, P.; Lucas-Borja, M.E.; Labate, A.; Zimbone, S.M. Assessment of riparian vegetation characteristics in Mediterranean headwaters regulated by check dams using multivariate statistical techniques. Sci. Total Environ. 2019, 657, 597–607. [Google Scholar] [CrossRef]
  28. Zema, D.A.; Bombino, G.; Denisi, P.; Lucas-Borja, M.E.; Zimbone, S.M. Evaluating the effects of check dams on channel geometry, bed sediment size and riparian vegetation in Mediterranean mountain torrents. Sci. Total Environ. 2018, 642, 327–340. [Google Scholar] [CrossRef]
  29. Castillo, V.M.; Mosch, W.; García, C.C.; Barberá, G.G.; Navarro-Cano, J.A.; López-Bermúdez, F. Effectiveness and geomorphological impacts of check dams for soil erosion control in a semiarid Mediterranean catchment: El Cárcavo (Murcia, Spain). Catena 2007, 70, 416–427. [Google Scholar] [CrossRef]
  30. Nadeu, E.; Quiñonero-Rubio, J.M.; De Vente, J.; Boix-Fayos, C. The influence of catchment morphology, lithology and land use on soil organic carbon export in a Mediterranean mountain region. Catena 2015, 126, 117–125. [Google Scholar] [CrossRef]
  31. Gómez-Gutiérrez, Á.; Schnabel, S.; Lavado Contador, F.; Sanjose, J.J.; Atkinson, A.D.J.; Pulido Fernandez, M.; Sánchez Fernández, M. Studying the influence of livestock pressure on gully erosion in rangelands of SW Spain by means of the UAV+SfM workflow. B Asoc. Geógr. Esp. 2018, 78, 66–88. [Google Scholar] [CrossRef]
  32. Mekonnen, M.; Keesstra, S.; Baartman, J.; Ritsema, C.; Melesse, A. Evaluating sediment storage dams: Structural off-site sediment trapping measures in northwest Ethiopia. Cuad. Investig. Geográfica 2015, 41, 7–22. [Google Scholar] [CrossRef] [Green Version]
  33. Mekonnen, M.; Keesstra, S.D.; Stroosnijder, L.; Baartman, J.E.M.; Maroulis, J. Soil conservation through sediment trapping: A review. Land Degrad. Dev. 2015, 26, 544–556. [Google Scholar] [CrossRef]
  34. Ramos-Diez, I.; Navarro-Hevia, J.; Fernández, R.S.M.; Díaz-Gutiérrez, V.; Mongil-Manso, J. Analysis of methods to determine the sediment retained by check dams and to estimate erosion rates in badlands. Environ. Monit. Assess. 2016, 188, 405. [Google Scholar] [CrossRef]
  35. Ramos-Diez, I.; Navarro-Hevia, J.; Fernández, R.S.M.; Díaz-Gutiérrez, V.; Mongil-Manso, J. Geometric models for measuring sediment wedge volume in retention check dams. Water Environ. J. 2016, 30, 119–127. [Google Scholar] [CrossRef]
  36. Ramos-Diez, I.; Navarro-Hevia, J.; San Martín Fernández, R.; Mongil-Manso, J. Final analysis of the accuracy and precision of methods to calculate the sediment retained by check dams. Land Degrad. Dev. 2017, 28, 2446–2456. [Google Scholar] [CrossRef]
  37. Ramos-Diez, I.; Navarro-Hevia, J.; Fernández, R.S.M.; Díaz-Gutiérrez, V.; Mongil-Manso, J. Evaluating methods to quantify sediment volumes trapped behind check dams, Saldaña badlands (Spain). Int. J. Sediment Res. 2017, 32, 1–11. [Google Scholar] [CrossRef]
  38. Bombino, G.; Gurnell, A.M.; Tamburino, V.; Zema, D.A.; Zimbone, S.M. Adjustments in channel form, sediment calibre and vegetation around check-dams in the headwater reaches of mountain torrents, Calabria, Italy. Earth Surf. Process. Landf. 2009, 34, 1011–1021. [Google Scholar] [CrossRef]
  39. Vagnon, F. Design of active debris flow mitigation measures: A comprehensive analysis of existing impact models. Landslides 2019, 17, 313–333. [Google Scholar] [CrossRef]
  40. Díaz-Gutiérrez, V.; Mongil-Manso, J.; Navarro-Hevia, J.; Ramos-Díez, I. Check dams and sediment control: Final results of a case study in the upper Corneja River (Central Spain). J. Soils Sediments 2019, 19, 451–466. [Google Scholar] [CrossRef]
  41. Zema, D.A.; Bombino, G.; Boix-Fayos, C.; Tamburino, V.; Zimbone, S.M.; Fortugno, D. Evaluation and modeling of scouring and sedimentation around check dams in a Mediterranean torrent in Calabria, Italy. J. Soil Water Conserv. 2014, 69, 316–329. [Google Scholar] [CrossRef]
  42. Piton, G.; Recking, A. Effects of check dams on bed-load transport and steep-slope stream morphodynamics. Geomorphology 2017, 291, 94–105. [Google Scholar] [CrossRef]
  43. Abedini, M.; Said, M.A.; Ahmad, F. Effectiveness of check dam to control soil erosion in a tropoical catchment (The Ulu Kinta Basin). Catena 2012, 97, 63–70. [Google Scholar] [CrossRef]
  44. Gutiérrez, V.D.; Mongil, J.; Navarro, J. Topographical surveying for improved assessment of sediment retention in check dams applied to a Mediterranean badlands restoration site (Central Spain). J. Soils Sediments 2014, 14, 2045–2056. [Google Scholar] [CrossRef]
  45. Romero-Díaz, A.; Alonso-Sarriá, F.; Martínez-Lloris, M. Erosion rates obtained from check-dam sedimentation (SE Spain). A multi-method comparison. Catena 2007, 71, 172–178. [Google Scholar] [CrossRef]
  46. Bellin, N.; Vanacker, V.; Van Wesemael, B.; Solé-Benet, A.; Bakker, M. Natural and anthropogenic controls on soil erosion in the Internal Betic Cordillera (southeast Spain). Catena 2011, 87, 190–200. [Google Scholar] [CrossRef] [Green Version]
  47. Alfonso-Torreño, A.; Gómez-Gutiérrez, A.; Schnabel, S.; J-Francisco, L.C.; de Sanjosé Blasco, J.J.; Fernández, M.S. sUAS, SfM-MVS photogrammetry and a topographic algorithm method to quantify the volume of sediments retained in check-dams. Sci. Total Environ. 2019, 678, 369–382. [Google Scholar]
  48. Cucchiaro, S.; Cavalli, M.; Vericat, D.; Crema, S.; Llena, M.; Beinat, A.; Marchi, L.; Cazorzi, F. Geomorphic effectiveness of check dams in a debris-flow catchment using multi-temporal topographic surveys. Catena 2019, 174, 73–83. [Google Scholar] [CrossRef]
  49. Gómez-Sánchez, E.; de Las Heras, J.; Lucas-Borja, M.E.; Moya, D. Assessing fire severity in semi-arid environments: Application in Donceles 2012 wildfire (SE Spain). Rev. Teledetección 2017, 49, 103–113. [Google Scholar]
  50. Gómez-Sánchez, E.; Lucas-Borja, M.E.; Plaza-Álvarez, P.; González-Romero, J.; Sagra, J.; Moya, D.; Heras, J.D.L. Effects of post-fire hillslope stabilisation techniques on chemical, physico-chemical and microbiological soil properties in mediterranean forest ecosystems. J. Environ. Manag. 2019, 246, 229–238. [Google Scholar] [CrossRef]
  51. Kottek, M.; Grieser, J.; Beck, C.; Rudolf, B.; Rubel, F. World Map of the Köppen-Geiger climate classification updated. Meteorol. Z. 2006, 15, 259–263. [Google Scholar] [CrossRef]
  52. Rivas-Martínez, S.; Díaz, T.E.; Fernánez-González, F.; Izco, J.; Loidi, J.; Lousã, M. Penas Vascular plant comunities of Spain and Portugal. Itinera Geobot. 2012, 15, 5–922. [Google Scholar]
  53. USDA Soil Taxonomy. A basic system of soil classification for making and interpreting soil surveys. Second edition. Geol. Mag. 1999, 114, 886. [Google Scholar]
  54. Falkner, E. Aerial Mapping: Methods and Applications, 1st ed.; Lewis Publishers: Boca Raton, FL, USA, 1995; p. 322. [Google Scholar]
  55. Da Silva, C.A.; Duarte, C.R.; Souto, M.V.S.; Dos Santos, A.L.S.; Amaro, V.E.; Bicho, C.P.; Sabadia, J. Avaliação da acurácia do cálculo de volume de pilhas de rejeito utilizando vant, GNSS e lidar. Bol. Ciências Geodésicas 2016, 22, 73–94. [Google Scholar] [CrossRef] [Green Version]
  56. Sougnez, N.; Van Wesemael, B.; Vanacker, V. Low erosion rates measured for steep, sparsely vegetated catchments in southeast Spain. Catena 2011, 84, 1–11. [Google Scholar] [CrossRef]
  57. Westoby, M.J.; Brasington, J.; Glasser, N.F.; Hambrey, M.J.; Reynolds, J.M. ‘Structure-from-Motion’ photogrammetry: A low-cost, effective tool for geoscience applications. Geomorphology 2012, 179, 300–314. [Google Scholar] [CrossRef] [Green Version]
  58. Wei, Y.; He, Z.; Li, Y.; Jiao, J.; Zhao, G.; Mu, X. Sediment yield deduction from check–dams deposition in the weathered sandstone watershed on the North Loess plateau, China. Land Degrad. Dev. 2016, 28, 217–231. [Google Scholar] [CrossRef]
Figure 1. Location (upper) and map (lower) of the experimental watershed (Sierra de Los Donceles, Castilla La Mancha, Spain) with ten check dams mapped using aerophotogrammetric and topographic methods.
Soilsystems 05 00009 g001
Figure 2. Workflow of the process for calculating sediment wedge behind check dams using aerophogrammetric (by UAV) and topographic (by total station) methods.
Soilsystems 05 00009 g002
Figure 3. Example of a channel cross section in proximity of a check dam (the brown line is the sediment wedge profile, the red line the channel profile, and the green line is the hypothesized bank profile close to the sediment wedge; the yellow-shadowed line is the area of the channel cross section).
Soilsystems 05 00009 g003
Figure 4. Cartographic products obtained in the aerophotogrammetric survey for Conejo (number 1) check dam (Sierra de Los Donceles forest, Castilla La Mancha, Spain): (a) 3D point cloud; (b) Classified point cloud; (c) Digital Terrain Model (DTM); (d) Shaded DTM.
Soilsystems 05 00009 g004
Figure 5. Points and related Triangular Irregular Network (TIN, (a) as well as Digital Terrain Model (DTM, (b) obtained in the topographic survey for Grillo (number 3) check dam (Sierra de Los Donceles forest, Castilla La Mancha, Spain).
Soilsystems 05 00009 g005
Figure 6. Scatter plots of sediment wedge volumes measured by the aerophotogrammetric and topographic methods for ten check dams (Sierra de Los Donceles forest, Castilla La Mancha, Spain) (a), larger check dams, V > 100 m3, (b), smaller check dams, V < 100 m3.
Soilsystems 05 00009 g006
Figure 7. Point clouds obtained by the topographic (a) and aerophotogrammetric (b) methods for the Palomar check dam (Sierra de Los Donceles forest, Castilla La Mancha, Spain).
Soilsystems 05 00009 g007
Figure 8. Digital Terrain Models (DTMs) obtained by the topographic (a) and aerophotogrammetric (b) methods for the Palomar check dam (Sierra de Los Donceles forest, Castilla La Mancha, Spain).
Soilsystems 05 00009 g008
Figure 9. Regression of sediment wedge volumes estimated by the aerophotogrammetric and topographic methods for ten check dams (Sierra de Los Donceles forest, Castilla La Mancha, Spain).
Soilsystems 05 00009 g009
Table 1. Main characteristics of the ten check dams included in the post fire emergency restoration works in Sierra de Los Donceles forest by the government of Castilla-La Mancha Region (Spain).
Check DamNameGeographic Coordinates *Construction DateSize (m)Material
XYWidthHeight
1Conejo6103374252597September 201338.356.25Concrete
2Palomar6116704251744July 201338.756.40
3Grillo 16144524251197November 201326.006.70
4Grillo 26142914250787October 201321.004.90
5Piñero 1a6133574249539July 201323.002.90
6Piñero 1b6133934249533July 201338.005.80
7Piñero 36138504249857September 201326.006.38
8Piñero 26125414249848October 201329.004.25
9Rayares 26094014249979November 201336.006.45
10Rayares 16087264250782November 201328.006.22
Note: * = UTM and Datum ETRS89 geographic coordinate system.
Table 2. Configuration data about the UAV flight plans for aerophotogrammetric surveys in Sierra de Los Donceles forest (Castilla-La Mancha, Spain).
Check DamNameFlight Characteristics
Area (m2)GSD (cm)Number of Caught Photos Flight Time (min)Flight Speed (m/s)Frontal Overlap (%)Lateral Overlap (%)
1Conejo68021.35803.3858080
2Palomar88741004.38
3Grillo 18223904.05
4Grillo 26047673.24
5 and 6Piñero 1 (a and b)10,2301315.23
7Piñero 35059562.46
8Piñero 25567683.08
9Rayares 25761713.28
10Rayares 15321632.48
TOTAL 61,884 72631.58
Note: GSD = Ground Sample Distance.
Table 3. Results of the aerophotogrammetric surveys using an unmanned aerial vehicle (UAV) in Sierra de Los Donceles forest (Castilla-La Mancha, Spain).
Check DamNameProcessing Time
(h, min and s)
Number of PointsArea (ha)Point Density (m−2)GSD (cm)RMSE (m)DTM Resolution (cm)
1Conejo27 min 39 s9,957,8561.51429.731.210.3694.82
2Palomar28 min 55 s8,718,9221.74339.831.360.4245.42
3Grillo 113 min 27 s5,544,7861.16330.641.370.5035.50
4Grillo 211 min 50 s3,109,5161.04182.831.850.5737.40
5 and 6Piñero 1
(a and b)
16 min 16 s6,743,4761.75280.091.490.3995.98
7Piñero 308 min 22 s2,817,6970.63293.181.460.4215.84
8Piñero 208 min 12 s4,668,1600.91364.991.310.4175.23
9Rayares 207 min 33 s5,768,4040.89409.511.240.3624.94
10Rayares 108 min 13 s4,047,3760.85320.561.400.4195.59
Mean-327.931.270.4325.63
Total-2 h 10 min 27 s51.376.19310.48-
Notes: GSD = Ground Sample Distance; RMSE = Root Mean Square Error; DTM = Digital Terrain Model.
Table 4. Results of the topographic surveys using a total station and GNSS/RTK in ten check dams of Sierra de Los Donceles forest (Castilla-La Mancha, Spain).
Check DamNameDuration of Field Survey
(h and min)
Processing Time (min)Number of PointsArea (ha)Point Density
(m−2)
RMSE (m)
1Conejo≈1 h 30 min≈25 min5490.2680.204<0.04
2Palomar4000.3240.123
3Grillo 12910.1120.260
4Grillo 22960.1290.228
5 and 6Piñero 1
(a and b)
≈3 h 00 min≈50 min5930.3260.182
7Piñero 3≈1 h 30 min≈25 min2970.1360.218
8Piñero 23650.2070.176
9Rayares 22570.1700.151
10Rayares 14230.2100.201
Mean-0.194
Total-≈15 h 00 min≈4 h 10 min34711.882-
Notes: RMSE = Root Mean Square Error.
Table 5. Volume of sediment wedge (in m3) measured by aerophotogrammetric (using an UAV) and topographic (using a total station) methods in ten check dams of Sierra de Los Donceles forest (Castilla-La Mancha, Spain).
Check DamUAVTotal StationDifference (%)
Conejo42130538.1
Palomar71058621.2
Grillo 11681604.9
Grillo 22132101.5
Piñero 1a544519.1
Piñero 1b18016410.1
Piñero 31461357.6
Piñero 283116−28.4
Rayares 24033903.5
Rayares 1847117.7
Publisher’s Note: MDPI stays neutral with regard to jurisdictional claims in published maps and institutional affiliations.

