Review

Application of Nematode Community Analyses-Based Models towards Identifying Sustainable Soil Health Management Outcomes: A Review of the Concepts

by
Haddish Melakeberhan
1,*,
Gregory Bonito
2 and
Alexandra N. Kravchenko
2
1
Agricultural Nematology Laboratory, Department of Horticulture, Michigan State University (MSU), East Lansing, MI 48824, USA
2
Department of Plant, Soil and Microbial Sciences, Michigan State University (MSU), East Lansing, MI 48824, USA
*
Author to whom correspondence should be addressed.
Submission received: 4 April 2021 / Revised: 10 May 2021 / Accepted: 17 May 2021 / Published: 21 May 2021

Abstract

:
Soil health connotes the balance of biological, physicochemical, nutritional, structural, and water-holding components necessary to sustain plant productivity. Despite a substantial knowledge base, achieving sustainable soil health remains a goal because it is difficult to simultaneously: (i) improve soil structure, physicochemistry, water-holding capacity, and nutrient cycling; (ii) suppress pests and diseases while increasing beneficial organisms; and (iii) improve biological functioning leading to improved biomass/crop yield. The objectives of this review are (a) to identify agricultural practices (APs) driving soil health degradations and barriers to developing sustainable soil health, and (b) to describe how the nematode community analyses-based soil food web (SFW) and fertilizer use efficiency (FUE) data visualization models can be used towards developing sustainable soil health. The SFW model considers changes in beneficial nematode population dynamics relative to food and reproduction (enrichment index, EI; y-axis) and resistance to disturbance (structure index, SI; x-axis) in order to identify best-to-worst case scenarios for nutrient cycling and agroecosystem suitability of AP-driven outcomes. The FUE model visualizes associations between beneficial and plant-parasitic nematodes (x-axis) and ecosystem services (e.g., yield or nutrients, y-axis). The x-y relationship identifies best-to-worst case scenarios of the outcomes for sustainability. Both models can serve as platforms towards developing integrated and sustainable soil health management strategies on a location-specific or a one-size-fits-all basis. Future improvements for increased implementation of these models are discussed.

1. Introduction

1.1. What Are the Characteristics of Sustainable Soil Health?

Healthy soils are the foundation for meeting the increasing world population’s needs for food, fiber, nutrition, and healthy environment on a limited landmass further confounded by climate change grand challenge that requires multi-dimensional solutions [1,2,3,4,5,6,7,8]. Soil health—the capacity of a soil to generate desirable ecosystem services—requires a dynamic balance among biological, physiochemical, nutritional, structural, and water-holding components [1,9,10,11,12]. Developing a sustainable soil health for both agricultural (annual to perennial; row and non-row crops) and managed natural (forests, grasslands, rangelands) production systems is central to meeting both food demands and to reducing environmental damage [3,5,6,10,13,14,15]. In this context, we define sustainable soil health as one that simultaneously generates three sets of desirable ecosystem services [9,12,16,17,18,19,20,21,22,23,24,25] while meeting environmental and economic expectations [5,26,27,28,29,30]. These three sets of desirable ecosystem services are to: (i) improve soil structure, physiochemistry, water-holding capacity and nutrient cycling; (ii) suppress pests and diseases while increasing beneficial organisms; and (iii) improve biological functioning leading to improved biomass/crop yield, simultaneously. When soil health is out of balance, it becomes difficult to generate the desirable ecosystem services [10,11,12,13,27,28,29,30,31,32,33,34].
The objectives of this review are two-fold: First is to identify barriers to developing sustainable soil health through a conceptual understanding of agriculture’s footprint in the cycle of soil health degradations; and second is to describe how nematode-based soil food web (SFW) [34] and fertilizer use efficiency (FUE) [28,29,30] models can serve as integrated soil health management decision-making tools. The SFW model uses changes in population dynamics of beneficial nematodes to identify best-to-worst outcomes for agroecosystem suitability. The FUE model uses beneficial and harmful nematodes to identify if the outcomes meet the definition of sustainable soil health. This review highlights how these two models can serve as a platform towards developing integrated and sustainable soil health management strategies on a location-specific or a one-size-fits-all basis.

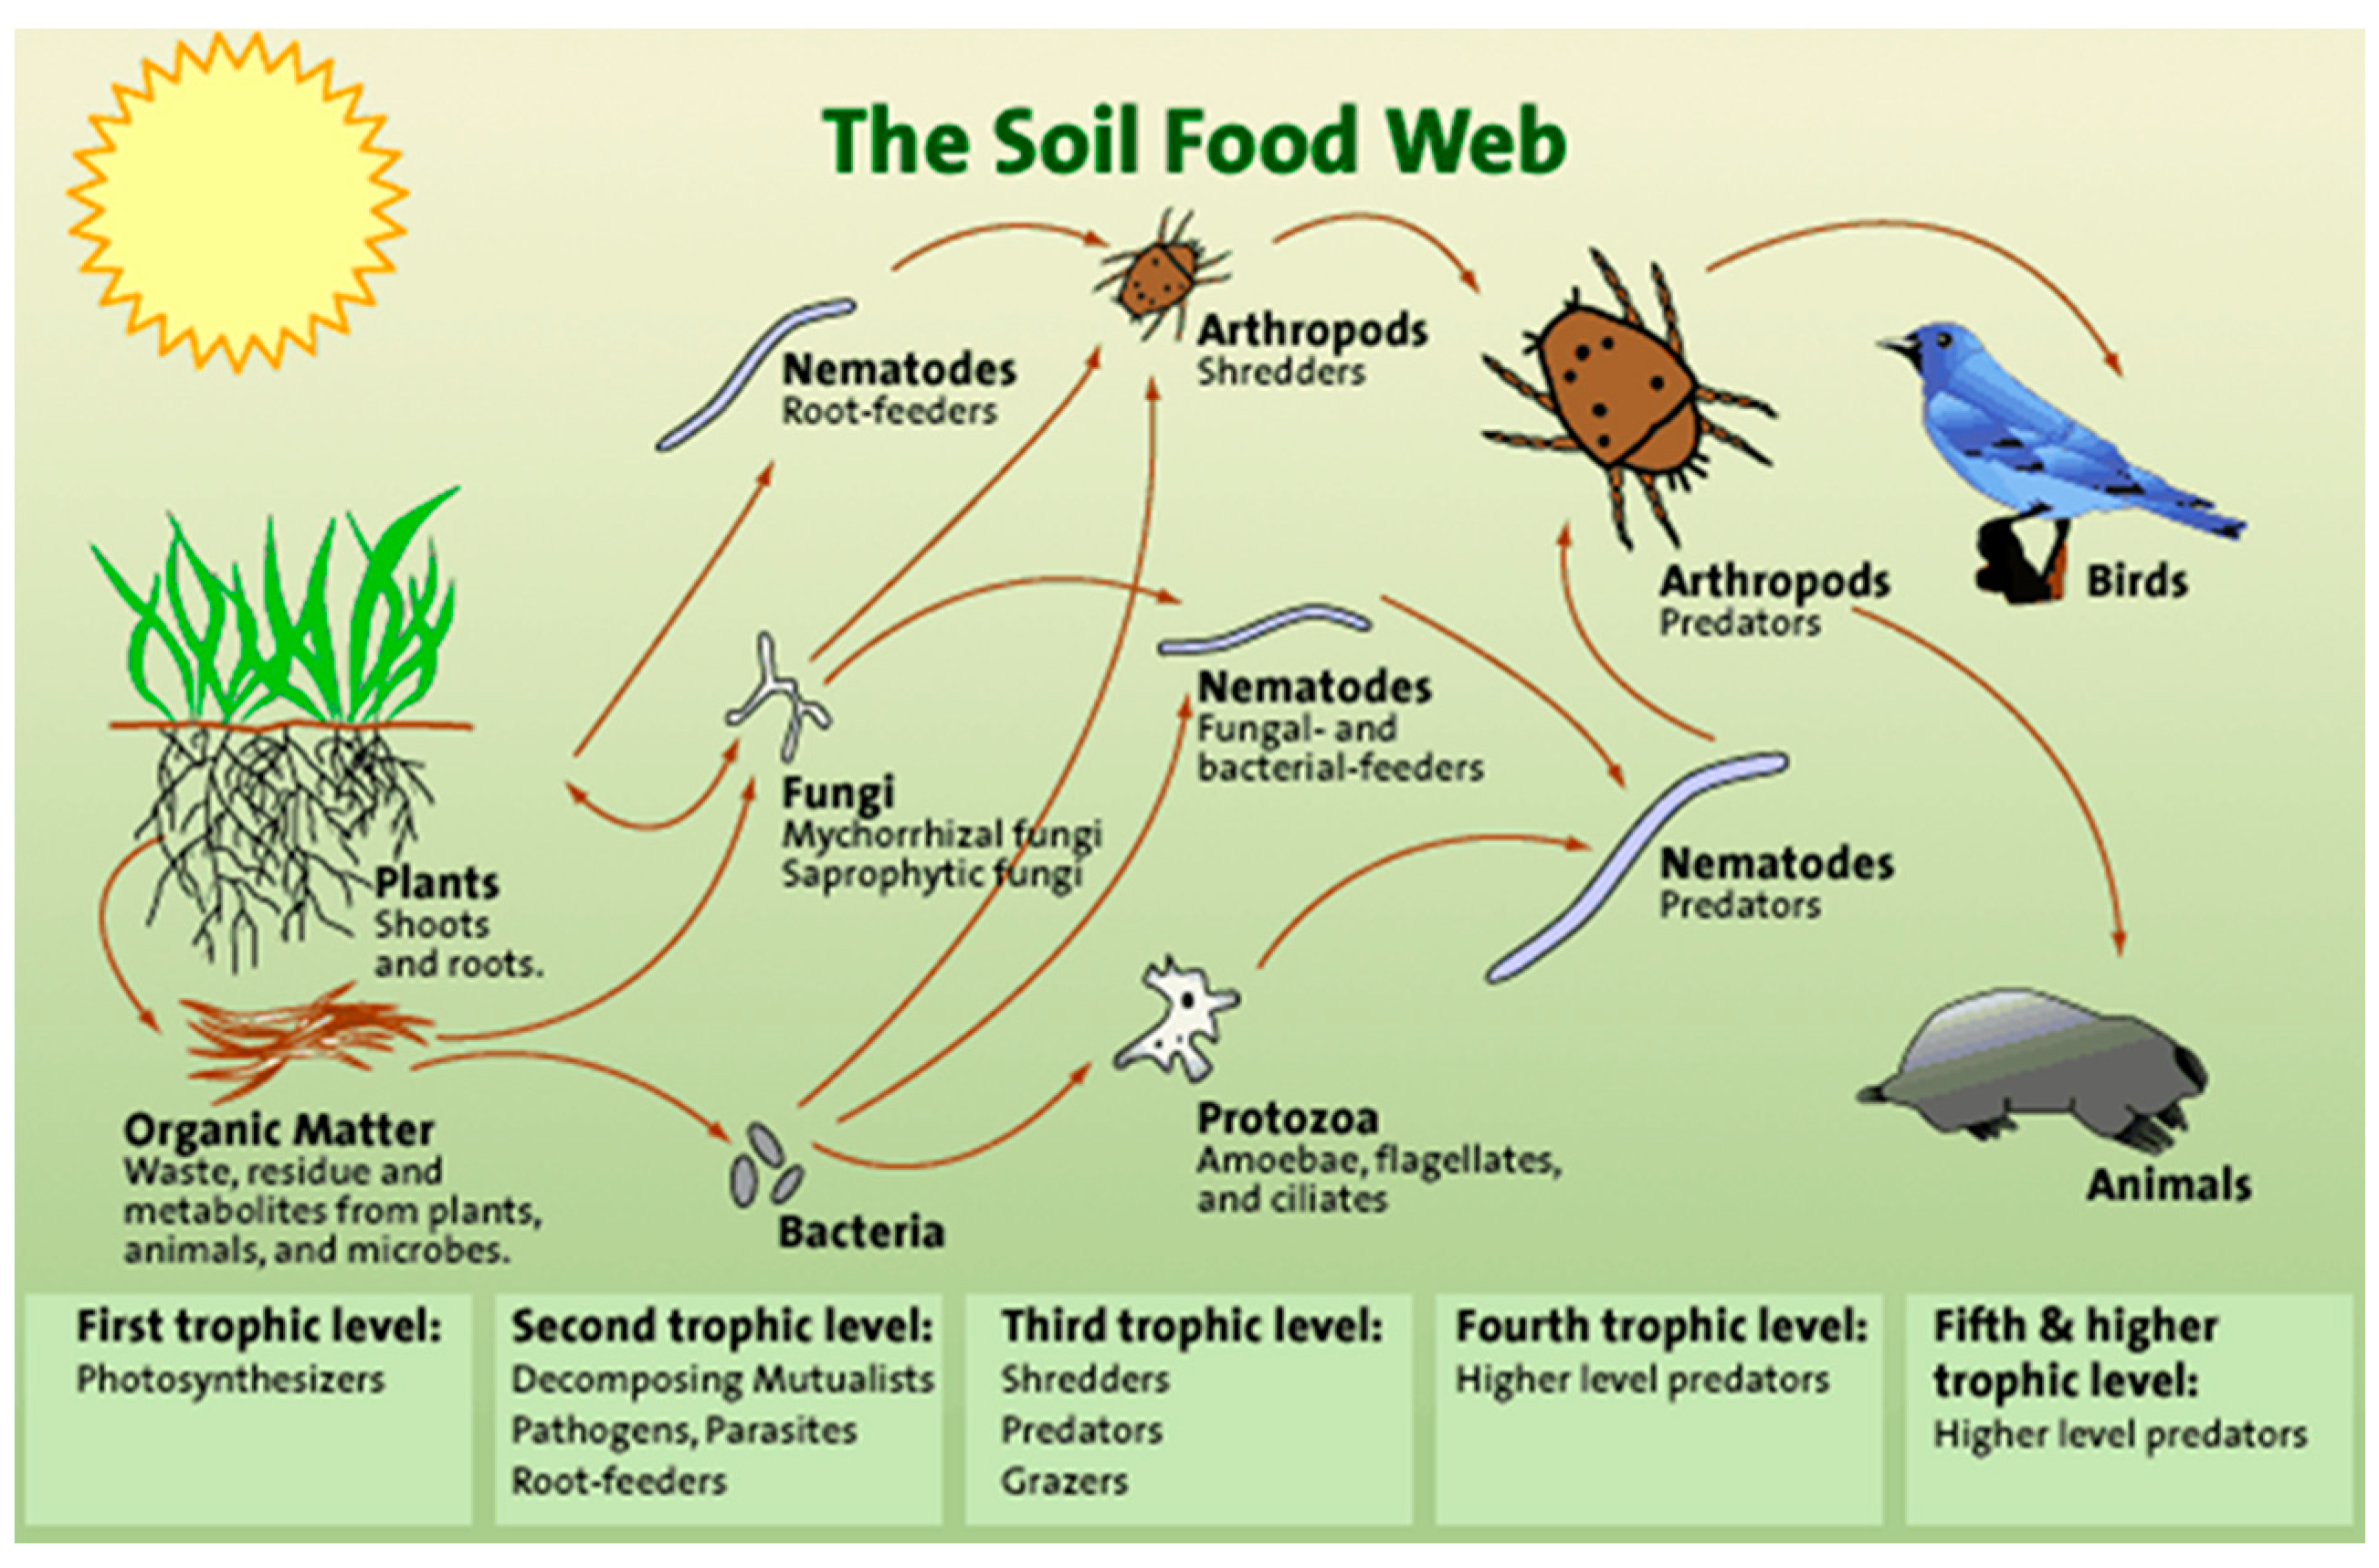
1.2. Why Nematodes Are Important to Soil Health?

Nematodes, non-segmented worm-like organisms, are present in all ecosystems, are sensitive to disturbance by agricultural practices (APs), and represent 80% of metazoans on the planet [11,33,34,35,36]. Based on their food source, soil-dwelling nematodes are classified into trophic groups that include bacterivores (bacterial feeders), fungivores (fungal feeders), plant-parasites or herbivores (plant-feeders), predators (feed on nematodes and other life forms), and omnivores (feed on a range of soil organisms) [36]. The nematode trophic groups have life histories and reproductive strategies that fall into five categories commonly known as colonizer-persister (c-p) groups [34,37,38,39]. These range from c-p 1, fast reproducing and tolerant to disturbance, to c-p 5, slow-reproducing and sensitive to disturbance. The c-p groups have different functions. Bacterivores, fungivores, omnivores, and predators are all beneficial and pertinent to nutrient cycling and maintaining healthy soils [10,11,12,21,36]. It is important that a healthy soil contains all c-p groups of all beneficial nematodes. Herbivores, which use a stylet (resembles a flexible hypodermic needle) to pierce roots (root parasites) or leaf tissue (shoot parasites) to obtain nutrition, are harmful pests that cause crop yield loss. Herbivorous and beneficial nematodes exist in the same soil ecosystems. Change in nematode population dynamics is an excellent indicator of changes in soil and global ecosystems [11,33,35,36].
Another way that nematodes are important to soil health is in nutrient cycling within the functions of the SFW (Figure 1). As shown in this open-source USDA/NRCS figure, nematodes are a critical part of the SFW in Trophic Levels II, III, and IV of the SFW (Figure 1 [10,11,21,34,40,41,42,43]). Level I are the photosynthesizers, Level II are decomposer and parasites, Level III are shredders, Level IV are predators, and Level V are higher level predators. In simple terms, the desired ecosystem services from a functioning SFW are the predator-prey and excretions of many micro- and macro-organisms operating across five trophic levels. By feeding on or being food for other organisms, nematodes contribute to releasing nitrogen and nutrient cycling in general [12,21,40]. A combination of their presence in all ecosystems, role as nutrient cyclers in the SFW, and sensitivity to APs-driven disturbances make nematodes excellent bioindicator organism to develop sustainable soil health in cropping systems.

1.3. Agriculture’s Footprint on Soil Health

Agriculture has a substantial footprint relevant to soil health and ecosystem degradation. For example, agriculture contributes ~84% of the global nitrous oxide (N2O) emissions [4]. In addition, soil fertility (organic and inorganic forms) managements [22,26,44,45,46,47,48], pesticides and agricultural inputs [19], land use (tillage, grazing) practices [2,17,18], and cropping systems [16,47,48] are among the APs that directly or indirectly influence the soil health components and in variable ways [45,46,47,48,49,50,51,52,53]. Although global fertilizer application will exceed 200 million metric tons per year [54] and the negative effects on soil health and the environment will continue, there are regional differences. For example, in economically less developed parts of the world, fertilizer may be expensive and soil health degradation may be exacerbated from inadequate soil fertility management. In economically developed countries, lack of integrated fertilizer use efficiency leads to nutrient pollution and economic waste [25,26]. For example, a comprehensive study of N use and maize and soybean yield in the U.S. Midwest showed a disturbing picture [26]:
Approximately 46% of the maize and soybean acreage was high-yielding, 26% stable low yielding, and 28% unstable (variable) yielding.
Low-yielding areas contributed ~44% and variable-yielding areas during years of poor yield 31% of total N loss to the environment.
Total loss to farmers from overfertilization in low- and variable-yielding areas was ~$485 million. The loss in fertilizer value corresponded to greenhouse gas (GHG) of 6.8 MMT CO2 equivalents.
It is clear that current fertilizer use practices and APs’ impact on soil health degradations are unsustainable. To reverse the trajectory of unsustainable practices and improve APs and soil health, in-depth understanding of the impact of APs’ large footprint on soil health and associated management decisions is necessary.

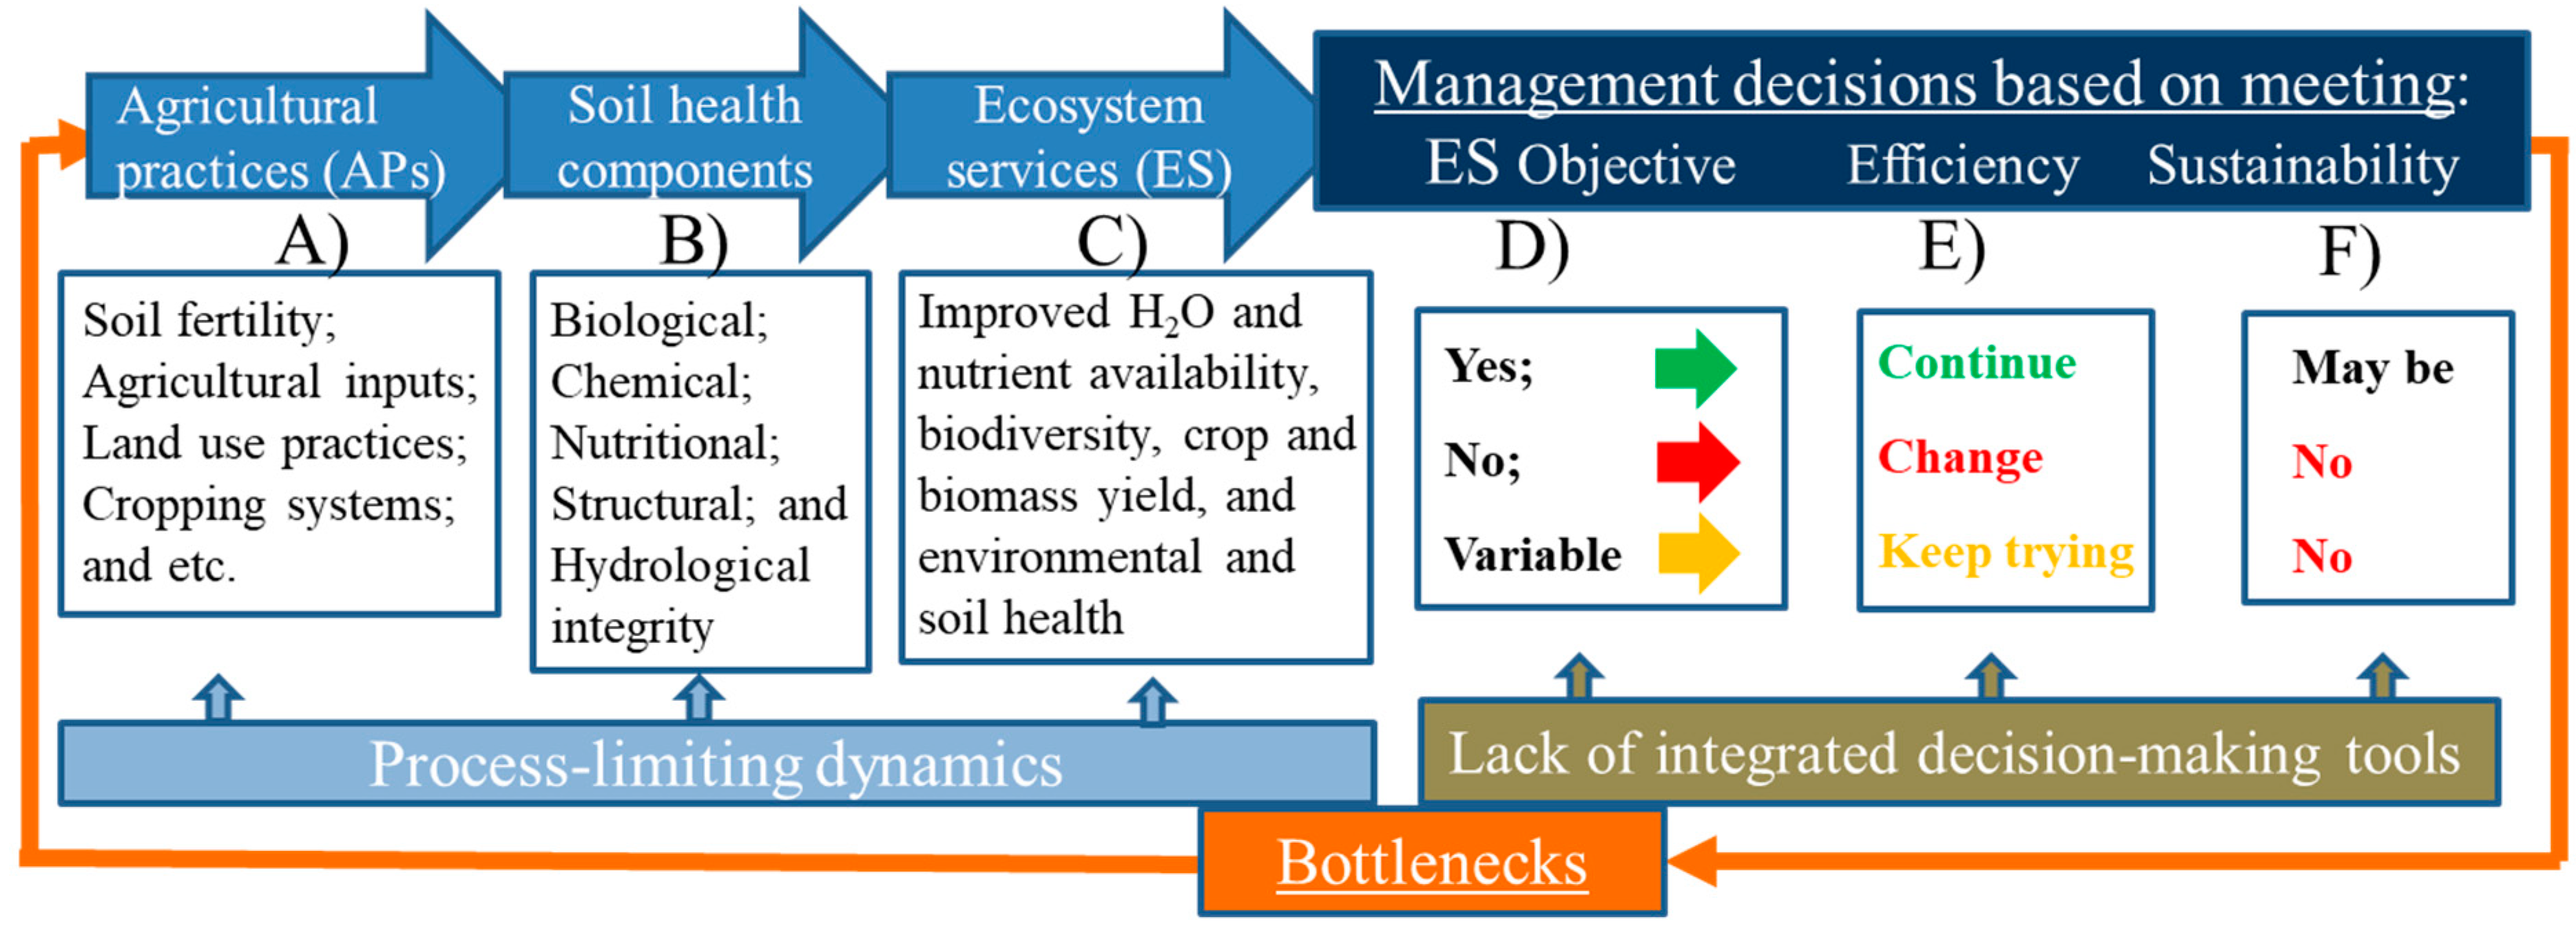
2. Conceptual Understanding of the Cycle of Soil Health Degradation

How efficiency and sustainability of the impact of APs’ on generating desirable ecosystem services are assessed are contributing factors in the cycle of soil health degradation. Figure 2 depicts a conceptual view of how separate APs or AP combinations applied in production systems (A) will alter soil health components (B) in generating objective-dependent ecosystem services (C), and the basis for management decisions if the outcomes of the objectives were either yes, no, or variable for one or more ecosystem services (D). A common way to determine whether APs generate desired ecosystem services is to assess production efficiency (E) and sustainability (F) of the outcomes. A combination of the gaps in integrated understanding of the process-limiting dynamics affecting A, B, and C, and the lack of decision-making tools affecting D, E, and F, creates bottlenecks that continue the feedback cycle of soil health degradation. Using soil fertility management applied to increase biomass/crop yield and/or suppress harmful plant-parasitic nematodes (PPN) as examples, we define production efficiency in this context as the difference between the values of inputs (e.g., soil amendment or fertilizer) and outcomes (e.g., yield increase and/or suppression PPN, or both) [11,44,55,56,57].
As depicted in Figure 2E,F, only yes or positive outcomes are seen as efficient and sustainable, so that soil treatments continue when an outcome is positive (green arrow), change when an outcome is negative (red arrow), and either change or continue with hope for better results when an outcome is both yes and no (yellow arrow). In the meantime,—because efficiency analysis based only on PPN suppression and/or increased biomass or crop yield does not always provide insights useful for system sustainability decision making—soil degradations continue unaddressed. For example, a soil nutrient amendment may not be sustainable if the amendment increases crop/biomass yield but adversely affects the soil environment [13,57] or beneficial soil organisms [2,28,29,30]. Under these circumstances, conclusions from Figure 2 outcomes are likely to remain discipline-based comparisons between an independent variable (AP treatment) and dependent variable (ecosystem service) in space and time [11,44,55,56,57]. This limitation makes it difficult to achieve sustainable agroecosystem and soil health conditions because the effects of APs (A) on the soil health components (B) necessary to generate the desired ecosystem services (C) might be subjects of study of not one but multiple disciplines (Figure 2). Sustainable soil health management is unlikely to be achieved without an integrated and interdisciplinary understanding of the process-limiting factors affecting the generation of desirable ecosystem services and identifying and/or developing management decision-making tools that aid in translating basic science into practical application.

3. Barriers to Developing Sustainable Soil Health and How to Overcome the Gaps Using Nematodes

There are several barriers to aligning sustainable soil health with the desirable ecosystem services.
First, despite a considerable basic and applied soil health knowledge, it is rare that management strategies align soil health components and the ecosystem services they generate [46,58,59,60,61,62,63,64,65,66,67,68,69,70]. Occurrence of beneficial and pathogenic organisms in the same soil environment further complicates aligning desirable ecosystem services [13,28,29,30].
Second, there are no quantitative benchmarks for the functions and process-based outcomes across the desirable ecosystem services that describe what a steady-state soil health looks like for any AP, soil type, or cropping system [13,31,32,33,47,48,49,50,51,62,71,72].
Third, lack of integrated translation of the biophysicochemical-based outcomes in ways growers can easily understand. Practical application is difficult.
Fourth, there is no framework for alignment of multiple ecosystem services simultaneously.
There are three major gaps to overcoming the critical barriers to developing steady-state soil health conditions and soil health practices that generate the desirable ecosystem services.
First, the integration of the substantial knowledge on all components of soil health in ways that align the 3 sets of desirable ecosystem services is lacking. The biological component of soil health that drives the belowground nutrient cycling of the SFW (Figure 1) and biodiversity [10,11,12] can be a platform for step-by-step integration.
Second, many of the micro- and macro-biome communities in the SFW are used as indicators of soil health [72,73,74,75,76,77,78]. However, there is a need for a foundation up on which the biological indicators can be integrated to identify agroecosystem suitability of the APs-driven outcomes. In this case, soil-dwelling nematodes (Section 1.2) can serve as a model organism, and the nematode community analysis-based Ferris et al. [34] SFW model described in Section 4 can be a tool for identifying agroecosystem suitability of AP-driven outcomes.
Third, an outcome that looks suitable for an agroecosystem and efficient by disciplinary measures (Figure 2D–F) is not necessarily sustainable. For an outcome to be sustainable, it has to meet a balanced expectation of generating the desirable ecosystem services and economic and environmental needs simultaneously. In this case, the harmful and beneficial soil-dwelling nematode community analyses-based FUE models described in Section 5 can be a foundation for identifying sustainable outcomes [28,29,30]. A combination of the SFW and FUE model analyses can be used to understand the process-limiting factors and gaps in decision-making tools (Figure 2) and align ecosystem services needed for sustainable soil health management in cropping systems.

4. How the SFW Model Uses Nematodes to Identify Agroecosystem Suitability of Soil Conditions

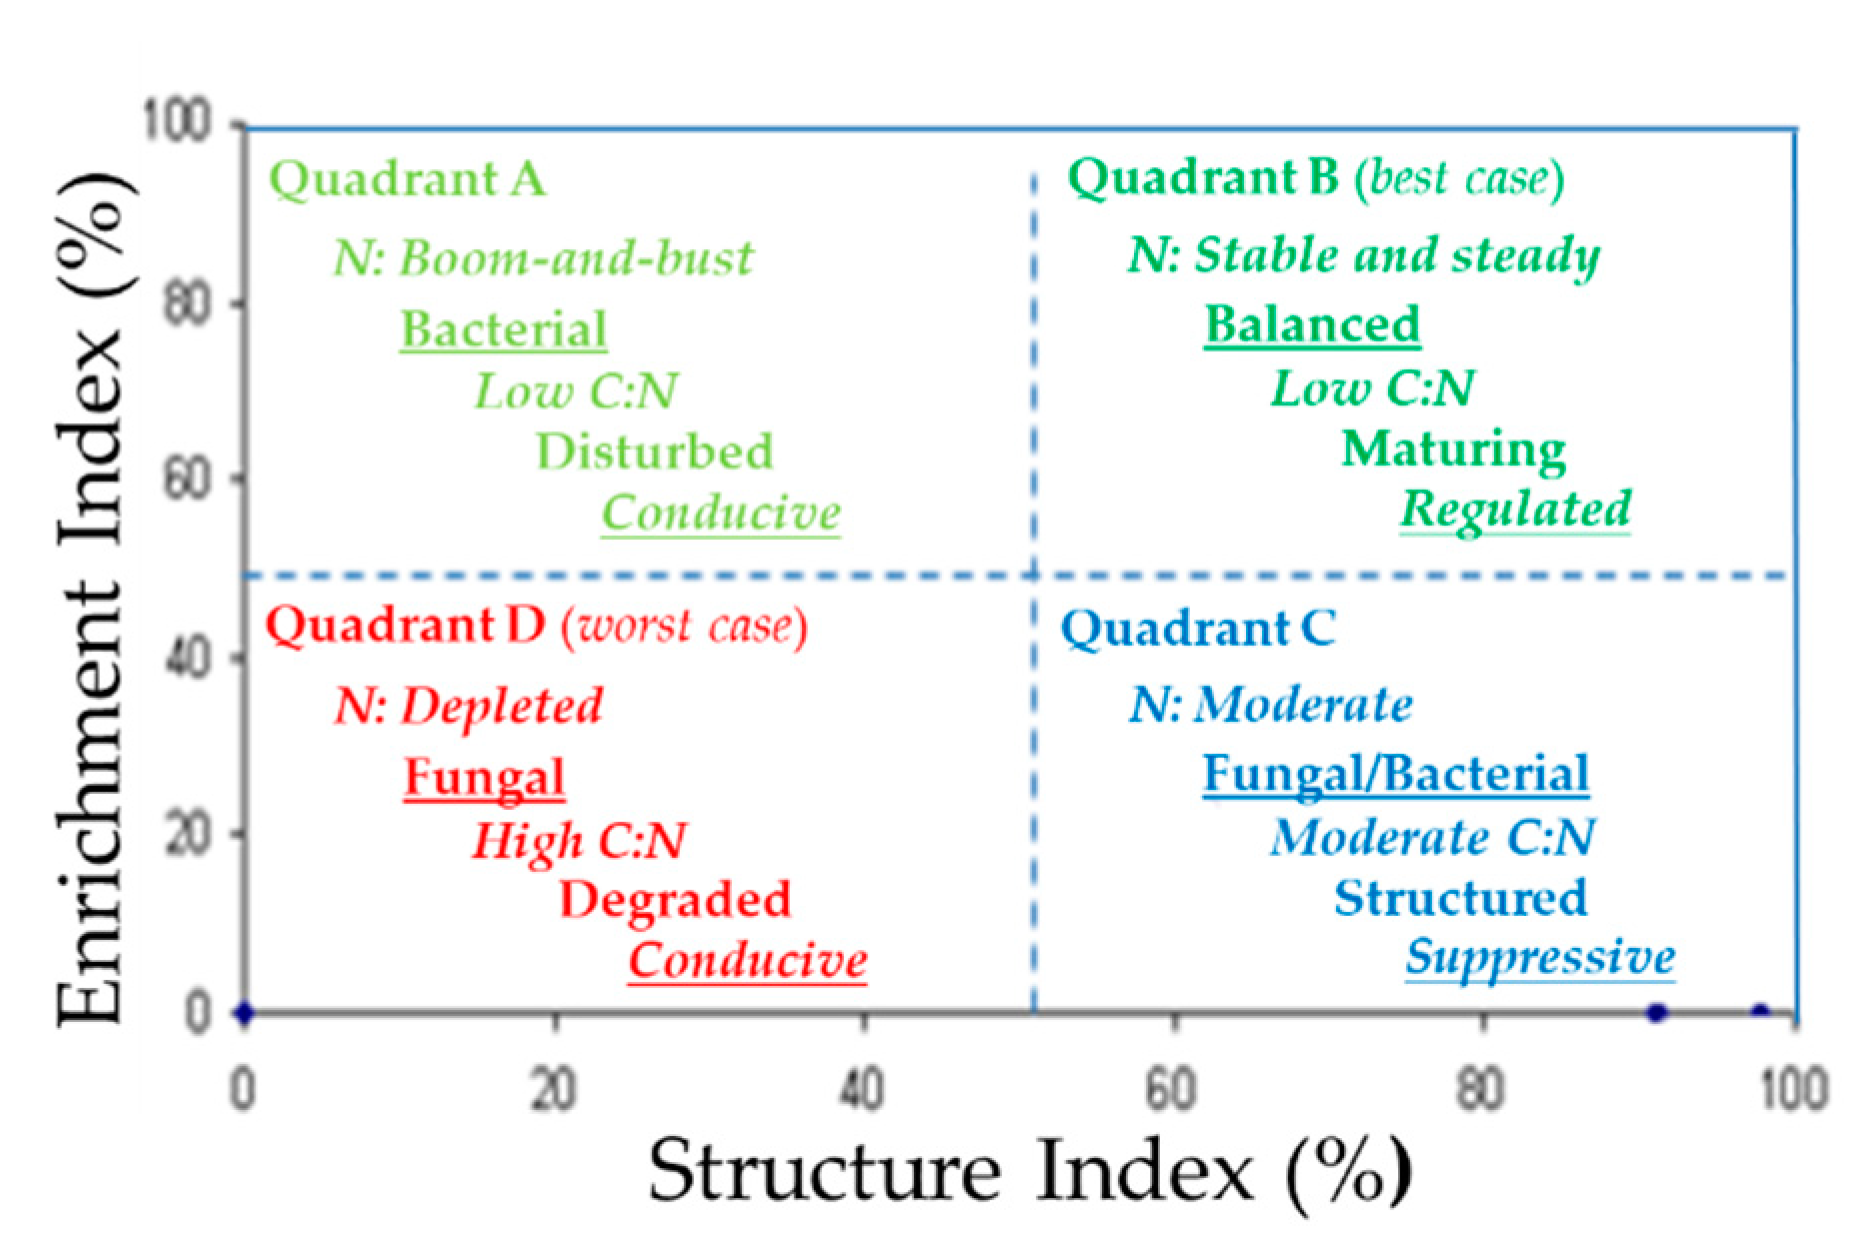
4.1. Description of the Ferris et al. SFW Model

The Ferris et al. [34] SFW model describes soil conditions in 4 quadrants by measuring changes in beneficial nematode trophic and colonizer-persister (c-p) groups. The model graphically represents the relationship between: (a) nematode population turnover relative to food and reproduction (Enrichment Index, EI, y-axis) and (b) the community profile relative to stress or resistance to disturbance (Structure Index, SI, x-axis) (Figure 3). The EI and SI trajectories are calculated independently from the weighted abundance of nematodes in guilds representing basal (b), enrichment (e), and structure (s) food web components. They are calculated as follows:
b = ∑kbnb,
where kb are the weightings assigned to guilds that indicate basal characteristics of the food web, and nb are the abundances of nematodes in those guilds. Using the same guilds, the e and s components are calculated as follows:
e = 100 × (e/(e + b)),
s = 100 × (s/(s + b)).
As nematodes feed on or are food for other organisms, their population dynamics and the release of N change [12,21,34,40]. It is this population dynamics that the Ferris et al. [34] SFW model expresses with the relationship between EI and SI on a scale of 0 to 100% to describe the soil conditions in four quadrants (Figure 3). High EI and low SI values (Quadrant A) indicate that the soil is N-enriched in a boom-and-bust manner, and the system is dominated by bacterial-feeding nematodes with fast reproduction and resistant to disturbance (usually c-p 1 and c-p 2). High EI and SI (Quadrant B) indicate that the soil is N-enriched in a stable and steady manner and the system is dominated by nematodes that are slow reproducing and sensitive to disturbance (usually c-p 4 and c-p 5). Low EI and high SI (Quadrant C) indicate that N is moderately available, and the soil system is dominated primarily by fungal-feeding nematodes that are slow reproducing and sensitive to disturbance. Low EI and SI values (Quadrant D) indicate that the soil is N-depleted, and the system is dominated by fast reproducing and resistant to disturbance fungal-feeding nematodes. Based on the proportion of the nematode trophic and c-p groups driving the nutrient cycling that is central to soil health, Quadrants A and B have low, Quadrant C moderate, and Quadrant D high C:N ratio. Based on the nematode population dynamics and nutrient cycling potential, the SFW structures are described as disturbed (Quadrant A), maturing (Quadrant B), structured (Quadrant C), and degraded (Quadrant D). Disturbed and degraded soil systems are likely to be conducive to more pests and diseases, structured systems suppressive, and maturing systems regulated.
The AP-driven soil health degradations discussed in Section 1.3 and Section 2 are likely to be happening in one or more soil conditions that the SFW model describes. While the degree to which different APs affect nematode population dynamics and their nutrient cycling potential may vary [11,33,34,35,36], sorting out the variable information is one of the key advantages of the SFW model. For example, data from effects of APs A–D (Figure 2) falling into Quadrants A and B would indicate N is available. Quadrant B is the best case for nutrient cycling and agroecosystem suitability, both important parts of healthy soils. Data falling in Quadrants C and D indicate biological activity will be required for N release. Quadrant D is the worst case, where the soil is degraded and biologically depleted. By identifying best-to-worst case outcomes for agroecosystem soil health, the SFW model can be a road map to achieving healthy soils because it simplifies complex information otherwise difficult to relate to production [79].

4.2. Examples of the SFW Model as a Decision-Making Tool to Identify Soil Health Conditions

The cycle of soil health degradations (Section 2) and barriers to developing sustainable soil health conditions exist because of the complex, variable, and poorly understood process-limiting factors affecting the generation of ecosystem services (Figure 2A–C). Among other things, the SFW model has been extensively used to describe the decomposition pathways of nutrient cycling and ecosystem disturbances, e.g., References [11,18,36,42,67]. Its implementation as a decision-making tool for diagnosis soil health conditions, however, has been limited. Recently, the SFW model has been used to identify if cropping systems and or objective-dependent soil amendment treatments resulted in enriched but unstructured (Quadrants A), enriched and structured (Quadrant B), resource-limited and structured (Quadrant C), or resource-depleted with minimal structure (Quadrant D) soil conditions [79,80,81,82,83,84]. Here, we describe an example of how the model was used to identify if soil health degradations across the seven major soil groups (orders) can be managed on a one-size-fits-all or a location-specific approach [84]. This was demonstrated by characterizing types and levels of biological degradations associated with Ferralsols, Lithosols, and Nitosols in Ghana, Kenya, and Malawi; see Table 1 and Figure 4 [84]. Table 1 presents SI and EI by country for each soil group and Figure 4 is a visual representation of the same data. Across countries and soil groups, the values of EI ranged 11% to 37% and SI of 31% to 88%, suggesting that the soil groups have low enrichment and variable structures (Table 1). Across countries and soil groups, EI was the highest in Malawi Lithosols and lowest in Kenya Nitosols, and SI of Ghanaian Lithosols was significantly higher than all, but Ghanaian Ferralsols and Nitosols. Malawi Nitosols and Ferralsols had the lowest SI. When the SI and EI data were fitted into the SFW model, the specific soil conditions of the soil groups within and across countries were revealed [34]. The EI and SI intersection represents the data point for the country and soil group on Figure 4. The EI and SI intersection point represents the location of the mean within a quadrant where the alignments of the standard errors can be assessed visually. Non-overlapping of either SI and/or EI standard errors of the data points on the graph show that there are significant differences of either SI and/or EI within and/or across countries (Table 1).
The data points for the Ghanaian and Kenyan Ferralsols, Lithosols, and Nitosols fell in Quadrant C (resource-limited and structured), those of Malawi Ferralasols and Nitosols in Quadrant D (resource-depleted with minimal structure), that of Lithosols borderline between Quadrant C and D, and the data points of the three countries and soil groups were not overlapping (Figure 4). In addition to identifying the specific soil conditions, the SFW model (a) showed how different the soil groups are within and across countries and (b) provided a proof-of-concept for location-specific than a one-size-fits-all approach when considering soil health management strategies across locations.

4.3. Potential Use of the SFW Model as an Integration Platform for Soil Health Indicators

The five trophic levels of the SFW (Figure 1) are the foundation of the belowground biophysicochemical processes affecting the different components of soil health and that the APs influence to generate the desirable ecosystem services (Figure 2A–C). There are many soil health indicators associated with the ecosystem services [72,73,74,75,76,77,78,85,86,87,88] for which the USDA/NRCS maintains an up-to-date database at https://www.nrcs.usda.gov/wps/portal/nrcs/detail/soils/health/assessment/?cid = stelprdb1237387 (accessed on 5 May 2021). These include organic matter recycling and carbon sequestration, soil structure stability, general microbial activity, carbon food source, bioactive nitrogen, and biodiversity. While sustainable soil health requires generating multiple desirable ecosystem services simultaneously (Section 1.1), aligning the soil health indicators for an integrated application remains challenging (Section 3), in part, due to lack of integration platforms. The SFW model can be used to address the challenges at least on two levels.
The first challenge are the gaps in integrated understanding the processes that generate the desirable ecosystem services (Figure 2A–C). For example, when APs, such as soil amendments or cropping systems, influence the soil health components and result in variable ecosystem services outcomes (Figure 2D), the source of variability could be the APs, soil health components, or a combination of both, further confounded by soil type and micro to ecosystem level environmental changes [89,90,91,92]. It is likely that the processes that lead to the soil health indicators are happening in any one or more of the four quadrants that the SFW model describes. For example, bioactive nitrogen could be present in soil conditions that resemble Quadrant A (enriched, but boom-and-bust) and or Quadrant B (enriched, steady, and biologically structured), each requiring location-specific than one-size-fits-all soil health management decisions. Similarly, bioactive nitrogen and other soil health indicators may be present in Quadrants A and or B. This would lead to building a database for managing multiple soil health indicators on a location-specific basis. Thus, by knowing if the different soil health indicators individually and/or collectively fall in either Quadrant A, Quadrant B, Quadrant C (biologically structured, but not enriched), or Quadrant D (degraded and depleted), the SFW model serves as an integration platform that could lead to integrating and aligning soil health indicators. This is the first step towards identifying soil health conditions from a single core of soil.
The second challenge is lack of integrated markers for the soil health conditions that integrate the desirable ecosystem services within a quadrant. Nematode and microbial communities are part of the biological component of soil health and as drivers of the SFW (Figure 1) generating the desirable ecosystem services. Thus, nematode and microbial communities have the potential for being the basis for developing markers that describe integrated soil health outcomes. Unfortunately, there are limited genetic markers for identifying all nematodes trophic groups to species level or functional guild [93,94,95], but there are many markers that describe microbial communities within a hierarchical taxonomy [96,97,98,99]. Whether or not existing genetic markers for microbial communities can describe the soil health condition that typify the desirable ecosystem services remains to be determined. Nonetheless, a combination of using nematodes to describe the soil health conditions with SFW model [34] and building upon existing microbial community genetic markers will lead towards identifying soil health conditions from a single core of soil.
Identifying the soil conditions in response to APs in one thing, whether or not the outcomes are sustainable is a different matter. For an outcome to be sustainable, it has to balance the dynamic of generating desirable ecosystem services, environmental and economic needs simultaneously. This requires integrated efficiency analysis, which the FUE models provide [28,29,30].

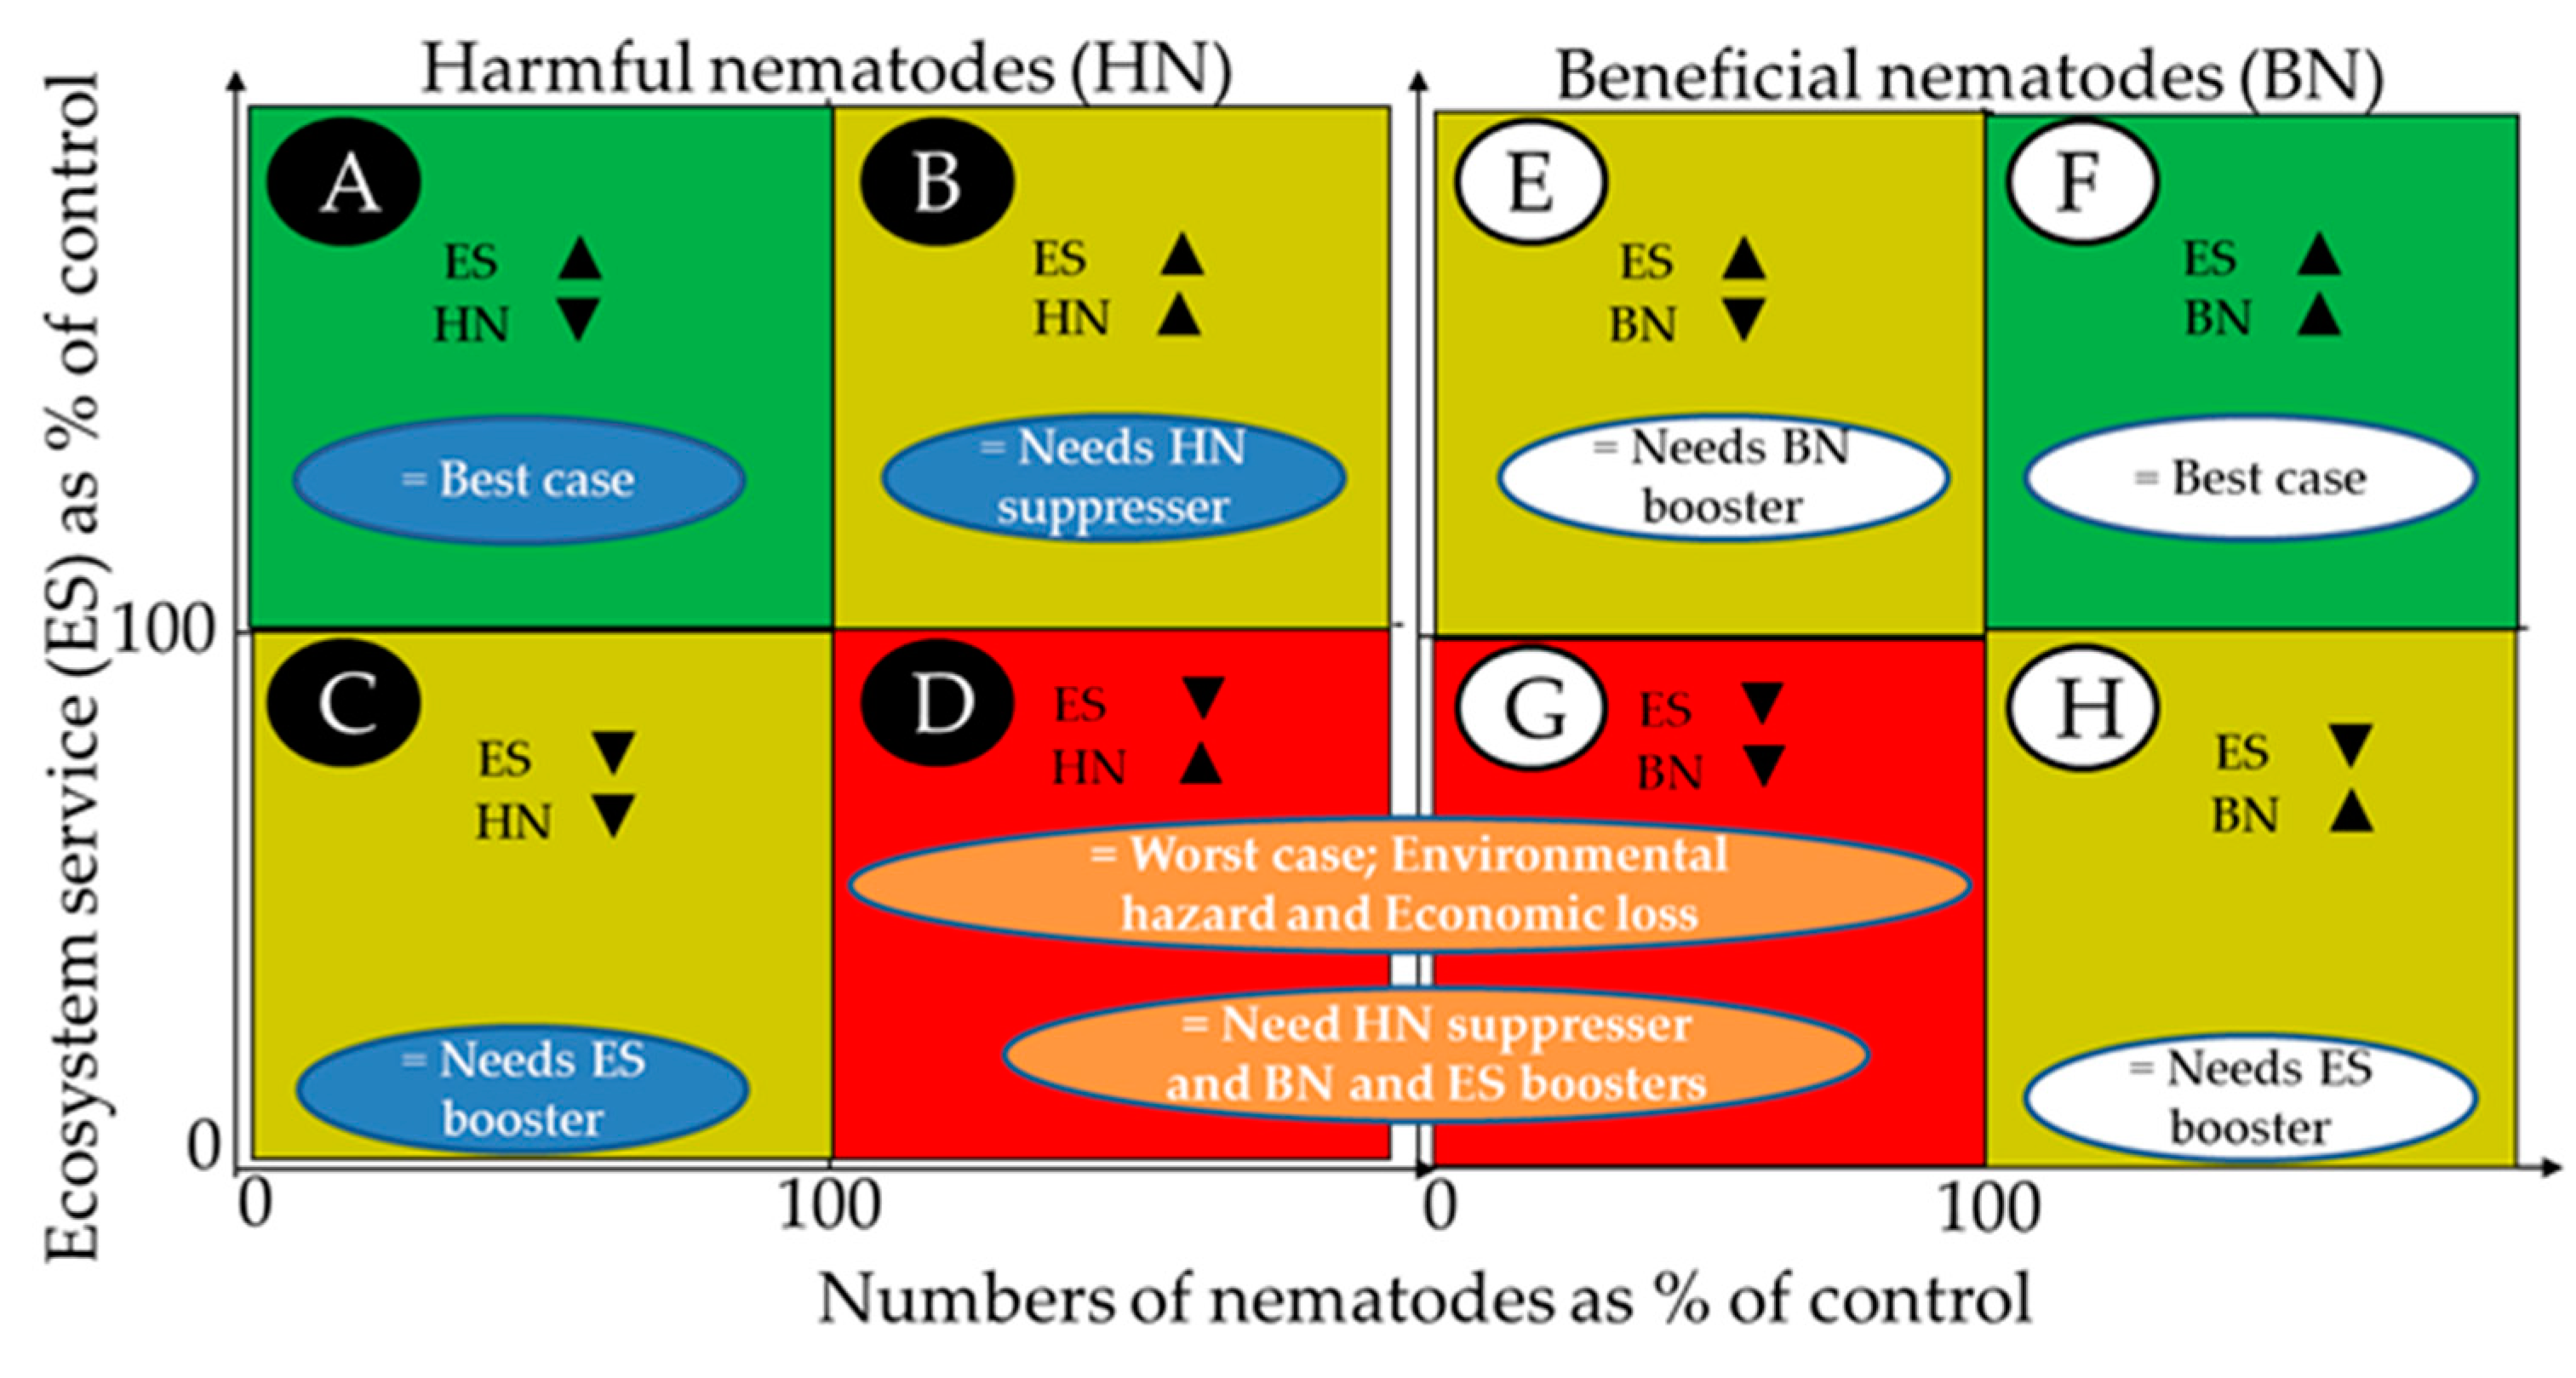
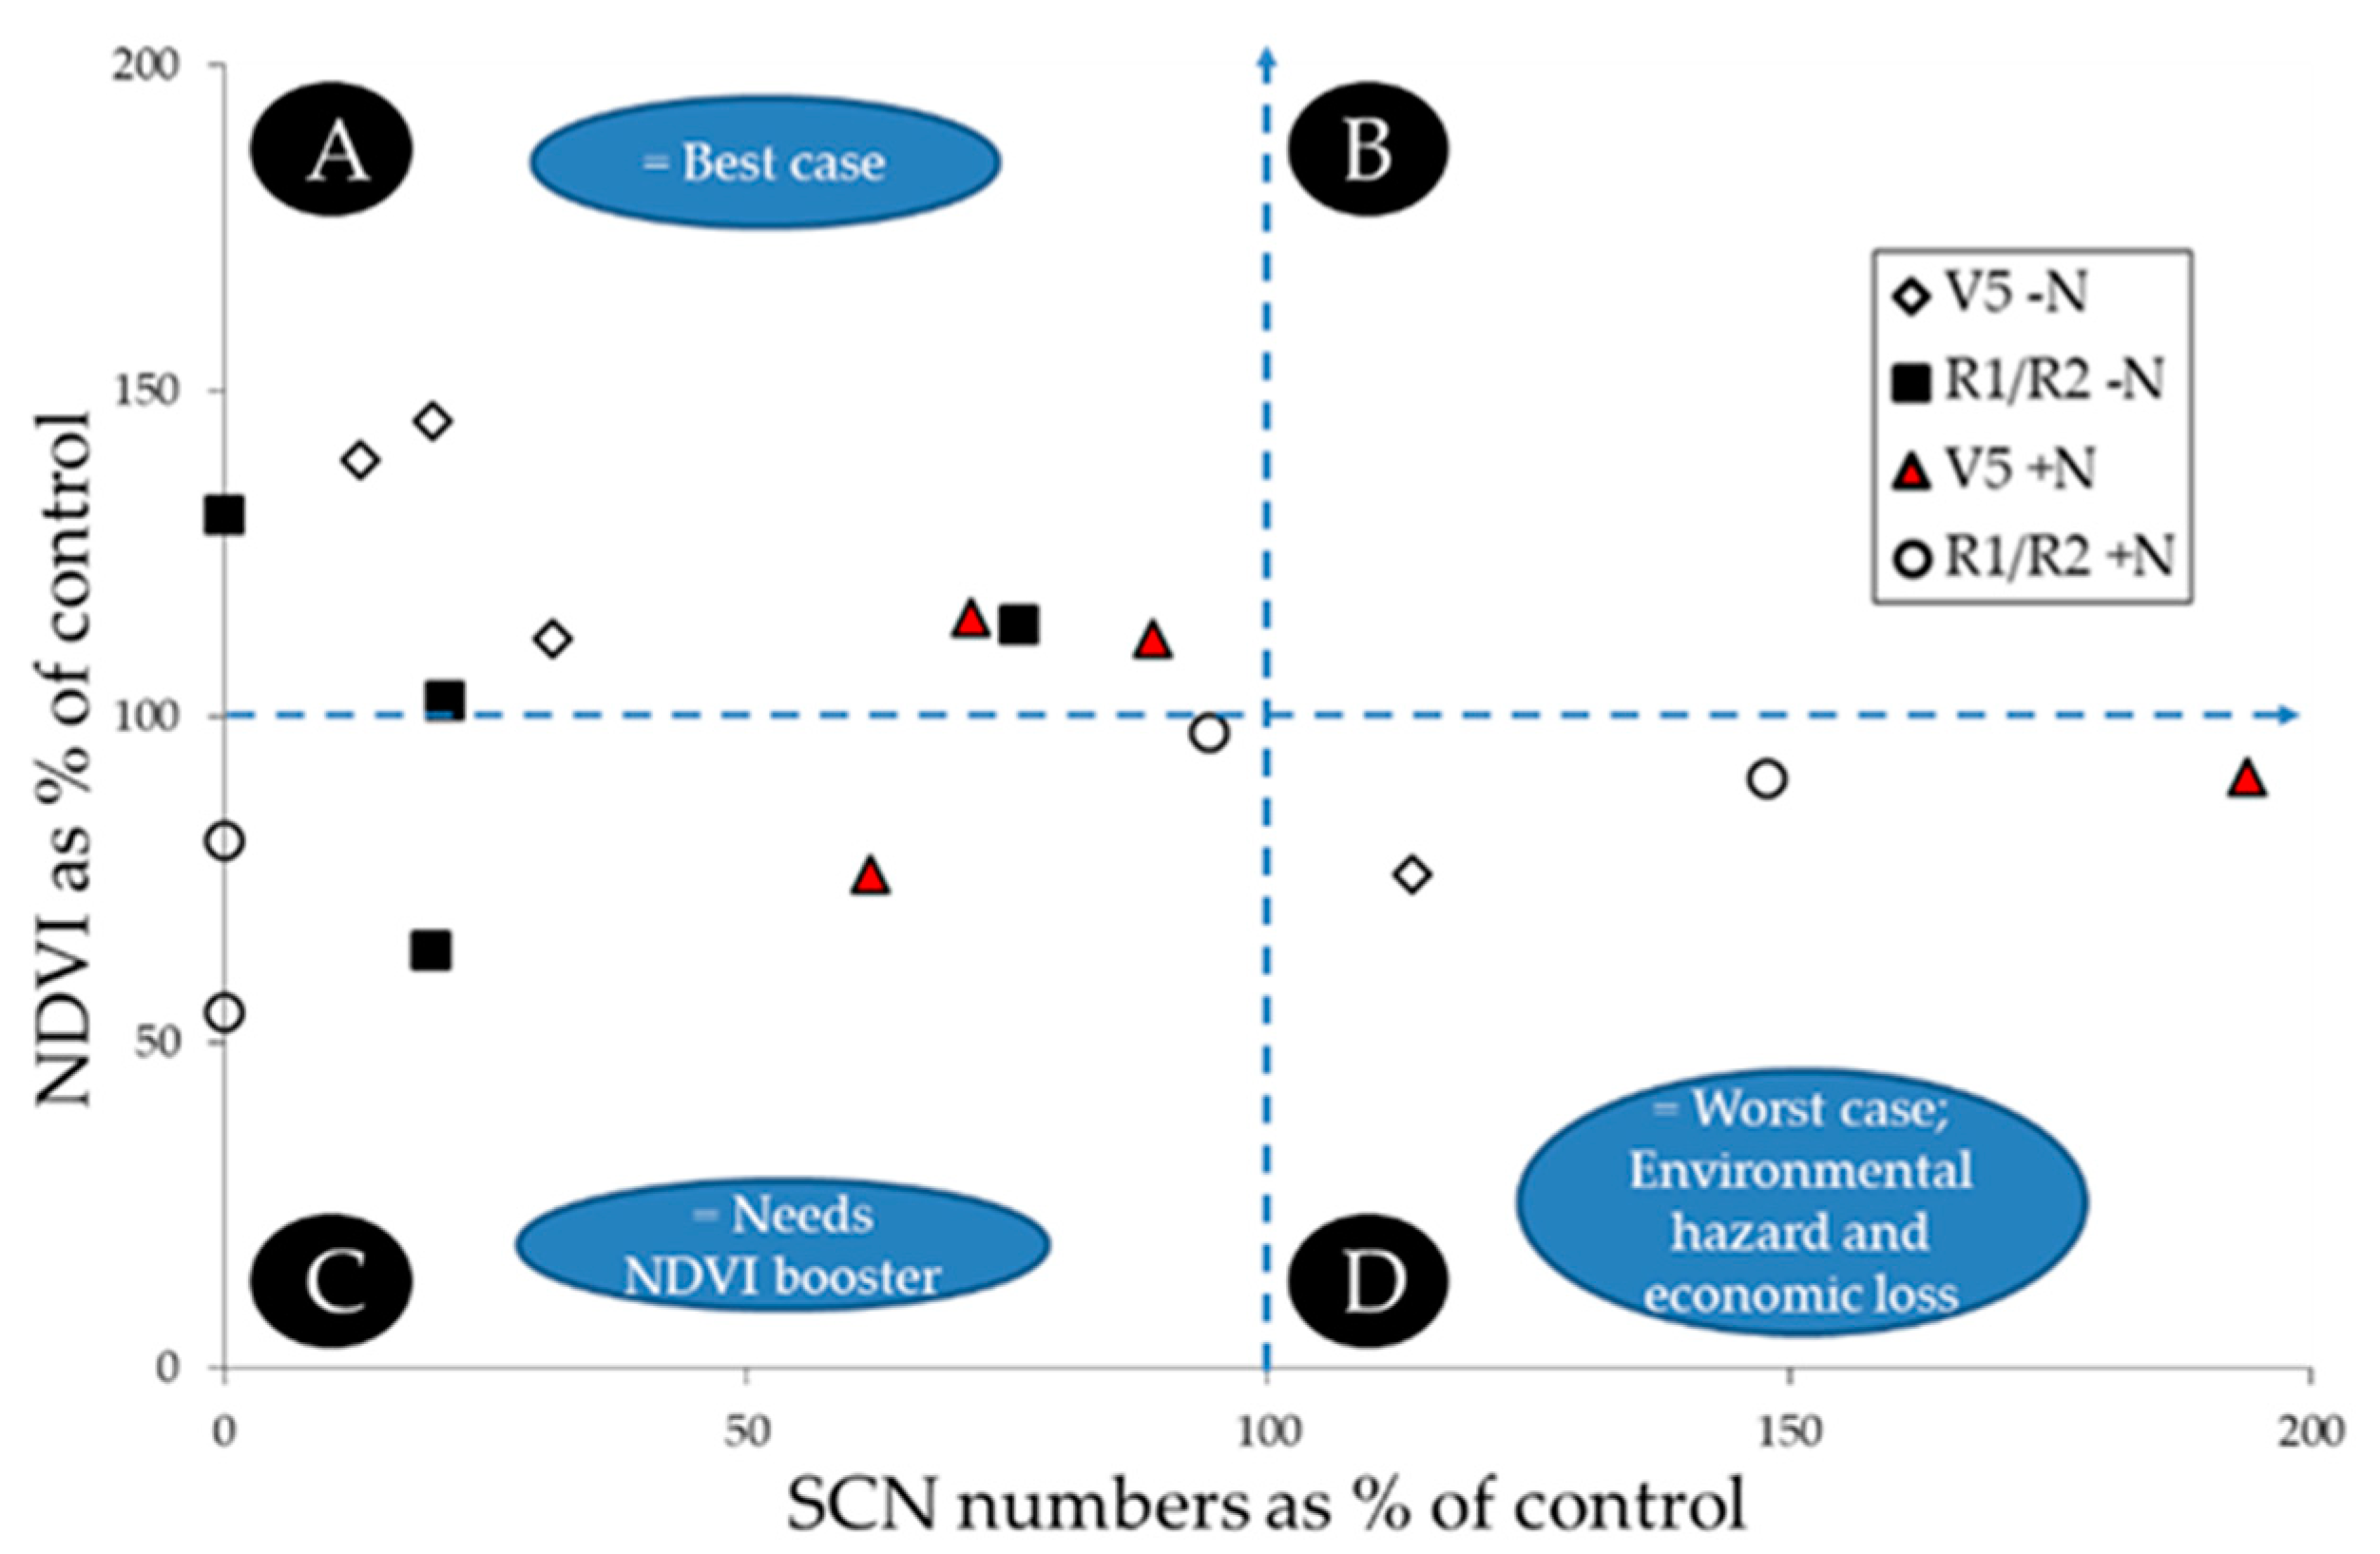
5. The FUE Model Analysis to Identify Integrated Efficiency Outcomes

5.1. The Concept and the Calculations

When APs, such as soil amendments or cropping systems, result in variable outcomes and efficiency and management decisions are mostly discipline-centered (Figure 2D–F; green, red, and yellow arrows), identifying sustainable outcomes by assessing the effect of a treatment on an ecosystem service becomes difficult [11,44,55,56,57]. The concept of FUE model is based on assessing relative changes among ecosystem services in response to an AP treatment. The FUE model is based on assessing the relationship between changes in numerical abundance of nematodes quantified at trophic group levels (e.g., herbivore, bacterivore, fungivore, predator, and omnivore [37,38]) and ecosystem services (plant growth, soil nutrient, etc.). It is called FUE because it was developed for testing the relationship between plant-parasitic (harmful) nematodes and plant growth in response to fertilizer management, one of the common APs [28], later modified to include beneficial nematodes [29], and verified under field conditions [30].
The assessments express changes in the numbers of harmful and beneficial nematodes and ecosystem services as a percentage of control (untreated) using the following 3 equations [28,29]:
Percent harmful nematodes (x-axis) = (HNT/HNC) × 100,
where HNT is the average number of harmful nematodes in a specific soil amendment and replication, and HNC is the average number of harmful nematodes in a corresponding non-amended soil.
Percent beneficial nematodes (x-axis) = (BNT/BNC) × 100,
where BNT is the average number of beneficial nematodes in a specific soil amendment and replication, and BNC is the average number of beneficial nematodes in a corresponding non-amended soil.
Percent ecosystem service parameter (y-axis) = (ECT/ECC) × 100,
where ECT is the value of ecosystem service parameter in a specific soil amendment and replication, and ECC is the value of ecosystem service parameter in a corresponding non-amended soil.

5.2. Visualization of the Outcomes

The assessments use quadrant formats to relate integrated efficiency in terms of soil nutrients in relation to the abundances of either harmful or beneficial nematodes expressed as a percentage of those of the untreated control. Plotting the changes in ecosystem service (crop yield or soil nutrient, etc., y-axis, Equation (6)) parameters against the changes in nematode abundances (x-axis, Equation (4) or (5)) provide two sets of graphical indicators of the condition of the production system (Quadrants A-D–assessment of harmful nematodes, Equation (4) and Quadrants E-H–assessment of beneficial nematodes, Equation (5) (Figure 5)). By visualizing the data this way, the FUE model identifies best-to-worst case scenarios for generating desirable ecosystem services while simultaneously meeting environmental and economic expectations (Figure 5). Best case scenarios are where treatments result in a desirable ecosystem service increase and a decrease in harmful nematodes (Quadrant A) and an increase in beneficial (Quadrant F) nematodes. For best cases, treatment can continue as usual. In cases where ecosystem service increases and harmful nematodes increase also (Quadrant B), treatments that suppress harmful nematodes are needed. In cases where ecosystem service increases but beneficial nematodes decrease (Quadrant E), treatments that increase beneficial nematodes are needed. In cases where ecosystem service decreases and root-feeding nematodes decrease (Quadrant C), treatments that increase ecosystem service are needed. In cases where ecosystem service decreases and beneficial nematodes increase (Quadrant H), treatments increase ecosystem service ae needed. The worst-case scenarios, and probably involving economic loss, environmental hazard, and loss of biodiversity, are where desirable ecosystem service decreases with an increase in harmful nematodes (Quadrant D) and a decrease in beneficial nematodes (Quadrant G). Here, treatments that increase ecosystem services and beneficial nematodes, and that suppress harmful nematodes, are needed.

5.3. Examples of How the FUE Model Visualization Can Detect Hidden Patterns

In Section 4.3, we described how the Ferris et al. [34] SFW model can be used as an integration platform for soil health indicators in ways that address the challenges associated with the process-limiting factors (Figure 2A–C). When APs, such as soil nutrient amendments, are applied with the objective of impacting nematodes communities and or plant growth and standard analysis based on comparing treatment means shows no differences among the treatments (Figure 2D), the logical conclusion is it did not work and discard the treatment. Here, we demonstrate how the FUE model visualization can be used to reveal hidden patterns in the data that can address the decision-making bottlenecks (Figure 2D–F) and identify sustainable soil health outcomes. The use of FUE model does not imply that comparisons among treatment means are not needed but that mean separation results by themselves cannot tell if the AP outcome is sustainable or not. It is when the relationship of the relative changes between ecosystem services are expressed on the FUE model scatter plot that sustainable outcomes can be identified.
Below, Table 2 (mean separation results) and Figure 6 (FUE model scatter plot) compare the two approaches to analyzing the same data from a field study where the effects of nitrogen fertilization on soybean cyst nematode (SCN) pest population density and the normalized difference vegetative index (NDVI) were tested [30]. NDVI is a plant physiological health indicator directly related to crop yield. We measured SCN population density and NDVI at vegetative (V5) and reproductive (R1 to R2) stages of soybean growth.
The means of SCN population density and NDVI as measured values and expressed as a percent of control across fertilizer treatments (Nu), plant growth stage (T) and interactions between Nu and T are shown in Table 2. There was no interaction effect of fertilizer treatment and plant growth stage on SCN and NDVI. Plant growth stage had no effect on NDVI. ANOVA for measured SCN population density showed significant difference between plant growth stages, a fluctuation known to be associated with SCN life cycle [18,49]. However, neither SCN nor NDVI measured or expressed as percent of control were affected by fertilizer treatment (Table 2). The obvious conclusion—that treatments did not lower SCN population density and increase NDVI—suggests either abandoning amendments or continuing in search of higher yield and lower SCN population density. Repeated amendments, however, cost money and risk environmental hazards.
However, when the same means expressed as a percent of control in Table 2 are visualized in an FUE model scatter plot, only 3 means fell into the worst-case quadrant for integrated fertilizer use efficiency. The proportion of data points that fall in the four quadrants is dependent on the data set [100]. Nonetheless, FUE model analysis showed that the fertilizer treatments worked, as well as indicated what to do to get the best outcome, namely adding plant growth boosting factors. The results show the potential of FUE model analysis of harmful and beneficial nematode populations as a decision tool for developing sustainable soil health by managing multiple ecosystem services while simultaneously meeting environmental and economic needs.

6. Future Perspectives for Increased Implementation of the Models

The SFW and FUE models may be nematode community-based, but they have broad applications. Disciplinary- and cross-disciplinary science gaps confounded by complexities of APs, soil types, and the environments, and lack of quantitative soil health benchmarks and decision-making tools make it difficult to develop soil health management strategies on a one-size-fits-all or location-specific basis. Identifying best-to-worst outcomes for agroecosystem suitability with the SFW model and sustainability of the outcomes with the FUE model inform whether the local conditions fit a location-specific or a one-size-fits-all management decision.
Increased implementation of these models as integrated soil health management decision-making tools will generate information that could impact policies, soil health management and research funding. However, increased implementation of these models will likely require sustained intra- and inter-disciplinary outreach to convey the concepts of the models. For example, soil health and sustainability may not have the same meaning in different disciplines and may get more complex to the discipline-focused thinkers when expressed through the lens of nematology or soil science. Therefore, cross-disciplinary thinking and efforts will be needed.
The dichotomy of the x-y relationship of these models may be simple, but what it reveals is powerful. The scale of the SFW model is 0 to 100 scale and the FUE model starts at 0, but has no upper limit (Figure 5). The 50% of the SFW model and 100% on the FUE model are the cut off boundaries of the four quadrants for the respective models. In addition to identifying best-to-worst soil health outcomes, these models will enable multi-disciplinary scientists to minimize confounding factors when testing hypotheses. For example, the same hypothesis tested in a soil environment that encompasses multiple quadrants will likely give a different outcome than one tested on quadrant-specific environments.
The SFW model is measuring soil health outcome based on life-history and trophic group levels, and the FUE model is measuring sustainability of the outcomes based on trophic group level population dynamics. Combining the concepts of the two models into one model will be most desirable. Until the concepts are combined, however, both models will be used separately towards developing sustainable soil health management strategies on a step-by-step basis.

7. Conclusions

Among other things, soil health degradation continues because of a lack of integrated understanding of the processes that generate the desirable ecosystem services, difficulty in aligning desirable and undesirable ecosystem services, and challenges in applying molecular markers to identify biophysicochemical changes of soil biota that accurately characterizes a soil health condition. This review makes the following points and contributions.
First, soil health has multiple components and sustainable soil health requires generating three sets of ecosystem services simultaneously (Section 1.1). Soil health becomes sustainable when it simultaneously generates the three sets of desirable ecosystem services while meeting environmental and economic expectations.
Second, provides a conceptual analysis of the relationship among use of APs, management decision-making and the cycle of soil health degradations, identifies barriers to developing sustainable soil health management strategies, and advocates for an integrated and multidisciplinary approaches to develop sustainable solutions.
Third, describes the concepts of the nematode community analysis based SFW and FUE models as decision-making tools in soil health management, i.e., the SFW model for identifying agroecosystem suitability of soil health outcomes and as a platform for integrating multiple soil health indicators, and the FUE model for separating the impact of harmful and beneficial organisms in the same environment and identifying if the outcomes meet the definition of sustainable soil health.
Fourth, a combination of the SFW and FUE models provide basis for addressing the bottlenecks of the processing-limiting factors and the lack of decision-making tools that contribute to the cycle of soil health degradations described in Figure 2.
Fifth, outlines future needs to increase implementation of the models.

Author Contributions

Conceptualization and writing—original draft preparation, H.M.; writing—review and editing, H.M., G.B., A.N.K. All authors have read and agreed to the published version of the manuscript.

Funding

There was no external funding.

Data Availability Statement

Not applicable because all presented data are published as referenced.

Acknowledgments

The authors thank Tom Holon of MSU and three anonymous reviewers for constructive criticisms of the manuscript.

Conflicts of Interest

The authors declare no conflict of interest.

References

  1. Lal, R. Soil health and climate change: An overview. In Soil Health and Climate Change; Singh, B.P., Cowie, A.L., Chan, K.Y., Eds.; Springer: Berlin/Heidelberg, Germany; Dordrech, The Netherlands; London, UK; New York, NY, USA, 2011; pp. 3–24. [Google Scholar]
  2. Assefa, F.; Elias, E.; Soromessa, T.; Ayele, G. Effect of changes in land-use management practices on soil physiochemical properties in Kabe Watershed, Ethiopia. Air Soil Water Res. 2020, 13, 1–16. [Google Scholar] [CrossRef]
  3. Fagodiya, R.K.; Pathak, H.; Kumar, A.; Bhatia, A.; Jain, N. Global temperature change potential of N use in agriculture: A 50 year assessment. Sci. Rep. 2016, 7, 44928. [Google Scholar] [CrossRef] [PubMed] [Green Version]
  4. IPCC. Climate Chang. 2013 Physical Science Basis; Contributing Working Group I to Fifth Assessment Representation. Intergovernmental Panel Climate Change 33; Cambridge University Press: Cambridge, UK, 2013. [Google Scholar]
  5. Jankowski, K.; Neill, C.; Davidson, E.A.; Macedo, M.N.; Costa, C.; Galford, G.L.; Santos, L.M.; Lefebvre, P.; Nunes, D.; Cerri, C.E.; et al. Deep soils modify environmental consequences of increased nitrogen fertilizer use in intensifying Amazon agriculture. Sci. Rep. 2018, 8, 13478. [Google Scholar] [CrossRef] [Green Version]
  6. Millar, N.; Robertson, G.P.; Grace, P.R.; Gehl, R.J.; Hoben, J.P. Nitrogen fertilizer management for nitrous oxide (N2O) mitigation in intensive corn (Maize) production: An emissions reduction protocol for US Midwest agriculture. Mitig. Adapt. Strateg. Glob. Chang. 2010, 15, 185–204. [Google Scholar] [CrossRef] [Green Version]
  7. Pimentel, D.; Giampietro, M. Food, Land, Population and the US Economy. 1994. Available online: http://www.dieoff.com/page40.htm (accessed on 19 May 2021).
  8. Robertson, G.P.; Bruulsema, T.D.; Gehl, R.J.; Kanter, D.; Mauzerall, D.L.; Rotz, C.A.; Williams, C.O. Nitrogen-climate interactions in US agriculture. Biogeochemistry 2012, 114, 41–70. [Google Scholar] [CrossRef] [Green Version]
  9. Anon. Soil Health. NRCS; 2016. Available online: http://www.nrcs.usda.gov/wps/portal/nr.cs/main/soils/health/ (accessed on 19 May 2021).
  10. Doran, J.W.; Zeiss, M.R. Soil health and sustainability: Managing the biotic component of soil quality. Appl. Soil Ecol. 2000, 15, 3–11. [Google Scholar] [CrossRef] [Green Version]
  11. Sánchez-Moreno, S. Biodiversity and soil health: The role of the soil food web in soil fertility and suppressiveness to soil-borne diseases. Acta Hortic. 2018, 1196, 95–104. [Google Scholar] [CrossRef]
  12. The Soil Food Web and Laboratories in the Continental USA. Available online: https://www.soilfoodweb.com/ (accessed on 19 May 2021).
  13. Ferguson, R.B. Groundwater quality and nitrogen use efficiency in Nebraska’s central platte river valley. J. Environ. Qual. 2015, 44, 449–459. [Google Scholar] [CrossRef] [Green Version]
  14. Lark, T.J.; Salmon, J.M.; Gibbs, H.K. Cropland expansion outpaces agricultural and biofuel policies in the United States. Environ. Res. Lett. 2015, 10, e044003. [Google Scholar] [CrossRef] [Green Version]
  15. Mladenoff, D.J.; Sahajpal, R.; Johnson, C.P.; Rothstein, R.E. Recent land use change to agriculture in the US lake states: Impacts on cellulosic biomass potential and natural lands. PLoS ONE 2016, 11, e0148566. [Google Scholar] [CrossRef]
  16. Beehler, J.; Fry, J.; Negassa, W.; Kravchenko, A.K. Impact of cover crop on soil carbon accrual in topographically diverse terrain. J. Soil. Water. Conserv. 2017, 72, 272–279. [Google Scholar] [CrossRef] [Green Version]
  17. Brainard, D.C.; Noyes, D.C. Strip-tillage and compost influence carrot quality, yield and net returns. HortScience 2012, 47, 1073–1079. [Google Scholar] [CrossRef] [Green Version]
  18. Cheng, Z.; Melakeberhan, H.; Mennan, S.; Grewal, P.S. Relationship between soybean cyst nematode Heterodera glycines and soil nematode community under long-term tillage and crop rotation. Nematropica 2018, 48, 101–115. [Google Scholar]
  19. Collins, H.P.; Alva, A.; Bydston, R.A.; Cochran, R.L.; Hamm, P.B.; McGuire, A.; Riga, E. Soil microbial, fungal, and nematode responses to soil fumigation and cover crops under potato production. Biol. Fertil. Soils 2006, 42, 247–257. [Google Scholar] [CrossRef]
  20. García-Orenes, F.; Morugán-Coronado, A.; Zornoza, R.; Scow, K. Changes in soil microbial community structure influenced by agricultural management practices in a Mediterranean agro-ecosystem. PLoS ONE 2013, 8, e80522. [Google Scholar] [CrossRef]
  21. Gebremikael, M.T.; Steel, H.; Bert, W.; Maenhout, P.; Sleutel, S.; De Neve, S. Quantifying the contribution of entire free-living nematode communities to carbon mineralization under contrasting C and N availability. PLoS ONE 2015, 10, e0136244. [Google Scholar] [CrossRef] [Green Version]
  22. Habteweld, A.W.; Brainard, D.C.; Kravchenko, A.N.; Grewal, P.S.; Melakeberhan, H. Effects of plant and animal waste-based compost amendments on soil food web, soil properties, and yield and quality of fresh market and processing carrot cultivars. Nematology 2018, 20, 147–168. [Google Scholar] [CrossRef]
  23. Helms, I.V.; Ijelu, J.A.; Willis, B.D.; Landis, D.A.; Haddad, N.M. Ant biodiversity and ecosystem services in bioenergy landscapes. Agr. Ecosyst. Environ. 2020, 290. [Google Scholar] [CrossRef]
  24. Toosi, E.R.; Kravchenko, A.N.; Guber, A.K.; Rivers, M.L. Pore characteristics regulate priming and fate of carbon from plant residue. Soil Biol. Biochem. 2017, 113, 219–230. [Google Scholar] [CrossRef]
  25. The 4R Principles of Nutrient Management—Do You Really Know Them? Meister Media Worldwide: Willoughby, OH, USA, 2021; Available online: https://www.croplife.com/special-reports/crop-nutrition/4r-principles-nutrient-management-really-know/ (accessed on 10 March 2021).
  26. Basso, B.G.; Zhang, S.J.; Robertson, G.P. Yield stability analysis reveals sources of large-scale nitrogen loss from the US Midwest. Nat. Sci. Rep. 2019, 10, 5774. [Google Scholar] [CrossRef]
  27. Kang, G.S.; Beri, V.; Sidhu, B.S.; Rupela, O.P. A new index to assess soil quality and sustainability of wheat-based cropping systems. Biol. Fertil. Soils. 2005, 41, 389–398. [Google Scholar] [CrossRef] [Green Version]
  28. Melakeberhan, H. Fertiliser use efficiency of soybean cultivars infected with Meloidogyne incognita and Pratylenchus penetrans. Nematology 2006, 8, 129–137. [Google Scholar] [CrossRef]
  29. Melakeberhan, H.; Avendaño, M.F. Spatio-temporal consideration of soil conditions and site-specific management of nematodes. Precis. Agric. 2008, 9, 341–354. [Google Scholar] [CrossRef]
  30. Melakeberhan, H. Cross-disciplinary efficiency assessment of agronomic and soil amendment practices designed to suppress biotic yield-limiting factors. J. Nematol. 2010, 42, 73–74. [Google Scholar] [PubMed]
  31. Jangid, K.; Williams, M.A.; Franzluebbers, A.J.; Sanderlin, J.S.; Reeves, J.H.; Endale, M.B.; Coleman, D.C.; Whitman, W.B. Relative impacts of land-use, management intensity and fertilization upon soil microbial community structure in agricultural systems. Soil Biol. Biochem. 2008, 40, 2843–2853. [Google Scholar] [CrossRef]
  32. Schutter, M.E.; Sandeno, J.M.; Dick, R.P. Seasonal, soil type, and alternative management influences on microbial communities of vegetable cropping systems. Biol. Fertil. Soils. 2001, 34, 397–410. [Google Scholar]
  33. Glavatska, O.; Muller, K.; Boutenschoen, O.; Schmalwasser, A.; Kandeler, E.; Scheu, S.; Totsche, K.U.; Ruess, L. Disentangling the root- and detritus-based food chain in the micro-food webs of an arable soil by plant removal. PLoS ONE 2017, 13, e0180264. [Google Scholar] [CrossRef] [Green Version]
  34. Ferris, H.; Bongers, T.; de Goede, R.G.M. A framework for soil food web diagnostics: Extension of the nematode faunal analysis concept. Appl. Soil Ecol. 2001, 18, 13–29. [Google Scholar] [CrossRef]
  35. Bongers, T.; Ferris, H. Nematode community structure as a bioindicator in environmental monitoring. Trends Evol. Ecol. 1999, 14, 224–228. [Google Scholar] [CrossRef]
  36. Van der Hoogen, J.; Geisen, S.; Routh, D.; Ferris, H.; Traunspurger, W.; Wardle, D.A.; De Goede, R.G.; Adams, B.J.; Ahmad, W.; Andriuzzi, W.S.; et al. Soil nematode abundance and functional group composition at a global scale. Nature 2019, 572, 194–198. [Google Scholar] [CrossRef] [Green Version]
  37. Yeates, G.W. Modification and qualification of the nematode maturity index. Pedobiologia 1995, 38, 97–101. [Google Scholar]
  38. Yeates, G.W.; Bongers, T.; de Goede, R.G.M.; Freckman, D.W.; Georgieva, S.S. Feeding habits in soil nematode families and genera an outline for soil ecologists. J. Nematol. 1993, 25, 315–331. [Google Scholar] [PubMed]
  39. Bongers, T.; Bongers, M. Functional diversity of nematodes. Appl. Soil Ecol. 1998, 10, 239–251. [Google Scholar] [CrossRef]
  40. Ferris, H.; Venette, R.C.; Scow, K.M. Soil management to enhance bacterivore and fungivore nematode populations and their nitrogen mineralization function. Appl. Soil Ecol. 2004, 24, 19–35. [Google Scholar] [CrossRef]
  41. Grabau, Z.J.; Chen, S. Influence of long-term corn-soybean crop sequences on soil ecology as indicated by the nematode community. Appl. Soil Ecol. 2016, 100, 172–185. [Google Scholar] [CrossRef]
  42. Grabau, Z.J.; Maung, Z.T.Z.; Noyes, C.; Baas, D.; Werling, B.P.; Brainard, D.C.; Melakeberhan, H. Effects of cover crops on Pratylenchus penetrans and the nematode community in carrot production. J. Nematol. 2017, 49, 114–123. [Google Scholar] [CrossRef] [PubMed] [Green Version]
  43. Kovacs-Hostyanszki, A.; Elek, Z.; Balazs, K.; Centeri, C.; Falusi, E.; Jeanneret, P.; Penksza, K.; Podmaniczky, L.; Szalkovszki, O.; Baldi, A. Earthworms, spiders and bees as indicators of habitat quality and management in low-input farming region—A whole farm approach. Ecol. Indic. 2013, 33, 111–120. [Google Scholar] [CrossRef] [Green Version]
  44. Fixen, P.; Brentrup, F.; Bruulsema, T.W.; Garcia, F.; Norton, R.; Zingore, S. Nutrient/fertilizer use efficiency: Measurements, current situation and trends. In Managing Water and Fertilizer for Sustainable Agricultural Intensification, 1st ed.; Drechsel, P., Heffer, P., Magen, H., Mikkelsen, R., Wichelns, D., Eds.; International Fertilizer Industry Association, International Water Management Institute, International Plant Nutrition Institute, and International Potash Institute: Paris, France, 2011; pp. 8–38. Available online: http://www.ipni.net/ipniweb/portal.nsf/0/B9C003FF28F9C9EF85257DE1007607CC/$FILE/2015_ifa_ipni_iwmi_ipi.pdf (accessed on 19 May 2021).
  45. Melakeberhan, H. Effect of starter nitrogen on soybeans under Heterodera glycines infestation. Plant Soil. 2007, 301, 111–121. [Google Scholar] [CrossRef]
  46. Bulluck, L.R., III; Barker, K.R.; Ristaino, J.B. Influences of organic and synthetic soil fertility amendments on nematode trophic groups and community dynamics under tomatoes. Appl. Soil Ecol. 2002, 21, 233–250. [Google Scholar] [CrossRef]
  47. Kravchenko, A.N.; Snapp, S.S.; Robertson, G.P. Field-scale experiments reveal persistent yield gaps in low-input and organic cropping systems. Proc. Natl. Acad. Sci. USA 2017, 114, 926–931. [Google Scholar] [CrossRef] [Green Version]
  48. Carrera, L.M.; Buyer, J.S.; Vinyard, B.; Abdul-Baki, A.A.; Sikora, L.J.; Teasdale, J.R. Effects of cover crops, compost and manure amendments on soil microbial community structure in tomato production systems. Appl. Soil Ecol. 2007, 37, 247–255. [Google Scholar] [CrossRef]
  49. Melakeberhan, H.; Wang, W.; Kravchenko, A.; Thelen, K. Effects of agronomic practices on the timeline of Heterodera glycines establishment in a new location. Nematology 2015, 17, 705–713. [Google Scholar] [CrossRef]
  50. Miguez, F.E.; Bollero, G.A. Review of corn yield response under winter cover cropping systems using metadata analytic methods. Crop Sci. 2005, 45, 2318–2329. [Google Scholar] [CrossRef] [Green Version]
  51. Renco, M.; Gomoryova, E.; Cerevkova, A. The effect of soil type and ecosystems on the soil nematode and microbial communities. Helminthologia 2020, 57, 129–144. [Google Scholar] [CrossRef] [PubMed]
  52. Ge, Z.W.; Brenneman, T.; Bonito, G.; Smith, M.E. Soil pH and mineral nutrients strongly influence truffles and other ectomycorrhizal fungi associated with commercial pecans (Carya illinoinensis). Plant Soil. 2017, 418, 493–505. [Google Scholar] [CrossRef]
  53. Bonito, G.; Reynolds, H.; Hodkinson, B.; Nelson, J.; Tuskan, G.; Robeson, M.; Schadt, C.; Vilgalys, R. Plant host and soil origin influence fungal and bacterial assemblages in the rhizosphere of woody plants. Mol. Ecol. 2014, 23, 3356–3370. [Google Scholar] [CrossRef] [PubMed]
  54. World Fertilizer Trends and Outlook to 2022; FAO: Rome, Italy, 2018; Available online: http://www.fao.org/3/ca6746en/ca6746en.pdf (accessed on 19 May 2021).
  55. Adesemoye, A.O.; Kloepper, J.W. Plant-microbe interactions in enhanced fertilizer-use efficiency-Mini-review. Appl. Microbio. Biotechnol. 2009, 85, 1–12. [Google Scholar] [CrossRef] [Green Version]
  56. Chagas, W.F.T.; Emrich, E.B.; Guelfi, D.R.; Caputo, A.L.C.; Faquin, V. Productive characteristics, nutrition and agronomic efficiency of polymer-coated MAP in lettuce crops. Cienc. Agron. 2015, 46, 266–276. [Google Scholar] [CrossRef] [Green Version]
  57. Nissen, T.M.; Wander, M.M. Management and soil-quality effects on fertilizer-use efficiency and leaching. Soil Sci. Soc. Am. J. 2003, 67, 1524–1532. [Google Scholar] [CrossRef] [Green Version]
  58. Olk, D.C.; Cassman, K.G.; Simbaha, G.; Sta Cruz, P.C.; Abdulrachman, S.; Nagarajan, R.; Tan, P.S.; Satawathananon, S. Interpreting fertilizer-use efficiency in relation to soil nutrient-supplying capacity, factor productivity, and agronomic efficiency. Nutr. Cycl. Agroecosyst 1999, 53, 35–41. [Google Scholar] [CrossRef]
  59. Biesiada, A.; Koota, E. The Effect of nitrogen fertilization on yield and quality of Radicchio. J. Elementol. 2008, 13, 175–180. [Google Scholar]
  60. Blanc, C.; Sy, M.; Djigal, D.; Brauman, A.; Normand, P.; Villenave, C. Nutrition on bacteria by bacterial-feeding nematodes and consequences on the structure of soil microbial community. Eur. J. Soil Biol. 2006, 42, S70S78. [Google Scholar] [CrossRef]
  61. Gibson, J.; Shokralla, S.; Porter, T.M.; King, I.; van Konynenburg, S.; Janzen, D.H.; Hallwachs, W.; Hajibabaei, M. Simultaneous assessment of the macrobiome and microbiome in a bulk sample of tropical arthropods through DNA metasystematics. Proc. Natl. Acad. Sci. USA 2014, 111, 8007–8012. [Google Scholar] [CrossRef] [PubMed] [Green Version]
  62. Riga, E.; Mojtahedi, H.; Ingham, R.E.; McGuire, A.M. Green manure amendments and management of root knot nematodes on potato in the Pacific Northwest of USA. Nematol. Monogr. Perspect. 2003, 2, 151–158. [Google Scholar]
  63. Schorpp, Q.; Schrader, S. Earthworm functional groups respond to the perennial energy cropping system of the cup plant (Silphium perforliatum). Biomass Bioenergy 2016, 87, 61–68. [Google Scholar] [CrossRef]
  64. Toosi, E.R.; Kravchenko, A.N.; Quigley, M.M.; Mao, J.; Rivers, M.L. Effects of management and pore characteristics on organic matter composition of macroaggregates, evidence from X-ray µ-tomography, FTIR and 13C-NMR. Eur. J. Soil Sci. 2017, 68, 200–211. [Google Scholar] [CrossRef]
  65. van Leeuwen, J.P.; Djukic, I.; Bloem, J.; Lehtinen, T.; Hemerick, L.; de Ruiter, P.C.; Lair, G.J. Effects of land use on soil microbial biomass, activity and community structure at different soil depth in the Danube floodplain. Eur. J. Soil Biol. 2017, 79, 14–20. [Google Scholar] [CrossRef]
  66. Wang, K.H.; McSorley, R.; Kokalis-Burelle, N. Effects of cover cropping, solarization, and fumigation on nematode communities. Plant Soil. 2006, 286, 229–243. [Google Scholar] [CrossRef]
  67. Wang, K.H.; Radovich, T.; Pant, A.; Cheng, Z. Integration of cover crops and vermicompost tea for soil and plant health management in a short-term vegetable cropping system. Appl. Soil Ecol. 2014, 82, 26–37. [Google Scholar] [CrossRef]
  68. Wickings, K.; Grandy, A.S.; Kravchenko, A.N. Going with the flow: Landscape position drives differences in microbial biomass and activity in conventional, low input, and organic agricultural systems in the Midwestern, U.S. Agric. Ecosyst. Environ. 2016, 218, 1–10. [Google Scholar] [CrossRef]
  69. Xiao, H.; Li, G.; Li, D.-M.; Hu, F.; Li, H.-X. Effect of different bacterial feeding nematode species on soil bacterial numbers, activity and community composition. Pedosphere 2014, 24, 116–124. [Google Scholar] [CrossRef]
  70. Zhang, X.; Ferris, H.; Mitchell, J.; Liang, W. Ecosystem services of the soil food web after long-term application if agricultural management practices. Soil Biol. Biochem. 2017, 111, 36–43. [Google Scholar] [CrossRef]
  71. Emery, S.M.; Reid, M.L.; Bell-Dereske, L.; Gross, K.L. Soil mycorrhizal and nematode diversity vary in response to bioenergy crop identity and fertilization. Glob. Chang. Biol. Bioenergy 2017, 9, 1644–1656. [Google Scholar] [CrossRef] [Green Version]
  72. Kokalis-Burelle, N.; Mahaffee, W.F.; Rodriguez-Kabana, R.; Klopper, J.W.; Brown, K.L. Effects of switchgrass (Panicum virgatum) rotations with peanut (Arachis hypogaea L.) on nematode populations and soil microflora. J. Nematol. 2002, 34, 98–105. [Google Scholar]
  73. Jian, J.; Du, X.; Stewart, R.D. A database for global soil health assessment. Nature. Sci. Data 2020, 7, 16. [Google Scholar] [CrossRef] [PubMed] [Green Version]
  74. Wander, M.M.; Cihacek, L.J.; Coyne, M.; Drijber, R.A.; Grossman, J.M.; Gutknecht, J.L.M.; Horwath, W.R.; Jagandamma, S.; Olk, D.C.; Ruark, M.; et al. Developments in agricultural soil quality and health: Reflections by the research committee on soil organic matter management. Front. Environ. Sci. 2019, 7, 1–9. [Google Scholar] [CrossRef] [Green Version]
  75. Fine, A.K.; van Es, H.M.; Schindelbeck, R.R. Statistics, Scoring Functions, and Regional Analysis of a Comprehensive Soil Health Database. Soil Sci. Soc. Am. J. 2017, 81, 589. [Google Scholar] [CrossRef]
  76. Kihara, J.; Bolo, P.; Kinyua, M.; Nyawira, S.S.; Sommer, R. Soil health and ecosystem services: Lessons from sub-Saharan Africa. Geoderma 2019, 370, 141342. [Google Scholar]
  77. Stewart, Z.P.; Pierzynski, G.M.; Middendorf, B.J.; Prasad, P.V.V. Approaches to improve soil fertility in sub-Saharan Africa. J. Exp. Bot. 2020, 71, 632–641. [Google Scholar] [CrossRef] [Green Version]
  78. Liu, T.; Hu, F.; Li, H. Spatial ecology of soil nematodes: Perspectives from global to micro scales. Soil Biol. Biochem. 2019, 137, 107565. [Google Scholar] [CrossRef]
  79. Melakeberhan, H.; Maung, Z.T.Z.; Lee, C.-L.; Poindexter, S.; Stewart, J. Soil type-driven variable effects on cover- and rotation-crops, nematodes and soil food web in sugar beet fields reveal a roadmap for developing healthy soils. Eur. J. Soil Biol. 2018, 85, 53–63. [Google Scholar] [CrossRef]
  80. Thuo, A.K.; Karuku, G.N.; Kimenju, J.W.; Kariuku, G.M.; Wendot, P.K.; Melakeberhan, H. Factors influencing the relationship between nematode communities and edaphic factors on selected soil groups in Kenya: Vertisols, Cambisols and Arenosols. Trop. Subtrop. Agroecosyst. 2020, 23, 49. [Google Scholar]
  81. Domene, X.; Mattana, S.; Sanchez-Moreno, S. Biochar addition rate determines contrasting shifts in soil nematode trophic groups in outdoor mesocosms: An appraisal of underlying mechanisms. Appl. Soil Ecol. 2021, 158, 103788. [Google Scholar] [CrossRef]
  82. Habteweld, A.; Brainard, D.; Kravchenko, A.; Parwinder, P.S.; Melakeberhan, H. Characterizing nematode communities in carrot fields and their bioindicator role for soil health. Nematropica 2020, 50, 201–210. [Google Scholar]
  83. Habteweld, A.; Brainard, D.; Kravchenko, A.; Parwinder, P.S.; Melakeberhan, H. Effects of integrated application of plant-based compost and urea on soil food web, soil properties, and yield and quality of a processing carrot cultivar. J. Nematol. 2020, 52. [Google Scholar] [CrossRef]
  84. Melakeberhan, H.; Maung, Z.; Lartey, I.; Yildiz, S.; Gronseth, J.; Qi, J.; Karuku, G.N.; Kimenju, J.W.; Kwoseh, C.; Adjei-Gyapong, T. Nematode community-based soil food web analysis of Ferralsol, Lithosol and Nitosol soil groups in Ghana, Kenya and Malawi reveals distinct soil health degradations. Diversity 2021, 13, 101. [Google Scholar] [CrossRef]
  85. Moore-Kucera, J.; Azarenko, A.N.; Brutcher, L.; Chozinski, A.; Myrold, D.D.; Ingham, R. In search of key soil functions to assess soil community management for sustainable sweet cherry orchards. HortScience 2008, 43, 38–44. [Google Scholar] [CrossRef] [Green Version]
  86. Kravchenko, A.N.; Guber, A.K.; Rasavi, B.S.; Koestel, J.; Quigley, M.Y.; Robertson, G.P.; Kuzyakov, Y. Microbial spatial footprint as a driver of soil carbon stabilization. Nat. Comm. 2019. [Google Scholar] [CrossRef] [PubMed] [Green Version]
  87. Publications—Soil Food Web School; Soil Foodweb School LLC: Corvallis, OR, USA, 2021; Available online: https://www.soilfoodweb.com/publications/ (accessed on 10 March 2021).
  88. State of Knowledge of Soil Biodiversity—Status, Challenges and Potentialities (Fao.org); FAO: Rome, Italy, 2020; Available online: http://www.fao.org/3/cb1928en/CB1928EN.pdf (accessed on 10 March 2021).
  89. Lišková, M.; Čerevková, A.; Hanel, L. Nematode communities of forest ecosystems in association with various soil orders. Russ. J. Nematol. 2008, 16, 129–142. [Google Scholar]
  90. Lima da Silva, J.V.C.; Hirschfeld, M.N.C.; Cares, J.E.; Esteves, A.M. Land use, soil properties and climate variables influence the nematode communities in the Caatinga dry forest. Appl. Soil Ecol. 2019, 103474. [Google Scholar] [CrossRef]
  91. Lazarova, S.; Coyne, D.; Rodríguez, M.G.; Peteira, B.; Ciancio, A. Functional diversity of soil nematodes in relation to the impact of agriculture—A review. Diversity 2021, 13, 64. [Google Scholar] [CrossRef]
  92. Baveye, P.C.; Otten, W.; Kravchenko, A.; Balseiro-Romero, M.; Beckers, É.; Chalhoub, M.; Darnault, C.; Eickhorst, T.; Garnier, P.; Hapca, S.; et al. Emergent properties of microbial activity in heterogeneous soil microenvironments: Different research approaches are slowly converging, yet major challenges remain. Frontiers in Microbiology, for special topic Elucidating Microbial Processes in Soils and Sediments. Micro. Measu. Model. 2018. [Google Scholar] [CrossRef] [PubMed]
  93. Lallias, D.; Hiddink, J.G.; Fonseca, V.G.; Gaspar, J.M.; Sung, W.; Neill, S.P.; Barnes, N.; Ferrero, T.; Hall, N.; Lambshead, P.J.D.; et al. Environmental metabarcoding reveals heterogeneous drivers of microbial eukaryote diversity in contrasting estuarine ecosystems. Int. Soc. Micro. Ecol. J. 2015, 9, 1208–1221. [Google Scholar] [CrossRef]
  94. Peraza-Padilla, W.; Archidona-Yuste, A.; Ferris, H.; Zamora-Araya, T.; Cantalapiedra-Navarrete, C.; Palmores-Rius, J.E.; Subbotin, S.A.; Castillo, P. Molecular characterization of pseudomonodelphic dagger nematodes of the genus Xiphinema Cobb, 1913 (Nematoda: Longidoridae) in Costa Rica, with notes on Xiphinema setariae Tarjan, 1964. Eur. J. Plant Pathol. 2017, 148, 739–747. [Google Scholar] [CrossRef]
  95. Powers, T.O.; Bernard, E.C.; Harris, T.; Higgins, R.; Olson, M.; Olson, S.; Lodema, M.; Matczyszyn, J.; Mullin, P.; Sutton, L.; et al. Species discovery and diversity in Lobocriconema (Criconematidae: Nematoda) and related plant-parasitic nematodes from North American ecoregions. Zootaxa 2016, 4085, 301–344. [Google Scholar] [CrossRef] [PubMed] [Green Version]
  96. Takahashi, S.; Omita, J.; Nishioka, K.; Hisada, T.; Nishijima, M. Development of a prokaryotic universal primer for simultaneous analysis of bacteria and archaea using next-generation sequencing. PLoS ONE 2014, 9, e105592. [Google Scholar] [CrossRef] [PubMed] [Green Version]
  97. Bonito, G.; Hameed, K.; Krishnan, J.; Ventura, R.; Vilgalys, R. Isolating a functionally relevant guild of fungi from the root microbiome of Populus. Fungal Ecol. 2016, 22, 35–42. [Google Scholar] [CrossRef] [Green Version]
  98. Uehling, J.; Gryganskyi, A.; Hameed, K.; Tschaplinski, T.; Misztal, P.K.; Wu, S.; Desirò, A.; Vande Pol, N.; Du, Z.; Zienkiewicz, A.; et al. Comparative Genome sequencing reveals origins of a unique bacterial endosymbiosis in the earliest lineages of terrestrial Fungi. Environ Micro. 2017, 19, 2964–2983. [Google Scholar] [CrossRef] [PubMed]
  99. Longley, R.; Noel, Z.A.; Benucci, G.M.N.; Chilvers, M.I.; Trail, F.; Bonito, G. Crop management impacts the soybean (Glycine max) microbiome. Front. Micro. 2020, 11, 1116. [Google Scholar] [CrossRef] [PubMed]
  100. Habteweld, A.W. Assessing the Impact of Compost Amendment for Managing Nematodes and the Health of Mineral Soil under carrot Production. Ph.D. Thesis, Michigan State University, East Lansing, MI, USA, 2015. [Google Scholar]
Figure 1. An open access USDA/NRCS illustration of the five trophic levels of the soil food web and the role of nematodes in trophic levels II, III, and IV. https://www.nrcs.usda.gov/wps/portal/nrcs/photogallery/soils/health/biology/gallery/?cid = 1788&position = Promo (accessed on 5 May 2021).
Soilsystems 05 00032 g001
Figure 2. Key concepts in crop production management: (A) agricultural practices (APs) collectively influence, (B) soil health components to generate (C) objective-dependent ecosystem services (ES) outcomes, that (D) may be achieved (yes) or not achieved (no) or variably achieved, which lead to management decisions on (E) efficiency and (F) sustainability of the outcomes, and the bottlenecks in the gaps in integrated understanding of the process-limiting dynamics across A, B, and C, and the lack of decision-making tools across D, E, and F, that keep the cycle of soil health degradation continue.
Soilsystems 05 00032 g002
Figure 3. Simplified SFW model that uses changes in nematode community relative to food and reproduction (Enrichment Index, y-axis) and resistance to disturbance (Structure Index, x-axis) to describe soil health conditions from best (Quadrant B) to worst (Quadrant D) case scenarios for nutrient cycling and agroecosystem and sustainability [34]; Indices of Ecosystem Condition (ucdavis.edu).
Soilsystems 05 00032 g003
Figure 4. Soil food web structure of Ferralsols, Lithosols, and Nitosols under disturbed (right) fields of Ghana (circle), Kenya (triangle), and Malawi (square). The Quadrants A, (enriched but unstructured), B (enriched and structured), C (resource-limited and structured), and D (resource-depleted with minimal structure) are based on the Ferris et al. [34] model. Adopted from Melakeberhan et al. [84].
Soilsystems 05 00032 g004
Figure 5. Conceptual use of the fertilizer use efficiency (FUE) model analysis scatter plots and quadrants to separate Best (green), Worst (red), and Variable (yellow) outcomes of ecosystem service (ES) and harmful (HN, left [28]) and beneficial (BN, right [29]) nematodes as indicators of the biological component of the SFW. Increased (▲) and decreased (▼) responses and what they mean (=) are indicated; 100% on either axis is a control.
Soilsystems 05 00032 g005
Figure 6. FUE model analysis can tell whether a selected treatment is the best for soil health improvement, or what to do to improve the outcome, when the standard method of comparison cannot. When the data that produced Table 1 are expressed as a percent of control and fitted to the FUE model, the conclusion is that the soil nutrient amendments are working towards a positive outcome [30]. Quadrants A, B, C, and D are as described in Figure 5.
Soilsystems 05 00032 g006
Table 1. Least square means and standard errors (±) of structure (SI) and enrichment (EI) indices of disturbed landscapes of Ghana, Kenya, and Malawi in Ferralsol (FL), Lithosol (LL), and Nitosol (NL) soil groups (SG). Adopted from Melakeberhan et al. [84].
SGCountrySI ¥EI
FLGhana77.8 ± 6.6 ab18.5 ± 4.1 ed
Kenya68.2 ± 4.9 bc30.6 ± 2.8 abc
Malawi31.9 ± 4.9 d36.0 ± 2.8 ab
LLGhana88.3 ± 5.8 a28.3 ± 3.4 abc
Kenya62.4 ± 4.9 bc26.0 ± 2.8 cd
Malawi52.1 ± 5.0 c37.0 ± 2.9 a
NLGhana77.7 ± 4.9 ab27.7 ± 2.8 bcd
Kenya62.8 ± 4.9 bc10.8 ± 2.8 e
Malawi42.1 ± 5.4 d31.3 ± 3.3 abc
¥ Means followed by the same letter within and across soil groups in a column are not statistically different at p < 0.05.
Table 2. Means of SCN population density (eggs/100 cc of soil) and NDVI for levels of fertilization (control, -N or +N) at vegetative (V5) and reproductive (R1-R2) growth stages of soybean expressed as measured values (left) and as percent of control (right), and the interactions of nutrient (Nu) and time (T). Adopted from Melakeberhan [30].
FactorSCN ¥NDVISCNNDVI
Measured ValuesAS % of Control
Nutrient (Nu)Control2420 a0.373 anana
No N991 a0.411 a36.9 a110.3 a
Plus N2269 a0.333 a82.3 a89.8 a
Time (T)V 53062 a0.348 a74.3 a108.3 a
R1-R2725 b0.396 a44.9 a91.9 a
Nu*T 0.53980.69880.62050.9296
¥ Means within the same column and factor followed by the same letters are not significantly different from each other (p ≤ 0.05). na = Not applicable as data are expressed as percent of the respective controls.
Publisher’s Note: MDPI stays neutral with regard to jurisdictional claims in published maps and institutional affiliations.

