Article

Single and Binary Fe- and Al-hydroxides Affect Potential Phosphorus Mobilization and Transfer from Pools of Different Availability

Department of Soil Protection and Recultivation, Faculty of Environment and Natural Sciences, Brandenburg University of Technology Cottbus-Senftenberg, Konrad-Wachsmann-Allee 6, 03046 Cottbus, Germany
*
Author to whom correspondence should be addressed.
Submission received: 9 March 2021 / Revised: 5 May 2021 / Accepted: 20 May 2021 / Published: 21 May 2021

Abstract

:
Phosphorus (P) fixation is a global problem for soil fertility and negatively impacts agricultural productivity. This study characterizes P desorption of already fixed P by using KCl, KNO3, histidine, and malic acid as inorganic and organic compounds, which are quite common in soil. Goethite, gibbsite, and ferrihydrite, as well as hydroxide mixtures with varying Fe- and Al-ratio were selected as model substances of crystalline and amorphous Fe- and Al-hydroxides. Especially two- and multi-component hydroxide systems are common in soils, but they have barely been included in desorption studies. Goethite showed the highest desorption in the range from 70.4 to 81.0%, followed by gibbsite with values in the range from 50.7 to 42.6%. Ferrihydrite had distinctive lower desorption in the range from 11.8 to 1.9%. Within the group of the amorphous Fe-Al-hydroxide mixtures, P desorption was lowest at the balanced mixture ratio for 1 Fe: 1 Al, increased either with increasing Fe or Al amount. Precipitation and steric effects were concluded to be important influencing factors. More P was released by crystalline Fe-hydroxides, and Al-hydroxides of varying crystallinity, but desorption using histidine and malic acid did not substantially influence P desorption compared to inorganic constituents.

1. Introduction

P, is, on the one hand, one of the most important essential nutrients for plant growth, but on the other hand, a finite resource, limiting productivity in agriculture terrestrial ecosystems. Given the scarcity of global phosphorus reserves, and to ensure sustainable soil fertility on agricultural soils, a fundamental understanding of the mechanisms of fixation, recognized as the reduction of solubility of fertilized P in the soil [1], and mobilization of inorganic phosphorus in soils is required. Although both the inorganic and organic P pools contribute to total P availability [2,3], dissolved inorganic P is the only P fraction that can be taken up by plants and microorganisms, thus maintaining ecosystem nutrition and mineralization [4]. Dissolved P has a high affinity for adsorption to the soil matrix, which affects its bioavailability, depending on soil composition and binding motifs. In particular, adsorption, desorption, and precipitation processes on pedogenic mineral surfaces limit its availability, which is why reactions of P with selected hydroxides have been studied in detail in the past.
“Nonspecific” physisorption via electrostatic attraction provides lower binding energy and thus easy mobilization of P by ion exchange [5,6], while more “specific” chemisorption results in stronger binding at the particle surface and lower availability of P over time [7,8]. However, the most stable and long-lasting P immobilization occurs via precipitation on the particle surface, where especially amorphous Fe-hydroxides play a major role [9,10,11].
In addition to the fixation of inorganic P on mineral surfaces, the soil organic matter has an important influence on P adsorption and desorption. If both P and organic anions are present in the soil solution, the adsorption of P on hydroxide surfaces can be positively influenced by competition for adsorption sites, ligand exchange, and replacement of P by organic anions, dissolution of adsorbents, and changes in the surface charge of the adsorbents. Soil organic matter can also retard the crystal growth of poorly crystalline Fe- and Al-oxides and -hydroxides, which affects their specific P adsorption capacities. Moreover, organic anions can form metal-organic complexes by adsorption on metal ions (e.g., Al3+, Fe3+) [12,13,14,15,16,17].
P fixation is a global problem for soil fertility and negatively impacts agricultural productivity because recovery by plants in the year of application is often only 10 to 15% and P inputs from fertilizers tend to accumulate in the soil [18]. A meta-analysis of about 2000 datasets from 30 field trials from Germany and Austria showed that yield increase after P application is mainly determined by pH, soil organic matter, fertilizer type, and crop type, whereas plant-available P in the soil seems to be the most important parameter [19]. However, Syers et al. (2008) [20] showed that an irreversible immobilization of fertilized P is not supported by field studies. They divided inorganic soil P into four pools with different availability to plants based on its accessibility to plant roots and extractability using common soil analytical methods. These pools range from soil solution P characterized by immediate accessibility and availability to very low accessible, extractable, and available P, which is very strongly bonded, inaccessible, precipitated, or mineral P. Roberts and Johnston (2015) [19] have summarized that differences in P bioavailability depend on accessibility to plant roots and extractability by soil test reagents. However, when the concept of P transfer within the four pools and partial nutrient balance is considered, P recovery can exceed 70%. In particular, the distribution of P among these different pools leads to the conversion of excess P into very slowly exchangeable P that can only be partially utilized when soil P content is low [21]. These organic and inorganic P pools of different availability were generated due to the weaker bound P in surface complexes or the strongly bound precipitates. Therefore, the fundamental understanding of P binding motifs on contrasting mineral surfaces, and possible changes in binding over time [22,23,24,25,26,27,28,29,30] allows a more detailed characterization of soils in terms of their potential P fixation capacity, as well as short- and long-term mobilization.
Most methods for the determination of available P are based on the quantification of solubilized P using different extractants, consist of chemical equilibrium-controlled solubility, and release rates-limiting processes. They do not measure the quantity of plant-available P, but by experimentation, testing, and the application of regression equations, they allow a prediction about a soil P status related to it [31]. However, these observed results are not always applicable to different soil types or arable crops. Due to ad- and desorption processes, dissolution, or mineralization, the pool of plant-available P is strongly time-dependent [20,31]. For this, sequential extraction methods offer an inexpensive and simple approach to determine the amount of long-term mobilized P. The different extractants can be selected according to the objectives and play a role, e.g., during cultivation, in the rhizosphere, or during soil development. While no particulate speciation such as precipitated or re-adsorbed P can be provided without further investigations [1], different soil types or soil components can be investigated concerning the differentiation of potential P mobilization. Based on the empirical assignments, the P status of soils can be characterized according to a concept of different available P pools and their transformation [20,31].
Therefore, this study aims to investigate whether the crystallinity, as well as the Fe/Al ratio of hydroxides, affects the potential mobilization of adsorbed P. The results will hopefully guide as to whether the composition of soil in terms of pedogenic hydroxides affects the moderately to non-labile P reserves. For this purpose, desorption kinetics are created in a batch setup using synthetic Fe- and Al-hydroxides as well as inorganic and organic extraction agents at two concentrations.
The amount of low and very low available inorganic P that can be desorbed by increasing concentrations of organic and inorganic extractants has to be determined, and the time-depended mobilization process will be evaluated.

2. Materials and Methods

2.1. Preparation of the Fe- and Al-Hydroxides

Goethite and gibbsite were used as model substances of crystalline Fe- and Al-hydroxides. In addition to ferrihydrite, these minerals were the main model minerals of previous studies. However, two- or multi-component hydroxide systems are more common in soils, but they have barely been included so far, especially in desorption studies. Therefore, synthesized Fe- and Al-hydroxide mixtures with varying Fe- and Al-ratio represented this binary amorphous fraction appearing in soils. Poorly crystalline ferrihydrite was used as a transitional Fe-hydroxide, bridging between the initial amorphous hydroxide structure and crystalline goethite during pedogenesis.
The synthetic hydroxides investigated in this study were goethite (99%, Alfa Aesar, Haverhill, MA, USA), gibbsite (analytical grade, Merck Millipore, Merck KGaA, Darmstadt, Germany), ferrihydrite (prepared according to [32]), and mixed Fe:Al-hydroxide (prepared according to [33]).
For the preparation of 2-line-ferrihydrite, a 1 M KOH was added to 500 mL of a 0.2 M Fe(NO3)3∙9 H2O-solution, until a pH of 7.5 was reached. The developed precipitate was washed with ultrapure water to remove remaining salts, centrifuged for 5 min at 12,134× g (Avanti J-25 Centrifuge, Beckman Coulter, Brea, CA, USA), frozen and freeze-dried, and stored in a desiccator.
The Fe:Al-hydroxide mixtures were prepared by mixing 0.1 M Fe(NO3)3∙9 H2O and 0.1 M Al(NO3)3∙9 H2O in molar ratios of 1:0, 5:1. 1:1, 1:5, and 0:1, and adjusted to pH 6 with 5 M KOH. The solutions were equilibrated for 1 h. Subsequently, the precipitate was washed with ultrapure water, centrifuged for 5 min at 12,134× g, dried at 60 °C, and ground into a powder. All chemicals used for the preparation were of analytical grade.
Prior to desorption experiments, 20 g of each hydroxide was adjusted to pH 6 in 50 mL ultrapure water with 0.1 M HCl or KOH, respectively, and dried at 40 °C for 5 days. P was adsorbed by adding 200 mL of a 0.3 M P solution to 17 g of the dried hydroxides. The P solution consisted of a Na2HPO4/KH2PO4 buffer solution (pH 6) with additional KH2PO4 to achieve the desired P concentration of 0.3 M. Subsequently, the hydroxide-P solution mixtures were shaken horizontally with 200 Motions min−1 for 24 h. Afterward, they were centrifuged for 15 min at 21,572× g until the supernatant was clear.

2.2. Characterization of the Fe- and Al-Hydroxides

The elemental composition of the hydroxides was verified using SEM-EDX, scanning electron microscopy (DSM 962, Zeiss, Oberkochen, Germany) with energy dispersive X-ray spectroscopy (X-Max 50 mm² with INCA, Oxford Instruments, Abingdon, Great Britain). The determination of the crystallization, as well as the poorly crystalline and amorphous structures was performed using X-ray diffraction (Empyrean powder diffractometer, PANalytical, Almelo, Netherlands) (for the results of gibbsite, ferrihydrite and the Fe-Al-hydroxide mixtures see [24], for the results of goethite see [23]).
Specific surface areas were determined in duplicate with an Autosorb-1 (Quantachrome, Odelzhausen, Germany) using a multi-point BET-measurement (Brunauer–Emmett–Teller) and N2 as adsorptive. An outgas test was performed to verify the completed outgas procedure for each hydroxide. The specific surface area was substantially higher for the amorphous Fe-hydroxides and decreased with increasing crystallinity grade, as well as an increasing amount of Al for the mixtures (Table 1). The specific surface area was in the same range for the crystalline and the amorphous Al-hydroxides.
The point of zero charge (PZC) of each hydroxide was determined using potentiometric titration. 0.5 g of each hydroxide mixture was weighed into 100 mL PE-cups in triplicate. 30 mL of different KCL solutions (0.02, 0.2, and 2 M) were added separately to each sample. The solutions were diluted with ultrapure water to a total volume of 60 mL, leading to final concentrations of 0.01, 0.1, and 1 M KCl, respectively. The hydroxide/KCl mixtures were equilibrated for 4 days at 21 °C and shaken for 1 h d-1 to reach an equilibration pH value prior to the titration procedure. In the beginning, the pH of the suspensions was increased with 1 mL of 5 M KOH, followed by titration with fixed amounts of 1 M HCl. The amount of adsorbed H+ on the hydroxide surface at each pH was determined by subtracting the titration curve of the blank KCl solutions from the titration curve of the suspension. The PZC derived from the titration curves was highest for amorphous hydroxides with a predominant Al- amount with a value of 9.8 (Table 1). The PZC decreased with increasing Fe-amount and was lowest for the pure amorphous Fe-hydroxide with a value of 6.0. Within the group of the crystalline hydroxides, gibbsite, and goethite were in a similar range with PZC values of 8.5 and 8.8, respectively. Ferrihydrite offered a slightly lower value of 7.1.
The total amount of Fe, Al, and adsorbed P was determined in duplicate by digestion of 0.02 g hydroxide in 50 mL ultrapure water with 1 mL aqua regia. The poorly crystalline ferrihydrite adsorbed initially 30.92 mg g−1 P, which was 4-fold higher than for goethite or gibbsite (Table 1). The amorphous Fe:Al-hydroxide mixtures had adsorbed P concentrations in the range from 31.34 to 64.65 mg g−1, increasing with a predominant amount of Al. Thus, the amorphous hydroxides showed a higher P adsorption than the crystalline hydroxides. Related to the specific surface area, P adsorption values of 80.81 and 40.25 mg m−2 were obtained for the amorphous Al-hydroxides, and 8.21 mg m−2 was obtained for gibbsite. P adsorption values in the range from 0.12 to 0.43 mg m−2 were lower for Fe-hydroxides due to the substantially higher SSA.

2.3. Desorption Experiments

Desorption experiments were performed in a batch setup at room temperature. The investigations were carried out in quadruplicate using 50 mL PE-centrifuge tubes. Each batch contained a hydroxide-solution mixture, consisting of 0.8 g hydroxide and 40 mL reaction solution, resulting in a solid-solution ratio of 1:50.
KCl and KNO3 were selected as inorganic compounds for desorption experiments since they are an essential part of the soil solution in agricultural soils, and components of mineral fertilizers. Histidine (C6H9N3O2, His) and malic acid (C4H6O5, Mal) were chosen as organic extractants. These reaction solutions were used with concentrations of 5 mM and 50 mM, adjusted to a pH of 6 with 0.1 M KOH, HCl, or HNO3, respectively.
At the beginning of desorption, the samples were shaken horizontally at 200 Motions min−1 for 24 h, afterward once a week for 1 h. For sample taking, the hydroxide-solution mixtures were centrifuged for 20 min at 21,572× g. The clear supernatant was carefully decanted and filtrated using P-poor Whatman 512 1/1 folded filter papers. Afterward, 40 mL of the fresh reaction solution was added to continue desorption. Sample taking was done after 2, 6, 24, 48, 168, and 336 h desorption time. After a desorption time of 2 h, the pH of the sample solution was measured again in two randomly selected samples of each hydroxide for all treatments.
Concentrations of dissolved total P, Fe, and Al were determined by using ICP–AES (Unicam iCAP6000 Duo, Thermo Fisher Scientific, Waltham, MA, USA), total Cl was determined by using ion chromatography (Dionex DX 500 + DX 120, Thermo Fisher Scientific), total N and C were measured with a TOC-Analyzer (TOC-VCPH and TOC5000, Shimadzu, Kyoto, Japan). Repeated washing of all used materials with ultrapure water and immediate freezing of the sample solutions prevented microbial activity.

2.4. Kinetics of P Desorption

The cumulative P desorption depending on time was calculated, and different linearized kinetic models were applied to the data (Table 2). The aim was to fit the experimental data to an appropriate kinetic model and to analyze the influence of organic and inorganic solutions on desorption kinetics from contrasting Fe- and Al-hydroxides. The coefficients of determination (R²), as well as the standard errors (S.E.) were tested using linear regression analysis to determine their applicability on the kinetics using SigmaPlot 12.0 (Systat Software Inc., San Jose, CA, USA). When not stated otherwise, the p-value was <0.05.

3. Results

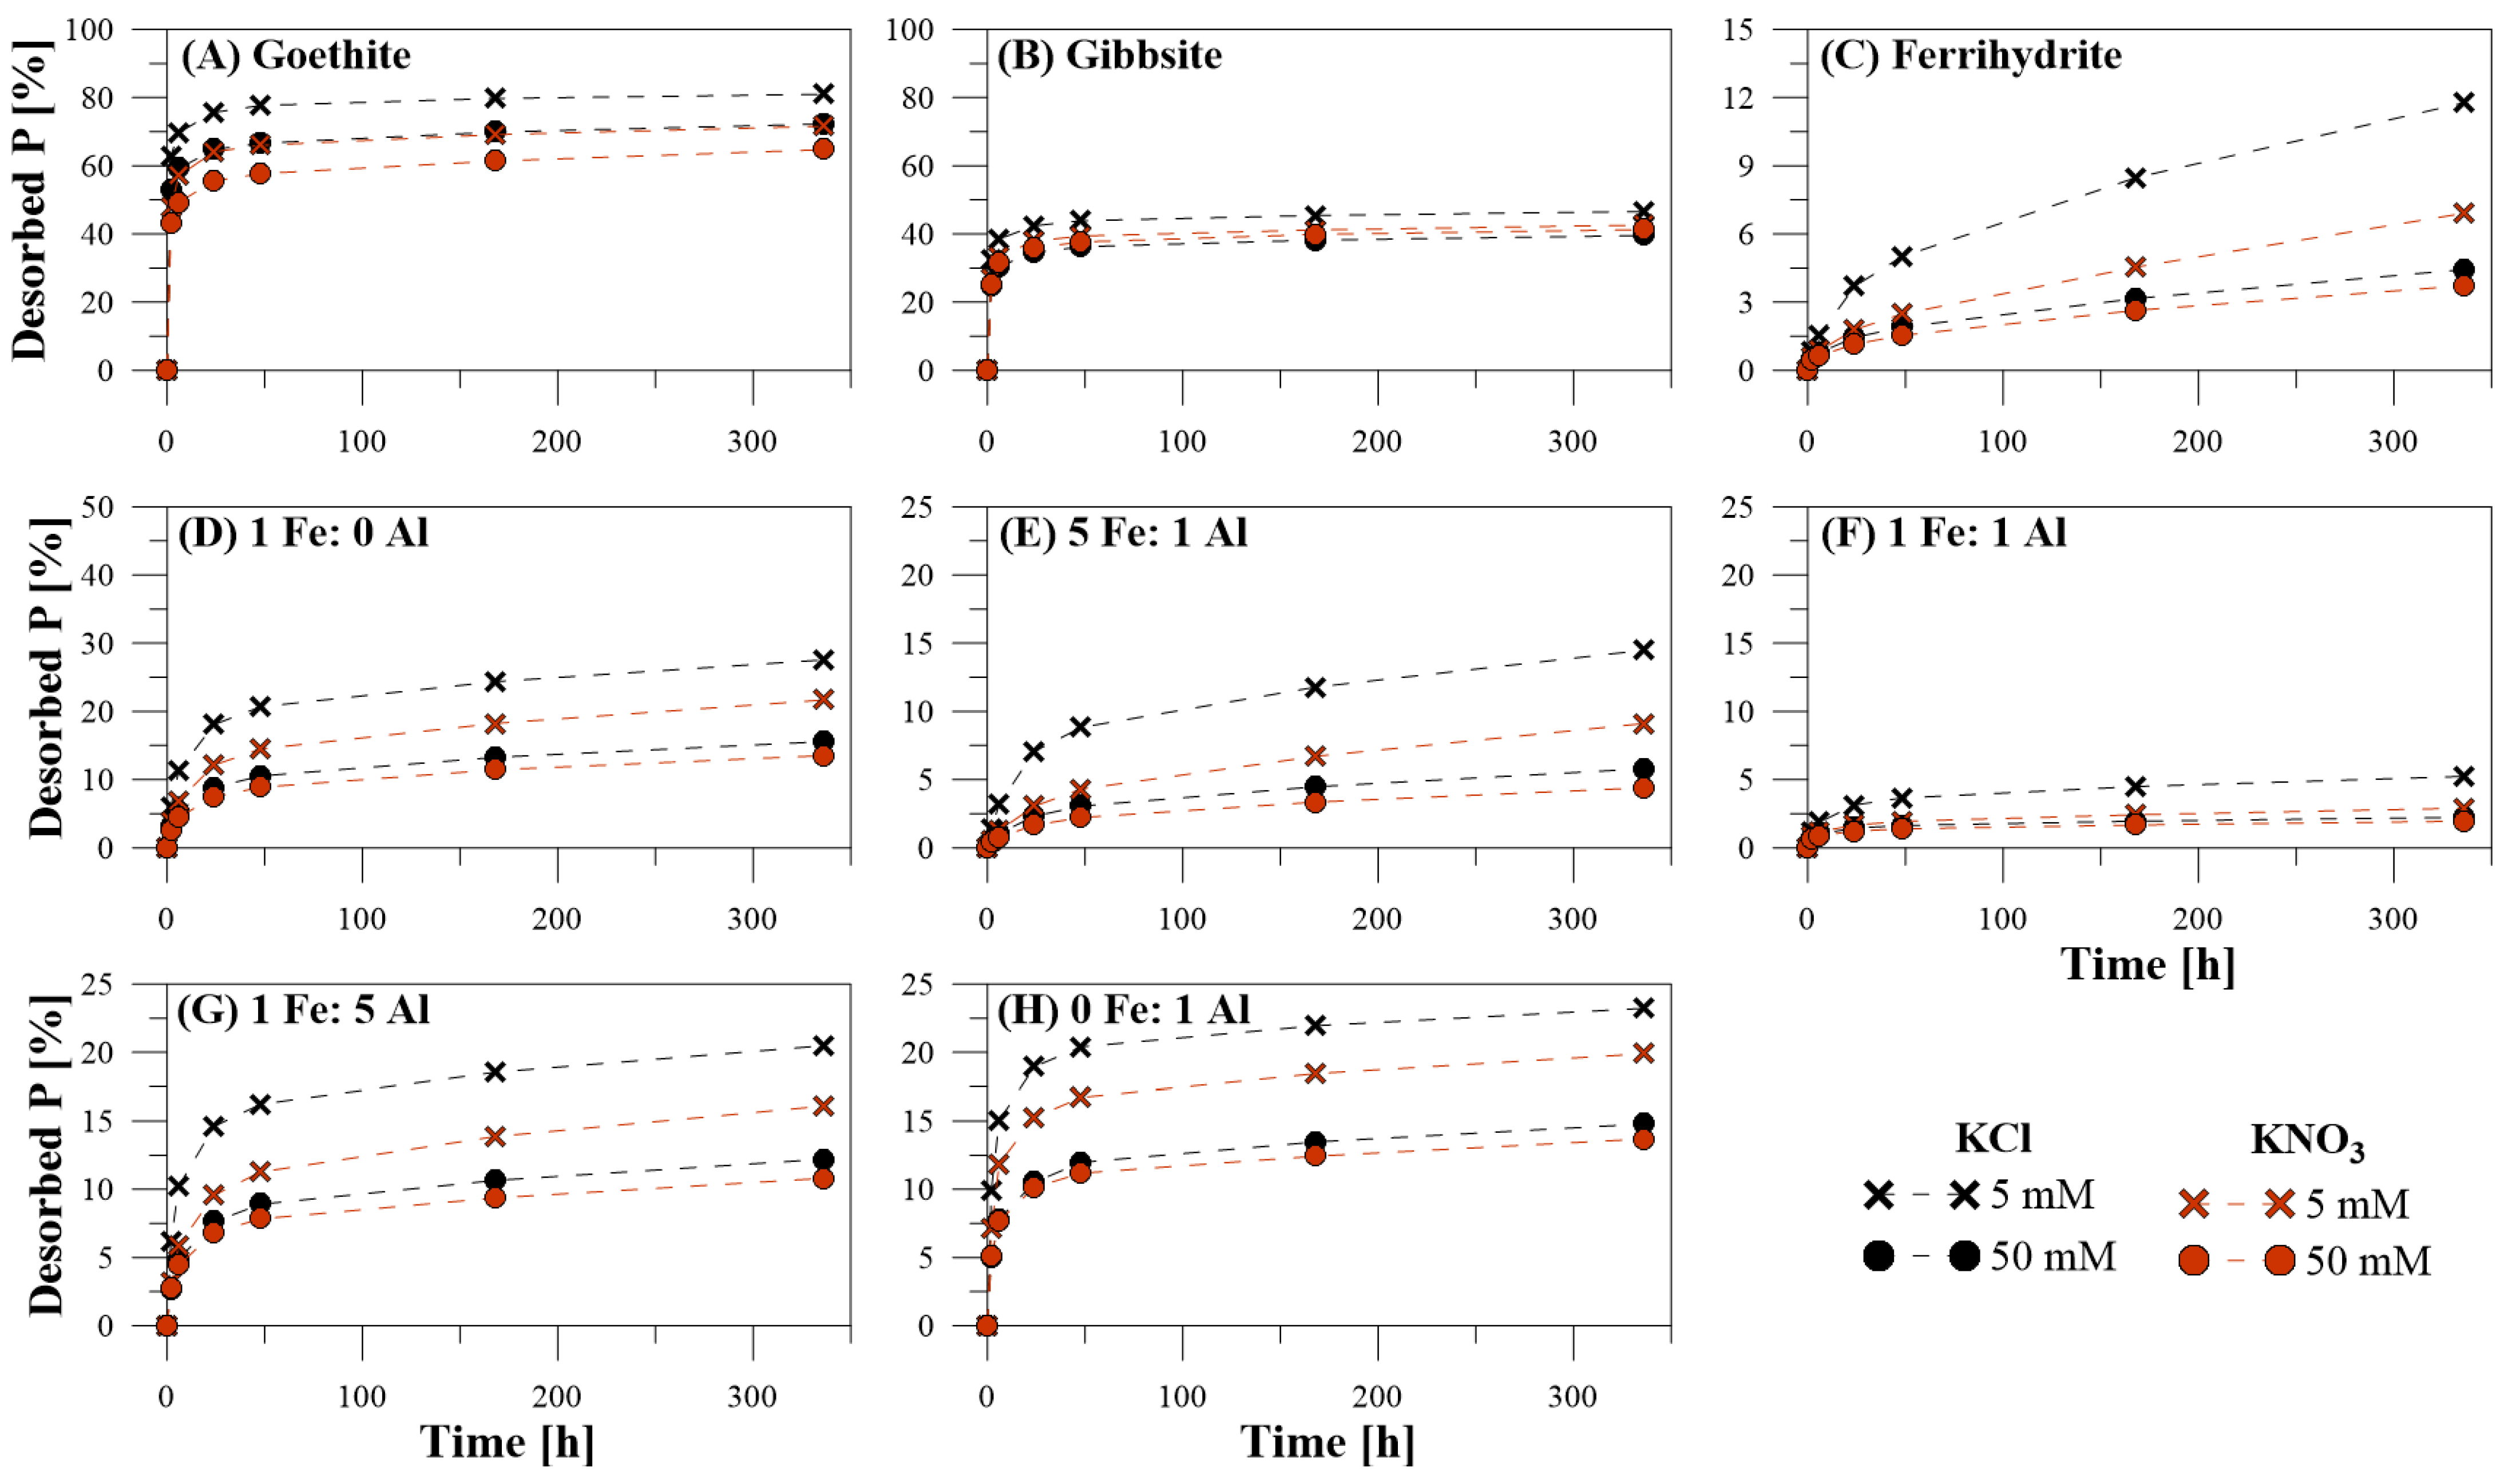
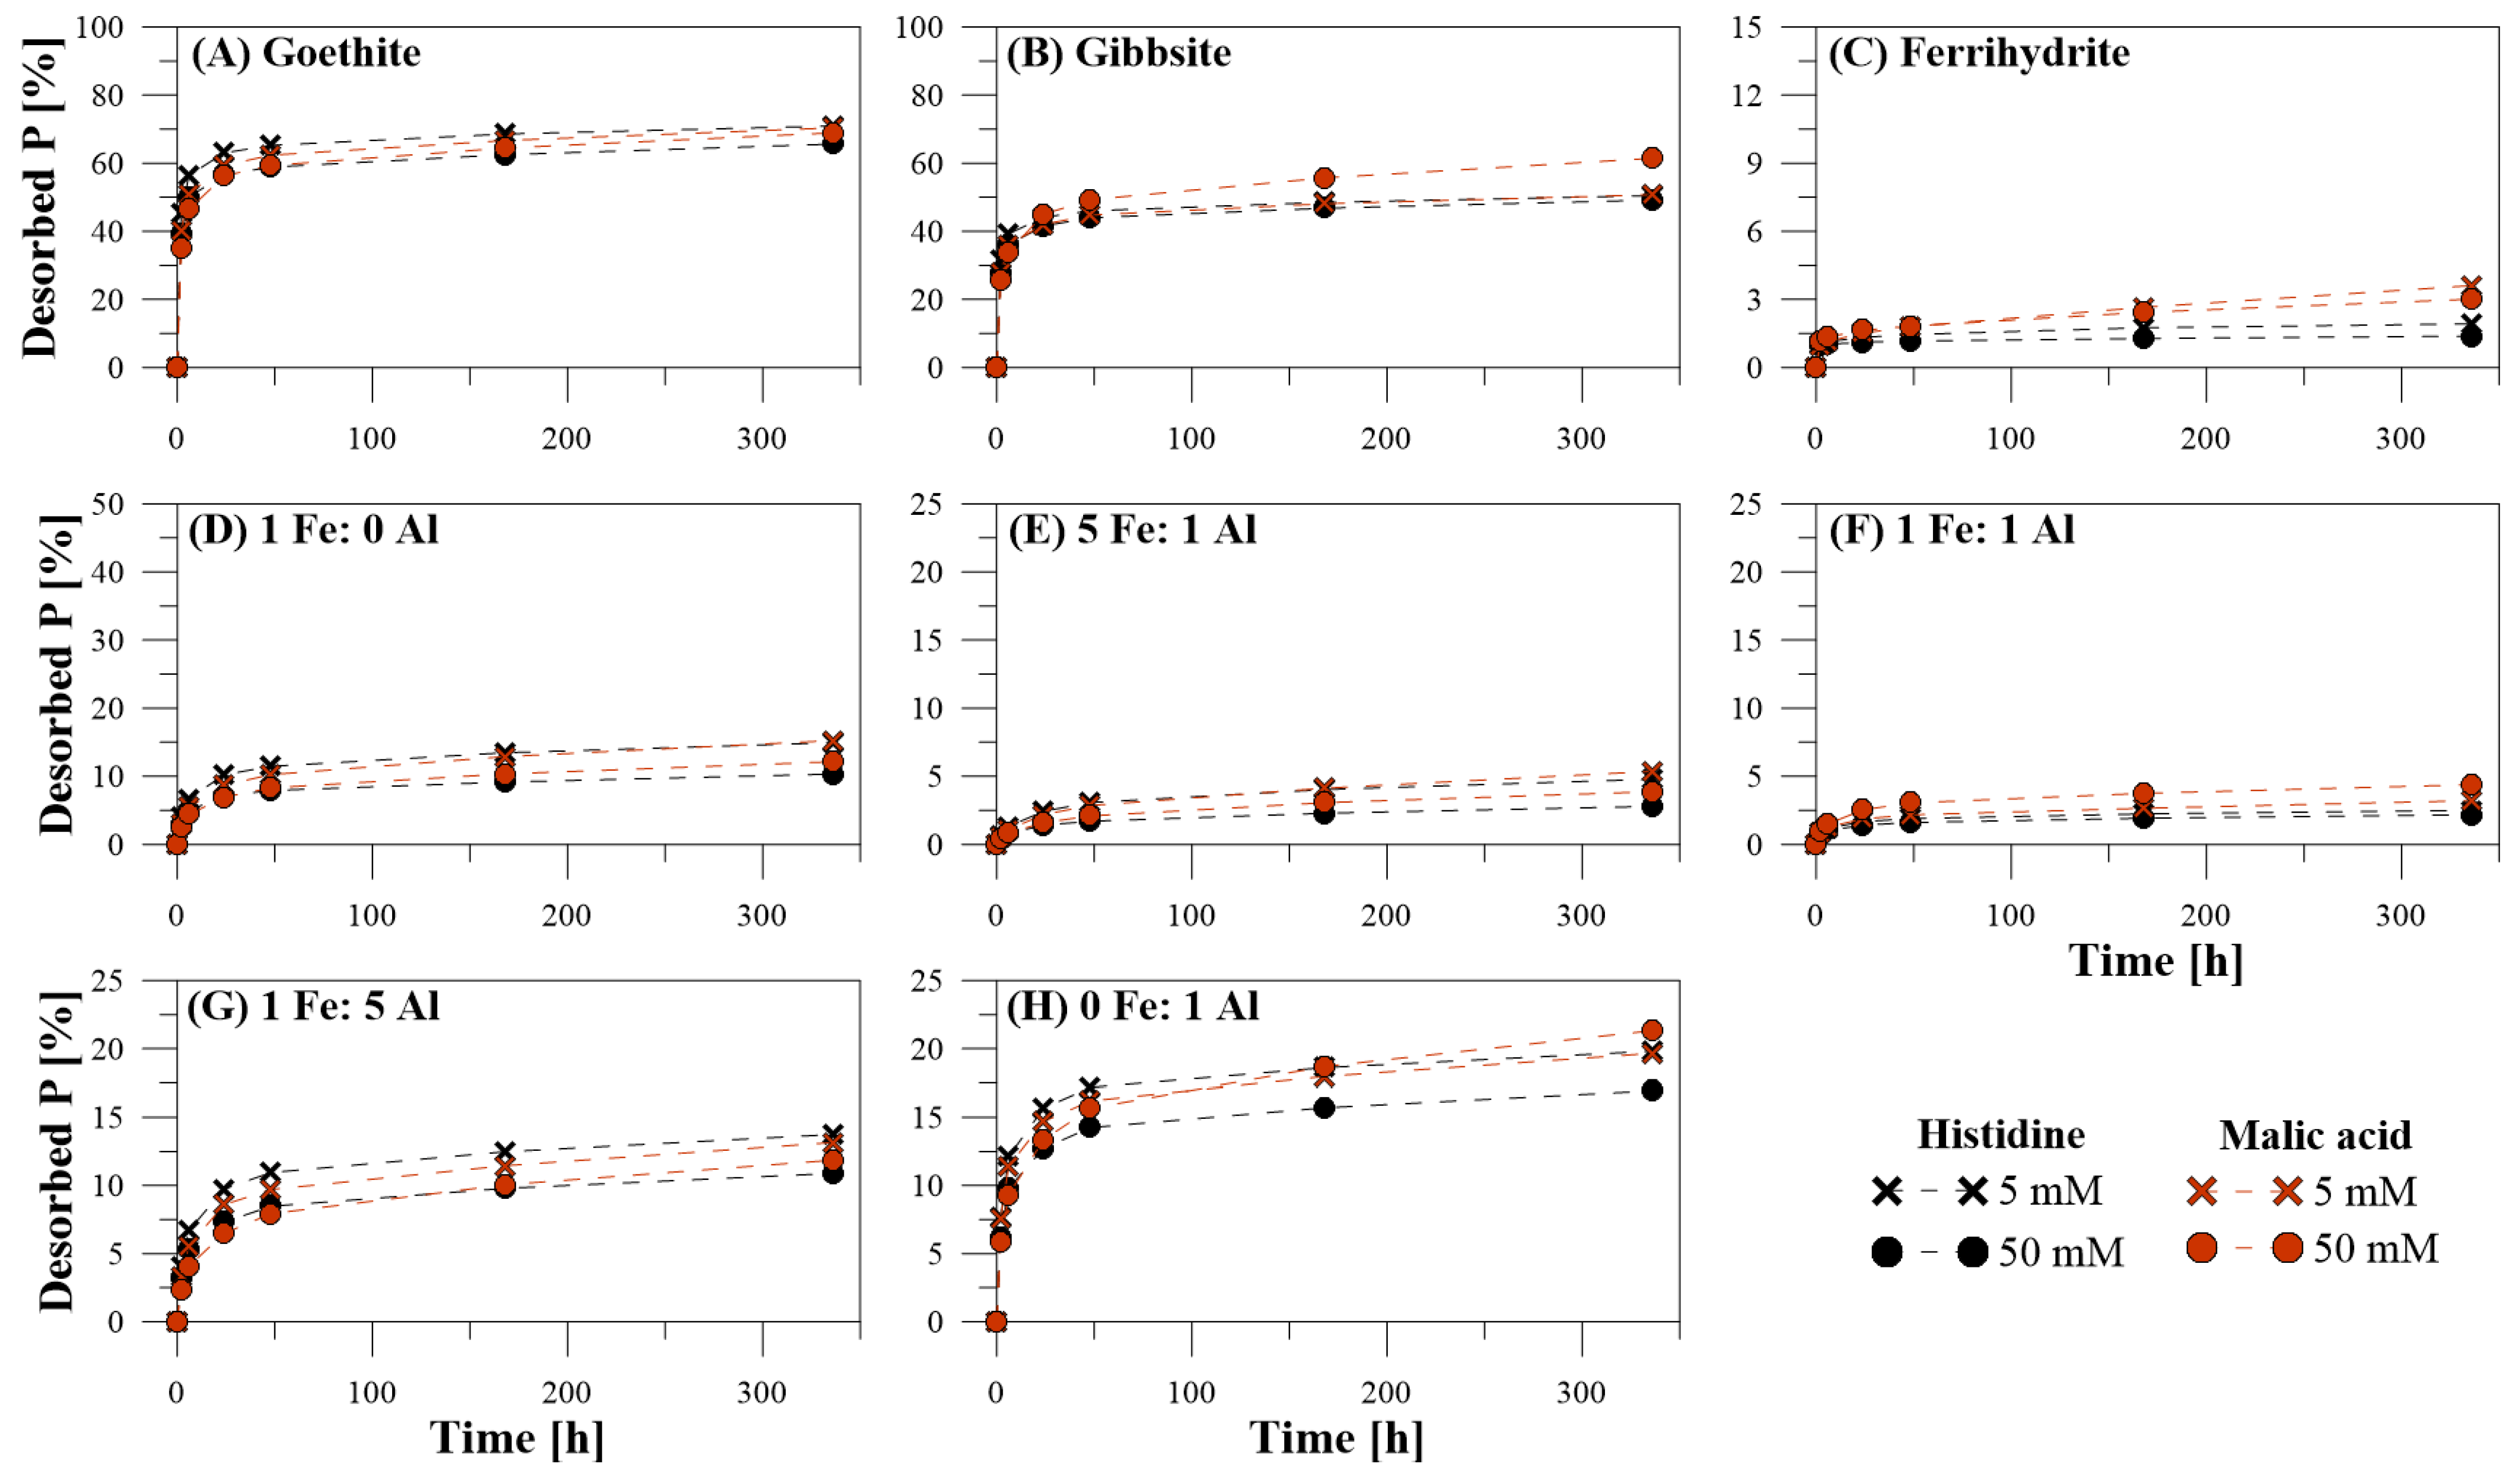
3.1. Efficiency of P Desorption

The efficiency of the desorption solutions showed in particular that the lower concentration of 5 mM led to a higher P release than the corresponding higher concentration of 50 mM for each reaction solution (Table 3). For the lower concentration of 50 mM, the efficiency of the desorption solutions ranked according to the following order: KCl > KNO3 > Mal > His. This order changed for the 50 mM concentration treatment to KCl > Mal > His > KNO3, where KCl also showed the highest P desorption efficiency.
For the concentration of 5 mM, goethite showed the highest P desorption in the range from 70.4 to 81.0%, followed by gibbsite with P desorption in the range from 50.7 to 42.6%. The poorly crystalline ferrihydrite had lower desorption values in the range from 11.8 to 1.9% compared to the crystalline goethite. Within the group of the amorphous Fe-Al-hydroxide mixtures, the pure hydroxides of Fe and Al had higher desorption with values in the range from 27.6 to 13.5% for 1 Fe: 0 Al, and from 23.2 to 19.7% for 0 Fe: 1 Al than the binary composites. P desorption was lowest at the balanced mixture ratio for 1 Fe: 1 Al in the range from 2.5 to 5.2%, and increased either with increasing Fe or Al amount. In total, more P was desorbed from the crystalline hydroxides than from the amorphous hydroxides.
If P desorption was related to the specific surface area, gibbsite had a higher desorption amount than goethite, because the specific surface area of goethite was substantially larger than that of gibbsite, which is why less P was ad- and desorbed from the goethite surface. Similar was observed for the hydroxide mixtures. While e.g., 1 Fe: 0 Al and 1 Fe: 5 Al had similar amounts of P desorption in%, especially for the organic treatment, the desorption amount related to the specific surface area was much lower for the pure amorphous Fe-hydroxide compared to the mixture due to the highly different surface area and hence, the amount of ad- and desorbed P per m².

3.2. Kinetics of P Desorption

The curves of the P desorption kinetics showed that the fast initial desorption step occurred during the first 48 h for all used reaction solutions (Figure 1 and Figure 2). While for goethite and gibbsite, after 48 h equilibrium was nearly reached using KCl and KNO3, desorption was still ongoing for ferrihydrite and the Fe-Al-hydroxide mixtures (Figure 1). Similar was observed for Mal and His, whereby it can be seen that P desorption from goethite and gibbsite continued using Mal (Figure 2).
The coefficients of determination for the applied kinetic models showed that desorption kinetics fitted best with the Elovich equation (mean R² = 0.93) (Table 4), followed by the exponential function (mean R² = 0.91) (Table 5), and the parabolic function (mean R² = 0.83) (Table 6). Only ferrihydrite had the best fit with the Parabolic equation (mean R² = 0.89), followed by the exponential function (mean R² = 0.87), and the Elovich equation (mean R² = 0.80). However, it is necessary to evaluate the results of the kinetic models as well as their calculated kinetic parameters (Table 4, Table 5 and Table 6) for each hydroxide separately. For goethite and gibbsite, the Elovich equation had the best fit, followed by the exponential function. In addition, the kinetic parameters obtained showed mainly a higher initial P release (α, a) and a lower P release over time (β, b). The Mal desorption treatments of goethite and the applied Elovich function showed a lower initial P release and a higher P release over time. However, noticeable were the α-values, which were overestimated compared to the actual desorption amounts. As already mentioned, for ferrihydrite the best fit was obtained by application of the exponential function. For ferrihydrite, the initial P release was lower than the release over time. By using the Elovich equation certainly, β was higher than α, where an overestimation of α for the His treatment was concluded as well. The amorphous Fe- and Al-hydroxide mixtures had the best fit with the Elovich equation, followed by the Exponential equation. For the pure amorphous Fe-hydroxide, the Fe-dominated mixtures, and the mixture with equal amounts of Fe and Al, the initial P release values α and a were lower than the release over time values β and b. The values for the mixture with predominant Al amount indicated a greater initial release of P.

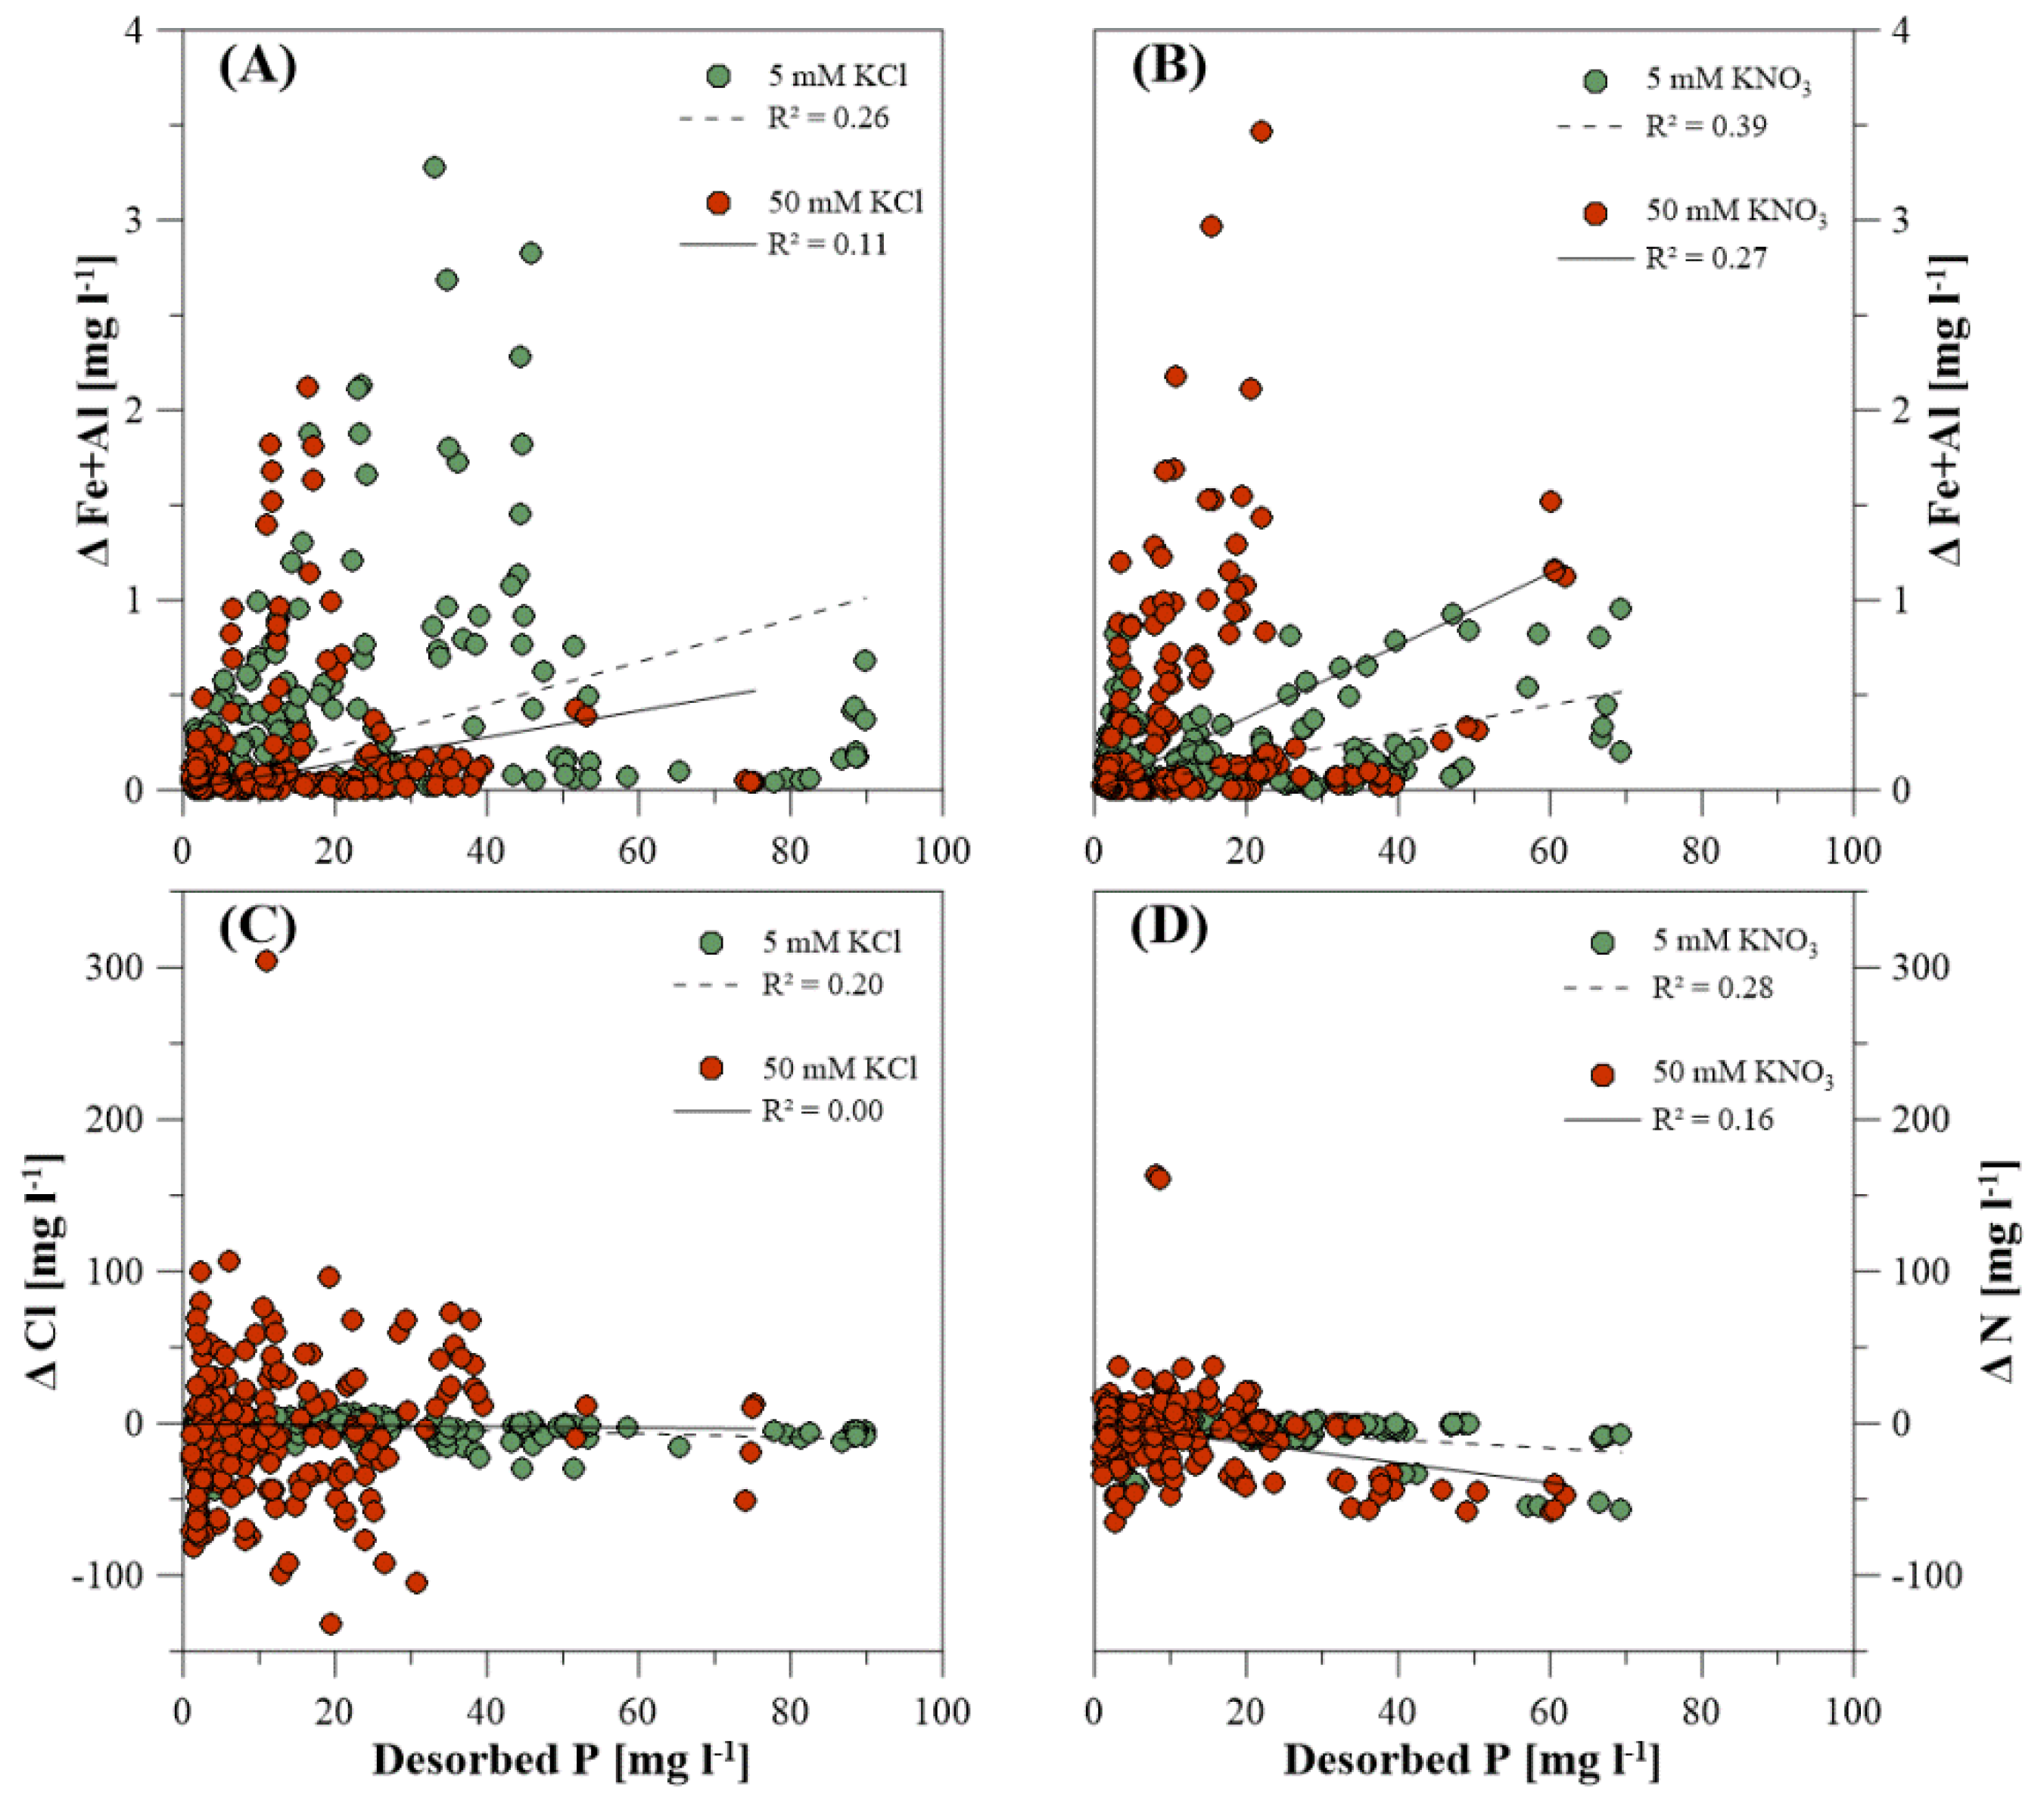
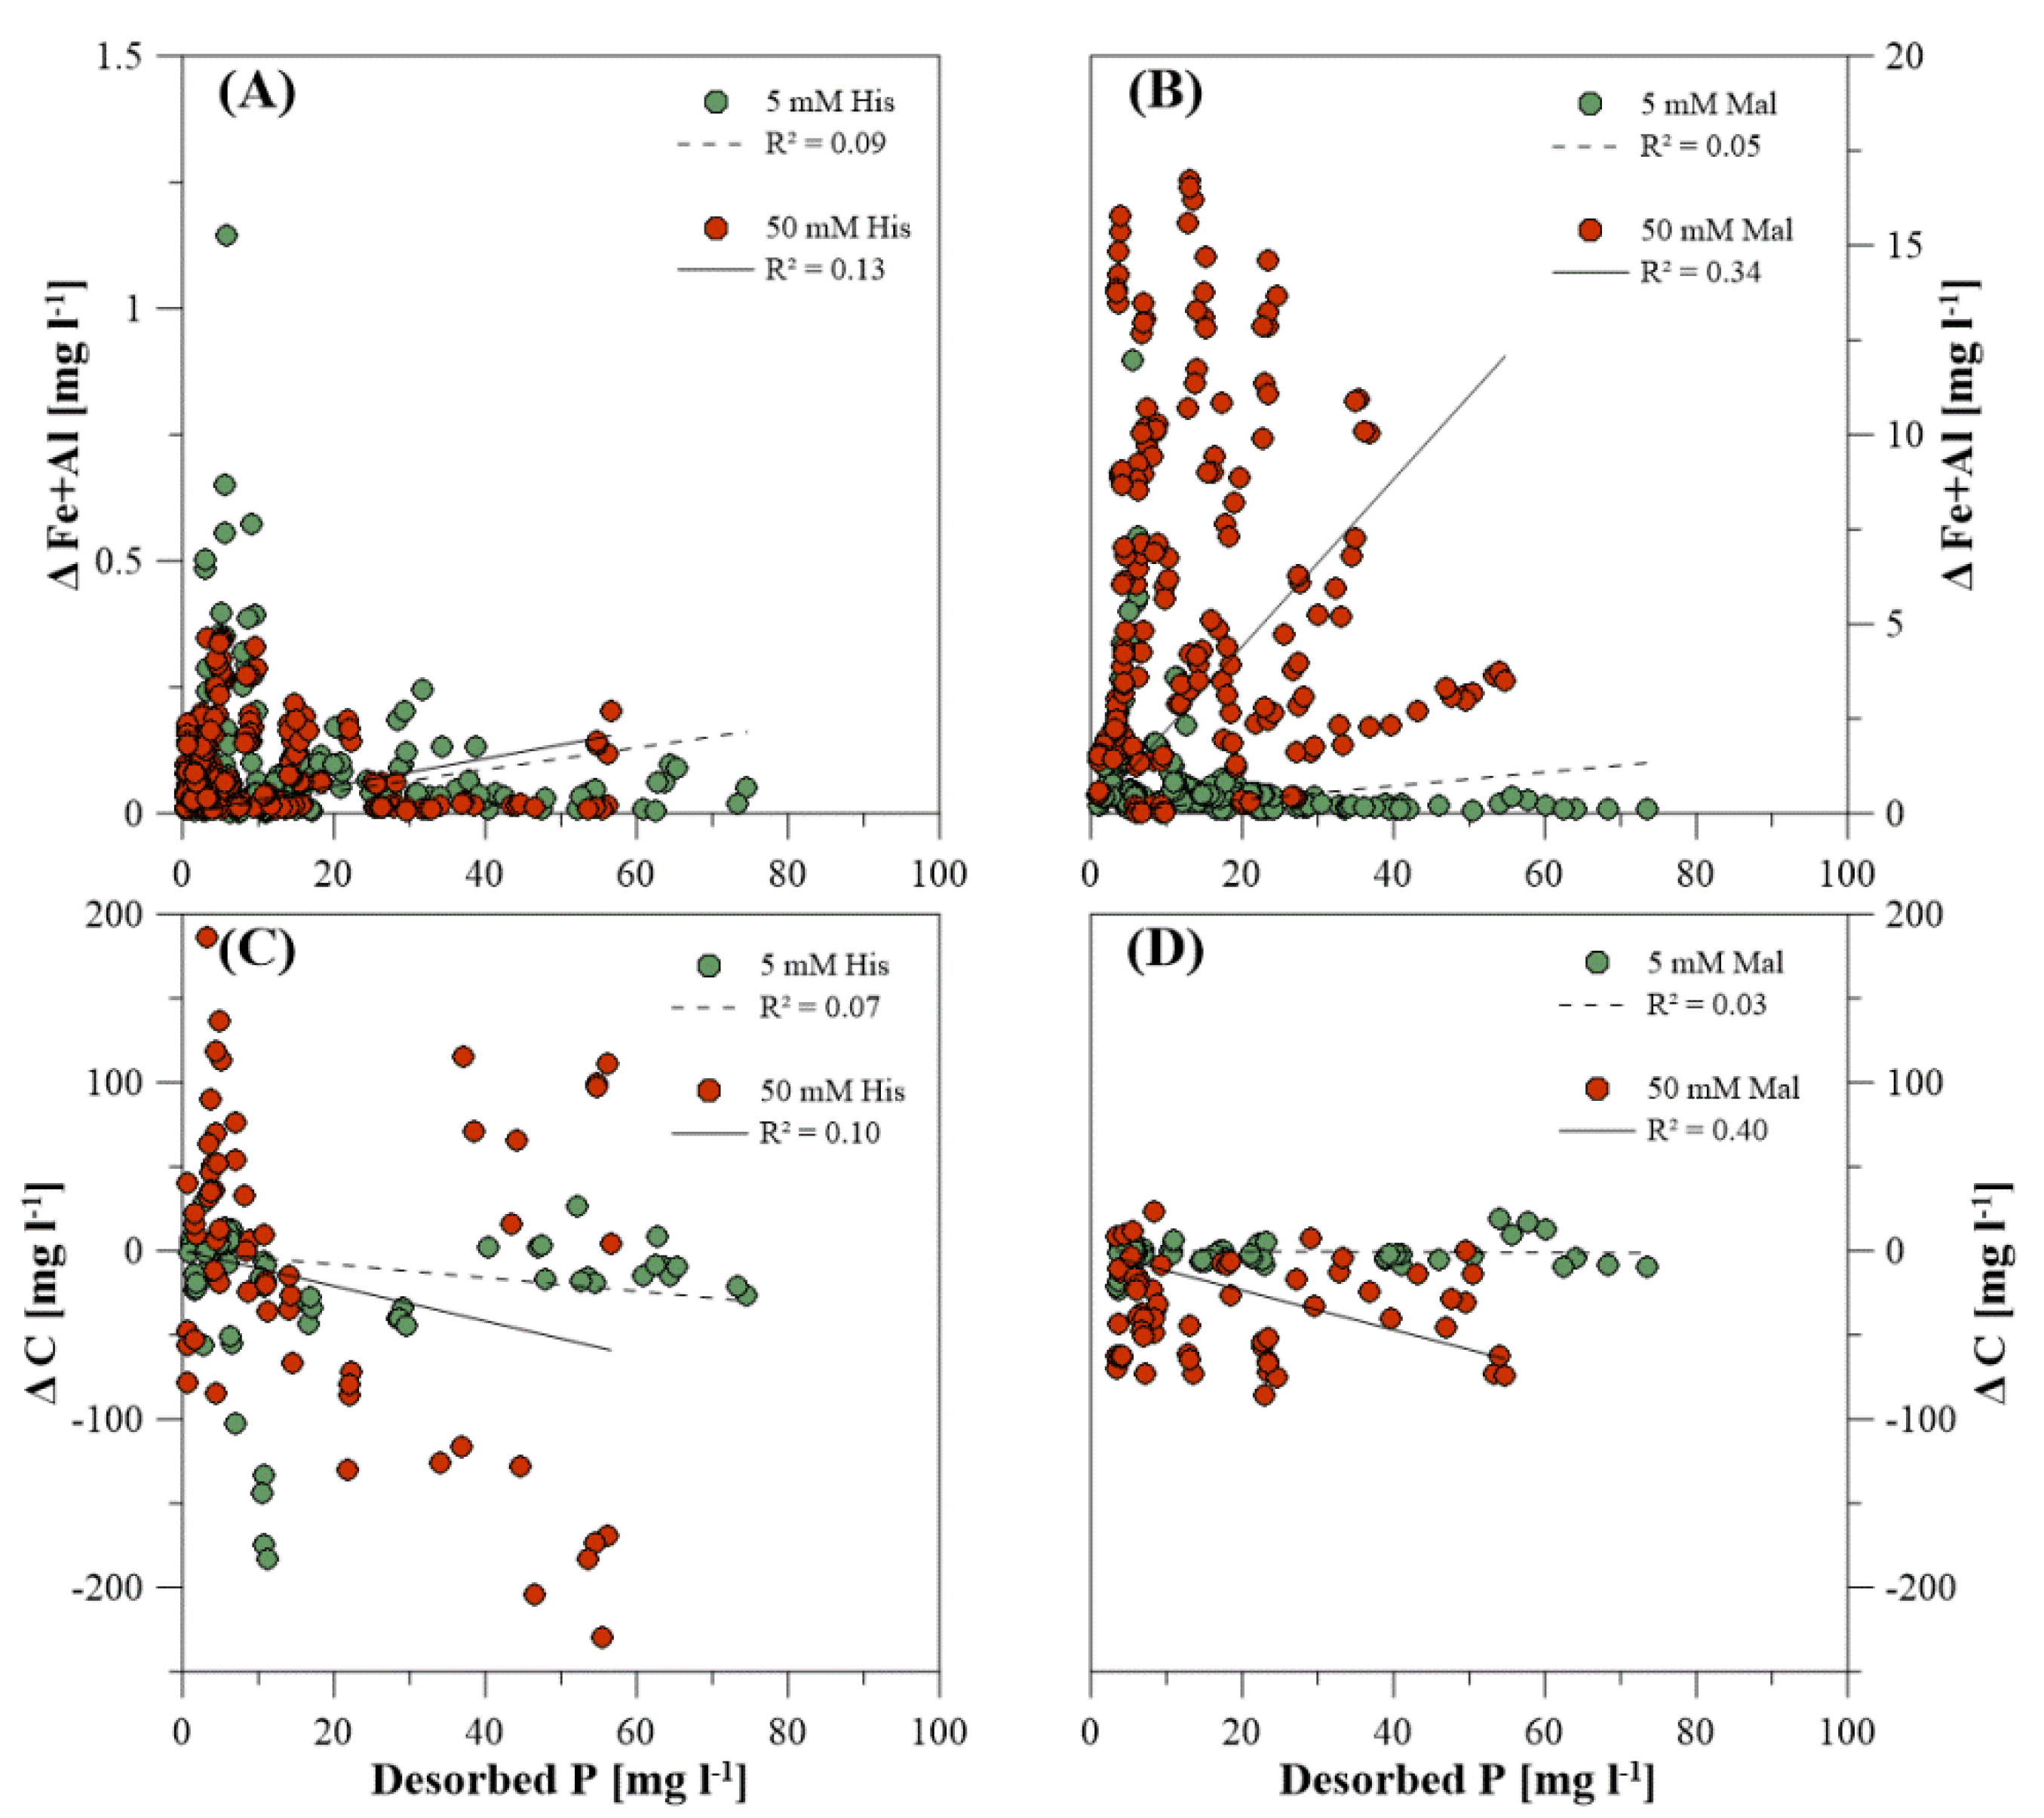
3.3. Dissolved Elemental Composition during P Desorption

With regard to possible release mechanisms of P from the investigated hydroxides, the concentrations of dissolved total Fe, Al, Cl, N, as well as C were measured in the reaction solution during and after desorption experiments. Since anion exchange is the dominating mechanism during P desorption, an increase of Cl and NO3 could be observable. The concentrations of total Cl and N showed despite some variation a decreasing trend. The correlation of the change of dissolved total Cl and N with the concentration of dissolved P in the sample solution showed no clear relationship (Figure 3C,D).
The concentration of dissolved total Fe and Al (separately Fe or Al for the sole hydroxides, sum of Fe and Al for the hydroxide-mixtures) showed enrichment in the sample solution during P desorption, however, the values had a high variation and no distinct correlation with the amount of desorbed P for the inorganic treatment (Figure 3A,B). While the KCl treatment with the lower 5 mM concentration had higher concentrations of dissolved total Fe and Al, the opposite was observed for KNO3. The same missing correlations of Fe, Al, and P were observed for the organic desorption treatments, whereas the concentration of dissolved Fe and Al increased in the sample solution as well. The Mal treatment showed higher concentrations of dissolved total Fe and Al than His (Figure 4A,B).
In addition, for desorption using organic constituents, total C was measured in the sample solution, and the difference from the initial total C concentration (240 mg L−1 for Mal and 3400 mg L−1 for His, respectively) to total C in the sample solution was calculated. Again, no clear relationship to the amount of desorbed P was observed, whereas the C concentration tended to decrease (Figure 4C,D).

3.4. Solution pH

The pH of the investigated hydroxides and the reaction solutions was adjusted to 6 prior to the experiments. After a 2 h desorption time, the pH of the sample solutions increased for nearly all treatments and hydroxides (Table 7). Only goethite, ferrihydrite, 5 Fe: 1 Al, and 1 Fe: 1 Al had a decreasing or constant pH during desorption using 50 mM KCl. The same was observed for goethite and ferrihydrite during desorption using 50 mM His. No correlation was detected for the change of solution pH and the amount of desorbed P (not shown).

4. Discussion

4.1. Influence of Crystallinity and Fe/Al Content on P Sorption

During the preparation of the desorption experiments, it was already shown that the different hydroxides had different reactive surface areas and hence, individual P adsorption capacities. It is well known that P adsorption on Fe- and Al-hydroxides occurs via inner-sphere complex formation [15,25,26,28,29,34], but also by surface precipitation [24,29,35,36], at which the crystallinity grade of the hydroxides played an important role. For goethite, several studies described the formation of either monodentate inner-sphere complexes [36,37] or bidentate complexes [23,38] with a minor fraction of monodentate complexes [23] in the intermediate pH range. Li and Stanforth (2000) [10] observed a more negative surface charge of goethite due to the replacement of surface OH groups by protonated and more acidic P anions, led to further decreasing P adsorption. For gibbsite, the formation of simultaneously existent monodentate and bidentate surface complexes with hydrogen-bonding to outer-sphere complexes was concluded [28,29]. In addition, the formed inner-sphere complex was described as a precursor for Al-P precipitation [28,29,35], decreasing with increasing pH due to the increased solubility of Al-phosphates at pH values around 6 [35].
Studies on poorly crystalline ferrihydrite divided the process of P adsorption into the formation of a monodentate [15,26] or bidentate inner-sphere complexes [22,25], the migration of P to surface sorption sites of decreasing accessibility within the particles [39], and with longer equilibration time also the formation of stable Fe-P precipitate [24,36]. For the amorphous Fe-hydroxide, the preferred formation of bidentate surface complexes as well as the formation of Fe-P precipitate with increasing P concentration and equilibration time was described, whereas for the amorphous Al-hydroxides prevalent monodentate inner-sphere complexes were reasoned. In the hydroxide mixtures, the Fe content is particularly contributed to a stable P fixation by precipitation reactions [24], whereby also P bindings via inner-sphere complexes were formed [40].
Summarized, the higher accessibility of both surface and structural binding sites of amorphous hydroxides led to a higher amount of adsorbed and precipitated P compared to well crystalline hydroxides, underlines the important role of amorphous Al and Fe fractions for the release of labile P in soils [41]. The more rigid, but poorly crystalline character allowed the migration of P into mineral particles, which also enabled a stable and effective P adsorption related to the specific surface area [24]. The decrease of initially P adsorption on the pure amorphous Al-hydroxide compared to the hydroxide mixtures with predominant Al content can, thus, also be attributed to a transitional phase with greater crystallization observed in the sample [24,34], which was already indicated by the XRD measurements in the present study. It is therefore possible that the release of adsorbed P from the inner mineral particle surface by means of anion exchange, in particular of more complex organic anions, is sterically inhibited by the initial crystallization.
As a consequence, the different binding motifs also have an impact on P mobilization. “Nonspecific” physisorption via electrostatic attraction provides lower binding energy and thus easy mobilization of P via ion exchange [5,6] while more “specific” chemisorption results in stronger binding at the particle surface and lower availability of P over time [7,8]. However, the most stable and long-lasting P fixation occurs via precipitation on the particle surface [9,10]. The preferred formation of Fe-P precipitates during adsorption on ferrihydrite and the amorphous hydroxides with predominant Fe amount led to a more stable P binding, and hence, lower desorption capacities than the crystalline hydroxides. With increasing Al content, the influence of the surface complexes also increased, which is why the desorption capacity increased, in this study independently from the type of extracting agent.

4.2. Effect of PZC and Electrolytes on P Adsorption

In addition to crystallinity or Fe/Al ratio, surface properties of the hydroxides also play a major role regarding exchange reactions. Besides the specific reactive surface area, a varying PZC influences sorption processes. The reported PZC from literature for goethite varies from 6.4 to 9.7 [10,42,43], are in the range from 7.5 to 11.3 for gibbsite [44,45,46,47], and between 7.6 and 8.0 for ferrihydrite [46,48]. Sujana et al. (2009) [33] reported PZC values of the amorphous Fe- and Al-hydroxide mixtures in a range from 4.8 to 6.1, increasing with an increasing amount of Al. In the present study, the measured PZC values of the amorphous Fe- and Al-hydroxides were significantly higher and in a range from 6.0 to 9.8, also increasing with increasing Al-amount. As the experimental pH was set to a value of 6, the positive net charge and thus a positive electric potential below the PZC values led to a charge surplus, and hence, stronger adsorption of anions. If the pH of the surrounding solution will be increased, the positive potential decreases and becomes negative at pH values above the PZC, constraining further specific adsorption.
But simultaneously with P adsorption, also sorption of protons (H+) takes place [49]. Along with the P adsorption process, a higher surface charge was produced by diffusion of protons from and to the hydroxide surface [43,50]. Similar was observed for background electrolyte solutions such as NaCl, NaNO3, or KNO3. The presence and concentration of electrolytes in the reaction solution can lead to a decrease of the positive electric potential and hence, a weaker P adsorption at low pH (<4) [42,51]. Certainly, the adsorption of electrolytes or P will be mutually affected. Higher adsorption of cations can be supported by a higher surface coverage of the hydroxide with negatively charged P [51]. Although the PZC changes during P adsorption, the amount of bound P can be affected, depending on the surrounding pH. In combination with the different binding motifs, depending on the crystallinity and the Fe-amount of the hydroxides, the later release of P can be influenced.

4.3. Desorption Kinetics

Similar to the observations for P adsorption kinetics, desorption showed a biphasic behavior with a first rapid and a second slower stage, which was described in previous studies for Fe- and Al-hydroxides by applying organic and inorganic reagents [11,26,52]. A great P release within the first 24 h of desorption time was observed for all investigated hydroxides, independent of their degree of crystallization or the Fe/Al ratio. However, compared to the crystalline hydroxides, ferrihydrite, and the amorphous Fe- and Al-hydroxide mixtures showed in general lower release rates and a continuous P mobilization. This was shown in both the P desorption kinetic curves and the calculated kinetic parameters. This typical time-dependent trend can be attributed to the different P binding mechanisms of the crystalline and amorphous hydroxides [11,24,53] and therefore, an easier release of P from weaker outer-sphere bindings [54] and nonspecific adsorbed P from low-affinity sites, followed by a slower release of specific adsorbed P from high-affinity sites as well as diffusion of structural bound P [55]. Thus, during the adsorption process, related to the specific surface, comparatively more P was bound to goethite or gibbsite than to ferrihydrite, but this P can be released again in the short-term. Meanwhile, the binding to amorphous hydroxides mainly contributes to a long-term release and a distinct ongoing mobilization over time. The better fit of the Elovich equation suggested that P was desorbed by chemisorption reactions, which was corroborated by previous studies using soil [53,56,57]. For ferrihydrite, in particular, the better applicability of the exponential function suggested that P mobilization is slow at first and stronger with time. This would be in good agreement with an inner-particulate P binding, which precedes the actual desorption with a diffusion phase and the migration of inner-particle bound P.
But independently of the desorption reactions, the high calculated values of both α (goethite and gibbsite) and β (ferrihydrite and amorphous hydroxide mixtures with predominant Fe) do not seem realistic compared to the measured values. For example, a cumulative P desorption of 3.44 ± 0.22 mg g−1 after 336 h desorption time was measured for ferrihydrite. This equals 0.01 ± 0.00 mg m−2, while the calculated P release constant over time β for the KCl treatment in the Elovich model amounted 392.88 mg min−1 m−2. Since an empirical model like the Elovich equation describes processes in an ideal system, an interpretation of the values can be difficult or misleading. An application to less ideal or even natural systems such as soils can therefore be problematic [58]. An increase or decrease of the fit parameters can display a change of reaction rates, whereas the slope of the function depends more on the reaction conditions than on their characterization. Therefore, it is possible to overestimate the initial or mid-term release due to either sharp or weak curvature of the P desorption kinetics [58].

4.4. Inorganic Extracting Agents

A further aspect of P release is the mechanism of action and, thus, the efficiency of both organic and inorganic extraction agents. Concerning inorganic anions, ion exchange reactions are the main mechanisms during nutrient mobilization in general and P desorption in particular [1,59]. While hydrated monovalent ions such as K+, Cl, or NO3 usually form weak non-spherical complexes on oppositely charged surfaces, P can be attached via ligand exchange to the hydroxide surfaces [6]. However, the anion exchange of adsorbed P by Cl and NO3 had still a clear effect on the crystalline hydroxides goethite and gibbsite (from 40 to 81% desorption capacity), but its effectiveness was lower for ferrihydrite and the amorphous Fe- and Al-hydroxides.
The successively decreasing desorption and the incomplete release of P, which varies depending on the hydroxide, can be explained, among other factors, by the change of anion exchange sites as a result of P adsorption, which was partly irreversible with respect to adsorption of NO3 and Cl [34]. During P desorption using KCl and KNO3, the concentration of total Cl and N decreased with increasing P release, whereby the effect was more pronounced for KNO3. This gives an indication of anion exchange reactions, where the anion concentration can vary greatly depending on the extracting agent and investigated hydroxide. However, in the absence of a clear trend of the anion concentration change in the reaction solution, mainly equilibrium reactions between the solid hydroxide surface and the reaction solution took place.

4.5. Organic Extracting Agents

If both P and organic anions were present, the adsorption of P can already be affected by the competition for adsorption sites, dissolution of adsorbents, change of the adsorbents surface charge, the formation of new adsorption sites by formation of metal-organic complexes through adsorption of metal ions (e.g., Al3+, Fe3+), as well as the retardation of crystal growth of poorly crystalline Fe- and Al-oxides and hydroxides [14,15,16,60,61]. If P was already adsorbed and hence, fixed, the further release can be controlled by the dissolution of low soluble minerals, ligand exchange and the replacement P by organic anions, as well as the formation of metal-organic complexes and thus the blocking of adsorption sites [12,17,62,63,64].
The measurement of total C showed no clear trend supporting concentration changes of organic anions during desorption using His and Mal, even though a stronger decrease was correlated for the 50 mM treatments. It can also be assumed that, in addition to anion exchange, equilibrium reactions took place. If the changes of the Fe and Al concentrations in the reaction solution were considered, in particular, more Fe and Al dissolved from the amorphous hydroxides with increasing desorption. Due to the higher Fe and Al concentrations at the beginning of desorption as well as the low release from the crystalline hydroxides, dissolution of the hydroxides by organic reactants, in particular, was assumed to be improbable. Moreover, the use of the organic reagents His and Mal showed a distinctive higher release from crystalline than from amorphous hydroxides. Certainly, the amount of released P was similar between organic and inorganic extracting agents, and, therefore, a clear beneficial influence of the organic compounds was not detected.
Basak (2019) [13] reported an average amount of P released from rock phosphates by organic acids in the range from 0.015 to 83.5% after 6 d reaction time, increasing with an increasing concentration of the acids. The effectiveness of the used acids followed the order: oxalic acid > citric acid > tartaric acid > formic acid > malic acid > succinic acid > acetic acid. However, Basak (2019) [13] also described a decreasing P release for the increase of the organic acid concentration from 0.3 to 0.5 M. Xu et al. (2004) [65] demonstrated that citric acid has the highest capacity to solubilize P from rock and iron phosphates after 24 h reaction time and that an increase in the concentration of organic acids enhanced significantly P solubilization (except oxalic acid). For P release from Fe phosphates, the effectiveness of the organic acids followed the order: citric acid > oxalic acid > malonic acid > tartaric acid > malic acid > acetic acid (not complete). Especially for citric acid, the amount of released P increased from 13.7 to 67.0 mg g−1 with an increasing acid concentration from 0.001 to 0.01 M. Wang et al. (2015) [53] studied P release from acidic, neutral, and calcareous soils using low molecular weight organic acids. They reported a high efficiency of oxalic acid (0.6 to 3.2 mg kg−1); followed by citric acid (0.6 to 2.8 mg kg−1) on cumulative released organic P, regardless form the soil type. Concerning inorganic P fractions, oxalic acid was more effective on calcareous soils, while citric acid had the highest amounts of P release from neutral and acidic soils.
While the enhanced release of inorganic P was likely due to accelerating desorption and dissolution processes, the acid strength contributed to the release of organic P. Gypser et al. (2019) [11] showed a clear lower effect of inorganic constituents than organic acids on P release from Fe- and Al-hydroxides using a concentration of 0.01 M at pH 6 over 1344 h reaction time. While P desorption using CaCl2 and CaSO4 amounted between 0.0 and 57.4%, humic acid showed a desorption capacity in the range from 0.3 to 87.2%. Citric acid had the highest P release in the range from 6.7 to 90.5%. Moreover, desorption increased with increasing crystallinity grade and Al content of the hydroxides. However, the reaction time is a crucial factor in P release, also with respect to P that was strongly bound on amorphous hydroxides. Thus, desorption reactions were still detected after an experimental reaction time of 8 weeks [11]. Taghipour and Jalali (2013) [66] also reported a lower efficiency of malic acid in comparison to citric and oxalic acid for calcareous soils. In particular, the chemical structure, type, and location of the functional groups of the ligands of organic acids influence the efficiency of P mobilization, where di- and tri-carboxylic acids were more effective during mobilization than mono-carboxylic acids [63]. In terms of carboxylation, the P release capacity of Mal (di-carboxylic) is expected to be higher than that of His (mono-carboxylic). In the present study, the release capacities of both compounds were equal for most hydroxides or only slightly higher for Mal. Therefore, the effect related to the number of carboxylic groups may have been relativized by at least one other mechanism.
Although the above-mentioned previous studies have shown that organic compounds support P release, this effect could not be observed in comparison with the inorganic compounds. One possible reason can be organic molecules acting as P adsorbing surfaces in some circumstances [67], and form loosely surface-bound complexes with already released P. Especially His has its isoelectric point in a neutral pH range (7.47 [68]) and can act both as a proton donor as well as an acceptor. In addition, it has a simple aromatic ring and is therefore considered more stable than Mal [69]. This is relevant, considering that P could be adsorbed on His and thus remained in soils, but can be released over a longer time. Another reason, which is essentially also related to the complex structure of organic molecules, is the formation of a “physical barrier” on the mineral surface and hence, limiting P desorption [65,70].
As mentioned above, several processes can be considered for the release of initially adsorbed P by organic constituents. These mechanisms can take place separately or in combination. A mechanism that can take place both when P is adsorbed and when P and organic anions occur simultaneously in the solution, is the dissolution of the adsorbent, which is responsible for a very effective P release. In particular, the dissolution reveals a clear relationship between released P and major components of the adsorbent [71]. In the present study, the dissolved concentrations of Fe and Al in comparison to the initial Fe and Al contents of the hydroxides (see Table 2) were too low to indicate the dissolution of the hydroxides during P release. Furthermore, CTotal fluctuated around the initial concentration of CTotal during the experiments with 5 mM His and Mal, while CTotal decreased using 50 mM His and Mal. The concentrations of Fe and Al slightly increased at the beginning of P desorption and fluctuated around zero during ongoing P mobilization, which rather indicated an equilibrium reaction between solid and liquid phase than the formation of metal-organic complexes in the reaction solution. Thus, ligand exchange and the replacement of P by organic anions were concluded to be the predominant mechanisms of P release by His and Mal. At the same time, the sorption of anions can induce adsorption of H+ and thus, explain the increasing pH in the reaction solution.
Initially, it was expected that a higher concentration of the respective reactant would also increase P release. In the present study, the opposite was observed. A possible explanation could be an increasing P co-adsorption of already desorbed P, and the formation of outer-sphere complexes by electrostatic interaction. Due to the addition of negative charge by adsorption of organic anions, the electrostatic repulsive force decreased and induced H+ adsorption as mentioned above. This more positive surface charge influenced the sorption behavior of P on the mineral surface. The similar was observed for Ca2+ [42,72], and Na+ [30] as background electrolytes. Duputel et al. (2013) [73] reported a decrease of available P for citrate concentrations below 20 µM due to large adsorption of citrate, enhancing Ca2+ adsorption and facilitate P binding through Ca-bridging. Hence, it can be assumed that a purely additive effect is invalid or limited to a small range [34].

5. Conclusions

The Fe- and Al-hydroxides showed different capacities to retain inorganic P, depending on the crystallinity of the hydroxides and, thus, the specific P binding motifs, govern the extent and strength of desorption.
The poorly crystalline and amorphous hydroxides especially contribute to a stable fixation of P. In addition, the proportion of Fe and Al plays a considerable role. Precipitation of poorly soluble Fe-phosphates inhibits or prevents effective short- to medium-term P mobilization from amorphous Fe-hydroxides. Al-hydroxides adsorb more P related to the specific reactive surface area than Fe-hydroxides, but they also show a substantially greater P release over time. Certainly, the release of adsorbed P from the inner mineral particle surface through complex organic anions can be sterically inhibited by an initial crystallization process.
In the present study, desorption using His and Mal might not be expected to substantially influence P desorption compared to selected inorganic constituents of the soil solution. An increase in concentration tends to have a detrimental effect on P release as well. It was suggested that organic molecules act as P adsorbing surfaces, which is relevant, considering that P could be adsorbed on His, but can be released over a longer time. Another reason, which is essentially also related to the complex structure of organic molecules, is the formation of a “physical barrier” on the mineral surface and, hence, limiting P desorption.
The assumption that the majority of P fertilization is stably bound to components of the soil and thus permanently unavailable to plants can therefore not be supported. The implication of these results for a sustainable P management in agricultural soils is that the consideration of the reactions of the P ions with soil particles should be included in balancing of potential plant-available P. There will be a transfer of inorganic P from very low/low available P pools (amorphous hydroxides) and low/readily available P pools (crystalline Fe-hydroxides, Al-hydroxides), but with time as one decisive factor. Therefore, a combination of extraction methods should be chosen for a comprehensive characterization of the current soil P status, and a prediction of the potential recovery of P reserves. Thus, at least the questions of the right rate and time of fertilizer application can be taken into account to supply plants with previously unused P reserves, and to reduce fertilizer or to use them more efficiently.
However, P adsorption and desorption will vary greatly in natural systems compared to purely artificial systems, as various physico–chemical properties significantly limit the assumption of pure additive effects. For an accurate calculation, a transfer from the lab to the field and the consideration of further factors, such as soil organic matter, pH, or crop type is necessary. The purpose should be the establishment of advanced methods and protocols to evaluate these implications and to link soil research with agronomic implementations.

Author Contributions

Conceptualization, E.S., S.G. and D.F.; methodology, E.S., S.G. and D.F.; investigation, E.S. and S.G.; characterization and chemical analysis, batch experiments, E.S. and S.G.; batch experiments, E.S.; kinetic modeling, S.G.; validation, S.G.; resources, S.G. and D.F.; writing—original draft preparation, S.G.; writing—review and editing, S.G. and D.F.; visualization, S.G.; supervision, D.F.; project administration, D.F.; funding acquisition, D.F. and S.G. All authors have read and agreed to the published version of the manuscript.

Funding

This research was funded by the German Federal Ministry of Education and Research (BMBF) in the BonaRes project InnoSoilPhos (No. 031B509C).

Institutional Review Board Statement

Not applicable.

Informed Consent Statement

Not applicable.

Conflicts of Interest

The authors declare no conflict of interest. The funders had no role in the design of the study; in the collection, analyses, or interpretation of data; in the writing of the manuscript, or in the decision to publish the results.

References

  1. Kruse, J.; Abraham, M.; Amelung, W.; Baum, C.; Bol, R.; Kühn, O.; Lewandowski, H.; Niederberger, J.; Oelmann, Y.; Rüger, C.; et al. Innovative methods in soil phosphorus research: A review. J. Plant Nutr. Soil Sci. 2015, 178, 43–88. [Google Scholar] [CrossRef] [PubMed] [Green Version]
  2. Celi, L.; Prati, M.; Magnacca, G.; Santoro, V.; Martin, M. Role of crystalline iron oxides on stabilization of inositol phosphates in soil. Geoderma 2020, 374, 114442. [Google Scholar] [CrossRef]
  3. Jiang, X.; Bol, R.; Willbold, S.; Vereecken, H.; Klumpp, E. Speciation and distribution of P associated with Fe and Al oxides in aggregate-sized fraction of an arable soil. Biogeosciences 2015, 12, 6443–6452. [Google Scholar] [CrossRef] [Green Version]
  4. Weihrauch, C. Phosphor-Dynamiken in Böden. Grundlagen, Konzepte und Untersuchungen zur räumlichen Verteilung des Nährstoffs; Springer Spektrum: Wiesbaden, Germany, 2018. [Google Scholar]
  5. Weng, Y.; Vekeman, J.; Zhang, H.; Chou, L.; Elskens, M.; Tielens, F. Unravelling phosphate adsorption on hydrous ferric oxide surfaces at the molecular level. Chemosphere 2020, 261, 127776. [Google Scholar] [CrossRef] [PubMed]
  6. Blume, H.-P.; Brümmer, G.W.; Horn, R.; Kandeler, E.; Kögel-Knabner, I.; Kretzschmar, R.; Stahr, K.; Wilke, B.-M. Scheffer/Schachtschabel Lehrbuch der Bodenkunde, 16th ed.; Springer Spektrum: Berlin/Heidelberg, Germany, 2016. [Google Scholar]
  7. Mnthambala, F.; Maida, J.; Lowole, M.W.; Kabambe, V.H. Phosphorus sorption and external phosphorus requirements of ultisols and oxisols in Malawi. J. Soil Sci. Environ. Manag. 2015, 6, 35–41. [Google Scholar]
  8. Reddy, K.R.; DeLaune, R.D. Biogeochemistry of Wetlands: Science and Applications; CRC Press Taylor & Francis Group: Boca Raton, FL, USA; London, UK; New York, NY, USA, 2008. [Google Scholar]
  9. Lang, F.; Bauhus, J.; Frossard, E.; George, E.; Kaiser, K.; Kaupenjohann, M.; Krüger, J.; Matzner, E.; Polle, A.; Prietzel, J.; et al. Phosphorus in forest ecosystems: New insights from an ecosystem nutrition perspective. J. Plant Nutr. Soil Sci. 2016, 179, 129–135. [Google Scholar] [CrossRef]
  10. Li, L.; Stanforth, R. Distinguishing adsorption and surface precipitation of phosphate on goethite (alpha-FeOOH). J. Colloid Interf. Sci. 2000, 230, 12–21. [Google Scholar] [CrossRef]
  11. Gypser, S.; Schütze, E.; Freese, D. Crystallization of single and binary iron- and aluminum hydroxides affect phosphorus desorption. J. Plant Nutr. Soil Sci. 2019, 182, 741–750. [Google Scholar] [CrossRef]
  12. Bais, H.P.; Weir, T.L.; Perry, L.G.; Gilroy, S.; Vivanco, J.M. The role of root exudates in rhizosphere interactions with plants and other organisms. Annu. Rev. Plant Biol. 2006, 57, 233–266. [Google Scholar] [CrossRef] [Green Version]
  13. Basak, B.B. Phosphorus release by low molecular weight organic acids from low-grade indian rock phosphate. Waste Biomass Valor. 2019, 10, 3225–3233. [Google Scholar] [CrossRef]
  14. Bhatti, J.S.; Comerford, N.B.; Johnston, C.T. Influence of oxalate and soil organic matter on sorption and desorption of phosphate onto a spodic horizon. Soil Sci. Soc. Am. J. 1998, 62, 1089–1095. [Google Scholar] [CrossRef]
  15. Borggaard, O.K.; Raben-Lange, B.; Gimsing, A.L.; Strobel, B.W. Influence of humic substances on phosphate adsorption by aluminium and iron oxides. Geoderma 2005, 127, 270–279. [Google Scholar] [CrossRef]
  16. Hinsinger, P. Bioavailability of soil inorganic P in the rhizosphere as affected by root-induced chemical changes: A review. Plant Soil 2001, 237, 173–195. [Google Scholar] [CrossRef]
  17. Johnson, S.E.; Loeppert, R.H. Role of organic acids in phosphate mobilization from iron oxide. Soil Sci. Soc. Am. J. 2006, 70, 222–234. [Google Scholar] [CrossRef] [Green Version]
  18. Roberts, T.L.; Johnston, A.E. Phosphorus use efficiency and management in agriculture. Resour. Conserv. Recycl. 2015, 105, 275–281. [Google Scholar] [CrossRef]
  19. Buczko, U.; van Laak, M.; Eichler-Löbermann, B.; Gans, W.; Merbach, I.; Panten, K.; Peiter, E.; Reitz, T.; Spiegel, H.; von Tucher, S. Re-evaluation of the yield response to phosphorus fertilization based on meta-analyses of long-term field experiments. Ambio 2018, 47, 50–61. [Google Scholar] [CrossRef] [PubMed] [Green Version]
  20. Syers, J.K.; Johnston, A.E.; Curtin, D. Efficiency of Soil and Fertilizer Phosphorus Use: Reconciling Changing Concepts of Soil Phosphorus Behaviour with Agronomic Information; FAO Fertilizer and Plant Nutrition No. 18; Food and Agriculture Organization of the United Nations: Rome, Italy, 2008. [Google Scholar]
  21. van der Bom, F.; McLaren, T.I.; Doolette, A.L.; Magid, J.; Frossard, E.; Oberson, A.; Jensen, L.S. Influence of long-term phosphorus fertilisation history on the availability and chemical nature of soil phosphorus. Geoderma 2019, 355, 113909. [Google Scholar] [CrossRef]
  22. Antelo, J.; Fiol, S.; Pérez, C.; Mariño, S.; Arce, F.; Gondar, D.; López, R. Analysis of phosphate adsorption onto ferrihydrite using the CD-MUSIC model. J. Colloid Interf. Sci. 2010, 347, 112–119. [Google Scholar] [CrossRef]
  23. Ahmed, A.A.; Gypser, S.; Leinweber, P.; Freese, D.; Kühn, O. Infrared spectroscopic characterization of phosphate binding at the goethite-water interface. Phys. Chem. Chem. Phys. 2019, 21, 4421–4434. [Google Scholar] [CrossRef] [Green Version]
  24. Gypser, S.; Hirsch, F.; Schleicher, A.M.; Freese, D. Impact of crystalline and amorphous iron- and aluminum hydroxides on mechanisms of phosphate adsorption and desorption. J. Environ. Sci. 2018, 70, 175–189. [Google Scholar] [CrossRef]
  25. Khare, N.; Martin, J.D.; Hesterberg, D. Phosphate bonding configuration on ferrihydrite based on molecular orbital calculations and XANES fingerprinting. Geochim. Cosmochim. Acta 2007, 71, 4405–4415. [Google Scholar] [CrossRef]
  26. Krumina, L.; Kenney, J.P.; Loring, J.S.; Persson, P. Desorption mechanisms of phosphate from ferrihydrite and goethite surfaces. Chem. Geol. 2016, 427, 54–64. [Google Scholar] [CrossRef]
  27. Kubicki, J.D.; Kwon, K.D.; Paul, K.W.; Sparks, D.L. Surface complex structures modelled with quantum chemical calculations: Carbonate, phosphate, sulphate, arsenate and arsenite. Eur. J. Soil Sci. 2007, 58, 932–944. [Google Scholar] [CrossRef]
  28. van Emmerik, T.J.; Sandström, D.E.; Antzutkin, O.N.; Angove, M.J.; Johnson, B.B. 31P solid-state nuclear magnetic resonance study of the sorption of phosphate onto gibbsite and kaolinite. Langmuir 2007, 23, 3205–3213. [Google Scholar] [CrossRef] [PubMed]
  29. Zheng, T.-T.; Sun, Z.-X.; Yang, X.-F.; Holmgren, A. Sorption of phosphate onto mesoporous γ-alumina studied with in-situ ATR-FTIR spectroscopy. Chem. Cent. J. 2012, 6, 26. [Google Scholar] [CrossRef] [Green Version]
  30. Arai, Y.; Sparks, D.L. ATR–FTIR spectroscopic investigation on phosphate adsorption mechanisms at the ferrihydrite–water interface. J. Colloid Interf. Sci. 2001, 241, 317–326. [Google Scholar] [CrossRef] [Green Version]
  31. Tiessen, H.; Moir, J.O. Characterization of available P by sequential extraction. In Soil Sampling and Methods of Analysis; Carter, M.R., Gregorich, E.G., Eds.; CRC Press: Boca Raton, FL, USA, 2007; ISBN 9780429126222. [Google Scholar]
  32. Schwertmann, U.; Cornell, R.M. Iron Oxides in the Laboratory: Preparation and Characterization; Wiley-VCH: Hoboken, NJ, USA, 2008. [Google Scholar]
  33. Sujana, M.G.; Soma, G.; Vasumathi, N.; Anand, S. Studies on fluoride adsorption capacities of amorphous Fe/Al mixed hydroxides from aqueous solutions. J. Fluor. Chem. 2009, 130, 749–754. [Google Scholar] [CrossRef]
  34. Harvey, O.R.; Rhue, R.D. Kinetics and energetics of phosphate sorption in a multi-component Al(III)-Fe(III) hydr(oxide) sorbent system. J. Colloid Interf. Sci. 2008, 322, 384–393. [Google Scholar] [CrossRef]
  35. Johnson, B.B.; Ivanov, A.V.; Antzutkin, O.N.; Forsling, W. 31P nuclear magnetic resonance study of the adsorption of phosphate and phenyl phosphates on γ-Al2O3. Langmuir 2002, 18, 1104–1111. [Google Scholar] [CrossRef]
  36. Persson, P.; Nilsson, N.; Sjöberg, S. Structure and bonding of orthophosphate ions at the iron oxide-aqueous interface. J. Colloid Interf. Sci. 1996, 177, 263–275. [Google Scholar] [CrossRef]
  37. Loring, J.S.; Sandström, M.H.; Norén, K.; Persson, P. Rethinking arsenate coordination at the surface of goethite. Chemistry 2009, 15, 5063–5072. [Google Scholar] [CrossRef]
  38. Luengo, C.; Brigante, M.; Antelo, J.; Avena, M. Kinetics of phosphate adsorption on goethite: Comparing batch adsorption and ATR-IR measurements. J. Colloid Interf. Sci. 2006, 300, 511–518. [Google Scholar] [CrossRef] [PubMed]
  39. Torrent, J. Fast and slow phosphate sorption by goethite-rich natural materials. Clay. Clay. Miner. 1992, 40, 14–21. [Google Scholar] [CrossRef]
  40. Lǚ, J.; Liu, H.; Liu, R.; Zhao, X.; Sun, L.; Qu, J. Adsorptive removal of phosphate by a nanostructured Fe–Al–Mn trimetal oxide adsorbent. Powder Technol. 2013, 233, 146–154. [Google Scholar] [CrossRef]
  41. Arai, Y.; Livi, K.J. Underassessed phosphorus fixation mechanisms in soil sand fraction. Geoderma 2013, 192, 422–429. [Google Scholar] [CrossRef]
  42. Antelo, J.; Avena, M.; Fiol, S.; López, R.; Arce, F. Effects of pH and ionic strength on the adsorption of phosphate and arsenate at the goethite-water interface. J. Colloid Interf. Sci. 2005, 285, 476–486. [Google Scholar] [CrossRef]
  43. Strauss, R.; Brümmer, G.W.; Barrow, N.J. Effects of crystallinity of goethite: II. Rates of sorption and desorption of phosphate. Eur. J. Soil Sci. 1997, 48, 101–114. [Google Scholar] [CrossRef]
  44. Adekola, F.; Fédoroff, M.; Geckeis, H.; Kupcik, T.; Lefèvre, G.; Lützenkirchen, J.; Plaschke, M.; Preocanin, T.; Rabung, T.; Schild, D. Characterization of acid-base properties of two gibbsite samples in the context of literature results. J. Colloid Interf. Sci. 2011, 354, 306–317. [Google Scholar] [CrossRef]
  45. Jodin, M.-C.; Gaboriaud, F.; Humbert, B. Limitations of potentiometric studies to determine the surface charge of gibbsite gamma-Al(OH)3 particles. J. Colloid Interf. Sci. 2005, 287, 581–591. [Google Scholar] [CrossRef]
  46. Kosmulski, M. Compilation of PZC and IEP of sparingly soluble metal oxides and hydroxides from literature. Adv. Colloid Interf. Sci. 2009, 152, 14–25. [Google Scholar] [CrossRef]
  47. Liu, J.; Wang, X.; Lin, C.-L.; Miller, J.D. Significance of particle aggregation in the reverse flotation of kaolinite from bauxite ore. Miner. Eng. 2015, 78, 58–65. [Google Scholar] [CrossRef] [Green Version]
  48. Cornell, R.M.; Schwertmann, U. The Iron Oxides. Structure, Properties, Reactions, Occurences and Uses, 2nd ed.; Wiley-VCH: Weinheim, Germany, 2003. [Google Scholar]
  49. Hiemstra, T.; van Riemsdijk, W.H. A surface structural approach to ion adsorption: The charge distribution (CD) model. J. Colloid Interf. Sci. 1996, 179, 488–508. [Google Scholar] [CrossRef]
  50. Ahmed, A.A.; Gypser, S.; Freese, D.; Leinweber, P.; Kühn, O. Molecular level picture of the interplay between pH and phosphate binding at the goethite-water interface. Phys. Chem. Chem. Phys. 2020, 22, 26509–26524. [Google Scholar] [CrossRef] [PubMed]
  51. Rietra, R.P.; Hiemstra, T.; van Riemsdijk, W.H. Interaction between calcium and phosphate adsorption on goethite. Environ. Sci. Technol. 2001, 35, 3369–3374. [Google Scholar] [CrossRef]
  52. Wang, X.; Phillips, B.; Boily, J.-F.; Hu, Y.; Hu, Z.; Yang, P.; Feng, X.; Xu, W.; Zhu, M. Phosphate sorption speciation and precipitation mechanisms on amorphous aluminum hydroxide. Soil Syst. 2019, 3, 20. [Google Scholar] [CrossRef] [Green Version]
  53. Wang, Y.; Chen, X.; Whalen, J.K.; Cao, Y.; Quan, Z.; Lu, C.; Shi, Y. Kinetics of inorganic and organic phosphorus release influenced by low molecular weight organic acids in calcareous, neutral and acidic soils. J. Plant Nutr. Soil Sci. 2015, 178, 555–566. [Google Scholar] [CrossRef]
  54. Onishi, B.S.D.; dos Reis Ferreira, C.S.; Urbano, A.; Santos, M.J. Modified hydrotalcite for phosphorus slow-release: Kinetic and sorption-desorption processes in clayey and sandy soils from North of Paraná state (Brazil). Appl. Clay Sci. 2020, 197, 105759. [Google Scholar] [CrossRef]
  55. Wang, X.; Liu, F.; Tan, W.; Li, W.; Feng, X.; Sparks, D.L. Characteristics of phosphate adsorption-desorption onto ferrihydrite. Soil Sci. 2013, 178, 1–11. [Google Scholar] [CrossRef]
  56. Shariatmadari, H.; Shirvani, M.; Jafari, A. Phosphorus release kinetics and availability in calcareous soils of selected arid and semiarid toposequences. Geoderma 2006, 132, 261–272. [Google Scholar] [CrossRef]
  57. Steffens, D. Phosphorus release kinetics and extractable phosphorus after long-term fertilization. Soil Sci. Soc. Am. J. 1994, 58, 1702. [Google Scholar] [CrossRef]
  58. Lammers, A. Phosphatformen und Phosphatfreisetzung in hochgedüngten Böden Europas; Dissertation, Utz: München, Germany, 1997. [Google Scholar]
  59. Arai, Y.; Sparks, D.L. Phosphate reaction dynamics in soils and soil components: A multiscale approach. Advances Agron. 2007, 94, 135–179. [Google Scholar]
  60. Gerke, J. Phosphate adsorption by humic/Fe-oxide mixtures aged at pH 4 and 7 and by poorly ordered Fe-oxide. Geoderma 1993, 59, 279–288. [Google Scholar] [CrossRef]
  61. Borggaard, O.K.; Jørgensen, S.S.; Moberg, J.P.; Raben-Lange, B. Influence of organic matter on phosphate adsorption by aluminium and iron oxides in sandy soils. Eur. J. Soil Sci. 1990, 41, 443–449. [Google Scholar] [CrossRef]
  62. Jones, D.L. Organic acids in the rhizosphere—A critical review. Plant Soil 1998, 205, 25–44. [Google Scholar] [CrossRef]
  63. Kpomblekou-A, K.; Tabatabai, M.A. Effect of low-molecular weight organic acids on phosphorus release and phytoavailabilty of phosphorus in phosphate rocks added to soils. Agric. Ecosyst. Environ. 2003, 100, 275–284. [Google Scholar] [CrossRef]
  64. Chen, C.R.; Condron, L.M.; Davis, M.R.; Sherlock, R.R. Effects of plant species on microbial biomass phosphorus and phosphatase activity in a range of grassland soils. Biol. Fertil. Soils 2004, 40, 313–322. [Google Scholar] [CrossRef]
  65. Xu, R.; Zhu, Y.; Chittleborough, D. Phosphorus release from phosphate rock and iron phosphate by low-molecular-weight organic acids. J. Environ. Sci. 2004, 16, 5–8. [Google Scholar]
  66. Taghipour, M.; Jalali, M. Effect of low-molecular-weight organic acids on kinetics release and fractionation of phosphorus in some calcareous soils of western Iran. Environ. Monit. Assess. 2013, 185, 5471–5482. [Google Scholar] [CrossRef]
  67. Zhu, J.; Li, M.; Whelan, M. Phosphorus activators contribute to legacy phosphorus availability in agricultural soils: A review. Sci. Total Environ. 2018, 612, 522–537. [Google Scholar] [CrossRef] [Green Version]
  68. Vinu, A.; Hossain, K.Z.; Satish Kumar, G.; Ariga, K. Adsorption of l-histidine over mesoporous carbon molecular sieves. Carbon 2006, 44, 530–536. [Google Scholar] [CrossRef]
  69. Lathrop, E.C. The organic nitrogen compounds of soils and fertilizers. J. Frankl. Inst. 1917, 303–321. [Google Scholar] [CrossRef]
  70. Mimmo, T.; Ghizzi, M.; Marzadori, C.; Gessa, C.E. Organic acid extraction from rhizosphere soil: Effect of field-moist, dried and frozen samples. Plant Soil 2008, 312, 175–184. [Google Scholar] [CrossRef]
  71. Schütze, E.; Gypser, S.; Freese, D. Kinetics of phosphorus release from vivianite, hydroxyapatite, and bone char influenced by organic and inorganic compounds. Soil Syst. 2020, 4, 15. [Google Scholar] [CrossRef] [Green Version]
  72. Talebi Atouei, M.; Rahnemaie, R.; Goli Kalanpa, E.; Davoodi, M.H. Competitive adsorption of magnesium and calcium with phosphate at the goethite water interface: Kinetics, equilibrium and CD-MUSIC modeling. Chem. Geol. 2016, 437, 19–29. [Google Scholar] [CrossRef]
  73. Duputel, M.; van Hoye, F.; Toucet, J.; Gérard, F. Citrate adsorption can decrease soluble phosphate concentration in soil: Experimental and modeling evidence. Appl. Geochem. 2013, 39, 85–92. [Google Scholar] [CrossRef]
Figure 1. Kinetics of P desorption from (A) goethite, (B) gibbsite, (C) ferrihydrite, (D) 1 Fe: 0 Al, (E) 5 Fe: 1 Al, (F) 1 Fe: 1 Al, (G) 1 Fe: 5 Al, (H) 0 Fe: 1 Al with KCl and KNO3 at concentrations of 5 mM and 50 mM.
Soilsystems 05 00033 g001
Figure 2. Kinetics of P desorption from (A) goethite, (B) gibbsite, (C) ferrihydrite, (D) 1 Fe: 0 Al, (E) 5 Fe: 1 Al, (F) 1 Fe: 1 Al, (G) 1 Fe: 5 Al, (H) 0 Fe: 1 Al with histidine and malic acid at concentrations of 5 mM and 50 mM.
Soilsystems 05 00033 g002
Figure 3. Correlation between desorbed P and the change of (A) dissolved total Fe + Al for KCl, (B) dissolved total Fe + Al for KNO3, (C) dissolved total Cl for KCl, and (D) dissolved total N for KNO3 in the sample solution for all hydroxides and each desorption time step.
Soilsystems 05 00033 g003
Figure 4. Correlation between desorbed P and the change of (A) dissolved total Fe + Al for histidine, (B) dissolved total Fe + Al for malic acid, (C) dissolved total C for histidine, and (D) dissolved total C for malic acid in the sample solution for all hydroxides and each desorption time step.
Soilsystems 05 00033 g004
Table 1. Point of zero charge (PZC), specific surface area (SSA), and the amount of total Fe, Al, and P of crystalline and amorphous Fe- and Al-hydroxides.
HydroxidePZCSSAFeAlP
pHm² g−1mg g−1mg g−1mg g−1mg m−2
Goethite8.817.2 ± 0.4564.17 ± 9.74-7.07 ± 0.240.41 ± 0.01
Gibbsite8.50.9 ± 0.0-337.39 ± 6.057.39 ± 0.068.21 ± 0.06
Ferrihydrite7.1251.8 ± 2.7520.99 ± 12.27-30.92 ± 2.630.12 ± 0.01
1 Fe: 0 Al6.0297.3 ± 10.4494.30 ± 25.04-36.50 ± 2.740.07 ± 0.09
5 Fe: 1 Al7.1203.8 ± 0.9424.59 ±2.5132.10 ± 1.1943.47 ± 5.230.21 ± 0.03
1 Fe: 1 Al7.673.7 ± 8.0275.44 ± 1.13137.22 ± 0.8731.34 ± 0.690.43 ± 0.01
1 Fe: 5 Al9.80.8 ± 0.058.55 ± 0.65162.27 ± 1.5764.65 ± 0.6480.82 ± 0.80
0 Fe: 1 Al9.81.1 ± 0.0-131.44 ± 2.6944.27 ± 0.3340.25 ± 0.30
Table 2. Applied kinetic models for P desorption.
Kinetic ModelLinearized EquationDeclaration
Elovich Q t = 1 β ln ( α β ) + 1 β ln t Qt—amount of desorbed P in mg P m−2 Hydroxide at time t
α/a—initial P release constants in mg P m−2 Hydroxide min−1
β/b—P release rate constants in mg P m−2 Hydroxide min−1
kp—diffusion rate constant in m s−1
Q0—equals value of 0 at the beginning of desorption
Exponential ln Q t = ln a + b ln t
Parabolic Q t = Q 0 + k p t 1 2
Table 3. Total P desorption after 336 h by using desorption solutions KCl, KNO3, histidine (His), and malic acid (Mal).
HydroxideDesorbed P [%]
KClKNO3HisMal
5 mM50 mM5 mM50 mM5 mM50 mM5 mM50 mM
Goethite80.95 ± 0.3972.24 ± 0.4071.58 ± 0.5164.72 ± 0.3370.94 ± 0.4665.61 ± 0.4070.38 ± 0.3268.91 ± 0.81
Gibbsite46.58 ± 2.9639.53 ± 1.8542.60 ± 2.1241.26 ± 2.8450.48 ± 3.6249.17 ± 3.5650.74 ± 2.5161.43 ± 3.33
Ferrihydrite11.77 ± 0.464.44 ± 0.226.91 ± 0.233.72 ± 0.111.92 ± 0.091.38 ± 0.213.61 ± 0.123.01 ± 0.29
1 Fe: 0 Al27.55 ± 0.2315.57 ± 0.1421.68 ± 0.1713.52 ± 0.0714.93 ± 0.1910.33 ± 0.1115.25 ± 0.1312.14 ± 0.06
5 Fe: 1 Al14.49 ± 0.325.79 ± 0.139.11 ± 0.234.40 ± 0.084.78 ± 0.102.79 ± 0.155.36 ± 0.103.87 ± 0.13
1 Fe: 1 Al5.23 ± 0.292.24 ± 0.162.90 ± 0.201.95 ± 0.282.51 ± 0.152.18 ± 0.133.22 ± 0.274.38 ± 0.35
1 Fe: 5 Al20.48 ± 1.0212.20 ± 0.2216.10 ± 0.0910.80 ± 0.1213.75 ± 0.0610.89 ± 0.3013.16 ± 0.3211.86 ± 0.52
0 Fe: 1 Al23.22 ± 0.3914.79 ± 0.4419.90 ± 0.5413.69 ± 0.3019.82 ± 0.3516.94 ± 0.1219.66 ± 0.4421.33 ± 0.33
Desorbed P [mg m−2]
Goethite0.33 ± 0.000.30 ± 0.000.29 ± 0.000.27 ± 0.000.29 ± 0.000.27 ± 0.000.29 ± 0.000.28 ± 0.00
Gibbsite3.96 ± 0.253.36 ± 0.163.62 ± 0.183.51 ± 0.244.29 ± 0.314.18 ± 0.304.31 ± 0.215.22 ± 0.28
Ferrihydrite0.01 ± 0.000.01 ± 0.000.01 ± 0.000.00 ± 0.000.00 ± 0.000.00 ± 0.000.00 ± 0.000.00 ± 0.00
1 Fe: 0 Al0.03 ± 0.000.02 ± 0.000.03 ± 0.000.02 ± 0.000.02 ± 0.000.01 ± 0.000.02 ± 0.000.01 ± 0.00
5 Fe: 1 Al0.03 ± 0.000.01 ± 0.000.02 ± 0.000.01 ± 0.000.01 ± 0.000.01 ± 0.000.01 ± 0.000.01 ± 0.00
1 Fe: 1 Al0.02 ± 0.000.01 ± 0.000.01 ± 0.000.01 ± 0.000.01 ± 0.000.01 ± 0.000.01 ± 0.000.02 ± 0.00
1 Fe: 5 Al16.71 ± 0.839.96 ± 0.1813.13± 0.078.81 ± 0.1011.21± 0.058.88 ± 0.2510.73 ± 0.269.67 ± 0.43
0 Fe: 1 Al9.19 ± 0.155.85 ± 0.177.87 ± 0.225.42 ± 0.127.84 ± 0.146.70 ± 0.057.78 ± 0.178.44 ± 0.13
Table 4. Coefficients of determination (R²), standard error (S.E.), and calculated kinetic parameters for the Elovich equation used to describe the kinetic release of P after 336 h desorption time.
HydroxideElovichKClKNO3HisMal
5 mM50 mM5 mM50 mM5 mM50 mM5 mM50 mM
Goethite0.930.970.940.980.930.940.960.97
S.E.0.010.000.010.000.010.010.010.01
α1.47 × 1062.40 × 104973.69440.79348.8975.1226.165.25
β71.3266.8655.4659.6752.1051.0043.4738.44
Gibbsite0.740.900.870.890.930.380.870.80
S.E.0.240.170.190.240.300.270.230.26
α6.62 × 1041.62 × 1033.03 × 1031.17 × 1032.84 × 103337.64211.4014.21
β4.544.254.093.953.422.972.771.72
Ferrihydrite0.920.870.850.800.770.840.89 *0.94
S.E.0.000.000.000.000.000.000.000.00
α1.03 × 10−34.86 × 10−45.45 × 10−43.91 × 10−40.025.741.12 × 10−33.78 × 10⁻³
β392.881.12 × 103696.871.33 × 1034.58 × 1031.02 × 1041.69 × 1032.40 × 103
1 Fe: 0 Al0.991.001.000.990.990.991.001.00
S.E.0.000.000.000.000.000.000.000.00
α0.014.98 × 10−30.013.90 × 10−30.010.010.014.13 × 10−3
β197.39339.08236.18386.40385.73591.45350.24439.41
5 Fe: 1 Al0.990.970.950.960.990.980.970.97
S.E.0.000.000.000.000.000.000.000.00
α3.82 × 10−31.19 × 10−31.47 × 10−38.59 × 10−41.64 × 10−31.04 × 10−31.22 × 10−39.32 × 10−4
β184.08459.54287.03608.12581.631.04 × 103510.68708.58
1 Fe: 1 Al0.980.930.960.820.960.950.930.95
S.E.0.000.000.000.000.000.000.000.00
α0.010.010.010.010.010.010.010.01
β299.90805.25596.31937.29719.88826.31531.43354.14
1 Fe: 5 Al0.970.991.000.990.980.970.980.99
S.E.0.720.330.180.180.400.380.390.34
α14.623.593.693.878.786.315.022.37
β0.450.670.490.790.660.830.650.67
0 Fe: 1 Al0.940.940.950.960.940.970.970.99
S.E.0.450.350.410.230.430.260.310.16
α52.567.1416.6110.7623.3013.4518.734.45
β1.021.361.071.571.111.251.120.85
* p = 0.059.
Table 5. Coefficients of determination (R²), standard error (S.E.), and calculated kinetic parameters for the exponential function used to describe the kinetic release of P after 336 h desorption time.
HydroxideExponentialKClKNO3HisMal
5 mM50 mM5 mM50 mM5 mM50 mM5 mM50 mM
Goethite0.910.960.910.970.890.900.920.92
S.E.0.030.020.040.030.050.060.060.07
a0.260.220.200.170.190.170.170.14
b0.050.060.070.080.080.090.100.12
Gibbsite0.720.840.830.770.750.820.870.92
S.E.0.080.070.070.090.090.090.080.09
a2.802.122.342.172.722.392.382.09
b0.070.090.080.090.080.100.110.17
Ferrihydrite0.990.991.001.000.950.380.950.82
S.E.0.090.060.060.050.060.170.100.16
a7.88 × 10−44.78 × 10−44.58 × 10−43.88 × 10−41.11 × 10−31.09 × 10−39.15 × 10−41.19 × 10⁻³
b0.510.410.490.420.130.070.250.18
1 Fe: 0 Al0.920.960.960.970.930.930.960.96
S.E.0.150.110.130.110.130.110.110.12
a0.013.61 × 10−34.44 × 10−32.96 × 10−34.89 × 10−33.73 × 10−33.61 × 10−32.91 × 10−3
b0.280.300.330.310.250.230.300.30
5 Fe: 1 Al0.940.970.980.980.950.970.980.98
S.E.0.200.150.150.120.150.120.120.11
a2.85 × 10−39.23 × 10−49.98 × 10−46.84 × 10−41.32 × 10−38.61 × 10−41.03 × 10−38.04 × 10⁻⁴
b0.440.470.530.470.380.350.430.42
1 Fe: 1 Al0.950.900.960.830.920.920.920.92
S.E.0.120.140.090.180.120.120.130.15
a4.71 × 10−32.79 × 10−33.14 × 10−32.41 × 10−33.27 × 10−32.77 × 10−33.32 × 10−33.77 × 10⁻³
b0.280.220.240.220.210.220.250.29
1 Fe: 5 Al0.920.920.940.950.920.910.930.96
S.E.0.120.150.140.110.130.140.130.12
a5.152.182.532.153.342.562.651.76
b0.220.280.300.260.230.230.260.31
0 Fe: 1 Al0.880.870.870.890.870.910.910.96
S.E.0.100.150.130.120.130.110.100.10
a4.131.962.972.033.182.543.042.24
b0.150.200.180.180.170.180.170.24
Table 6. Coefficients of determination (R²), standard error (S.E.), and calculated kinetic parameters for the parabolic function used to describe the kinetic release of P after 336 h desorption time.
HydroxideParabolicKClKNO3HisMal
5 mM50 mM5 mM50 mM5 mM50 mM5 mM50 mM
Goethite0.690.790.710.820.700.730.760.77
S.E.0.020.010.020.010.020.020.020.02
Q00.280.230.220.190.220.190.190.17
kp3.58 × 10−33.99 × 10−34.67 × 10−34.55 × 10−34.94 × 10−30.010.010.01
Gibbsite0.550.670.640.610.590.650.710.81
S.E.0.320.270.300.330.390.400.380.48
Q03.092.412.652.483.092.782.792.59
kp0.060.060.060.070.080.090.100.16
Ferrihydrite0.990.990.991.000.920.370.990.88
S.E.0.000.000.000.000.000.000.000.00
Q02.85 × 10−43.22 × 10⁻⁴−6.07 × 10−52.26 × 10−41.26 × 10−31.19 × 10−39.30 × 10−41.33 × 10−3
kp7.83 × 10−42.79 × 10−44.56 × 10−42.36 × 10−46.44 × 10−52.89 × 10−51.87 × 10−41.30 × 10⁻⁴
1 Fe: 0 Al0.840.910.910.920.830.840.910.91
S.E.0.000.000.000.000.000.000.000.00
Q00.010.010.014.12 × 10−30.010.010.014.09 × 10−3
kp1.38 × 10−38.35 × 10−41.20 × 10−37.38 × 10−47.04 × 10−44.61 × 10−48.09 × 10−46.43 × 10⁻⁴
5 Fe: 1 Al0.920.970.980.980.920.940.970.97
S.E.0.000.000.000.000.000.000.000.00
Q04.44 × 10−31.06 × 10−36.39 × 10−46.87 × 10−41.95 × 10−31.18 × 10−31.20 × 10−39.50 × 10⁻⁴
kp1.56 × 10−36.45 × 10−41.05 × 10−34.93 × 10−44.90 × 10−42.78 × 10−45.82 × 10−44.19 × 10⁻⁴
1 Fe: 1 Al0.880.840.910.760.840.850.870.86
S.E.0.000.000.000.000.000.000.000.00
Q00.013.65 × 10−33.95 × 10−33.11 × 10−34.29 × 10−33.60 × 10−34.31 × 10−30.01
kp9.38 × 10−43.49 × 10−44.86 × 10−43.04 × 10−43.86 × 10−43.39 × 10−45.41 × 10−47.99 × 10⁻⁴
1 Fe: 5 Al0.800.860.880.880.810.820.850.91
S.E.1.871.051.280.831.250.961.120.85
Q07.073.173.702.974.653.533.742.46
kp0.600.410.570.350.410.330.420.43
0 Fe: 1 Al0.710.780.740.790.720.770.790.88
S.E.1.000.660.910.550.910.720.770.74
Q05.252.633.962.634.173.333.892.99
kp0.250.200.250.170.230.210.240.33
Table 7. Change of H+ concentrations in the sample solutions after 2 h desorption time.
HydroxideΔ c(H+) (10−7 mol L−1)
KClKNO3HisMal
5 mM50 mM5 mM50 mM5 mM50 mM5 mM50 mM
Goethite−0.79 ± 0.001.18 ± 0.07−3.36 ± 0.04−2.91 ± 0.00−3.44 ± 0.040.45 ± 0.64−2.43 ± 0.00−3.38 ± 0.46
Gibbsite−2.25 ± 0.04−0.48 ± 0.01−4.24 ± 0.01−4.11 ± 0.03−3.84 ± 0.260.00 ± 0.24−2.73 ± 0.04−4.44 ± 0.39
Ferrihydrite−1.87 ± 0.110.26 ± 0.30−3.47 ± 0.16−2.85 ± 0.20−4.30 ± 0.24−0.57 ± 0.11−3.27 ± 0.01−3.61 ± 0.78
1 Fe: 0 Al−2.30 ± 0.03−0.44 ± 0.01−4.18 ± 0.02−4.06 ± 0.01−5.71 ± 0.01−1.72 ± 0.09−3.05 ± 0.01−7.08 ± 0.22
5 Fe: 1 Al−2.07 ± 0.000.17 ± 0.21−3.58 ± 0.07−3.39 ± 0.08−5.39 ± 0.03−1.52 ± 0.19−2.89 ± 0.01−5.34 ± 0.17
1 Fe: 1 Al−1.96 ± 0.110.00 ± 0.09−3.40 ± 0.15−2.75 ± 0.38−4.77 ± 0.16−1.17 ± 0.30−2.88 ± 0.02−3.86 ± 0.43
1 Fe: 5 Al−2.44 ± 0.01−0.57 ± 0.06−4.36 ± 0.06−4.31 ± 0.02−5.88 ± 0.02−2.51 ± 0.32−3.18 ± 0.04−6.53 ± 0.19
0 Fe: 1 Al−2.44 ± 0.01−0.63 ± 0.04−4.46 ± 0.00−4.33 ± 0.03−5.78 ± 0.18−3.78 ± 0.24−3.21 ± 0.01−8.88 ± 0.51
Publisher’s Note: MDPI stays neutral with regard to jurisdictional claims in published maps and institutional affiliations.

