Article

Long-Term Effects of Forest Plantation Species on Chemical Soil Properties in Southern Rwanda

by
Peter Rwibasira
1,2,*,
Francois Xavier Naramabuye
3,
Donat Nsabimana
3 and
Monique Carnol
1,*
1
Laboratory of Plant and Microbial Ecology, InBioS, University of Liège, Botany Bât. 22, Chemin de la Vallée 4, 4000 Liège, Belgium
2
College of Science and Technology (CST), University of Rwanda, KN 73 St., Nyarugenge, Kigali P.O. Box 3900, Rwanda
3
College of Agriculture, Animal Sciences and Veterinary Medicine (CAVM), University of Rwanda, Huye Campus, Butare P.O. Box 56, Rwanda
*
Authors to whom correspondence should be addressed.
Submission received: 31 July 2021 / Revised: 10 September 2021 / Accepted: 20 September 2021 / Published: 26 September 2021
(This article belongs to the Special Issue Forest Soils: Functions, Threats, Management)

Abstract

:
Understanding the long-term effects of tree species on soil properties is crucial for the development of forest restoration policies in relation to the choice of species that meet both environmental and local livelihood needs. This study was performed in the Arboretum of Ruhande, Southern Rwanda, where monocultures of 148 deciduous and 56 conifer species have been established in 0.25 ha replicated plots from 1933 onwards. We investigated the effects of six exotic and two native tree species planted in monoculture plots and native species mixed within one self-regenerated plot on soil properties in two layers (0–5 cm and 5–10 cm depth). We measured general soil properties (pH, SOM, exchangeable base cations) and water-soluble C and N as a proxy for soil functioning. Changes in soil properties were observed in the upper soil layer for all tree species. Planting Eucalyptus species caused soil acidification, whereas soil exchangeable cations and pH were higher under native species (Entandrophragma excelsum and Polyschias fulva) and mixed native species. The effects of tree species were more pronounced for hot water-extractable C and N than for other soil properties. Their analyses could be used for detecting changes in soil functioning linked to vegetation types.

1. Introduction

Plants and soils are key components of terrestrial ecosystems, and changes in vegetation cover may lead to changes in soil properties, especially in the forest topsoil [1,2]. Soils provide important ecosystem functions, such as nutrient cycling, carbon sequestration in soil organic matter [3], and provision of fiber and food through the supply of water and nutrients to the vegetation [4]. In turn, trees are an important soil-forming factor, and tree species can affect soils through various mechanisms, including nutrient uptake and return to the soil, soil organic matter dynamics, changes in soil acidity via root–soil exchange, and protection from erosion [2,5,6]. As a result, physical, chemical, and biological properties as well as the related processes may be affected by tree species [7] and thus influence the nutrient supply capacity of the soils to the trees. In tropical forests, soil fertility relies heavily on the internal cycling of nutrients through the rapid decomposition of above- and belowground litter from vegetation, taking place in the thin upper soil horizon [8,9]. Understanding the effect of tree species is particularly important in tropical forest ecosystems for the long-term preservation of soil quality and for promoting soil functioning.
Recently, there has been much interest and debate about the delimitation of the concepts of soil quality, health, fertility, and ecosystem services [10,11,12,13], with sometimes overlapping or contradicting views, leading to confusion across disciplines. Karlen et al. [10] defined soil quality as “the capacity of a specific kind of soil to function, within natural or managed ecosystem boundaries, to sustain plant and animal productivity, maintain or enhance water and air quality, and support human health and habitation’’. They also recommended that soil quality should be evaluated based on soil function without, however, providing a specific definition of soil functions. Greiner et al. [14] indicated that soil functions result from the interaction of soil properties and processes and that they are related to ecosystem services and human benefits, as illustrated in the “Cascading framework” [15]. Soil functions can be measured through physical, chemical, and biological soil properties and processes, which are used as the basic tools to evaluate soil quality under different land-use systems [16,17].
Among many soil properties, soil organic matter and/or carbon (SOM, SOC), pH, and base cations are frequently used as primary indicators of forest soil quality [13,18]. Given the importance of soil organic matter for soil functioning [19], several studies investigated tree species-induced changes on total soil organic carbon (SOC) after afforestation [20]. The findings differed, with some studies showing no change [21,22], increased SOC [23,24], and decreased SOC [20,25]. Numerous factors may govern these contradictory results, and, in a review of 43 afforestation studies, Paul et al. [26] identified, in order of importance, previous land use, climate, and forest tree species as key factors influencing forest soil organic matter dynamics. While SOM is recognized as an important global indicator of soil quality, its slow dynamics does not allow for early detection of changes [27]. Further, most SOM might not be available for microbial breakdown; therefore, total SOM might not be a relevant indicator of soil functioning [28]. For example, in a grassland, 60% of SOM was shown to be a recalcitrant pool [29]. SOM undergoes continuous changes that generate distinct chemical and physical organic matter fractions with different turnover rates, from readily available labile to recalcitrant carbon and nitrogen fractions [30,31]. Labile SOM fractions have recently gained interest as indicators of soil quality because they are more sensitive to changes in vegetation cover and land use than the total organic matter [32,33]. Additionally, being the main substrate and energy source for soil microorganisms, labile carbon and nitrogen fractions such as water-extractable C and N are linked to soil nutrient cycling and thus to soil functioning [28,31,34].
Rwanda experienced the loss of its natural forest cover from 30% in 1920 to 8% in 1998 [35]. This deforestation in a country whose topography is dominated by steep sloping hills with heavy precipitation has led to accelerated soil erosion and to the decline of soil fertility [36]. A tree plantation program was initiated in 2010 to promote “in situ soil conservation through agroforestry and forest landscape restoration” [37] and halt the decline of forest cover, counter soil erosion, and land degradation as well as to meet increasing demands for wood. Within this program, the government of Rwanda has mobilized its entire population and non-governmental organizations to plant trees, mainly fast-growing exotic species, and to maintain remaining forests, whereby a target was set in 2010 to restore the country’s forest cover from 19.6% to 30% by 2030 [38]. This target was reached in 2020 with 724,695 ha (30.4%) forest cover in the country [39]. This forest cover is composed of the following: 387,425 ha (53.5%) forest plantations, wooded savannahs in the east cover 161,843 ha (22.3%), natural montane forests occupy 130,850 ha (18.1%), shrublands cover 43,963 ha (6.1%), and 613 ha are occupied by bamboo [40]. Of the forest plantations, eucalyptus species are dominant with 89%, followed by 6.5% pines, 3.1% mixed exotic forests, and 1.4% being plantations of native species [41]. While the effects of tree species on soils were extensively studied for temperate ecosystems, data on tropical soils are scarce [42]. The results of most studies may therefore have limited relevance within the context of tropical soils [43]. Additionally, numerous studies were performed in relatively short-term common garden experiments [42]. We need an in-depth understanding of the effects of the planted species on soil quality in tropical ecosystems. Such expertise for local conditions is important for selecting suitable species promoting soil functioning in these tropical forest ecosystems.
The general aim of this study was to assess the long-term effects of tree species planted in Rwanda on chemical soil quality, including water-soluble labile C and N fractions, as a proxy for soil functioning. Specific aims were to (i) determine the differences in soil chemical properties between tree species in two soil layers (0–5 cm and 5–10 cm depth); (ii) characterize hot and cold water-extractable mineral N and organic C and N in soils under different plantation species, and (iii) investigate the relationships between labile C and N fractions and other soil properties in response to tree species. We hypothesized that the exotic eucalyptus species would reduce the chemical quality of the soils in comparison to native species and that labile C and N fractions would be more sensitive to a change in tree species than SOM.

2. Materials and Methods
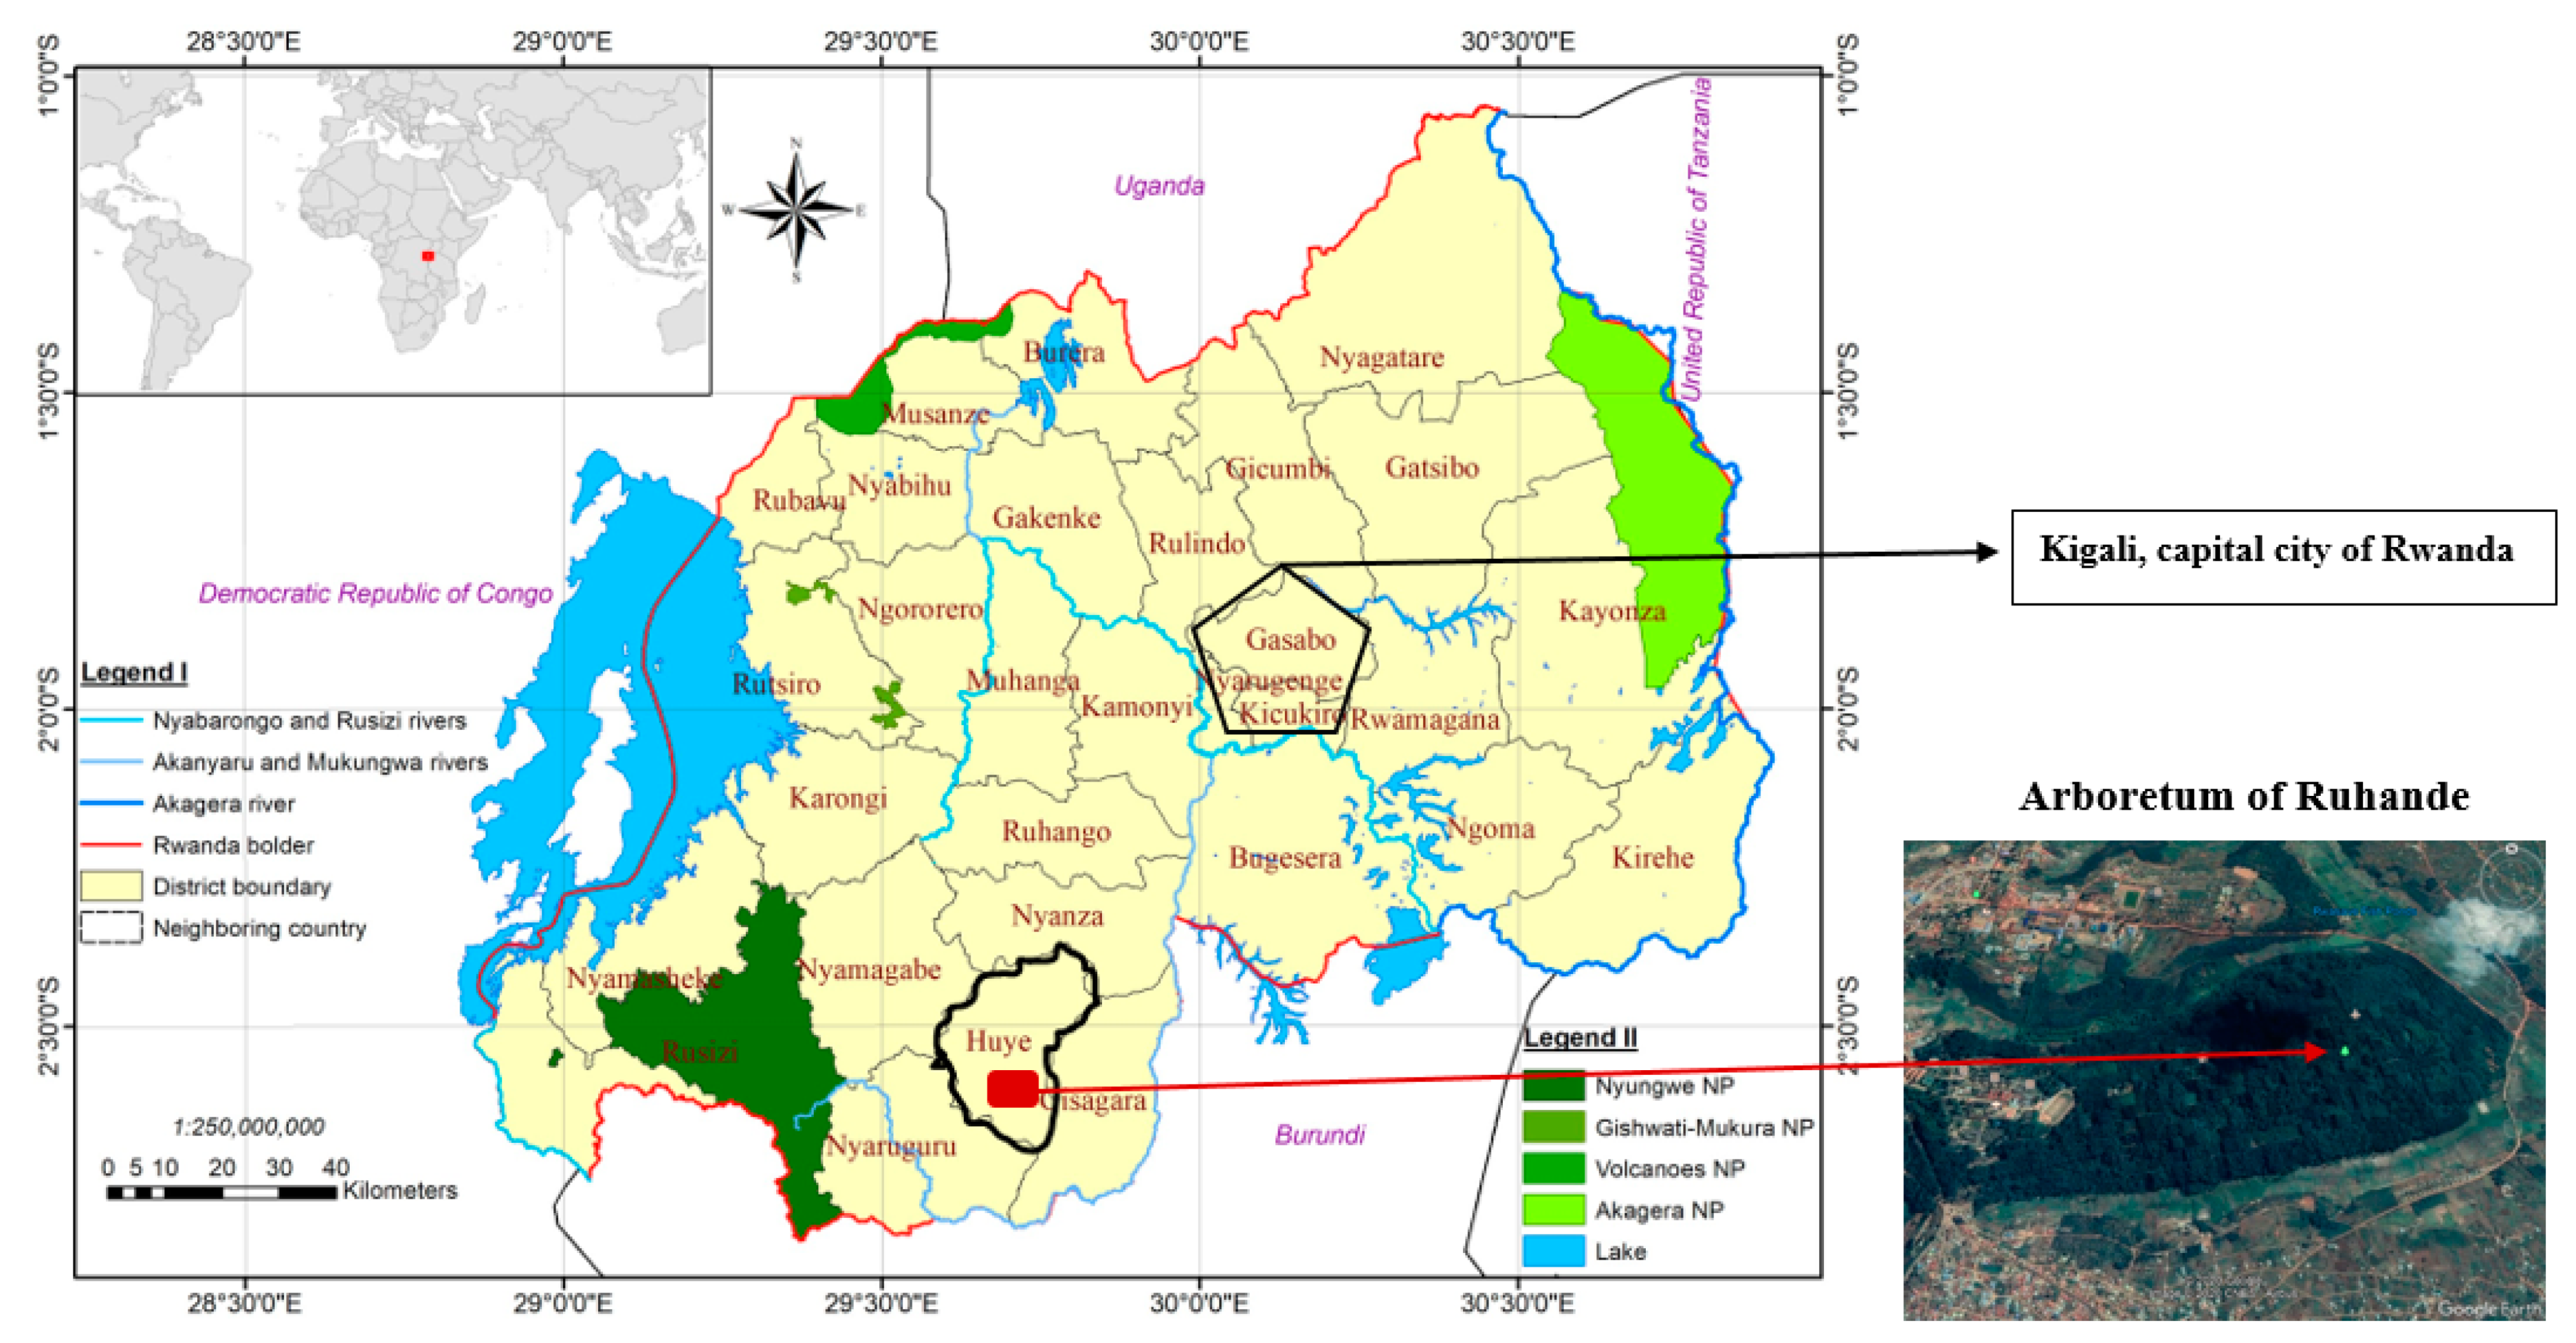
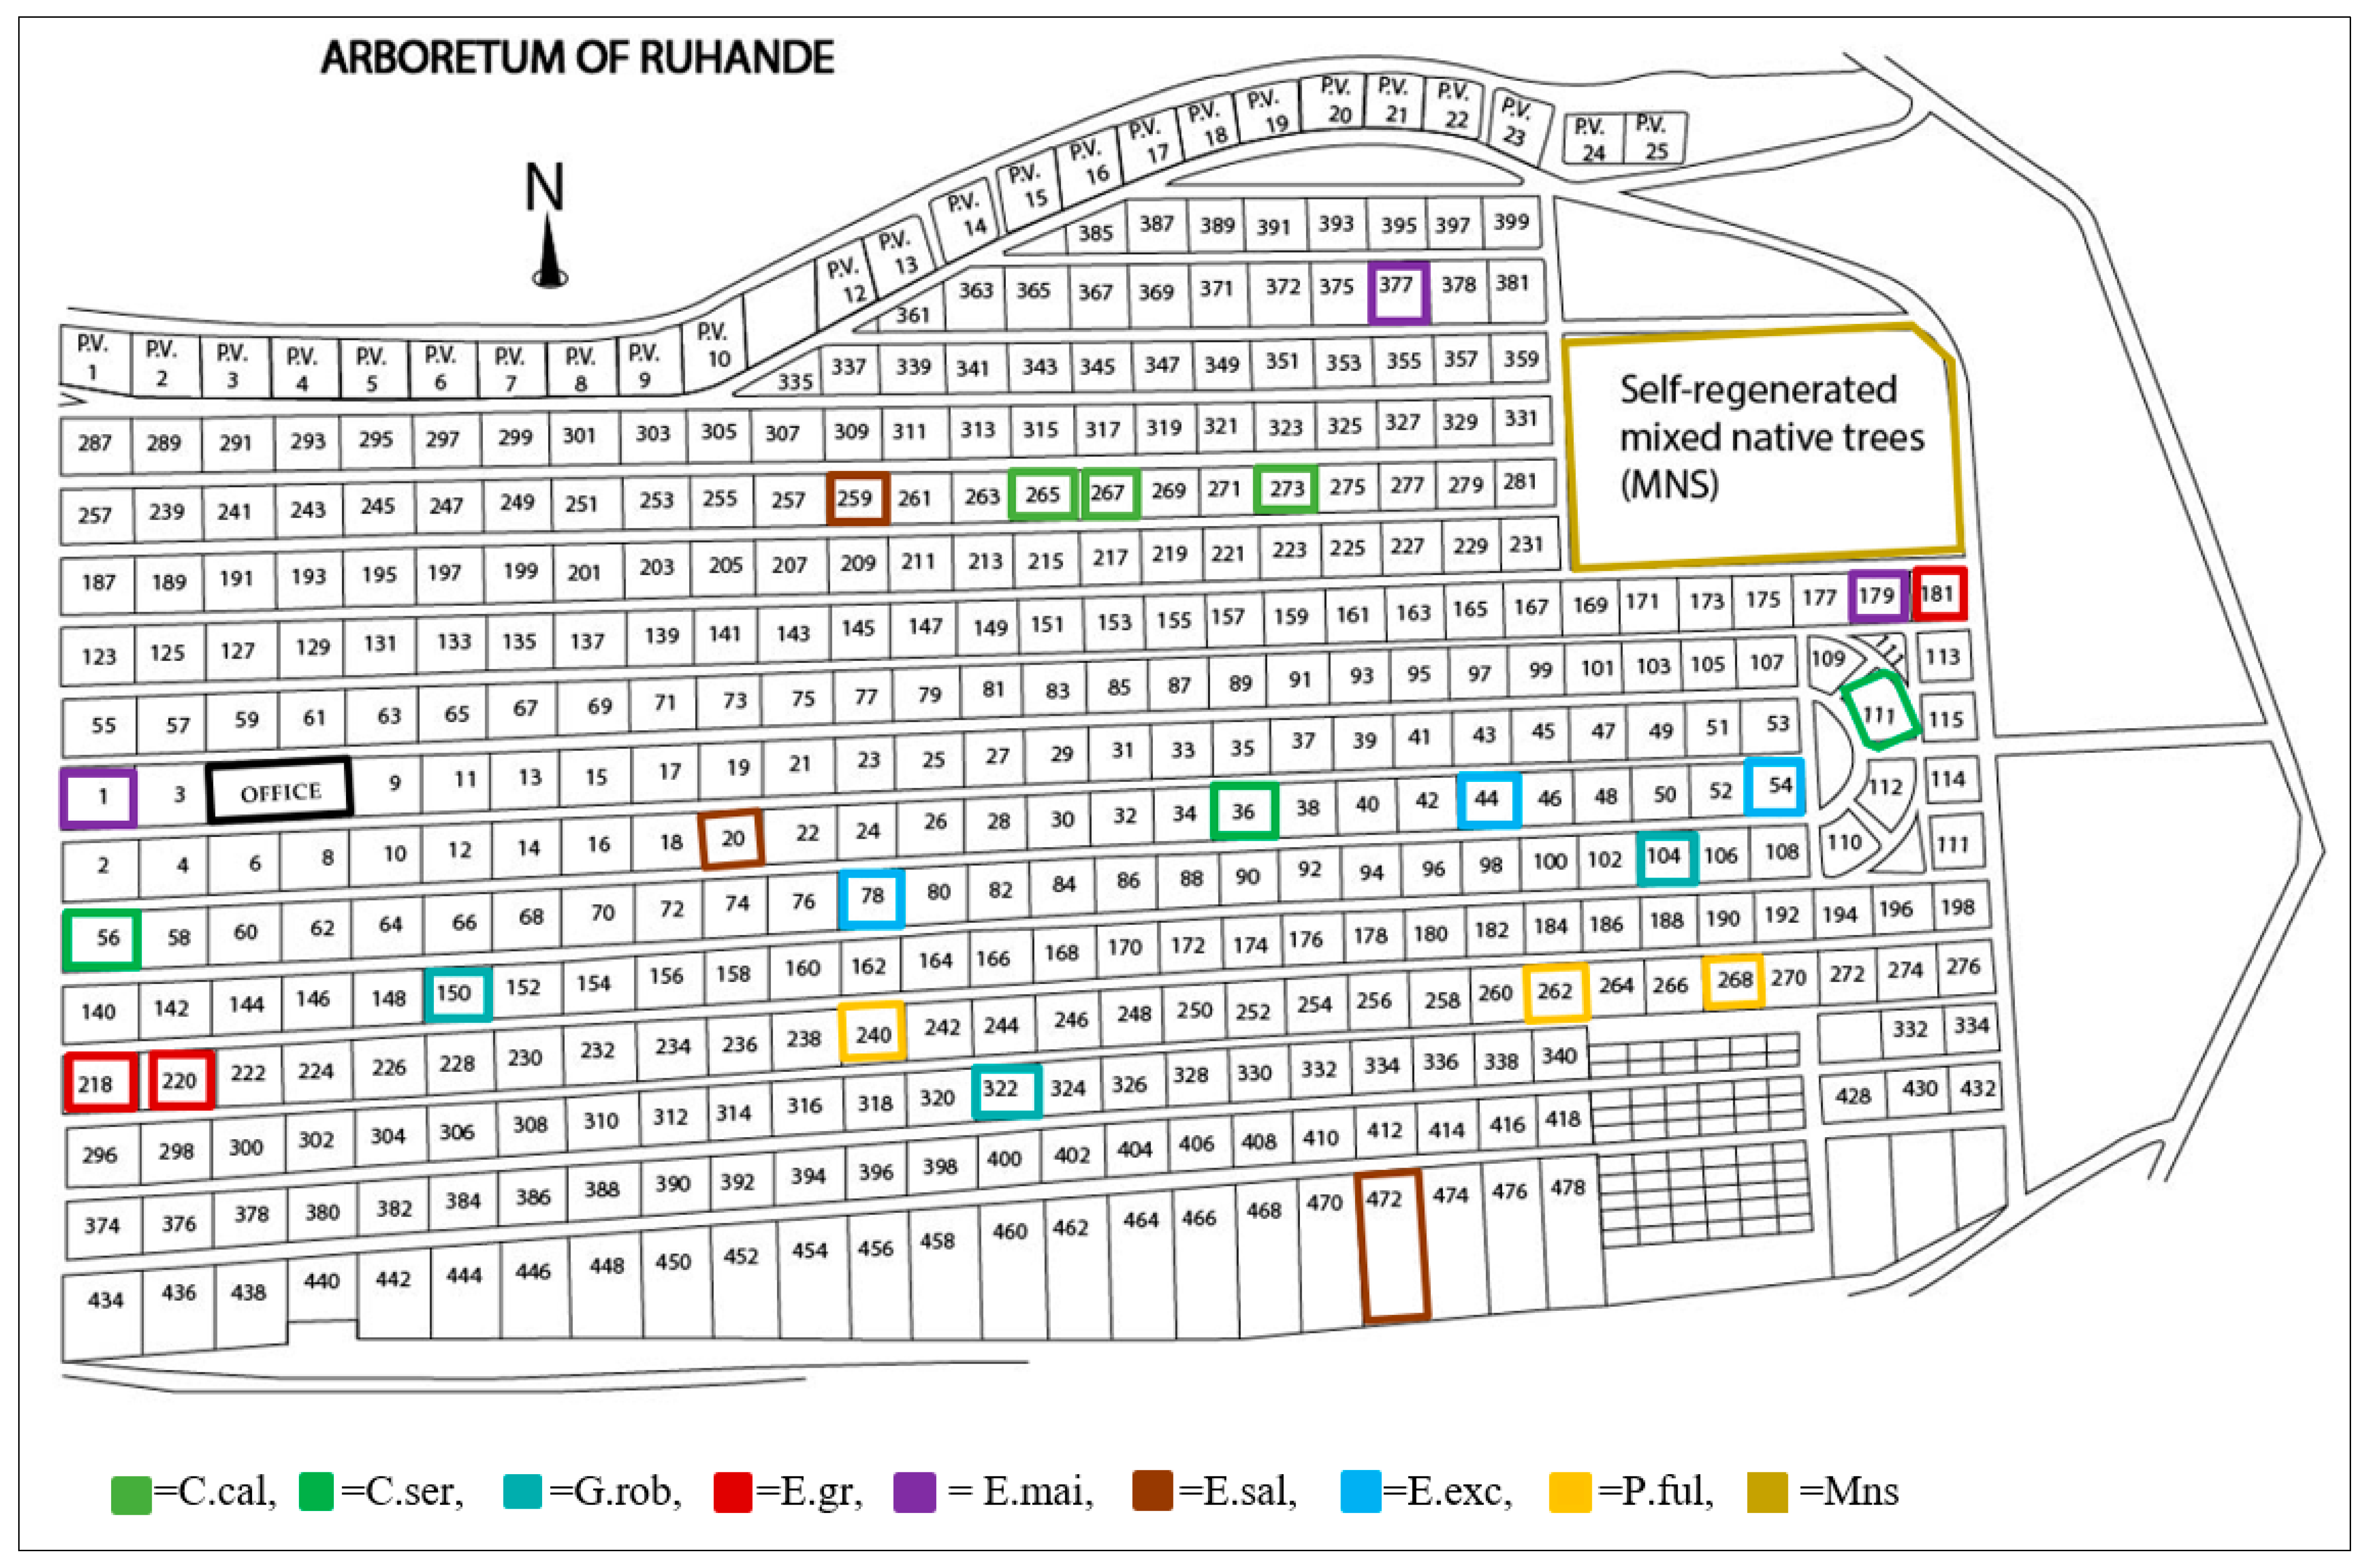
2.1. Study Site

Soils were sampled in the Arboretum of Ruhande (Southern Rwanda, 2°36′ S, 29°44′ E, Figure 1) located at 1638–1737 m elevation on a flat plateau of the Ruhande hill [44]. This site is characterized by a mean annual rainfall of 1230 mm and a temperature between 17.5 °C and 19 °C. The rainfall has a bimodal regime with irregular short rains from September to December and a short dry season (January to February), followed by a heavy rainy season from March to May and a long dry season from June to August [45]. The soil is classified as ferralsol (also known as oxisols in USDA soil taxonomy), a red-brown colored soil with a sandy loam texture and diffuse horizons [46]. It is developed from weathered Precambrian phyllite and granitic batholith parental rocks coated with a mixture of quartzites and mica schists [47,48].
The site was established in 1933 on cultivated land under the request of the colonial leaders of Rwanda-Urundi territory for forestry research, wood, and seed provision to the rest of the country [49]. The size of the arboretum was progressively increased to reach currently 200 ha with 143 hardwood tree species, including 126 introduced exotic species of which 69 are eucalyptus species and 17 are native species. It also contains 57 deciduous tree species and 3 bamboo species, of which two are native to Rwanda [44]. Trees are planted in replicated monoculture stands of 0.25 ha (50 m × 50 m), resulting in 504 numbered plots (with 454 plots of exotic species) separated by inter-plot paths 6–10 m wide (Figure 2). Thinning and removal of shrubs and other invading vegetation is performed annually on all plots, except on an undisturbed plot (4 ha) of self-regenerated mixed native species (Mns). Plots are managed to maintain a constant density of the main tree species by planting in replacement of dead plants. From the 24 selected plots (see below), six were completely re-established, but they were aged minimum 30 years at the time of this study (Table A1). Neighboring local households are allowed to collect dry wood each Friday for cooking. Given that trees were planted on the same site with similar (agricultural) land-use history and climatic conditions, we expect current differences in soil characteristics to reflect the influence of the planted tree species.
The uniqueness of Arboretum of Ruhande in terms of design, landscape, tree species composition, and presence of other living organisms lies in its multiple roles as a global site for forestry conservation, research, educational activities, and a gene bank of forestry germplasm in addition to being the country’s main source of forest planting materials [50]. This botanical garden was recently (May 2018) awarded international recognition through its enrollment into the “Queen’s Commonwealth Canopy” projects. This is a network of forest conservation initiatives within Commonwealth countries aiming at forest and biodiversity conservation for future generations [51].

2.2. Soil Sampling and Chemical Analyses

Based on the records of forestry seed demands and species adaptability in different regions of the country [53,54], eight species were selected considering three plots per species (Figure 2, Table A1). These included three eucalyptus species (Eucalyptus grandis, Eucalyptus maideni, and Eucalyptus saligna), three agroforestry species (Calliandra calothyrsus, Cedrela serrata, and Grevillea robusta), two native species (Entandrophragma excelsum and Polyscias fulva), and a self-regenerated plot of native forest (mixed native species = Mns).
Each plot was divided into two sub-plots (25 × 50 m), where soil samples were collected under the trees’ canopy at a distance of 1 to 1.5 m from the tree base [55]. One composite sample was taken in each sub-plot by mixing five soil cores (X-shaped sampling) collected using a 30 × 30 cm frame and a shovel. Samples were taken at two soil depths—0–5 cm and 5–10 cm—the most active layers in tropical forest soils with a high rate of organic matter decomposition and nutrient cycling [56]. Thus, we took two composite soil samples per plot at two soil depths. Soils were sieved fresh (4 mm) and stored at 4 °C until analyses.
Gravimetric water content, soil organic matter (SOM), and pH were determined as described by Allen et al. [57]. Briefly, moisture was calculated as the difference between fresh and oven-dried soil at 105 °C for 3 h; SOM was calculated as a weight loss from oven-dry soil after overnight ignition at 550 °C in a muffle furnace. Soil organic carbon (SOC) was estimated by dividing SOM by 1.724 (Van Bemmelen factor), assuming that organic matter contains 58% of organic carbon [58]. The pHKCL was determined in a soil solution (1:2.5 v/v) with 1 M KCl and measured using a pH meter (HI2550 Multiparameter pH Benchtop meter, HANNA® Instruments, Woonsocket, RI, USA). Soil water holding capacity (WHC) was determined using Shaw’s method according to Jenkinson and Powlson [59] as the difference between the volume of water (50 mL) added to 25 g of fresh soil and the volume drained after 30 min of saturation in addition to the initial soil moisture content.
Exchangeable cations (Al3+, Ca2+, Fe2+, K+, Mg2+, Mn2+, Na+, and Zn2+) were extracted from fresh soil with 0.1 M BaCl2 (1:5 w/v) by agitation for 30 min, followed by centrifugation at 180 rpm [60]. Chemical analysis of the filtered (Macherey Nagel MN 6151/4. Ø 150 mm, Germany) and the acidified (1% HNO3 Suprapur) BaCl2 extracts was performed using ICP-AESS (Varian, Australia). The sum of exchangeable cations (∑cations) was calculated as the sum of all measured cations, and exchangeable base cations (EBC) were calculated as the sum of Ca2+, K+, Mg2+, and Na+; expressed in c mol· kg−1.
Water-extractable C and N were determined using the method of Ghani et al. [61]. Fresh soil was extracted with distilled water (1:6, w/v), shaken (120 rpm, 30 min), centrifuged (4000 rpm, 10 min), and filtered (Whatman #42), representing water-soluble C and N (WSC, WSN) fractions. Hot water-extractable C and N (HWC, HWN) were subsequently extracted from the remaining wet soil, mixed with distilled water (30 mL), and placed in the oven for 16 h at 80 °C. Organic C in the cold (WSC) and the hot water (HWC) extracts was measured using a Total Organic Carbon analyzer (LabToc, Pollution and Process Monitoring, UK). Cold (“WS…”) and hot water-extractable (“HW…”) nitrogen forms (N-NH4: WSNH4, HWNH4; N-NO3: WSNO3, HWNO3) and total nitrogen (WSNtot, HWNtot) were measured colorimetrically using a continuous flow autoanalyzer equipped with a UV digestor (Autoanalyser3, BranLuebbe, Germany). Organic nitrogen in the extracts (WSNorg, HWNorg) was calculated as the difference between total nitrogen and mineral nitrogen. Given that most of the mineral N is extracted with cold water, and as ammonium N in hot water extracts comes from hydrolysis of organic N [62], we assumed that HWNtot was entirely deriving from organic N and thus included WSNorg, WSNtot, HWNorg, HWNtot, WSC:WSNorg, and HWC:HWNtot in our analyses.

2.3. Statistical Analysis

We used linear mixed-effects models (LMM) to investigate the differences in soil chemical properties between tree species and soil layers, using lme4 package and lmer function [63] in R, version 3.5.1 [64]. The model used “Species” (9 levels: C. calothyrsus, C. serrata, G. robusta, E. grandis, E. maideni, E. saligna, E. excelsum, P. fulva, and Mixnatives, with three replicates per species), “Layer” (with two levels: upper and lower soil layers), and the interaction between tree species and soil layer (species*layer), which were included in models as fixed effects. “Plot” was included as a random effect to account for the non-independence of the two samples collected within the same plot and the tree age differences between plots. Normality was tested using the Shapiro–Wilk test and/or visual inspection of plotted residuals. Homoscedasticity of random errors was tested using Levene test function, part of the Car package in R. Where necessary, response variables were transformed to improve normality and homoscedasticity of errors. Significance of tree species and soil layer effects were analyzed using the model’s estimated marginal means (EMMeans) function, part of the multcompView package in R, using Tukey–Kramer honestly significant difference range post-hoc test to compare all measured parameters across levels at a significant probability of α = 0.05. The prediction of response variables explained by the model was determined using a multi-model inference (MuMIn-v1.42.1) package and r.squaredGLMM function in R [65].
Pearson’s coefficient of correlation was used to determine the correlation between measured variables. Principal component analysis (PCA: using FactoMineR and ggplot2 packages) was used to describe the patterns of variation explained by soil parameters of interest (pH, SOM, EBC, WSC, WSNorg, WSNtot, WSC:WSNorg, HWC, HWNorg, HWNtot, and HWC:HWNtot) between tree species. All statistical analyses and tests were carried out using R software, version 3.5.1 [64].

3. Results

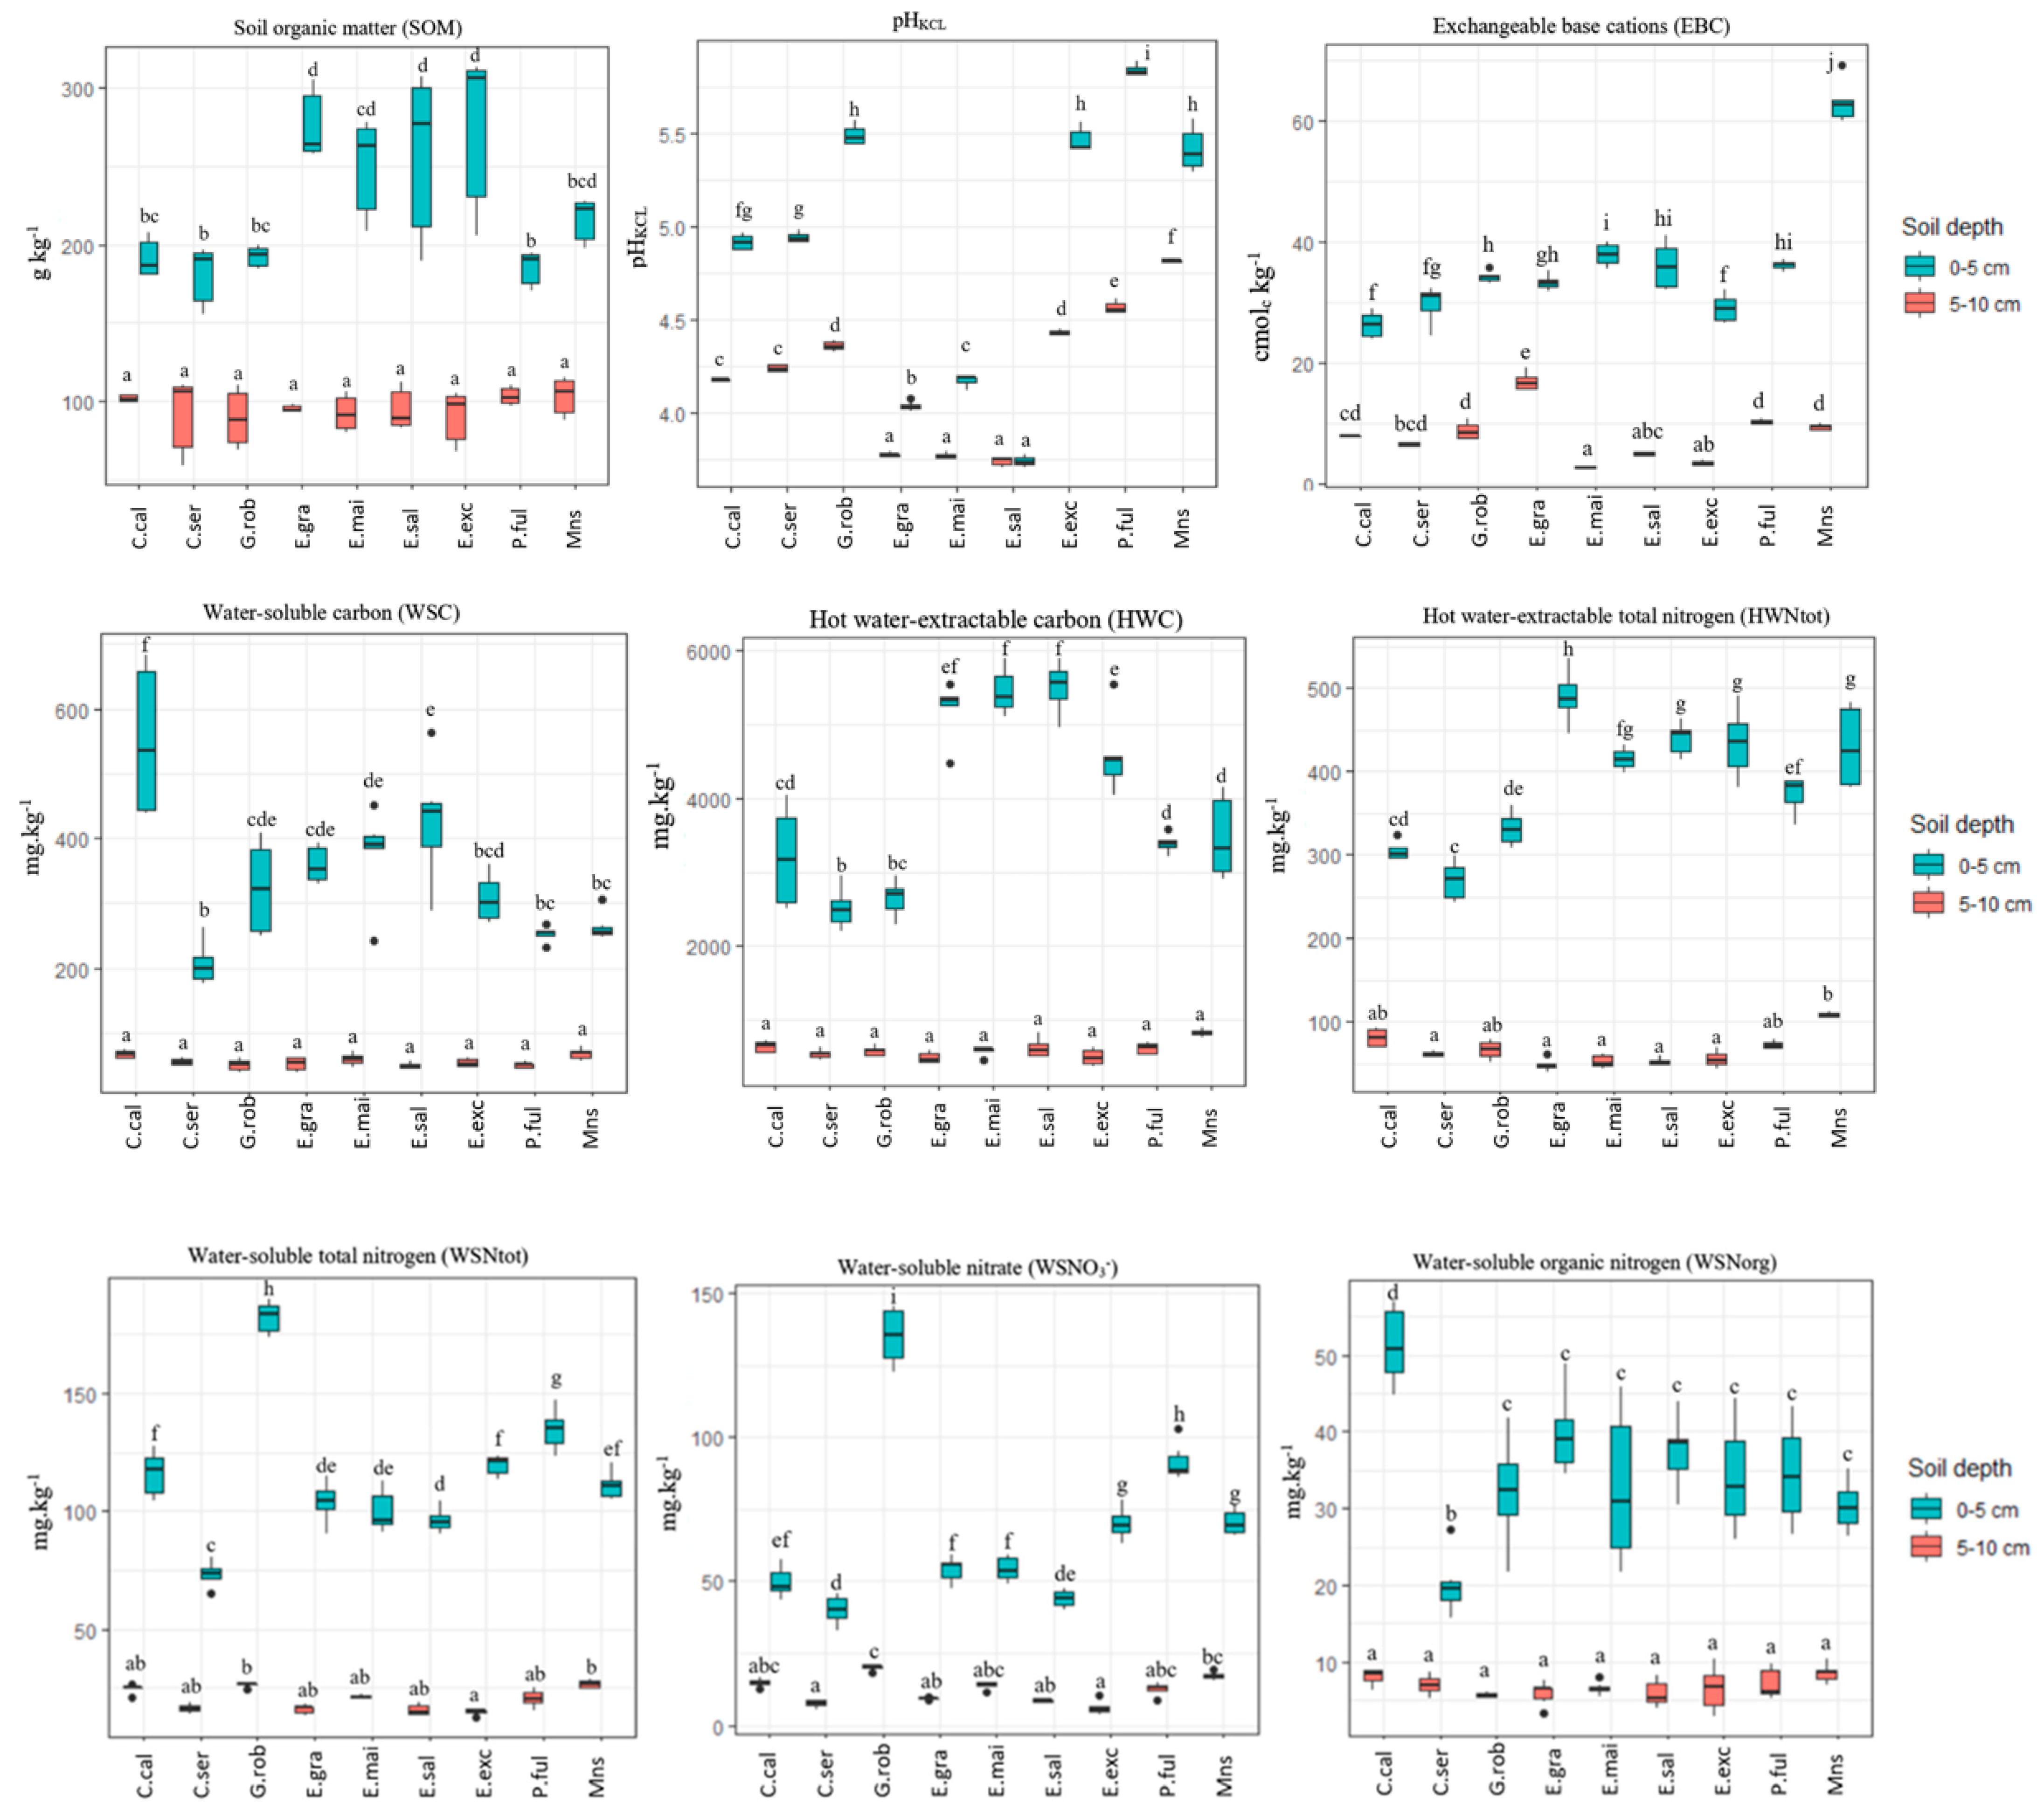
3.1. Chemical Soil Properties in Two Topsoil Layers

Values for all soil parameters (Figure 3, Table 1 and Table A2) were significantly higher in the upper (0–5 cm) soil layer compared to the lower (5–10 cm) layer under all tree species (except for Al3+, Fe2+, and Na+). pH, SOM, and EBC were 14%, 57%, and 78% higher in the upper compared to the lower soil layer (4.9, 22%, and 36.3 cmolc kg−1 versus, 4.2, 9.6%, and 7.8 cmolc kg−1, respectively). Base cations dominated the sum of exchangeable cations, representing 78% (Ca2+), 19.4% (Mg2+), and 2.3% (K+) in the upper soil layer and 65% (Ca2+), 16.5% (Mg2+), and 1.7% (K+) in the lower soil layer (Table A3). In contrast to the other soil parameters, the contribution of Al3+, Fe2+, and Na+ to the sum of exchangeable cations was less in the upper soil layer (0.002% Fe2+, 0.2% Al3+, 0.4% Na+) compared to the lower soil layer (0.1% Fe2+, 13.5% Al3+, 2% Na+).
Labile (water-soluble and hot water-extractable) carbon and nitrogen also differed between soil layers (Figure 3, Table 1 and Table A4). The amounts of water-soluble C (WSC) and hot water-extractable C (HWC) were about seven times higher in the upper than in the lower soil layer. Different components of water-extractable N also varied significantly with soil depth (Table 1). In the upper soil layer, across tree species, cold water extractable N comprised nitrate (WSNO3, 52%), ammonium (WSNH4, 13.4%), and organic nitrogen (WSNorg, 34.6%) (Table A4). In the lower soil layer, these proportions accounted for 58.4% nitrate (WSNO3), 6.7% ammonium (WSNH4), and 34.9% organic nitrogen (WSNorg). The proportions extracted by hot water also differed with soil depth where nitrate, ammonium, and organic nitrogen accounted for 3.5%, 18.7%, and 77.8%, respectively, in the upper soil layer against 3.4%, 12.6%, and 84%, respectively, in the lower soil layer (Table A4).

3.2. Effects of Tree Species on Water-Extractable C and N and Other Soil Properties

Most differences in soil properties between tree species were found in the upper 0–5 cm soil layer (Table A3; Figure 3). In this layer, pH was highest under Polyscias fulva (pHKCL = 5.8), followed by the two native species stands (Mns and Entandrophragma excelsum) and Grevillea robusta (Figure 2). Soils under Calliandra calothyrsus and Cedrela serrata had an intermediate pH (pHKCL = 4.9), while all eucalyptus species showed the lowest soil pH values (Eucalyptus saligna < Eucalyptus grandis < Eucalyptus maideni). The SOM content was significantly higher under most eucalyptus species and Entandrophragma excelsum, while it was not different between the other species.
Water-extractable labile C and N (Table 1, Figure 3) also differed under tree species. Water-soluble organic carbon (WSC) was significantly higher under Calliandra calothyrsus, followed by some eucalyptus species. Hot water-extractable carbon (HWC) showed the highest values under eucalyptus species and Entandrophragma excelsum, while values were not significantly different under the other tree species. Water-soluble total nitrogen (WSNtot) was highest under Grevillea robusta followed by native species (Entandrophragma excelsum and Polyscias fulva) and Calliandra calothyrsus with intermediate values under eucalyptus species and lowest concentration under Cedrela serrata (Figure 3).
Unlike WSNtot, hot water-extractable total nitrogen (HWNtot) showed similar differences between tree species as HWC, with the highest values under eucalyptus species and Entandrophragma excelsum and similar values under the other tree species. The highest percentage of water-soluble mineral nitrogen relative to total water-soluble nitrogen was measured under Grevillea robusta (WSNmin = 82%; WSNO3 = 73% + WSNH4 = 9%), while the lowest percentage was measured under Entandrophragma excelsum (WSNmin = 39%; WSNO3 = 12% + WSNH4 = 27%). The proportion of water-soluble organic nitrogen (WSNorg) was highest under Entandrophragma excelsum (WSNorg = 61%) and lowest under Grevillea robusta (WSNorg = 18%). The proportions of WSNorg under the other tree species ranged between 26% and 44%. In the hot water N extracts, organic nitrogen dominated fractions for all species. The highest proportion of mineral nitrogen was measured under Polyscias fulva (HWNmin, 28%; HWNO3 = 3% + HWNH4 = 25%), while the lowest proportion was measured under Eucalyptus saligna (HWNmin, 18%; HWNO3 = 3% + HWNH4 = 15%). Consequently, WSNorg was higher under Eucalyptus saligna (WSNorg = 82%) followed by Polyscias fulva (HWNorg = 72%). WSC/WSNorg ranged from 7.5 to 12, with no significant difference between tree species (Table 1).
The sum of exchangeable base cations (EBC: Ca2+, Mg2+, K+, and Na+) was significantly higher under mixed native species, followed by eucalyptus species, Polyscias fulva, and Grevillea robusta compared to Calliandra calothyrsus, Cedrela serrata, and Entandrophragma excelsum. Soil base cations such as Ca2+, Mg2+, and K+ dominated with nearly 97% of the total exchangeable cations, and they generally showed the higher concentrations under native and Eucalyptus species.
In the lower soil layer (5–10 cm), there were no significant differences between tree species for SOM, WSC, WSNorg, WSNH4, HWC, HWNH4, and HWNO3. Significant differences between species were observed for pH, EBC, ∑cations, and individual cations such as Ca2+, Mg2+, K+, and Al3+ (Table A3). There was also a significant effect of tree species for WSNtot, WSNO3, WSC/WSN, HWNtot, HWNorg, and HWC/HWNtot (Table 1). The highest pH (pHKCL = 4.8) was measured under the Mns, followed by the plot of monospecific native species and agroforestry species (Polyscias fulva > Entandrophragma excelsum = Grevillea robusta > Calliandra calothyrsus = Cedrela serrata), while the lowest pH (pHKCL = 3.7) was measured under eucalyptus species. EBC ranged from 2.8 ± 0.02 cmolckg−1 (Eucalyptus maideni) to 17 ± 0.6 cmolckg−1 (Eucalyptus grandis); this trend was similar to ∑cations, which ranged from 5.4 ± 0.07 cmolckg−1 under Eucalyptus maideni to 17 ± 0.2 cmolckg−1 under Eucalyptus grandis. Exchangeable Ca2+ was significantly higher under Eucalyptus grandis, intermediate under Mns, Polyscias fulva, Grevillea robusta, and Calliandra calothyrsus, and lower values were measured under Cedrela serrata, Eucalyptus maideni, Eucalyptus saligna, and Entandrophragma excelsum. Mg2+ was higher under Eucalyptus grandis, Polyscias fulva, and Mns, whereas the values of Mg2+ were lower under Eucalyptus maideni, Eucalyptus saligna, and Entandrophragma excelsum, with intermediate values under agroforestry species (Calliandra calothyrsus, Cedrela serrata, and Grevillea robusta). Similar to Ca2+ and Mg2+, the concentration of K+ was also significantly higher under Eucalyptus grandis and Mns but not different for the remaining tree species. There was high variability in the exchangeable Al3+ concentration between tree species in the lower soil layer. The concentration of Al3+ in the soil classified tree species in the following order: Eucalyptus maideni > Entandrophragma excelsum > Eucalyptus saligna > Cedrela serrata > Grevillea robusta = Calliandra calothyrsus > Mns > Polyscias fulva > Eucalyptus grandis.
The proportions of water-soluble nitrogen fractions in the lower soil layer (Table A4) showed that the mineral nitrogen was dominant with the highest percentage under Grevillea robusta (WSNmin = 78%; WSNO3 = 76% + WSNH4 = 2%) and the lowest percentage under Entandrophragma excelsum (WSNmin = 56%; WSNO3 = 41% + WSNH4 = 15%). The other species had WSNmin percentages ranging between 57% and 69%. The water-soluble organic nitrogen ranged between 22% (Grevillea robusta) and 44% (Entandrophragma excelsum). Hot water-extractable fractions contained mostly organic N ranging from 72% to 82% of the HWNtot and 81% to 86% in the 0–5 cm and the 5–10 cm soil layers, respectively. The hot water-extractable mineral N forms were dominated by N-NH4+ (15% to 25%) in the 0–5 cm soil layer and 10% to 17% in the 5–10 cm soil layer. The less abundant hot water-extractable mineral N fraction was N-NO3- that ranged from 2% to 5% in both 0–5 cm and 5–10 cm soil layers.

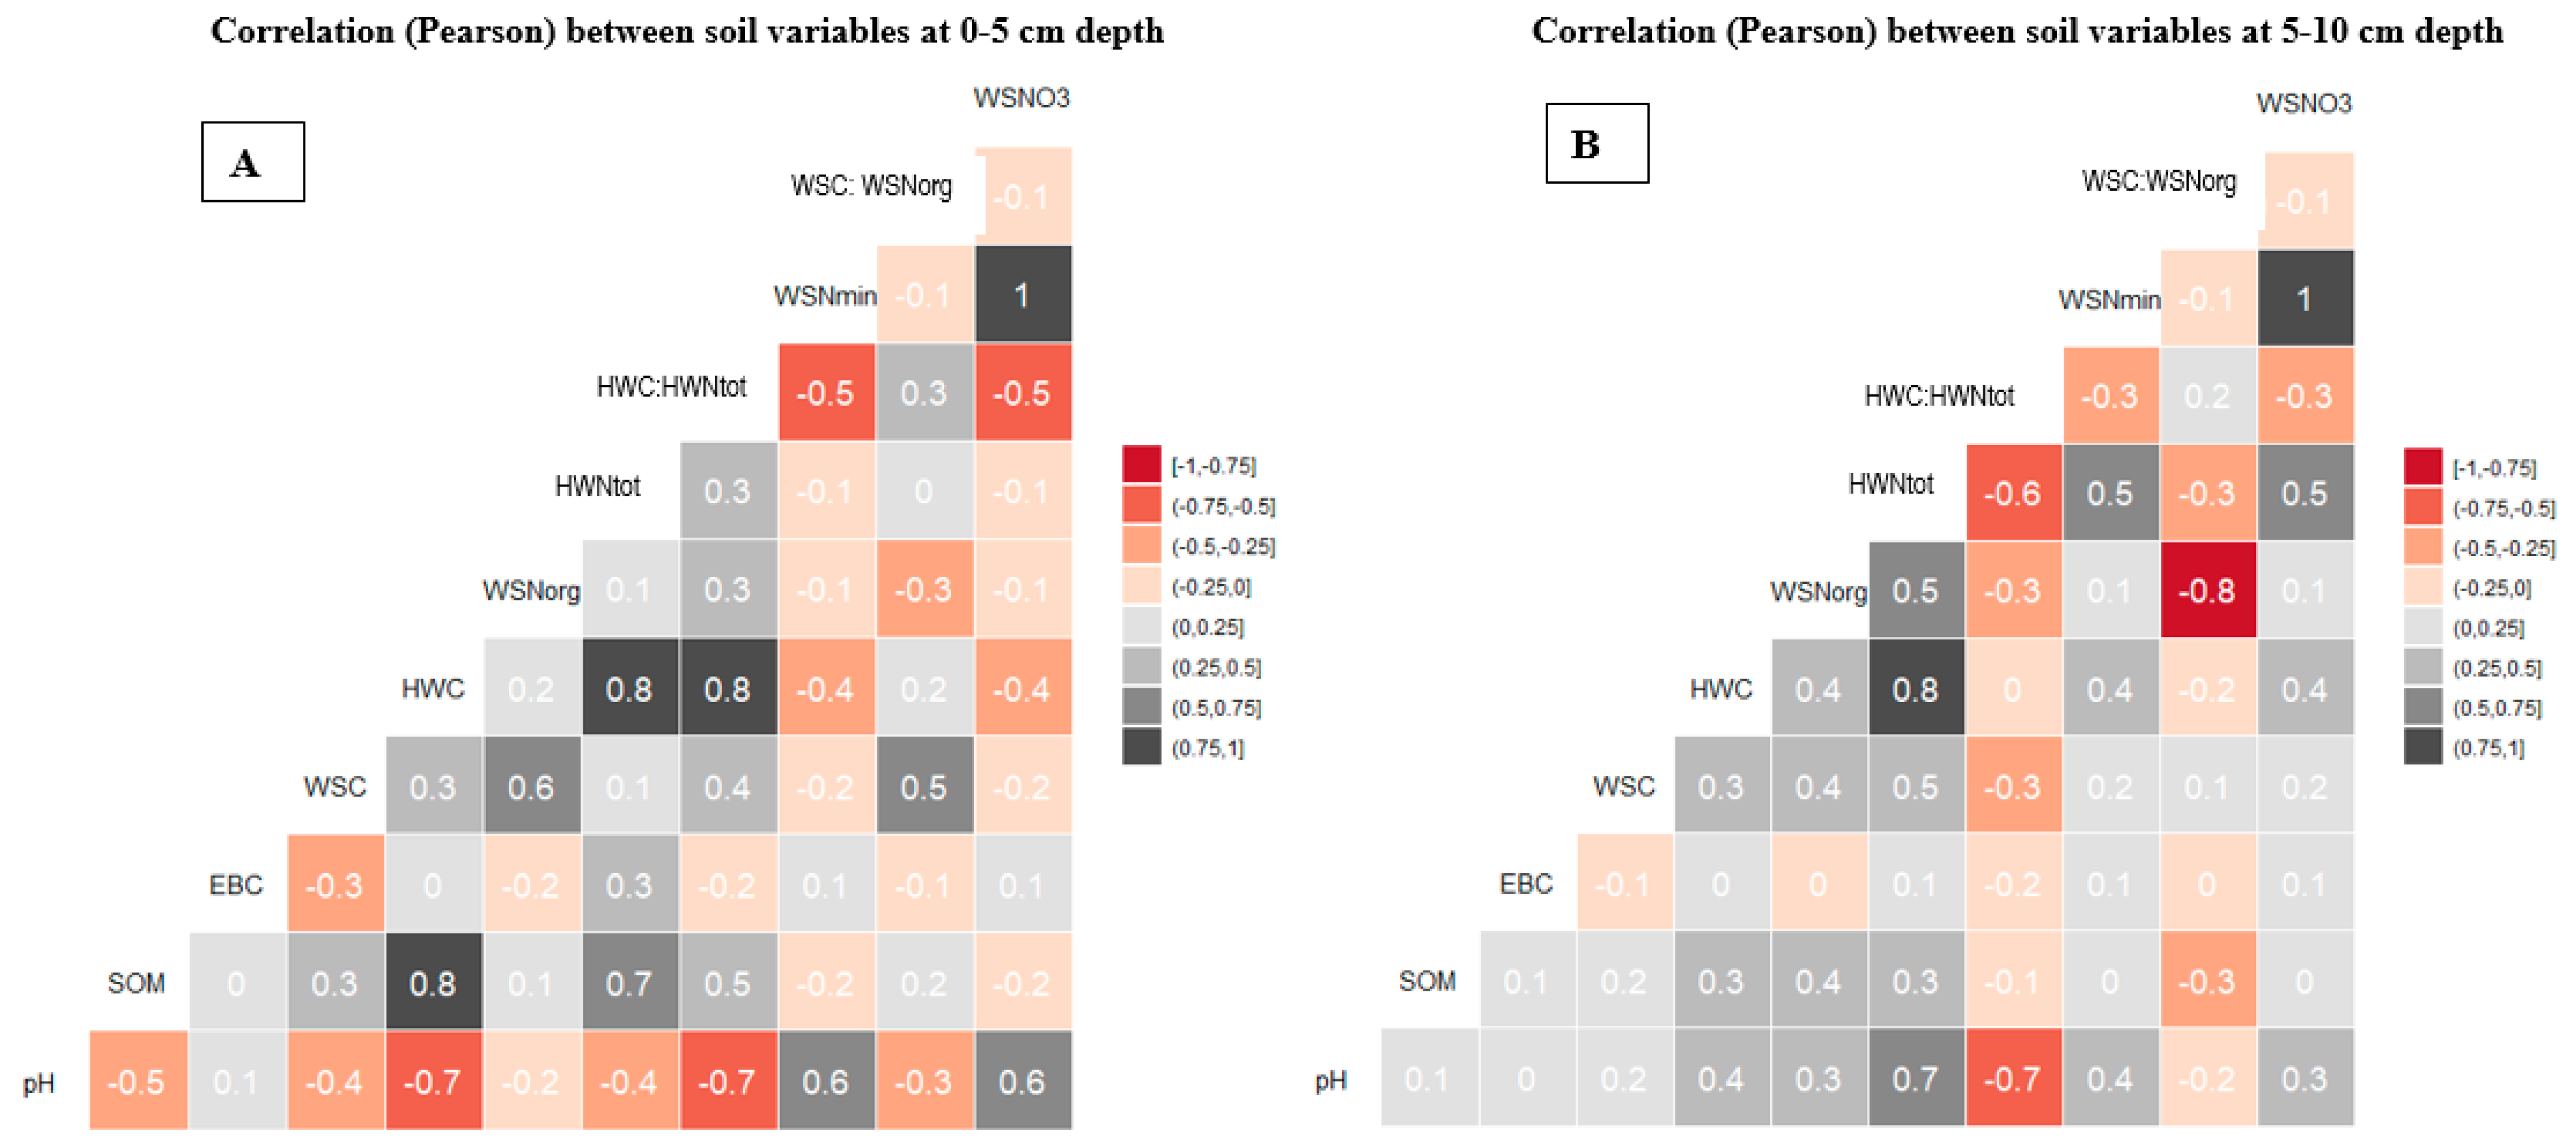
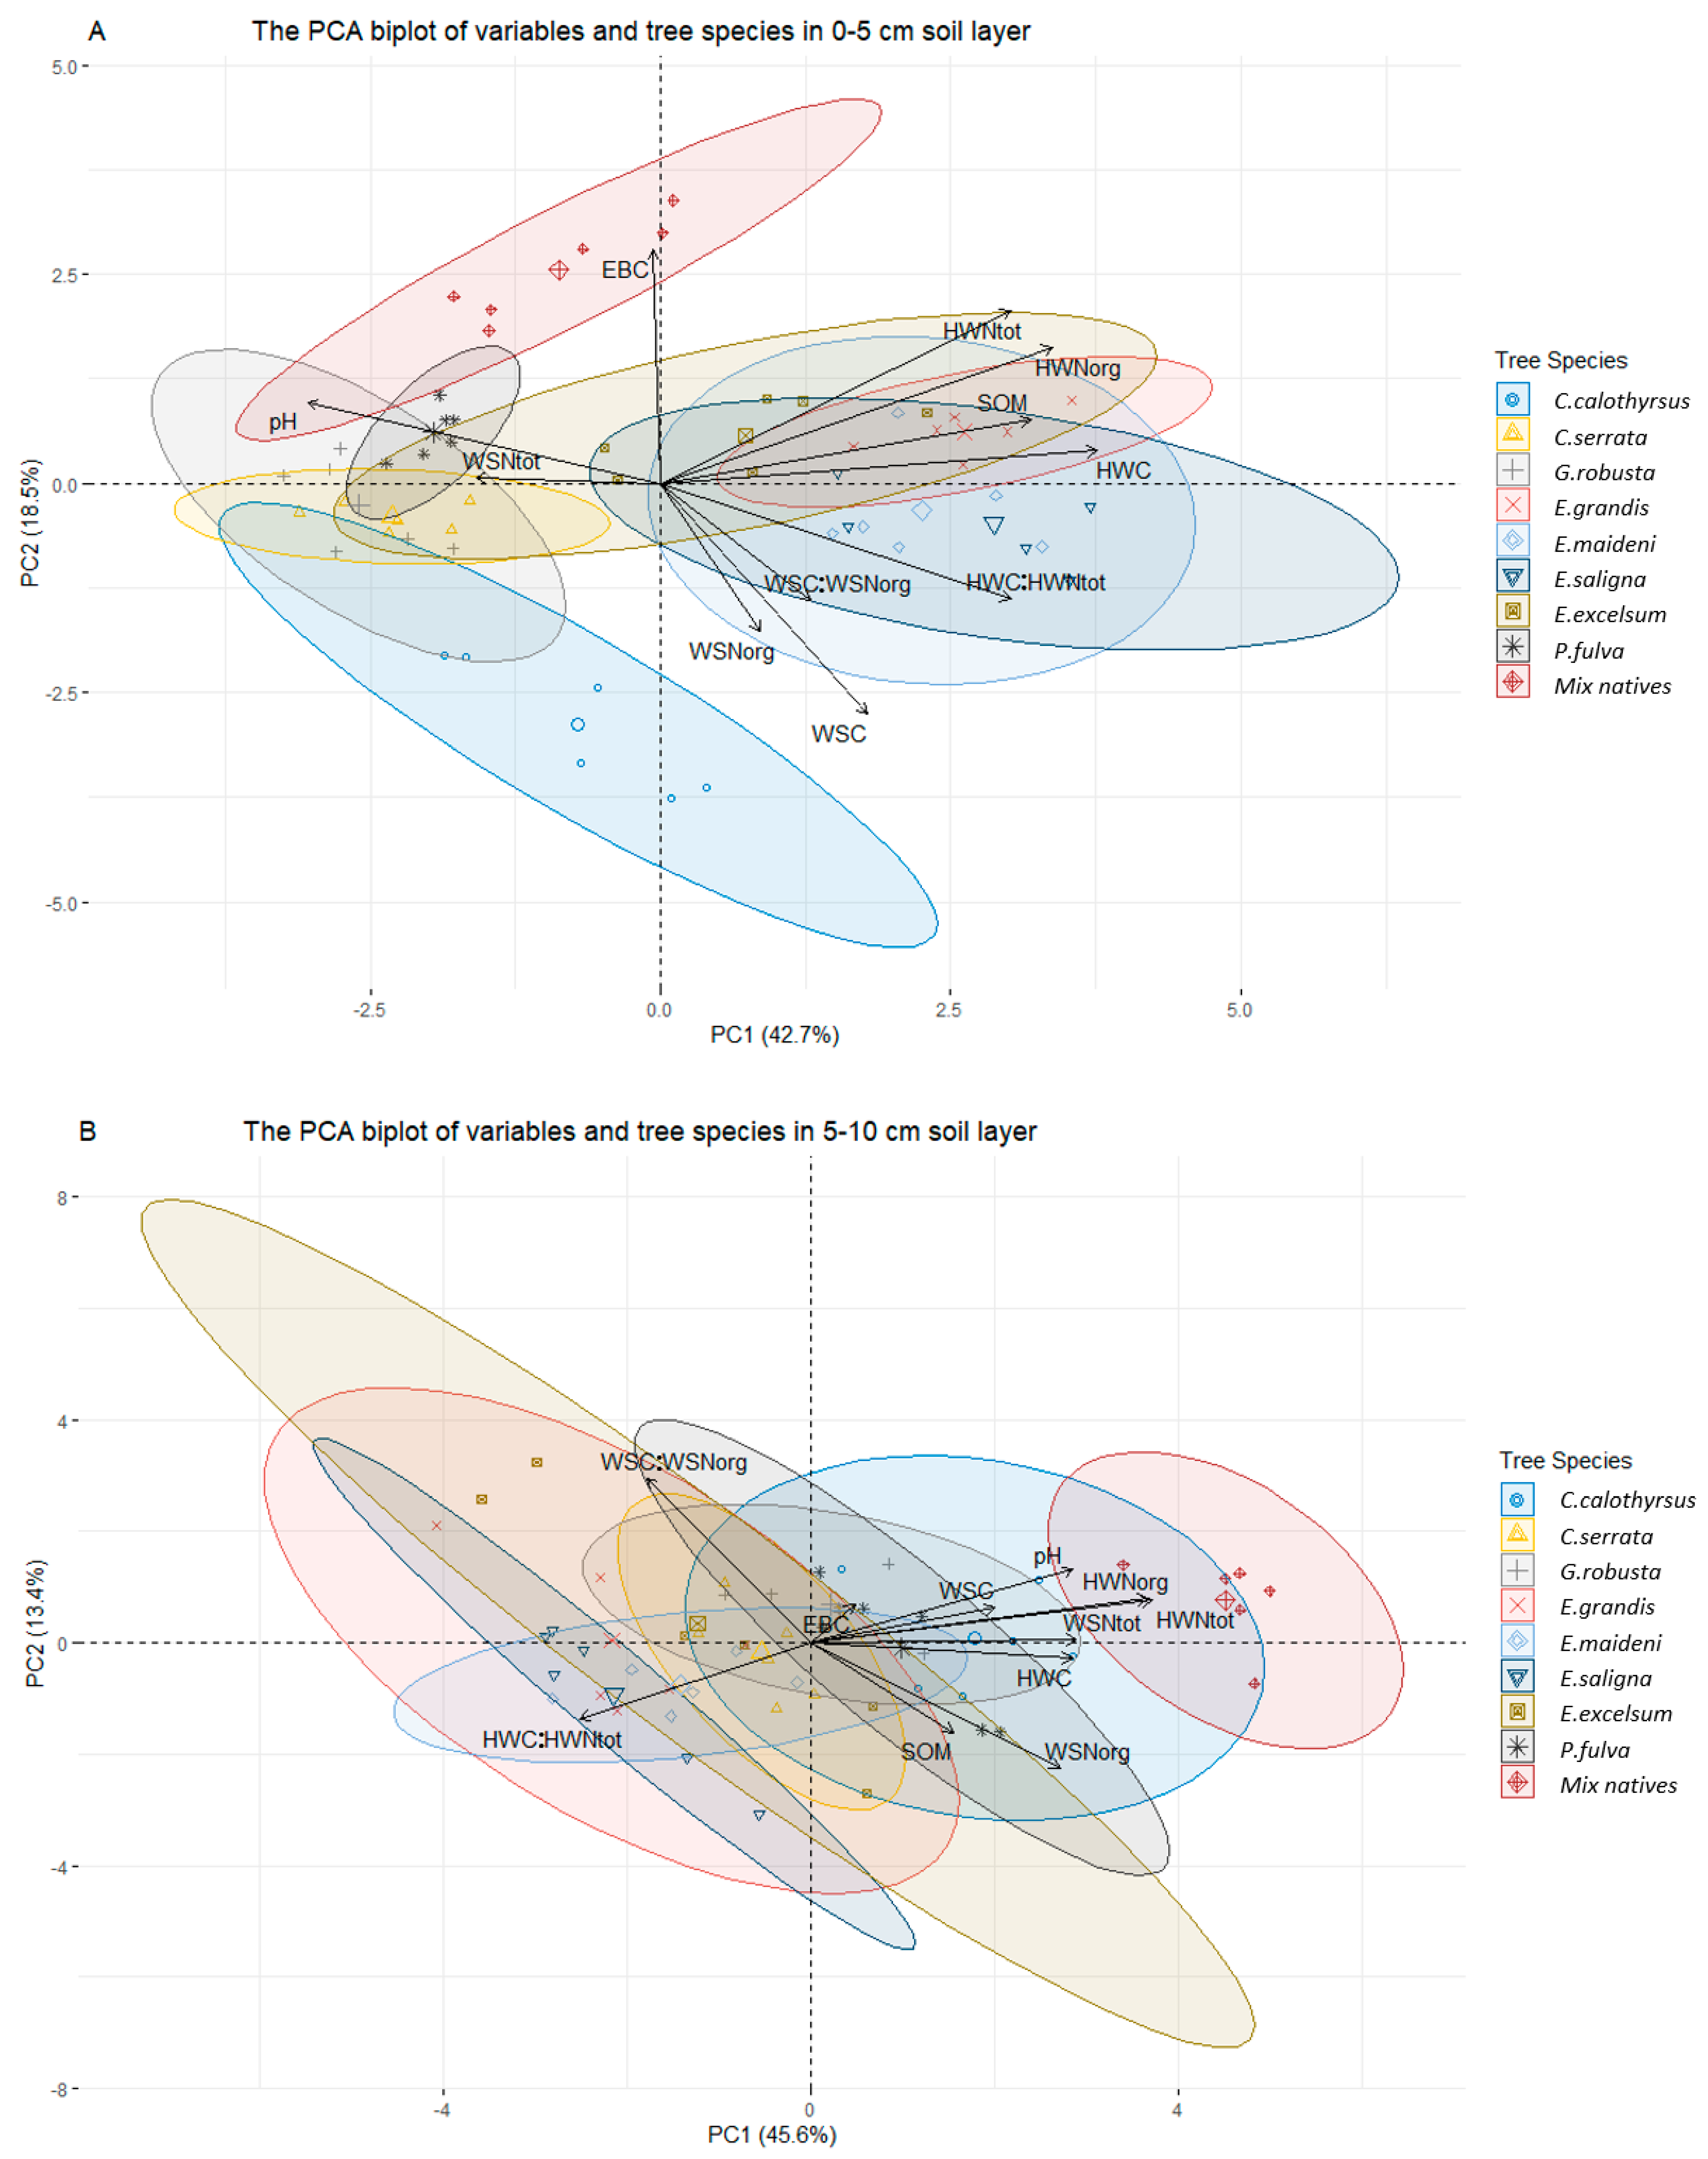
3.3. Relationships between Water-Extractable Elements (C, N) and Other Soil Properties

The correlation between soil properties (pH, SOM, and EBC) and water-extractable C and N fractions (WSC, WSNorg, WSNmin, WSNO3, WSC/Norg, HWC, HWNtot, and HWC/HWNtot) showed significant correlations within each of the two soil layers (Figure 4).
In the upper soil layer (0–5 cm), soil pH was negatively correlated with SOM, all water-soluble and hot water-extractable C and N fractions, and HWC/HWNtot, except WSNmin and WSNO3, which were positively correlated with pH (Figure 4). There was a significant positive correlation between SOM and all the above-mentioned water-extractable C and N fractions, except WSNmin and WSNO3 (r = -0.2). The strongest positive correlation was found between SOM and HWC (r = 0.8), HWNtot (r = 0.7), and HWC/HWNtot (r = 0.5). EBC showed a weak positive correlation with HWNtot and a weak negative correlation with WSC, WSNorg, and HWC/HWN; no significant correlation was found with the other water-extractable C and N fractions (Figure 4). In the lower soil layer (5–10 cm), soil pH was positively correlated with HWC, HWNtot, WSNorg, WSNmin, and WSNO3, while it was negatively correlated with HWC/HWN. The relationship patterns between SOM and water-extractable C and N fractions showed a positive correlation with HWC, HWNtot, and WSNorg, while it was negatively correlated with WSC/WSNorg. The strength of the correlation between SOM and water-extractable C and N fractions was comparatively lower compared to the upper soil layer, and there was no significant correlation between EBC and water-extractable C and N fractions (Figure 4).
Principal component analysis (PCA) of soil properties (pH, SOM, and EBC) and water-extractable C and N fractions (WSC, WSNorg, WSNtot, WSC:WSNorg, HWC, HWNorg, HWNtot, and HWC/HWNtot) for the upper and the lower soil layers showed differences in the patterns of the tree species clustering based on these soil properties (Figure 5). In the upper soil layer (0–5 cm), the total variance explained by the first two principal components was 62%. SOM, HWC, HWNorg, HWNtot, and C/N ratio of hot water extracts (HWC/HWNtot) had the highest positive loadings on PC1 (43%), while pH and WSNtot showed the highest loading to the negative side of PC1 (Figure 5A). Eucalyptus species and Entendrophragma excelsum clustered separately along with the positive side of PC1, while species such as Polyscias fulva and Grevillea robusta clustered along its negative side. EBC positively loaded highest on the second PC (19%), while WSC, WSNorg C/N ratio of water-soluble C, and organic N (WSC/WSNorg) had their negative loading to PC2. Mns plot clustered separately from the other plots along the positive side of the second axis, and Calliandra calothyrsus, Cedrela serrata, and Grevillea robusta overlapped on its negative side (Figure 5A).
In the lower soil layer (5–10 cm), the first two principal components explained 59% of the combined variation in PCA input variables between tree species (Figure 5B, Table 2). The positive loadings on PC1 (46%) were observed for pH, WSNorg, WSNtot, HWNorg, HWC, HWNtot, and EBC, while the HWC/HWNtot was highly loaded on its negative side. On the PC2 (13%), WSC/WSNorg showed a positive loading, while SOM showed a negative loading (Figure 5B, Table 2). In this soil layer, most of the tree species clustered around the center of biplot quadrants with a tendency for the plots of Mns, Polyscias fulva, Grevillea robusta, and Calliandra calothyrsus to overlap on the positive side of the PC1. Eucalyptus species overlapped with both the negative side of the PC1 and the positive side of the PC2. The clustering patterns of species such as Entandrophragma excelsum and Cedrela serrata showed a stretching of statistical ellipses across the intersection of PCA axes towards both sides of PC2.

4. Discussion

Given that trees species were planted on the same site with similar land-use history and climatic conditions, the Arboretum of Ruhande provided a unique set-up for investigating the effects of tree species used for forest plantations in Rwanda on soil chemical properties. We thus base the interpretation of the results on the assumption that the current differences in soil characteristics reflect the influence of the planted trees.

4.1. Importance of the Thin Upper Soil Layer (0–5 cm Depth)

The present study showed higher values for all analyzed soil properties in 0–5 than 5–10 cm soil layers (except for Al3+ and Fe2+), regardless of tree species, although the two soil layers were visibly indistinguishable under most species. SOM, EBC, water-soluble, and hot-water-extractable C and N were two to nine-fold higher compared to the 5–10 cm layer. This vertical distribution was particularly marked for parameters related to soil organic matter content and water-extractable C and N. The water soluble fractions represent the amount of the readily mineralizable C and N in soil [66] and have been linked to soil functions which provide nutrients for the trees. Physical protection and the preservation of soil properties and processes of this layer are therefore of utmost importance [67].
In a previous study conducted at the same site, Nsabimana et al. [44] showed that planting trees increased the levels of soil carbon, nitrogen, base saturation, and exchangeable cation pools in the upper 10 cm of the soil compared to agricultural lands in the same agroecological zone. In the present study, we observed that planted trees influenced soil fertility only in the uppermost soil layer (0–5 cm), with higher values of SOM and exchangeable base cations than the values reported by Nsabimana et al. [44] a decade before at this site and compared to those reported for other tropical forest soils [42,68].
In contrast to high Al saturation and low amounts of exchangeable cations generally characterizing highly weathered and acidic tropical soils dominated by kaolinitic clays [69], we observed that the sum of exchangeable cations was relatively high and dominated by calcium (75%), whereas aluminum represented only 3% of the sum of exchangeable cations. Similarly, high base saturation (87%) with a dominance of Ca2+ was reported at this site [44] and for other sites in the same agro-ecological zone with base saturations between 45% and 85% [70,71]. The high proportion of Ca2+ could be related to plant litter Ca content, soil pH, and the nature of clay minerals at this site. In tropical nutrient-poor soils, organic acidity is promoted by plants (and soil microorganisms) through the production and the release of organic acids into the soil solution as a “nutrient acquisition strategy” [72]. This may lead to an exchange acidity dominated by protons, allowing for high base saturation events at certain pH values [73]. Further, the presence of interstratified kaolinite-smectite, as reported for soils from some subtropical and tropical climates [74,75], may explain the relatively high exchange capacity measured in this study.

4.2. Effects of Tree Species on Chemical Soil Properties

Tree species effects were mostly observed in the upper soil layer (except for Al and Fe). This may indicate that the changes in aboveground litter quality and quantity, rather than mineral weathering and root exudation, most likely influenced soil chemical properties. In contrast to Bauters et al. [42], who found a significant effect of tree species on soil pH and carbon content until about 30 cm deep in tropical forest plantations, our results highlighted the importance of this thin uppermost 0–5 cm layer in these highly weathered tropical forest soils.
Planting trees is one of the key strategies for restoring degraded forests and soils, especially in tropical soils with inherently poor chemical properties [76]. In our study, the pH under eucalyptus species was 0.6 pH units lower than under exotic agroforestry species (Calliandra calothyrsus, Cedrela serrata, and Grevillea robusta) and 1.7 pH units lower than under native species (Entandrophragma excelsum, Polyscias fulva, and self-regenerated mixed natives) in the upper layer. Soil acidification under eucalyptus species was reported in previous studies conducted at this site [44], in forest plantations near this site [77], and in other tropical [78,79] and non-tropical regions [80]. The relatively higher concentrations of exchangeable Al3+ and Fe2+ measured in soils under Eucalyptus saligna and Eucalyptus grandis compared to other species in this study could be related to the acidifying effect of these species, leading to Al3+ and Fe2+ release [42] with potential toxic effects for plant roots [72]. Two main mechanisms were suggested for the effects of tree species on soil pH: (1) input of organic acids from litter decomposition and root exudates, (2) increased proton release in the soil to compensate for the high plant uptake and storage of base cations [18,81]. We measured higher pH and exchangeable base cations under mixed native species (Mns) plots compared to other plots. The Mns plots were characterized by high tree density and vegetation diversity dominated by mature native trees accompanied by shrubs and grasses. All species together might have contributed to high quality and quantity of litter as a natural regeneration setup [82] compared to other adjacent monoculture plots. Therefore, we suggest that soil pH, SOM content, water-extractable C and N, and exchangeable cations were likely influenced by the species-specific litter chemical quality.
In the upper soil layer, the clear grouping by tree species and high loadings of variables such as SOM, pH, and hot water-extractable C and N fractions (HWC, HWNorg, HWNtot, and HWC:HWNtot) on the first principal component (PC1 = 43%) may indicate that these properties were the most influential set of variables in explaining the variation between species. A previous study [44] associated eucalyptus plantations with soil organic matter accumulation and decreased pH. This is in line with our PCA results, where the first PC representing soil organic matter-related properties and pH were associated with a cluster of eucalyptus species (E. grandis, E. maideni, and E. saligna). The high loadings of pH and WSNtot associated with Grevillea robusta, Polyscias fulva, and mixed native species indicate increased soil pH and N availability under these species. The second set of influential variables included EBC, WSC, and WSNorg loading high on the second principal component (PC2, 18.5%). As described by Ahmed et al. [83], these variables represent the quality and the bioavailability of mineralizable organic matter and related nutrient cycling processes. The high positive loading of EBC associated with Mns plots may be due to the capacity of this undisturbed self-regenerated native forest containing highly dense and diverse vegetation (trees, shrubs, and grasses) for improving soil chemical quality in terms of nutrients cycling. The observed relationship of water-soluble C and organic N (WSC and WSNorg) with Calliandra calothyrsus may be due to the characteristics of this plant used in agroforestry as an N-fixing tree [84].
In the 5–10 cm soil layer, the two axes of the PCA explained 59% of the variation between tree species. Calliandra calothyrsus and Mns plots grouping was explained by pH, WSNorg, WSNtot, HWC, HWNorg, HWNtot, and HWC:HWNtot (PC1, 46%). The remaining species overlapped around the center of the biplot, indicating the lack of species influence on selected soil variables. The multivariate analysis of covariation between chemical properties and tree species in this study suggests that the influence of tree species is mainly limited to the upper soil layer (0–5 cm). This first principal component could be interpreted as a measurement of soil acidity and bioavailability of hot water-extractable C and N fractions, reflecting the quality of SOM and its mineralization process in this soil layer. The results from the present study allowed us to consider this upper layer as a highly sensitive layer to vegetation changes in this tropical forest ecosystem.

4.3. Differences in Water-Extractable C and N between Tree Species

Soil organic matter has been used for many years as one of the major indicators of soil quality, given its important role in controlling soil chemistry as well as physical and biological processes [85]. However, it may take many decades to detect a change in the total soil organic C pool, given its slow rate of change [86]. Water-soluble and hot water-extractable C and N analyzed in this study are labile components of soil organic matter that could reflect early changes in soil–plant interactions [87]. Water-soluble fractions contain dissolved organic components almost similar to those measured directly in the soil solution using lysimeters and suction devices [88]. Hot water-extractable fractions consist of an easily decomposable pool of SOM, including microbial biomass, that serves as the source of energy and substrate to soil microorganisms, and its decomposition provides nutrients to plants [61,86]. This implies that labile fractions of SOM, especially those extracted with hot water, might be used as a proxy for soil microbial biomass and activity [28,61]. The influence of tree species on soil function, as represented by water-soluble and hot water-extractable C and N, was observable through the discrimination of tree species and also through the correlation of these fractions with other soil properties. These fractions are closely related to the decomposability of the plant’s detritus, which is influenced by the litter chemistry [89] and might thus be used as a proxy for soil functioning [28]. Labile C and N fractions were significantly correlated to SOM, EBC, and pH in both upper and lower soil layers, and correlation between HWC and soil organic matter was greater than that for WSC, as also observed by Ghani et al. [61]. While the mineralizable organic N decreased with soil depth, nitrates increased with soil depth. This is likely due to water solubility and leaching of nitrates towards the lower soil horizons [90] and the fact that water-soluble and hot water-extractable C and N fractions originate mainly from above-ground litter rather than root exudates [91]. The dominance of organic N compared to other nitrogen forms may be explained by the fact that most of the mineral N was already extracted by the previous cold water extraction. Hot water (80 °C) extracts the organic matter not only from decomposing plant litter but also from soil microorganisms [92].

5. Conclusions

The present study was conducted to evaluate the effects of forest tree species on chemical soil quality in Rwanda. The most important changes in soil pH, SOM, water-extractable labile C and N fractions, and base cations were observed in the thin upper soil layer (0–5 cm) across tree species, which made it possible to recognize the importance of this thin upper soil layer for soil fertility. Eucalyptus species led to soil acidification while soil pH and nutrients increased under native species (Entandrophragma excelsum and Polyschias fulva) and Mns plots. Hot water-extractable C and N fractions strongly correlated with most of the analyzed soil parameters and were more sensitive in discriminating tree species effects than other soil properties analyzed. This reflects the suitability of this methodological approach for detecting subtle changes that might be linked to forest trees and its potential to be used as a proxy to SOM analysis. In selecting forest trees, priority should be given to the species which do not negatively alter chemical soil quality.

Author Contributions

Conceptualization, P.R., F.X.N., D.N. and M.C.; Data curation, P.R.; Formal analysis, P.R.; Funding acquisition, D.N. and M.C.; Investigation, P.R.; Methodology, P.R. and M.C.; Project administration, M.C.; Resources, M.C.; Software, P.R.; Supervision, F.X.N., D.N. and M.C.; Validation, M.C.; Visualization, P.R.; Writing—original draft, P.R., M.C.; Writing—review & editing, P.R., F.X.N., D.N. and M.C. All authors have read and agreed to the published version of the manuscript.

Funding

This research was funded by UR-ARES Project, a partnership project between the University of Rwanda and the Académie de Recherche et Enseignement Supérieur (ARES, Belgium Fédération Wallonie-Bruxelles).

Institutional Review Board Statement

Not applicable.

Informed Consent Statement

Not applicable.

Data Availability Statement

The data that support the findings of this study are available on request from the corresponding authors (P.R. and M.C.)

Acknowledgments

The authors are very thankful to the staff of the Laboratory of Plant and Microbial Ecology (ULiège) for scientific and technical support: B. Bosman, A. Degueldre, M.C. Requier, and A. Tahiri. We would like also to thank the Rwanda Forestry Authority (RFA) and the staff of the Arboretum of Ruhande for their support during soil sampling.

Conflicts of Interest

The authors declare no conflict of interest.

Appendix A

Table A1. Selected study plots in the Arboretum of Ruhande, Rwanda. (Rwibasira et al., Long-term effect of forest plantation species on soil chemical properties in Southern Rwanda).
Plot IDSpeciesNative/ExoticLatitudeLongitudeElevation Age in 2016 (Years)
Plot273Calliandra calothyrsus (C. cal)Exotic02°36′69″ S 29°45′30″ E 1722 m31
Plot265Calliandra calothyrsus (C. cal)Exotic02°36′71″ S 29°45′18″ E 1713 m31
Plot267Calliandra calothyrsus (C. cal)Exotic02°36′72″ S 29°45′21″ E 1714 m31
Plot56Cedrela serrata (C. ser)Exotic02°36′94″ S 29°44′79″ E 1713 m70
Plot111Cedrela serrata (C. ser)Exotic02°36′75″ S 29°45′60″ E 1709 m79
Plot36Cedrela serrata (C. ser)Exotic02°36′83″ S 29°45′30″ E1730 m73
Plot150Grevillea robusta (G. rob)Exotic02°36′97″ S 29°44′96″ E1713 m75
Plot322Grevillea robusta (G. rob)Exotic02°36′94″ S 29°45′19″ E 1709 m69
Plot104Grevillea robusta (G. rob)Exotic02º36.84 S 29º45.51 E 1720 m35
Plot218Eucalyptus grandis (E. gr)Exotic02°37′03″ S 29°44′83″ E 1707 m70
Plot220Eucalyptus grandis (E. gr)Exotic02°37′05″ S 29°44′86″ E 1706 m65
Plot181Eucalyptus grandis (E. gr)Exotic02°36′65″ S 29°45′64″ E 1680 m65
Plot179Eucalyptus maideni (E. mai)Exotic02°36′66″ S 29°45′61″ E 1685 m70
Plot377Eucalyptus maideni (E. mai)Exotic02°36′59″ S 29°45′32″ E 1695 m82
Plot1Eucalyptus maideni (E. mai)Exotic02°36′89″ S 29°44′78″ E 1732 m67
Plot472Eucalyptus saligna (E. sal)Exotic02°37′01″ S 29°45′12″ E 1710 m82
Plot259Eucalyptus saligna (E. sal)Exotic02°36′93″ S 29°45′38″ E 1709 m36
Plot20Eucalyptus saligna (E. sal)Exotic02°36′89″ S 29°45′06″ E 1729 m59
Plot78Entandrophragma excelsum (E. exc)Native02°36′90″ S 29°45′12″ E 1727 m67
Plot44Entandrophragma excelsum (E. exc)Native02°36′81″ S 29°45′42″ E 1727 m64
Plot54Entandrophragma excelsum (E. exc)Native02°36′78″ S 29°45′57″ E 1718 m45
Plot240Polyscias fulva (P. ful)Native02°36′96″ S 29°45′15″ E 1714 m80
Plot262Polyscias fulva (P. ful)Native02°36′91″ S 29°45′46″ E 1695 m80
Plot268Polyscias fulva (P. ful)Native02°36′88″ S 29°45′54″ E 1693 m80
MNS1Mix natives species (Mns)Native02°36′65″ S 29°44′65″ E 1700 m83
MNS1Mix natives species (Mns)Native02°36′68″ S 29°45′51″ E 1692 m83
MNS3Mix natives species (Mns)Native02°36′59″ S 29°45′63″ E 1680 m83
Table A2. Descriptive statistics of soil parameters for two soil layers (0–5 cm and 5–10 cm) across all samples (two samples per plot, eight tree species, one mixed plot) (Rwibasira et al., Long-term effect of forest plantation species on soil chemical properties in Southern Rwanda).
Soil ParametersLayer NMeanSDMedianMinMaxSkewKurtosisSE
pHKCL0–5 cm 544.890.714.963.715.89−0.33−1.380.1
5–10 cm 544.210.364.243.714.830.04−1.250.05
SOM (%)0–5 cm 5422.494.7120.5515.5331.320.63−1.030.64
5–10 cm 549.61.49.875.9311.56−0.950.210.19
SOC (gkg−1)0–5 cm 54130.427.31119.290.1181.660.63−1.043.72
5–10 cm 5455.678.1357.2234.4167.06−0.940.21.11
WSC (mgkg−1)0–5 cm 54340.8115.1323175.2683.51.11.0515.6
5–10 cm 5456.319.4155.939.7778.740.36−0.611.28
WSNO3 (mgkg−1)0–5 cm 5467.728.8258.1332.77145.641.340.933.92
5–10 cm 5412.314.6812.33.9320.820.18−1.070.64
WSNH4 (mgkg−1)0–5 cm 5412.852.9712.977.6218.34−0.12−1.280.4
5–10 cm 541.230.670.950.472.90.96−0.220.09
WSNorg (mgkg−1)0–5 cm 5434.739.7434.4115.8457.020.22−0.511.32
5–10 cm 546.851.746.562.9910.420.03−0.480.24
WSNmin (mgkg−1)0–5 cm 5480.5429.0770.6545.01162.931.471.383.96
5–10 cm 5413.544.3413.45.5321.330.22−1.20.59
WSNtot (mgkg−1)0–5 cm 54115.229.68111.265.1190.10.970.634.04
5–10 cm 5420.394.8620.3812.8628.780.1−1.480.66
WSC/WSNorg0–5 cm 5410.072.869.285.8918.791.131.330.39
5–10 cm 548.662.218.434.6115.50.961.550.3
WSC/WSNtot0–5 cm 543.111.22.711.346.390.860.190.16
5–10 cm 542.880.662.871.54.430.02−0.630.09
HWC (mgkg−1)0–5 cm 543994.61201.23904.72203.45893.40.11−1.51163.4
5–10 cm 54603.43119.8601.8382.16888.070.48−0.3316.31
HWNO3 (mgkg−1)0–5 cm 5414.134.8614.114.5723.36-0.03−0.790.66
5–10 cm 542.220.852.010.833.920.32−0.940.12
HWNH4 (mgkg−1)0–5 cm 5471.718.671.0537.07104.15-0.01−0.952.53
5–10 cm 548.353.157.974.1814.970.5−0.910.43
HWNorg (mgkg−1)0–5 cm 54301.6462.12294.93194.96440.040.18−1.28.45
5–10 cm 5455.4416.4553.0331.9495.430.9−0.042.24
HWNtot (mgkg−1)0–5 cm 54387.4773.9388.71242.65536.49−0.1−110.06
5–10 cm 5466.0119.3661.4740.02111.710.9−0.012.63
HWC/HWNorg0–5 cm 5413.082.1212.6410.0817.60.37−1.140.29
5–10 cm 5411.32.1510.938.5217.220.860.030.29
HWC/HWNtot0–5 cm 5410.21.919.857.4513.770.34−1.260.26
5–10 cm 549.481.849.167.0114.210.890.090.25
Al3+ (cmolc kg−1)0–5 cm 540.060.050.040.000.160.93−0.310.01
5–10 cm 541.220.90.940.012.820.38−1.370.12
Ca2+ (cmolc kg−1)0–5 cm 5428.57.8927.2717.3952.91.421.741.07
5–10 cm 545.973.555.971.5416.61.020.810.48
Fe2+ (cmolc kg−1)0–5 cm 540.000.000.000.000.011.220.890.00
5–10 cm 540.010.030.000.000.256.9346.940.00
K+ (cmolc kg−1)0–5 cm 540.610.170.570.310.960.29−0.940.02
5–10 cm 540.210.140.150.080.561.470.810.02
Mg2+ (cmolc kg−1)0–5 cm 546.92.875.674.4515.171.741.940.39
5–10 cm 541.510.551.490.672.340.05−1.420.07
Mn2+ (cmolc kg−1)0–5 cm 540.090.070.060.020.291.220.680.01
5–10 cm 540.010.010.010.000.030.35−0.880.00
Na+ (cmolc kg−1)0–5 cm 540.150.060.140.070.280.32−1.160.01
5–10 cm 540.180.030.190.090.24-0.740.860.00
Zn2+ (cmolc kg−1)0–5 cm 540.000.000.000.000.001.080.570.00
5–10 cm 540.000.000.000.000.000.96−0.280.00
EBC (cmolc kg−1)0–5 cm 5436.1610.4633.9623.9869.181.752.391.42
5–10 cm 547.874.17.752.7119.270.880.390.56
∑cations (cmolc kg−1)0–5 cm 5436.3110.4134.0724.3269.241.772.421.42
5–10 cm 549.113.318.625.0819.311.291.330.45
Table A3. Measured soil characteristics under different tree species in the Arboretum of Ruhande (means ± SEM). Different letters within one parameter denote significant differences between tree species and soil depths (mixed linear models, Tukey’s HSD, p < 0.05 (Rwibasira et al., Long-term effect of forest plantation species on soil chemical properties in Southern Rwanda).
Soil ParametersLayer (cm)Calliandra
calothyrsus
Cedrela
serrata
Grevillea robustaEucalyptus grandisEucalyptus maideniEucalyptus salignaEntandrophragma excelsumPolyscias
fulva
Mixed
natives
pHKCl 0–54.9 ± 0.01 fg4.9 ± 0.01 fg5.5 ± 0.02 h4.0 ± 0.01 b4.2 ± 0.01 c3.7 ± 0.01 a5.5 ± 0.02 h5.8 ± 0.01 i5.4 ± 0.04 h
5–104.2 ± 0.0 c4.2 ± 0.0 c4.4 ± 0.0 d3.8 ± 0.0 a3.8 ± 0.0 a3.7 ± 0.0 a4.4 ± 0.0 d4.6 ± 0.0 e4.8 ± 0.0 f
SOM (%)0–519.1 ± 0.52 bc18.1 ± 0.81 b19.2 ± 0.26 bc21.6 ± 0.59 bcd27.6 ± 0.92 d25 ± 1.33 cd25.8 ± 2.24 d18.5 ± 0.46 b27.5 ± 2.2 d
5–1010.2 ± 0.1 a9.19 ± 1.0 a8.93 0.7 a10.3 ± 0.5 a9.58 ± 0.08 a9.27 ± 0.4 a9.5 ± 0.5 a10.3 ± 0.2 a9.06 ± 0.7 a
SOC (g kg−1)0–5110 ± 3 bc100 ± 4.7 b110 ± 1.6 bc160 ± 5.4 d140 ± 7.7 cd150 ± 13 d160 ± 13 d110 ± 2.7 b130 ± 3.4 bcd
5–1059 ± 0.57 a53 ± 6 a52 ± 4.3 a56 ± 0.52 a54 ± 2.8 a55 ± 3.2 a53 ± 4.1 a60 ± 1.3 a60 ± 3 a
Al3+
(cmolc kg−1)
0–50.079 ± 0.00 a0.085 ± 0.01 a0.026 ± 0.00 a0.006 ± 0.00 a0.067 ± 0.01 a0.04 ± 0.00 a0.15 ± 0.00 a0.01 ± 0.00 a0.03 ± 0.00 a
5–100.93 ± 0.035 d1.2 ± 0.036 e0.77 ± 0.04 d0.027 ± 0.00 a2.6 ± 0.083 h2.2 ± 0.05 f2.4 ± 0.059 g0.34 ± 0.01 b0.53 ± 0.01 c
Ca2+ (cmolckg−1)0–519 ± 0.77 e24 ± 1.3 fg28 ± 0.33 hi27 ± 0.45 gh29 ± 0.59 hi31 ± 1.6 i23 ± 0.85 f28 ± 0.25 hi48 ± 1.2 j
5–106 ± 0.06 bc4.8 ± 0.067 abc7 ± 0.47 bc14 ± 0.64 d1.6 ± 0.026 a3.8 ± 0.097 ab2.2 ± 0.081 a7.8 ± 0.15 c6.7 ± 0.18 bc
Fe2+ (cmolckg−1)0–50.004 ± 0.00 ef0.001 ± 0.00 ab0.001 ± 0.00 a0.0008 ± 0.00 a0.002 ± 0.00 abcd0.002 ± 0.00 abc0.002 ± 0.00 abcd0.001 ± 0.00 ab0.001 ± 0.00 a
5–100.003 ± 0.0 bcdef0.003 ± 0.00 abcdef0.004 ± 0.00 def0.0028 ± 0.00 abcdef0.005 ± 0.00 f0.045 ± 0.04 cdef0.004 ± 0.00 def0.003 ± 0.00 abcde0.003 ± 0.00 abcde
K+
(cmolckg−1)
0–50.63 ± 0.023 efg0.52 ± 0.016 cde0.7 ± 0.045 gh0.81 ± 0.018 hi0.41 ± 0.014 bc0.47 ± 0.012 cd0.43 ± 0.042 bcd0.64 ± 0.01 fg0.85 ± 0.04 i
5–100.12 ± 0.01 a0.12 ± 0.0091 a0.13 ± 0.018 a0.53 ± 0.009 def0.14 ± 0.0044 a0.15 ± 0.0083 a0.17 ± 0.016 a0.17 ± 0.00 a0.35 ± 0.01 b
Mg2+ (cmolckg−1)0–56.3 ± 0.14 h4.9 ± 0.08 ef5.6 ± 0.036 g5.1 ± 0.047 fg8.2 ± 0.18 i4.6 ± 0.053 e5.5 ± 0.099 g7.7 ± 0.09 i14 ± 0.22 j
5–101.5 ± 0.042 c1.5 ± 0.035 c1.4 ± 0.089 bc2.2 ± 0.054 d0.82 ± 0.015 a0.91 ± 0.098 a0.92 ± 0.048 ab2.1 ± 0.04 d2.2 ± 0.03 d
Mn2+ (cmolckg−1)0–50.26 ± 0.01 g0.061 ± 0.00 d0.056 ± 0.00 cd0.019 ± 0.00 ab0.1 ± 0.00 e0.13 ± 0.00 f0.12 ± 0.01 ef0.02 ± 0.00 ab0.033 ± 0.00 bc
5–100.024 ± 0.00 ab0.02 ± 0.00 ab0.009 ± 0.00 ab0.004 ± 0.00 a0.017 ± 0.00 ab0.013 ± 0.00 ab0.022 ± 0.00 ab0.006 ± 0.00 a0.013 ± 0.00 ab
Na+ (cmolckg−1)
0–50.091 ± 0.01 a0.1 ± 0.00 a0.11 ± 0.00 a0.12 ± 0.017 ab0.19 ± 0.01 cde0.21 ± 0.0045 e0.21 ± 0.01 e0.13 ± 0.02 abc0.18 ± 0.02 bcde
5–100.19 ± 0.01 cde0.18 ± 0.00 bcde0.2 ± 0.00 de0.17 ± 0.0077 bcde0.2 ± 0.00 de0.18 ± 0.015 bcde0.19 ± 0.00 cde0.17 ± 0.01 bcde0.14 ± 0.013 abcd
Zn2+ (cmolckg−1)0–50.002 ± 0.00 e0.001 ± 0.00 abc0.001 ± 0.00 bc0.0009 ± 0.00 abc0.0007 ± 0.00 abc0.0008 ± 0.00 abc0.0012 ± 0.00 cd0.0006 ± 0.00 abc0.0017 ± 0.00 de
5–100.001 ± 0.00 bcd0.0006 ± 0.00 abc0.0005 ± 0.00 a0.0007 ± 0.00 abc0.0006 ± 0.00 abc0.0006 ± 0.00 abc0.0006 ± 0.00 ab0.0006 ± 0.00 abc0.0011 ± 0.00 bc
EBC (cmolckg−1)0–526 ± 0.89 f30 ± 1.2 fg34 ± 0.36 h33 ± 0.48 gh38 ± 0.75 i36 ± 1.6 hi29 ± 0.9 f36 ± 0.31 hi63 ± 1.4 j
5–107.9 ± 0.05 cd6.6 ±0.08 bcd8.7 ± 0.57 d17 ± 0.6 e2.8 ± 0.02 a5 ± ±0.12 abc3.4 ± 0.1 ab10 ± 0.19 d9.3 ± 0.2 d
Cations (cmolckg−1)0–527 ± 0.9 e30 ± 1.2 ef34 ± 0.36 g33 ± 0.47 fg38 ± 0.74 h36 ± 1.6 gh29 ± 0.91 e36 ± 0.31 gh63 ± 1.4 i
5–108.8 ± 0.06 abc7.8 ± 0.11 abc9.5 ± 0.55 bc17 ± 0.6 d5.4 ± 0.07 a7.2 ± 0.09 abc5.9 ± 0.07 ab11 ± 0.19 c9.9 ± 0.2 c
Table A4. Proportions of water-soluble and hot water-extractable nitrogen forms under different tree species at two soil layers (0–5 cm and 5–10 cm) (Rwibasira et al., Long-term effect of forest plantation species on soil chemical properties in Southern Rwanda).
Soil Layer Water Extract. N FractionsCalliandra CalothyrsusCedrela SerrataGrevillea RobustaEucalyptus GrandisEucalyptus MaideniEucalyptus SalignaEntandrophragma ExcelsumPolyscias FulvaMixed natives
Water-soluble fractions
0–5 cmWSNO3 (%)435573525446126864
WSNH4 (%)131891013162769
WSNorg (%)442718383338612627
5–10 cmWSNO3 (%)604576586555416264
WSNH4 (%)71225481543
WSNorg (%)334322373137443433
Hot water-extractable fractions
0–5 cmHWNO3 (%)435353333
HWNH4 (%)171622161515192523
HWNorg (%)798173818082787274
5–10 cmHWNO3 (%)434444233
HWNH4 (%)151510111011171113
HWNorg (%)818286858685818684

References

  1. Binkley, D.; Menyailo, O. Gaining insights on the effects of tree spiecies on soils. In Tree Species Effects on Soils: Implications for Global Change; Kluwer Academic Publishers: Dordrecht, The Netherlands, 2005; pp. 1–16. [Google Scholar]
  2. Carnol, M.; Bazgir, M. Nutrient return to the forest floor through litter and throughfall under 7 forest species after conversion from Norway spruce. For. Ecol. Manag. 2013, 309, 66–75. [Google Scholar] [CrossRef]
  3. Bauters, M.; Ampoorter, E.; Huygens, D.; Kearsley, E.; De Haulleville, T.; Sellan, G.; Verbeeck, H.; Boeckx, P.; Verheyen, K. Functional identity explains carbon sequestration in a 77-year-old experimental tropical plantation. Ecosphere 2015, 6, 1–11. [Google Scholar] [CrossRef] [Green Version]
  4. Lathwell, D.J.; Grove, T.L. Soil-Plant Relationships in the Tropics. Ecology 2011, 17, 1–16. [Google Scholar] [CrossRef]
  5. Hobbie, S.E.; Reich, P.; Oleksyn, J.; Ogdahl, M.; Zytkowiak, R.; Hale, C.; Karolewski, P. Tree Species Effects on decomposition and forest floor dynamics in a common garden. Ecology 2006, 87, 2288–2297. [Google Scholar] [CrossRef]
  6. Prescott, C.E.; Vesterdal, L. Tree species effects on soils in temperate and boreal forests: Emerging themes and research needs. For. Ecol. Manag. 2013, 309, 1–3. [Google Scholar] [CrossRef]
  7. Veldkamp, A. Pedogenesis and Soil Forming Factors. In Land Use and Land Cover; Encyclopedia of Life Support Systems (EOLSS): Wageningen, The Netherlands, 2000. [Google Scholar]
  8. Sayer, E.J.; Banin, L.F. Tree Nutrient Status and Nutrient Cycling in Tropical Forest—Lessons from Fertilization Experiments. Tree Physiol. 2016, 6, 275–297. [Google Scholar] [CrossRef]
  9. Schulte, A.; Ruhiyat, D. Soils of Tropical Forest Ecosystems; Springer: Berlin/Heidelberg, Germany, 1998. [Google Scholar]
  10. Karlen, D.L.; Mausbach, M.J.; Doran, J.W.; Cline, R.G.; Harris, R.F.; Schuman, G.E. Soil Quality: A Concept, Definition, and Framework for Evaluation (A Guest Editorial). Soil Sci. Soc. Am. J. 1997, 61, 4–10. [Google Scholar] [CrossRef] [Green Version]
  11. Salomé, C.; Coll, P.; Lardo, E.; Metay, A.; Villenave, C.; Marsden, C.; Blanchart, E.; Hinsinger, P.; Le Cadre, E. The soil quality concept as a framework to assess management practices in vulnerable agroecosystems: A case study in Mediterranean vineyards. Ecol. Indic. 2016, 61, 456–465. [Google Scholar] [CrossRef]
  12. Baveye, P.C.; Ebaveye, J.; Egowdy, J. Soil “Ecosystem” Services and Natural Capital: Critical Appraisal of Research on Uncertain Ground. Front. Environ. Sci. 2016, 4, 41. [Google Scholar] [CrossRef]
  13. Bünemann, E.K.; Bongiorno, G.; Bai, Z.; Creamer, R.E.; De Deyn, G.; de Goede, R.; Fleskens, L.; Geissen, V.; Kuyper, T.W.; Mäder, P.; et al. Soil quality—A critical review. Soil Biol. Biochem. 2018, 120, 105–125. [Google Scholar] [CrossRef]
  14. Greiner, L.; Keller, A.; Grêt-Regamey, A.; Papritz, A. Soil function assessment: Review of methods for quantifying the contributions of soils to ecosystem services. Land Use Policy 2017, 69, 224–237. [Google Scholar] [CrossRef]
  15. Haines-Young, R.; Potschin, M. England’s Terrestrial Ecosystem Services and Rationale for an Ecosystem Approach; Ecosystem Services: London, UK, 2008. [Google Scholar]
  16. Kennedy, A.C. Biological Indicators of Soil Health. J. Environ. Qual. 1998, 27, 1275–1276. [Google Scholar] [CrossRef]
  17. Vogel, H.-J.; Eberhardt, E.; Franko, U.; Lang, B.; Ließ, M.; Weller, U.; Wiesmeier, M.; Wollschläger, U. Quantitative Evaluation of Soil Functions: Potential and State. Front. Environ. Sci. 2019, 7, 164. [Google Scholar] [CrossRef]
  18. Augusto, L.; Ranger, J.; Binkley, D.; Rothe, A. Impact of several common tree species of European temperate forests on soil fertility. Ann. For. Sci. 2002, 59, 233–253. [Google Scholar] [CrossRef] [Green Version]
  19. Franzluebbers, A. Soil organic matter stratification ratio as an indicator of soil quality. Soil Tillage Res. 2002, 66, 95–106. [Google Scholar] [CrossRef]
  20. Wellock, M.L.; LaPerle, C.M.; Kiely, G. What is the impact of afforestation on the carbon stocks of Irish mineral soils? For. Ecol. Manag. 2011, 262, 1589–1596. [Google Scholar] [CrossRef]
  21. DeGryze, S.; Six, J.; Paustian, K.; Morris, S.J.; Paul, E.A.; Merckx, R. Soil organic carbon pool changes following land-use conversions. Glob. Chang. Biol. 2004, 10, 1120–1132. [Google Scholar] [CrossRef] [Green Version]
  22. Peri, P.L.; Gargaglione, V.; Pastur, G.J.M.; Lencinas, M.V. Carbon accumulation along a stand development sequence of Nothofagus antarctica forests across a gradient in site quality in Southern Patagonia. For. Ecol. Manag. 2010, 260, 229–237. [Google Scholar] [CrossRef]
  23. Del Galdo, I.; Six, J.; Peressotti, A.; Cotrufo, M.F. Assessing the impact of land-use change on soil C sequestration in agricultural soils by means of organic matter fractionation and stable C isotopes. Glob. Chang. Biol. 2003, 9, 1204–1213. [Google Scholar] [CrossRef]
  24. Mao, R.; Zeng, D.-H.; Hu, Y.-L.; Li, L.-J.; Yang, D. Soil organic carbon and nitrogen stocks in an age-sequence of poplar stands planted on marginal agricultural land in Northeast China. Plant Soil 2010, 332, 277–287. [Google Scholar] [CrossRef]
  25. Ross, D.; Tate, K.; Scott, N.; Feltham, C. Land-use change: Effects on soil carbon, nitrogen and phosphorus pools and fluxes in three adjacent ecosystems. Soil Biol. Biochem. 1999, 31, 803–813. [Google Scholar] [CrossRef]
  26. Paul, K.; Polglase, P.; Nyakuengama, J.; Khanna, P. Change in soil carbon following afforestation. For. Ecol. Manag. 2002, 168, 241–257. [Google Scholar] [CrossRef]
  27. Nyberg, G.; Ekblad, A.; Buresh, R.; Högberg, P. Short-term patterns of carbon and nitrogen mineralisation in a fallow field amended with green manures from agroforestry trees. Biol. Fertil. Soils 2002, 36, 18–25. [Google Scholar] [CrossRef]
  28. Curtin, D.; Beare, M.H.; Qiu, W. Distinguishing functional pools of soil organic matter based on solubility in hot water. Soil Res. 2021, 59, 319. [Google Scholar] [CrossRef]
  29. Paul, E.A. The nature and dynamics of soil organic matter: Plant inputs, microbial transformations, and organic matter stabilization. Soil Biol. Biochem. 2016, 98, 109–126. [Google Scholar] [CrossRef] [Green Version]
  30. Choudhary, O.; Gill, J.; Singh, B. Water-Extractable Carbon Pools and Microbial Biomass Carbon in Sodic Water-Irrigated Soils Amended with Gypsum and Organic Manures. Pedosphere 2013, 23, 88–97. [Google Scholar] [CrossRef]
  31. Haynes, R. Labile Organic Matter Fractions as Central Components of the Quality of Agricultural Soils: An Overview. Adv. Agron. 2005, 85, 221–268. [Google Scholar] [CrossRef]
  32. Strosser, E. Methods for determination of labile soil organic matter: An overview. J. Agrobiol. 2010, 27, 49–60. [Google Scholar] [CrossRef]
  33. Zhang, M.; He, Z.; Zhao, A.; Zhang, H.; Endale, D.M.; Schomberg, H.H. Water-Extractable Soil Organic Carbon and Nitrogen Affected by Tillage and Manure Application. Soil Sci. 2011, 176, 307–312. [Google Scholar] [CrossRef]
  34. Wang, Q.; Wang, S.; Huang, Y. Comparisons of litterfall, litter decomposition and nutrient return in a monoculture Cunninghamia lanceolata and a mixed stand in southern China. For. Ecol. Manag. 2008, 255, 1210–1218. [Google Scholar] [CrossRef]
  35. Habiyaremye, G.; Jiwen, G.; de la Paix Mupenzi, J.; Balogun, W.O. Demographic pressure impacts on forests in Rwanda. Afr. J. Agric. Res. 2011, 6, 4533–4538. [Google Scholar] [CrossRef]
  36. Clay, D.C.; Lewis, L.A. Land use, soil loss, and sustainable agriculture in Rwanda. Hum. Ecol. 1990, 18, 147–161. [Google Scholar] [CrossRef] [Green Version]
  37. MINILAF. Forest Sector Strategic Plan 2018–2024; GoR: Kigali, Rwanda, 2018. [Google Scholar]
  38. Warnest, M.; Sagashya, D.; Nkurunziza, E. Emerging in a Changing Climate-Sustainable Land Use Management in Rwanda; International Federation of Surveyors (FIG): Rome, Italy, 2012. [Google Scholar]
  39. RFA. Rwanda Forestry Status; GoR: Kigali, Rwanda, 2020; Available online: https://www.rfa.rw (accessed on 6 May 2020).
  40. MoE. Rwanda Forest cover Mapping; GoR: Kigali, Rwanda, 2019. [Google Scholar]
  41. IUCN. A Thousand Hills Turn Green: How Rwanda Became a Leader in Forest Landscape restoration. Int. Union Conserv. Nat. 2020. Available online: https://iucn.maps.arcgis.com/apps/MapJournal/index.html?appid=0c40be7f83c64bb9b7c8f3372358c6f9 (accessed on 4 April 2020).
  42. Bauters, M.; Verbeeck, H.; Doetterl, S.; Ampoorter, E.; Baert, G.; Vermeir, P.; Verheyen, K.; Boeckx, P. Functional Composition of Tree Communities Changed Topsoil Properties in an Old Experimental Tropical Plantation. Ecosystems 2016, 20, 861–871. [Google Scholar] [CrossRef]
  43. Bauters, M.; Verbeeck, H.; Demol, M.; Bruneel, S.; Taveirne, C.; Van der Heyden, D.; Cizungu, L.; Boeckx, P. Parallel functional and stoichiometric trait shifts in South American and African forest communities with elevation. Biogeosciences 2017, 14, 5313–5321. [Google Scholar] [CrossRef] [Green Version]
  44. Nsabimana, L.; Klemedtson, B.; Kaplin, G. Wallin, Soil carbon and nutrient accumulation under forest plantations in southern Rwanda. African J. Environ. Sci. Technol. 2008, 2, 142–149. [Google Scholar]
  45. Meteorwanda, Climatology of Rwanda. 2021. Available online: https://www.meteorwanda.gov.rw/index.php?id=30 (accessed on 30 April 2021).
  46. Nsabimana, D.; Klemedtson, L.; Kaplin, B.; Wallin, G. Soil CO2 flux in six monospecific forest plantations in Southern Rwanda. Soil Biol. Biochem. 2009, 41, 396–402. [Google Scholar] [CrossRef] [Green Version]
  47. Steiner, K. Using farmers’ knowledge of soils in making research results more relevant to field practice: Experiences from Rwanda. Agric. Ecosyst. Environ. 1998, 69, 191–200. [Google Scholar] [CrossRef]
  48. Moeyersons, J. The topographic thresholds of hillslope incisions in southwestern Rwanda. Catena 2003, 50, 381–400. [Google Scholar] [CrossRef]
  49. Kalinganire, A. Performance of Grevillea robusta in plantations and on farms under varying environmental conditions in Rwanda. For. Ecol. Manage. 1995, 80, 279–285. [Google Scholar] [CrossRef]
  50. Burren, C. Les Eucalyptus au Rwanda: Analyse de 60 ans D’expérience avec Référence Particulière à l’Arboretum de Ruhande; Switzerland-ISAR/Intercooperation: Bern, Switzerland, 1995. [Google Scholar]
  51. Commonwealth. Arboretum of Ruhande: A 500 Acre Stretch of Botanical Garden, QCC Proj. 2018. Available online: https://queenscommonwealthcanopy.org/projects/arboretum-of-ruhande (accessed on 30 August 2020).
  52. ISAR. Arboretum de Ruhande 1987: Note Explicative à L’intention des Visiteurs Élaborée par les Collaborateurs du Département de Foresterie, 3rd ed.; ISAR: Butare, Rwanda, 1987. [Google Scholar]
  53. Ndayambaje, J.D. State of Rwanda’s Biodiversity for Food and Agriculture; FAO-Rwanda: Kigali, Rwanda, 2016. [Google Scholar]
  54. Iiyama, M.; Mukuralinda, A.; Ndayambaje, J.D.; Musana, B.; Ndoli, A.; Mowo, J.G.; Garrity, D.; Ling, S.; Ruganzu, V. Tree-Based Ecosystem Approaches (TBEAs) as Multi-Functional Land Management Strategies—Evidence from Rwanda. Sustainability 2018, 10, 1360. [Google Scholar] [CrossRef] [Green Version]
  55. Bini, D.; dos Santos, C.A.; Bouillet, J.-P.; Gonçalves, J.L.M.; Cardoso, E.J.B.N. Eucalyptus grandis and Acacia mangium in monoculture and intercropped plantations: Evolution of soil and litter microbial and chemical attributes during early stages of plant development. Appl. Soil Ecol. 2013, 63, 57–66. [Google Scholar] [CrossRef]
  56. Zalamea, M.; González, G.; Lodge, D. Physical, Chemical, and Biological Properties of Soil under Decaying Wood in a Tropical Wet Forest in Puerto Rico. Forests 2016, 7, 168. [Google Scholar] [CrossRef] [Green Version]
  57. Rorison, I.H.; Allen, S.E.; Grimshaw, H.M.; Parkinson, J.A.; Quarmby, C. Chemical Analysis of Ecological Materials. J. Appl. Ecol. 1976, 13, 650. [Google Scholar] [CrossRef]
  58. Périé, C.; Ouimet, R. Organic carbon, organic matter and bulk density relationships in boreal forest soils. Can. J. Soil Sci. 2008, 88, 315–325. [Google Scholar] [CrossRef]
  59. Jenkinson, D.S.; Powlson, D.S. The effects of biocidal treatments on metabolism in soil—V: A method for measuring soil biomass. Soil Biol. Biochem. 1976, 9, 209–213. [Google Scholar] [CrossRef]
  60. Hendershot, W.H.; Duquette, M. A simple barium chloride for determining cation exchange capacity and exchangeable cations. Soil Sci. Soc. Am. J. 1986, 50, 605–608. [Google Scholar] [CrossRef]
  61. Ghani, A.; Dexter, M.; Perrott, K. Hot-water extractable carbon in soils: A sensitive measurement for determining impacts of fertilisation, grazing and cultivation. Soil Biol. Biochem. 2003, 35, 1231–1243. [Google Scholar] [CrossRef]
  62. Gregorich, E.; Beare, M.; Stoklas, U.; St-Georges, P. Biodegradability of soluble organic matter in maize-cropped soils. Geoderma 2003, 113, 237–252. [Google Scholar] [CrossRef]
  63. Bates, D.; Maechler, M.; Bolker, B.M.; Walker, S.C. Fitting linear mixed-effects models using lme4. J. Stat. Softw. 2015, 76, 1–48. [Google Scholar]
  64. Venables, W.N.; Ripley, B.D. Package MASS. Available online: http://www.r-project.org (accessed on 17 October 2012).
  65. Barton, K. MuMIn: Multi-Model Inference. 2018. Available online: https://cran.rproject.org/package=MuMIn (accessed on 15 September 2021).
  66. Gelsomino, A.; Azzellino, A. Multivariate analysis of soils: Microbial biomass, metabolic activity, and bacterial-community structure and their relationships with soil depth and type. J. Plant Nutr. Soil Sci. 2011, 174, 381–394. [Google Scholar] [CrossRef]
  67. FAO. Topsoil characterization for sustainable land management. In Land and Water Development Division Soil Resources, Management and Conservation Service; FAO: Rome, Italy, 1998; p. 71. [Google Scholar]
  68. Adugna, A.; Abegaz, A. Effects of soil depth on the dynamics of selected soil properties among the highlands resources of Northeast Wollega, Ethiopia: Are these sign of degradation? Solid Earth Discuss. 2015, 7, 2011–2035. [Google Scholar] [CrossRef]
  69. Cleveland, C.C.; Townsend, A.R.; Schmidt, S.K.; Constance, B.C. Soil microbial dynamics and biogeochemistry in tropical forests and pastures, southwestern costa rica. Ecol. Appl. 2003, 13, 314–326. [Google Scholar] [CrossRef]
  70. Yamoah, C.F.; Burleigh, J.R.; Malcolm, M.R. Application of expert systems to study of acid soils in Rwanda. Agric. Ecosyst. Environ. 1990, 30, 203–218. [Google Scholar] [CrossRef]
  71. Mbonigaba, J.J.M.; Nzeyimana, I.; Bucagu, C.; Culot, M. Caractérisation physique, chimique et microbiologique de trois sols acides tropicaux du Rwanda sous jachères naturelles et contraintes à leur productivité. Biotechnol. Agron. Soc. Environ. 2009, 13, 545–558. [Google Scholar]
  72. Fujii, K. Soil acidification and adaptations of plants and microorganisms in Bornean tropical forests. Ecol. Res. 2014, 29, 371–381. [Google Scholar] [CrossRef] [Green Version]
  73. Duchaufour, P. Pédologie: Sol, Végétation, Environnement; Elsevier Masson: Paris, France, 1994. [Google Scholar]
  74. Dudek, T.; Cuadros, J.; Fiore, S. Interstratified kaolinite-smectite: Nature of the layers and mechanism of smectite kaolinization. Am. Miner. 2006, 91, 159–170. [Google Scholar] [CrossRef]
  75. Ryan, P.C.; Huertas, F.J. Reaction Pathways of Clay Minerals in Tropical Soils: Insights from Kaolinite-smectite Synthesis Experiments. Clays Clay Miner. 2013, 61, 303–318. [Google Scholar] [CrossRef]
  76. Celentano, D.; Zahawi, R.; Finegan, B.; Ostertag, R.; Cole, R.J.; Holl, K.D. Litterfall Dynamics Under Different Tropical Forest Restoration Strategies in Costa Rica. Biotropica 2010, 43, 279–287. [Google Scholar] [CrossRef]
  77. Mugunga, C.P.; Kool, D.; Van Wijk, M.T.; Mohren, G.M.J.; Giller, K.E. Water use by short rotation Eucalyptus woodlots in southern Rwanda. Agrofor. Syst. 2015, 89, 1119–1139. [Google Scholar] [CrossRef] [Green Version]
  78. Behera, N.; Sahani, U. Soil microbial biomass and activity in response to Eucalyptus plantation and natural regeneration on tropical soil. For. Ecol. Manag. 2003, 174, 1–11. [Google Scholar] [CrossRef]
  79. Laclau, J.-P.; Ranger, J.; Gonçalves, J.L.M.; Maquère, V.; Krusche, A.; M’Bou, A.T.; Nouvellon, Y.; Saint-André, L.; Bouillet, J.-P.; Piccolo, M.D.C.; et al. Biogeochemical cycles of nutrients in tropical Eucalyptus plantations: Main features shown by intensive monitoring in Congo and Brazil. For. Ecol. Manag. 2010, 259, 1771–1785. [Google Scholar] [CrossRef]
  80. Rhoades, C.; Binkley, D. Factors influencing decline in soil pH in Hawaiian Eucalyptus and Albizia plantations. For. Ecol. Manag. 1996, 80, 47–56. [Google Scholar] [CrossRef]
  81. Jobbágy, E.G.; Jackson, R.B. Patterns and mechanisms of soil acidification in the conversion of grasslands to forests. Biogeochemistry 2003, 64, 205–229. [Google Scholar] [CrossRef]
  82. de Medeiros, E.V.; Duda, G.P.; dos Santos, L.A.R.; Lima, J.R.D.S.; de Almeida-Cortêz, J.S.; Hammecker, C.; Lardy, L.; Cournac, L. Soil organic carbon, microbial biomass and enzyme activities responses to natural regeneration in a tropical dry region in Northeast Brazil. Catena 2017, 151, 137–146. [Google Scholar] [CrossRef]
  83. Ahmed, A.G.; Murungi, L.K.; Babin, R.; Peng, Y.; Schmidt, I.K.; Zheng, H.; Heděnec, P.; Bachega, L.R.; Yue, K.; Wu, F.; et al. Six, Tree species effects on soil organic matter dynamics: The role of soil cation composition. For. Ecol. Manage. 2015, 36, 119–127. [Google Scholar] [CrossRef]
  84. Koutika, L.-S.; Epron, D.; Bouillet, J.-P.; Mareschal, L. Changes in N and C concentrations, soil acidity and P availability in tropical mixed acacia and eucalypt plantations on a nutrient-poor sandy soil. Plant Soil 2014, 379, 205–216. [Google Scholar] [CrossRef]
  85. Wang, Q.; Wang, S.; Yu, X. Decline of soil fertility during forest conversion of secondary forest to Chinese fir plantations in subtropical China. Land Degrad. Dev. 2011, 22, 444–452. [Google Scholar] [CrossRef]
  86. Bankó, L.; Tóth, G.; Marton, C.L.; Hoffmann, S. Hot-water extractable C and N as indicators for 4p1000 goals in a temperate-climate long-term field experiment: A case study from Hungary. Ecol. Indic. 2021, 126, 107364. [Google Scholar] [CrossRef]
  87. Gregorich, E.G.; Carter, M.R.; Angers, D.A.; Monreal, C.M.; Ellert, B.H. Towards a minimum data set to assess soil organic matter quality in agricultural soils. Can. J. Soil Sci. 1994, 74, 367–385. [Google Scholar] [CrossRef] [Green Version]
  88. Ostrowska, A.; Porȩbska, G.; Kanafa, M. Carbon accumulation and distribution in profiles of forest soils. Polish J. Environ. Stud. 2010, 19, 1307–1315. [Google Scholar]
  89. Russell, A.E.; Raich, J.W.; Valverde-Barrantes, O.J.; Fisher, R.F. Tree Species Effects on Soil Properties in Experimental Plantations in Tropical Moist Forest. Soil Sci. Soc. Am. J. 2007, 71, 1389–1397. [Google Scholar] [CrossRef] [Green Version]
  90. Landgraf, D.; Leinweber, P.; Makeschin, F. Cold and hot water–extractable organic matter as indicators of litter decomposition in forest soils. J. Plant Nutr. Soil Sci. 2006, 169, 76–82. [Google Scholar] [CrossRef]
  91. Binkley, D.; Menyailo, O. Tree Species Effects on Soils: Implications for Global Change; Springer: Krasnoyarsk, Russia, 2004; p. 361. [Google Scholar] [CrossRef] [Green Version]
  92. Ćirić, V.; Belić, M.; Nešić, L.; Šeremešić, S.; Pejić, B.; Bezdan, A.; Manojlović, M. The sensitivity of water extractable soil organic carbon fractions to land use in three soil types. Arch. Agron. Soil Sci. 2016, 62, 1654–1664. [Google Scholar] [CrossRef]
Figure 1. Geographical map of the study site.
Soilsystems 05 00059 g001
Figure 2. Map of the Arboretum of Ruhande, Rwanda. Studied plots are indicated in colors. More details can be found in Table A1. Adapted with permission from [52]. Copyright 1987 ISAR Foresterie.
Soilsystems 05 00059 g002
Figure 3. Predicted (LMM) soil properties under eight tree species (C. cal: Calliandra calothyrsus; C. ser: Cedrela serrata; G. rob: Grevillea robusta; E. gra: Eucalyptus grandis; E. mai: Eucalyptus maideni; E. sal: Eucalyptus saligna; E. exc: Entandrophragma excelsum; P. ful: Polyscias fulva) and in the plot with mixed native species (Mns) at two soil depths (0–5 cm and 5–10 cm). The horizontal black line in the box shows the estimated sample median, while the lower and the upper box boundaries show the first and the third percentiles, respectively. The dots outside the whisker boundaries show observations outside the 5th–95th percentile range. Different letters denote significant differences between tree species and soil layer (mixed linear models, Tukey’s HSD, p < 0.05).
Soilsystems 05 00059 g003
Figure 4. Pearson correlation matrices showing the relationship between soil properties and water-extractable C and N fractions in the upper ((A) 0–5 cm) and lower ((B) 5–10 cm) soil layers. Relationships between parameters are indicated by the values at the intersection of parameters and interpreted within color contrast as shown in the legends.
Soilsystems 05 00059 g004
Figure 5. PCA biplot of soil chemical properties and tree species for the upper (A) and the lower (B) soil layers. The first two principal components explained 62.5% of the combined variation in soil parameters at 0–5 cm soil depth and 54.9% at 5–10 cm soil depth between tree species. Statistical ellipses at 95% confidence level group tree species (represented by different symbols and colors) based soil variables depicted by vectors (pH; SOM = soil organic matter; EBC = exchangeable basic cations; WSC = water-soluble C, WSNorg = water soluble organic N; WSNtot = water-soluble total N, WSC:WSNorg = water soluble organic C/N ratio; HWC = hot water-extractable C, HWNorg = hot water-extractable organic N, HWNtot = hot water-extractable total N, and HWC:HWNtot= hot water-extractable C/N ratio).
Soilsystems 05 00059 g005
Table 1. Measured waters’ C and N under different tree species in the Arboretum of Ruhande (means ± SEM). Different letters within one parameter denote significant differences between tree species and soil depths (mixed linear models, Tukey’s HSD, p < 0.05.
Labile C and N FractionsSoil Layer (cm)Calliandra
calothyrsus
Cedrela
serrata
Grevillea robustaEucalyptus grandisEucalyptus maideniEucalyptus salignaEntandrophragma excelsumPolyscias
fulva
Mixed
natives
Water-soluble C and N fractions
WSC (mgkg−1)0–5 550 ± 49 f210 ± 13 b320 ± 30 cde360 ± 12 cde380 ± 29 de430 ± 38 e310 ± 15 bcd250 ± 5 bc260 ± 8.9 bc
5–1067 ± 2.5 a56± 2.3 a50 ± 3.4 a52 ± 3.9 a60 ± 3.4 a50 ± 1.7 a53 ± 2.6 a50 ± 1.9 a68± 3.3 a
WSNtot (mgkg−1)0–5 120 ± 3.8 f73 ± 2.2 c180 ± 2.8 h100 ± 3.4 de100 ± 3.8 de96 ± 2 d120 ± 1.7 f130 ± 3.5 g110 ± 2.3 ef
5–1025 ± 0.81 ab17 ± 0.73 ab26 ± 0.36 b16 ± 0.73 ab22 ± 0.3 ab16 ± 0.99 ab15 ± 0.46 a21 ± 1.4 ab27 ± 0.69 b
WSNorg (mgkg−1)0–5 51 ± 2 d20 ± 1.6 b32 ± 2.8 c40 ± 2.2 c33 ± 4.1 c37 ± 1.9 c34 ± 2.9 c35 ± ±2.7 c30 ± 1.3 c
5–108.1 ± 0.44 a7.1 ± 0.5 a5.8 ± 0.12 a5.9 ± 0.64 a6.6 ± 0.37 a5.9 ± 0.69 a6.6 ± 1.2 a7.2 ± 0.83 a8.6 ± 0.49 a
WSNH4 (mgkg−1)0–5 15 ± 0.66 d13 ± 0.45 cd15 ± 0.75 d9.9 ± 0.92 b13 ± 1.1 cd15 ± 0.53 d15 ± 1.2 d8.7 ± 0.3 b10 ± 0.24 bc
5–101.8 ± 0.14 a2 ± 0.27 a0.52 ± 0.01 a0.76 ± 0.06 a0.9 ±0.07 a1.2 ± 0.2 a2.2 ± 0.2 a0.82 ± 0.03 a0.8 ± 0.05 a
WSNO3 (mgkg−1)0–5 50 ± 2.1 ef40 ± 2 d130 ± 4.1 i54 ± 1.8 f54 ± 1.7 f44 ± 1.2 de70 ± 2.2 g91 ± 2.6 h70 ± 1.8 g
5–1015 ± 0.49 abc7.6 ± 0.55 a20 ± 0.39 c9.3 ± 0.17 ab14 ± 0.54 abc8.7 ± 0.21 ab6.1 ± 0.93 a13 ± 0.89 abc17 ± 0.53 bc
WSC/WSNtot0–5 4.8 ± 0.5 f2.9 ± 0.2 abcd1.9 ± 0.2 a3.5 ± 0.1 bcde3.8 ± 0.3 def4.5 ± 0.4 ef2.9 ± 0.1 abc1.9 ± 0.1 a2.4 ± 0.0 ab
5–102.7 ± 0.2 abcd3.4 ± 0.1 bcde1.9 ± 0.1 a3.3 ± 0.3 bcde2.8 ± 0.1 abc3.2 ± 0.1 bcd3.6 ± 0.2 cdef2.5 ± 0.2 abc2.6 ± 0.1 abc
WSC/WSNorg0–5 11 ± 1 a11 ± 0.9 a11 ± 1.8 a9.2 ± 0.5 a12 ± 1.5 a12 ± 1.3 a9.3 ± 0.9 a7.5 ± 0.6 a8.7 ± 0.2 a
5–108.6 ± 0.83 a8 ± 0.34 a8.8 ± 0.58 a9.6 ± 1.5 a9 ± 0.2 a8.9 ± 0.79 a9.6 ± 1.7 a7.4 ± 0.81 a8 ± 0.55 a
Hot water-extractable C and N fractions
HWC (mgkg−1)0–5 3200 ± 280 cd2500 ± 110 b2700 ± 97 bc5200 ± 150 ef5400 ± 120 f5500 ± 140 f4600 ± 210 e3400 ± 51 d3500 ± 230 d
5–10640 ±32 a540 ± 25 a590 ± 25 a500 ± 29 a580 ± 25 a630 ± 51 a500 ± 46 a620 ± 31 a830 ± 16 a
HWNtot (mgkg−1)0–5 300 ± 4.5 cd270 ± 9.4 c330 ± 8 de490 ± 13 h420 ± 5.2 fg440 ± 8 g430 ± 17 g370 ± 8.9 ef430 ± 20 g
5–1080 ± 4.6 ab61 ± 1.2 a66 ± 4.4 ab48± 3.1 a52 ± 3.2 a51 ± 1.7 a55 ± 3.8 a72 ± 1.5 ab110± 1.3 b
HWNorg (mgkg−1)0–5 240 ± 1.9 cd220 ± 7.5 c240 ± 5.5 cd400 ± 11 g330 ± 4.8 ef360 ± 6.2 f340 ± 13 ef270 ± 6 d320 ± 18 e
5–1065 ± 4.3 ab50 ± 1.7 a57 ± 3.8 ab41 ± 2.9 a44 ± 2.9 a43 ± 1.6 a45 ± 3.9 a62 ± 1.7 ab91 ± 1.2 b
WSNH4 (mgkg−1)0–5 50 ± 2.4 b43 ± 2.1 b73 ± 3.1 cde77 ± 2.8 de63 ± 1.8 c68 ± 2 cd82 ± 3.7 e94 ± 4.9 f97 ± 2.1 f
5–1012 ± 0.35 a9.1 ± 0.75 a6.4 ± 0.42 a5.2 ± 0.15 a5.1 ± 0.35 a5.9 ± 0.81 a9.3 ± 0.59 a8.2 ± 0.43 a14 ± 0.42 a
WSNO3 (mgkg−1)0–5 12 ± 0.98 cd8 ± 0.19 bc17 ± 0.7 de17 ± 1.4 de21 ± 0.97 e14 ± 1.3 d14 ± 1.2 d12 ± 0.92 cd12 ± 3.2 cd
5–103 ± 0.35 ab1.6 ± 0.11 a2.8 ± 0.25 ab2 ± 0.26 a2.2 ± 0.29 a1.9 ± 0.03 a0.99 ± 0.03 a2.4 ± 0.29 a3.1 ± 0.21 ab
HWC/HWNtot0–5 11 ± 0.9 bcd9.4 ± 0.3 abc8 ± 0.1 a11 ± 0.1 bcd13.9 ± 0.1 e13 ± 0.2 de11 ± 0.3 bcd9.1 ± 0.2 ab8 ± 0.1 a
5–108 ± 0.1 a8.9 ± 0.5 ab9 ± 0.4 ab10 ± 0.3 bcd11 ± 0.8 cde12 ± 0.6 de9.1 ± 0.5 ab8.5 ± 0.4 ab7.7 ± 0.1 a
HWC/HWNorg0–5 13 ± 1.2 defg12 ± 0.4 abcdef11 ± 0.2 abcde13 ± 0.2 defg16 ± 0.2 h15 ± 0.3 gh14 ± 0.4 efgh13 ± 0.3 cdefg11 ± 0.2 abcde
5–109.8 ± 0.17 abc11 ± 0.85 abcde10 ± 0.54 abcd12 ± 0.38 bcdefg13 ± 0.95 defg14 ± 0.77 fgh11 ± 0.6 abcde10 ±0.5 ab9.1 ± 0.16 a
Table 2. Principal component analysis (PCA) of 11 selected soil chemical properties measured in 108 samples under nine treatments (tree species) at two soil layers. Variable loadings higher than 0.6 are in bold, expressing a significant weight of variables on PC, and the first five principal components explaining 87%–91% of the cumulative total variance are presented. The sign on variable loadings indicates the direction of the variable on PC axes. Analyzed soil variables (pH; SOM = soil organic matter; EBC = exchangeable basic cations; WSC = water-soluble C, WSNorg = water soluble organic N; WSNtot = water-soluble total N, WSC:WSNorg = water soluble organic C/N ratio; HWC = hot water-extractable C, HWNorg = hot water-extractable organic N, HWNtot = hot water-extractable total N, and HWC:HWNtot= hot water-extractable C/N ratio).
Upper Soil Layer (0–5 cm)Lower Soil Layer (5–10 cm)
Principal ComponentsPC1PC2PC3PC4PC5PC1PC2PC3PC4PC5
Eigenvalues4.692.031.571.030.715.021.4721.191.020.89
% variance42.6618.5214.279.436.4845.6413.3810.859.348.16
Cumulative % of the total variance42.6661.1975.4684.8991.3845.6459.0369.8879.2287.39
Loadings (weight) of variables on PCs (%)
pHKCL−0.770.240.220.25−0.150.730.33−0.21−0.22−0.09
SOM0.810.190.070.17−0.250.40−0.410.040.500.38
WSC0.45−0.700.240.340.290.510.160.50−0.010.59
WSNorg0.22−0.450.80−0.200.210.70−0.58−0.04−0.190.18
WSNtot−0.400.0170.630.48−0.230.740.010.08−0.07−0.20
WSC:WSNorg0.33−0.35−0.550.660.06−0.460.760.350.190.13
HWC0.960.100.05−0.05−0.080.73−0.070.410.30−0.39
HWNorg0.860.410.140.04−0.050.940.200.040.08−0.14
HWNtot0.770.530.230.14−0.050.950.190.040.05−0.09
HWC:HWNtot0.77−0.35−0.11−0.24−0.03−0.64−0.350.460.29−0.32
EBC−0.010.710.020.140.640.120.18−0.590.670.04
Contribution of variables to PCs (%)
pHKCL12.962.983.346.253.2110.827.783.904.790.94
SOM14.301.850.353.099.373.2011.630.1824.7016.20
WSC4.4324.503.7911.3312.245.331.8121.350.0338.75
WSNorg1.0310.0740.844.156.219.7922.890.153.783.92
WSNtot3.540.0126.0322.467.5811.080.010.550.504.67
WSC:WSNorg2.356.3319.5542.610.584.2539.3810.453.681.98
HWC19.850.490.190.240.8910.720.3414.479.2817.71
HWNorg15.968.551.340.220.4217.772.880.150.642.44
HWNtot12.7613.793.632.010.3718.312.620.160.321.06
HWC:HWNtot12.776.210.845.560.198.368.3718.148.3612.02
EBC0.0125.160.052.0258.900.302.2330.4543.870.25
Publisher’s Note: MDPI stays neutral with regard to jurisdictional claims in published maps and institutional affiliations.

