1. Introduction
The current energy systems are increasingly complex, as multiple generation and distribution technologies exist to provide the energy required by the final users. In particular, the heating and cooling energy sector, which is responsible of a large share of Greenhouse Gases (GHG) emission in Europe (EU) [
1], is expected to radically change in the upcoming years. Therefore, proper studies to compare the performance of alternative solutions are of interest, to support the energy planners with evidence of the impacts and the efficiency of different solutions. The Life Cycle Assessment (LCA) methodology is widely applied to evaluate the impacts of goods production throughout their life cycle, and to asses the environmental sustainability of products, goods, food, etc. [
2]. Moreover, LCA is a useful tool in order to asses and quantify the achievement towards the Sustainable Development Goals (SDGs) set by the United Nations [
3,
4,
5] which are working as drivers for international green and clean policies.
The LCA approach has been initially developed for the assessment of the production of goods as in [
5,
6,
7], but thanks to the flexibility of its methodology, in recent years there is a growing interest in applying it to a range of services as well. Different examples exist of studies that have applied LCA approach to the electricity generation and goods. In [
8,
9], the authors performed a review on the different LCA studies about electricity generation for traditional and renewable sources respectively, while the authors of [
10] analysed the environmental impact evolution of the Brazilian electricity generation system from 2016 to 2026. In [
11,
12], electricity production from biomass is analysed, and environmental benefits and critical processes, like biomass transportation, are highlighted. Moreover, other authors, as in [
13,
14], have already proven the importance of the LCA approach in estimating the advantages of different energy technologies. Manufacturing, fuel extraction and transport [
15,
16,
17] can play an important role in determining the overall impact of an energy technology.
However, less attention has been paid to the heating sector: some studies have compared heat pumps and gas-fired boilers [
18] or to biomass based heating systems [
16], while others have been focused on solar systems [
19]. When it comes to district heating (DH) systems, few studies have addressed the LCA of the heat supplied to the users through DH networks. Eriksson et al. [
20] have compared the use of biomass and natural gas as fuels in DH systems, while others have been focused on single technologies [
21], the network construction [
22] or the used fuel as in [
23]. A comparison with traditional distributed boilers, which represent the standard solution in multiple countries, has not currently being evaluated in the literature.
The aim of this work is to help filling this gap, by providing a study on the LCA impact of heat generation in an existing large-scale district heating system, in comparison with the distributed natural gas boilers, which are the reference solution for buildings heating in the region. The results can support policy makers in evaluating the effectiveness of DH systems in large urban contexts.
Turin District Heating System
This study is based on the real annual values obtained from the operational data of the city of Turin. The city is located in the northwest of Italy and present a continental climate with humid summer and cold winter with around 2600 heating degree days [
24]. Moreover, it is associated to a climate area
Cfb, based on the Kopper–Geiger climate classification [
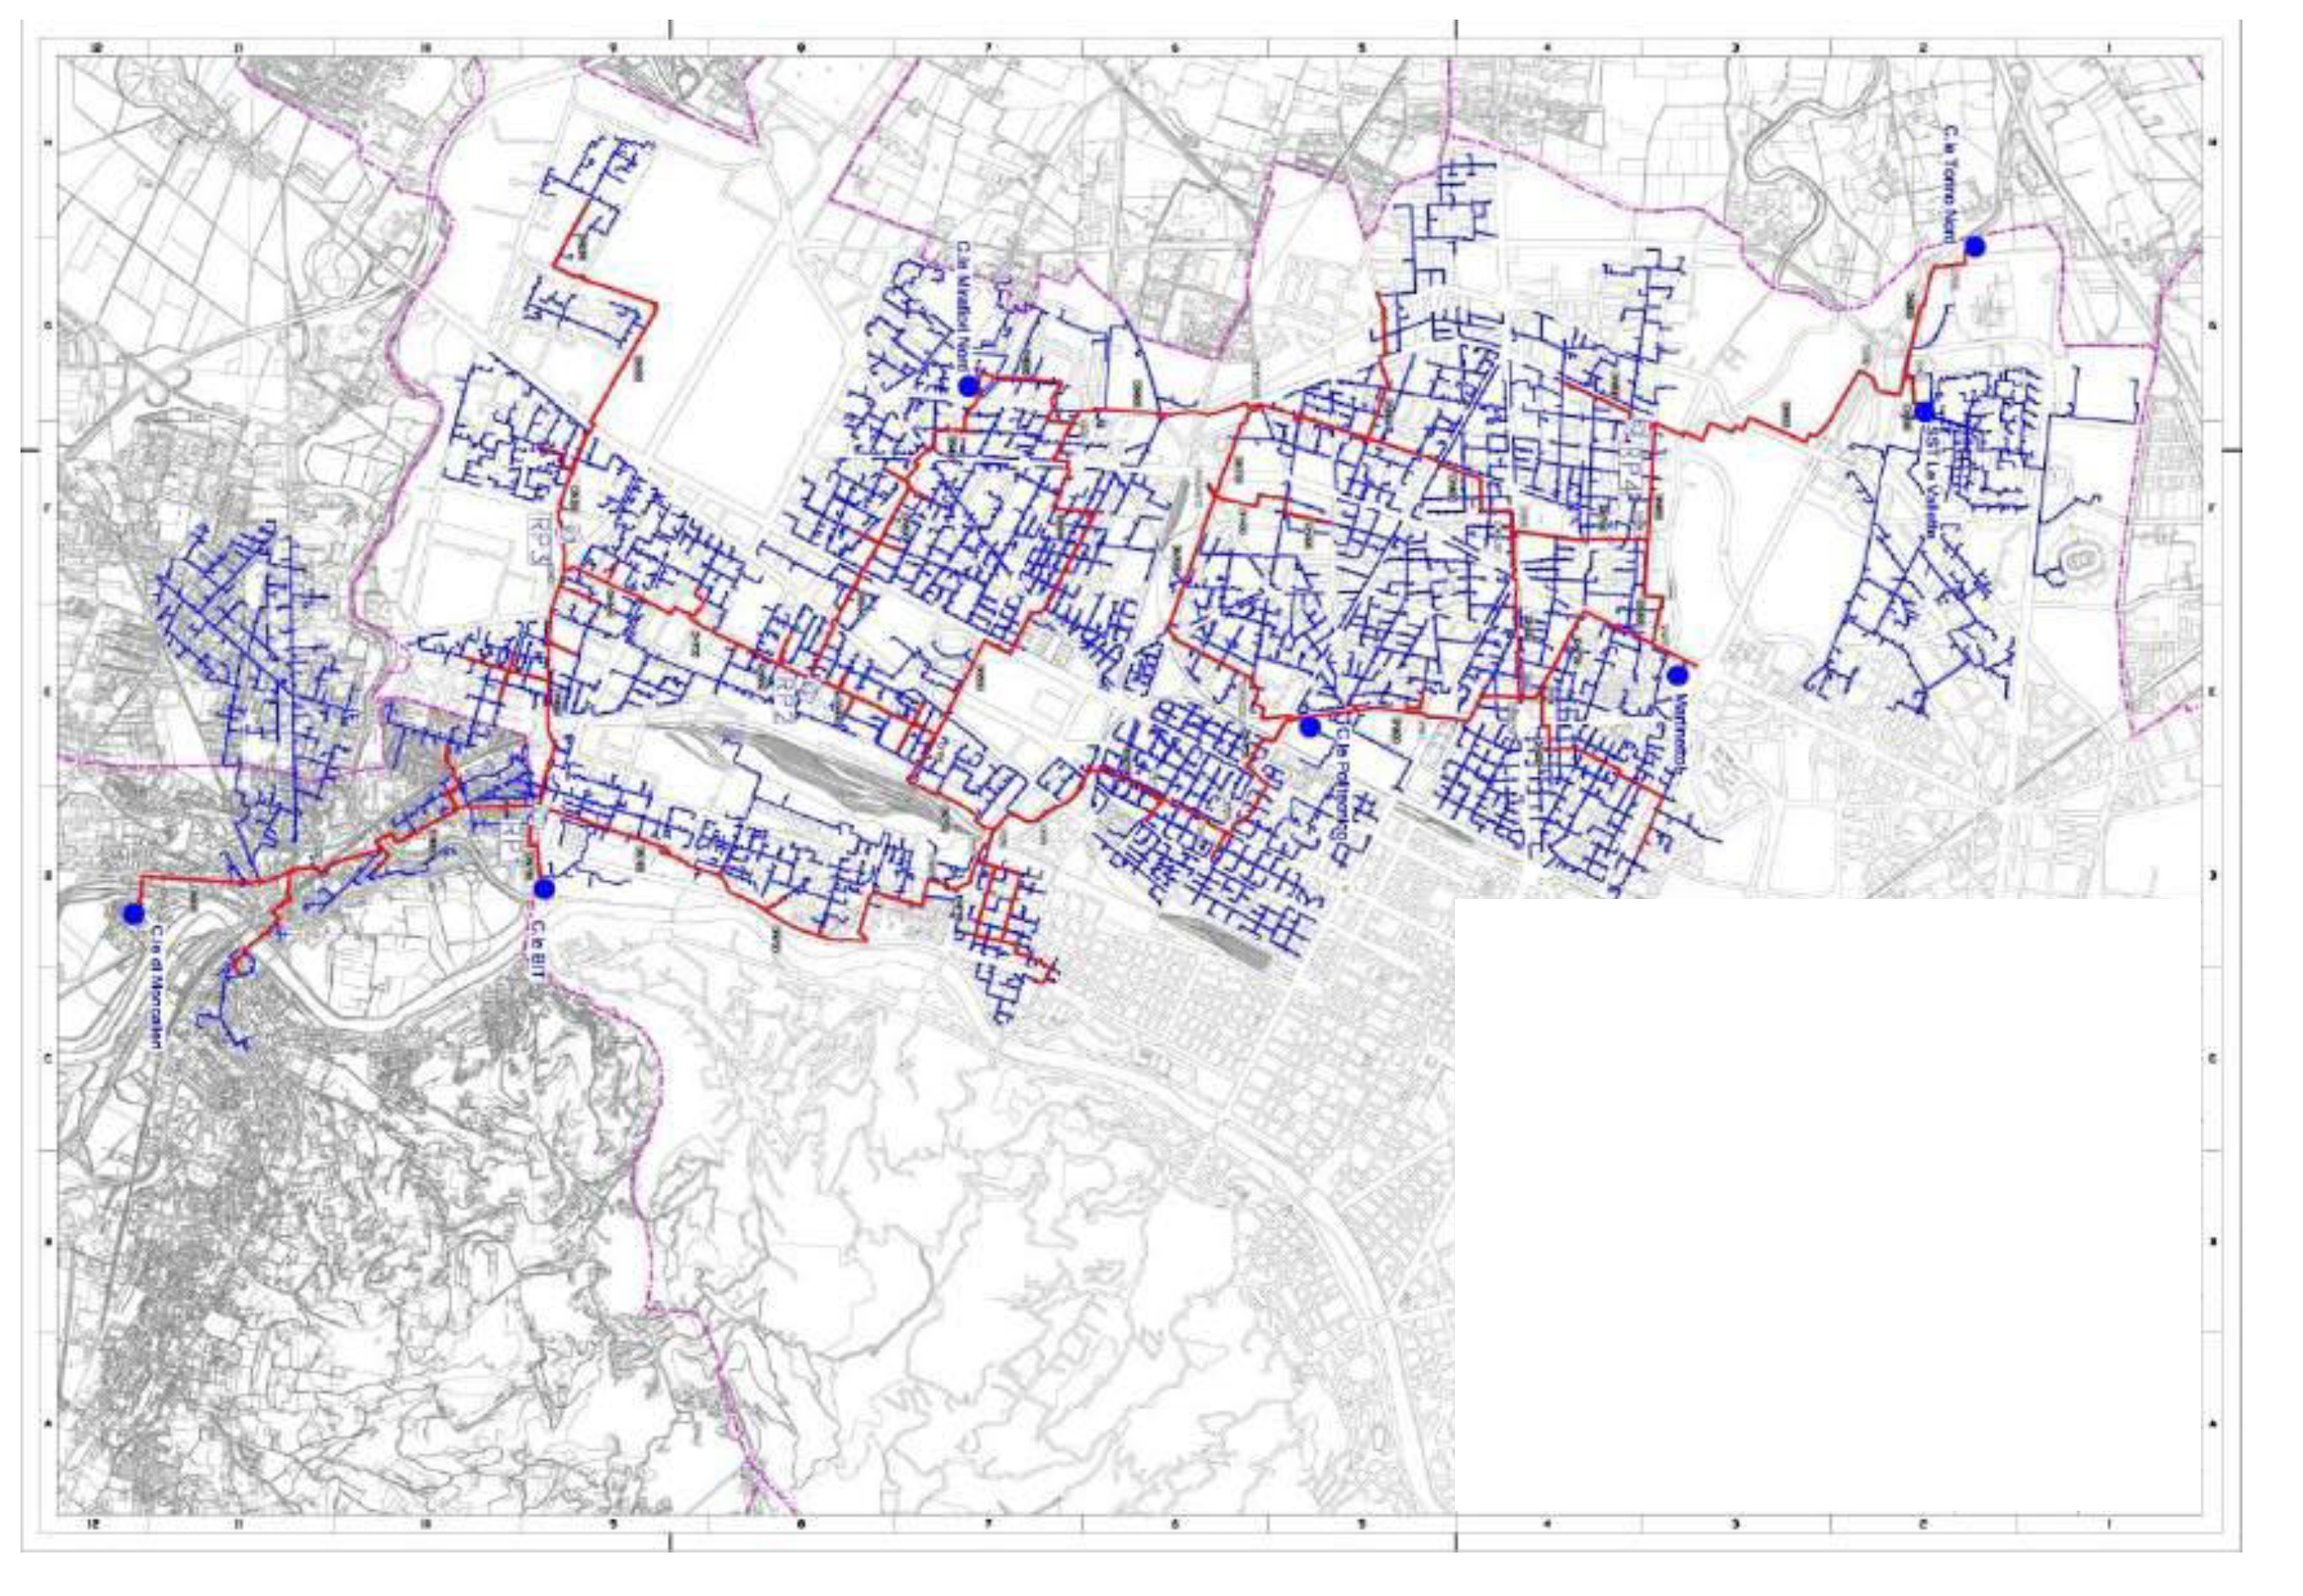
25]. Turin has a large-size district heating network (reported in
Figure 1) which provides heat more then 50% of the overall city heating volume. The heat produced in the system is generated by high-efficiency natural gas-fired combined cycles power plants. The Turin district heating system is currently the largest system in Italy, and among the largest systems in Europe. It supplies heat to ~62 million m
of buildings volume, with 6455 substations, and it has a total network extension of ~568 km [
26].
The largest part of the energy supply is produced by three combined heat and power (CHP) plants located in Turin and Moncalieri [
29], which provide approximately 95% of the annual thermal energy demand [
26,
30] with an average overall efficiency equal to 74% [
26]. Integration gas-fired boilers and thermal storage systems are used during peak hours and to optimise the overall system performance. Thanks to the use of CHP plants, the DH network has always been considered more efficient than the separate production of heat and electricity, and an additional advantage in comparison with individual gas boilers is related to the higher effectiveness in filtering pollutants emissions, especially NO
X.
The network is operated at 120–95 °C supply and 80–45 °C return temperatures, depending on the month of the year. Pumping stations are installed at each thermal plant, and different booster pumping groups are located along the network to ensure acceptable pressure levels in all the network branches. The main characteristics of the DH system components are listed in
Table 1.
2. Methods
The methodology of LCA is defined in detail in the norm ISO 14040/44 [
31], where all the specific rules and the main hypotheses are illustrated. It is composed of 4 main sections:
The first three sections are related to the input data and the hypotheses that are chosen for each study.
2.1. Definition of Goal and Scope
The scope of this study is to estimate the life cycle impact of 1 kWh of thermal energy produced in the Turin DH system and supplied to the final users, in comparison with 1 kWh generated in households by individual natural gas boilers (GB). Concerning the system boundaries, we consider the entire supply chain, from raw materials to the energy delivered to users. No decommissioning or recovery processes have been considered, due to the long lifetime that makes the end of life impact hard to estimate.
Regarding the DH system, the LCA study is based on the 2017 Turin DH energy balance provided by AIRU [
26,
28]. Moreover, to slightly simplify the analysis, not all the components of the DH system are considered in this paper. As 94% of the DH thermal energy is provided by CHPs, and even larger shares in some recent years, integration plants are not considered. Moreover, due to difficulties in finding reliable data even pumping stations and storages have not been considered.
As no specific information was available on the origin of building materials, Ecoinvent 3 global average material streams have been used, by considering the steel used for the construction of heat exchangers and piping. Moreover, for materials transformation, we used average manufacturing processes streams or simple material flow (both available in the Ecoinvent 3 database [
32]), due to a lack of data about their actual production processes, which have been performed at different stages of network expansions. A lifetime of 25 years has been assumed for CHP plants the heat exchangers and the natural gas boiler. For the piping network, a lifetime of 40 years has been assumed, in accordance with usual hypotheses in similar studies. Moreover, as CHP technology involves multiple outputs, a proper allocation method is needed to associate the impacts on the heat and electricity generation respectively. The choice of the allocation method is an important aspect, as it can have a significant impact on the results [
33]. In this paper, a comparison between two allocation methodologies is conducted to represent the range of variability of the results.
As a single DH substation generally serves one condominium or a group of them, it has been decided to compare the DH solution in comparison with 40 distributed gas boiler, representing a large condominium. As already stated in the introduction, GB represent the reference solution for domestic heating system with many different product and configuration possibilities. For this reason, we have decided to use the already present Ecoinvent stream “market for gas boiler, cut-off, S” instead of a precise configuration. The “market for gas boiler, cut-off, S” represent the amount of materials and energy (from cradle) spent to make a generic 10 kW gas boiler with the main components such as burner, safety valves and water pipes.
2.2. Life Cycle Inventory Analysis
The inventory section contains the different data about streams and materials used in the analysis. The main data at the basis of this study are recapped in
Table 2.
As already said, the energy generation and natural gas consumption data for the DH system have been taken from the most recent operation data available (year 2017), as well as the energy balance data: so, they can be considered as primary data (i.e., directly referred to the plant that is being analysed). In addition, since the consumed gas and the output thermal energy are known, the efficiency is implicitly considered in the calculation. Concerning the CHP plant construction and natural gas boilers, already available streams from Ecoinvent 3 database have been used. The power plants’ heat exchanger is a shell-and-tube one and it has been characterised with its nominal parameters (water temperature difference, type of materials, heat transfer coefficient, external dimension, etc.) by a direct interview with the operator of the plants. Starting from these data, an estimation of the steel amount has been performed by sizing the heat exchanger following the thermodynamic laws and EN10255 prescriptions [
34]. In particular, having the nominal temperature difference and the nominal
U value W/(m
K) the needed surface has been estimated with Equation (
1),
where
P is the rated thermal power (reported in
Table 1),
U is the heat transfer coefficient equal to 2300 [W/m
K],
is the mean logarithmic temperature difference, and
A [m
] is the heat exchanger surface. Knowing the pipes and vessel dimensions and thicknesses (retrieved from EN10255 and direct interview), it is possible to estimate the total amount of steel needed for the heat exchangers construction. Finally, it has been used a heat exchanger efficiency
= 1.0 because the output thermal energy reported in the AIRU report already take into account the heat exchanger efficiency (See
Table 3 where the same thermal energy output is reported for the CHP plant and for the Plant Heat exchanger). In
Table 3 are reported the main used parameters.
Instead, the users’ plate heat exchanger has been sized and designed based on different catalogues from producers [
35,
36], where typical weight, dimension, number of plates, and materials have been selected.
Table 4 recaps the main parameter used for sizing. The heat exchanger are mainly made by steel and presents 150 flat plates to drive the heat exchange between the DH water (120–90 °C) and the heating system water (80–40 °C). Using the rated power and the needed surface (calculated with Equation (
1)), product composition and typology has been selected from the catalogues. An overall thermal efficiency of 0.9 has been used.
Finally, pipes diameters, insulation thicknesses and materials have been designed based on the LOGSTOR catalogue available on the website [
37], considering the characteristics of the network. The DH present different pipe diameters across the network. As the precise extension per each diameter is a difficult information to retrieve, an average value of 400 mm as outer diameter has been used (catalogue range: 1200–20 mm). The pipe is composed of three layers: a steel body, a polyuretane foam insulation layer and an outer chasing in polyethylene and the linear mass for the 400 mm pipes is equal to 79 kg/m. As reported in
Table 5, the mass of the different layers has been estimated starting from the thicknesses and material density of the different layers. Moreover, a thermal efficiency equal to 0.81 [
26] has been used for the piping network.
Moreover, we did not consider the impact of network construction, due to the difficulty of finding reliable data. It is worth mentioning that for all manufacturing processes of the pipes and the heat exchangers, impacts have been estimated with the Ecoinvent 3 average manufacturing processes streams. As reported in
Table 2, high pressure natural gas stream has been selected for both the gas boiler and CHP plant components in order to keep the same energy source for the two technologies.
The GB scenario, partially introduced in paragraph
Section 2.1, takes into account 40 distributed gas boiler of 10 kW as rated power (total of 400 kW, as the DH substation) with an overall thermal efficiency of 0.9. In order to fairly compare the GB solution with the DH one, the thermal energy output of the 40 units as been equal to the average thermal energy delivered from a single substation. This value has been retrieved by dividing the overall thermal energy delivered by the DH system (2.17 × 10
MWh) to the total number of substation (6455). Then, using a
= 39 MJ/m
and an efficiency
, the overall gas consumption has been calculated together with the CO
emissions, following the stoichiometric reaction (1 mole of CO
per mole of CH
). Again, the input data are reported in
Table 2.
To sum up, we can consider energy balance data (gas input, electricity production, thermal energy delivered, etc.), CO2 emissions and materials for the plant heat exchanger as primary data, while considering plant and boilers construction, manufacturing processes and material extraction as secondary data.
2.3. Life Cycle Impact Assessment
The LCA analysis has been conducted with OpenLCA software [
38] and the Life Cycle Impact Assessment (LCIA) method used to assess the values of LCA indicators is the CML (v4.4 2015) method developed by the Leiden University [
39]. In this method, a set of impact categories and and characterisation method have been linked to the Ecoinvent stream database [
40] in order to effectively manage all the streams during the LCIA phase. In particular, for the Global Warming category, global warming potential (GWP) factors by IPCC are used to calculate the impact. Moreover, different time horizon are available (20,100,500 years). As recommended in [
41], this work use the 100 year time horizon
. The detailed method and specification are reported in [
41], while the flows database is freely downloadable from [
42].
The different impact categories available are listed in
Table 6, but the focus of our analysis is on the “Climate Change” impact category. Further information about the method can be found in [
43,
44]. Moreover, in the first column of
Table 6 are reported the different SDGs for which the impact categories are relevant, to further describe the implications in the perspective on global sustainable goals [
5].
An additional aspect to be discussed is the allocation factor of the energy output. As already stated, the DH system considered in this study is based on CHP units that are producing both heat and power outputs, and proper allocation factors are needed to estimate the impact associated to the heat supplied to final users. In [
33], different allocation factors methodologies are reported and evaluated, and two of them are used in this study: the Energy Methodology (EN) and the Exergy Methodology (EX). The former is based on the idea of allocating the impacts depending on the amount of energy produced for each type, i.e., without differentiating the higher “
” of electrical energy (
E) with respect to thermal energy (
Q). The electricity and heat factor
and
can be calculated as follows.
The two factors are then multiplied for the overall emissions in order to allocate the overall CO
emission [kg
] to the different energy output. On the other hand, the Exergy approach has the aim of giving a different weighting factor to power generation, which has a higher value given the possibility of converting it further to heat. In particular, for electricity, the exergy coincides with the energy, while for the heat, it is related to the delivered temperature. Therefore, the two factors are calculated as follows,
where
is the reference temperature, equal to 298 K, while
is defined as
where
and
are, respectively, the supply and return temperatures of the DH network in Kelvin (393–353 K). The choice of the Exergy methodology is in accordance to the idea that in traditional power plants (at the time of the construction of the DH system under analysis) the electricity generation was the priority, with heat being a by-product that was usually dissipated and, for this reason, the allocation factor for the heat is much lower with respect to the electricity one. In the current energy transition, the strong penetration of renewable technologies for power generation has changed this perspective. Thus, we believe that a comparison of these two methods may be of use for the reader to compare alternative approaches. The used allocation coefficients are reported in
Table 7.
These two methods have been chosen because their allocation requires no additional external hypothesis, such as reference efficiency parameters, which can have a significant impact on the results. In the case of the Power Bonus Method, which is defined in the European and Italian legislation, the reference efficiency for natural gas power plants results in a 100% allocation of resources and impacts on electricity. This would lead to a virtually carbon-free heat, which is not a meaningful result for this study. These aspects are described in greater detail in [
33].
3. Results and Discussion
The output of the LCA process has been divided by the useful heat and electricity generated by the DH system, with a proper allocation in the CHP unit. The same study has been performed on small-size distributed natural gas boilers, to compare the impacts of the two alternative solutions.
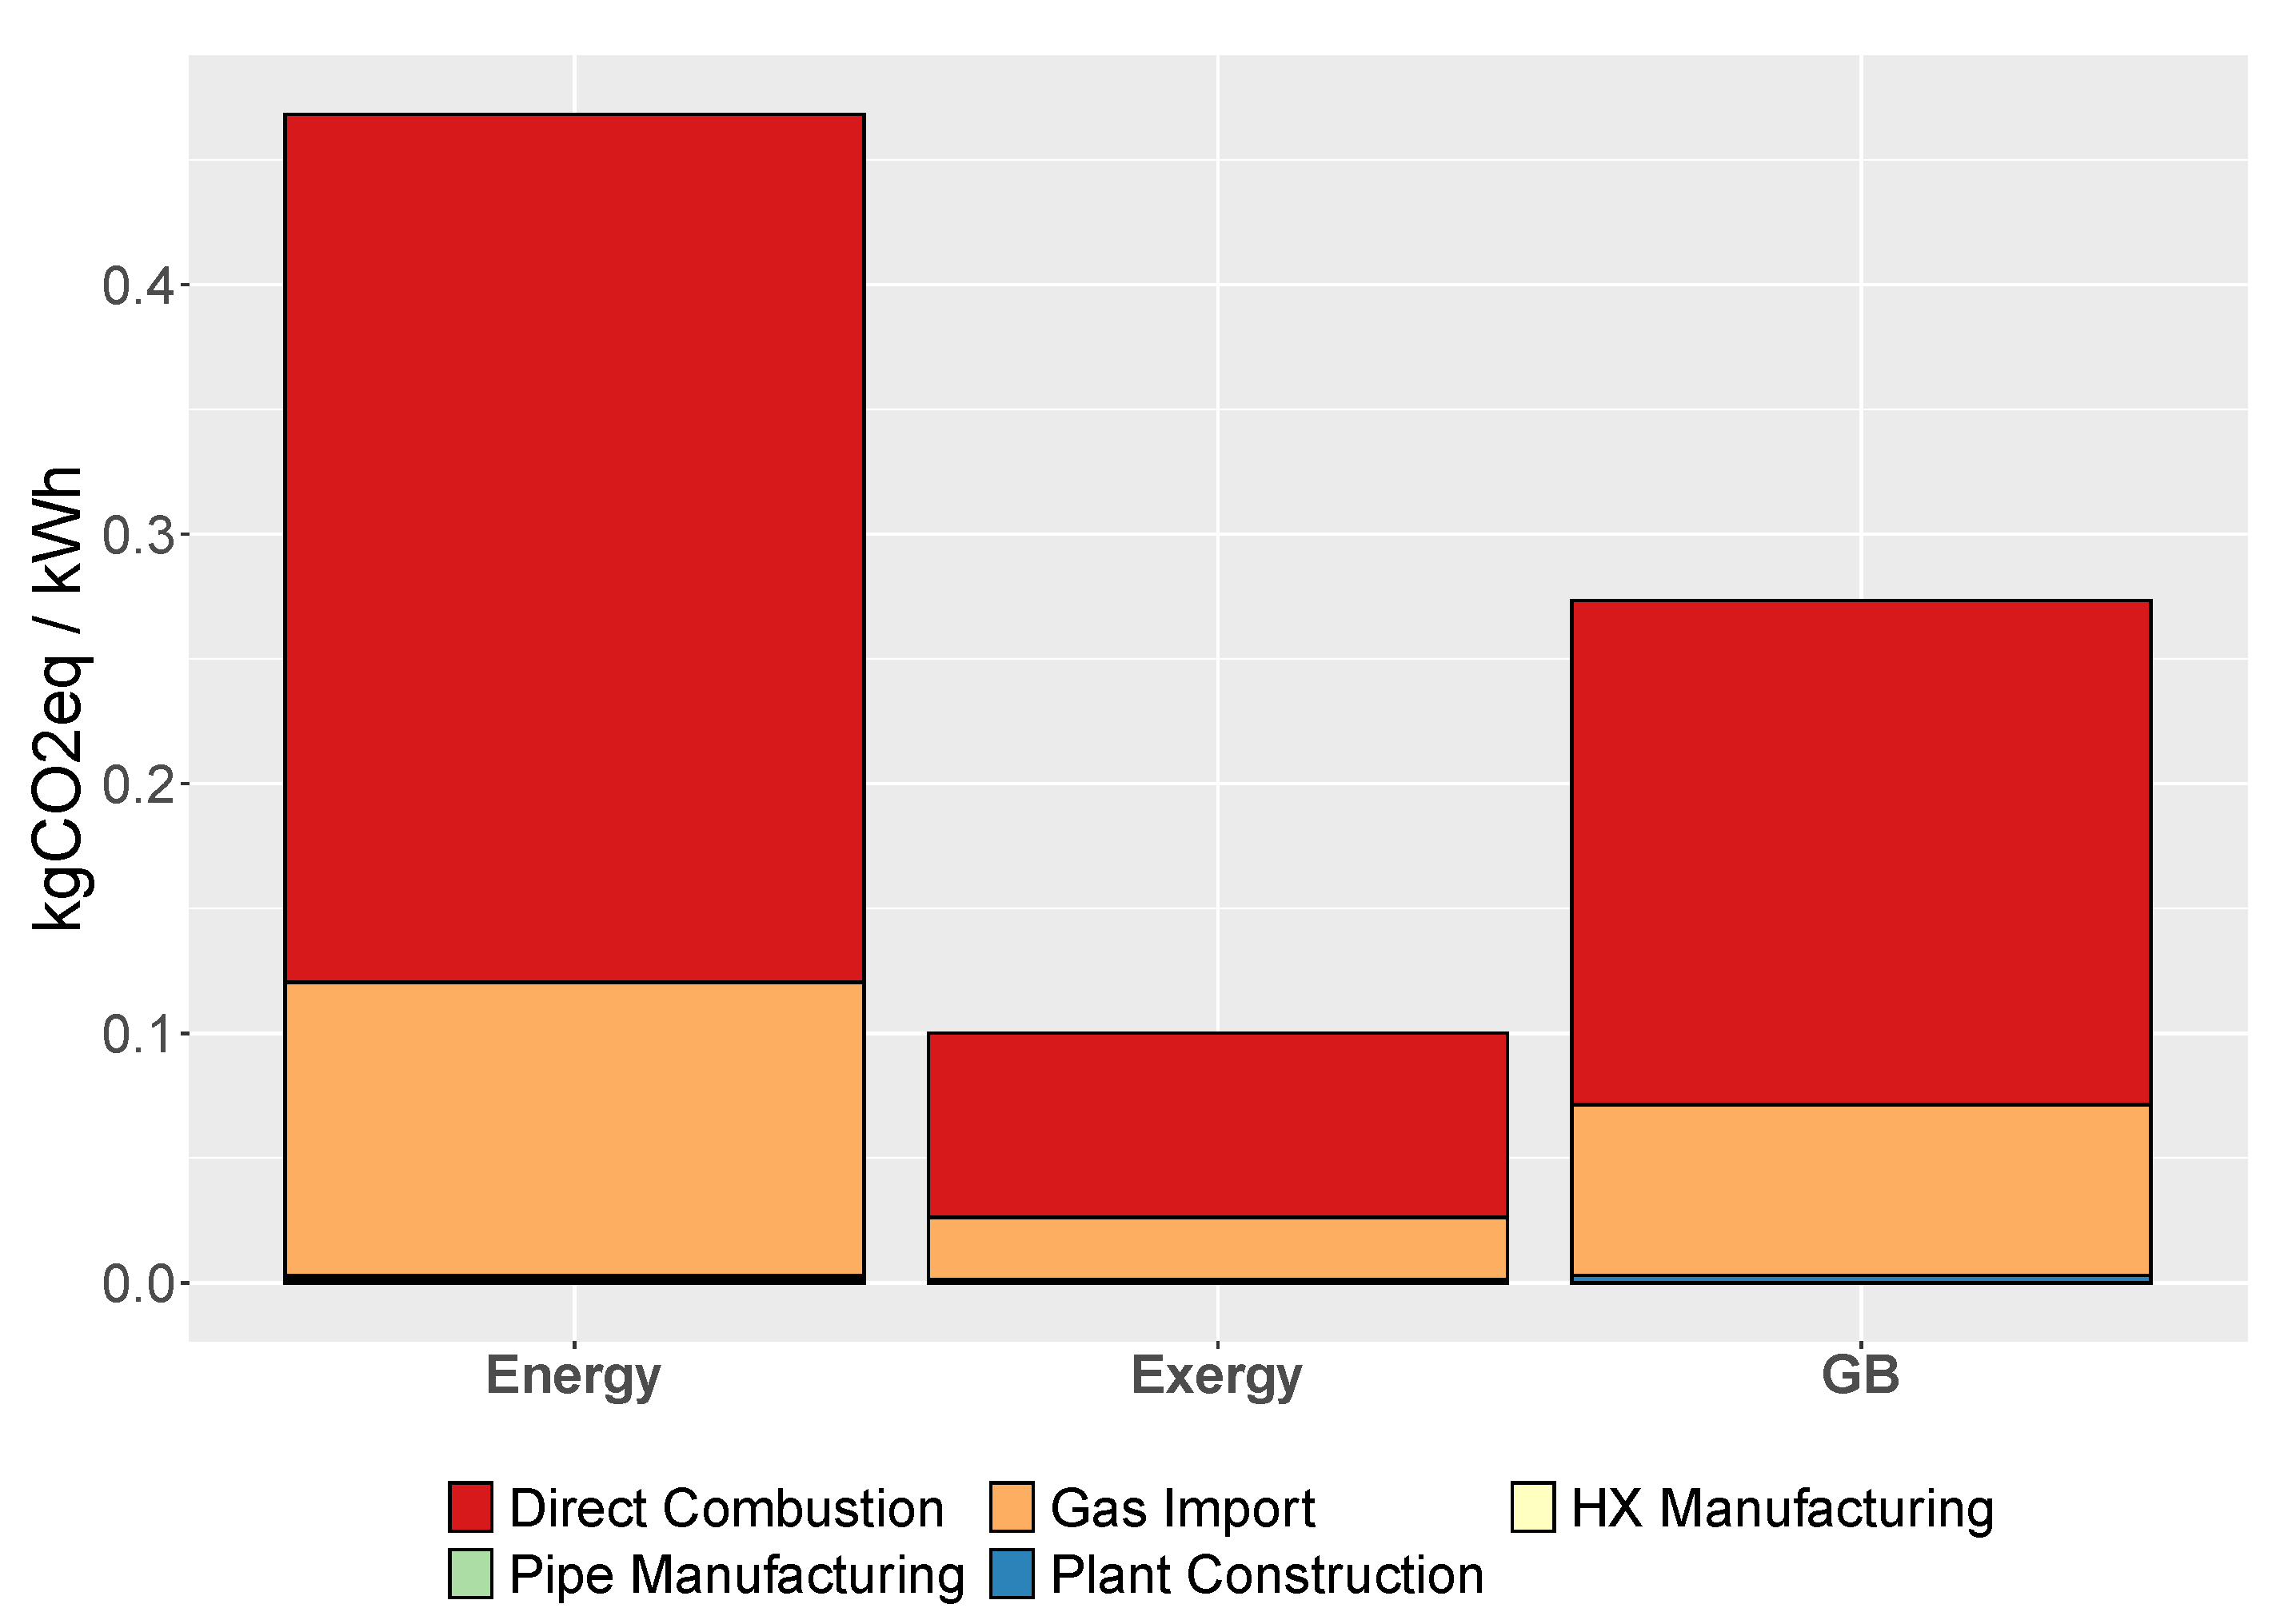
In
Figure 2, the Climate Change impacts calculated for the heat supply are reported, in terms of kg
over useful kWh divided in the different construction and operation phases of the system. The results show an overall impact for individual gas boilers (GB) equal to 0.27 kg
/kWh, while for DH equal to 0.47 and 0.10 kg
/kWh for the Energy and Exergy methodologies, respectively. As expected, the main contribution derives from the natural gas combustion, followed by the gas import (and distribution). It is important to highlight that the system construction is irrelevant for both technologies in accordance with the works in [
15,
16], which has the same results for biomass boilers and air conditioning unit with gas boiler, and thus the common practice of considering operational data when evaluating climate change impacts is a good evaluation (see
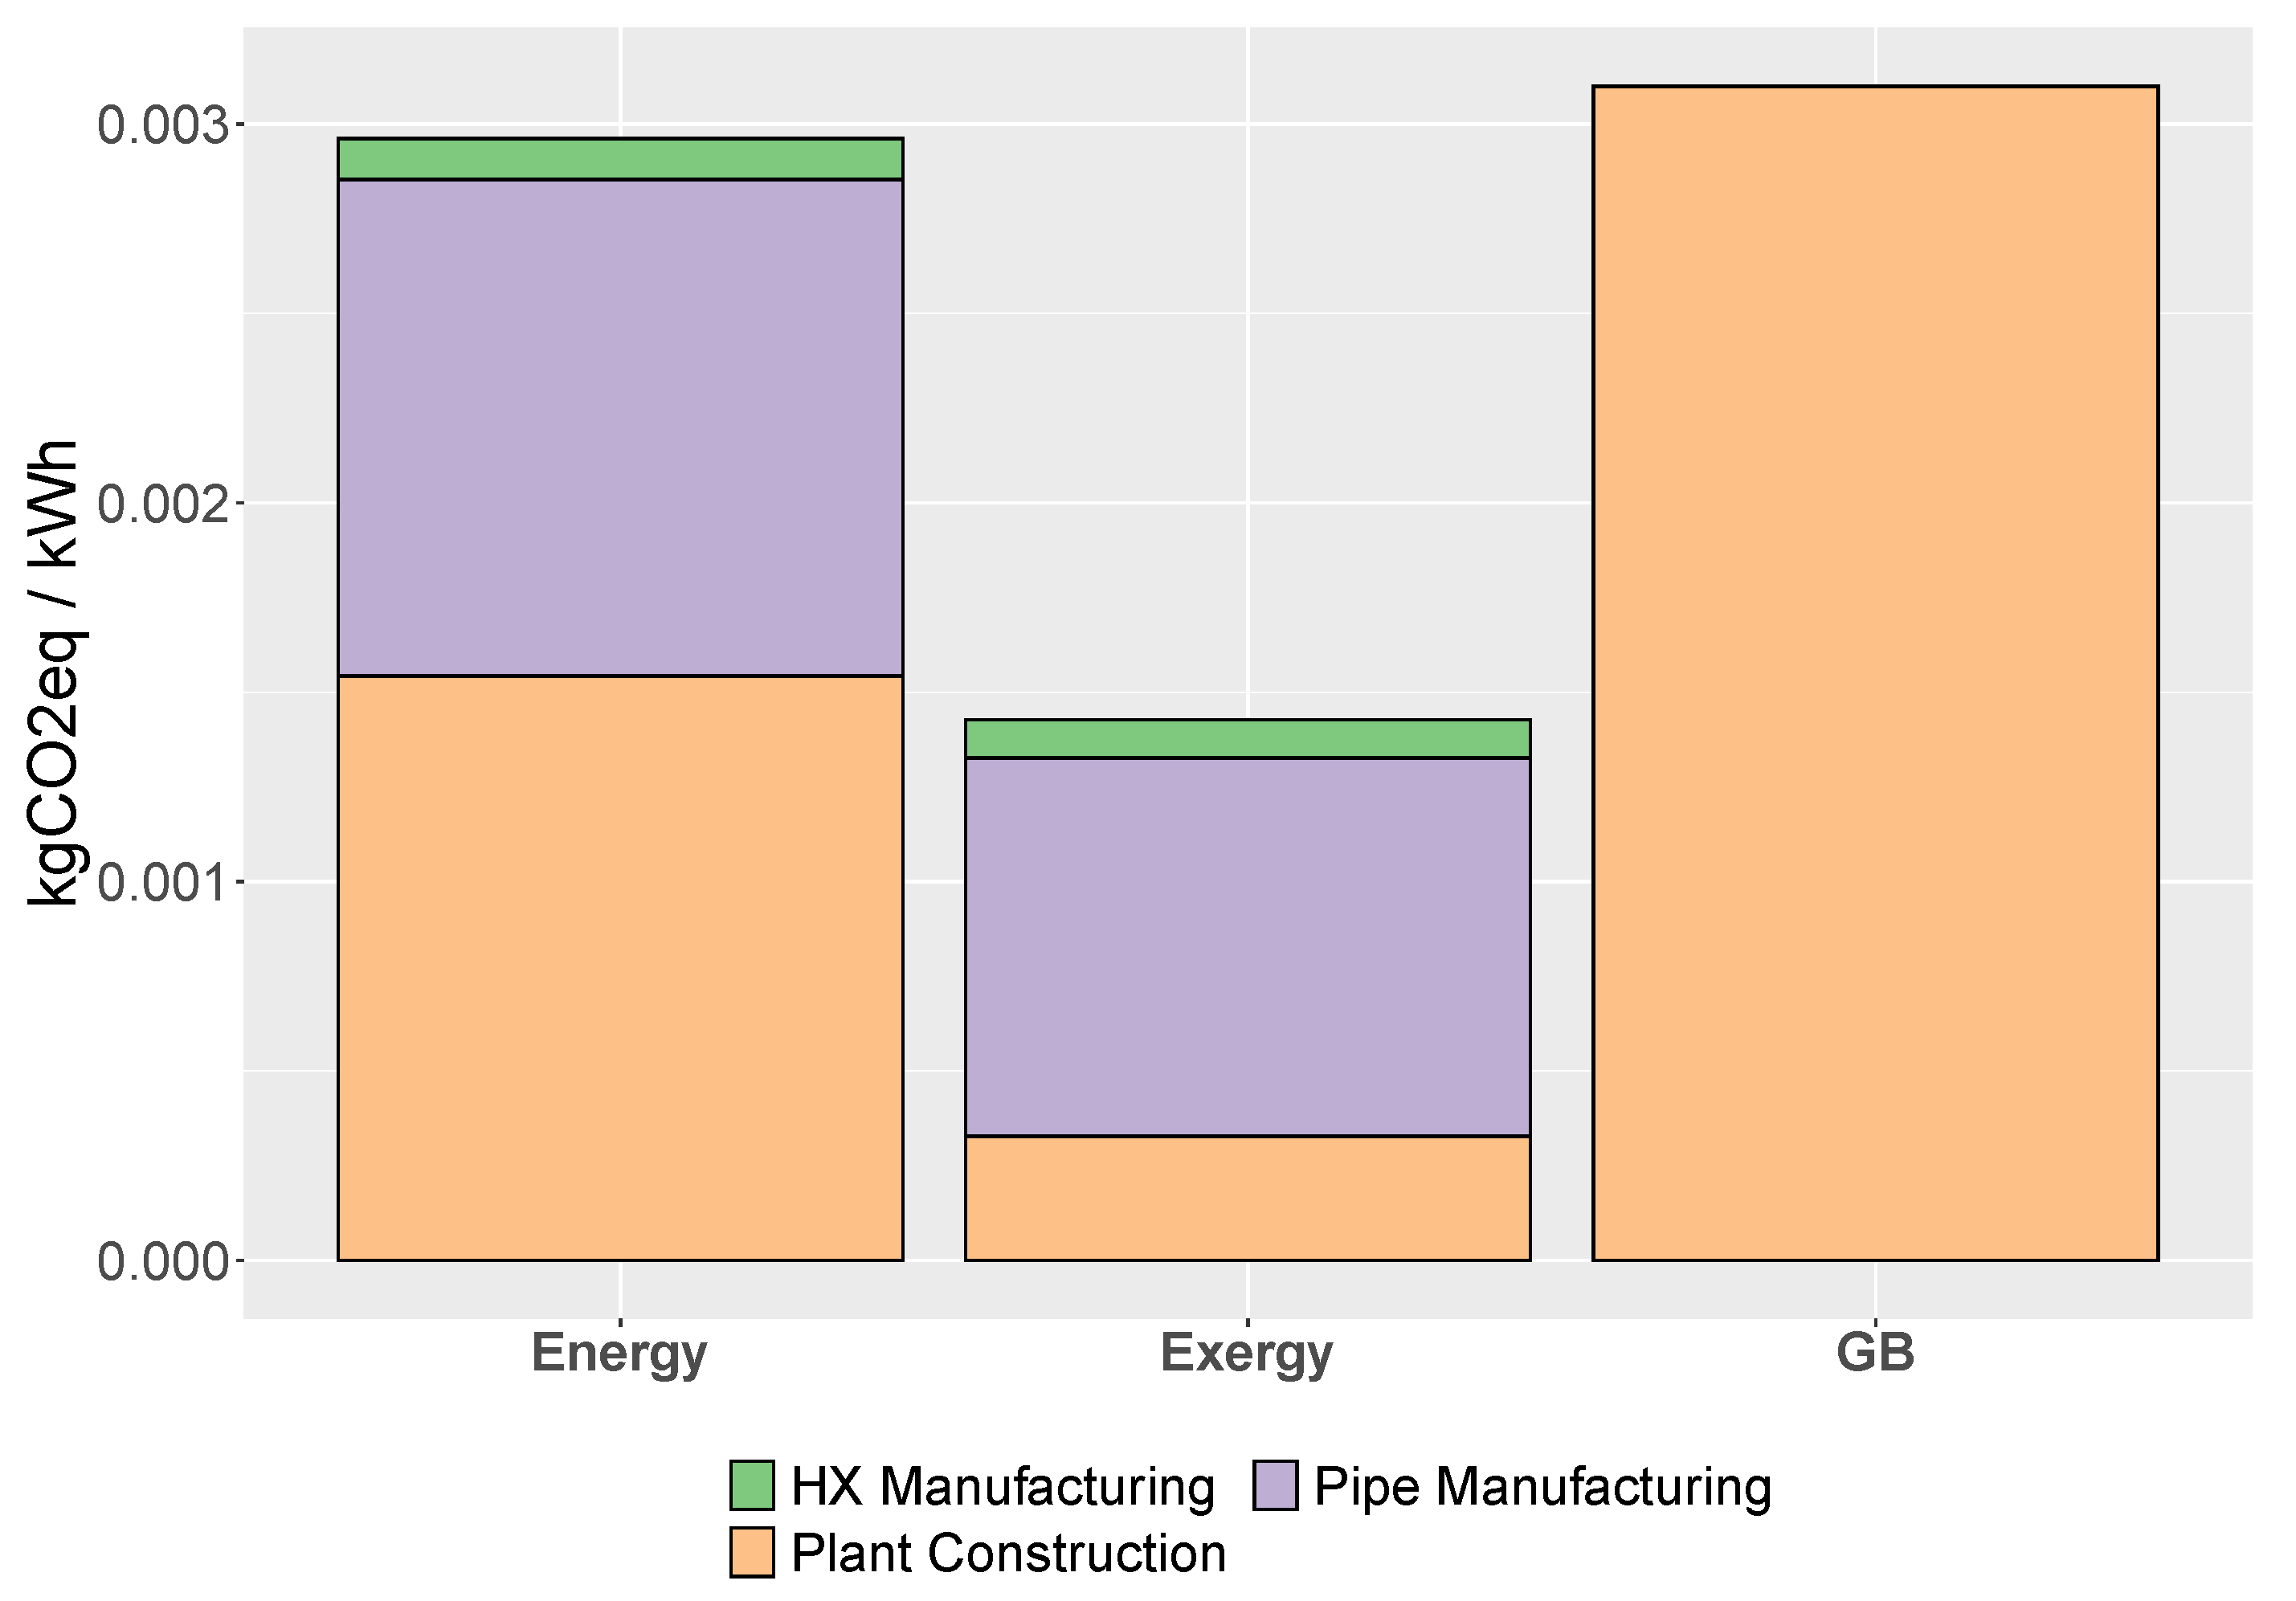
Figure 3 for minor contribution share division).
Another main outcome of this analysis is the dramatic impact of the allocation method on the final results, as, based on this choice, the impact of DH heat can be lower or higher than the individual natural gas boilers. In this case study, a wide gap is noticeable between energy and exergy methodology. The second one boosts the competitiveness of CHP giving to heat production less importance, presenting the DH as a key technology in lowering the emission factor of the heat supply. On the contrary, the energy methodology suggests a less interesting emission factor for heat supplied by DH, which is much higher than the individual boilers solution. Moreover, different allocation methods can be affected not only by the energy production, but also by other variables such as, in the case for the exergy method, the reference temperature considered or the definition of the reference energy system in the alternative generation method. Other methods are also strongly dependent on the specific assumptions that are taken on reference efficiencies. The power bonus method, which is not considered in this study, is strongly affected by the choice of the reference parameters that are used.
It is also important to remark that we are comparing DH with high-efficiency gas boilers (with average annual efficiency of ~90%). However, old and inefficient boilers are still operating in cities with poor combustion/emission control systems and sometimes running on lower quality fossil fuels like diesel or fuel oil. Nevertheless, we believe that our assumption is a fair choice for the average boiler characteristics of the dwellings in Turin, especially considering that old boilers are being gradually phased out following the EU and Italian directives.
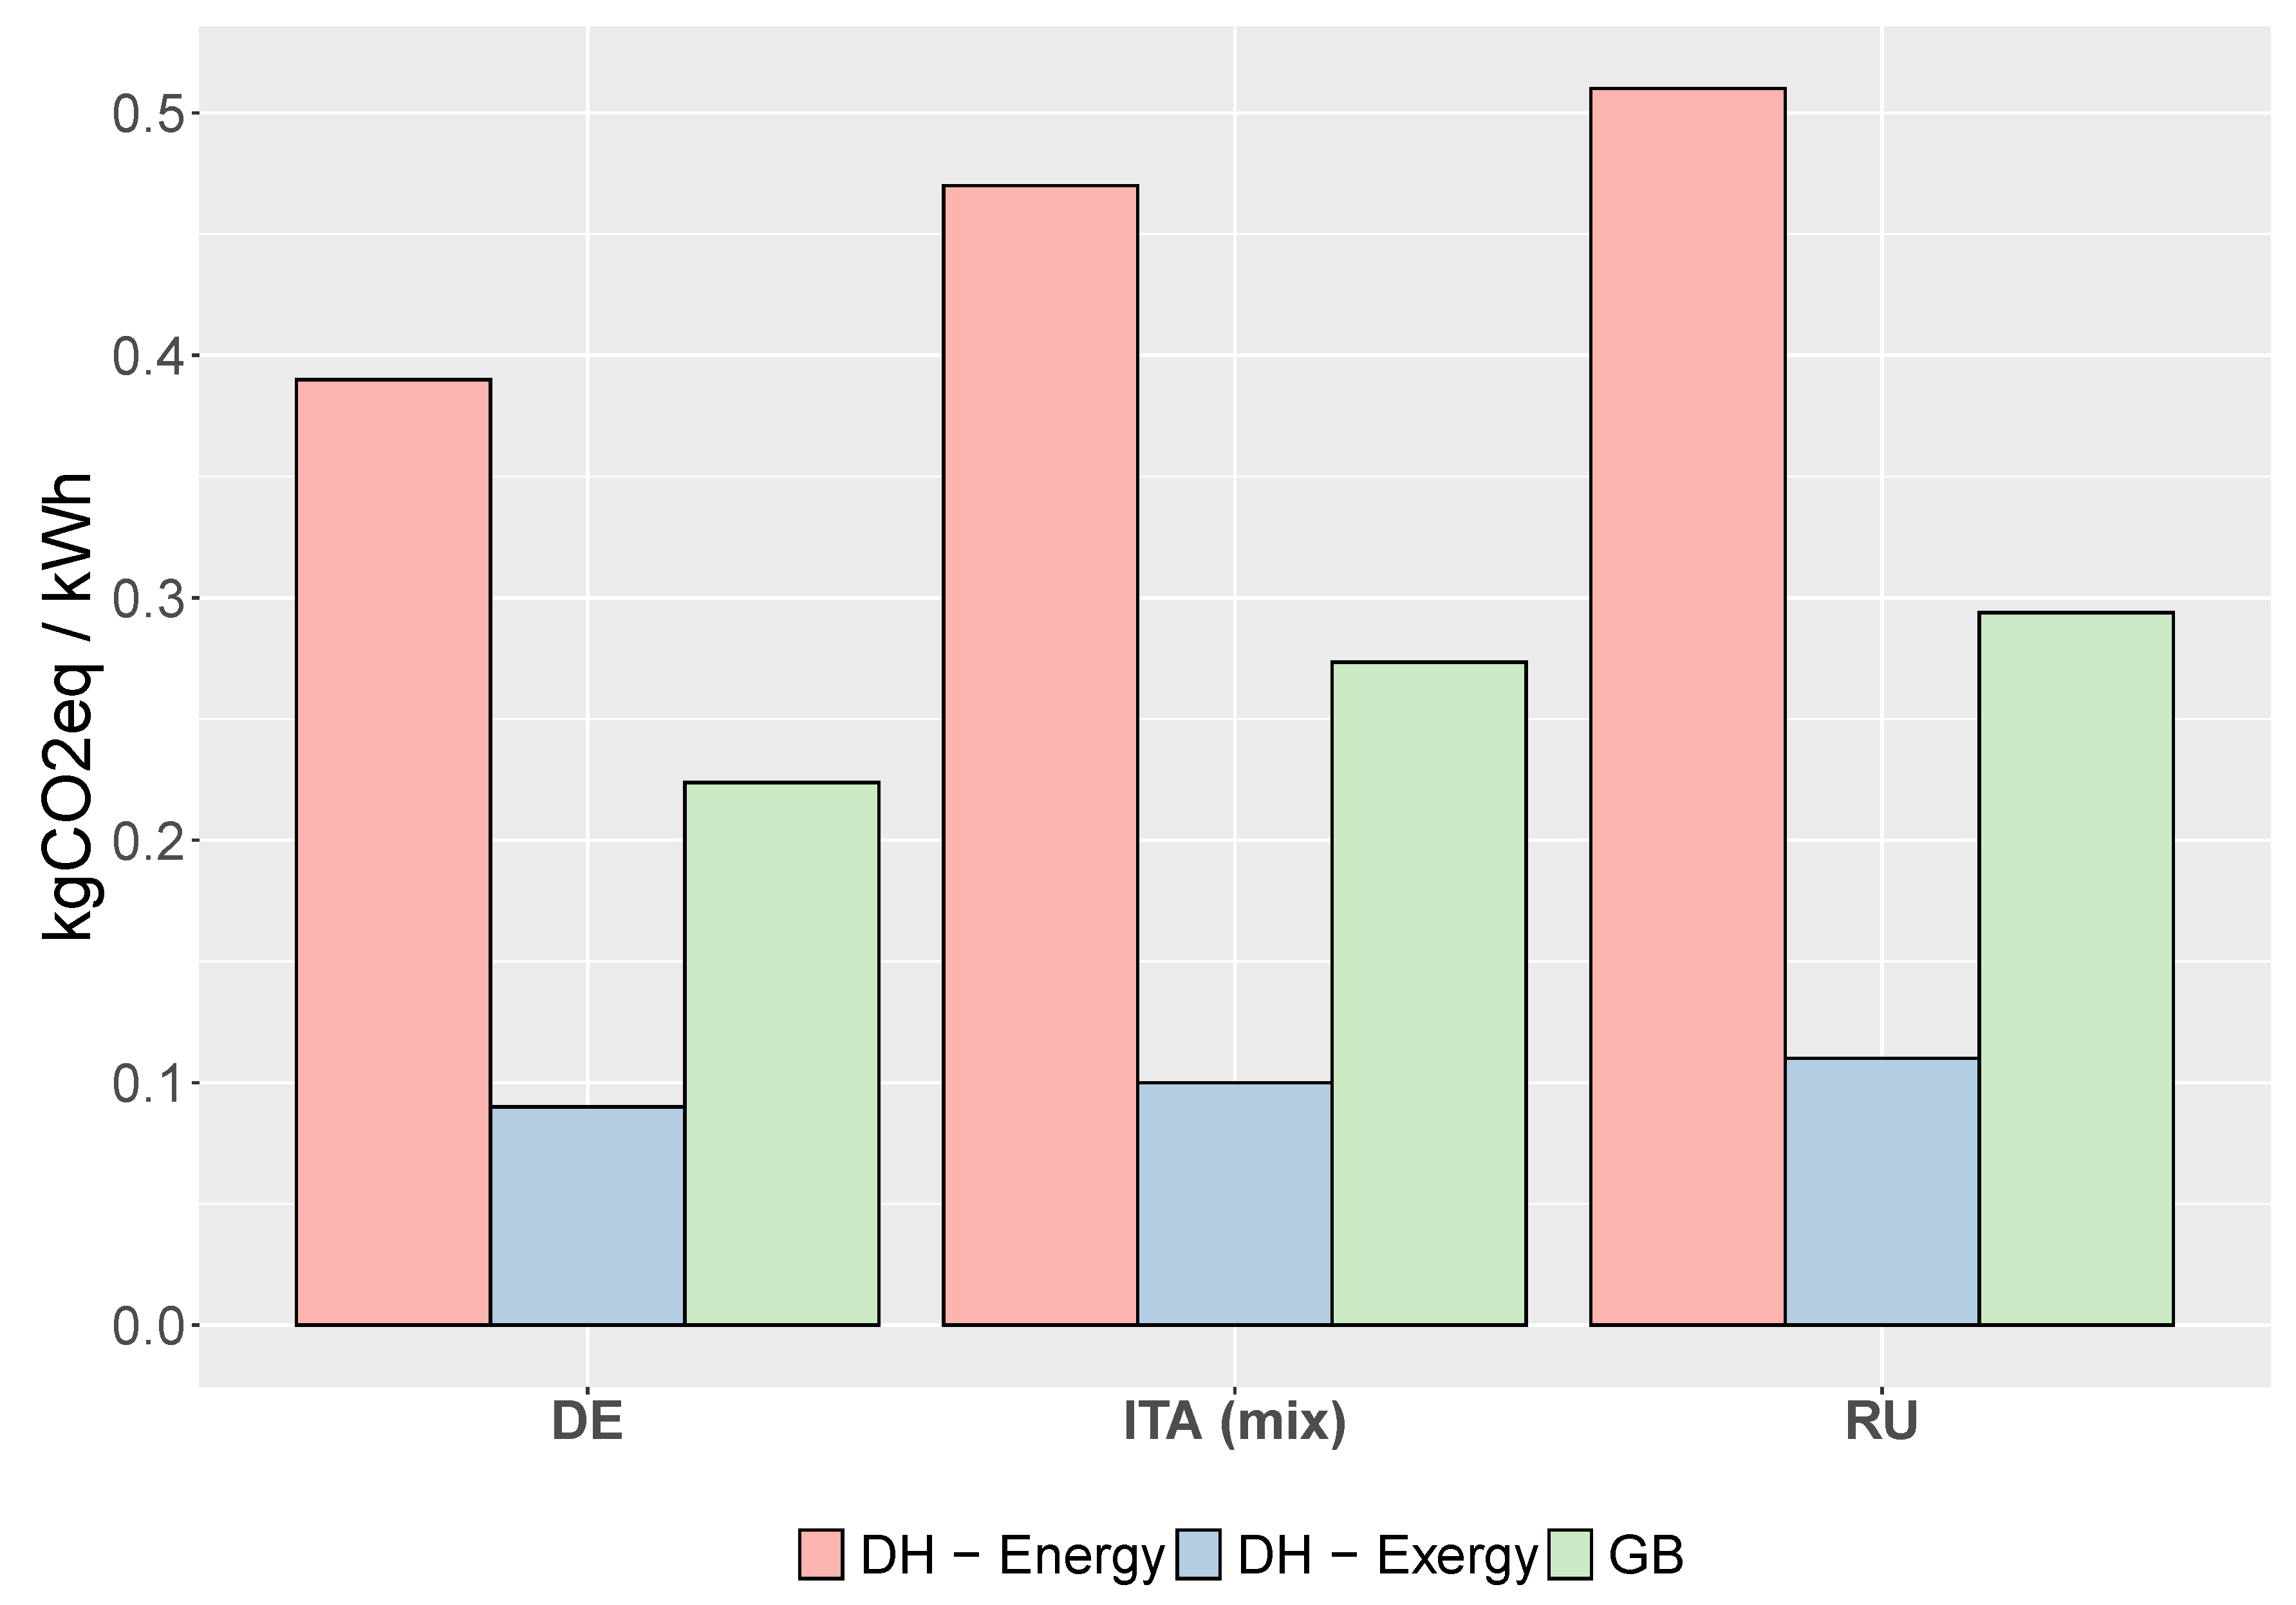
Finally, it is interesting to notice the significant impact of the natural gas import: it is produced not only by the CO2 emitted for construction, but also from the CH4 leakage that has an important impact on climate change as its Global Warming Potential (GWP; i.e., its impact measured as a ratio over the emission of the same amount of CO2) is equal to 25. This aspect should be carefully considered when planning the infrastructure and the gas import: strong actions to limit the leakage rates can significantly lower the overall impact of different gas-based technologies.
This aspect is well presented in
Figure 4, where the impacts are represented as if all the gas was provided from Germany (DE), the current Italian mix (ITA mix) and Russia (RU). The different streams are present present in the Ecoinvent 3 database.
While this analysis has been mostly focused on climate change impacts, some information can be provided also on the other impacts to give the reader a comprehensive overview on the different environmental impacts. The main results of the LCA analysis with respect to all the impacts are reported in
Table 8, where all the impacts are expressed with reference to a unit of heat supplied to the final users (i.e., 1 kWh
). The majority of the impacts shows comparable results for DH and individual boilers, with the impact of the allocation methodology that is strongly affecting the comparison between the systems.
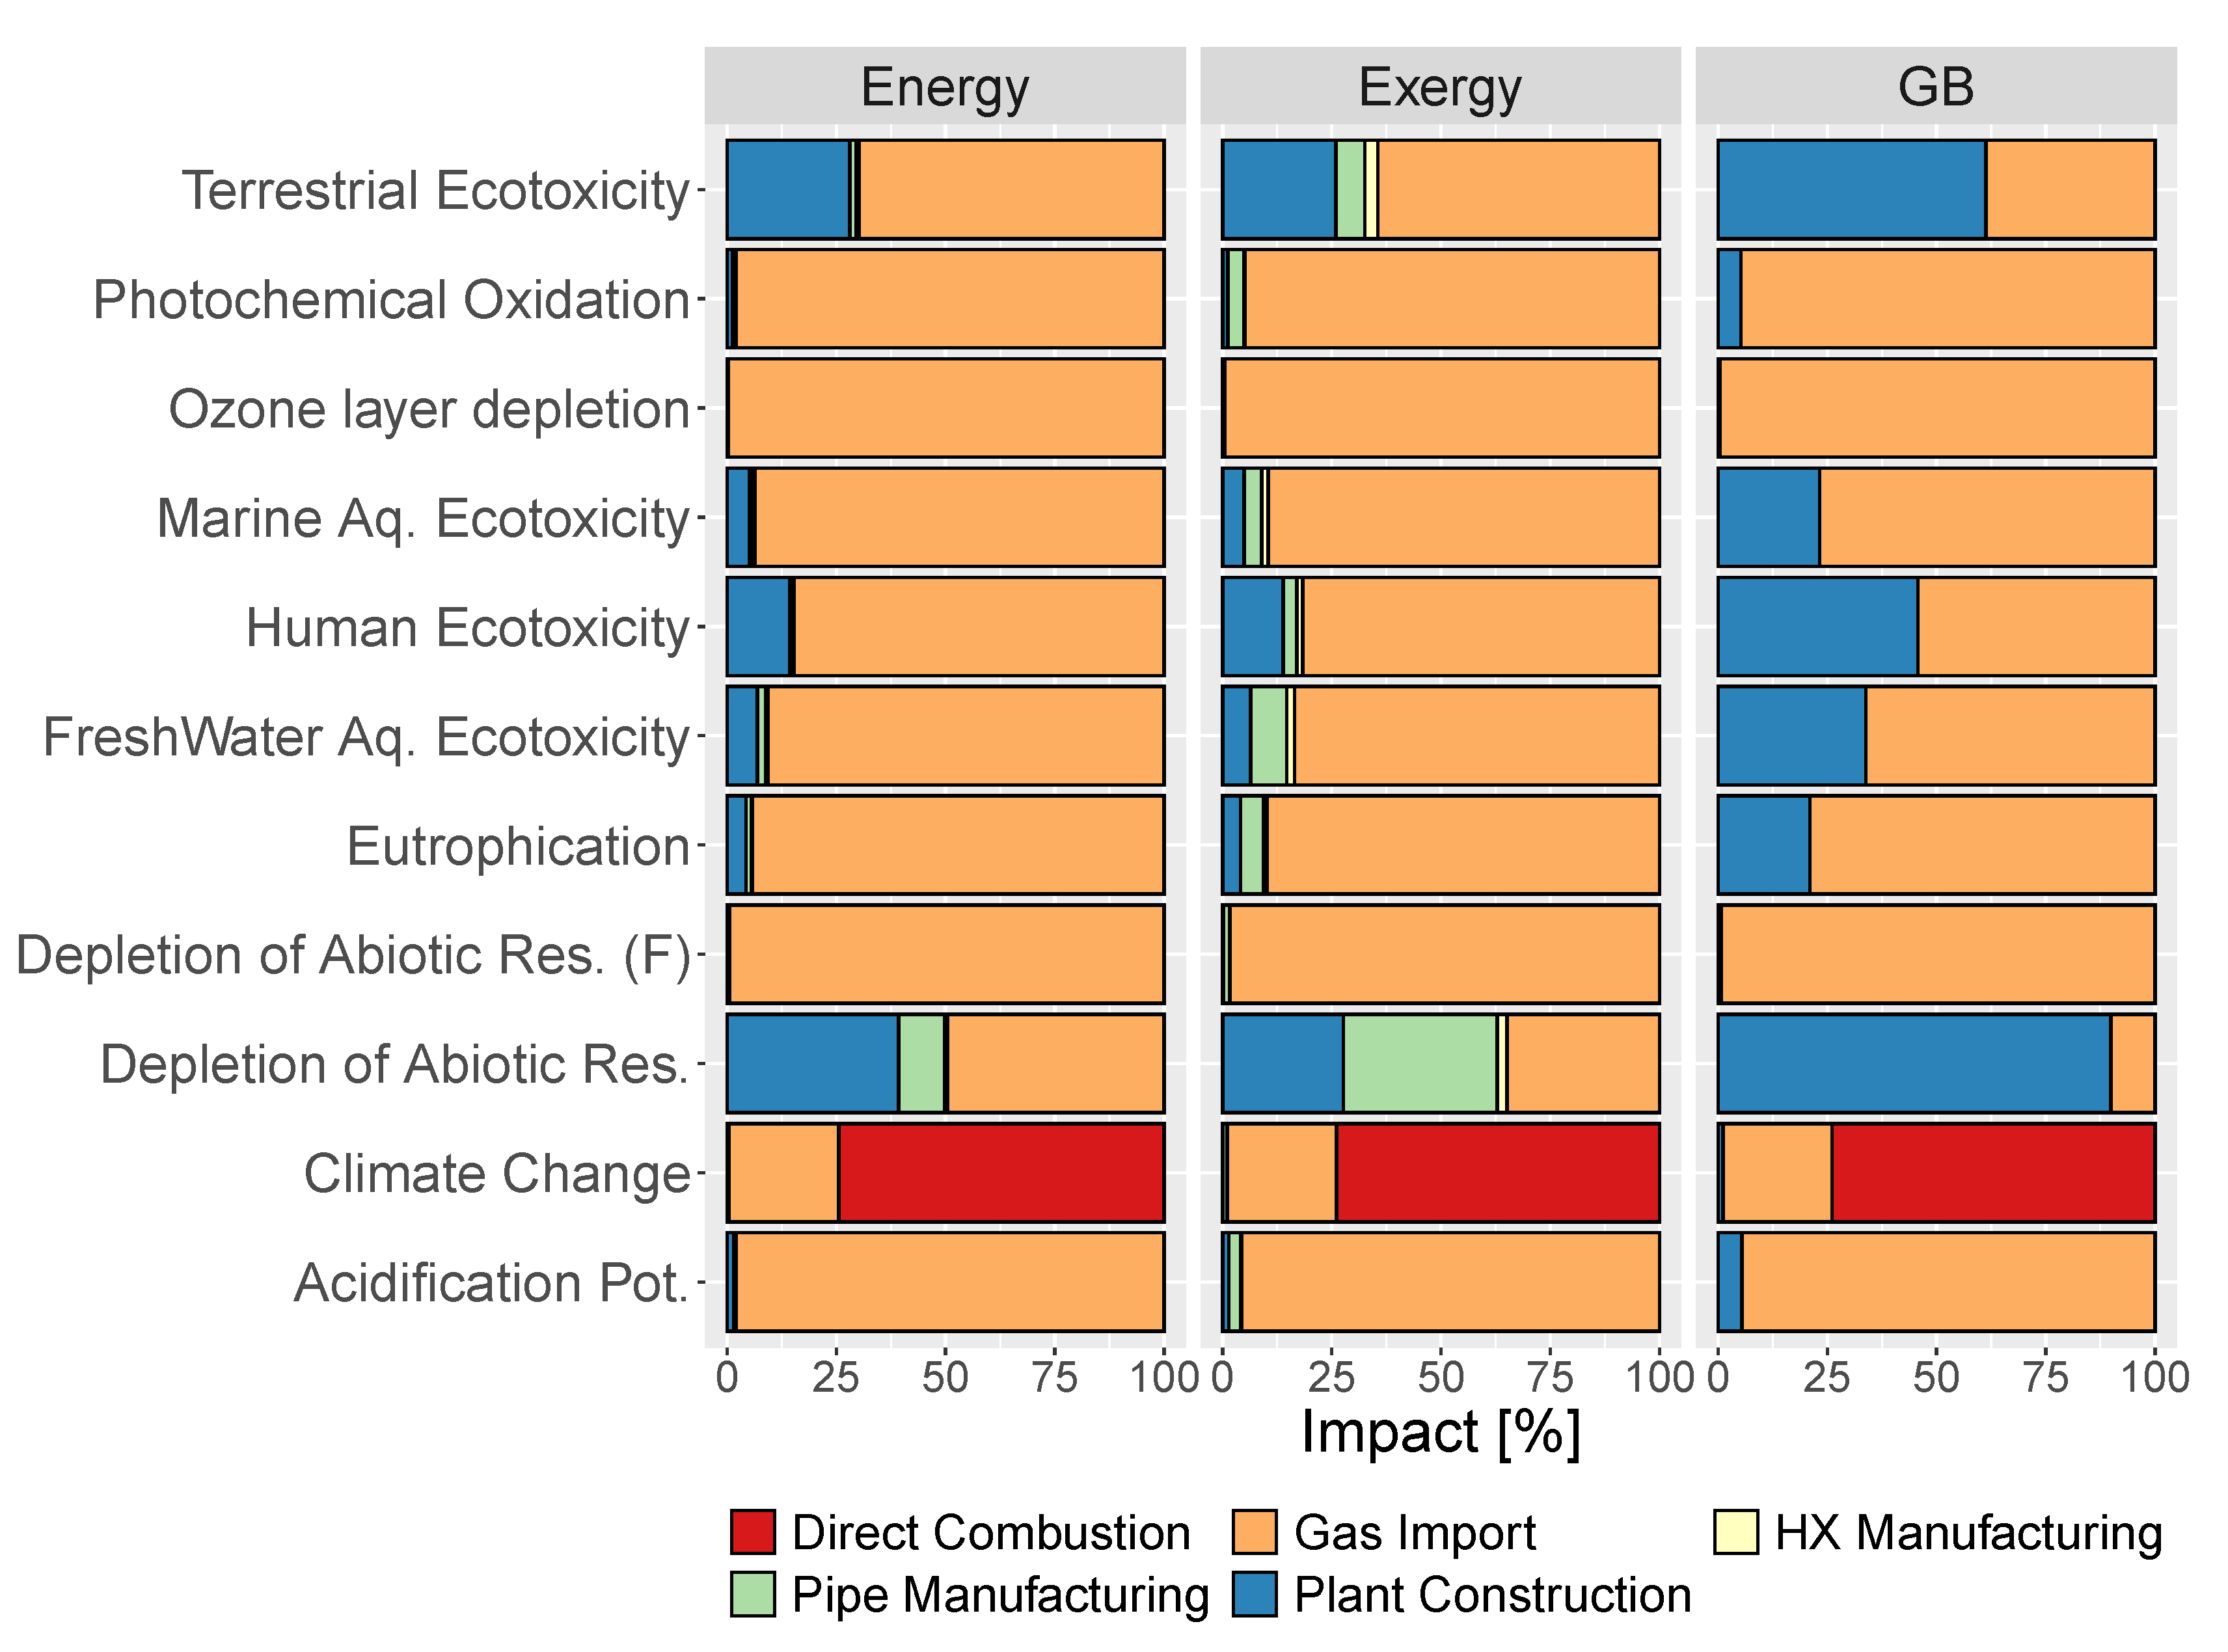
Figure 5 shows additional insights, by representing the weight of the different phases calculated by the LCA analysis for all the environmental impacts listed in
Table 8. The phases that are considered are both related to the system construction (heat exchanger manufacturing, pipes manufacturing and plant construction) and to its operation (direct combustion of natural gas and natural gas import and distribution).
Gas import is the main contributor in almost all the considered impact categories. It is also notable the effect of the allocation factor: in categories from marine aquatic ecotoxicity to eutrophication, as well as in depletion of abiotic resources, the weight of the different phases vary between energy and exergy method (e.g., pipe manufacturing weights 10.6% and 35.2% with energy and exergy, respectively, in the depletion of abiotic resources). The share variation is due to the fact that allocation factors are applied only to the components that are related both to electricity and heat, i.e., direct combustion, gas import and plant construction. Pipe manufacturing and heat exchangers manufacturing are only related to thermal energy and they are thus completely allocated on the heat supply. The plant construction results the main contributor for terrestrial ecotoxicity and depletion of abiotic resources for gas boilers (GB), while for DH plant the natural gas import results as the major contributor in almost all the categories except for climate change and depletion of abiotic resources. As already said, while these preliminary results give an overview on the different impact categories considered in LCA studies, the focus of this work is limited to climate change impacts.
Future Developments
This work is a first analysis of the comparison of DH and gas boilers, which has been done by considering some approximations based on reasonable assumptions. A better description of the system, including backup boilers, precise manufacturing of components and network construction emissions should be performed; this would require additional information that are not available at this stage. However, due to their low importance in the final impact the results will probably not show significant variations. Comparisons with other generation technologies and other DH networks could improve the robustness of the results of this study, including the specific impact of network efficiency, fuel utilisation (which can play an important role as stated in [
23] and generation technology. Furthermore, different boiler technologies and efficiency levels could be evaluated to verify a more realistic overview and especially a comparison with heat pumps which in others works shows a reduction of GHG emission around 18% with respect to traditional heating systems [
13], in substitution to GB, could be added to the study.
4. Conclusions
This study presents a comparison of the environmental impact of the heat supplied to the final users connected to a natural gas-fired district heating system, in comparison with traditional individual natural gas boilers, which represent the baseline heating solution in several urban contexts. The focus of this research is on specific CO
2 emissions, which is a parameter that is often used in different analyses. The specific impacts have been determined using the LCA analysis, to consider the entire life cycle of the components. The main results are recapped in
Table 9.
The results of our work show a specific emission equal to 0.47 and 0.10 kg
/kWh for district heating with Energy and Exergy methodologies, respectively, against the 0.27 kg
/kWh of the distributed gas boiler. The CO
2 emitted during the combustion is the main contributor to the overall impacts of both technologies. In fact, it accounts for ~74% of the overall emission value. However, gas infrastructure accounts for an important share too (~25%) and it shows a main role in all the other specific impacts as reported in
Table 5. It can heavily influence the results, increasing, for example, the specific impact from 0.39 to 0.51 kg
/kWh (marking a +31%) for DH specific emission calculated with the energy methodology. For this reason, careful evaluations must be considered in gas import strategies and policy planning. On the contrary, commissioning and construction phases contributions are almost irrelevant to the balance. This suggests that the common practice of relying on operational data and neglecting the impact of the construction phase seems to be a reasonable approach. However, this is true for CO
2 emissions but not for other environmental impacts (e.g., depletion of abiotic resources), for which the construction phase of the different components has a non-negligible effect.
An additional aspect to be highlighted is that the specific emissions of the DH system are highly dependent on the CHP allocation method that is chosen, as the results show a variation from +72% to −60% with respect to individual gas boilers. This large variation is related to the perspective with which cogeneration is considered, i.e., the relative importance which is given to heat and power generation in CHP systems. This behaviour is reflected also from the results of the other impact categories, where the allocation factor produces a variation of the final results. Thus, an appropriate choice of the allocation factor is of paramount importance, and this choice should be in line with the aim of the analysis and taken to account when interpreting the results.


