Multiphysics Design of Pet-Coke Burner and Hydrogen Production by Applying Methane Steam Reforming System


Tomer Ltd., Tel-Aviv 6473424, Israel
Clean Technol. 2021, 3(1), 260-287; https://0-doi-org.brum.beds.ac.uk/10.3390/cleantechnol3010015
Submission received: 30 December 2020
/
Revised: 27 February 2021
/
Accepted: 10 March 2021
/
Published: 17 March 2021
(This article belongs to the Special Issue Hydrogen Economy Technologies)
Abstract
:Pet-coke (petroleum coke) is identified as a carbon-rich and black-colored solid. Despite the environmental risks posed by the exploitation of pet-coke, it is mostly applied as a boiling and combusting fuel in power generation, and cement production plants. It is considered as a promising replacement for coal power plants because of its higher heating value, carbon content, and low ash. A computational fluid dynamics (CFD) computational model of methane steam reforming was developed in this research. The hydrogen production system is composed from a pet-coke burner and a catalyst bed reactor. The heat released, produced by the pet-coke combustion, was utilized for convective and radiative heating of the catalyst bed for maintaining the steam reforming reaction of methane into hydrogen and carbon monoxide. This computational algorithm is composed of three steps—simulation of pet-coke combustion by using fire dynamics simulator (FDS) software coupled with thermal structural analysis of the burner lining and a multiphysics computation of the methane steam reforming (MSR) process taking place inside the catalyst bed. The structural analysis of the burner lining was carried out by coupling the solutions of heat conduction equation, Darcy porous media steam flow equation, and structural mechanics equation. In order to validate the gaseous temperature and carbon monoxide mole fraction obtained by FDS calculation, a comparison was carried out with the literature results. The maximal temperature obtained from the combustion simulation was about 1440 °C. The calculated temperature is similar to the temperature reported, which is also close to 1400 °C. The maximal carbon dioxide mole fraction reading was 15.0%. COMSOL multi-physics software solves simultaneously the catalyst media fluid flow, heat, and mass with chemical reaction kinetics transport equations of the methane steam reforming catalyst bed reactor. The methane conversion is about 27%. The steam and the methane decay along the catalyst bed reactor at the same slope. Similar values have been reported in the literature for MSR temperature of 510 °C. The hydrogen mass fraction was increased by 98.4%.

1. Introduction
Pet-coke is a carbon-rich and black-colored solid. It is mostly applied as a boiling and combusting fuel in power generation, and cement plants. Pet-coke is considered as a promising replacement for coal in power plants because of its higher heating value, carbon content, and low ash [1]. The pet-coke produced by delayed cokers is an attractive source of energy due to its very high heating value (over 8500 kcal/kg) that stems from its high carbon (75–80% by weight) and low ash content (under 1%) [2]. The refiner now decides to add petro-power and shifts production away from high sulfur fuel oil (HSFO) for producing pet-coke fuel [2]. According to [3], the coke yield produced by delayed coker is about 33%. Coke burns in several installations inside the refinery. For example, FCC (fluid catalytic cracking) regenerators have been employed for burning the coke-coated catalysts in order to restore catalytic activity and to supply the required heat flux for the cracking reactions in risers [4].
Computational fluid dynamics (CFD) is considered a powerful tool for predicting the hydrodynamic properties and other characteristics of fluidized beds and other dense multiphase flows [5].
CFD modeling is an important computational tool for steam reforming design. It includes physical and chemical models with detailed representation of the reformer geometry. It has powerful computational capabilities and visualization to deal with different geometry characteristics, transport equations, and boundary conditions.
Wilde and Froment [6] have performed CFD computations on the zone-flow reactor. It is a tubular reactor, which contains two types of internals: a core type adjacent to the wall, and a casing type, both of which are coated with a thin layer of catalyst. This reactor is designed for higher energy efficiency and lower steam-to-carbon ratios in methane steam reforming. The CFD is based on the Reynolds-averaged Navier–Stokes (RANS) turbulence model. Convective and radiative heat transfer, detailed reaction kinetics including coking, intraparticle diffusion limitations, and the compressibility of the gas phase were considered in the CFD simulations. The 3D CFD simulations show a better performance of on zone-flow reactor compared to conventional fixed bed reactors in terms of conversion and coke formation. Lao et al. [7] developed a CFD model of an industrial scale steam methane reforming tube. The numerical simulation was carried out by applying ANSYS software with realistic geometry characteristics to simulate the transport and chemical reactions phenomena occurring in catalyst packing. In the framework of their research, they evaluated different feedback control schemes to drive the area-weighted average hydrogen mole fraction measured at the reforming tube outlet to a desired set-point value area-weighted average hydrogen mole fraction under the influence of a tube-side feed supply disturbance. The CFD simulation results obtained for the closed-loop significantly improve the process dynamics compared to open-loop control.
In my opinion, this is the first work consisting of simulation of pet-coke combustion by using fire dynamics simulator (FDS) software coupled with thermal structural analysis of the burner ceiling lining (in order to verify that the burner lining can withstand the extreme service conditions of the burner) and a multiphysics computation of the methane steam reforming (MSR).
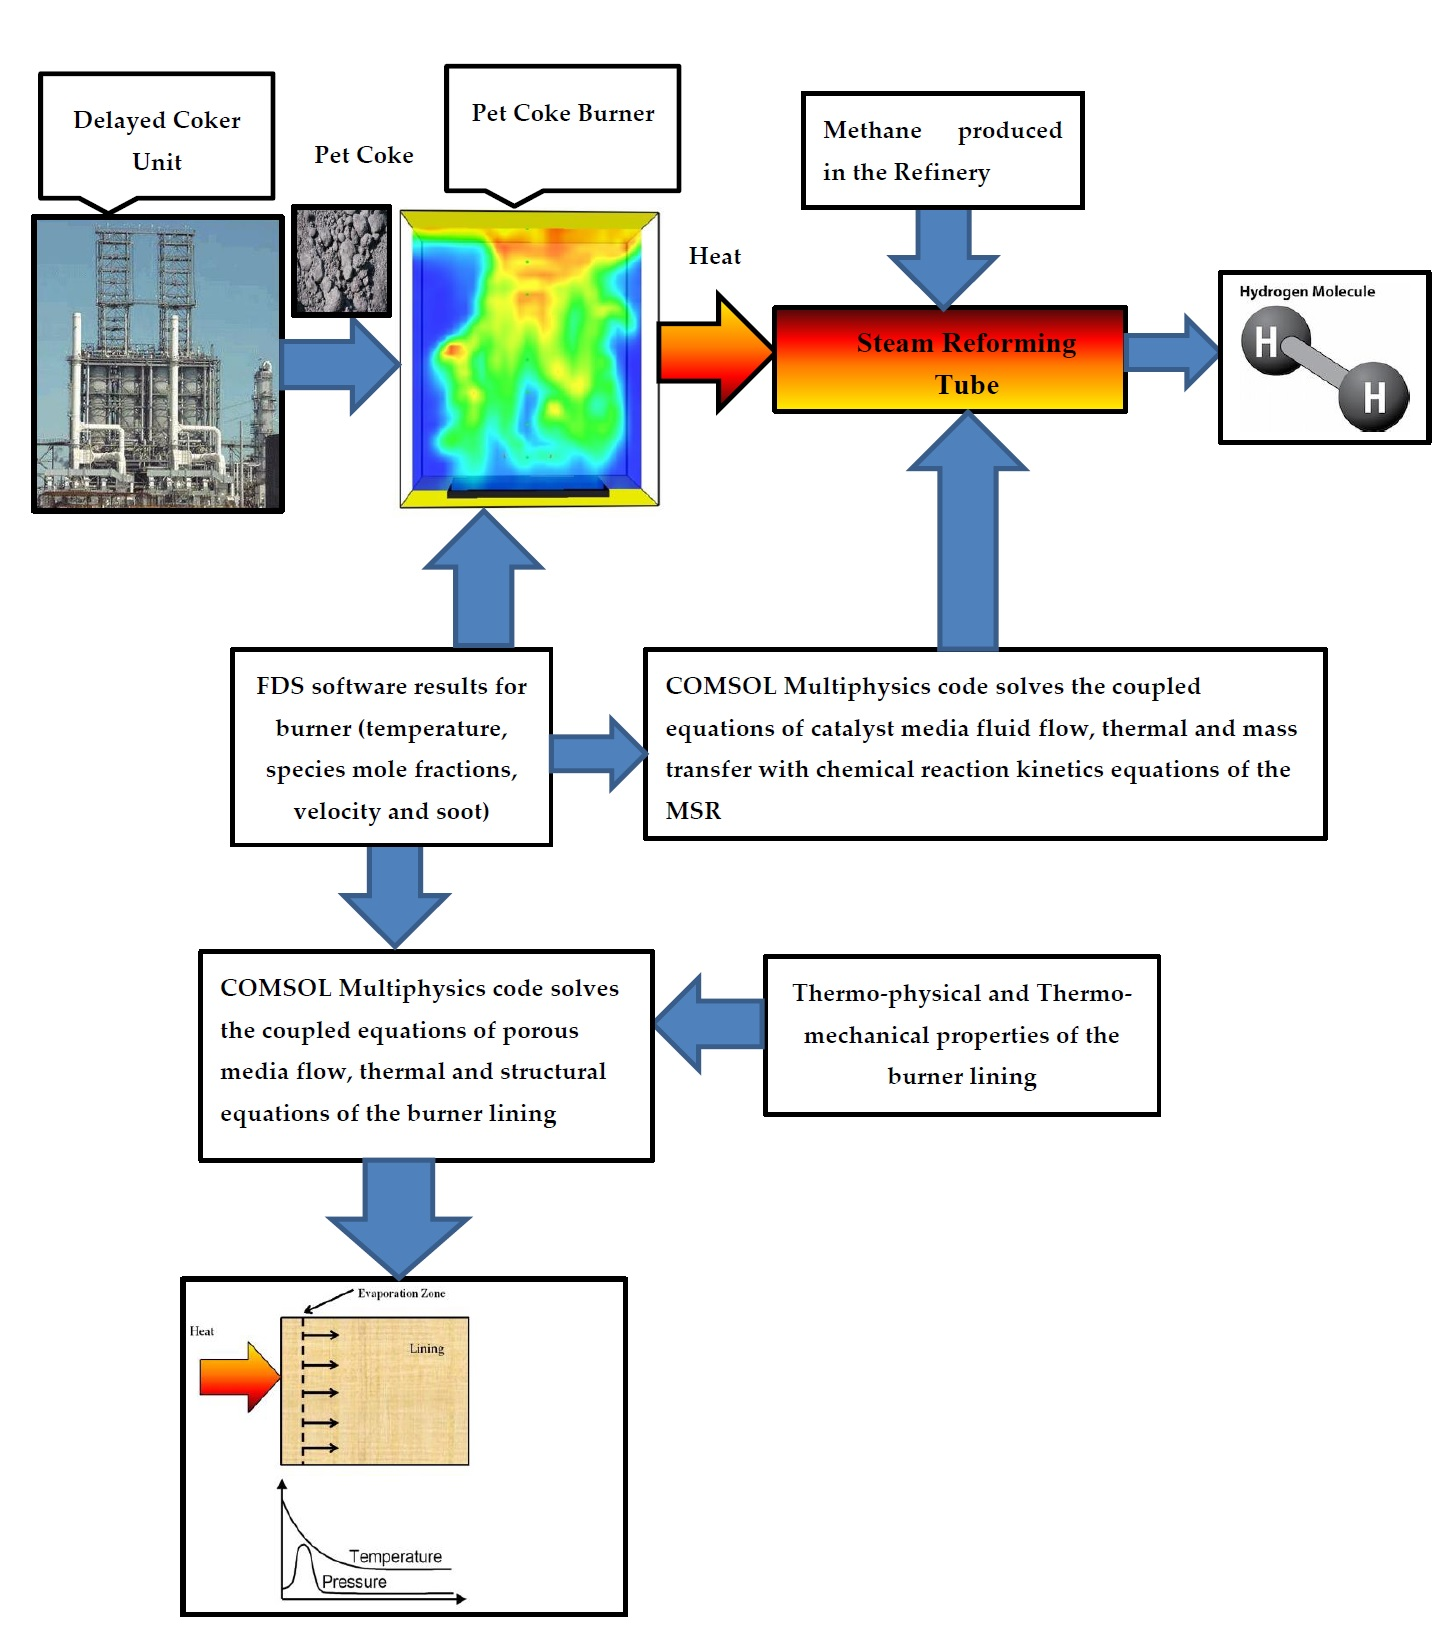
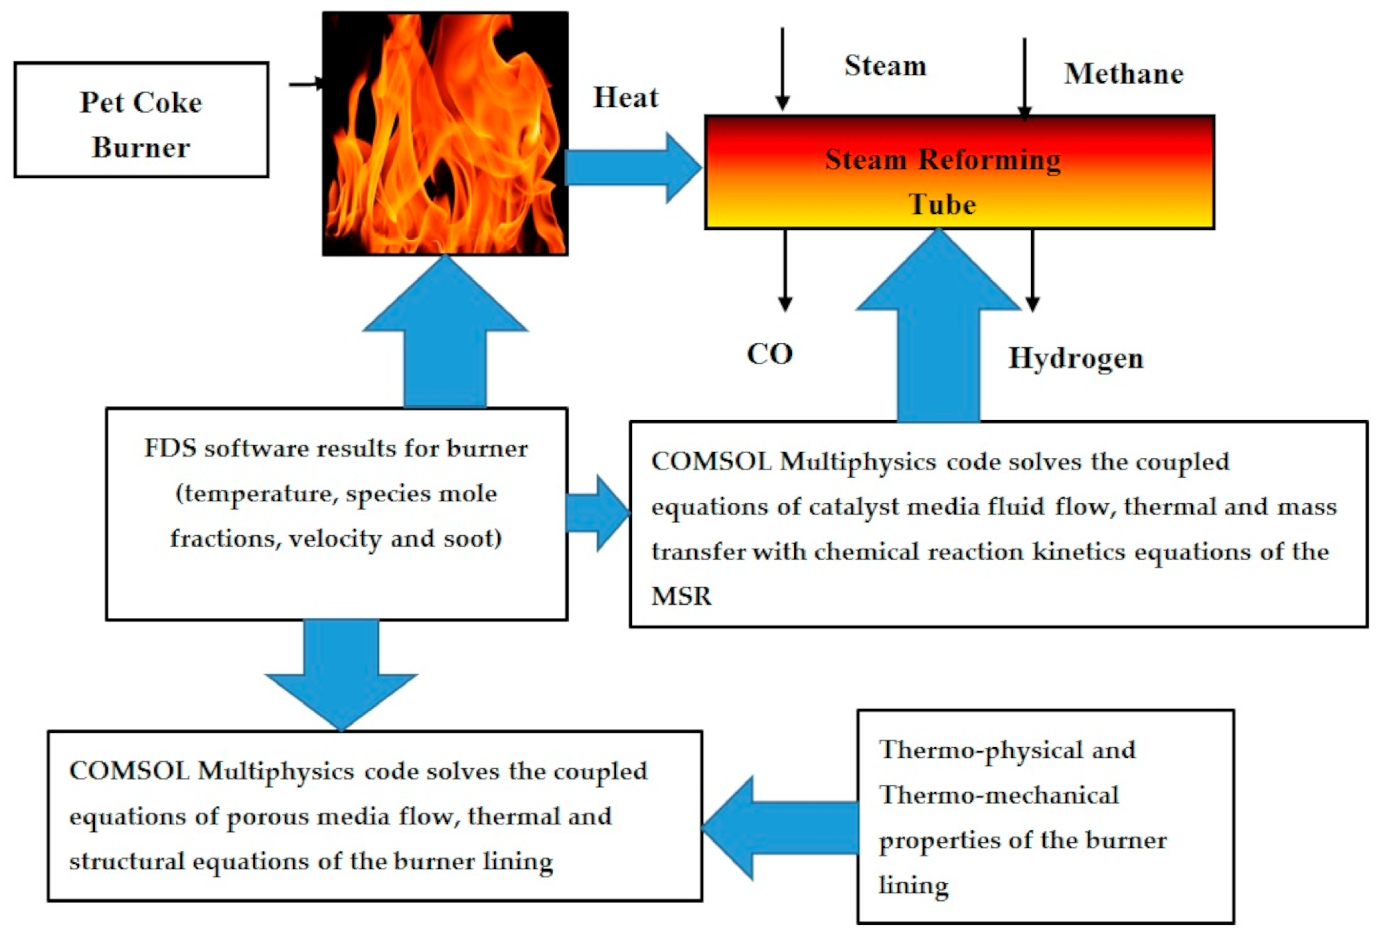
All the papers described above have hardly addressed the issue of structural integrity of the lining. The pet-coke linings rupture may release pollutants such carbon dioxide and soot particles to the atmosphere. By applying the heat loads obtained from FDS software, COMSOL multiphysics software has solved simultaneously the heat conduction equation, Darcy porous media steam flow equation, and structural mechanics equations for the concrete. The computational modeling of the methane steam reforming system is described schematically in Figure 1.
The computational process algorithm of the pet-coke burner described in the bottom of Figure 1 contains three components: simulation of coke flame carried out by using FDS simulation, multiphysics transient model which performs heat transfer, porous media flow (Darcy), and structural analyses of burner linings carried out by using COMSOL multiphysics software.
1.1. Mechanism of Methane Steam Reforming (MSR) Process
The major reactions that occur during the MSR process on Ni–Alumina catalyst are [8]:
CH4 + H2O → CO +3H2
CO+ H2O → CO2 + H2
CH4 + 2H2O → CO2 +4H2
1.2. Refractory Lining System Failure
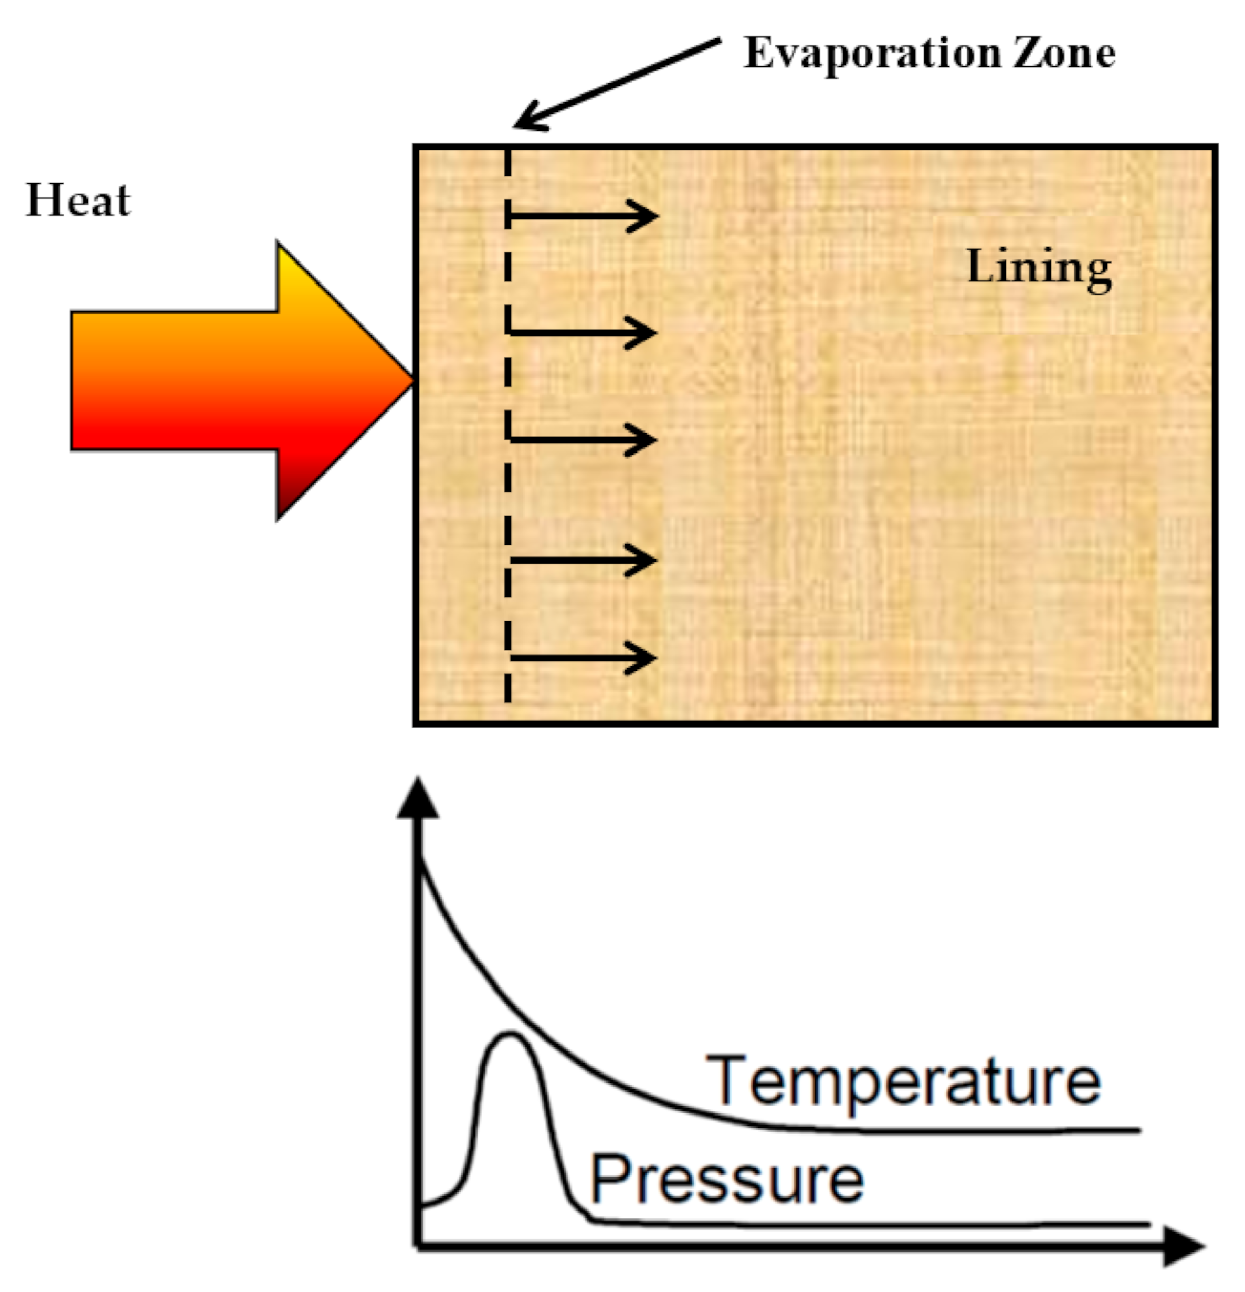
Refractories are used to withstand extreme temperature conditions. They are applied as heat-resistant linings to protect the walls from chemical decomposition, oxidation, and chemical and mechanical erosion [9]. The main types are made from ceramic materials or brick. Intense heating of the burner lining will cause accumulation of steam inside the refractory lining that may not flow outside through the refractory lining. The accumulated steam trapped inside the lining causes explosive spallation. It should be noted that most ceramic materials are weak under tension and if the ultimate tensile strength (UTS) is locally exceeded, a crack will develop, often leading to the hot outer layer becoming detached from the remaining brick. This process is known as “spallation” [10]. The process of buildup steam pressure inside the heated lining is illustrated in Figure 2. As the concrete temperature increases, the moisture trapped inside the lining pores heats and evaporates, leading to further pressure loads on the lining. Under the pressure gradient, water vapor is transported both outwards and inwards in the concrete element. If the stress induced by the pressure gradient is higher than the strength of the concrete, the spallation occurs [11].
2. Materials and Methods
2.1. Fire Dynamic Simulation (FDS) Modeling of the Pet-Coke Burner
The National Institutes of Standards and Technology (NIST) have developed this software [12,13]. It solves simultaneously the momentum transport equation, the equation of state, the energy equation, and the diffusion transport transient equations within each numerical grid cell. It is capable of computing the heat fluxes. This software is composed of three main components:
Hydrodynamic Model—the numerical solution of the momentum equation is carried out by applying large eddy simulation (LES) technique in most of the fire-driven turbulent flows (i.e., natural convection) simulation applications. It is suitable for low Mach numbers.
Combustion Model— FDS software employs two types of combustion models. The first model (default) uses the mixture fraction, a quantity representing the fuel and the products of combustion. The second model applies Arrhenius reaction parameters for individual gas species [14].
Radiation Transport—FDS uses finite volume method (FVM) technique in order to solve the radiation transport equation (RTE) for a non-scattering gray gaseous mixture [12].
The “smoke-view” postprocessor software was used in order to simulate the pet-coke burner combustion performance (temperatures and products mass fractions). The governing equations of FDS software are described in [15].
2.2. FDS Modeling of the Combustor
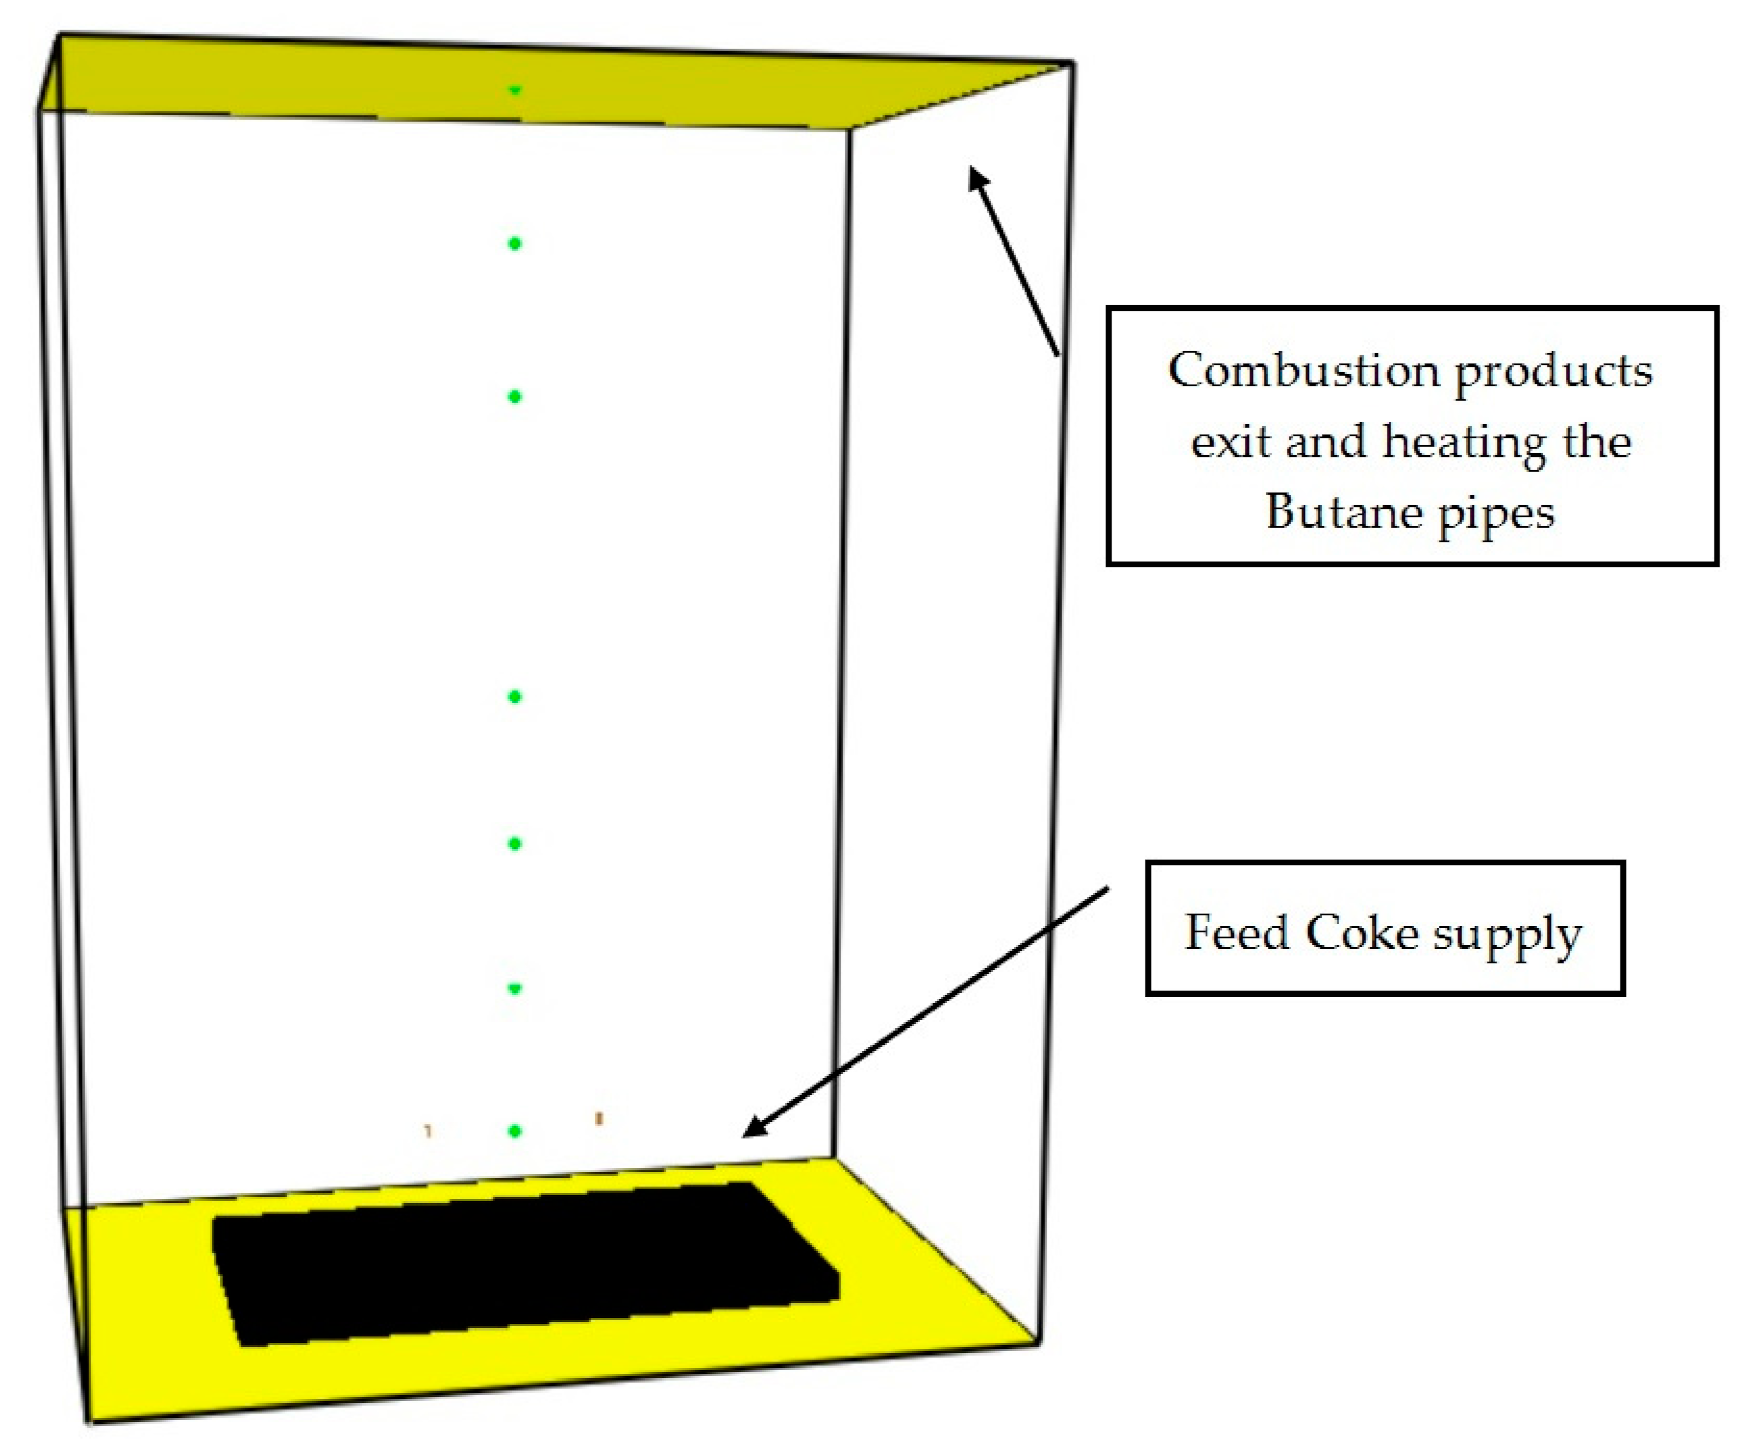
The geometrical model of the pet-coke burner is shown in Figure 3.
The height of the pet-coke burner is 4.0 m. The width and the length of the burner are 3 m and 2 m, respectively. The mesh size of the burner is 24,000 cells. At the side of the burner, coke particles are injected and ignited. Seven thermocouples, seven carbon dioxide, seven carbon monoxide, seven oxygen, and seven soot particles concentration sensors are placed inside the burner model. Table 1 shows the thermocouples locations inside the burner (the coordinate system center is located at the center of the burner bottom plate; see Figure 3).
According to [16], the heat of combustion of coke is 38,379 (kJ/kg).
Initial condition—The initial temperature, species concentration in the air, and the pressure are:
Boundary Condition—the burner is opened to the atmosphere (the MSR tubes are exposed to the flame).
2.3. Thermal and Structural Properties of the Burner Concrete Lining
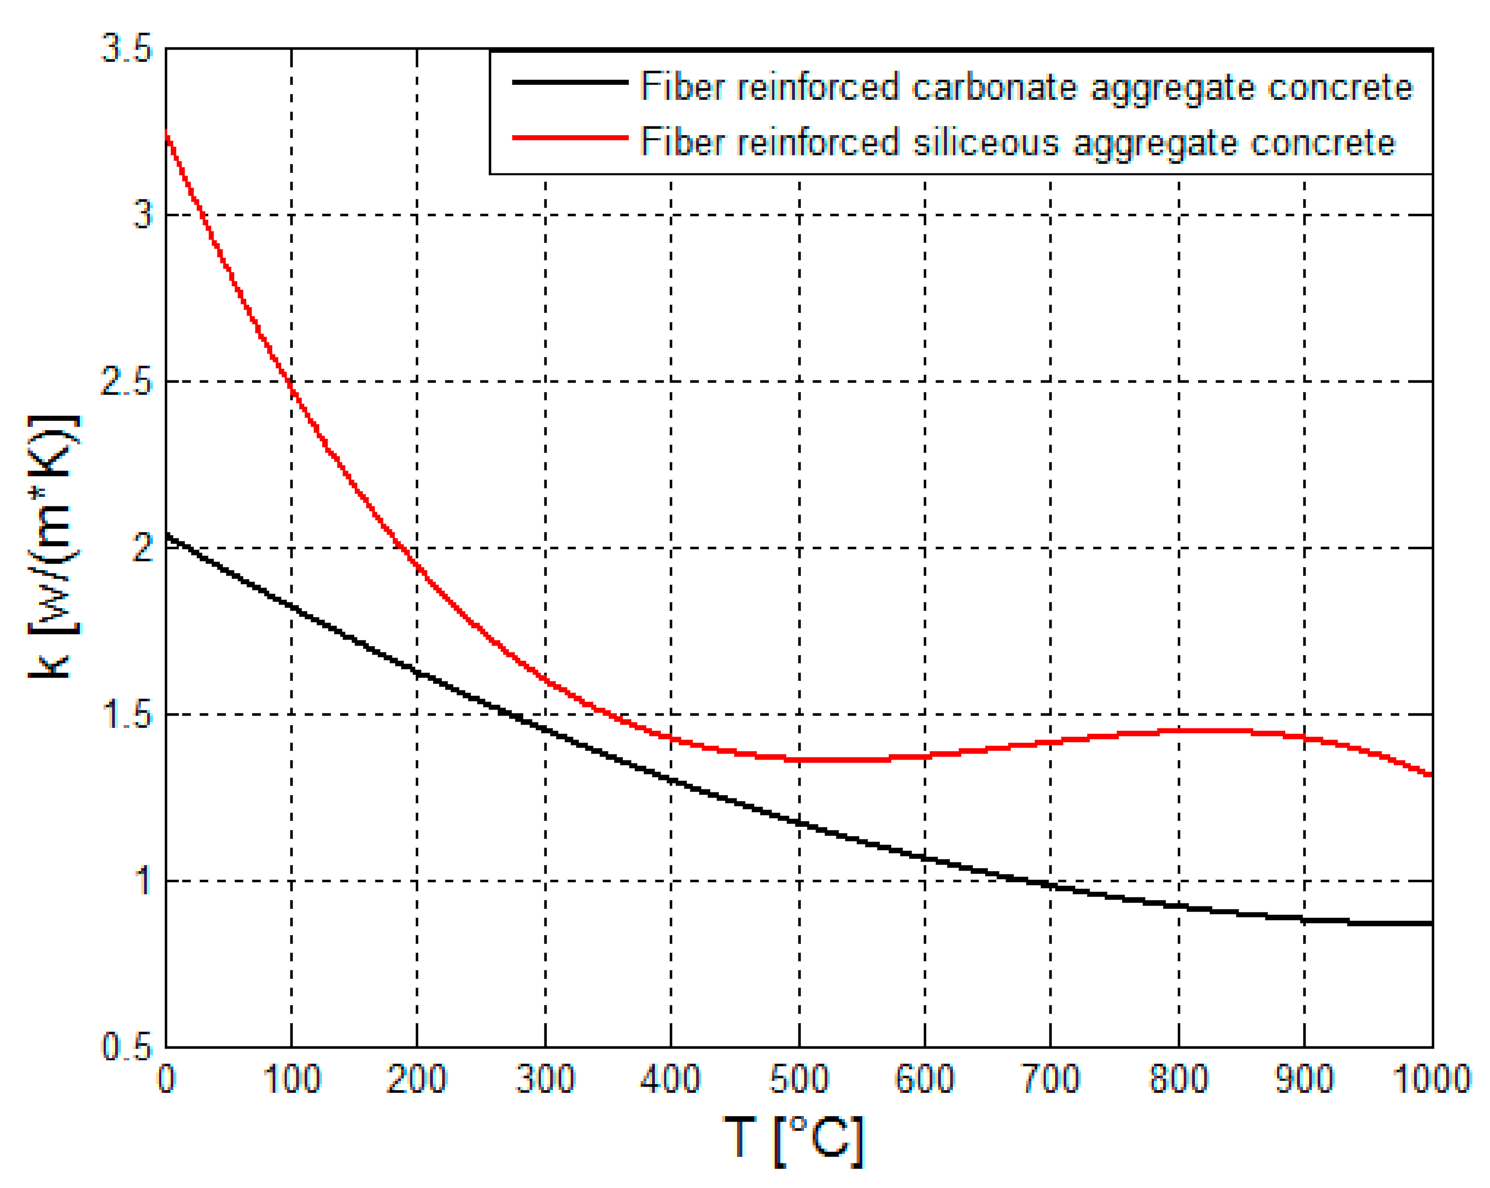
It was assumed that the burner linings are made from two different types of concrete: fiber-reinforced carbonate aggregate concrete and fiber-reinforced siliceous aggregate concrete [18]. The thermal and mechanical properties of steel fiber-reinforced concrete at elevated temperatures were applied. The thermal properties as a function of temperature were evaluated in the temperature range between 0 °C and 1000 °C [18]. Figure 4 presents the thermal conductivities of the two kinds of concrete.
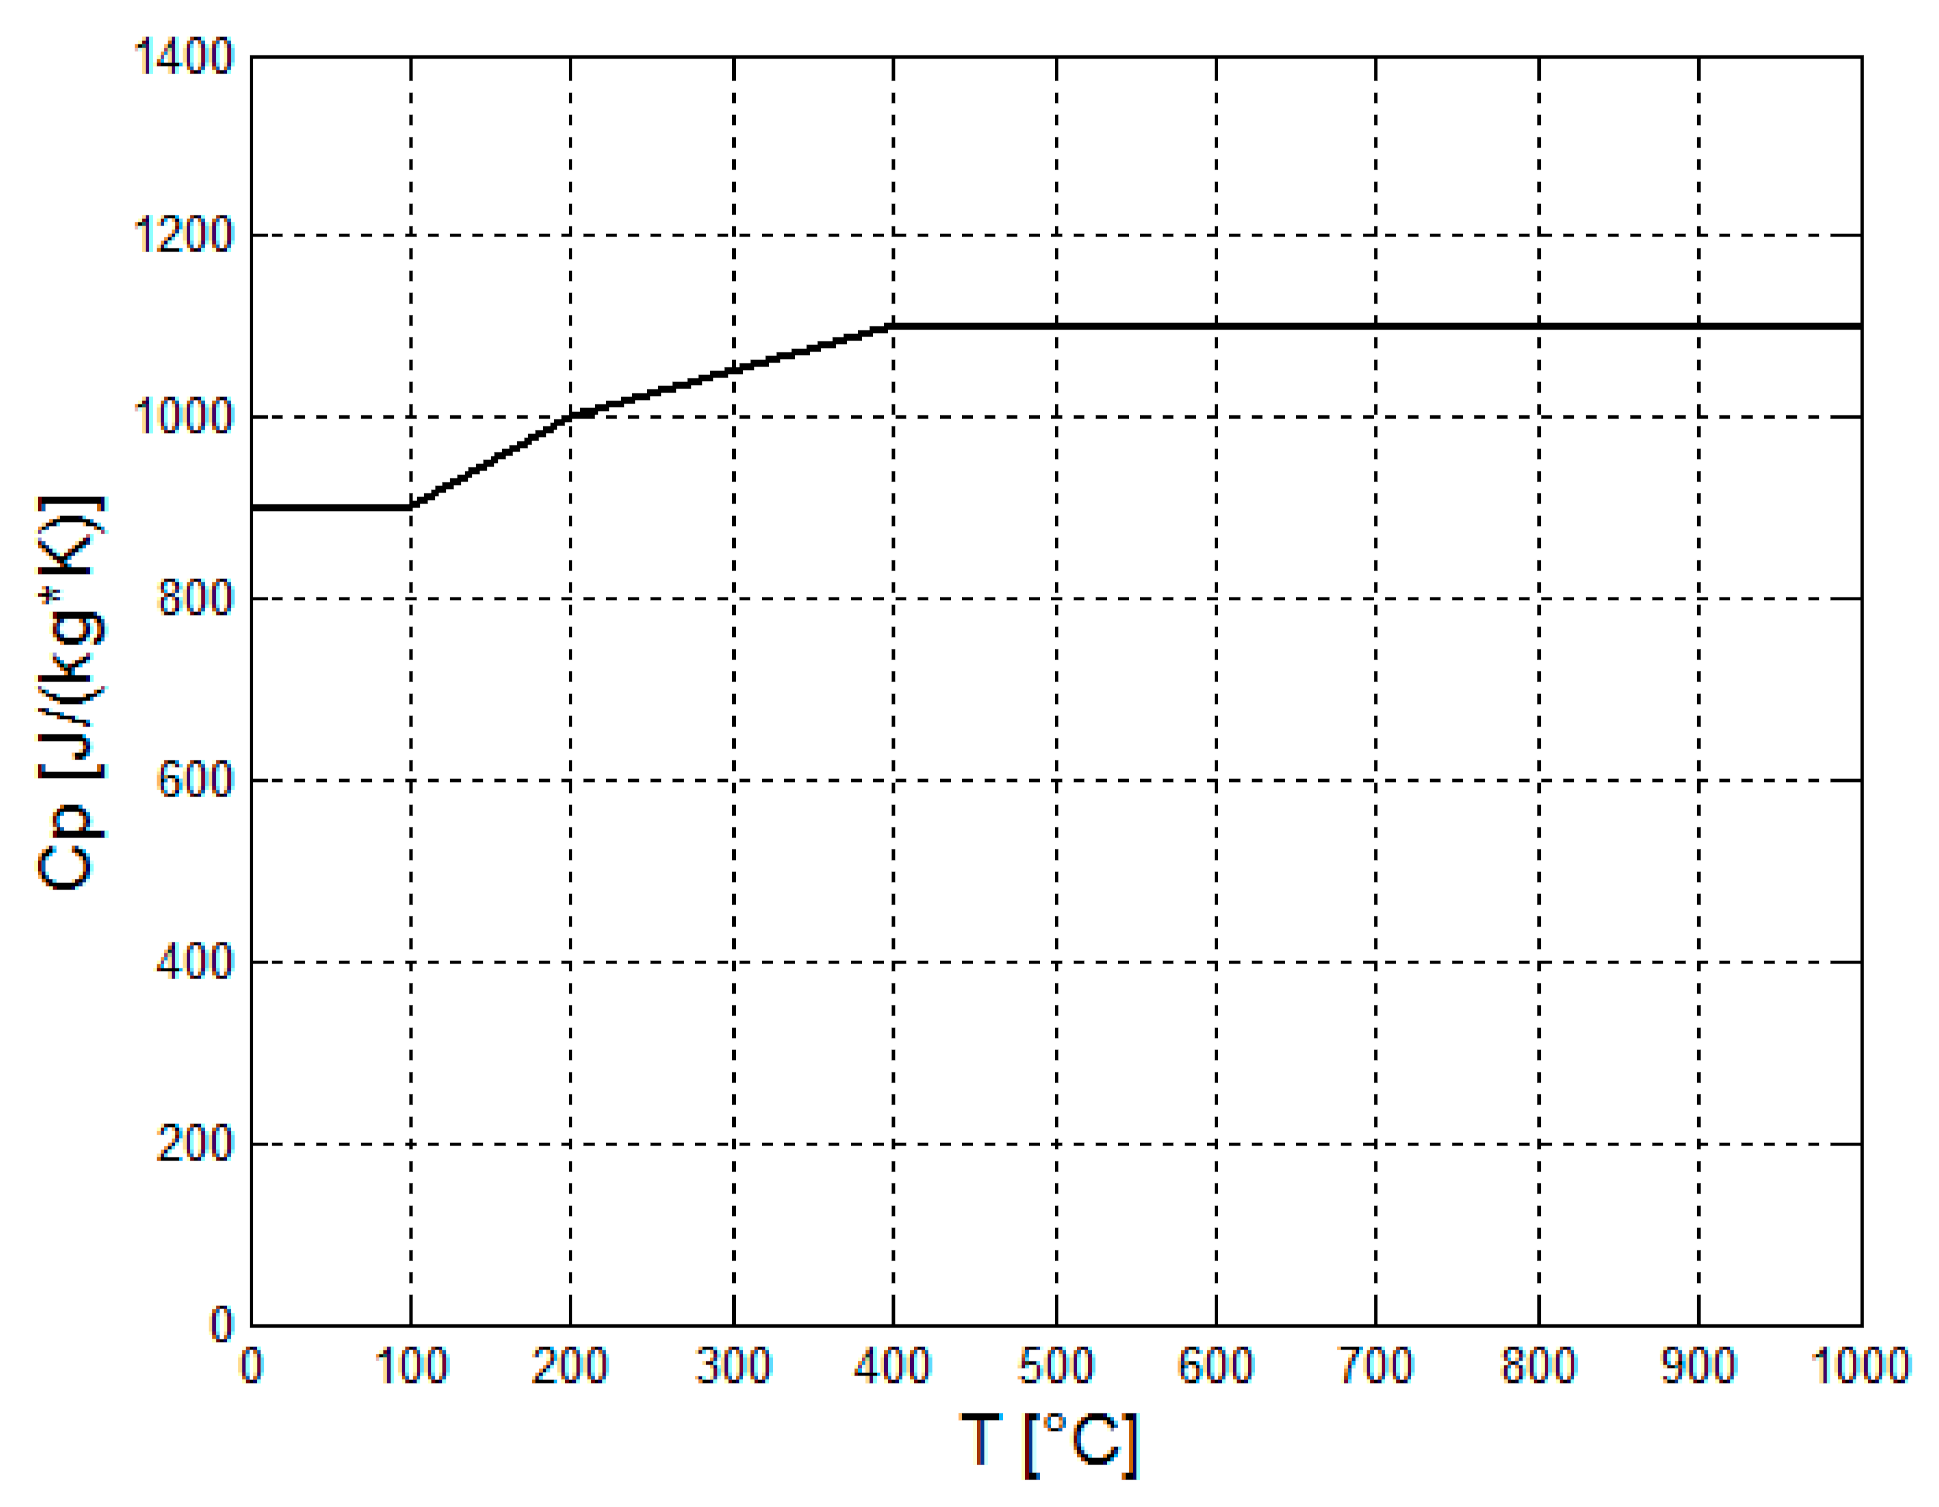
Figure 4 indicates that the thermal conductivities of the two concrete types decay with the temperature up to approximately 400 °C. The thermal conductivity of fiber-reinforced siliceous concrete is greater than the carbonate concrete because of the higher crystallinity of the siliceous aggregates as compared to that of the carbonate aggregate. Figure 5 shows the typical graph of the heat capacity of concrete [19].
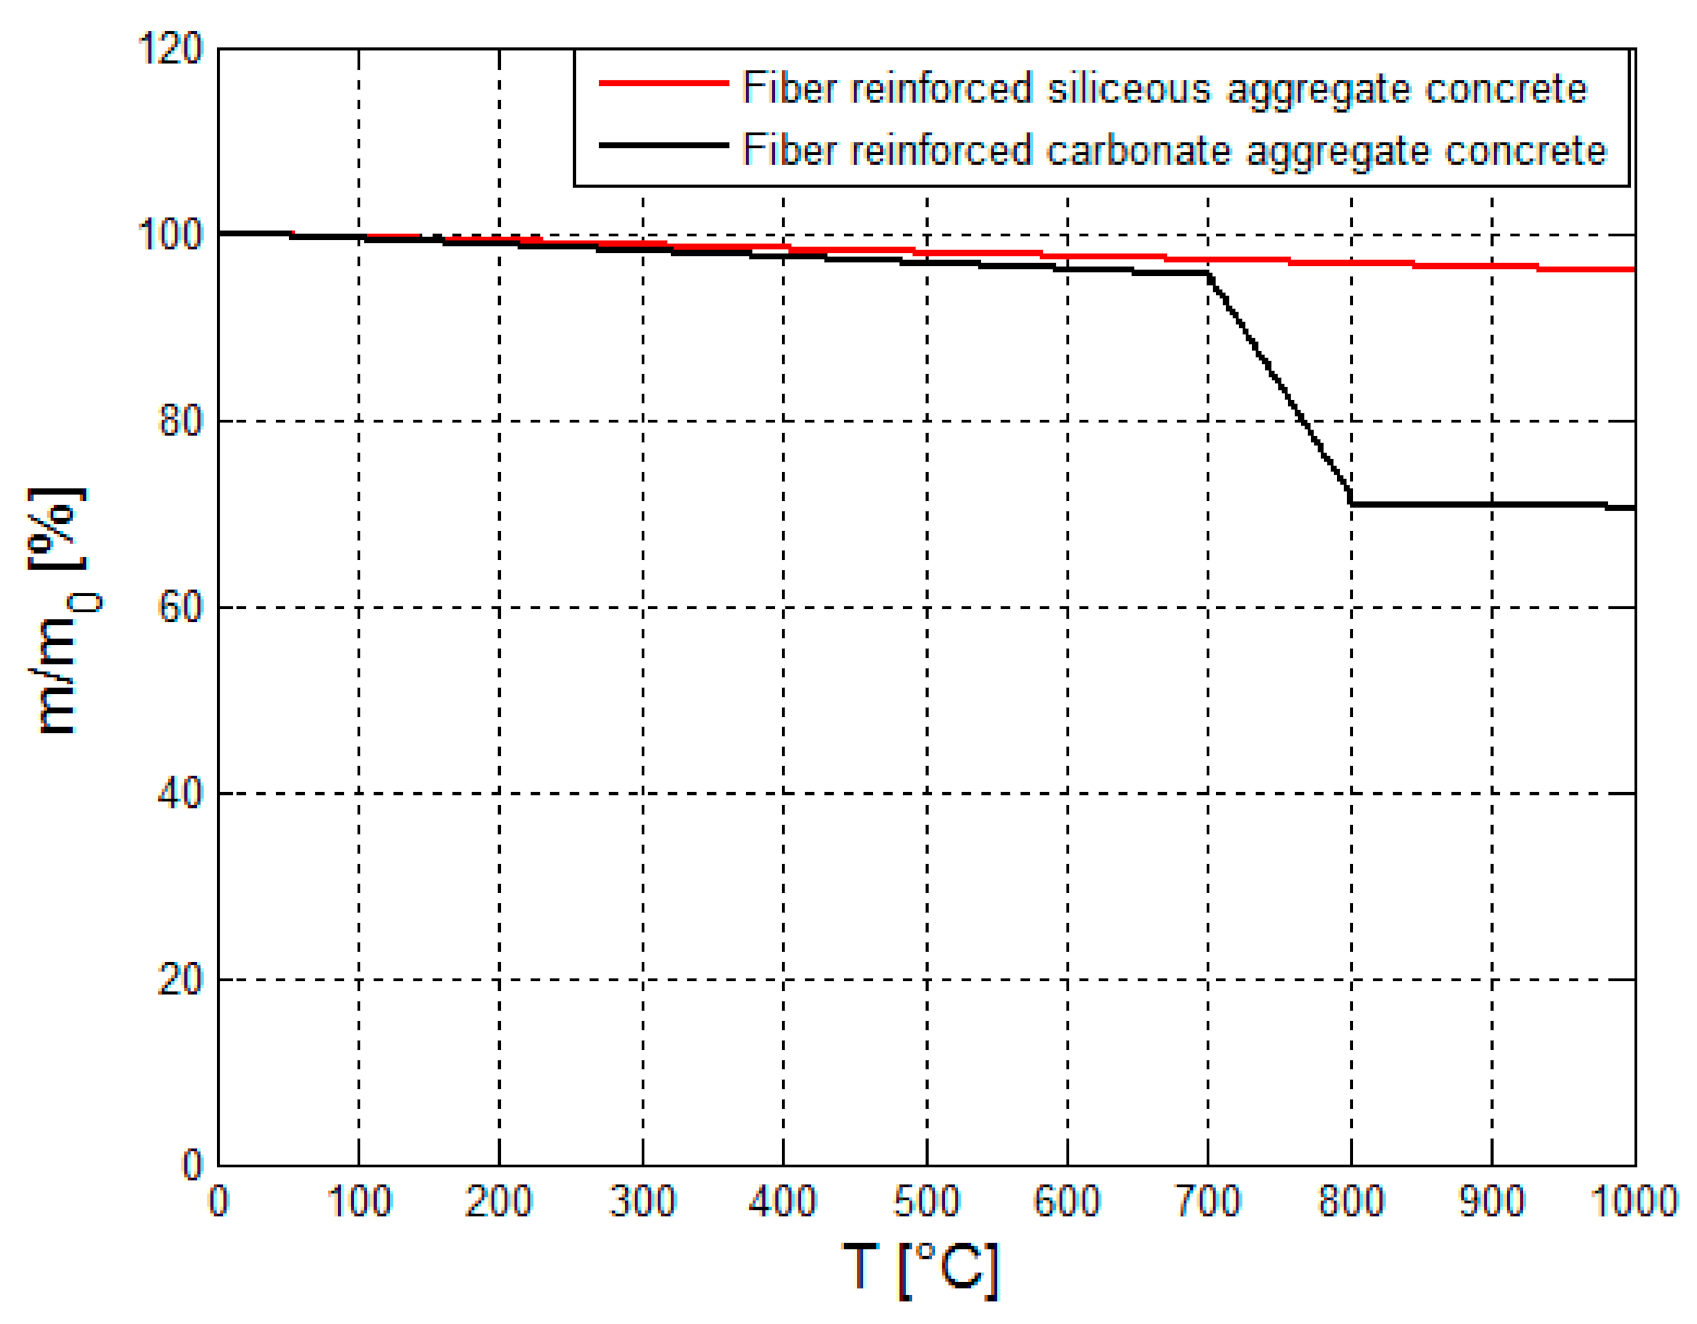
Figure 5 shows that the heat capacity of concrete increases with the temperature up to 400 °C. In the temperature range of 400–1000 °C, the heat capacity remains almost constant. The presence of the steel fibers inside the concrete slightly affects the specific heat of the concrete. Figure 6 shows the mass loss of the two different types of concrete: fiber-reinforced carbonate aggregate concrete and fiber-reinforced siliceous aggregate concrete [18].
As can be seen from Figure 6, the mass loss of the two concrete types is negligible until about 600 °C. Above 600 °C, the mass of plain and fiber-reinforced carbonate aggregate concrete decays considerably. This is caused by thermal decomposition of the dolomite component in the concrete. Above 800 °C, the mass loss again gradually decays with temperature.
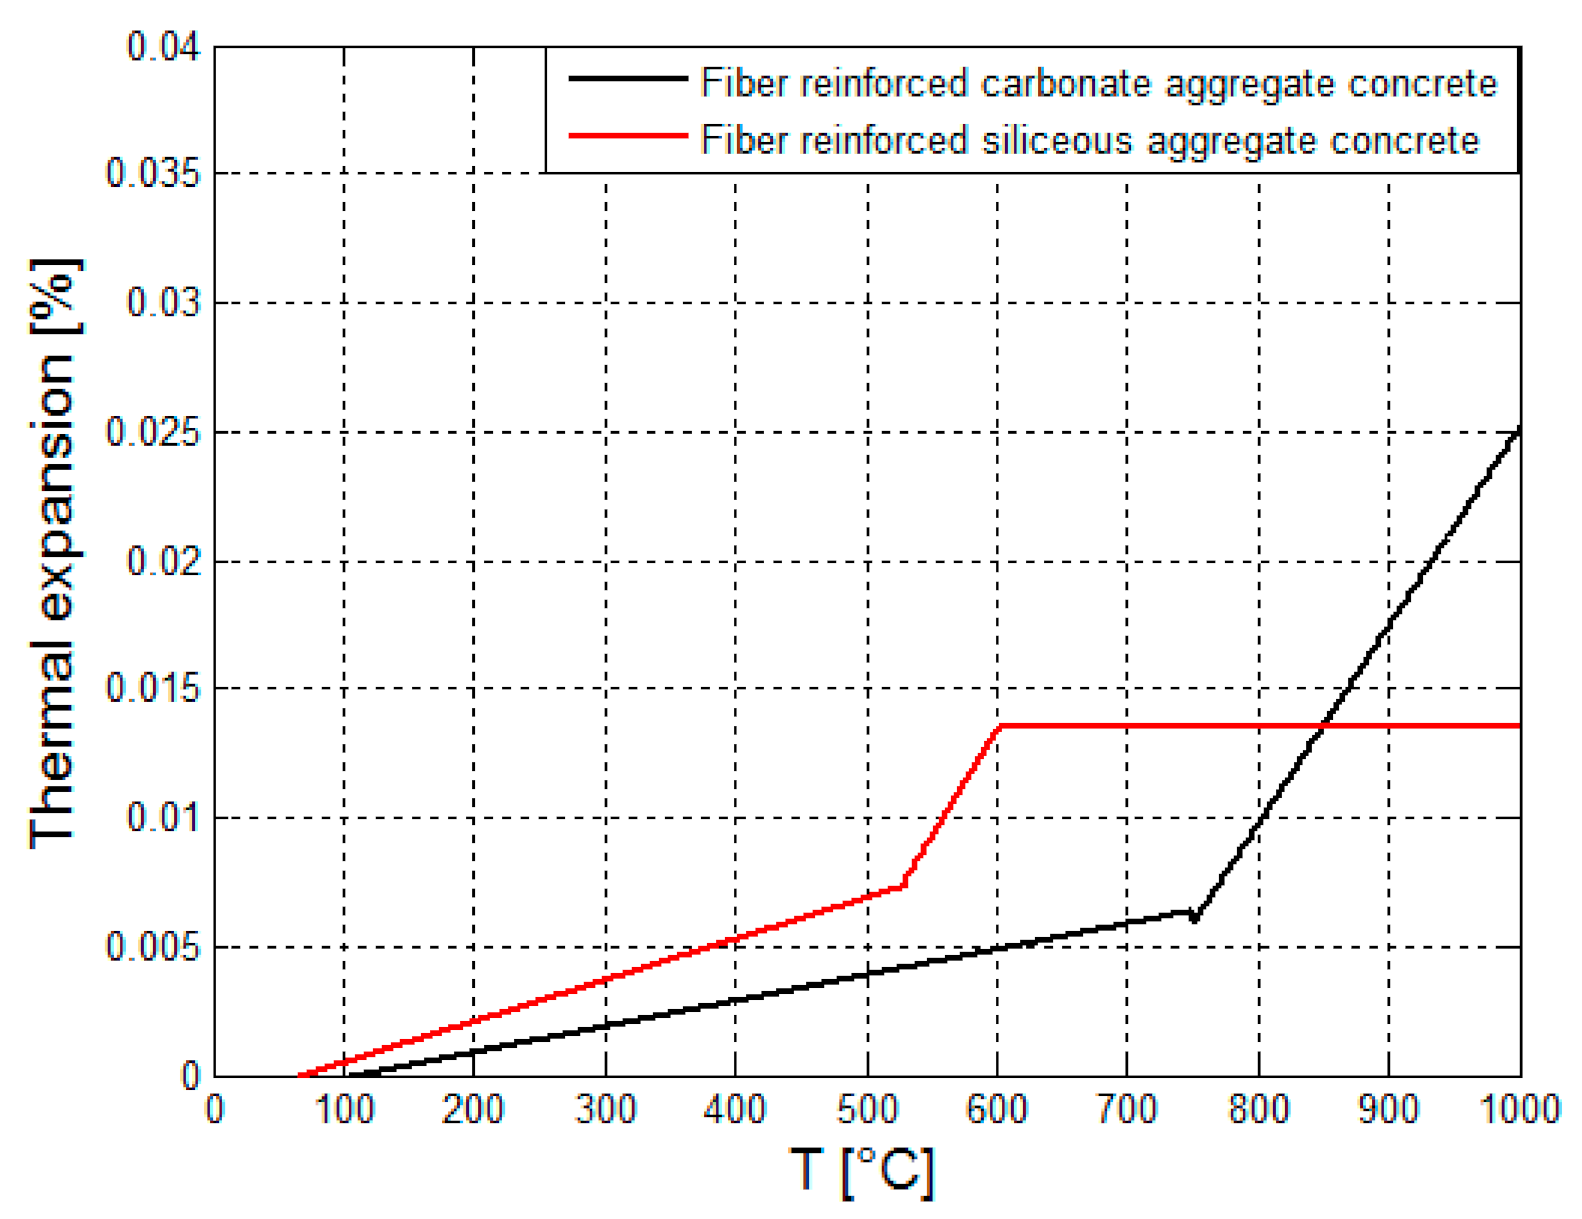
Figure 7 shows the coefficient of thermal expansion of the two different types of concrete: fiber-reinforced carbonate aggregate concrete and fiber-reinforced siliceous aggregate concrete [18].
The thermal expansion of fiber-reinforced siliceous aggregate concrete increases with temperature up to about 600 °C and then remains constant. The CTE is increased considerably near 550 °C. This can be attributed to transformation of quartz in the siliceous aggregate. Above this temperature, the CTE of the fiber-reinforced carbonate concrete increases considerably more than the CTE of the siliceous concrete. This steep increase of CTE with temperature can be caused by the presence of the steel fibers which expand at a growing rate [18]. The stress–strain curves are shown in Figure 8.
As can be seen from Figure 8, the compressive strength tends to decrease at elevated temperatures. The thermophysical and thermomechanical properties shown in Figure 4, Figure 5, Figure 6 and Figure 7 indicate that the steel fibers have a minor influence on the thermal properties of the concretes. The influence on the mechanical properties is relatively greater and is expected to contribute to the flame resistance of the fiber-reinforced concrete. The porosity, φ, and permeability, κ, of both kinds of concrete used in the calculation of COMSOL are shown in Table 2 [20].
2.4. Multiphysics Analysis of the Concrete Lining
2.4.1. Porous Media Flow—Concrete Lining
The steam density is represented by in dimensions of (kg/m3). The steam viscosity is represented by in dimensions of (Pa·s). is the permeability of the porous concrete medium (m2). is the pressure of the steam trapped inside the concrete lining (Pa). All the concrete lining boundaries are impervious, corresponding to the condition:
2.4.2. Energy Transport—Concrete Lining
In the above equations, the subscript “conc” denotes the concrete lining. Furthermore, is the temperature in K, and is the thermal conductivity of the concrete lining in w/(m·K). It is assumed that the left side of the concrete lining is exposed to radiative and convective heat flux.
where denotes the convective coefficient, and denotes the flame temperature produced by the coke combustion, is the emissivity, and is the Stefan–Boltzmann constant.
2.5. Multiphysics Analysis of the MSR
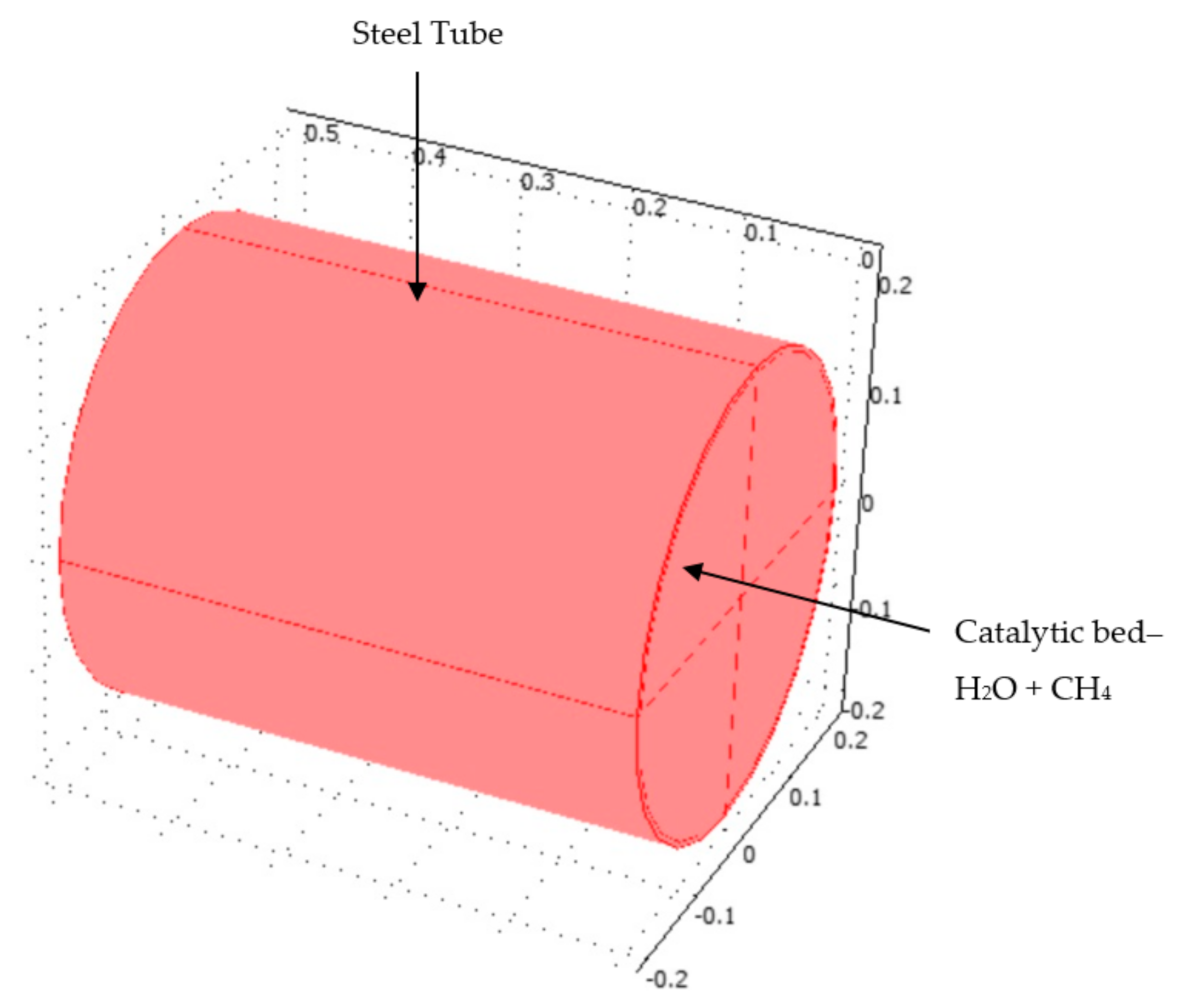
The methane steam reformer (MSR) is analyzed numerically in the section. Figure 9 presents the geometrical model of the MSR.
The MSR contains catalyst material and steel casing. The reformer radius is 0.2 m, and its height is 0.5 m. The steel tube thickness is 0.01 m. The steam chemical reforming reactions occur in an MSR catalytic reactor. Heat is transferred to the MSR by using pet-coke burner in order to provide the necessary endothermal steam reforming reaction. A mixture of methane and steam enters into the MSR catalytic reactor. COMSOL multiphysics solves simultaneously the Darcy fluid flow, heat transfer with endothermic chemical reactions, and mass transfer equations with terms of chemical reaction kinetics (Arrhenius equation).
2.5.1. Model Kinetics of the MSR
The steam and methane react to form CO and H2 in the MSR:
The kinetic rate of the MSR reaction is calculated by applying Equation (6) [23]:
The frequency factor is (represented by A) is 1.2 × 10¹⁷ (1/s). The activation energy (represented by E) is 223,070 (kJ/mole) [24].
2.5.2. Porous Media Fluid Flow inside the MSR
The flow of the gaseous mixture of the methane and steam is described by Darcy’s Law:
where denotes the gaseous mixture density (kg/m3), and is the viscosity of the gaseous mixture in (Pa·s). The term is the permeability of the MSR bed (m2). represents the pressure inside the reformer bed (Pa). The other boundaries are impervious:
2.5.3. Heat Transfer of Equation inside the MSR
The heat transfer equation is applied to describe the temperature field inside the catalyst bed:
The equivalent heat capacity of the MSR is calculated by:
The subscripts “s” and “f” represent solid and fluid phases, respectively. The term ε represents the volume fraction of the fluid phase. is the temperature (K) and is the thermal conductivity of the MSR catalyst bed in w/(m·K). Q is the thermal source (w/m3), and u is the fluid velocity field (m/s) of the mixture inside the MSR. It is assumed that the MSR is homogeneous and isotropic. The steady-state heat transfer conduction equation becomes:
The MSR reaction volumetric heat source is calculated by the following equation:
Here, r represents the MSR reaction rate. The enthalpy of reforming reaction is: [25]. Since there are no chemical reactions taking place in the steel tube, the heat conduction equation reduces to:
where is the steel thermal conductivity. The temperature of the entering gaseous mixture is 1000 K at the inlet. The convective heat transport is dominant at the outlet:
2.5.4. Mass Transport of the MSR Bed
The Maxwell–Stefan diffusion and convection equation (mass balance) at steady state condition is:
Here, denotes the density (kg/m3), is the mass fraction of species i, is the mole fraction of component j, is the ij component diffusion coefficient (m2/s), is the generalized thermal diffusion coefficient (kg/(m·s)), and is the reforming reaction rate in (kg/(m3·s)).
2.5.5. Computation of the Species Diffusion Coefficients
The diffusion coefficients of the components, , are obtained by Chapman–Enskog theory [26]:
is the Lennard–Jones collision diameter. is the collision integral between molecule i and molecule j. The collision diameter is calculated by and is calculated by [27]:
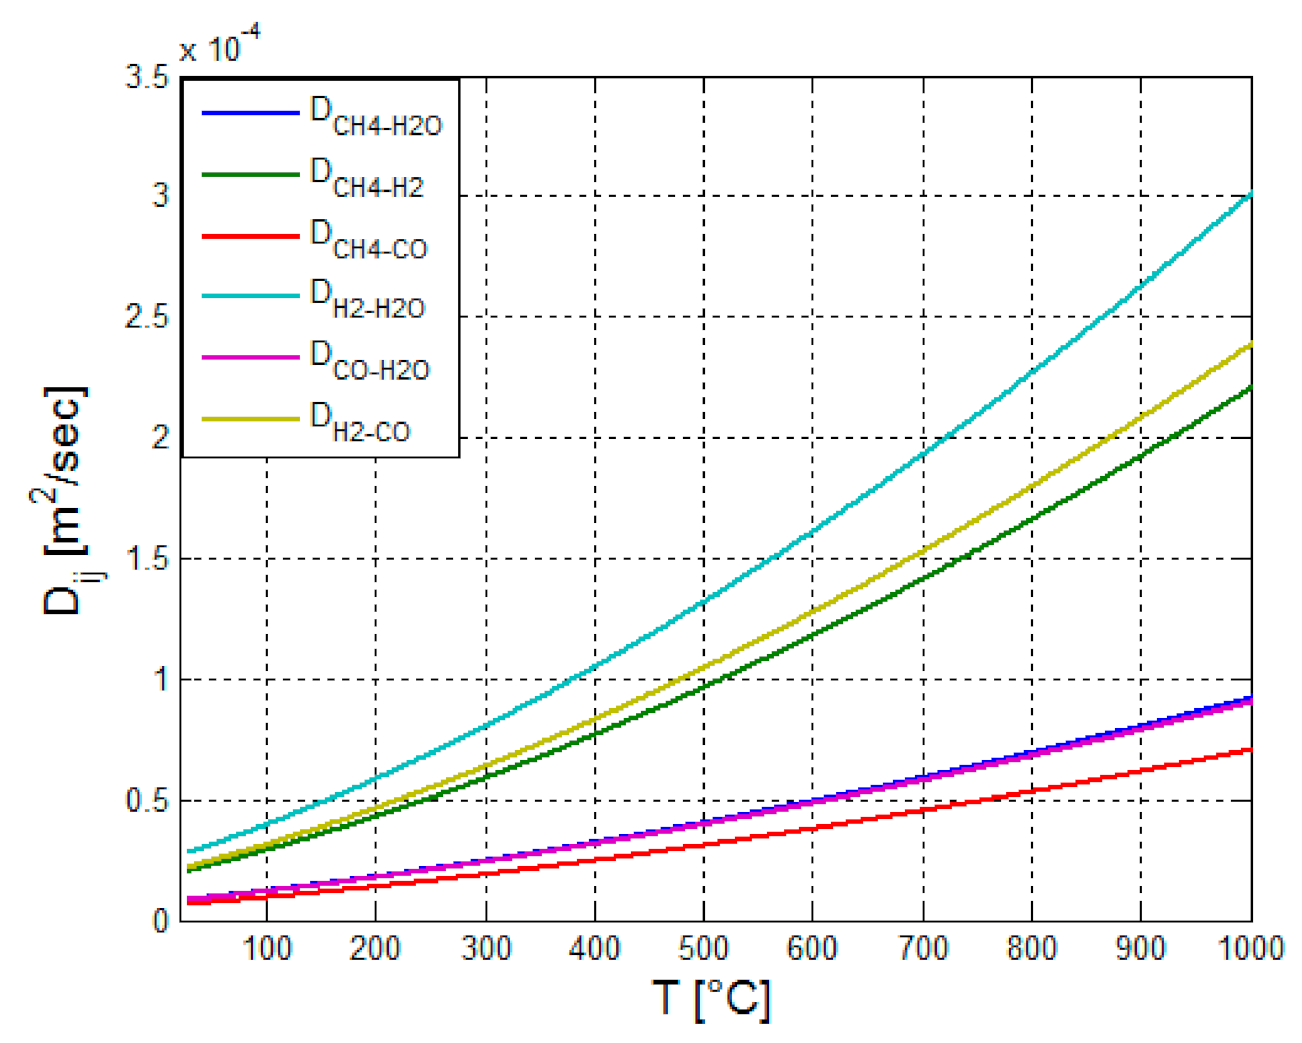
denotes the dimensionless temperature. The term denotes the maximum attractive energy between the molecule i and j. The numerical values of and for each component are described in detail in [28]. The binary diffusion coefficients are shown in Figure 10.
According to Figure 10, the species diffusion coefficient increases with the temperature.
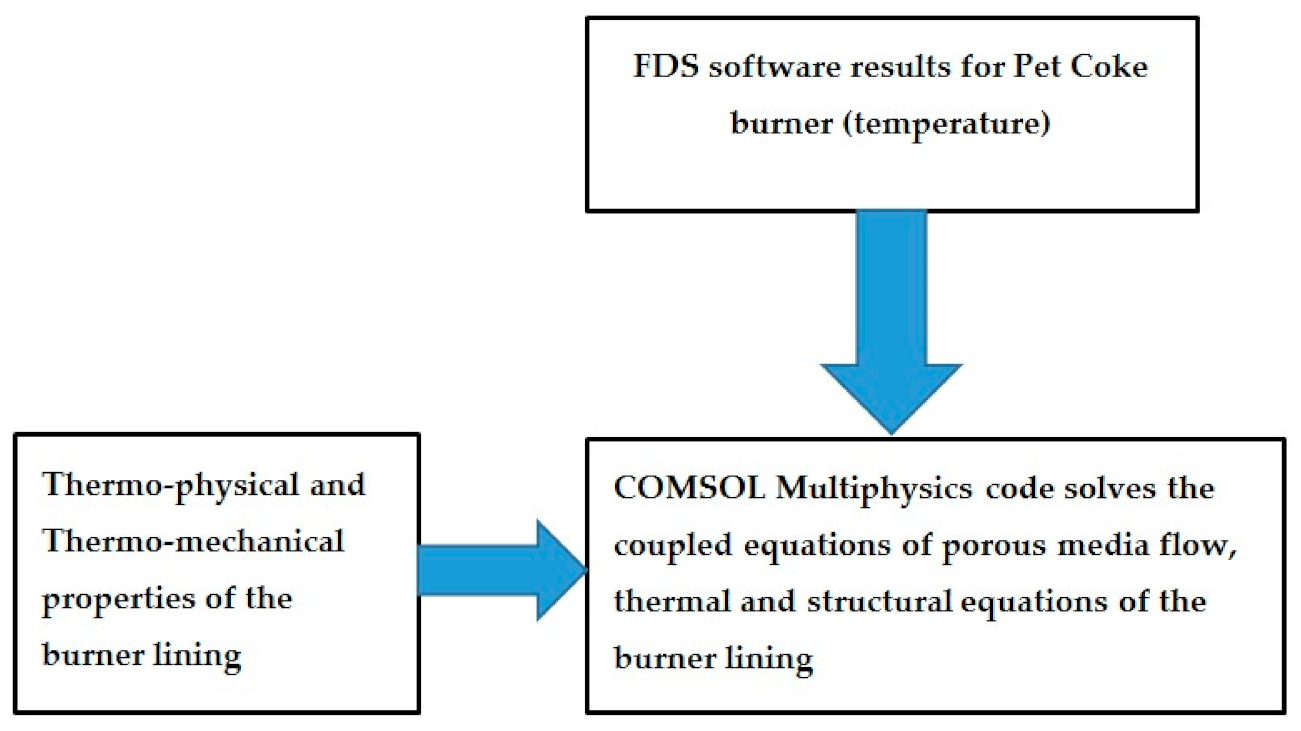
2.6. Computation Process of the Pet-coke Burner
The computational process is described in Figure 11. The calculation process is composed of three parts: computation of the temperatures and species mass fractions by using FDS software, loading the thermo-physical and thermo-structural properties of the concrete, and finally solving the heat transfer, and structural equations for the burner ceiling by using COMSOL software [21].
3. Results
The results section is divided into three parts. The thermal results of FDS code are described in Section 3.1. The multiphysics results (temperature and mass fractions of the species) for MSR are described in Section 3.3.
3.1. Fire Dynamics Simulator Software Results for Burner
This section provides the results of FDS simulation regarding the coke burner, including the gas velocity, the mixture temperature, heat release rate, and carbon dioxide mole fractions. The temperature field at t = 60.7 s is presented in Figure 12.
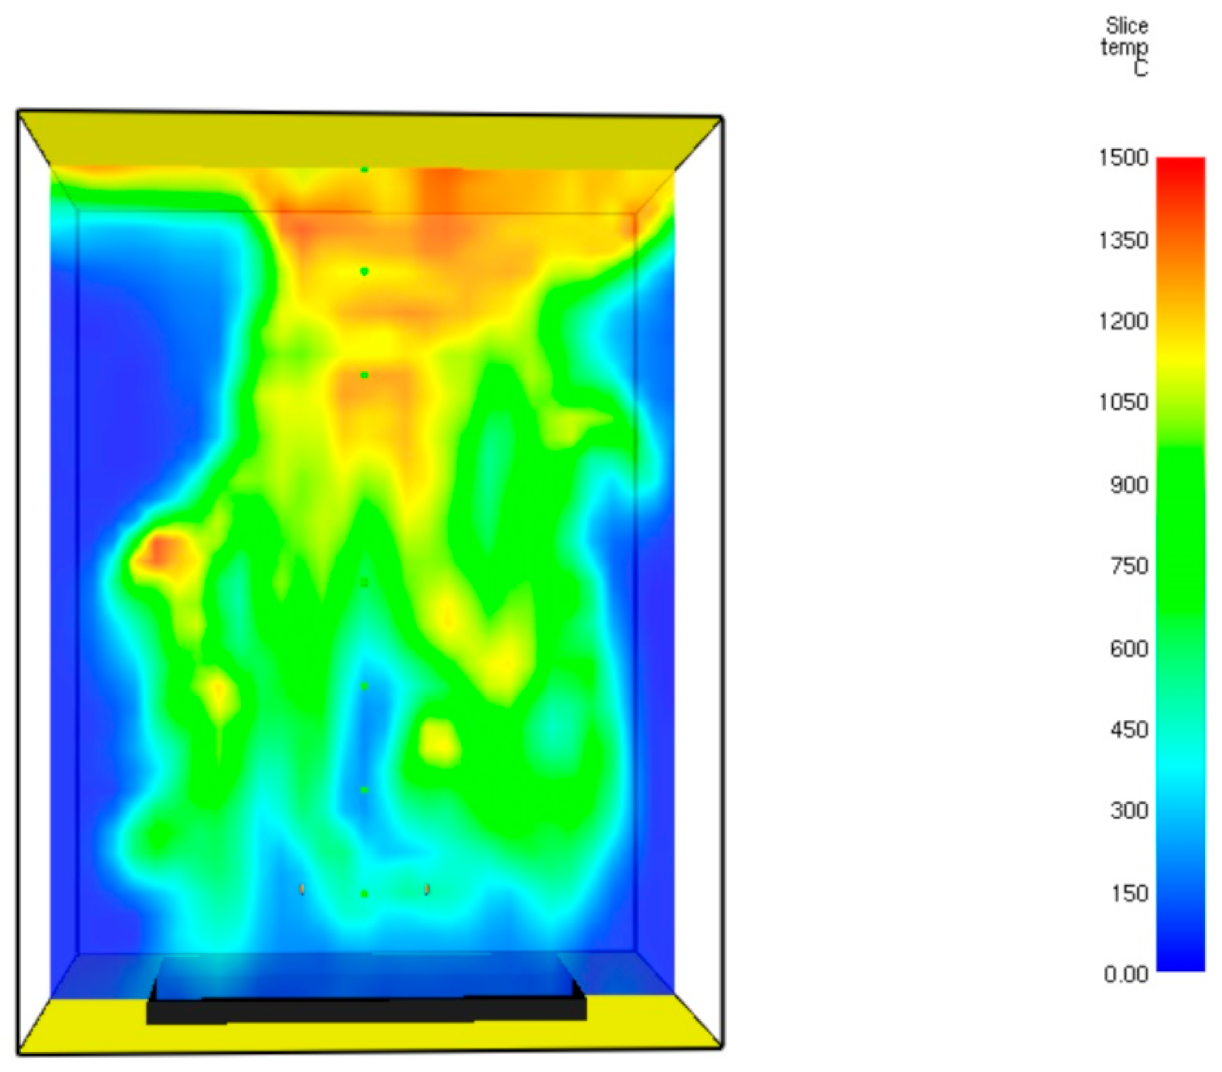
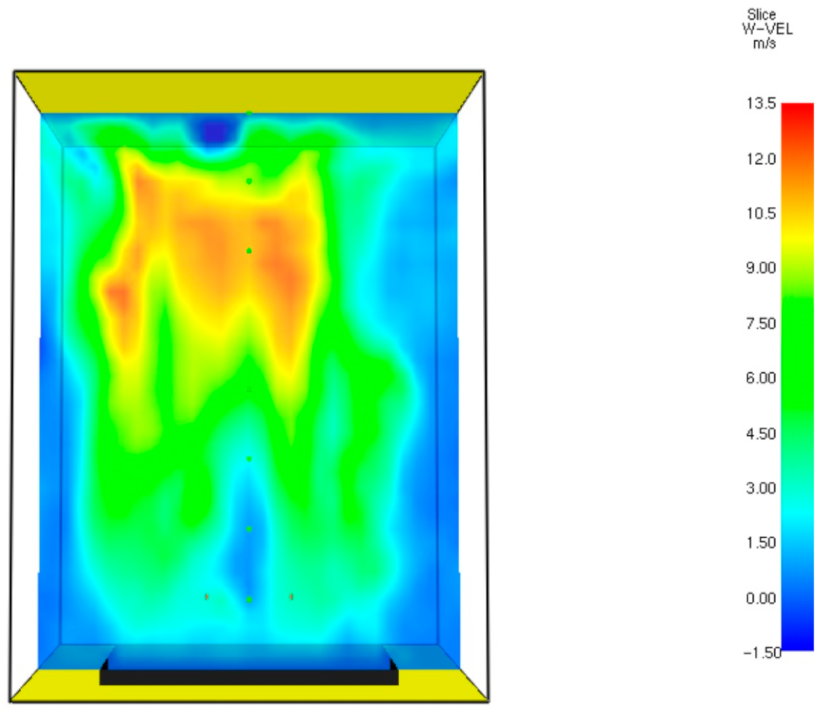
It can be seen from this figure that the maximal temperature at time = 60.7 s reaches 1440 °C. A similar value was reported in [18]. The temperature of the gaseous mixture tends to increase at the top of the burner. The calculated temperature at the bottom region of the burner is close to 700 °C. A similar temperature was reported in Ahmed and Ateya [29]. The velocity field of the gaseous mixture at time of t = 60.7 s is presented in Figure 13.
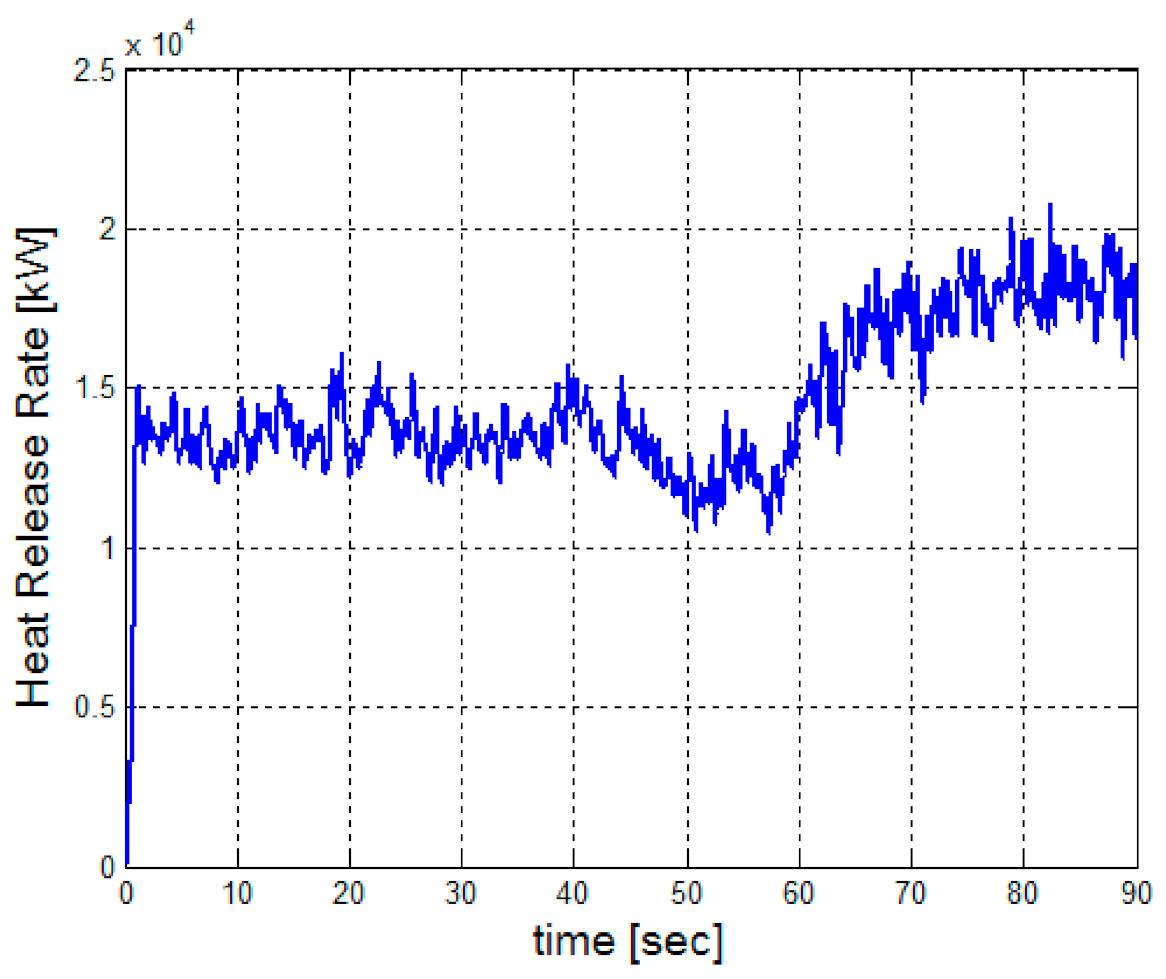
Figure 13 shows that flue gases flow upwards. This movement is caused by buoyancy. As can be seen from Figure 10 and Figure 11, the temperature and velocity of the gaseous mixture tend to be higher in close proximity to the ceiling. The combination of these physical phenomena increases the convective and radiative heat fluxes to the ceiling lining. Thermal stresses are usually generated by temperature distributions caused by the combustion or by generation of heat by internal thermal sources such as joule dissipation [30]. The temperature gradient leads to thermal expansion. The sharp temperature gradient inside the concrete ceiling lining enhances the thermal stresses. Figure 14 shows the heat release rate (HRR). Seven soot concentration sensors and thermocouples were positioned at different heights (shown in Table 1) inside the burner model.
Figure 15 shows the temperature readings of the three thermocouples (TC1, TC4, and TC7).
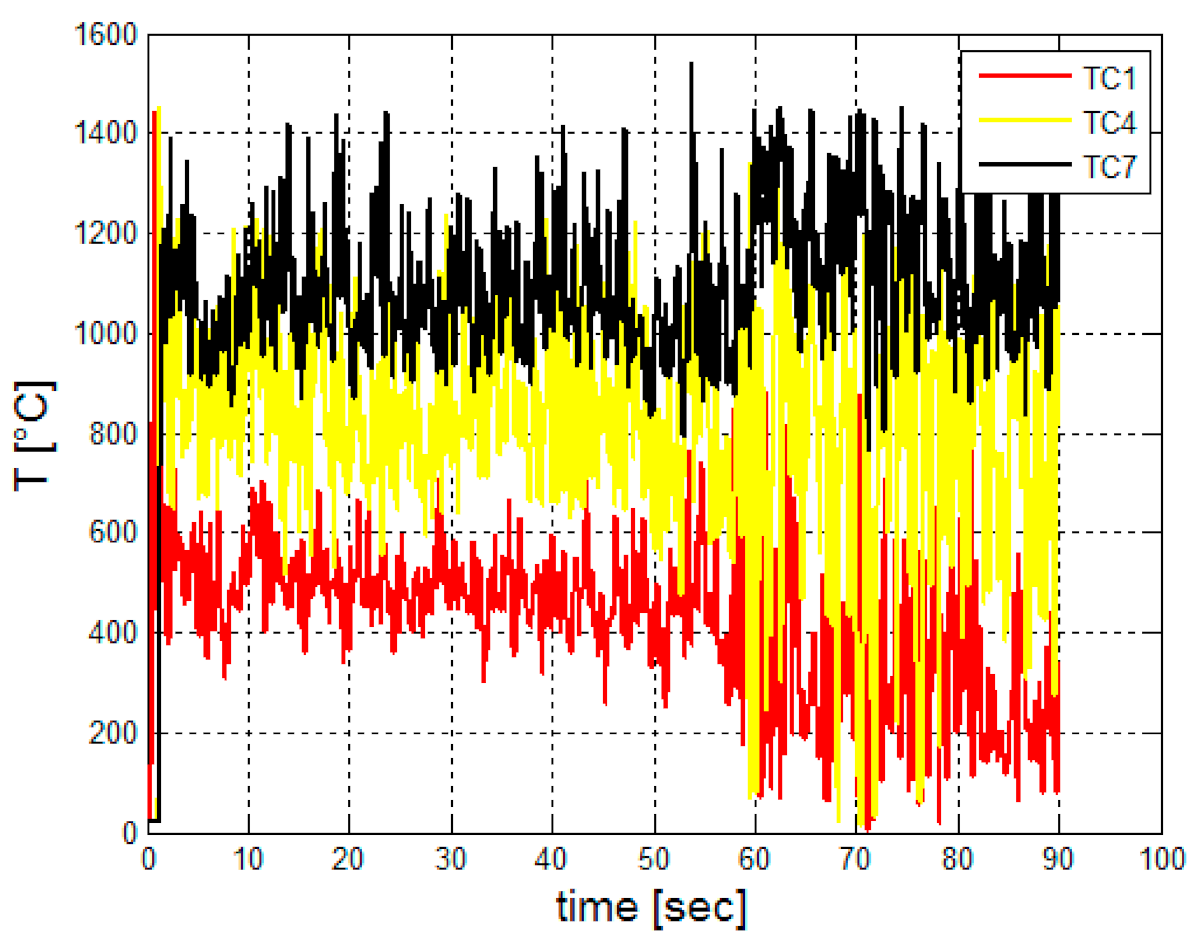
According to Figure 15, the temperature readings which are shown by TC1 are much lower than the temperature readings of TC4 and TC7. This is because the hot gaseous mixture tends to concentrate near the burner ceiling because of the buoyancy forces. The maximal temperature obtained from TC7 reading is about 1440 °C. The calculated temperature is similar to the temperature reported in [18], which is also close to 1400 °C. Figure 16 shows the carbon dioxide mole fraction readings of the three sensors (CO2-1, CO2-4, and CO2-7).
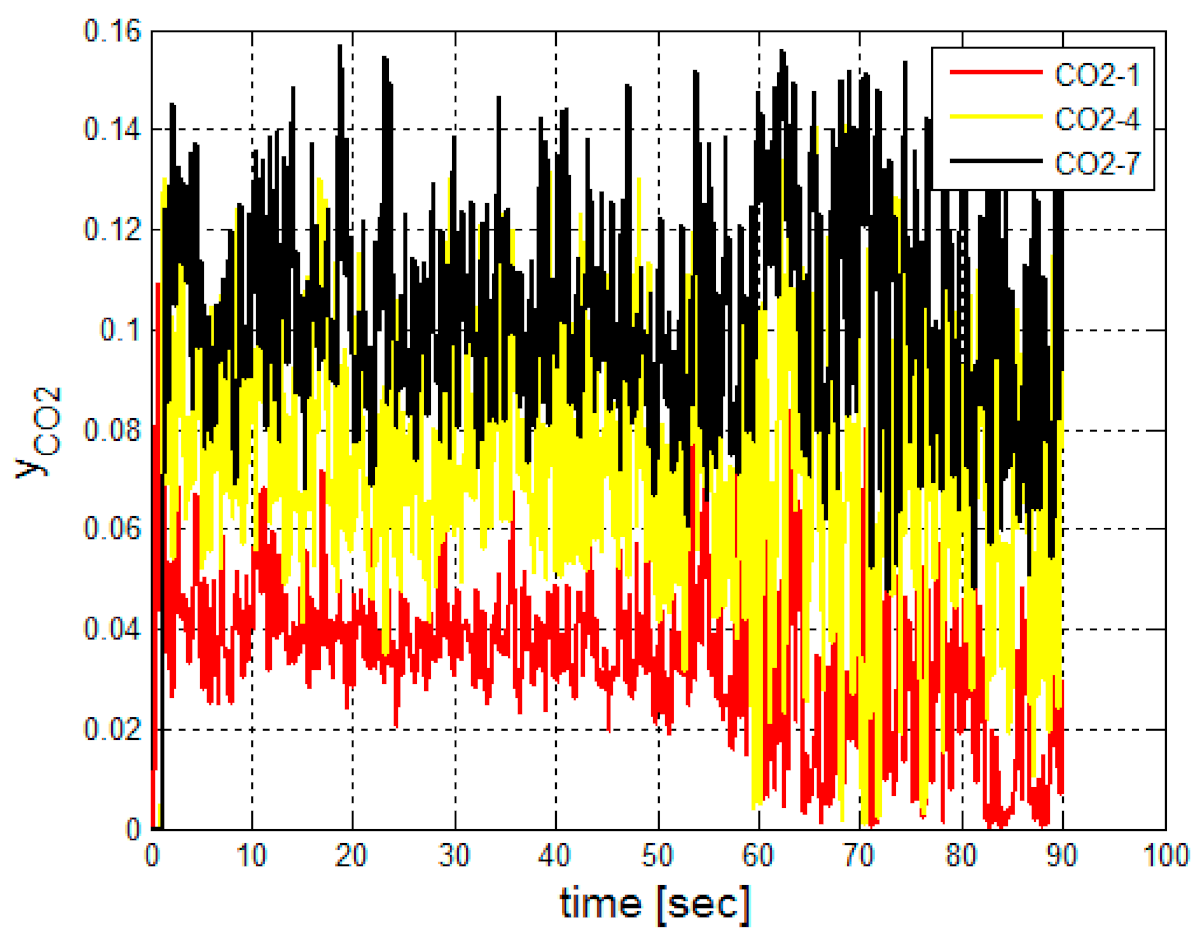
Figure 16 indicates that the mole fraction readings shown by CO2-1 are much lower than the mole fraction readings obtained by CO2-4 and CO2-7 sensors. This is because the oxidation reactions taking place between the coke particles and the oxygen increases with higher temperatures. The oxidation reactions are governed by the Arrhenius rate equations. The maximal carbon dioxide mole fraction obtained from CO2-7 reading is 15.0%. The calculated carbon dioxide mole fraction is similar to the carbon dioxide mole fractions reported in [31,32] which are 14.5% and 13.6%, respectively.
Grid Sensitivity Study Results
In order to verify the CFD numerical results, a grid sensitivity study was carried out on the FDS model developed in this work. An additional FDS model was developed, containing 36,000 cells. The average temperature was calculated by performing numerical integration over the time. The difference between the average temperatures obtained by applying different meshes are shown in Table 4.
The difference between the average temperatures obtained by applying different meshes is less than 8%.
3.2. Thermomechanical Analysis Results for Burner Ceiling Lining
A thermomechanical analysis was carried out in order to evaluate the von Mises stresses inside the concrete. It is assumed that the convective coefficient of gaseous mixture is 25.0 W/(m2·K) [33]. Figure 17 shows the 2D temperature field inside the fiber-reinforced carbonate aggregate concrete lining.
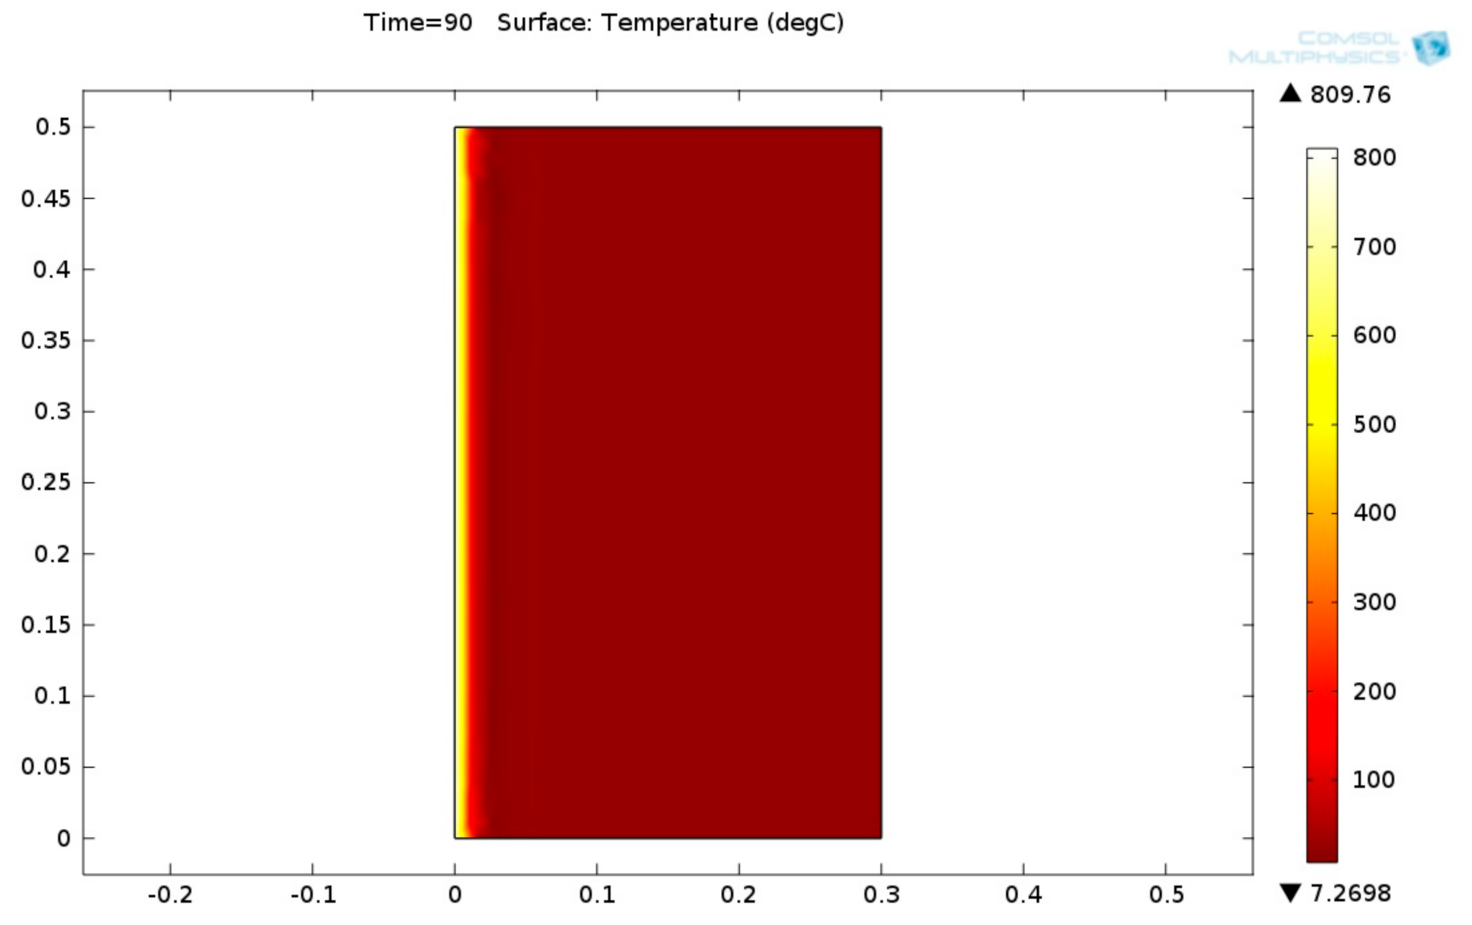
From Figure 17, it can be seen that the temperature gradient inside the fiber-reinforced carbonate aggregate concrete is high. This is because the thermal conductivity of this kind of concrete is low. The 2D von Mises stress distribution of burner fiber-reinforced carbonate aggregate concrete lining is shown in Figure 18.
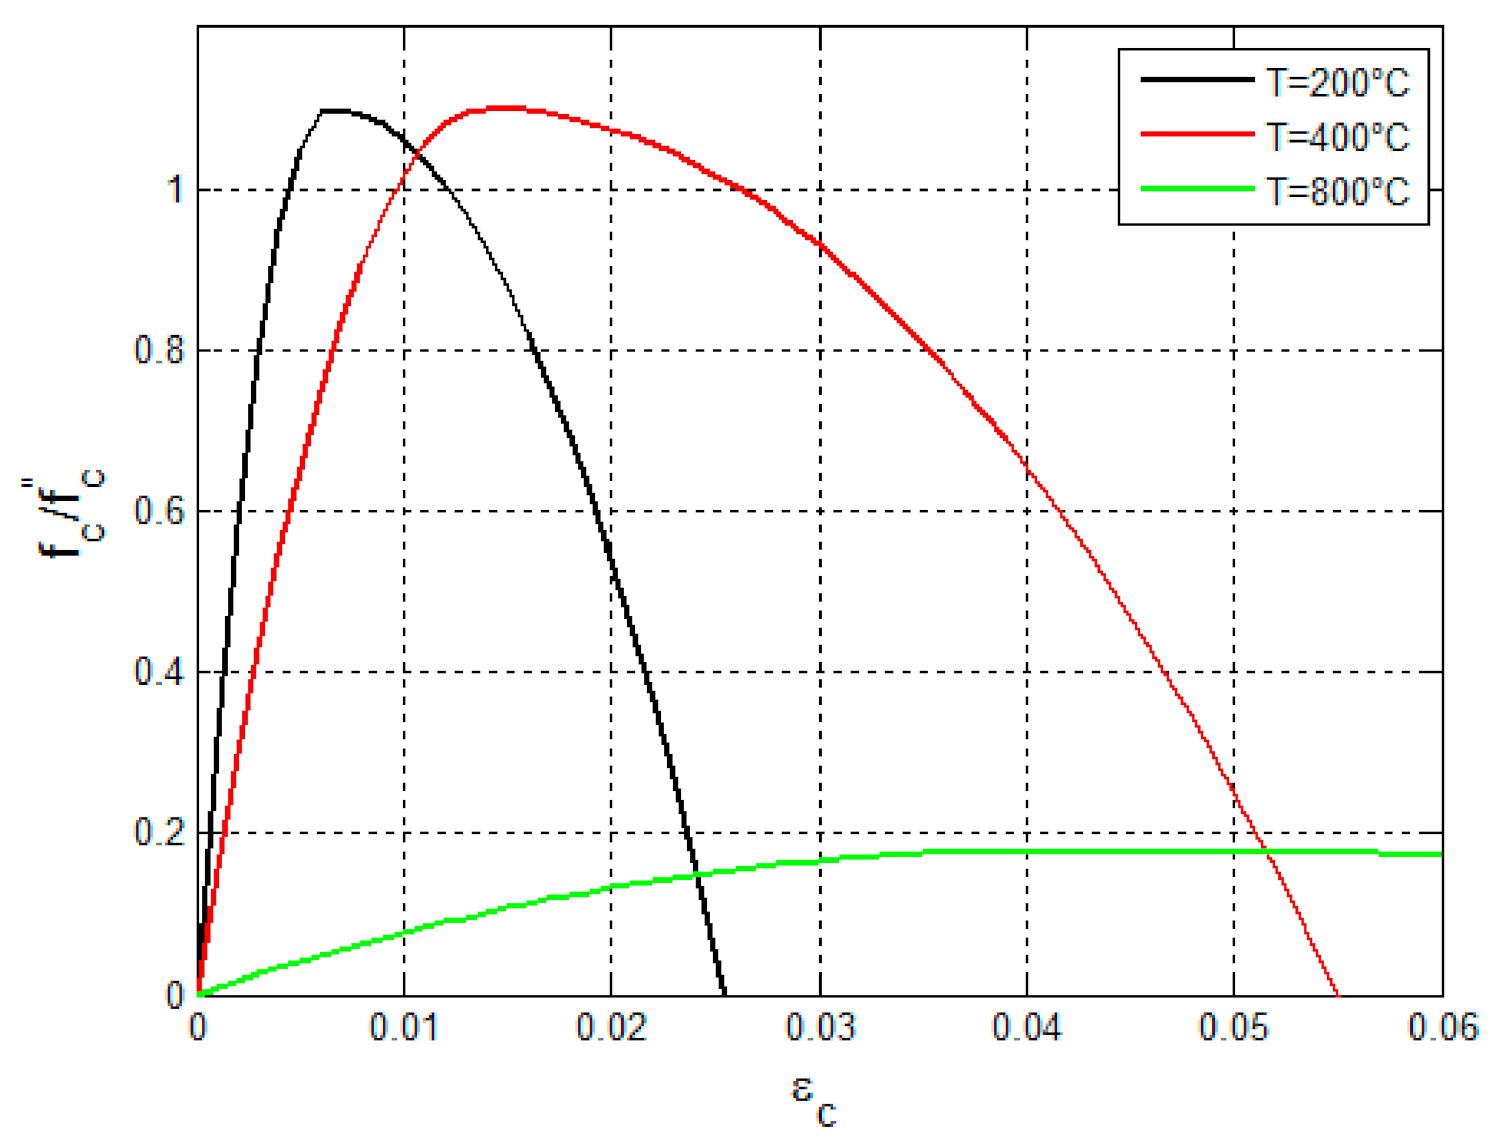
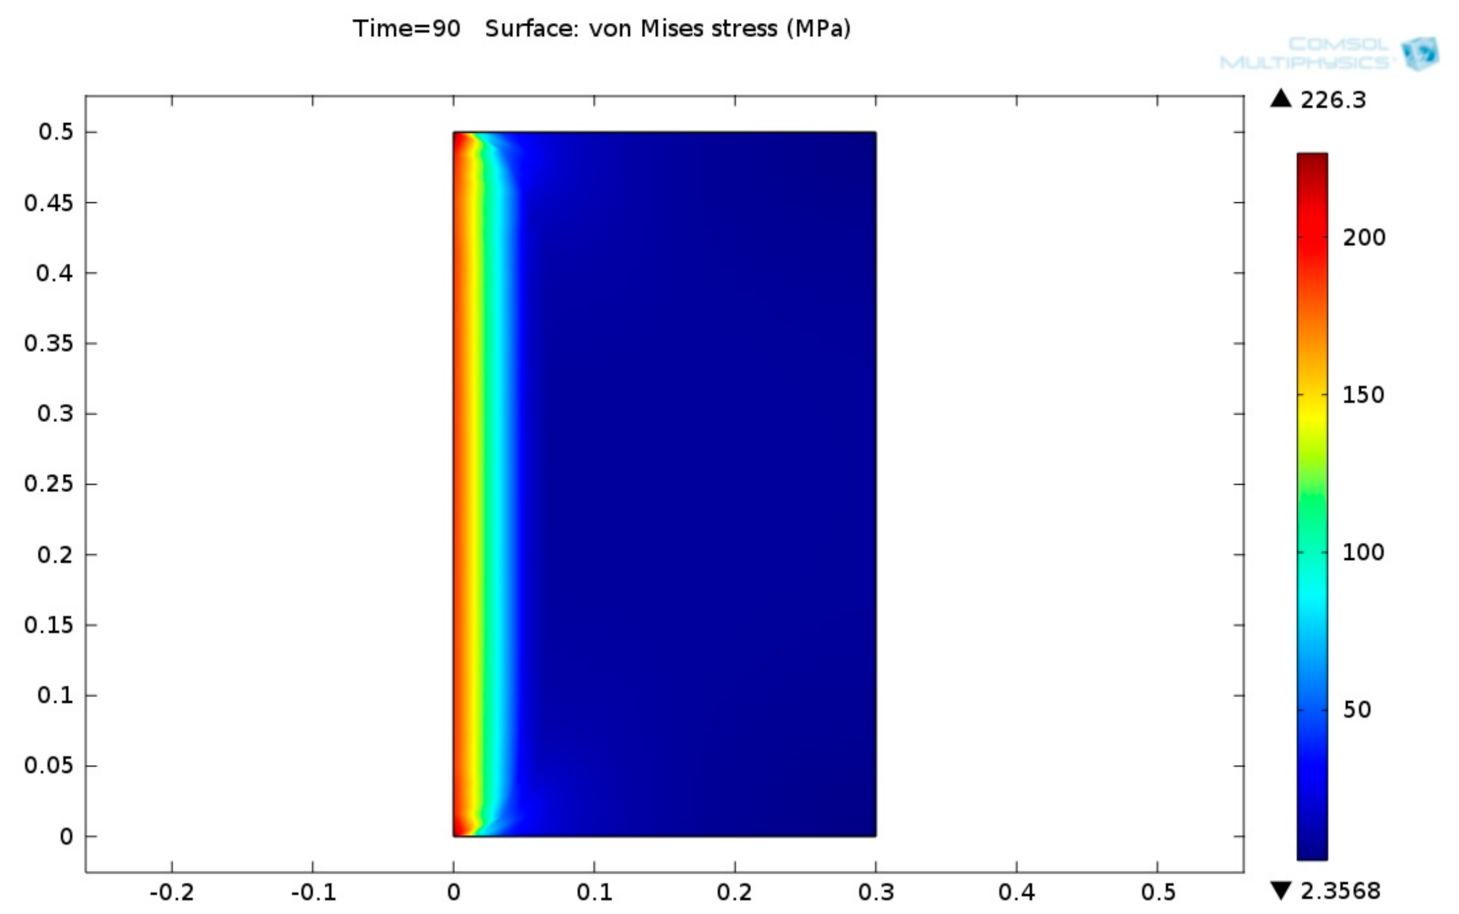
Figure 18 indicates that the maximal stress reaches 226.3 MPa. These stresses are concentrated at the very narrow zone at the left side of the concrete ceiling lining. The von Mises stress decreases with the concrete thickness. Similar calculations were carried out on fiber-reinforced siliceous aggregate concrete linings. It was found that the maximal temperature obtained in the case of applying siliceous aggregate concrete is lower than carbonate aggregate concrete. This is because the thermal conductivity of siliceous aggregate concrete is greater than the thermal conductivity of carbonate aggregate concrete (see Figure 4). The maximal stress reaches 217.06 MPa. These stresses are concentrated at the very narrow zone at the left side of the concrete ceiling lining. The von Mises stress decreases along the concrete depth.
3.3. Multiphysics Results for MSR
Figure 19 shows the 2D plot of temperature field inside the MSR.
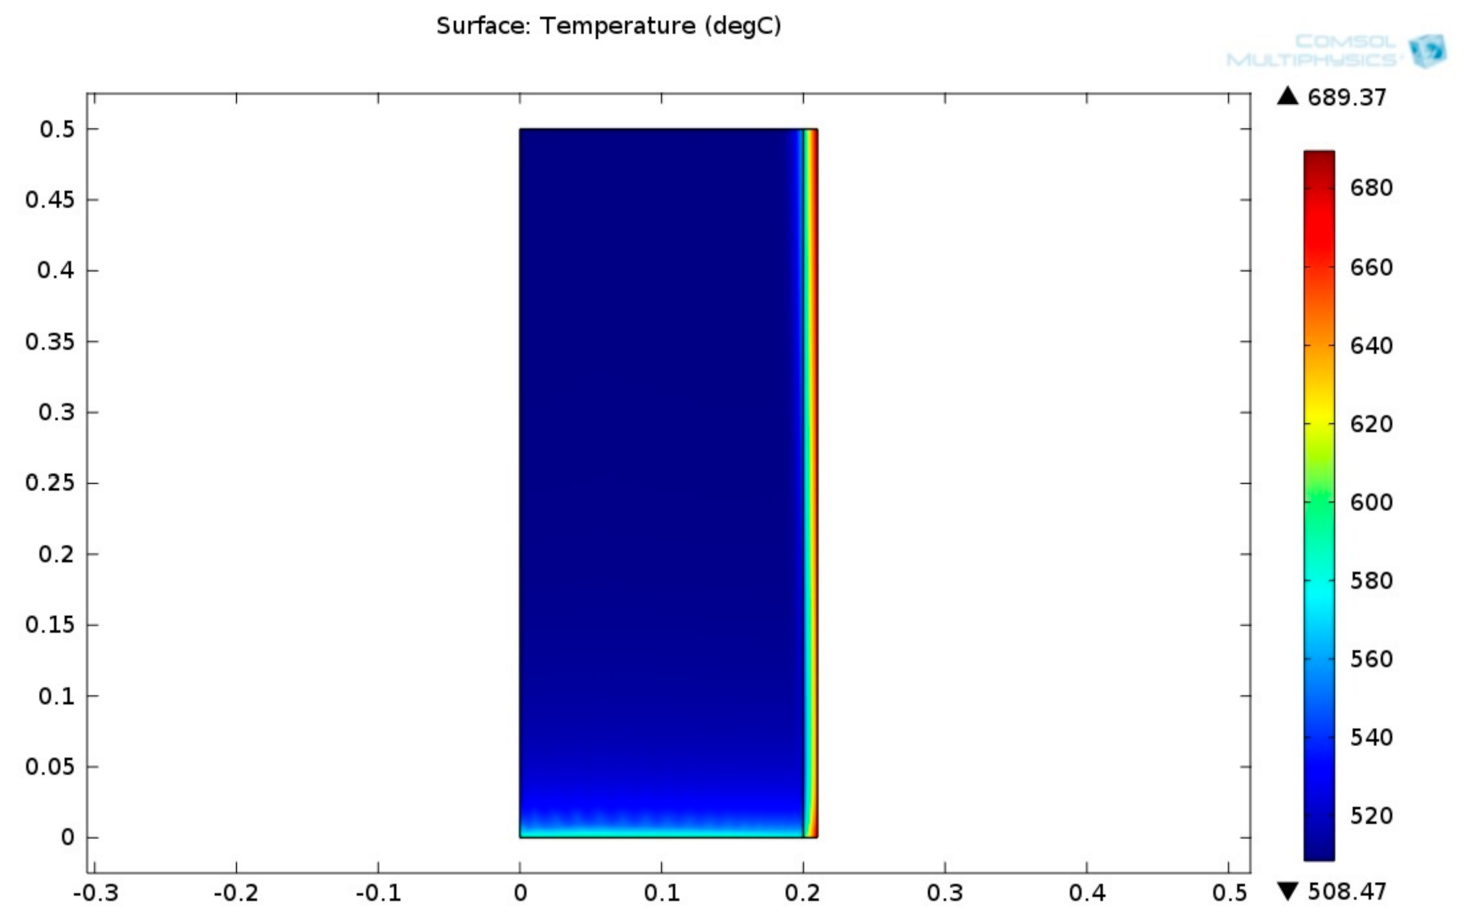
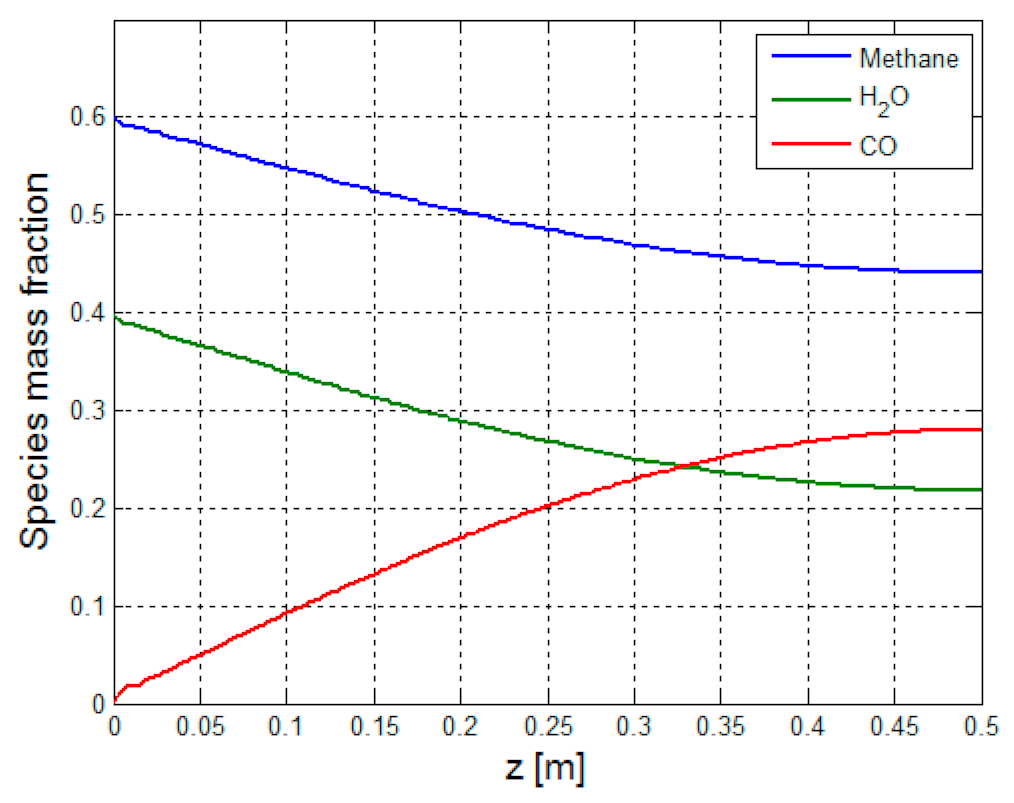
Figure 19 shows that the temperature decays along the MSR height. The temperature of the steel tube is greater than the temperature of the MSR. This phenomenon may be attributed to by three major factors: Firstly, the thermal conductivity of the catalyst is smaller than the steel tube; secondly, the endothermic reactions taking place at the MSR are endothermic and consume the heat; and thirdly, the MSR bed is thicker than the steel casing. Figure 20 shows the values mass fractions of the components (methane, CO, and H2O) along the reformer height. The temperature inside the MSR is about 510 °C.
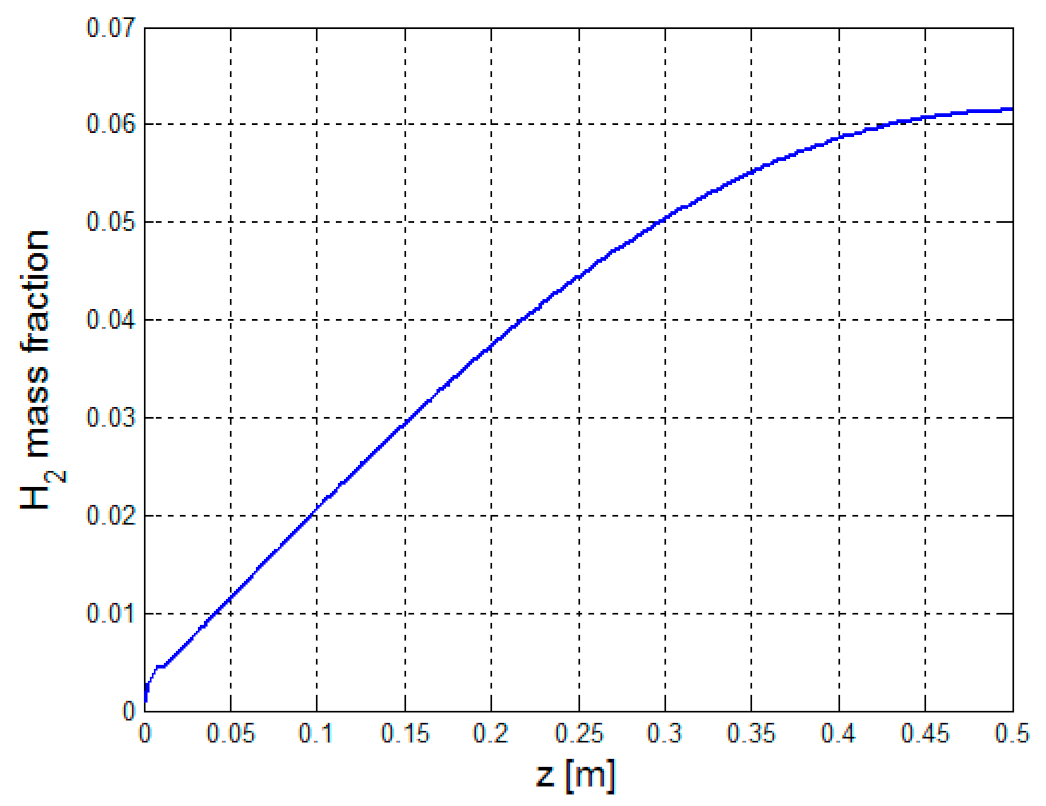
The mass fractions of the reactants (methane and steam) decrease with reformer height. The methane conversion is about 27%. The amounts of methane and the steam are proportional to each other (see Equation (5)). Similar results have been obtained in references [34,35]. The results obtained here indicate that heat released by the pet-coke burner provides the necessary heat for performing the endothermic MSR chemical reactions. Figure 21 presents the mass fraction of hydrogen along the reformer height.
The hydrogen mass fraction increases considerably with the reformer height, as shown in Figure 21. It is increased by 98.4%.
3.4. Verification and Validation of the Multiphysics Results for the MSR
The profile of the hydrogen mass fraction shown in this figure is similar to the profile to the hydrogen partial pressure graph (the partial pressure of the hydrogen is a linear function of the mass fraction) shown in [35]. According to the graphs shown in Figure 20 and Figure 21, the methane, steam, hydrogen, and carbon monoxide mass fraction at the upper edge of the MSR are: 0.440, 0.218, 0.062, and 0.28, respectively. The sum of these mass fractions is 1, as expected according to the mass conservation law.
4. Discussion
Multiphysics design of a pet-coke burner and methane steam reforming (MSR) system was carried out in this work. The heat needed for operating the MSR was supplied by using a petroleum coke burner. Pet-coke (petroleum coke) is a black-colored and carbon-rich solid. Pet-coke is produced by delayed cokers. It is an attractive source of energy due to its very high heating value (over 8500 kcal/kg) that stems from its high carbon (75–80% by weight) and low ash content (under 1%). According to the literature, the coke yield produced by delayed coker is about 33%. Coke burns in several installations inside the refinery.
A computational fluid dynamics (CFD) simulation algorithm of pet-coke burner was developed in this work. The proposed computational algorithm includes simulation of a pet-coke burner by using FDS software, and structural analysis of the burner ceiling lining by coupling the solutions of heat conduction equation, Darcy porous media flow equation, and structural mechanics equation. In order to validate the gaseous temperature and carbon dioxide mole fraction obtained by FDS calculation, a comparison was carried out with the literature results. The maximal temperature obtained in the numerical combustion analysis is about 1440 °C. The calculated temperature is similar to the temperature reported in the literature. The maximal carbon dioxide mole fraction obtained in this work is 15.0%. The calculated carbon dioxide mole fraction is similar to the carbon dioxide mole fraction reported in the literature, which is 14.5%.
It is assumed that the ceiling linings are made from concrete with the strength and deformation properties of steel fiber-reinforced siliceous and carbonate aggregate concretes. A thermostructural analyses study was performed in order to analyze the influence of the radiative and convective heat flux on the burner concrete lining structural integrity. The COMSOL software was loaded with the gaseous temperature obtained by FDS software. The proposed work may be applied in the design of wall lining FCC, furnaces, and pet-coke combustion installation in order to mitigate the explosive spallation failure of the linings. The von Mises stress field of the concrete linings was calculated. It was found that the temperature gradient inside the fiber-reinforced carbonate aggregate concrete is high. This is because the thermal conductivity of this kind of concrete is low. The maximal stress reaches 226.3 MPa at the very narrow zone at the left side of the fiber-reinforced carbonate aggregate concrete lining. It was found that the maximal temperature obtained in the case of applying siliceous aggregate concrete is lower than carbonate aggregate concrete. This is because the thermal conductivity of siliceous aggregate concrete is greater than the thermal conductivity of carbonate aggregate concrete. The maximal stress reaches 217.06 MPa at the very narrow zone at the left side of the fiber-reinforced siliceous aggregate concrete lining. The von Mises stress decreases along the concrete thickness. The von Mises strength decreases with enhancement of the heat transfer. The pet-coke burner supplies the necessary heat flux for maintaining the methane steam reforming reaction.
The temperature decays along the MSR height. The temperature of the MSR steel casing is greater than the temperature of the MSR reactor. It was found that the methane and steam mass fractions decrease along the reformer height. The methane conversion is about 27%. The steam and the methane decay along the catalyst bed reactor at the same slope. This is because these two amounts of reactants are proportional to each other. Similar values are reported in the literature for MSR temperature of 510 °C. The hydrogen mass fraction was increased by 98.4%.
5. Conclusions
In my opinion, this is the first work consisting of simulation of pet-coke combustion by using FDS software coupled with thermal structural analysis of the burner ceiling lining (in order to verify that the burner lining can withstand the extreme service conditions of the burner) and a multiphysics computation of the methane steam reforming (MSR).
All the papers described above have hardly addressed the issue of structural integrity of the lining. The pet-coke linings rupture may release pollutants such as carbon dioxide and soot particles to the atmosphere.
This paper presents a CFD modeling of pet-coke combustion and structural analysis of the burner lining. The proposed computational algorithm includes simulation of a pet-coke burner, structural analysis of the burner ceiling lining by coupling the solutions of heat conduction equation, Darcy porous media flow equation, and structural mechanics equation for two kinds of concrete lining—fiber-reinforced carbonate aggregate concrete and fiber-reinforced siliceous aggregate concrete. The relevant thermal and mechanical properties of steel fiber-reinforced concrete at elevated temperatures were applied. It is recommended to apply fiber-reinforced siliceous aggregate concrete. Its mass decays slowly and its maximal stress is much slower. The maximal temperature obtained in the numerical combustion analysis is about 1440 °C. The calculated temperature is similar to the temperature reported in the literature. The maximal carbon dioxide mole fraction obtained in this work is 15.0%. The calculated carbon dioxide mole fraction is similar to the carbon dioxide mole fractions reported in the literature which are 14.5% and 13.6%, respectively. This work may be further extended in order to include power production by applying the Organic Rankine Cycle. The heat liberated from the pet-coke combustion may be exploited in the steam generator order to produce steam. The hydrogen production system is composed of a pet-coke burner and a catalyst bed reactor. The hot gases generated were utilized for convective and radiative heating of the catalyst bed for maintaining the steam reforming reaction of methane into hydrogen and carbon monoxide.
Funding
This research has not received external funding. No funding sponsors had any role in the numerical analyses, or interpretation of data; in the writing of the manuscript, or in the decision to publish the results.
Conflicts of Interest
The author declares no conflict of interest.
Abbreviations
| CFD | Computational Fluid Dynamics |
| CTE | Coefficient of Thermal Expansion |
| FCC | Fluid Catalytic Cracking |
| FDS | Fire Dynamics Simulation |
| FVM | Finite Volume Method |
| HSFO | High Sulfur Fuel Oil |
| HRR | Heat Release Rate |
| LES | Large Eddy Simulation |
| MSR | Methane Steam Reforming |
| Pet Coke | Petroleum Coke |
| RTE | Radiation Transport Equation |
| UTS | Ultimate Tensile Strength |
Nomenclature
| heat capacity in [J/(kg K)] | |
| gravity acceleration in [m/s2] | |
| specific enthalpy of the stream in [kJ/kg] | |
| convective heat transfer coefficient in [W/(m2 K)] | |
| thermal conductivity in [W/(m K)], Boltzmann constant in Equation (17). | |
| pressure of the moisture in [kPa] | |
| temperature in [K] | |
| time in [K] | |
| velocity of the stream in [m/s] | |
| height of the stream in [m] | |
| Subscripts | |
| concrete | |
| condenser | |
| heat release rate | |
| Greek letters | |
| emissivity of the concrete | |
| strain of the concrete [Pa·s] | |
| viscosity of the steam in [Pa·s] | |
| permeability of the concrete in [m2] | |
| density in [kg/m3] | |
| Stefan–Boltzmann constant () | |
| porosity of the concrete | |
References
- Afrooz, I.E.; Ching, D.L.C. A Modified Model for Kinetic Analysis of Petroleum Coke. Int. J. Chem. Eng. 2019. [Google Scholar] [CrossRef]
- Gigilio, R. The Power Option. Available online: https://www.digitalrefining.com/article/1002284/the-power-option#.XwnO7G0zbX4 (accessed on 12 March 2021).
- Ramesh, K. Estimating Delayed Coker Yields. Available online: https://www.digitalrefining.com/article/1002409/estimating-delayed-coker-yields#.XxLFQm0zbX5 (accessed on 12 March 2021).
- Chang, J.; Wang, G.; Lan, X.; Gao, J.; Zhang, K. Computational Investigation of a Turbulent Fluidized-bed FCC Regenerator. Ind. Eng. Chem. Res. 2013, 52, 4000–4010. [Google Scholar] [CrossRef]
- Grace, J.R.; Taghipour, F. Verification and validation of CFD models and dynamic similarity for fluidized beds. Powder Technol. 2004, 139, 99–110. [Google Scholar] [CrossRef]
- De Wilde, J.; Froment, G.F. Computational Fluid Dynamics in chemical reactor analysis and design: Application to the ZoneFlow™ reactor for methane steam reforming. Fuel 2012, 100, 48–56. [Google Scholar] [CrossRef]
- Lao, L.; Aguirre, A.; Tran, A.; Wu, Z.; Durand, H.; Christofides, P.D. CFD modeling and control of a steam methane reforming reactor. Chem. Eng. Sci. 2016, 148, 78–92. [Google Scholar] [CrossRef] [Green Version]
- Holt, J.E.; Kreusser, J.K.; Herritsch, A.; Watson, M. Numerical modelling of a steam methane reformer. ANZIAM J. 2018, C112–C127. [Google Scholar] [CrossRef]
- Sadeghbeigi, R. Fluid Catalytic Cracking Handbook: An Expert Guide to Practical Operation, Design, and Optimization of FCC Units, 3rd ed.; Butterworth-Heinemann: Oxford, UK, 2012. [Google Scholar]
- Mullinger, P.; Jenkins, B. Industrial and Process. Furnaces Principles, Design and Operation, 2nd ed.; Butterworth-Heinemann: Oxford, UK, 2014. [Google Scholar]
- Sevón, T. Molten Core—Concrete Interactions in Nuclear Accidents: Theory and Design of an Experimental Facility; VTT Technical Research Centre of Finland: Espoo, Finland, 2005. [Google Scholar]
- McGrattan, K. Fire Dynamics Simulator (Version 5)—Technical Reference Guide Volume 1: Mathematical Model; NIST Special Publication 1018-5; National Institute of Standards and Technology U.S. Department of Commerce: Washington, DC, USA; New York, NY, USA, 2010.
- McGrattan, K.; Forney, G.P. Fire Dynamics Simulator (Version 5)—User’s Guide; NIST Special Publication 1019-5; National Institute of Standards and Technology U.S. Department of Commerce: Washington, DC, USA; New York, NY, USA, 2010.
- McGrattan, K. Numerical Simulation of the Caldecott Tunnel Fire, April 1982; NISTIR 7231; National Institute of Standards and Technology U.S. Department of Commerce: Washington, DC, USA, 2005.
- Davidy, A. CFD Simulation of Forced Recirculating Fired Heated Reboilers. Processes 2020, 8, 145. [Google Scholar] [CrossRef] [Green Version]
- Magee, J.S. Studies in Surface Science and Catalysis. In Fluid Catalytic Cracking: Science and Technology, 1st ed.; Delmon, B., Yates, J.T., Eds.; Elsevier Science Publishers: Amsterdam, The Netherlands, 23 July 1993; Volume 76. [Google Scholar]
- Pedersen, M.N.; Nielsen, M.; Clausen, S.; Jensen, P.A.; Jensen, L.S.; Johansen, K.D. Imaging of Flames in Cement Kilns To Study the Influence of Different Fuel Types. Energy Fuels 2017, 31, 11424–11438. [Google Scholar] [CrossRef] [Green Version]
- Lie, T.T.; Kodur, V.R. Thermal and mechanical properties of steel fiber reinforced concrete at elevated temperatures. Can. J. Civ. Eng. 1996, 23, 511–517. [Google Scholar] [CrossRef]
- Kodur, V. Properties of Concrete at Elevated Temperatures. Rev. Artic. 2014. [Google Scholar] [CrossRef]
- Wang, J.; Davie, C.T.; Masoero, E. Numerical Benchmark of experiments on heated concrete, RILEM TC 256. Presentd at the 5th Fire Spalling Workshop, Borås, Sweden, 12–13 October 2017. [Google Scholar]
- COMSOL. COMSOL Multiphysics—Modeling Guide, Version 4.3b; COMSOL AB: Stockholm, Sweden, 2013. [Google Scholar]
- Bird, R.E.; Stewart, W.E.; Lightfoot, E.N. Transport. Phenomena; John Wiley and Sons, Inc.: Hoboken, NJ, USA, 2002. [Google Scholar]
- Uriz, I.; Arzamendi, G.; López, E.; Llorca, J.; Gandía, L.M. Computational fluid dynamics simulation of ethanol steam reforming in catalytic wall micro channels. Chem. Eng. J. 2011, 167, 603–609. [Google Scholar] [CrossRef]
- Hou, K.; Hughes, R. The kinetics of methane steam reforming over a Ni/α-Al2O catalyst. Chem. Eng. J. 2001, 82, 311–328. [Google Scholar] [CrossRef]
- Xu, J.; Froment, G.F. Methane Steam Reforming, Methanation, and Water Gas Shift: I. Intrinsic Kinetics. AICHE J. 1989, 35, 88–96. [Google Scholar] [CrossRef]
- De-Souza, Z.G.M.; Moraes, F.F. Parametric Study of Hydrogen Production from Ethanol Steam Reforming in Membrane Micro-reactor. Braz. J. Chem. Eng. 2013, 30, 355–367. [Google Scholar] [CrossRef] [Green Version]
- Neufeld, P.D.; Jansen, A.R.; Aziz, R.A. Empirical equations to calculate 16 of the transport collision integrals Ω(l,s) * for the Lennard-Jones (1216–) potential. J. Chem. Phys. 1972, 57, 1100–1102. [Google Scholar] [CrossRef]
- Perry, R.H.; Green, D.W.; Maloney, J.O. Perry’s Chemical Engineers’ Handbook, 7th ed.; McGraw Hill: New York, NY, USA, 1997. [Google Scholar]
- Ahmed, D.F.; Ateya, S.K. Modelling and Simulation of Fluid Catalytic Cracking Unit. J. Chem. Eng. Process. Technol. 2016, 7, 308. [Google Scholar] [CrossRef] [Green Version]
- Emery, A.F. Thermal Stress Fracture in Elastic-Brittle Materials in Thermal Stresses in Severe Environments. In Thermal Stresses in Severe Environments; Hasselman, D.P.H., Heller, R.A., Eds.; Plenum Press: New York, NY, USA, 1980. [Google Scholar]
- Commandre, J.L.; Salvador, S. Lack of correlation between the properties of a petroleum coke and its behavior during combustion. Fuel Process. Technol. 2005, 86, 795–808. [Google Scholar] [CrossRef] [Green Version]
- Sandmo, T. The Norwegian Emission Inventory 2009, Documentation of Methodologies for Estimating Emissions of Greenhouse Gases and Long-Range Transboundary Air Pollutants; Statistics Norway/Department of Economics, Energy and the Environment Statistics: Oslo, Norway, 2009. [Google Scholar]
- Mehaffey, J. Lecture #4, Heat Transfer: Convection and Radiation. In Fire Dynamics I; Carleton University: Ottawa, ON, Canada, 2002. [Google Scholar]
- Chibane, L.; Djellouli, B. Methane Steam Reforming Reaction Behavior in a Packed Bed Membrane Reactor. Int. J. Chem. Eng. Appl. 2011, 2. [Google Scholar] [CrossRef]
- Shagdar, E.; Lougou, B.G.; Shuai, Y.; Ganbold, E.; Chinonso, O.P.; Tan, H. Process Analysis of Solar Steam Reforming of Methane for Producing Low-Carbon Hydrogen. RSC Adv. 2020, 10, 12582. [Google Scholar] [CrossRef]
Figure 1.
Schematics of methane steam reforming (MSR) system based on pet-coke burner.

Figure 2.
The process of buildup of steam pressure inside heated lining.

Figure 3.
The geometry of the pet-coke burner.

Figure 4.
Thermal conductivity of various concrete types as a function of temperature [18].
Figure 4.
Thermal conductivity of various concrete types as a function of temperature [18].

Figure 5.
Temperature-dependent heat capacity of the concrete [19].
Figure 5.
Temperature-dependent heat capacity of the concrete [19].

Figure 6.
Mass loss curves of different kinds of concrete as a function of temperature [18].
Figure 6.
Mass loss curves of different kinds of concrete as a function of temperature [18].

Figure 7.
Coefficient of thermal expansion (CTE) curves of the different concrete types as a function of temperature [18].
Figure 7.
Coefficient of thermal expansion (CTE) curves of the different concrete types as a function of temperature [18].

Figure 8.
Stress–strain curves of various concrete types as a function of temperature [18].
Figure 8.
Stress–strain curves of various concrete types as a function of temperature [18].

Figure 9.
3D plot of the MSR.

Figure 10.
The diffusion coefficients of the gaseous components as a function of the temperature.

Figure 11.
Schematics of the computational process of the pet-coke burner.

Figure 12.
Temperature field (°C) of the flue gaseous mixture inside the burner at t = 60.7 s.

Figure 13.
Velocity field (m/s) of the flue gaseous mixture at t = 60.7 s.

Figure 14.
Heat release rate (HRR) of the pet-coke burner.

Figure 15.
Temperature readings of three thermocouples inside the burner.

Figure 16.
Carbon dioxide readings of three sensors inside the burner.

Figure 17.
2D plot of the fiber-reinforced carbonate aggregate concrete lining temperature field.

Figure 18.
2D plot of the fiber-reinforced carbonate aggregate concrete von Mises stress field.

Figure 19.
2D plot of the MSR temperature field.

Figure 20.
Methane, steam, and carbon monoxide mass fractions as function of the MSR height.

Figure 21.
Hydrogen mass fraction along the MSR height.


Table 1.
Sensors locations inside the burner.
| Sensor | Position [m] |
|---|---|
| TC1, CO2-1, CO-1, Soot-1 | x = 4, y = 0, z = 0.5 |
| TC2, CO2-2, CO-2, Soot-2 | x = 4, y = 0, z = 1.0 |
| TC3, CO2-3, CO-3, Soot-3 | x = 4, y = 0, z = 1.5 |
| TC4, CO2-4, CO-4, Soot-4 | x = 4, y = 0, z = 2.0 |
| TC5, CO2-5, CO-5, Soot-5 | x = 4, y = 0, z = 3.0 |
| TC6, CO2-6, CO-6, Soot-6 | x = 4, y = 0, z = 3.5 |
| TC7, CO2-7, CO-7, Soot-7 | x = 4, y = 0, z = 4.0 |
Table 2.
Porosity and permeability properties of concrete used in COMSOL calculations [20].
Table 2.
Porosity and permeability properties of concrete used in COMSOL calculations [20].
| Concrete Property | Value |
|---|---|
| φ | 0.16 |
| κ | 10−14 (m2) |
Table 3.
Thermophysical properties of the MSR [7].
Table 3.
Thermophysical properties of the MSR [7].
| Material Property | Value |
|---|---|
| Density | 3960.0 (kg/m3) |
| Heat Capacity | 880.0 (J/(kg·°C)) |
| Thermal Conductivity | 33.0 (w/(m·°C)) |
Table 4.
Difference between the average temperatures obtained by applying different meshes.
| Thermocouple | Difference [%] |
|---|---|
| TC1 | 4.8 |
| TC4 | 3.1 |
| TC7 | 7.3 |
Publisher’s Note: MDPI stays neutral with regard to jurisdictional claims in published maps and institutional affiliations. |
© 2021 by the author. Licensee MDPI, Basel, Switzerland. This article is an open access article distributed under the terms and conditions of the Creative Commons Attribution (CC BY) license (http://creativecommons.org/licenses/by/4.0/).
Share and Cite
MDPI and ACS Style
Davidy, A. Multiphysics Design of Pet-Coke Burner and Hydrogen Production by Applying Methane Steam Reforming System. Clean Technol. 2021, 3, 260-287. https://0-doi-org.brum.beds.ac.uk/10.3390/cleantechnol3010015
AMA Style
Davidy A. Multiphysics Design of Pet-Coke Burner and Hydrogen Production by Applying Methane Steam Reforming System. Clean Technologies. 2021; 3(1):260-287. https://0-doi-org.brum.beds.ac.uk/10.3390/cleantechnol3010015
Chicago/Turabian StyleDavidy, Alon. 2021. "Multiphysics Design of Pet-Coke Burner and Hydrogen Production by Applying Methane Steam Reforming System" Clean Technologies 3, no. 1: 260-287. https://0-doi-org.brum.beds.ac.uk/10.3390/cleantechnol3010015