Comparison of Different References When Assessing PV HC in Distribution Networks


Department of Electrical Engineering and Automation, Aalto University, Maarintie 8, 02150 Espoo, Finland
*
Author to whom correspondence should be addressed.
Clean Technol. 2021, 3(1), 123-137; https://0-doi-org.brum.beds.ac.uk/10.3390/cleantechnol3010008
Submission received: 5 January 2021
/
Revised: 25 January 2021
/
Accepted: 27 January 2021
/
Published: 1 February 2021
(This article belongs to the Special Issue Integration and Control of Distributed Renewable Energy Resources)
Abstract
:The burgeoning photovoltaics’ (PVs) penetration in the low voltage distribution networks can cause operational bottlenecks if the PV integration exceeds the threshold known as hosting capacity (HC). There has been no common consensus on defining HC, and its numerical value varies depending on the reference used. Therefore, this article compared the HC values of three types of networks in rural, suburban, and urban regions for different HC reference definitions. The comparison was made under balanced and unbalanced PV deployment scenarios and also for two different network loading conditions. A Monte Carlo (MC) simulation approach was utilized to consider the intermittency of PV power and varying loading conditions. The stochastic analysis of the networks was implemented by carrying out a large number of simulation scenarios, which led towards the determination of the maximum amount of PV generation in each network case.
1. Introduction
The hosting capacity (HC) concept has been gaining importance with time to ensure the capacity of the system without employing any expensive grid upgrades. However, the value of HC varies considerably depending on a variety of factors including photovoltaic (PV) locations, network loading conditions, numerical values of limiting factors, and PV deployment scenarios. Moreover, HC value is dependent on the references used for its definition, and Reference [1] provides a review of different HC references and their influence on changing HC value. The study concluded the five major HC references used in the literature to be peak load, transformer rating, the share of customers’ PVs, energy consumption, and share of available roof space. The HC can be defined as the ratio of maximum PV production to the peak load of the feeder [2] or transformer’s kVA rating [3], or the ratio of total yearly PV production to the yearly energy consumption [4] and w.r.t roof space [5]. Alternatively, it can be defined with respect to the customers equipped with PVs as the ratio of customers with PVs to the total customers in the area under study [6]. The grid operators are concerned about maintaining the power quality standards with an increasing trend to integrate more PVs in the electrical networks by using novel technologies. The compliance with the performance constraints also known as the HC limiting factors is an important criterion for the accurate determination of HC without risking the quality of supply and the network component’s life. The limiting factors for defining the HC are voltage variations, voltage unbalance, overloading limit of cables and transformers, flicker, and harmonics. Voltage rise is the important limiting factor in low-voltage networks in terms of voltage variations without any significant contribution of under-voltage in limiting the HC. Therefore, the under-voltage limit violation can be excluded from the set of limiting factors. The accurate choice of the limiting factors and their operational threshold significantly influence the HC of the network, and different studies have used a variety of performance indices for HC determination. Overvoltage limit has been widely used in the literature as a performance constraint followed by overloading limits of cables and transformers.
The study conducted in [2] focused on finding the technical constraints limiting the PV HC and concluded that on-load tap changer (OLTC) is more effective in HC improvement in balanced PV deployment as compared to the single-phase connections. A Monte Carlo (MC)-based simulation analysis was carried out in [3], considering PV allocation as a random variable, with the authors discussing the HC dependence on the loading level of the network. According to this study, 0–5% loading enabled only 10% of investigated LV (low voltage) circuits to host 30% PV capacity as compared to the 80% LV systems with midday loading of 25–35% to host similar PVs. However, the authors argued that PV hosting capacity is not merely dependent on the loading levels but also on other factors such as the number of customers, length of the LV network, PV connection scenarios, and load distribution of different types of customers. The idea of HC dependence on varying factors is substantiated by a study performed in [7]. The authors here discussed that the prediction of HC for any network is subjected to many uncertainties: variable solar production, customer installations, PV connections such as single-phase or three-phase, and panel tilt, among many others. Similarly, two different HC values of 43% and 83% w.r.t energy consumption were investigated in [4], considering the very well suited rooftops and all rooftops for PV connection, respectively. Moreover, the potential of the battery energy storage system, active power curtailment, and dynamic thermal loading of the transformer was investigated in this study to increase the PV HC. However, the dynamic loading of the transformer as a potential means to improve HC was found to be effective only in the case of the transformer that is loaded for the short term.
The quantification of rooftop solar PV potential plays a vital role in the HC calculation w.r.t roof space. This quantification involves the estimation of available rooftop area for the installation of solar PV panels [8] as the entire roof area cannot be utilized for this purpose due to varying reasons such as shadows from surrounding buildings and the mechanical barriers such as ventilation equipment, etc. A similar form of research was conducted in [9] that was based on the calculation of usable rooftop area for solar PV installation as part of the Energizing Urban Ecosystems project founded by RYM Oy using realistic solar radiation data in the city of Espoo, Finland. The author utilized three filters: profitability filter, city planning filter, and mechanical barrier filter to eliminate the unsuitable areas for solar PV installations. The HC calculation w.r.t roofspace PVs was carried out in [5], wherein the authors employed a model predictive control strategy for the determination of HC. The authors investigated six reference grids in the remote, rural, and urban regions with HC values of 16%, 13%, and 45% w.r.t roof space, respectively. The effectiveness of power curtailment in conjunction with the storage options and reactive power control is also discussed in this study to increase the PV penetration and thus the network HC. The authors in this study further noticed that HC was limited by voltage violations in the rural and remote networks, whereas the urban grid’s HC was restricted by the thermal violations.
A real UK residential network with single-phase customers was analyzed in [6] to determine the HC value w.r.t customers with PVs, and the potential of OLTC with a setting of +/−8% for HC improvement was investigated. An MC-based approach was employed by the authors in this work to take into consideration the uncertainties in the load and PV generation. Similarly, a static load type feeder was investigated in [10] for the HC determination, considering voltage, power flow, and cable ampacity as the limiting factors, with HC linearly related to the load variations. In this case, there was also reverse power limitation, and the authors noticed this kind of power flow violations at the load value of 8.8 MW, which is the current load of an actual 20 kV distribution feeder in an urban distribution network with the attribute of large loads. Moreover, the HC was also defined in terms of the actual active power of the load in [11], where the authors investigated an Australian distribution feeder in the context of validation of the voltage rise mitigation strategy proposed in the study. The calculation approach for the HC w.r.t active power was similar to the HC w.r.t peak load. However, the authors calculated the HC values at two different times of the day, morning and midday, and found that the midday loading enabled more HC as compared to morning loading. The aggregated loads on the distribution feeder were modelled by considering the characteristic electrical appliances of the residential household, and the PV output power was compared with the actual active power of the loads at the point of common coupling. The study revealed the HC value of the network as 111% with PV output power as 1.73 kW while serving a load of 1.5 kW at 9 a.m. The HC value of this network was increased to a value of 177% at midday, with an increased PV power of 2.93 kW serving the loading level of 1.65 kW at the point of common coupling. Thus, the findings of the study revealed the higher value of HC at midday as compared to morning, which was due to increased load. The accurate HC determination enabled the utilities to make timely decisions to integrate or curtail the future PV penetration to ensure the reliability of electrical network. The idea of changing HC due to different reference definition can be further explored by finding the gap between the HC values of a network by using different references. The core idea of this study was to compare different references used when determining numerical values of PV HC in distribution networks. The main purpose of this study was to show that HC value of the same network can vary depending on different references and how these values are far apart.
The HC determination should be carefully done by either a well-informed guess [7] or a stochastic approach, and thus this study focused on the latter approach. The first part of the HC calculation modified and adopted an MC simulation-based approach developed in [2] that was further extended to find the HC values w.r.t different references. Additionally, the impact of variation in HC references was analyzed under balanced and unbalanced PV connection scenarios. The value of HC w.r.t peak load or energy consumption is largely dependent on the loading of the network, and thus the adopted model was simulated by randomly sampling the load values among three types of loads. The customer loading data were primarily based on the heating modes for three distinct Finnish networks in rural, suburban, and urban regions. Moreover, HC values are also influenced by the loading level; therefore, this aspect of network loading was taken into account in the analysis of PV HC by taking maximum load as 100% and 50% of transformer rating, respectively. An hourly stochastic analysis was utilized for determining the network HC using the hourly data, showing variations in load demand and PV generation for an entire year. Moreover, the proposed hourly MC-based algorithm employed the approach of the worst-case hours that are of high concern for the network planning to ensure network capacity even under the highest PV penetration during these hours. This aspect facilitated the network planners responsible for making crucial decisions regarding network reinforcement investments. An adequately high number of MC simulations was carried out for the accuracy of HC results by simulating a large number of iterations. Finally, a sensitivity analysis was carried out for two loading levels at three different load power factor settings to validate the HC values of the networks.
This paper is organized as follows. Section 2 introduces the system models; the nodes; and customers per feeders of the networks, source data, and the limiting constraints for PV HC. Section 3 begins by introducing the assessment methodology, loading contribution based on heating modes, and the explanation of the proposed MC algorithm. Section 4 defines the different HC w.r.t references and calculates the HC of the networks under varying scenarios with respect to five HC references: peak load, transformer rating, energy consumption, the ratio of customers with PVs, and ratio of roof-space used for PVs. Thus, this work can serve as a foundation to maintain the fact that HC of a network is not a unique value. Section 5 provides a summary of the results.
2. Simulation Characterization and Source Data
The investigated LV networks of this study are formulated in [2], comprising Finnish predominantly rural (PR), suburban (SU), and predominantly urban (PU) regions with different proportions of customers per node, as shown in Table 1. The customers were distributed homogenously among the nodes and PV distribution was tested for both the balanced and unbalanced feed-in cases. The following limiting factors for HC analysis were employed in this study:
- Upper voltage limit as +5% of Un (E1).
- Static loading of cables (E2).
- Transformer static overloading limit (E3).
- Negative sequence voltage unbalance limit as 2% of Un (E4).
- Ampacity limit of neutral-wire (E5).
The nature of loads influences the determination of HC, and the loads in the LV systems are higher in resistive components. Therefore, a higher power factor (0.95) [2] and constant power loads were simulated in this study. The simulation assumptions are discussed further in Section 4.
In addition, the solar input data were based on the research conducted in [12], which provided the simulation of PV generation stochastic variation over an entire calendar year. The load data utilized in the simulation model consisted of three types of customers for an entire year on an hourly resolution. The load consumption profiles were based on the heating modes of the customers, as given in Table 2. The different modes of heating are defined as storage heating, district heating, and dielectric heating. The storage heating is the form of electrical heating with heat storage such as an electric boiler that is usually charged at night-time, thus utilizing the benefit of the reduced night-time tariffs. In contrast, the district heating also represents the houses with some other heating method such as fuels, including but not limited to oil, natural gas, and wood. Moreover, these customers do not utilize the electrical heating system for space heating. The annual load profiles were generated by incorporating the information about the number of customers and their heating methods, and finally the peak load of the feeder was calculated for further analysis. However, the peak load was then scaled according to the feeding transformer capacity using a scaling factor. The scaling factor employed here is defined as the ratio of transformer rating and the feeder load [13]. The scaling factor and different network loading will be further discussed in Section 4. Similarly, the PV generation data were collected for the complete year in the form of theoretical maximum PV generation without considering the weather conditions that affect irradiance profiles. The unbalance condition of naturally unbalanced systems can be increased further by the connection of single-phase PV installations. The lognormal distribution function of load unbalance data employed in this study was based on a single household in Helsinki, Finland, as used also in a study conducted by [14] that was further used for the determination of voltage unbalance magnitude and the angle.
3. Assessment Methodology for PV HC Determination
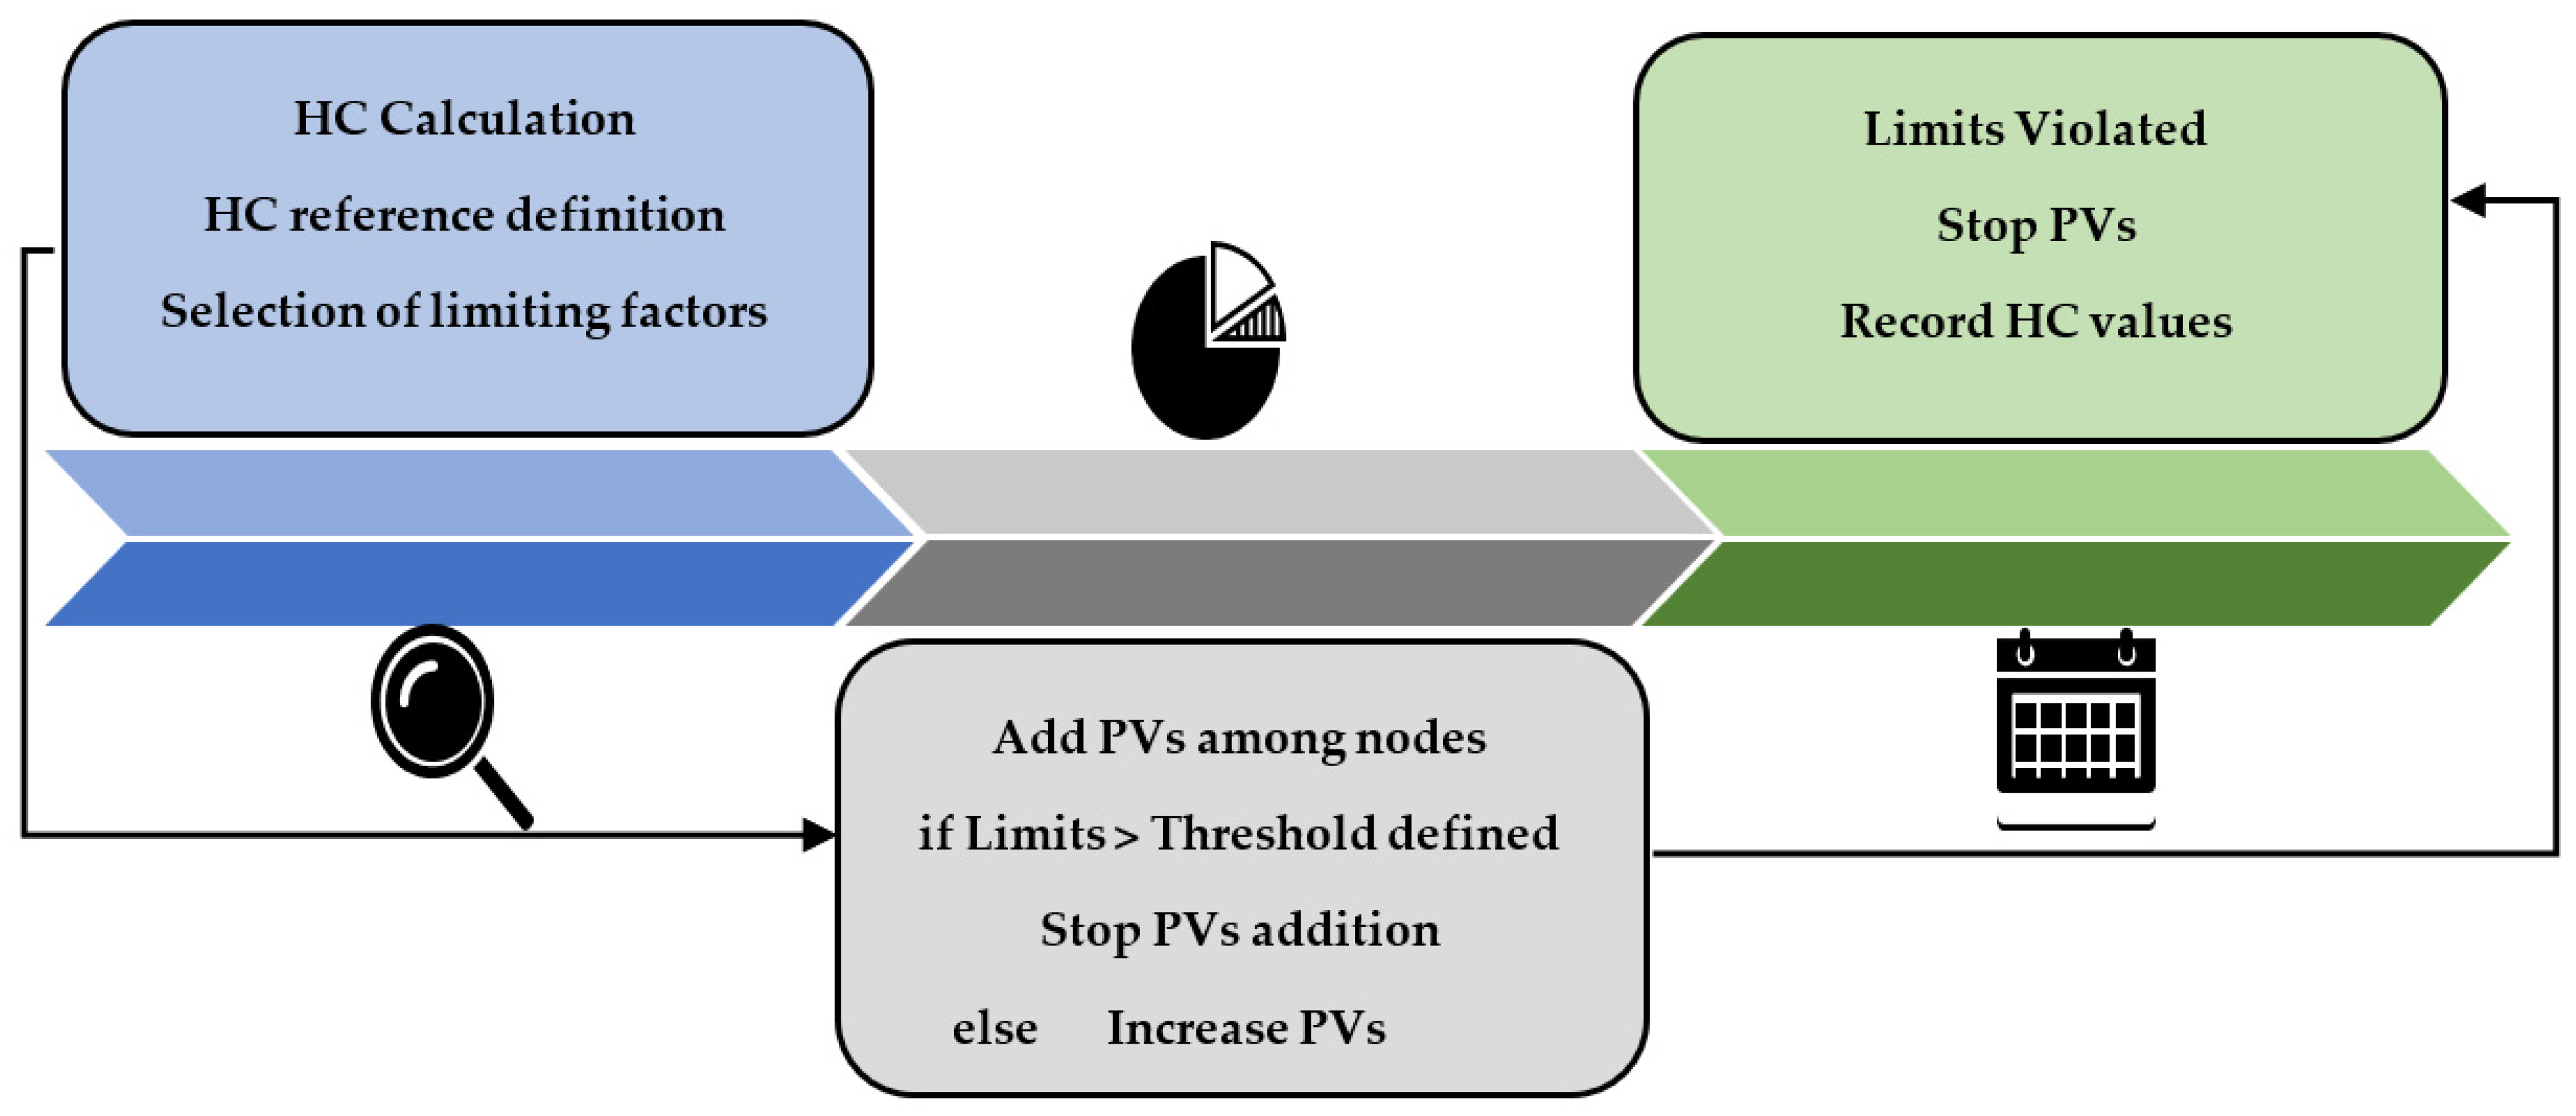
A Monte Carlo-based algorithm was proposed for the determination of HC, considering its dependence on various operational scenarios. The load types depending on heating modes were randomly selected by running the MC simulations 1000 times [14] to ensure the accuracy of HC results. The changing loading profiles of each region were sampled randomly according to the percentages of three types of loads: storage heating, district heating, and direct electric heating, as given in Table 2. This load profile randomization was primarily performed to take into account the stochastic nature of the loads. The MC simulation model was based on the worst-case hours where the maximum PV generation coincided with the minimum network load consumption. The worst-case hours were selected out of a total of 8760 h for the load and PV values to reduce computational efforts based on the convex hull approach employed in [14]. The worst-case hours approach is considered a conservative approach. The random variables involved in this study were mainly the load profiles and PV deployment scenarios.
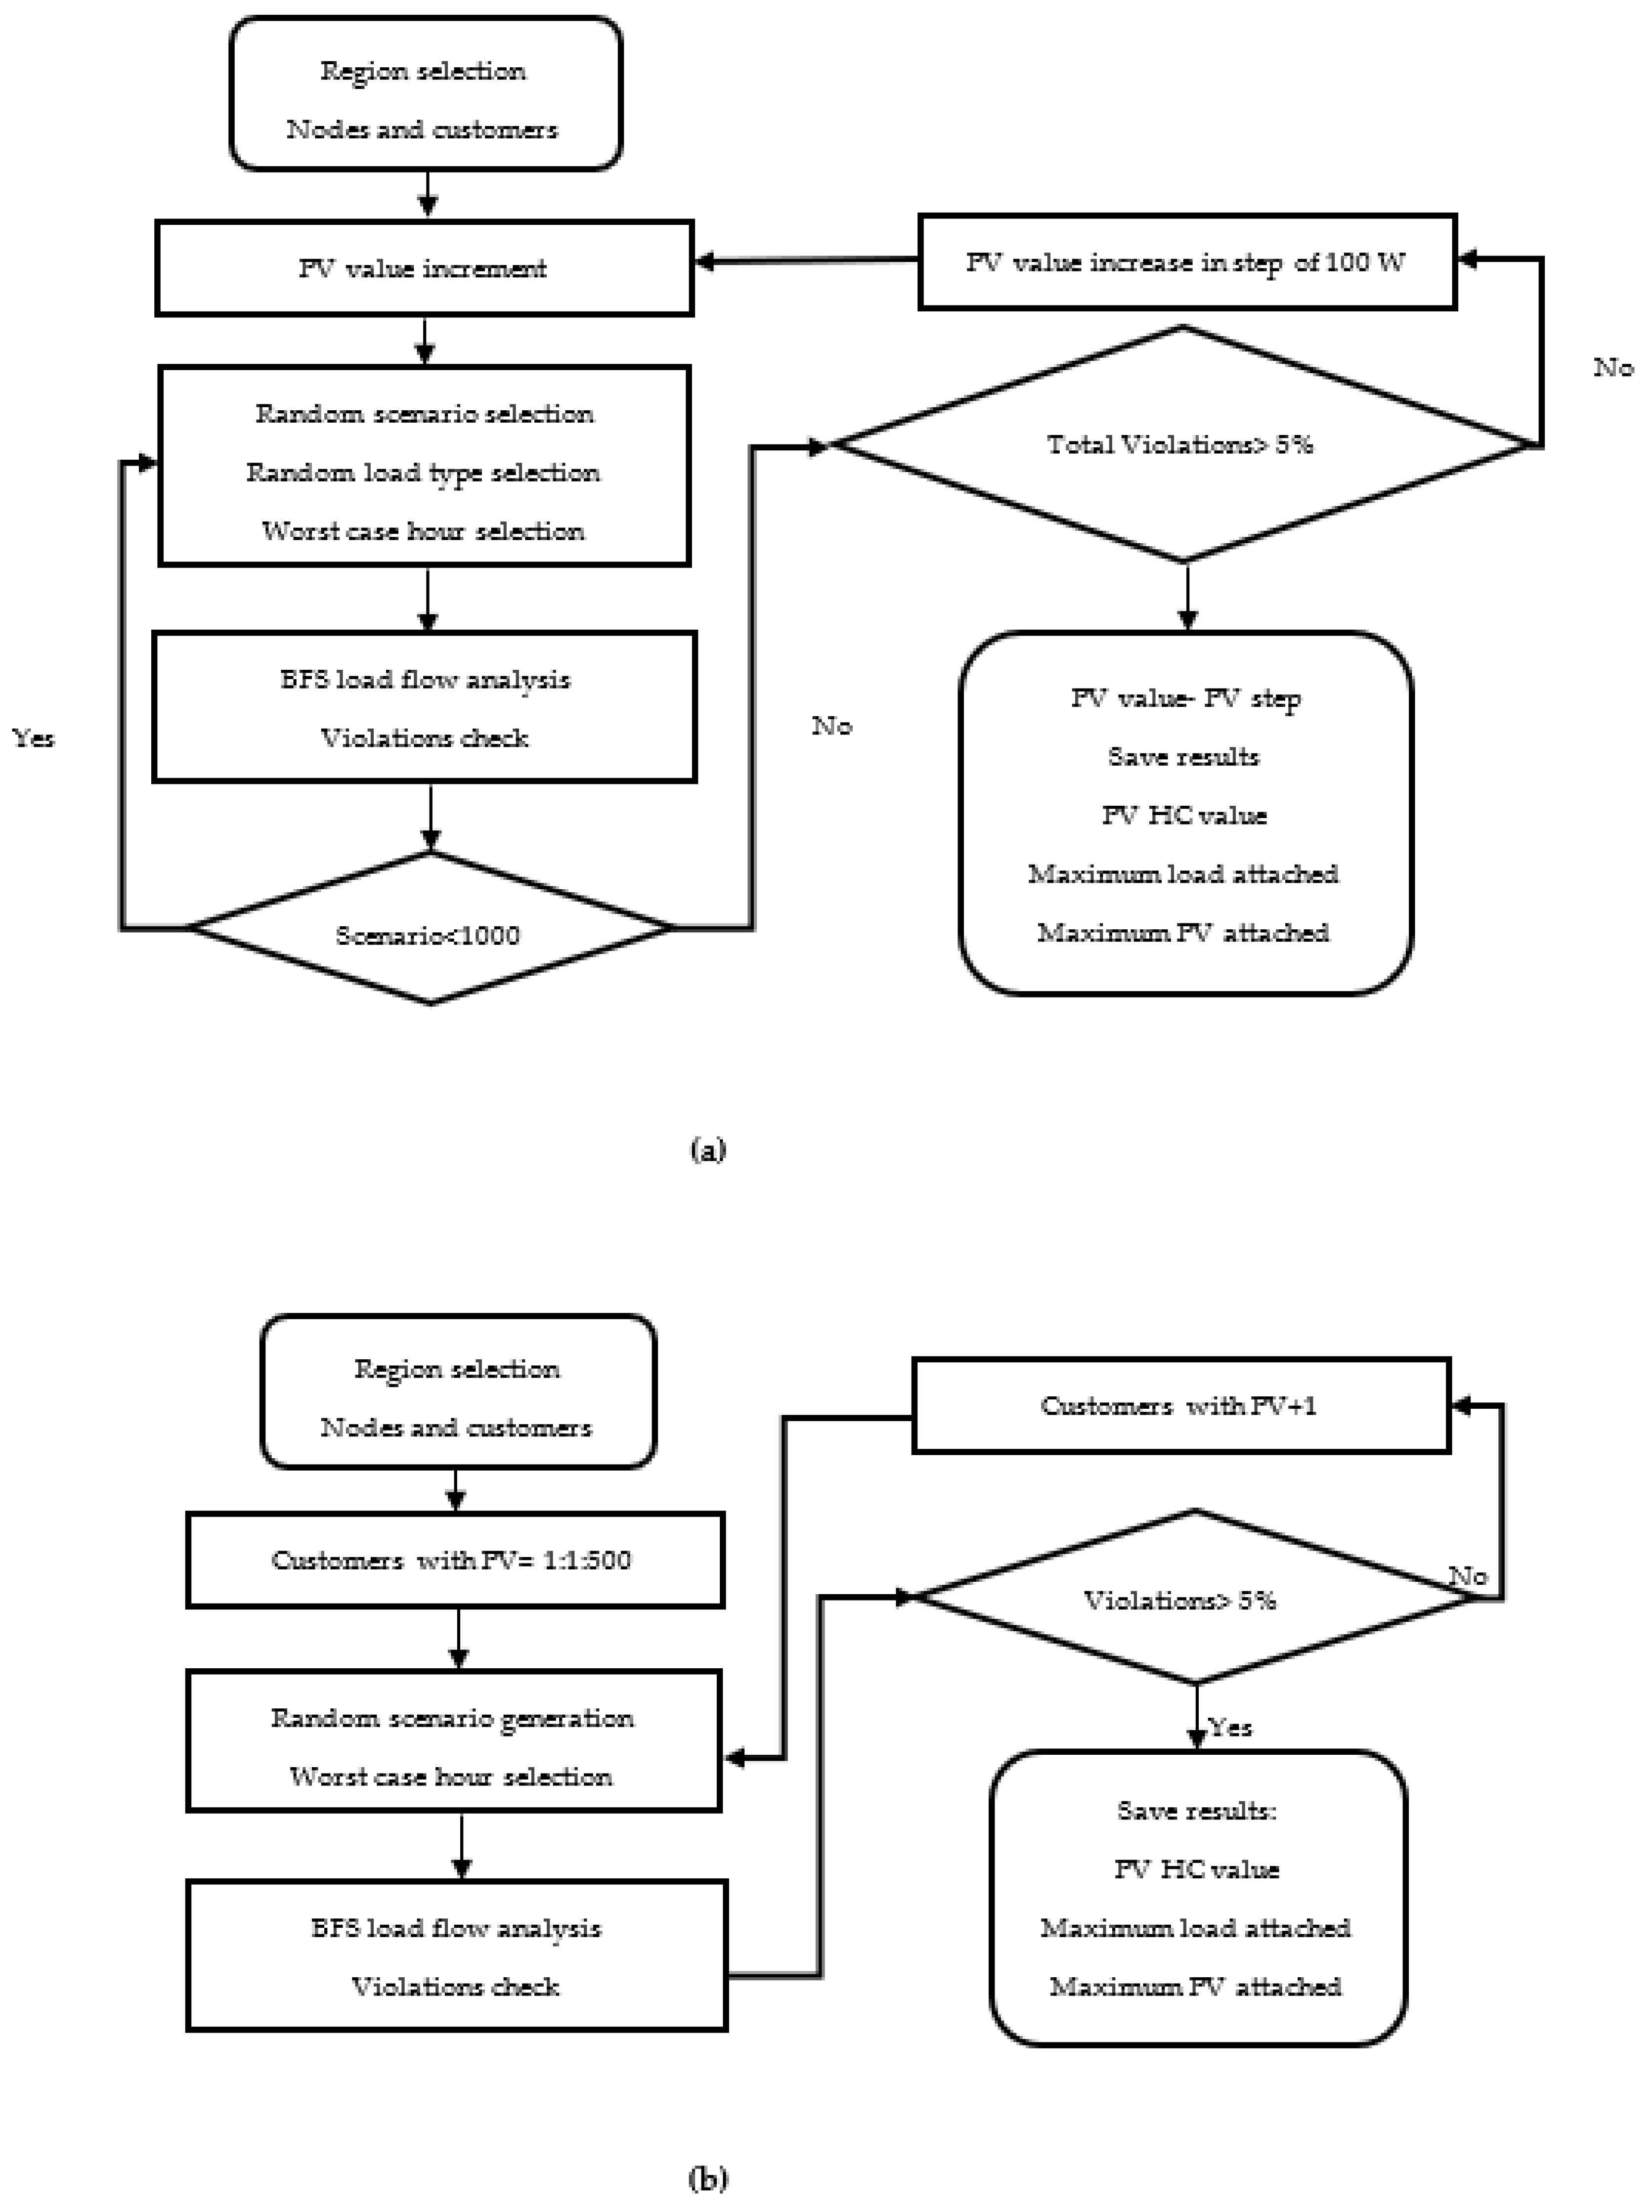
The general methodology used for hosting capacity determination is presented in Figure 1, the details of the proposed MC algorithm developed in MATLAB platform are shown in Figure 2a, and different steps are described below.
- The model commences by defining the network parameters such as the number of nodes, impedance of lines and transformers, and the base PV defined as 1 kWp for each region.
- This is followed by the main MC algorithm that increments the PV power of each PV module installed in the network. It starts with the first scenario by starting the PV generation at 1 kWp incremented in steps of 100 W until the maximum PV that is taken as equal to the rated transformer power of the region under consideration.
- The loading profiles depending on the region selected in step 1 are randomly sampled at this stage. This algorithm simulates for 1000 different loading profiles for the accuracy of HC results. Similarly, this stage involves the random allocation of single and three-phase PVs on the nodes of the network. This step includes the selection of worst-case hours from the total 8760 h and finding the worst-case PV and loading scenario.
- The power flow analysis based on backward and forward sweep (BFS) load flow analysis is simulated in a time-series framework as the loading profiles are changing with time. This is followed by checking the possible violations of performance constraints and the results are saved after checking the violations.
- The scenario count is checked at this step and the model simulates again from step 3 if the scenario count is not reached at 1000 iterations. Alternatively, the constraints violation is checked and the PV size is incremented by a step of 100 W if violations are within 5% tolerance level of the total grid violations [2]. The model works such that the PV increment is discontinued when the performance constraint exceeds the predefined limits for more than 5% tolerance level. The idea behind setting the grid violations to be under 5% corresponds to the power quality requirements of supply voltage variations and supply voltage unbalance to be within 95% confidence limit as per the Standard EN 50160.
This MC algorithm is a modified version of the method presented in [15] to calculate the HC w.r.t customers’ PVs by incrementing the customers equipped with PVs until the grid violations are detected, as shown in Figure 2b. Steps 2–5 of the main algorithm in Figure 2a are modified such that the customers with the PVs are incremented in steps of 1 until the grid observes 5% of violations [2]. However, the random selection of load types and worst-case hour selection follows the same procedure as explained in step 3 by utilizing the same function in the MATLAB script. The load types and hence load values for one year were randomly sampled and the worst-case hours were estimated for a total of 1000 iterations to ensure the sufficient accuracy of HC results.
4. HC Analysis w.r.t Different References
PV HC can be defined in multiple ways, employing various references, as shown in Table 3. The HC of three regions—rural, suburban, and urban—were calculated in this section according to the references defined below. The simulations were performed for the three regions separately for a balanced and unbalanced PV feed-in scenario by first taking the maximum load as 100% of the transformer rating and then 50 percent of the transformer rating.
The HC research conducted in this part of the article is based on the following assumptions.
- HC calculation w.r.t customers’ PVs considers the increment of customers equipped with PVs in steps of 1 kWp for each penetration level as in the study performed in [15].
- HC calculation w.r.t other references assume the even distribution of PVs along the length of the feeder with PVs at each bus. Moreover, the base PV for the rural, suburban, and urban regions is taken as 1 kW [2].
- The HC w.r.t energy consumption is calculated assuming all the customers having PV installation as calculated in [4].
- The proposed model takes into account only the theoretical maximum PV generation without considering the weather conditions impacting the irradiance level.
- The HC is calculated for the load power factor as 0.95 [2].
- The PV power factor is considered as unity.
The HC w.r.t roof-space was also defined as the roof area of the customers connected with the feeder that potentially enables the installation of PV panels. The determination of the usable rooftop area for PV installation is an extensive task that requires statistical data of the actual buildings by first finding the total roof area of the region to be studied and then finding the usable rooftop area for PV installation. Therefore, HC w.r.t roof space was calculated in this work by first estimating the practical roof space employed for potential PV installation. A PV panel of the power range between 260 and 285 Wp was utilized in this study with a size of 1.6 m2 [16]. Hence, a PV array consisting of four PV panels of the power range 260 W was used for generating 1 kWp PV output covering an area of 6.4 m2. The analysis then further proceeds towards finding the rooftop area to install the PV panels that satisfy the maximum PV generation during the worst-case hours. The estimation of the total available usable roof space area for PV installation is based on the research conducted in [9]. The HC w.r.t roof space was finally calculated as the ratio between the roof space area utilized for maximum PV generation during worst-case hours and the total available roof area for PV installation after eliminating the unsuitable areas.
4.1. Case Studies and Results
This section presents the HC analysis of the three geographically distinct Finnish regions according to different HC references for two types of PV deployment scenarios. The following scenarios are considered for HC analysis.
- HC analysis without scaling maximum load.
- HC analysis by scaling maximum load as 100% and 50% of transformer rating.
4.1.1. HC Analysis without Scaling Maximum Load
In this part of study, the LV networks were first analyzed depending on the loading level in comparison to the transformer rating, as given in Table 4. It was observed that the network load was only about 35–55% of the transformer rating, such that the transformers were not fully loaded initially and thus leaving sufficient headroom for PV addition without risking the transformers’ life. Moreover, this part of the work utilized the original peak load value without scaling the peak load w.r.t transformer rating that would be discussed further in Section 4.1.2. The LV system loads were predominantly resistive and they were modeled by considering a high-power factor (0.95). Moreover, the constant power loads are depicted in Equation (1) according to a study conducted in [2] as active and reactive power profiles. The right-hand side of Equation (1) represents the real and reactive powers and the left side represents the apparent power of the constant power loads.
[SLabc] = [PPQabc] + i[QPQabc]
The load modeling for the calculation of PV HC was highly dependent on the type of heating mode used for each region, as described in Table 2. The load values depending on the heating mode of each region were first randomly sampled by incorporating a random probability distribution function “randp” in MATLAB to create a vector of the size of “number of network nodes X 1”. This column vector of the size of network nodes was then utilized further to calculate the load values for the complete year by using the load distribution data among three types of customers utilizing different heating modes. Finally, a matrix of the size of “number of network nodes X 8760” was formed, showing the load values at each node for one complete year (8760 h). Afterwards, the peak feeder load was calculated by aggregating the load values among all the nodes connected to a feeder for 8760 h (a matrix of 1 × 8760), and then the peak load was selected as the maximum value from this row vector of the size 8760. Thus, the loading data were based on realistic load values by using real consumption profiles of the customers.
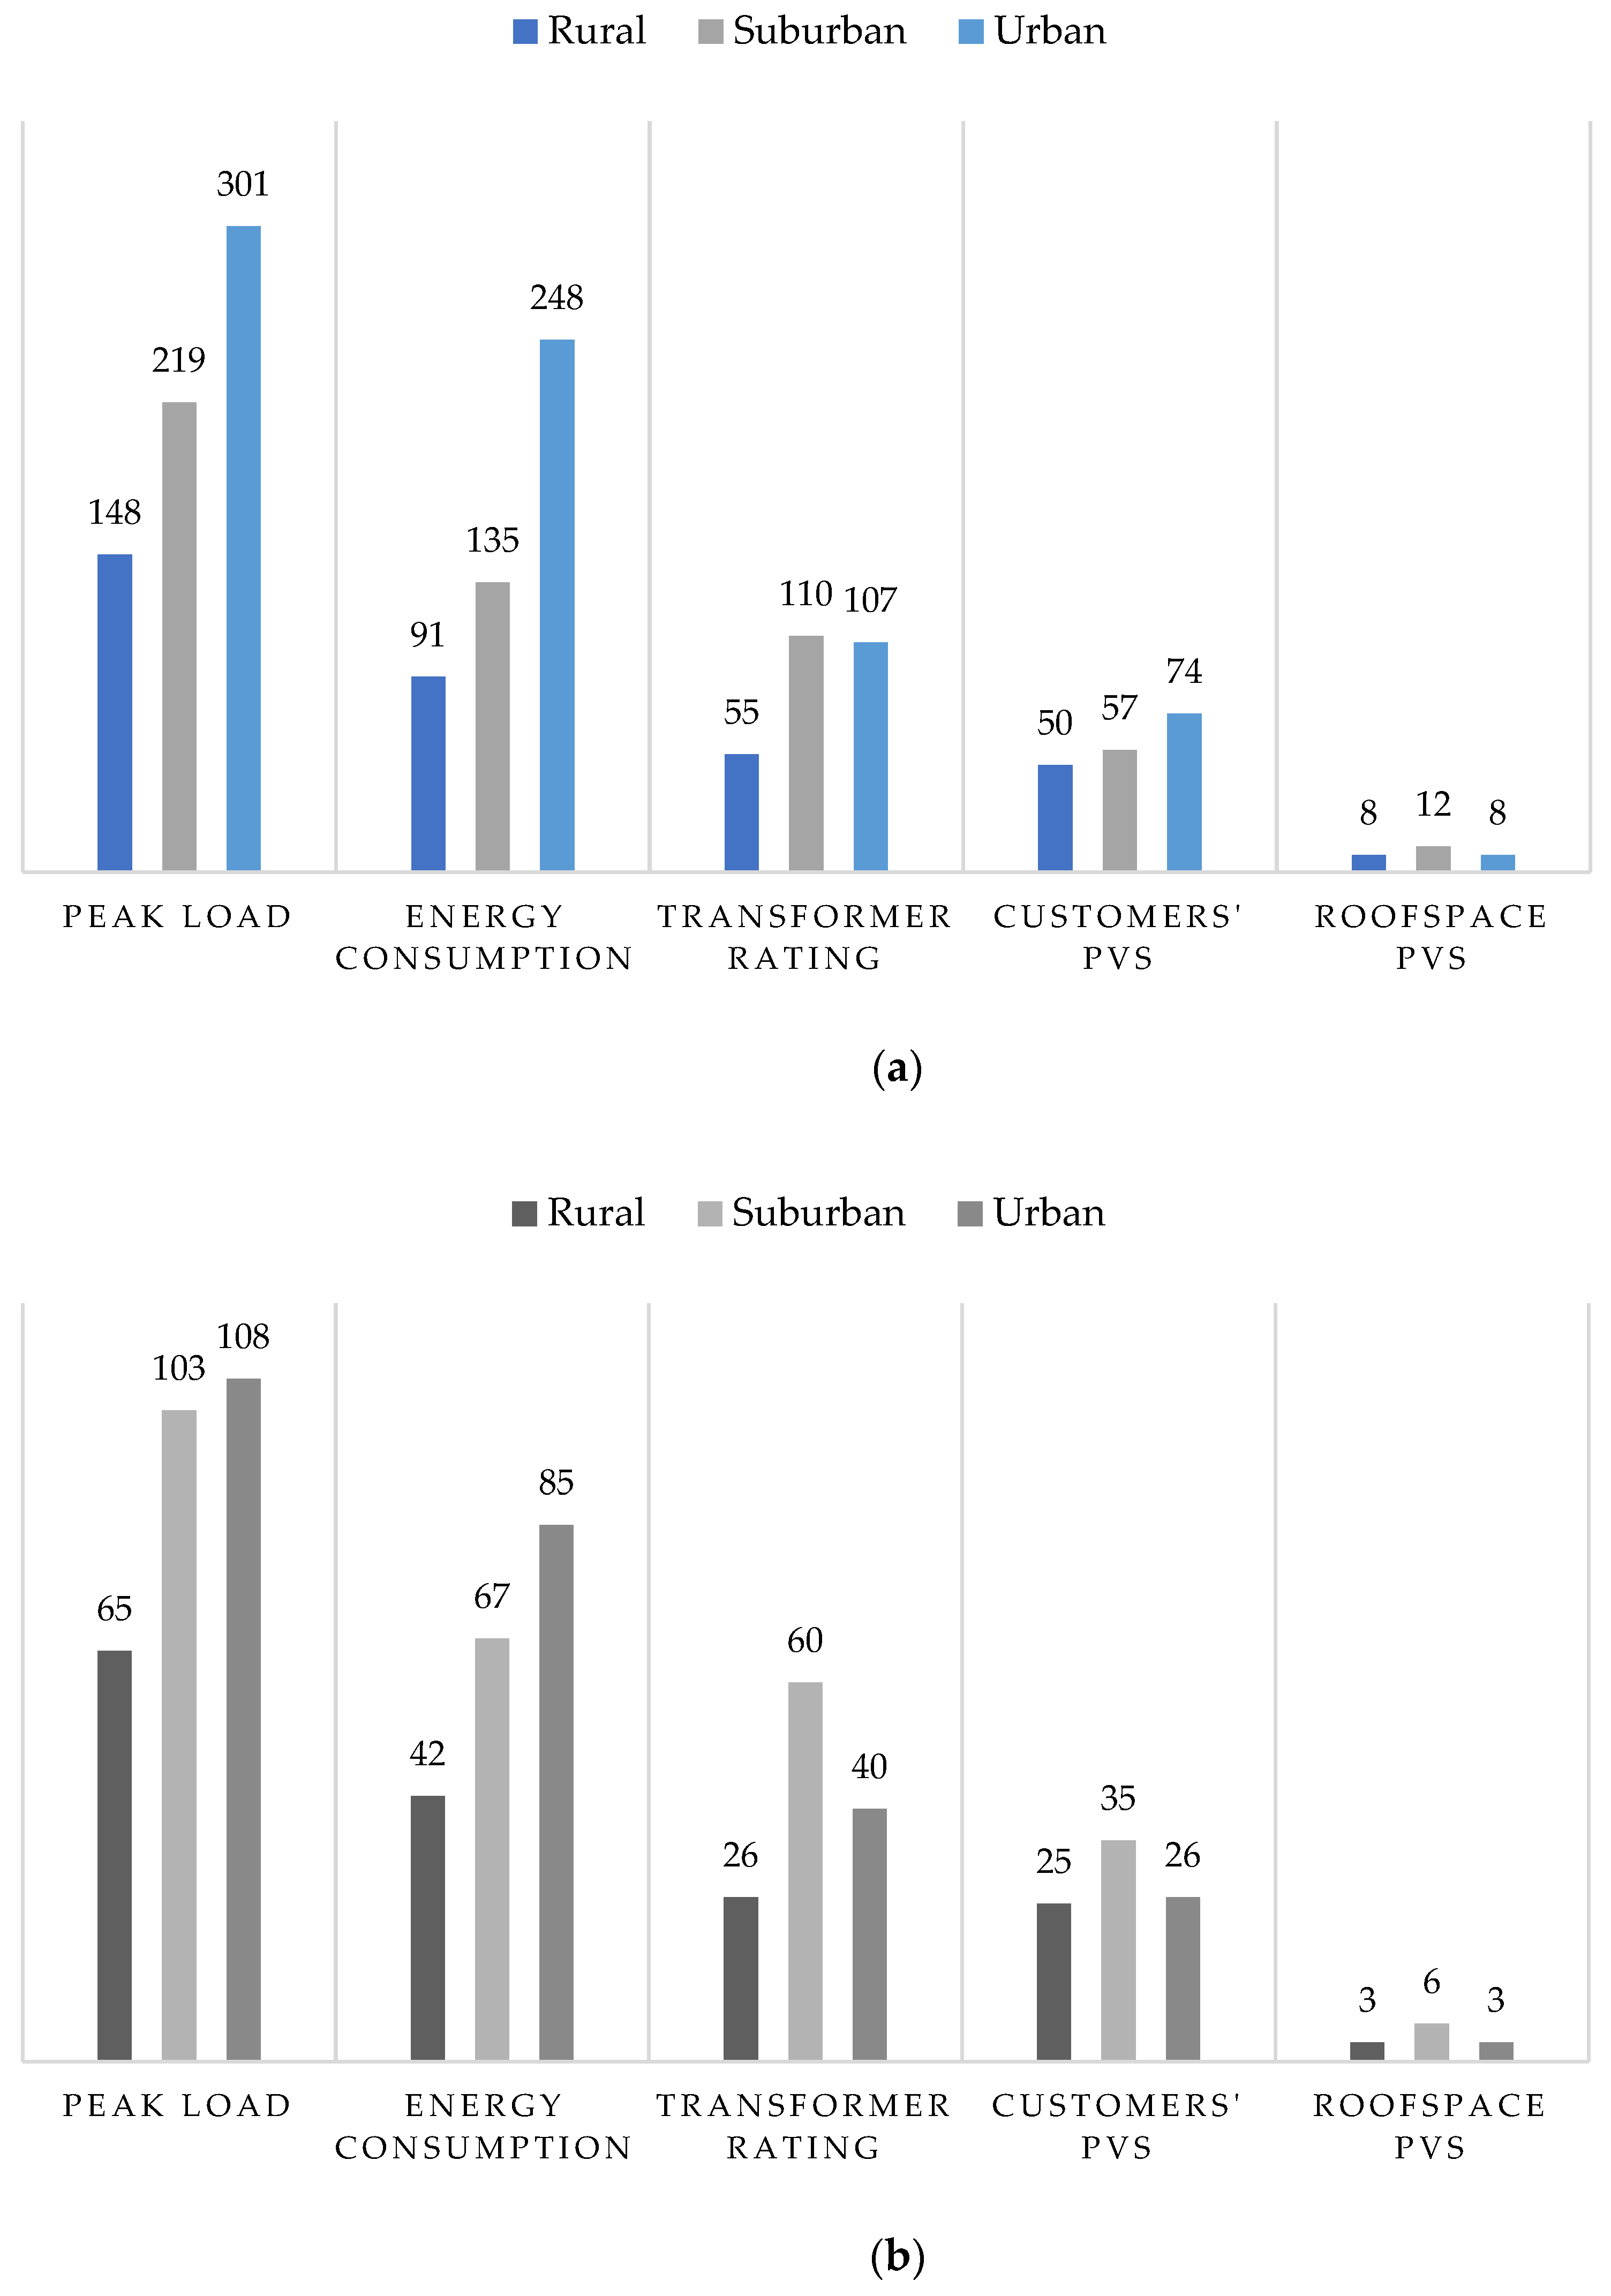
The load values utilized in this work were basically of two types: the minimum load value corresponding to the worst-case hours and the peak load value calculated by finding the maximum feeder load value from 8760 h. Moreover, the HC determination w.r.t peak load and energy consumption involved the peak feeder load instead of the worst-case hour load value. The peak load and the mean load value among the worst-case hours are given in Table 4. An MC-based simulation analysis was performed in this section for investigation of the HC w.r.t different references for two PV deployment scenarios: balanced 3-phase PV and unbalanced 1-phase PV, as presented in Table 5, and also in Figure 3. The HC results show that the HC of the rural region was the lowest among the three regions and that the balanced PV scenario permitted higher values of HC as compared to an unbalanced PV connection.
The investigation of the limiting constraints of the HC shows that the overvoltage limit restricted the PV HC in the balanced rural networks and the transformer loading limited the PV penetration in the suburban and urban regions. Moreover, the negative sequence unbalance remained the limiting constraint in the rural and suburban unbalanced PV connection scenarios and neutral wire ampacity limited the PV in urban unbalanced PV deployment. The sequence of the limiting factors such as E5, E4, and E2 in the unbalanced urban network represented the frequency of occurrences of the violation of limiting factors. The results revealed that the cable ampacity manifested itself as a limiting factor for HC only in the unbalanced urban networks and its violation occurrences were outnumbered by the other two limiting factors of neutral wire ampacity and voltage unbalance. Moreover, a higher value of PV HC w.r.t peak load of the urban region in Table 5 can be attributed to the initial peak load of urban region to be only about 35.9% of the transformer rating. Thus, this lower value of peak load in the denominator of HC definition as given in Equation (2) of Section 4.1.2 resulted in a higher value of HC.
This study adopted a more conservative voltage rise limit of +5% of the nominal voltage, resulting in the lower value of HC with respect to transformer rating of 55% for rural region under balanced PV scenario as compared to the HC (105%) in [14]. This is attributed to the different selection of performance constraints, and therefore it led towards the fact of how HC values of similar networks can be altered by choosing different limits of the performance constraints. However, this change in voltage rise constraint impacted merely the HC of the rural region where the HC was primarily limited by over-voltage as compared to the transformer overloading limiting the HC of suburban and urban regions.
4.1.2. HC Analysis by Scaling Maximum Load as 100% and 50% of Transformer Rating
The maximum PV HC was strongly influenced by network loading. This part of the work was focused on the determination of the impacts of variation of maximum loading of the network on the PV HC of the network. The HC results for two loading levels are given in Table 6. This analysis shows how different limiting factors of the HC manifested themselves under varying loading conditions, thus changing the HC of the network.
The calculation of HC w.r.t two loadings levels was initiated by generating the hourly annual load profiles for a year, as described in Section 3. The loading profiles were then scaled by using a scaling factor for 100% and 50% of the transformer rating. The annual hourly loading profiles at each node in the network were used for estimating the maximum feeder load of the network that was compared with the 100% and 50% of the transformer rating. Thus, the comparison of the peak load with the transformer rating revealed the lower value of maximum load, and thus the maximum load of the network was scaled up by using a scaling factor. The selection of the scaling factor played a central role in the accurate determination of the HC of the network and it is defined here as the ratio of the transformer apparent power to the peak feeder load. The apparent power of the transformers was distinct for each region, and therefore the scaling factor varied for each of the investigated regions. Similarly, the scaling factor for 100% and 50% of the transformer rating was different, leading to the different values of PV HC. The research results depicted that HC values w.r.t peak load and energy consumption were highly skewed by almost doubling in magnitude with maximum load as 50% of the transformer rating as compared to 100% of the transformer rating.
The HC values w.r.t peak load and the energy consumption were greatly dependent on the peak load of the network, as depicted in Equations (2) and (3), respectively. Thus, scaling the peak load w.r.t transformer rating generally impacted the HC w.r.t these two references without significantly impacting the other reference definitions.
The denominator in Equation (3) is calculated by aggregating the hourly loads of the network for one complete year and thus scaling the maximum load of the network against the transformer rating changes this value for two loading levels. The HC analysis of this work shows that HC of the same network calculated considering different references varied considerably with the HC w.r.t peak load, giving the highest numerical value among all the HC references.
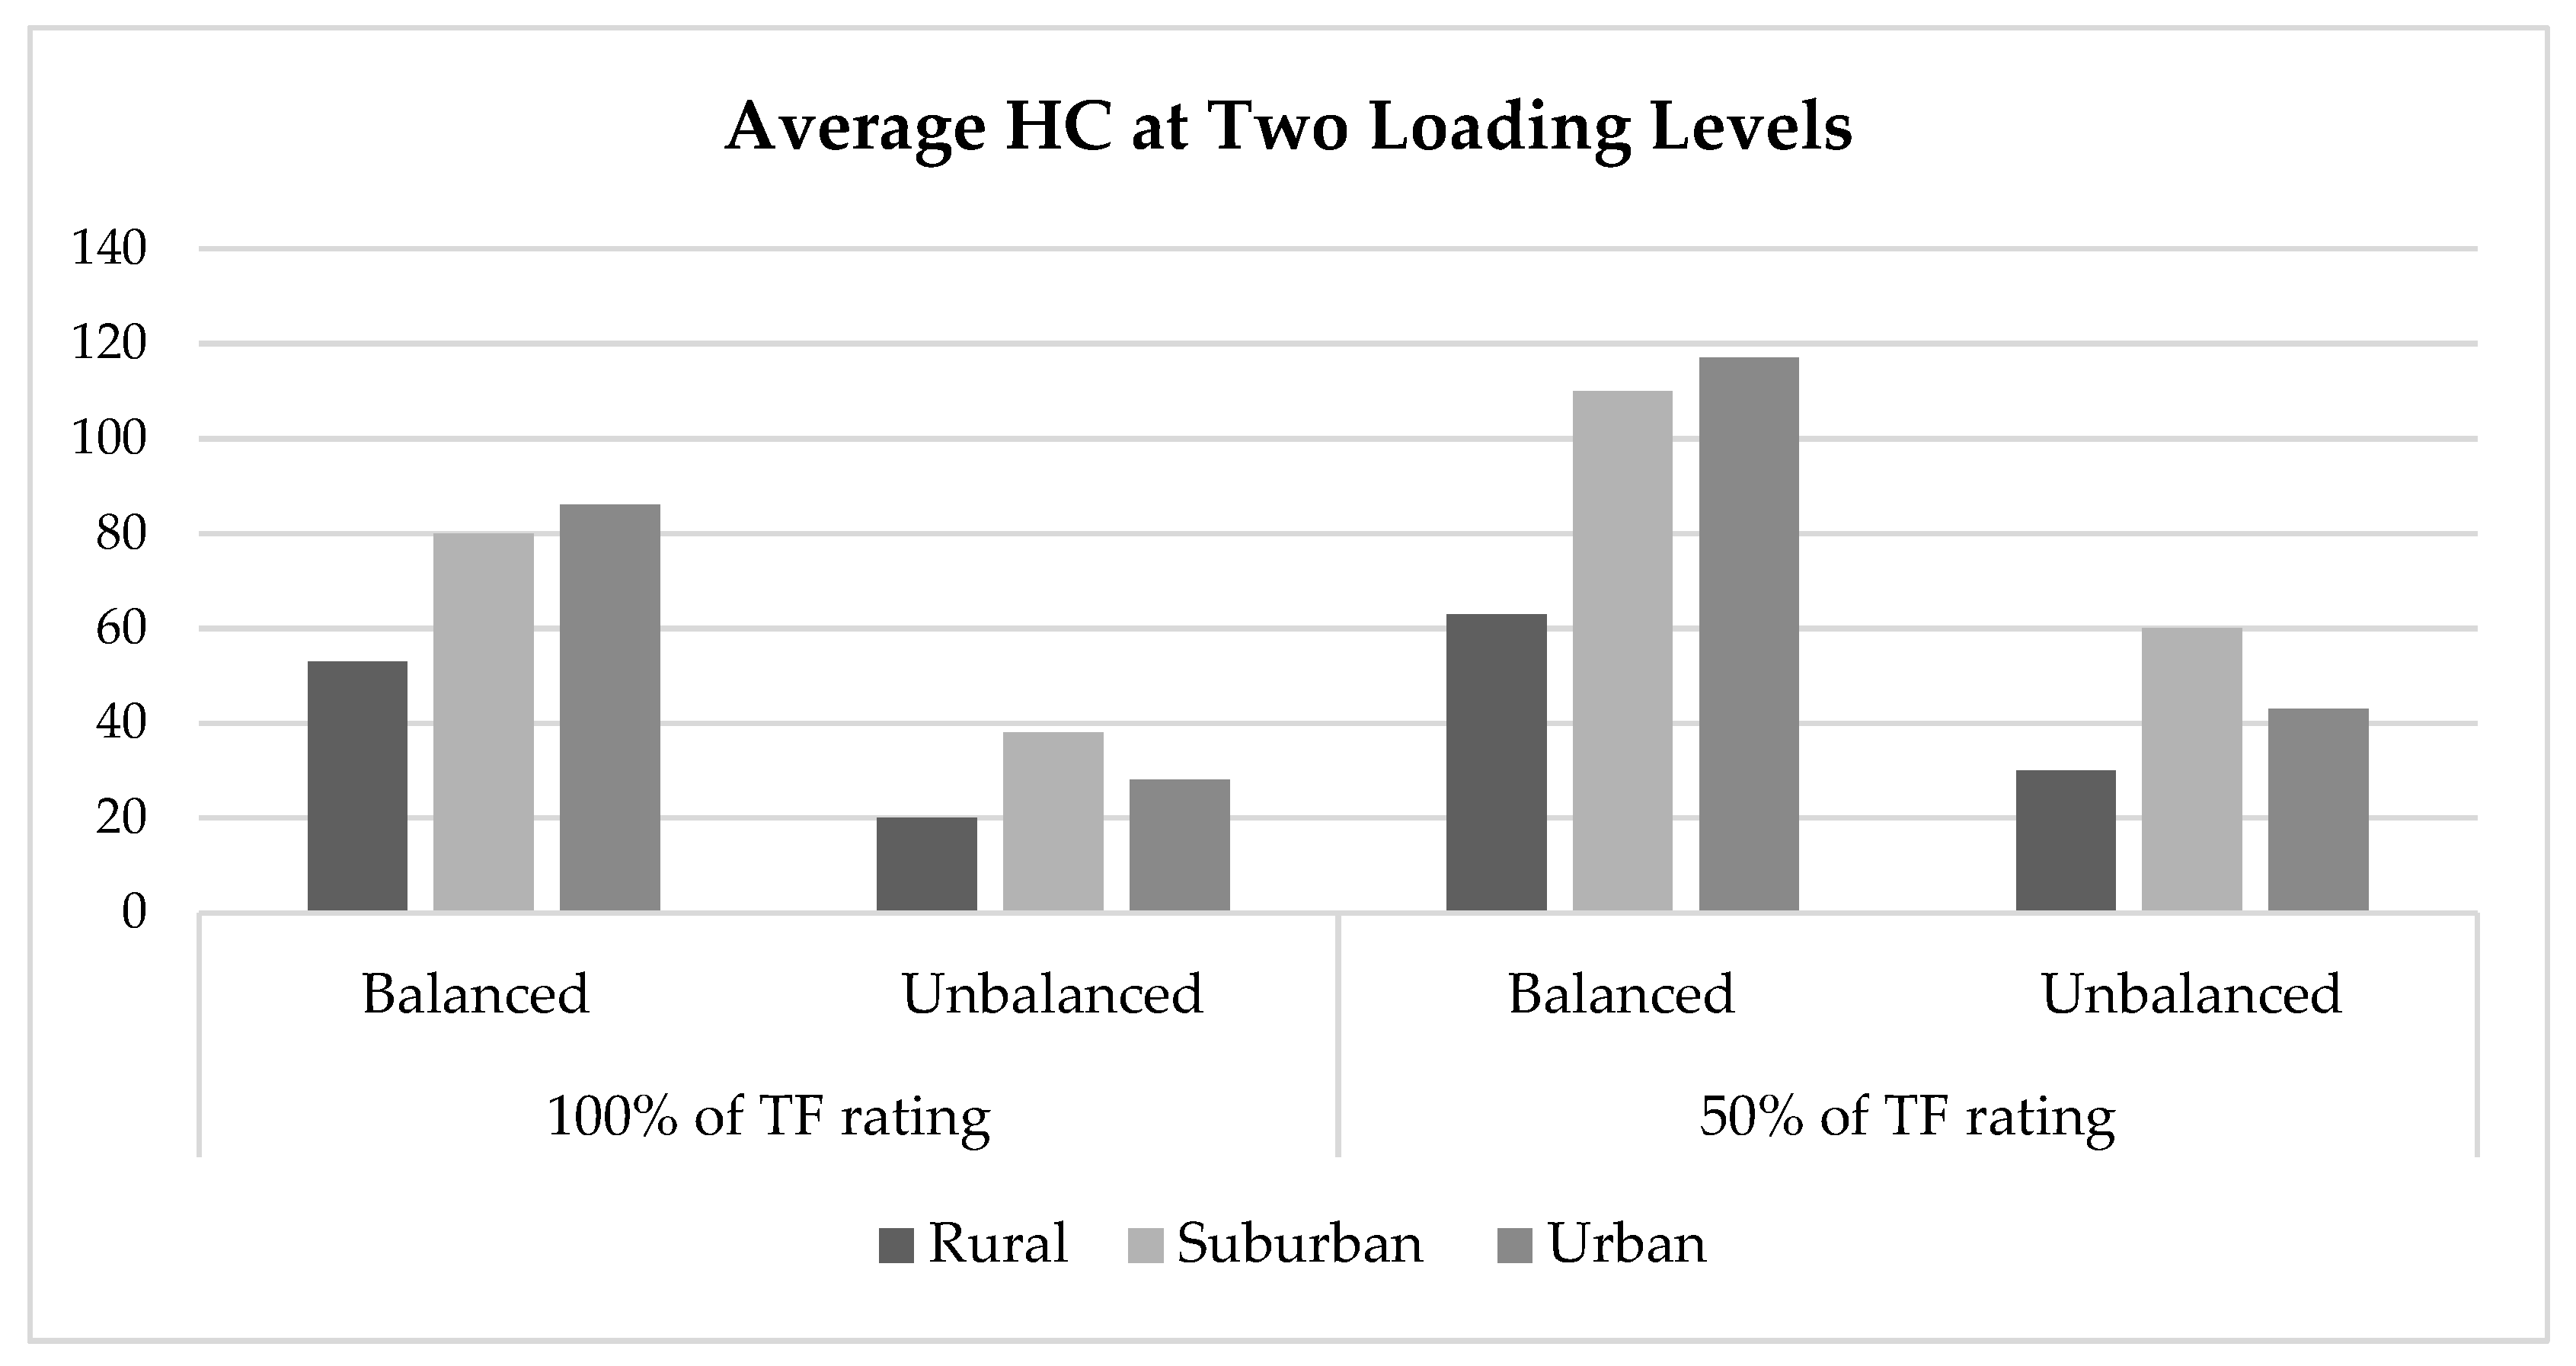
HC of the balanced PV deployment case was higher than the unbalanced PV case for all the regions. In the case of a balanced PV connection, the HC was primarily limited by the voltage violations in the rural region, and the transformer overloading (E3) became the major limiting factor in the case of suburban and urban regions, as shown in Table 5. The unbalanced PV scenario presented negative sequence voltage unbalance (E4) as the main limiting factor for integrating a large amount of PV in the LV system for rural and suburban regions. However, the neutral wire ampacity (E5) remained the dominating limiting factor with the calculation of the HC of urban areas for an unbalanced PV deployment scenario. Moreover, the overvoltage limit did not prove to be as restricting in the case of unbalanced PV scenarios in rural regions where the most dominant limiting factor was observed as negative sequence voltage unbalance (E4). Additionally, transformer overloading (E3) appeared as the major limiting constraint for the PV penetration in the case of a balanced PV scenario for 100% and 50% loading levels in the urban region. Figure 4 shows the average HC at two loading levels by averaging all of the percentage estimates in Table 6. It shows that the HC at 50% loading level of the transformer rating outscored the HC value at 100% loading level of the transformer rating.
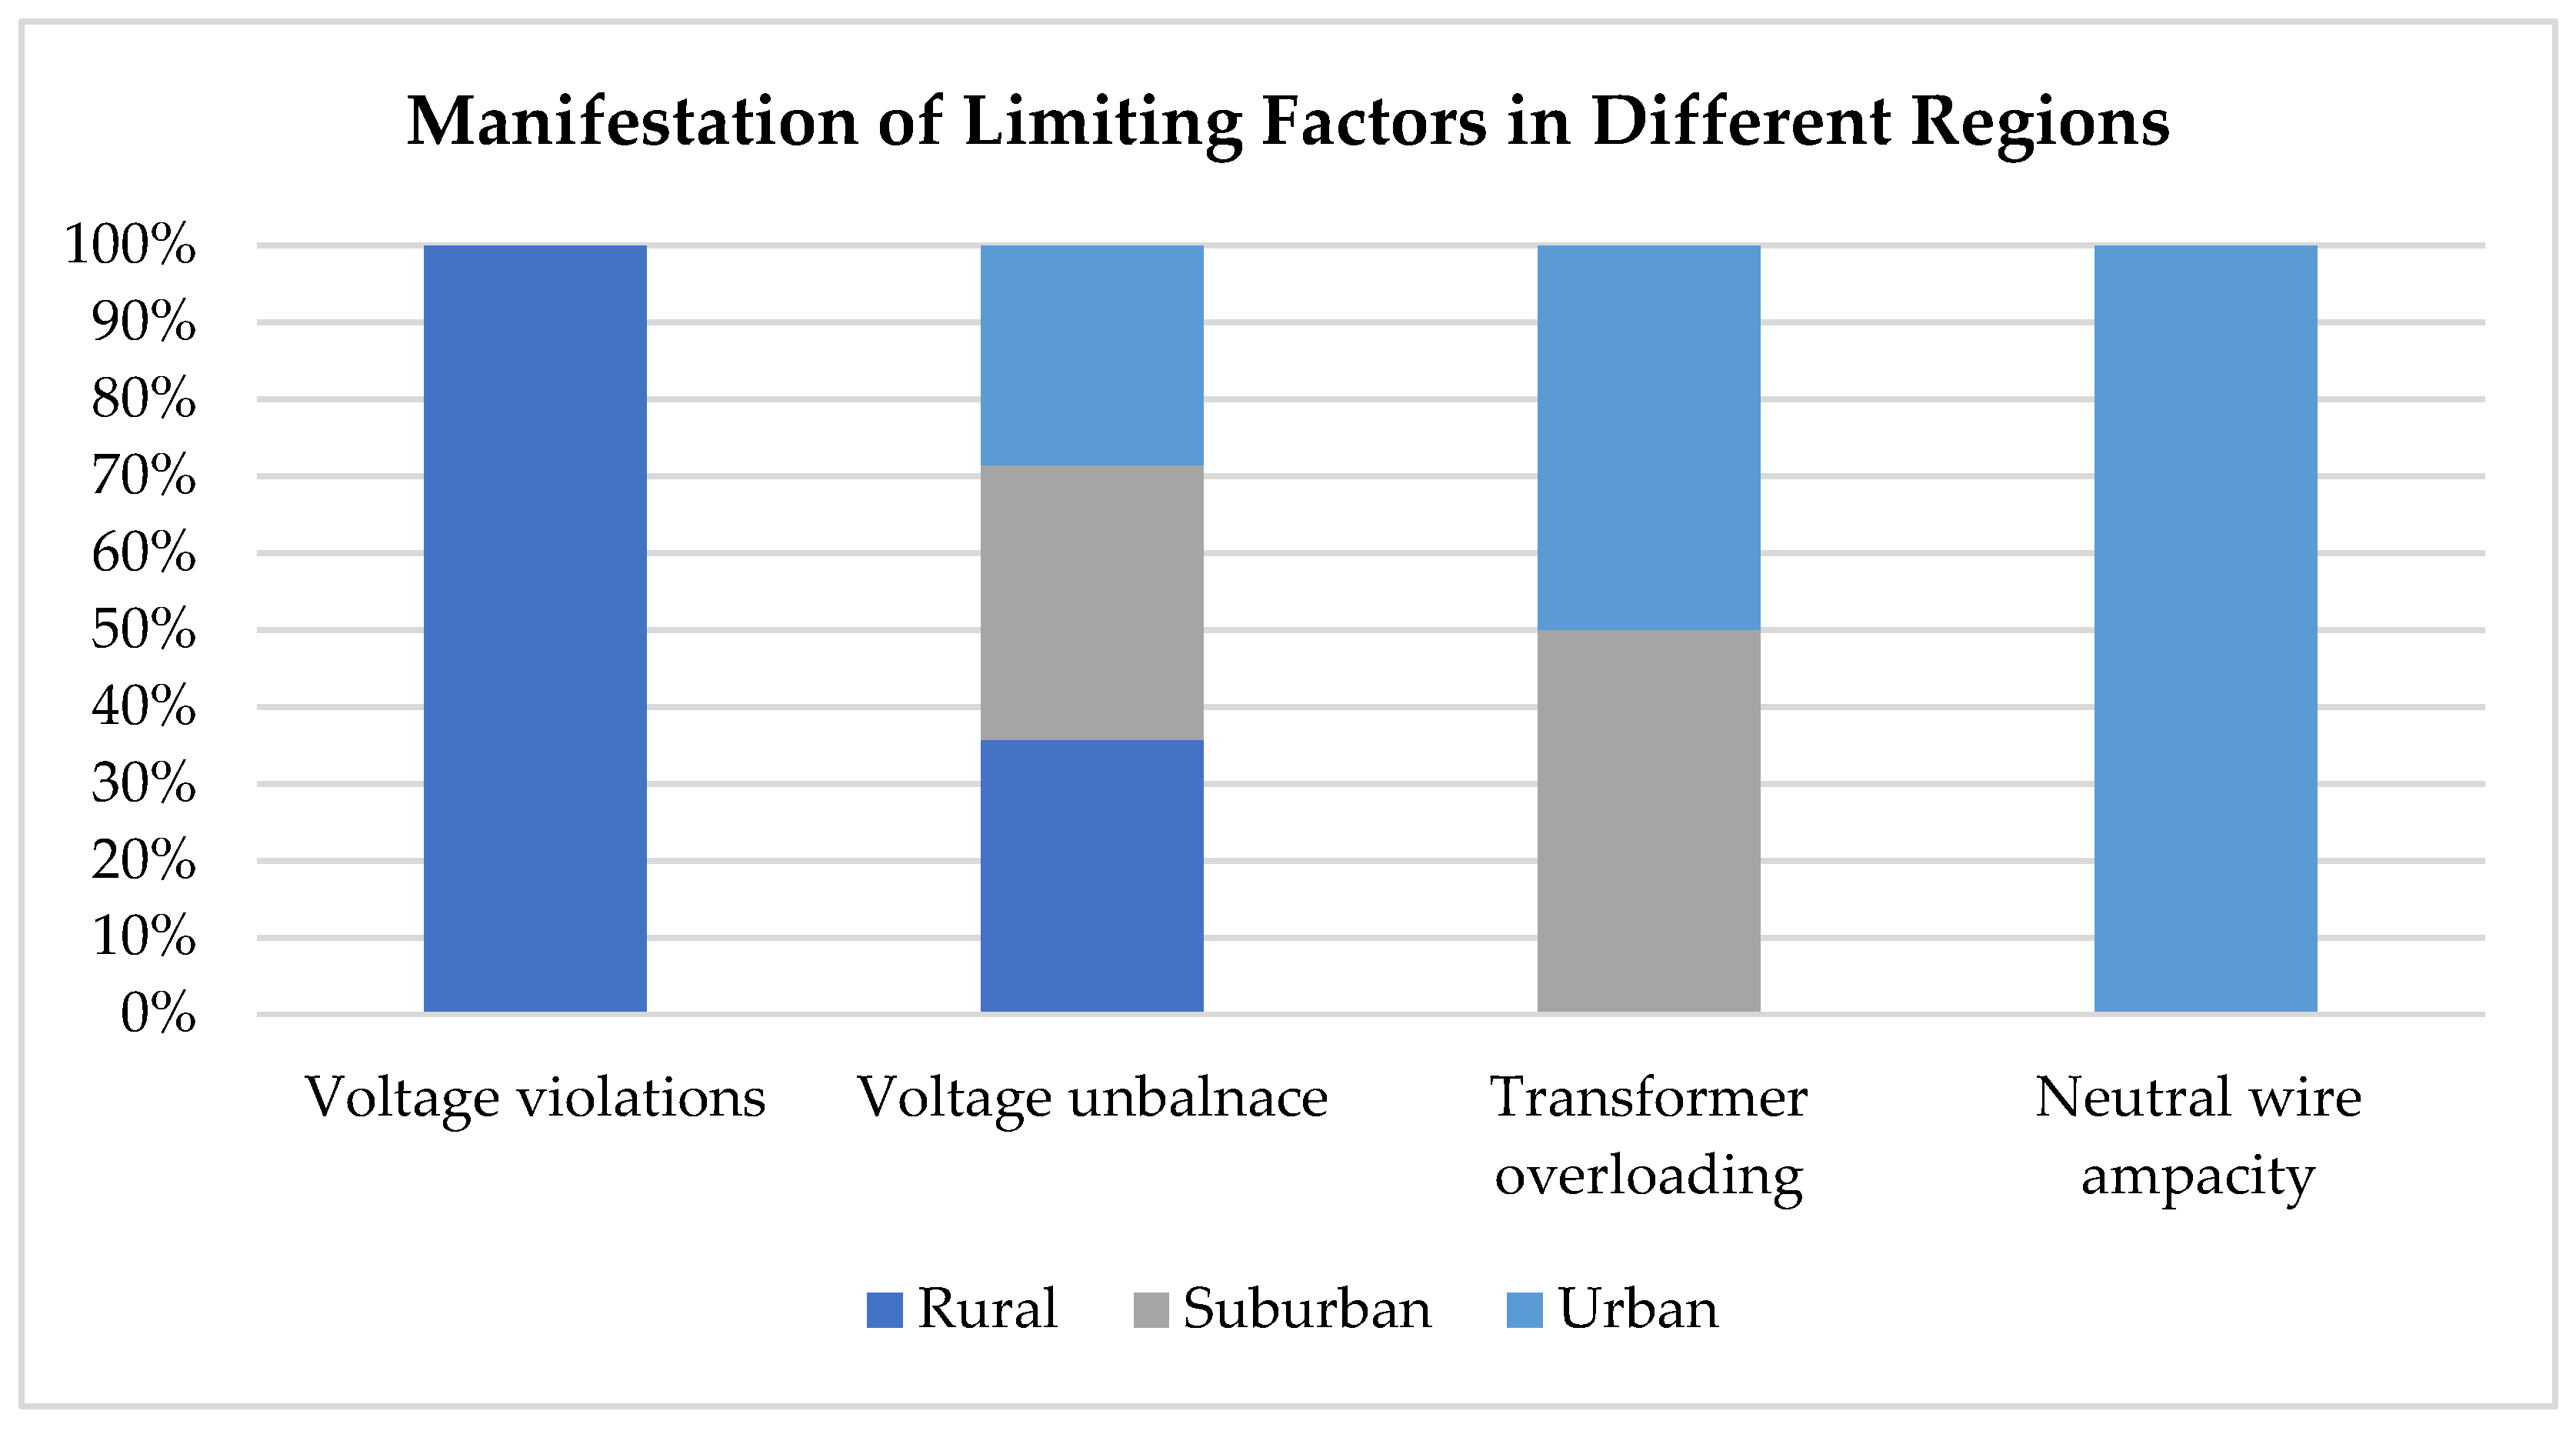
Overall, the voltage violation was observed as a key limiting factor for increased PV integration in the rural areas, and the transformer overloading noticeably limited the PV integration in the suburban and urban regions, as shown in Figure 5. The negative sequence voltage unbalance appeared as the limiting factor in all three regions, while the neutral wire ampacity limited HC of the urban region.
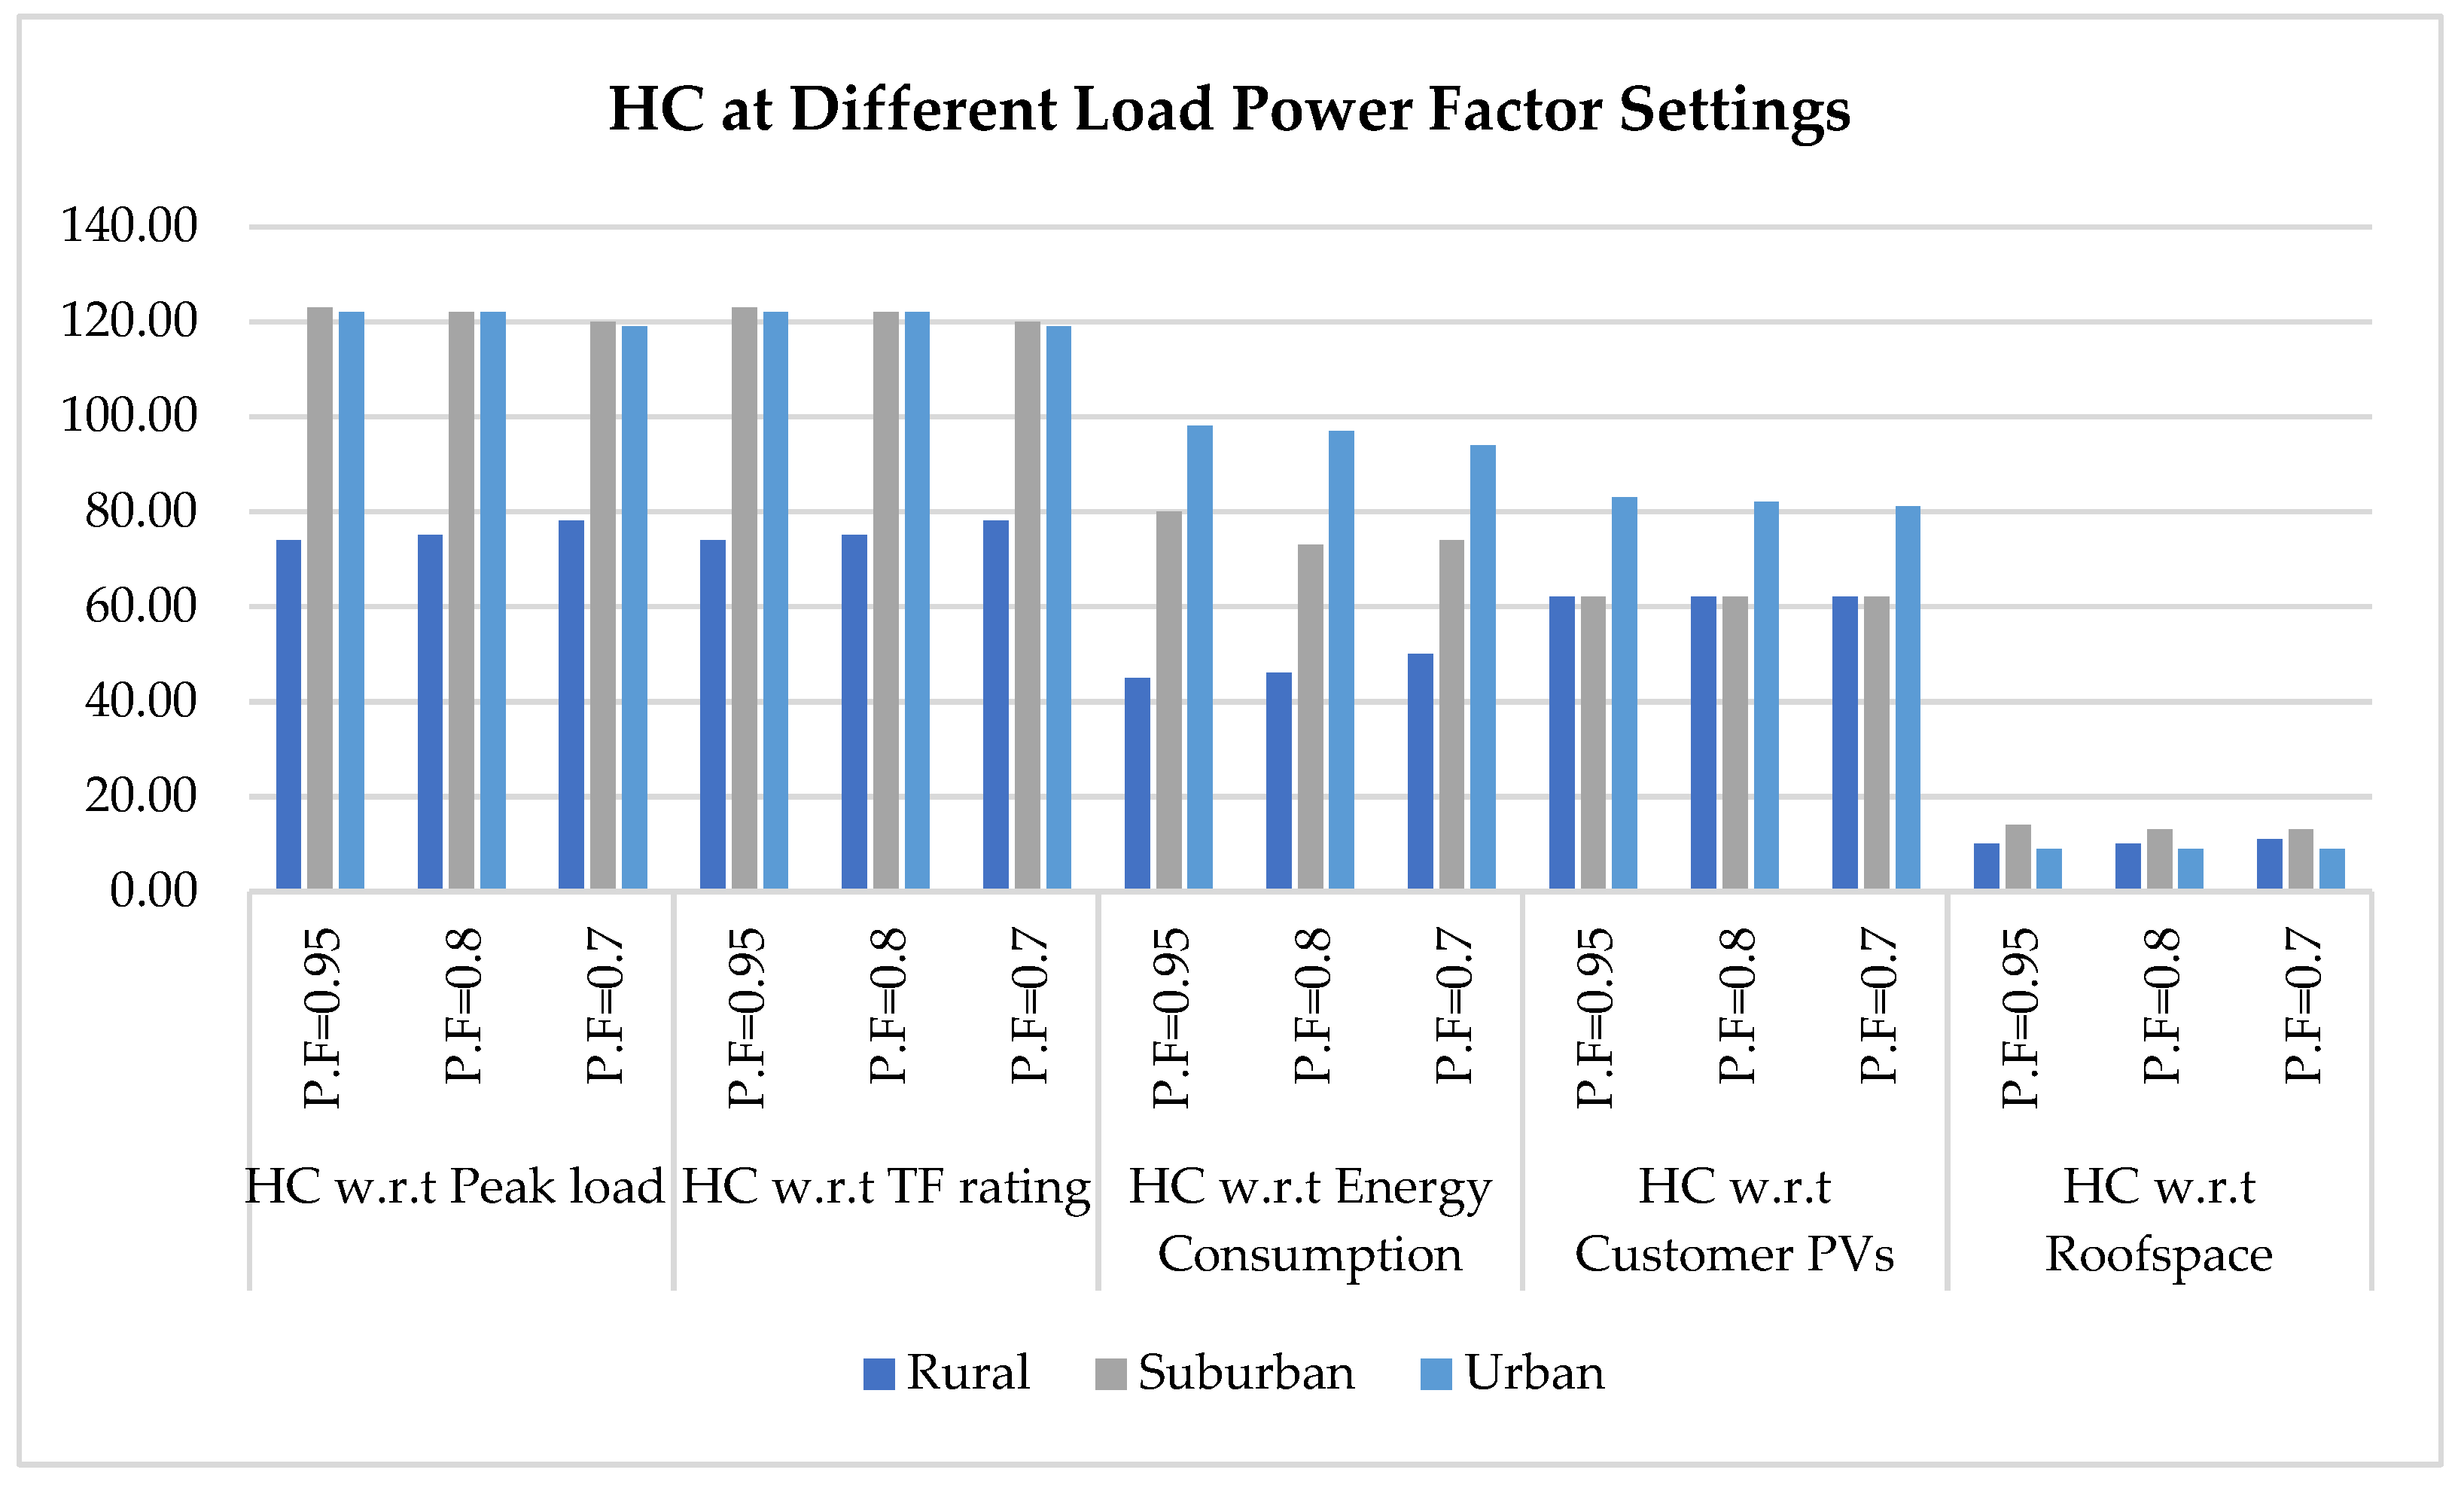
Finally, the HC values of the networks were investigated at different load power factor values of 0.95, 0.8, and 0.7, with research results showing that the HC values remained almost consistent most of the time by changing the load power factor. There were slight fluctuations in the HC values that can be accredited to different load selection from the pool for each analysis. The results of this analysis are shown in Table 7 and also Figure 6.
5. Discussion
The comparison of HC w.r.t different references revealed the fact that HC is not a single value. Therefore, the HC must be carefully investigated in the context of the used references before integrating a large amount of PV generation in the network. The HC values varied considerably depending on used reference, technical limit values employed, share of single-phase PVs, the number of customers to be served, loading level, PV deployment, and location criteria. The main focus of this article was to compare the PV HC of the same networks by using different HC definitions as a reference. The test networks (rural, suburban, and urban) of this study were formulated in [2] by utilizing the real load consumption data of different customers characterized by their unique heating modes. A MC simulation approach is beneficial for simulating a high variance of networks as we used randomly sampled load profiles of each type of customer (differentiated by heating modes) for a total year. The proposed MC model enabled to use the input data of the test networks in the form of real DSO (distribution system operator) survey on measured load data and the average network size as formulated in [2].
Heating is the major part of the electricity consumption in cold climates. The investigated networks in this study were based on the real Finnish DSO surveys and real load consumption data of Finland. Therefore, this article was more focused on heating methods for defining the customer types as it took into account the conditions encountered in Finland: heating, generated networks, and PV arrays for Helsinki region. In heating-dominated load case, the loads are highest in winter time, whereas in summer, when the PV production is highest, the demand of residential customers is at its lowest. It has been established by the careful investigation of the same networks under the same loading conditions and same geographical location that the HC w.r.t different references produce quite disparate results. It was further observed that the HC value of the same PV generation amount w.r.t peak load showed the highest numerical value, and HC w.r.t roof space resulted in the lowest numerical value, thus maintaining it as the most conservative reference definition of HC in this analysis.
The peak load is the most widely used HC reference throughout the literature; however, the HC w.r.t peak load depends on the load sampling and scale of the peak load w.r.t transformer rating. Therefore, the frequent load variations of the network resulted in inconsistent HC values. The HC w.r.t transformer rating showed almost similar values for each load sampling and thus proved to be useful for the HC assessment, as already proved by the research results of [14]. Moreover, it was observed that scaling the maximum load w.r.t transformer rating mainly impacted the HC values w.r.t peak load and energy consumption, which involve the peak load directly in the HC calculation. A quantitative analysis of the HC limiting factors strengthened the fact that the voltage violations mainly limit the HC of rural networks, and transformer overloading restricts the HC of urban and suburban regions. This observation supports the use of transformer capacity as the main HC reference. If the HC is clearly lower than 100% of transformer rating, the HC limitations are likely to be due to voltage issues. On the other hand, the scaling w.r.t customer PVs or roofspace may reveal the unused PV generation potential among the local community.
The scope of this article was to compare the HC with respect to different reference definitions without utilizing any means to increase the HC of the networks. However, the potential of storage devices, reactive power control, voltage control, inverter oversizing, and dynamic loading of components should be addressed, taking into account different HC references.
Author Contributions
Conceptualization, S.F., V.P., and M.L.; methodology, S.F., V.P., and M.L.; software S.F. and V.P.; validation, S.F., V.P., and M.L.; formal analysis, S.F.; investigation, S.F. and V.P.; resources, M.L.; data curation, V.P.; writing—original draft preparation, S.F.; writing—review and editing, V.P. and M.L.; visualization, S.F.; supervision, M.L.; project administration, M.L.; funding acquisition, M.L. All authors have read and agreed to the published version of the manuscript.
Funding
This research was funded by BusinessFinland SolarX project.
Institutional Review Board Statement
No humans or animals were involved in this study.
Informed Consent Statement
No humans were involved in this study. The metered consumption data used for the study was anonymous and did not include any personal information.
Data Availability Statement
The data used for the study is confidential and was submitted by the DSOs for the research project in question only.
Conflicts of Interest
The authors declare no conflict of interest.
References
- Fatima, S.; Püvi, V.; Lehtonen, M. Review on the PV Hosting Capacity in Distribution Networks. Energies 2020, 13, 4756. [Google Scholar] [CrossRef]
- Arshad, A.; Lindner, M.; Lehtonen, M. An Analysis of Photo-Voltaic Hosting Capacity in Finnish Low Voltage Distribution Networks. Energies 2017, 10, 1702. [Google Scholar] [CrossRef] [Green Version]
- Torquato, R.; Salles, D.; Pereira, C.O.; Meira, P.C.M.; Freitas, W. A Comprehensive Assessment of PV Hosting Capacity on Low-Voltage Distribution Systems. IEEE Trans. Power Deliv. 2018, 33, 1002–1012. [Google Scholar] [CrossRef]
- Weisshaupt, M.J.; Schlatter, B.; Korba, P.; Kaffe, E.; Kienzle, F. Evaluation of Measures to Operate Urban Low Voltage Grids Considering Future PV Expansion. IFAC-PapersOnLine 2016, 49, 336–341. [Google Scholar] [CrossRef]
- Heinrich, C.; Fortenbacher, P.; Fuchs, A.; Andersson, G. PV-integration strategies for low voltage networks. In Proceedings of the 2016 IEEE International Energy Conference (ENERGYCON), Leuven, Belgium, 4–8 April 2016; Volume 2. [Google Scholar] [CrossRef]
- Procopiou, A.T.; Ochoa, L.F. Voltage Control in PV-Rich LV Networks without Remote Monitoring. IEEE Trans. Power Syst. 2017, 32, 1224–1236. [Google Scholar] [CrossRef]
- Bollen, M.H.J.; Rönnberg, S.K. Hosting Capacity of the Power Grid for Renewable Electricity Production and New Large Consumption Equipment. Energies 2017, 10, 1325. [Google Scholar] [CrossRef] [Green Version]
- Hong, T.; Lee, M.; Koo, C.; Kim, J.; Jeong, K. Estimation of the Available Rooftop Area for Installing the Rooftop Solar Photovoltaic (PV) System by Analyzing the Building Shadow Using Hillshade Analysis. Energy Procedia 2016, 88, 408–413. [Google Scholar] [CrossRef] [Green Version]
- Sorsanen, J. Assessment of Realistic Solar Electricity Production Potential of Grid-Connected Photovoltaic Systems in Tapiola District; Evaluation of Realistic Photovoltaic Production Potential for Grid-Connected Photovoltaic Systems in the Tapiola Area. Master´s Thesis, Aalto University School of Electrical Engineering, Aalto University, Espoo, Finland, 2015. [Google Scholar]
- Rahman, F.F.S.; Adi, K.W.; Sarjiya; Putranto, L.M. Study on Photovoltaic Hosting in Yogyakarta Electric Distribution Network. In Proceedings of the 2018 5th International Conference on Information Technology, Computer, and Electrical Engineering (ICITACEE), Semarang, Indonesia, 27–28 September 2018; pp. 240–244. [Google Scholar] [CrossRef]
- Alam, M.J.E.; Muttaqi, K.M.; Sutanto, D. Distributed energy storage for mitigation of voltage-rise impact caused by rooftop solar PV. In Proceedings of the 2012 IEEE Power and Energy Society General Meeting, San Diego, CA, USA, 22–26 July 2012; pp. 1–8. [Google Scholar]
- Ekstrom, J.; Koivisto, M.; Millar, R.J.; Mellin, I.; Lehtonen, M. A statistical approach for hourly photovoltaic power generation modeling with generation locations without measured data. Sol. Energy 2016, 132, 173–187. [Google Scholar] [CrossRef]
- Hoke, A.; Butler, R.; Hambrick, J.; Kroposki, B. Steady-State Analysis of Maximum Photovoltaic Penetration Levels on Typical Distribution Feeders. IEEE Trans. Sustain. Energy 2013, 4, 350–357. [Google Scholar] [CrossRef]
- Arshad, A.; Püvi, V.; Lehtonen, M. Monte Carlo-Based Comprehensive Assessment of PV Hosting Capacity and Energy Storage Impact in Realistic Finnish Low-Voltage Networks. Energies 2018, 11, 1467. [Google Scholar] [CrossRef] [Green Version]
- Atmaja, W.Y.; Sarjiya; Putranto, L.M.; Santoso, S. Rooftop Photovoltaic Hosting Capacity Assessment: A Case Study of Rural Distribution Grids in Yogyakarta, Indonesia. In Proceedings of the 2019 International Conference on Electrical Engineering and Informatics (ICEEI), Bandung, Indonesia, 9–10 July 2019; pp. 448–453. [Google Scholar] [CrossRef]
- Vimpari, J.; Junnila, S. Estimating the diffusion of rooftop PVs: A real estate economics perspective. Energy 2019, 172, 1087–1097. [Google Scholar] [CrossRef]
Figure 1.
General methodology for hosting capacity (HC) determination.

Figure 2.
The Monte Carlo (MC) algorithm for the calculation of HC: (a) HC w.r.t peak load, transformer rating, energy consumption, and roof-space; (b) HC w.r.t customers’ photovoltaics (PVs).
Figure 2.
The Monte Carlo (MC) algorithm for the calculation of HC: (a) HC w.r.t peak load, transformer rating, energy consumption, and roof-space; (b) HC w.r.t customers’ photovoltaics (PVs).

Figure 3.
The comparison of HC w.r.t different references: (a) HC comparison for balanced PV deployment; (b) HC comparison for unbalanced PV deployment.
Figure 3.
The comparison of HC w.r.t different references: (a) HC comparison for balanced PV deployment; (b) HC comparison for unbalanced PV deployment.

Figure 4.
The average HC of three regions at different loading levels by averaging all percentage estimates of different reference definitions.
Figure 4.
The average HC of three regions at different loading levels by averaging all percentage estimates of different reference definitions.

Figure 5.
Quantitative analysis of HC limiting constraints for the investigated cases in Section 4.1.2.
Figure 5.
Quantitative analysis of HC limiting constraints for the investigated cases in Section 4.1.2.

Figure 6.
HC comparison for balanced PVs by taking maximum load as 100% of transformer rating for three load power factor settings of 0.95, 0.8, and 0.7 for the three regions.
Figure 6.
HC comparison for balanced PVs by taking maximum load as 100% of transformer rating for three load power factor settings of 0.95, 0.8, and 0.7 for the three regions.


Table 1.
LV test networks’ characteristics and grid components specifications.
| Region | No. of Feeders | Nodes/Feeder | Customers/Node | Total Customers | Transformer (kVA) | Cable Length (m) |
|---|---|---|---|---|---|---|
| PR | 1 | 8 | 1 | 8 | 50 | 150 |
| SU | 3 | 4,3,3 | 4 | 40 | 200 | 100 |
| PU | 3 | 2,2,1 | 60 | 300 | 1000 | 100 |
Table 2.
Loading (heating) distributions for three types of investigated regions.
| Region | Storage Heating (%) | District Heating (%) | Direct Electric Heating (%) |
|---|---|---|---|
| PR | 5.9 | 52.9 | 41.2 |
| SU | 7.6 | 52.5 | 39.9 |
| PU | 0.5 | 95.3 | 4.2 |
Table 3.
Different definitions of HC w.r.t varying references [1].
Table 3.
Different definitions of HC w.r.t varying references [1].
| HC Reference | HC Definition |
|---|---|
| Peak load | The ratio of peak PV capacity to the peak load of the feeder. |
| Transformer rating | The ratio of peak PV capacity to the transformer rating. |
| Energy consumption | The ratio of total yearly PV production to the total yearly energy consumption. |
| Customers’ PVs | The ratio of customers with PVs to the total number of customers. |
| Roof space PVs | The ratio of roof space utilized for PV installation to total available roof space. |
Table 4.
Average load values of the networks under balanced PVs in three regions for worst-case hours (minimum load values) and peak load calculated among all the 8760 h.
Table 4.
Average load values of the networks under balanced PVs in three regions for worst-case hours (minimum load values) and peak load calculated among all the 8760 h.
| Region | Worst-Case Hour Load Values (kW) | Peak Load (kW) | Transformer Rating (kVA) | Initial Peak Load/TF Rating (%) |
|---|---|---|---|---|
| PR | 5.9 | 20.8 | 50 | 41.6 |
| SU | 31 | 109.5 | 200 | 54.7 |
| PU | 82.6 | 359.7 | 1000 | 35.9 |
Table 5.
HC values as compared to different references for balanced and unbalanced PV scenarios.
| HC References | Balanced (Three-Phase PV) | Unbalanced (One-Phase PV) | |||
|---|---|---|---|---|---|
| Rural | HC (%) | Violation | HC (%) | Violation | |
| Peak load | 148 | E1 1 | 65.6 | E4, E1 | |
| Transformer rating | 55.6 | E1 | 26 | E4, E1 | |
| Energy consumption | 91.7 | E1 | 42 | E4, E1 | |
| Customers’ PVs | 50 | E1 | 25 | E4, E1 | |
| Roof-space PVs | 8 | E1 | 3.7 | E4, E1 | |
| Suburban | |||||
| Peak load | 219 | E3 | 103 | E4 | |
| Transformer rating | 110 | E3 | 60 | E4 | |
| Energy consumption | 135 | E3 | 67.9 | E4 | |
| Customers’ PVs | 57.5 | E3 | 35 | E4 | |
| Roof-space PVs | 12.5 | E3 | 6.8 | E4 | |
| Urban | |||||
| Peak load | 301 | E3 | 108 | E5, E4, E2 | |
| Transformer rating | 107.8 | E3 | 40.7 | E5, E4, E2 | |
| Energy consumption | 248 | E3 | 85 | E5, E4, E2 | |
| Customers’ PVs | 73.6 | E3 | 26 | E5 | |
| Roof-space PVs | 8.2 | E3 | 3.1 | E5, E4, E2 | |
1 Over-voltage (E1), cable ampacity (E2), transformer overloading (E3), voltage unbalance (E4), and neutral-wire ampacity (E5).
Table 6.
HC reference value comparison for two different loading levels of the maximum load as 100% and 50% of transformer rating. (a) HC of the rural region for two loading levels; (b) HC of the suburban region for two loading levels; (c) HC of the urban region for two loading levels.
Table 6.
HC reference value comparison for two different loading levels of the maximum load as 100% and 50% of transformer rating. (a) HC of the rural region for two loading levels; (b) HC of the suburban region for two loading levels; (c) HC of the urban region for two loading levels.
| (a) | ||||||||
| Loading Level | 100% of Transformer Rating | 50% of Transformer Rating | ||||||
| PV Connection | Balanced | Unbalanced | Balanced | Unbalanced | ||||
| HC References | HC | Limit | HC | Limit | HC | Limit | HC | Limit |
| Peak load | 74 | E1 | 26 | E4 | 120 | E1 | 55.6 | E4, E1 |
| Energy consumption | 45 | E1 | 18 | E4 | 74 | E1 | 35.5 | E4, E1 |
| Transformer rating | 74 | E1 | 26 | E4 | 60 | E1 | 27.8 | E4, E1 |
| Customers’ PVs | 62.5 | E1 | 25 | E4, E1 | 50 | E1 | 25 | E4, E1 |
| Roof-space PVs | 10.58 | E1 | 3.7 | E4 | 8.6 | E1 | 3.9 | E4, E1 |
| (b) | ||||||||
| Loading Level | 100% of Transformer Rating | 50% of Transformer Rating | ||||||
| PV Connection | Balanced | Unbalanced | Balanced | Unbalanced | ||||
| HC References | HC | Limit | HC | Limit | HC | Limit | HC | Limit |
| Peak load | 123.7 | E3 | 58 | E4 | 225 | E3 | 120 | E4 |
| Energy consumption | 80 | E3 | 36.5 | E4 | 140.5 | E3 | 75 | E4 |
| Transformer rating | 123.7 | E3 | 58 | E4 | 112.5 | E3 | 60 | E4 |
| Customers’ PVs | 62.5 | E3 | 32.5 | E4 | 57.5 | E3 | 40 | E4 |
| Roof-space PVs | 14 | E3 | 6.6 | E4 | 12.8 | E3 | 6.8 | E4 |
| (c) | ||||||||
| Loading Level | 100% of Transformer Rating | 50% of Transformer Rating | ||||||
| PV Connection | Balanced | Unbalanced | Balanced | Unbalanced | ||||
| HC References | HC | Limit | HC | Limit | HC | Limit | HC | Limit |
| Peak load | 122 | E3 | 40.7 | E5, E4 | 221 | E3 | 81.5 | E5, E4 |
| Energy consumption | 98 | E3 | 31.8 | E5, E4 | 170.9 | E3 | 64.8 | E5, E4 |
| Transformer rating | 122 | E3 | 40.7 | E5, E4 | 110.5 | E3 | 40.7 | E5, E4 |
| Customers’ PVs | 83 | E3 | 26 | E5 | 76 | E3 | 26 | E5 |
| Roof-space PVs | 9 | E3 | 3 | E5, E4 | 8.4 | E3 | 3.1 | E5, E4 |
Table 7.
The HC variation based on changing load power factor for 100% and 50% loading levels for balanced PVs in rural, suburban, and urban regions.
Table 7.
The HC variation based on changing load power factor for 100% and 50% loading levels for balanced PVs in rural, suburban, and urban regions.
| Region | 100% Loading Level | 50% Loading Level | ||||
|---|---|---|---|---|---|---|
| Peak load | 74 | 75.7 | 78 | 120 | 123.7 | 130 |
| Energy | 45 | 46.6 | 50 | 74 | 76.9 | 82 |
| TF rating | 74 | 75.7 | 78 | 60 | 61.8 | 65 |
| Customers | 62.5 | 62.5 | 62.5 | 50 | 50 | 50 |
| Roofspace | 10.58 | 10.8 | 11 | 8.6 | 8.8 | 9.3 |
| Suburban | P.F = 0.95 | P.F = 0.8 | P.F = 0.7 | P.F = 0.95 | P.F = 0.8 | P.F = 0.7 |
| Peak load | 123.7 | 122 | 120 | 225 | 224 | 224 |
| Energy | 80 | 73 | 74 | 140.5 | 145 | 144 |
| TF rating | 123.7 | 122 | 120 | 112.5 | 112 | 112 |
| Customers | 62.5 | 62.5 | 62.5 | 57.5 | 57.5 | 57.5 |
| Roofspace | 14 | 13.9 | 13.7 | 12.8 | 12.8 | 12.8 |
| Urban | P.F = 0.95 | P.F = 0.8 | P.F = 0.7 | P.F = 0.95 | P.F = 0.8 | P.F = 0.7 |
| Peak load | 122 | 122 | 119.5 | 221 | 221 | 221 |
| Energy | 98 | 97 | 94 | 170.9 | 178 | 163.8 |
| TF rating | 122 | 122 | 119.5 | 110.5 | 110 | 110.7 |
| Customers | 83 | 82 | 81 | 76 | 75.3 | 75.6 |
| Roofspace | 9 | 9.3 | 9 | 8.4 | 8.4 | 8.4 |
Publisher’s Note: MDPI stays neutral with regard to jurisdictional claims in published maps and institutional affiliations. |
© 2021 by the authors. Licensee MDPI, Basel, Switzerland. This article is an open access article distributed under the terms and conditions of the Creative Commons Attribution (CC BY) license (http://creativecommons.org/licenses/by/4.0/).
Share and Cite
MDPI and ACS Style
Fatima, S.; Püvi, V.; Lehtonen, M. Comparison of Different References When Assessing PV HC in Distribution Networks. Clean Technol. 2021, 3, 123-137. https://0-doi-org.brum.beds.ac.uk/10.3390/cleantechnol3010008
AMA Style
Fatima S, Püvi V, Lehtonen M. Comparison of Different References When Assessing PV HC in Distribution Networks. Clean Technologies. 2021; 3(1):123-137. https://0-doi-org.brum.beds.ac.uk/10.3390/cleantechnol3010008
Chicago/Turabian StyleFatima, Samar, Verner Püvi, and Matti Lehtonen. 2021. "Comparison of Different References When Assessing PV HC in Distribution Networks" Clean Technologies 3, no. 1: 123-137. https://0-doi-org.brum.beds.ac.uk/10.3390/cleantechnol3010008