
Hybrid PV System with High Speed Flywheel Energy Storage for Remote Residential Loads


School of Mathematics, Computer Science and Engineering, City University of London, London EC1V 0HB, UK
*
Author to whom correspondence should be addressed.
Clean Technol. 2021, 3(2), 351-376; https://0-doi-org.brum.beds.ac.uk/10.3390/cleantechnol3020020
Submission received: 12 February 2021
/
Revised: 11 March 2021
/
Accepted: 13 March 2021
/
Published: 20 April 2021
(This article belongs to the Special Issue Feature Papers 2020)
Abstract
:Due to low system inertia in microgrids, frequencies may vary rapidly from the nominal value, leading to the complete blackout of the system unless there is an adequate spinning reserve available for balancing the supply with the demand load. This issue of instability in microgrids under islanded operation has attracted particular attention recently. A diesel generator is considered to be an ideal spinning reserve to provide back-up power to the load along with the renewable energy source in islanded system. However, the high maintenance cost and CO2 emissions of diesel generator are detrimental factors which have inspired searches for more cost effective and cleaner technologies. The integration of an energy storage system (ESS) in islanded system along with generator not only reduces generator maintenance costs but also reduces the CO2 emissions by limiting its operating hours. This paper proposes an islanded PV hybrid microgrid system (PVHMS) utilizing flywheel energy storage systems (FESS) as an alternative to battery technology to support the PV system and meet the peak demand of a small residential town with 100 dwellings. The diesel generator is used in the islanded system as a spinning reserve to maintain the stability of the islanded system when the PV system and flywheel storage cannot meet the load demand. Results of analysis of such a system demonstrate that flywheel energy storage technology of appropriate size offers a viable solution to support the operation of the standalone PV system. Furthermore, the reduction in CO2 emissions and fuel consumption has been quantified as compared with the case with flywheel energy storage systems which means the diesel generator but always be operating.
1. Introduction
Approaches to power generation for satisfying consumption have recently been changed due to increased energy demand, challenging targets of cutting carbon footprints and effects of climate change [1]. The growing demand for energy from existing national and micro electrical grids has led electricity suppliers to search for new sources of electric power production and update the existing electrical infrastructure [2]. Due to ease of integration, flexible installation, high energy utilization and low transmission losses, renewable energy sources (RES) have attracted much attention in energy industry [3]. RES offers the greatest potential for reducing carbon emissions and facilitating clean technology than improvements in energy efficiency hence greatest impact in global warming mitigation. However, RES such as wind and solar, can cause frequency deviations due to their unpredictable power production particularly when integrated into microgrids. In addition, to this, meeting the electricity demand by RES alone cannot be guaranteed for the entire day. Therefore, lack of active power in microgrids makes frequency control more difficult than in conventional national grids which are larger so the effect of individual load changes is smaller. Due to the mismatch between electric power supply and the load demand, the frequency of the microgrid will swing and it may fluctuate rapidly due to the low inertia present in the microgrid. If the imbalance is large, complete failure may occur in the form of a blackout unless there is adequate spinning reserve available for balancing frequency of microgrid. Typically, it is necessary to maintain the grid electric frequency within the standard range of ±0.5 Hz in order to avoid system blackouts.
With the integration of RES (wind or solar) in microgrids, a backup energy source or an energy storage system (usually in the form of battery storage) are needed to provide electric power and maintain the microgrid stability when power from RES is unavailable or insufficient to meet the load demand. Availability of solar energy is in abundance, but a standalone PV system cannot match time distribution of the load for an entire day [4]. The use of an independent and predictable backup source such as diesel generator (DGen) is a common option to provide power when energy from solar or wind is not available. However, due to environmental pollution, high maintenance and running costs, this is not an ideal solution, especially at partial loads when efficiency is low. An energy storage system (ESS) with quick response having capability of power absorption or supply can improve stability of the microgrid by power levelling or bridging the gap between supply and demand. The choice of ESS depends on various characteristics such as capacity reserve, quick response time, long or short storage, energy density, storage costs, security, environmental impacts, storage time limits and conversion response time [5]. Batteries of different capacities are usually considered to be the most suitable options to store energy. They are efficient, reliable, easy-to-use, and convenient storage systems. However, manufacturing of the batteries leads to the production of hazardous waste, greenhouse emissions and other toxic gases, which has dangerous impacts on the environment. Additionally, high cost, need for critical materials, low energy density and restricted lifetime in certain storage applications are some of the limitations of battery technology [6].
For the load sites which are far away from a conventional power system, the hybrid renewable energy system (HRES) is the most preferable option to electrify the load sites. HRES include a renewable source (wind or PV), DGen and ESS such as batteries. HRES is considered a cost-effective solution to meet energy requirements [7] in the areas where the extension of the conventional grid is not possible or is not cost-effective. Technical assessments and performance evaluation of HRES utilizing solar PV and wind with a suitable ESS are discussed in [4,8,9]. Applications of hybrid standalone PV systems with battery storage has been widely researched as evidenced in publicly available literature, although other energy storage technologies such as pumped hydro, gravity systems and compressed air storage could offer options for the same applications. However, their slow response time, limited number of charge/discharge cycles and cost for small scale systems can be a challenge. In contrast, flywheel energy storage systems (FESS) offer several benefits of high-power density, fast response, long service time, large number of charge and discharge cycles and are insensitive to environmental conditions. Furthermore, the environmental issues associated with battery manufacture and disposal can be avoided. It is the therefore the purpose of this this paper to explore FESS as an alternative to electrochemical batteries and other ESS technologies to support stand-alone solar PV systems backed up by DGen. The FESS can perform large number of charge-discharge cycles, which makes is highly suitable for the power smoothing, power quality improvement, renewable energy integration and for system stability applications [10].
In HRES where the load is supplied by a DGen and PV system, there FESS can support the load in many scenarios such as disconnection of the microgrid or in case of insufficient power supply from PV system due to a cloudy day or partial shading. In these cases, the FESS not only supports stable operation of HRES, but also helps to reduce CO2 emissions by reducing the operation of DGen. Additionally, operation of FESS together with DGen can increase the efficiency of DGen and save costs due to lesser consumption of diesel fuel. This paper studies the use of FESS in a microgrid together with a stand-alone PV system and DGen to demonstrate how the FESS can act as a power bridge in a microgrid to ensures the constant supply of power to the load when power from the DGen and/or the PV system is not sufficient. The operation scenarios are created based on the three load profiles for day and nighttime. The compliance of the FESS operation is demonstrated according to the activity of the residents and their inhabitance.
2. Modelling of FESS and Its Control Structure
2.1. Modelling of FESS
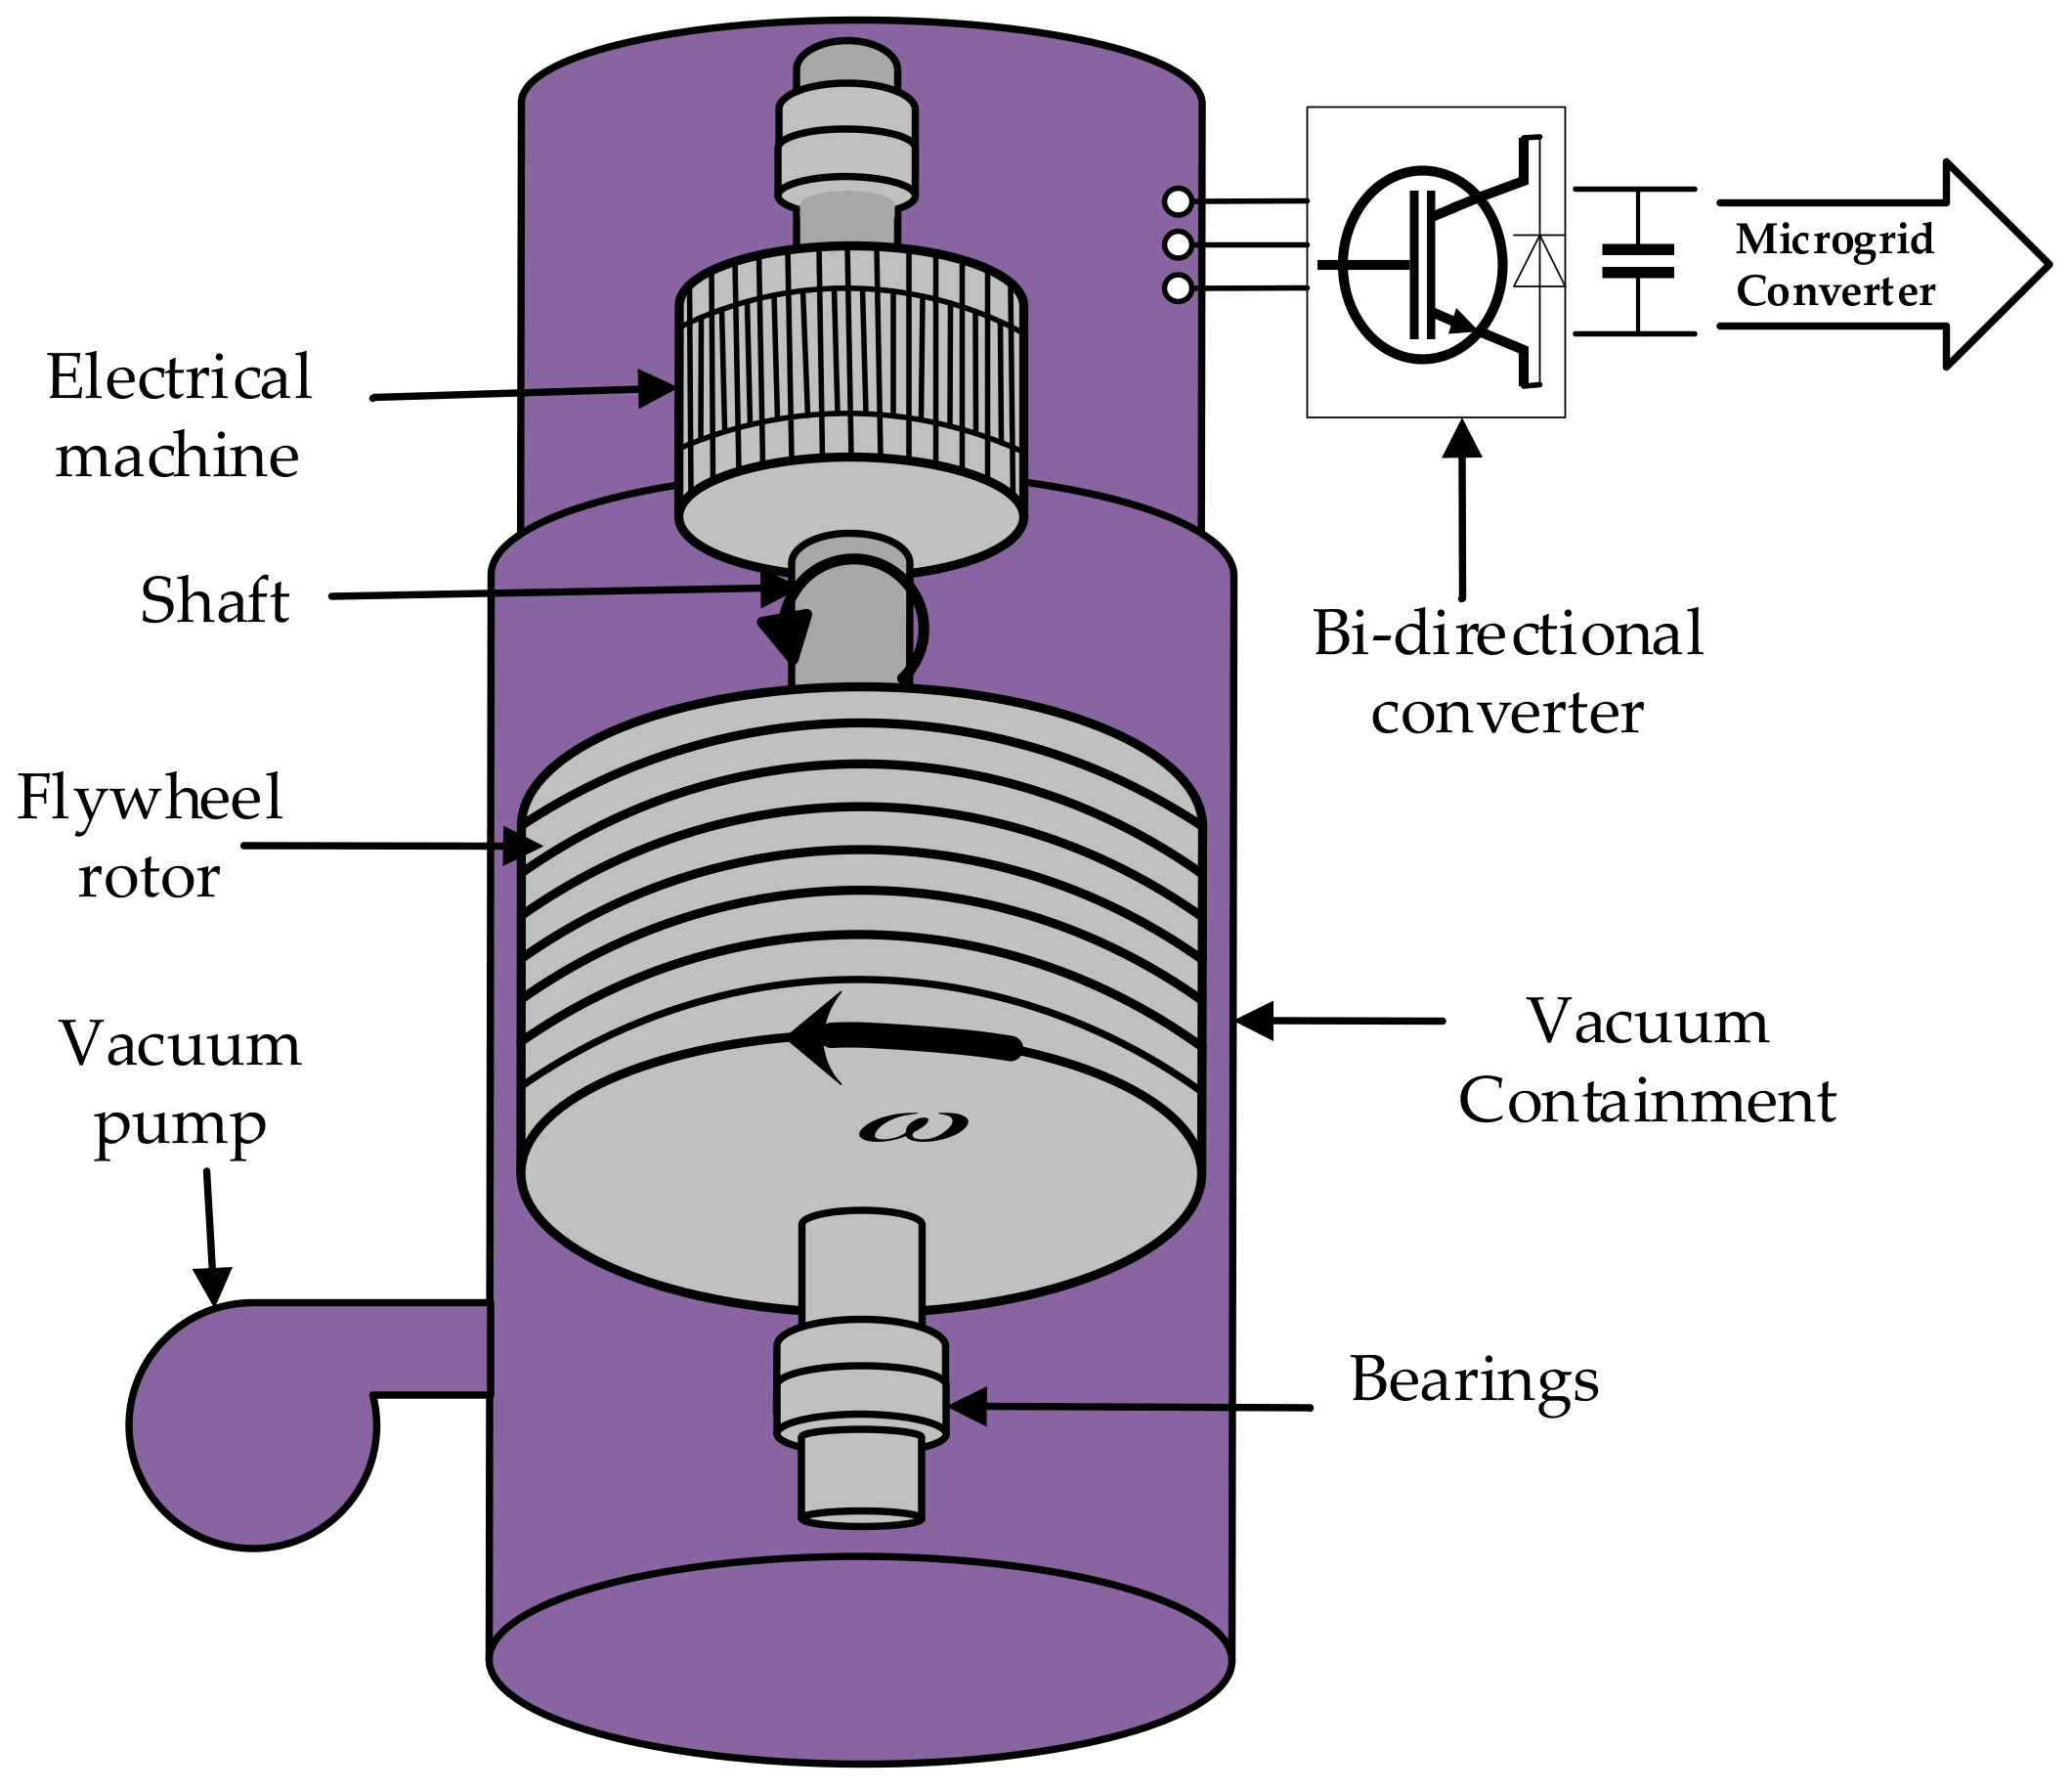
FESS model proposed in this paper comprises a squirrel cage induction machine (SCIM), a solid disk steel laminated flywheel rotor modelled as high inertial mass, two bidirectional voltage source converters and their associated control systems. SCIM and the flywheel are coupled and mounted on the same shaft and supported by bearings. A schematic diagram showing the structure of FESS is shown in Figure 1.
The rotor of the flywheel with a rotating mass (kg) having inertia (kg·m2) and spinning at an angular velocity of (rad/s), stores kinetic energy (joules) as given by Equation (1).
Expressing the moment of inertia as function of density (kg/m3) and length (m), angular velocity can be expressed by Equation (2);
For the disc type flywheel rotor rotating between a minimum and maximum velocity of , the moment of inertia is equal to , where is the mass and is the radius of the flywheel. Therefore, the useable stored kinetic energy the stored energy is expressed by Equation (3) [11].
Parameters for the SCIM based flywheel energy storage system (SCIM-FESS) used in this paper are given in Table 1.
For simple representation of SCIM model and control schemes, the time varying sinusoidal equations are presented into d-q synchronous reference frame by Park’s transformation method. The dynamic equations of the rotor and stator voltages of the SCIM in d-q reference frame are presented in Equations (4) and (5), respectively. The dynamic model of SCIM is discussed and detail analysis is presented in [12].
where and are stator and rotor resistance respectively, is the stator voltage in d-q reference frame (V), is the stator electrical speed (rad/s), and are stator and rotor flux linkages (Wb) respectively in d-q reference frame, and are stator and rotor currents (A) respectively in d-q reference frame.
2.2. Modelling of Control Structure
For control design of FESS model, the essential parameters to be considered are flywheel torque, speed of motor/generator set, DC-link voltage, and the angular position of the rotor flux vector. Field oriented control (FOC) scheme has been utilized for the control of gate pulses of machine side converter (MSC) by space vector pulse width modulation (SVPWM) technique and for the control of grid side converter (GSC), direct control technique is used, the gate pulses of the converter are controlled by reference three phase currents of the micro grid, three phase voltages and the reference DC voltage as shown in Figure 2.
The control principle of FOC is based on simple control structure as of DC machine which reduces the uncertainty in parameter variations. Therefore, the flux producing current (id) and the torque producing current (iq) are controlled separately [13]. For generation of gate pulses of MSC the PI controller produces reference voltage signals ( and ) by comparing the DC currents and with reference currents and . The rotor flux angle ( is a key parameter and it governs the position of rotor flux in induction machine as calculated using Equations (6) and (7).
The flux estimator calculates the actual magnitude of rotor magnetic flux using Equation (8) which is then compared with the reference flux (). Reference d-q axis stator currents and are calculated using Equations (9) and (10) respectively by currents calculator blocks. The reference currents ( and ) are then compared with actual stator currents () to produce reference voltages ( and ).
where is the reference torque from PI controller, and is an estimated flux and d-axis rotor magnetic flux respectively, and rotor inductance and is mutual inductance respectively, is the rotor time constant and is the slip frequency.
In order to accurately produce command voltages for modulation and generation of gating signals, the compensator term () is used in the controller. The compensator term eliminates coupling between d-q axis components and also reduces the error in the reference voltage (). The angle () for Park’s transformation ( to d-q reference frame) is calculated by phase locked loop (PLL) at grid frequency (50 Hz). The control strategy of the GSC (Figure 2) is based on Equation (11) [14].
where and are grid side resistance and inductance and, is the grid voltage. The unity power factor is assumed in this control strategy, therefore, q-axis current is not considered in calculations (). The reference d-axis current () is generated by a PI controller by comparing the reference and measured value of dc link voltage ().
3. Modelling and Operation of Photovoltaic Hybrid Mini-Grid System (PVHMS)
A PV solar system cannot meet the energy demand alone for 24-h during the day due to variations in solar irradiance, particularly during nighttime. Therefore, integration of a DGen or appropriately sized ESS or both can meet the required load demand for 24 h and keep the system stable. In most cases, both DGen and ESS are needed since it is unlikely an ESS on its own can provide several hours of no photovoltaic energy supply let alone days or weeks that could occur during periods of inclement weather. Such a photovoltaic hybrid system can be used to facilitate rural electrification where there are weak grid systems or extension of existing conventional grids is an expensive option with increasing electricity demand in developing world. It is proposed and will be demonstrated with supporting results that FESS would be the feasible technology for providing back-up power which leads to reduced operation of diesel engine resulting in less emissions and reduced fuel burn. The storage capacity of the flywheel technology is independent of temperature fluctuations, therefore, contrary to batteries, it would be a suitable alternative for the islanded grid system in the countries with high temperatures [9]. The application of a PV hybrid mini-grid system (PVHMS) consisting of PV system, DGen and the FESS technology for applications in small towns located in remote areas was hence studied. A schematic diagram of PVHMS studied in this paper is shown in Figure 3.
The dynamic load is variable residential load representing load demand of a small town having 100 dwellings. The PV system and FESS are connected to DC bus. AC dynamic load and DGen are connected to AC bus. The AC load is supplied by DGen, PV and FESS.
With the proposed topology (Figure 3) penetration of PV can be increased into the system to maintain the stable voltage profile by charging the FESS when there is excessive power production from PV system. The FESS and the PV system are connected to the same bus (DC-link) therefore the proposed network topology does not require DC-AC grid inverter for FESS which reduces the cost of the system and reduces the power electronics losses. The specifications of the sources used in the proposed topology are given in Table 2.
3.1. Operation of the FESS
The flywheel storage system has three modes of operation which are charge, discharge and standby. The flywheel is said to be in stand-by mode when no energy conversion occurs and the flywheel runs at an optimum speed except for the marginal speed decrease due to standby losses. During charging mode, the flywheel converts electrical energy into kinetic energy, when there is disturbance in the electric grid, the flywheel starts to discharge and converts kinetic energy back into electrical energy. The flywheel rotor is assumed as an added inertia coupled with the shaft of SCIM. The position of the flywheel and speed are controlled by MSC that is connected to the grid side converter (GSC) through a DC-link capacitor. MATLAB/Simulink model of FESS is shown in Figure 4.
The GSC acts as a rectifier or an inverter during acceleration and deceleration modes, respectively. Additionally, it regulates the DC-link voltage and the reactive currents exchanged with the electric grid. In contrast, when a disturbance occurs in an electric grid, the flywheel starts to decelerate (discharge), the GSC acts as an inverter and MSC operates as a rectifier.
3.2. Modelling of Load Profiles
Stochastic demand models as recommended for use by [15] are the best input models for consumption trend simulations since they are able to match the disordered consumption of electricity whilst keeping the aggregate trend intact and produce the data which has sufficient probability distributions compared to those found in real world. Therefore, in this paper, a high-resolution stochastic model was created and developed using the CREST methodology [16]. The data for the load profile is generated by defining the type of the day of the week, month of the year and number of dwellings. Switching events of lighting, appliances and water-fixtures are calculated on basis of stochastic sequences of occupancy for each dwelling which determines electricity demands of dwellings. The CREST methodology also allows creation of solar PV supply for typical weather conditions as affected by cloud cover.
In order to get challenging load models (weekends and weekdays) with more varying solar irradiance several situations were modelled in CREST model and the examples were selected based on the significant variations in solar irradiance and maximum demand in energy consumption. Three types of load profiles were modelled for the months of April, August and December in order to represent the spread seasonal variations in solar irradiance and electricity usage of consumers of United Kingdom. The results for all months and even yearly variations for these months could be presented, however, due to space limitations the only three months were selected and the results fall within three months considered. The load profiles are selected for both weekend and weekdays presenting the worst-case scenarios as there are more peaks and spikes and irregular trend of electricity consumption on weekend compared to weekday. The electricity consumption of residential consumers on weekdays is relatively predictable and follows specific patterns due to regular routine activities of the consumers, while power consumption on weekends does not follow consistent trend. The load demand is assumed to be of small town consisted of 100 dwellings with 3 residents in each. The generated load profiles will help to analyze the different trends of power consumption with different occupancies at homes.
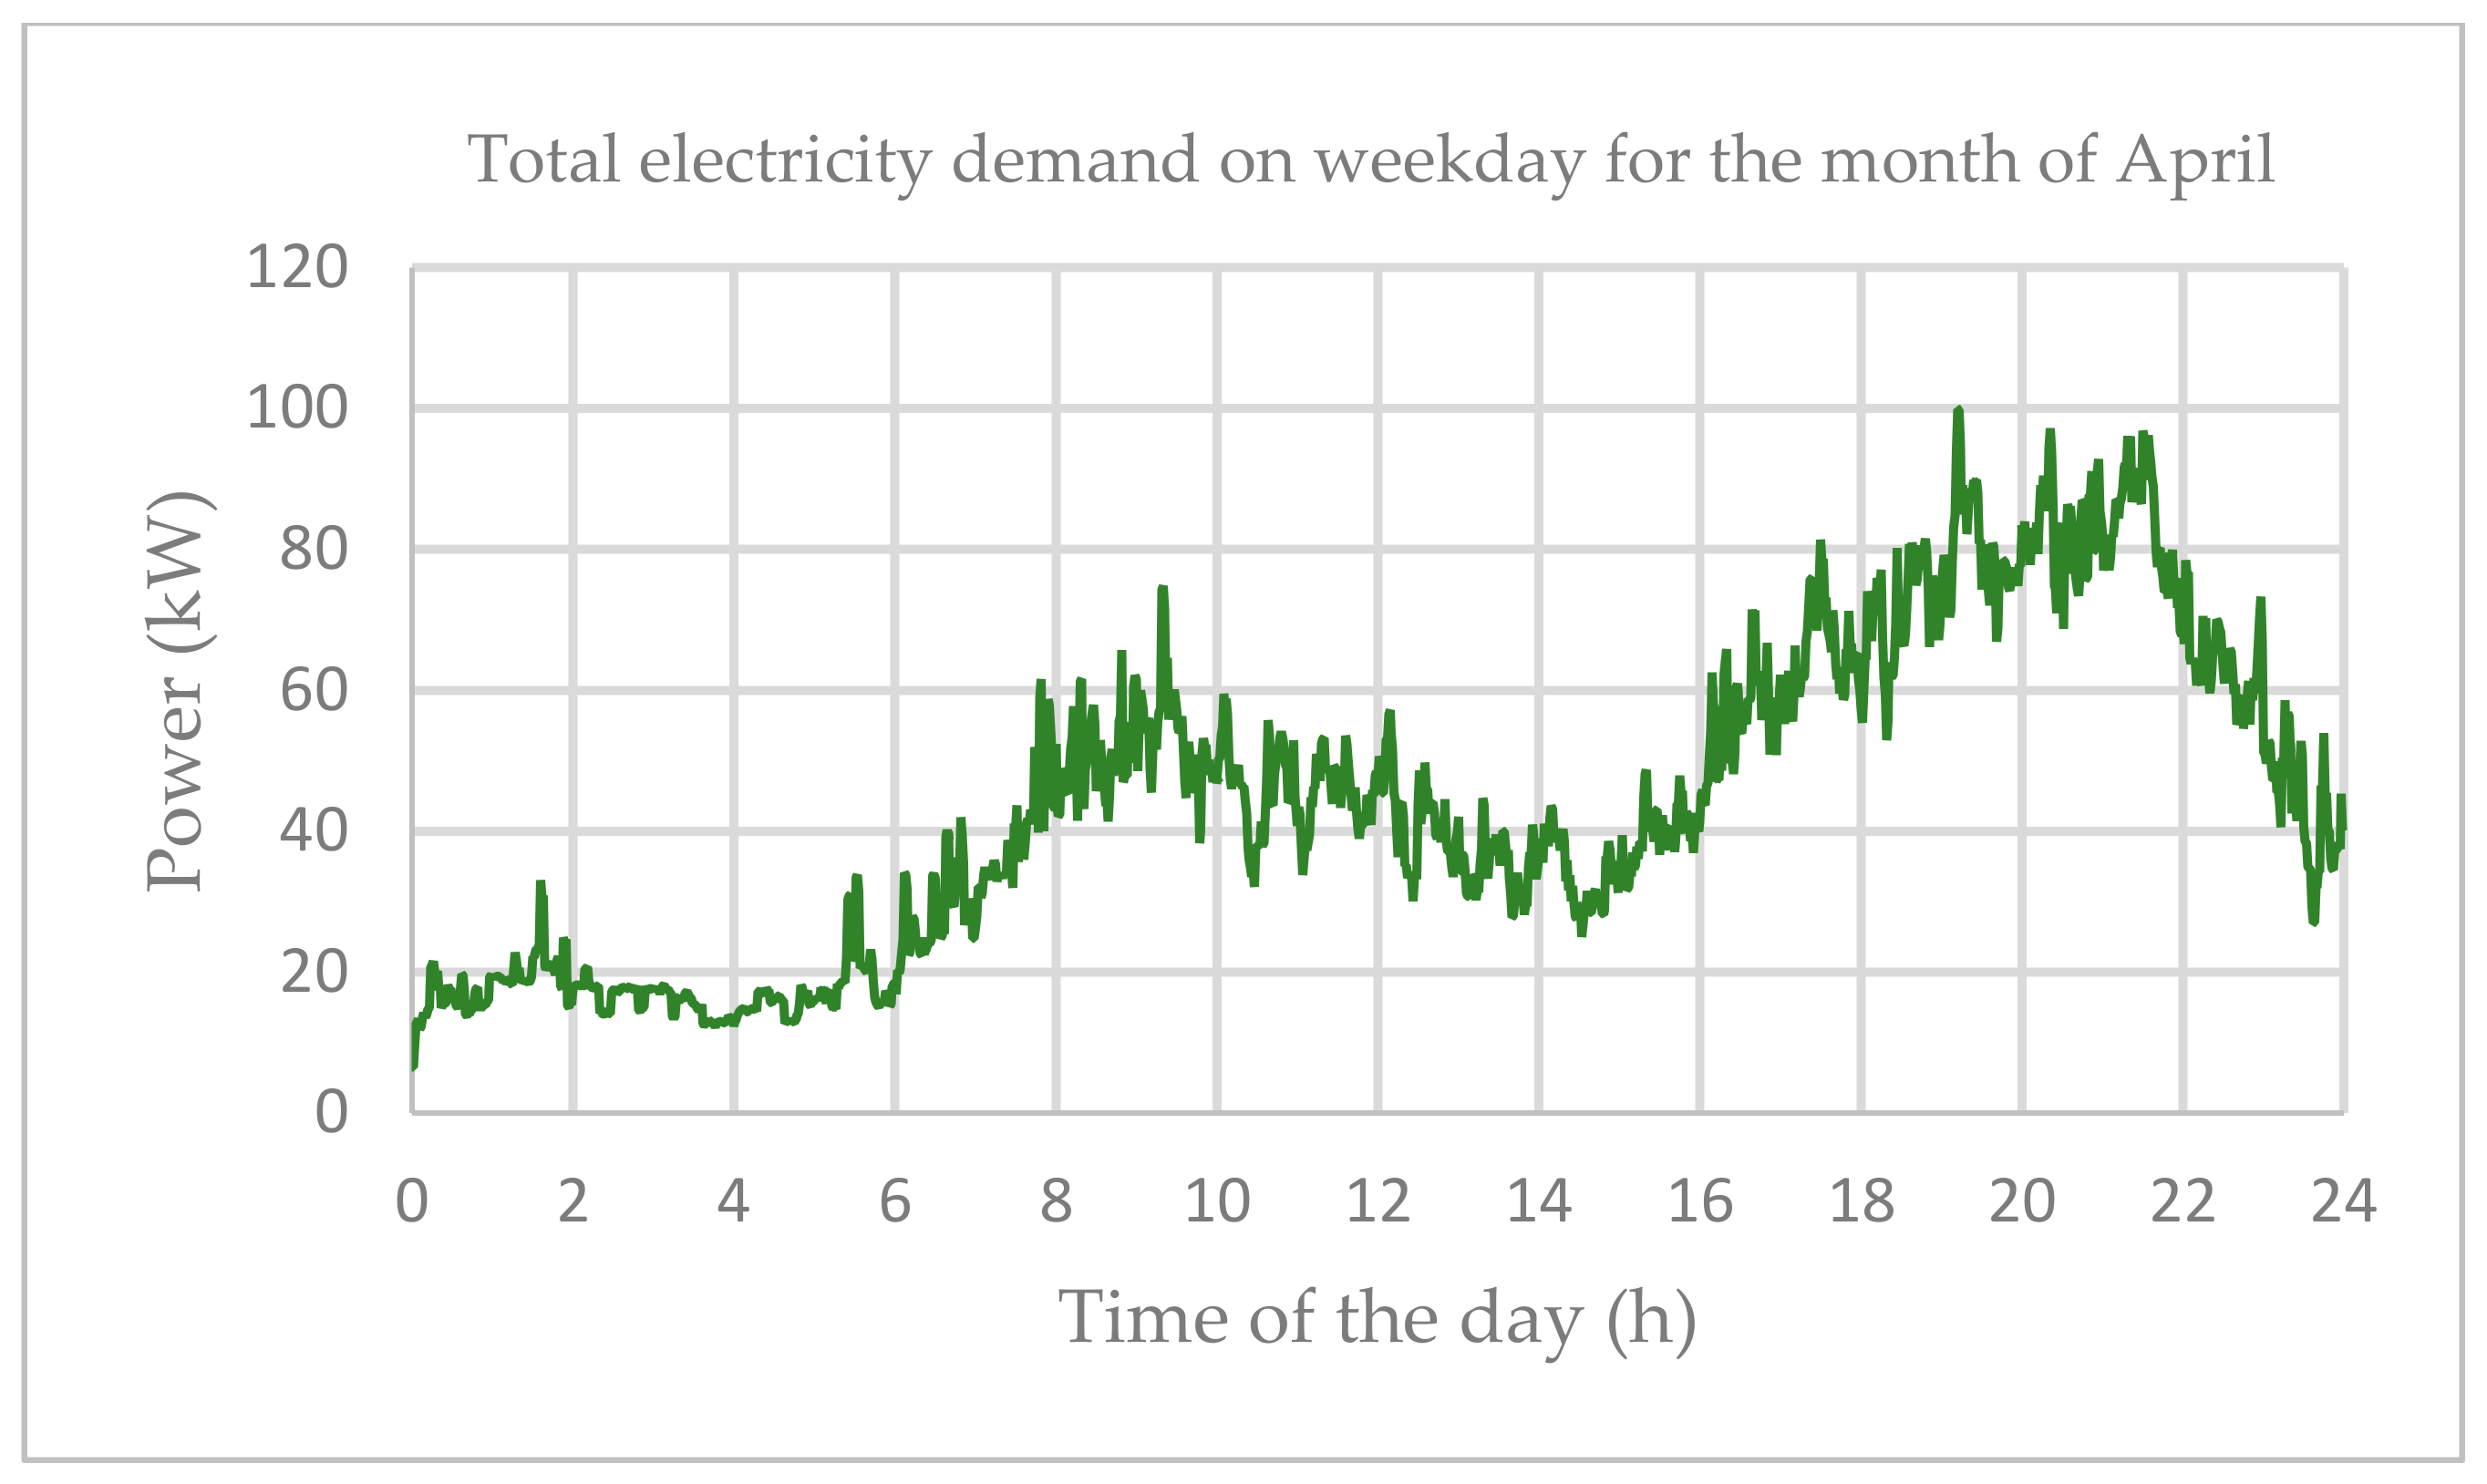
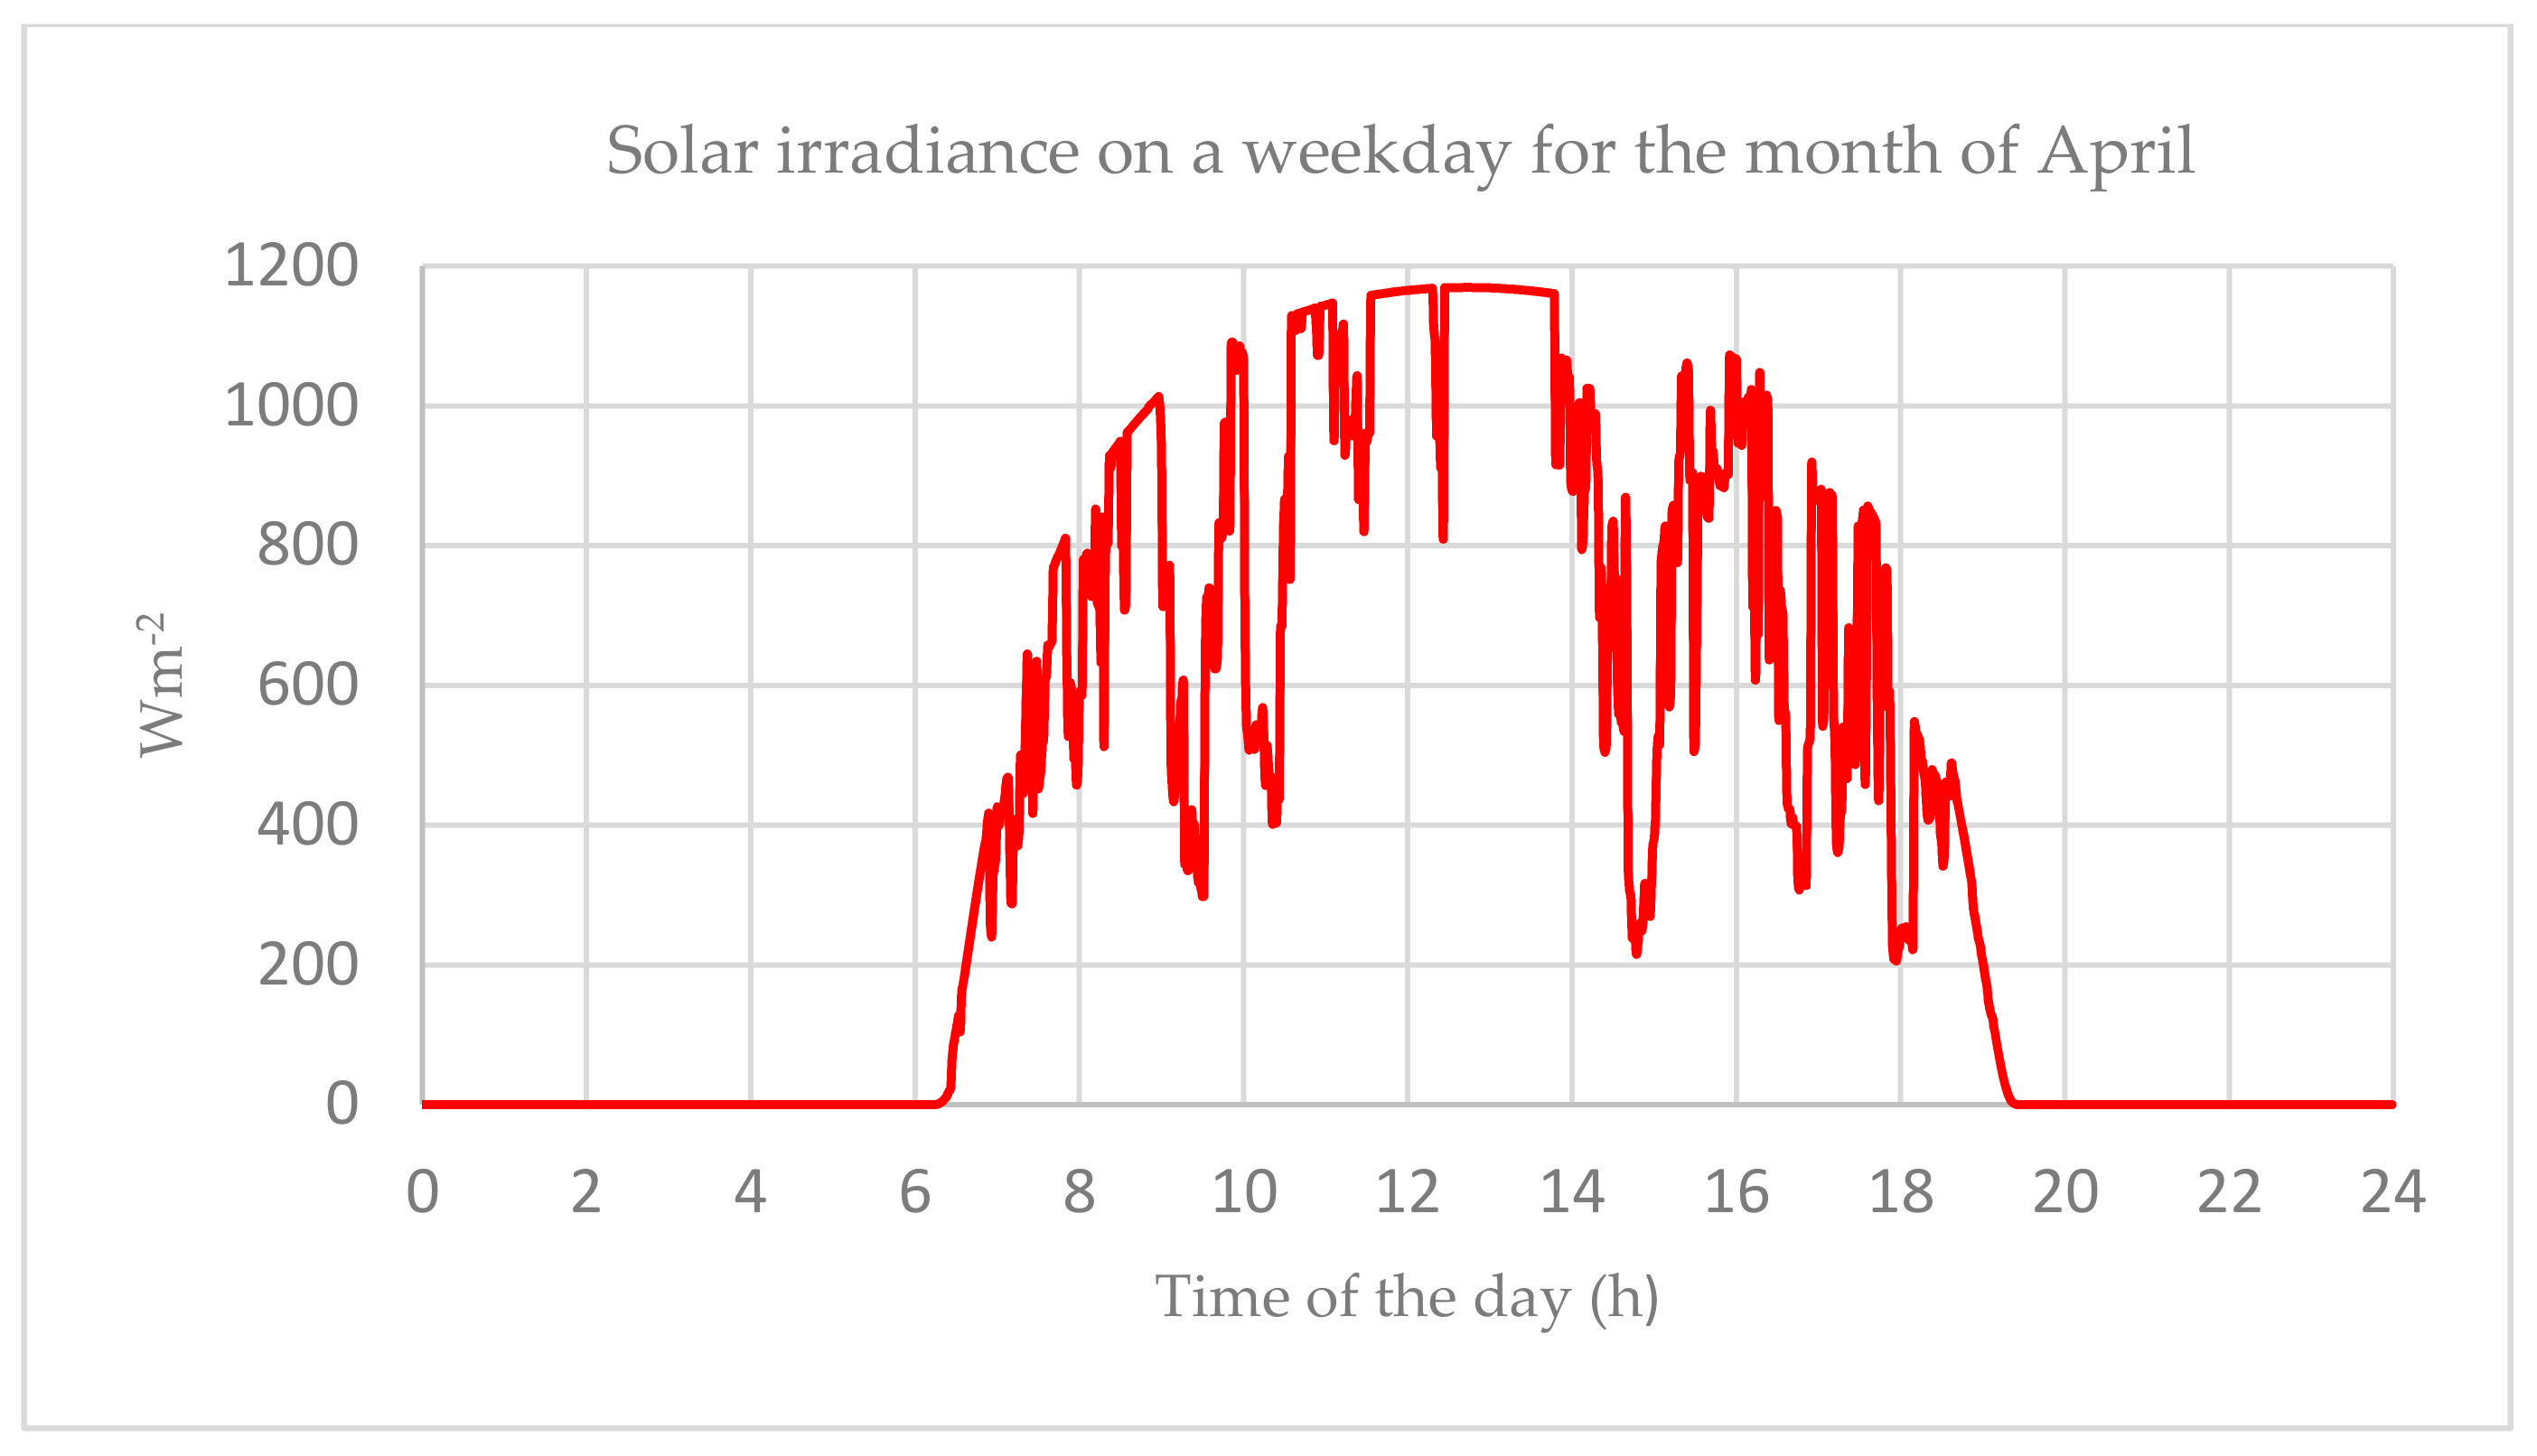
Figure 5 represents the load profile 1, the electricity demand is for 100 dwellings for the month of April on a weekday. The electricity consumption starts increasing from 6:00 to 10:00 with peak demand of 78 kW in the morning. During this time, the solar irradiance may not be enough for the PV system to meet this demand as there is significant dip in the irradiances between 9:00 to 10:00 due to cloud passing as shown in Figure 6.
The consumption trend shows that maximum electricity demand is between 16:00 and 21:00 and 6:00 to 10:00 and the PV output will certainly not be sufficient to meet load demand during various times of the day, particularly evenings.
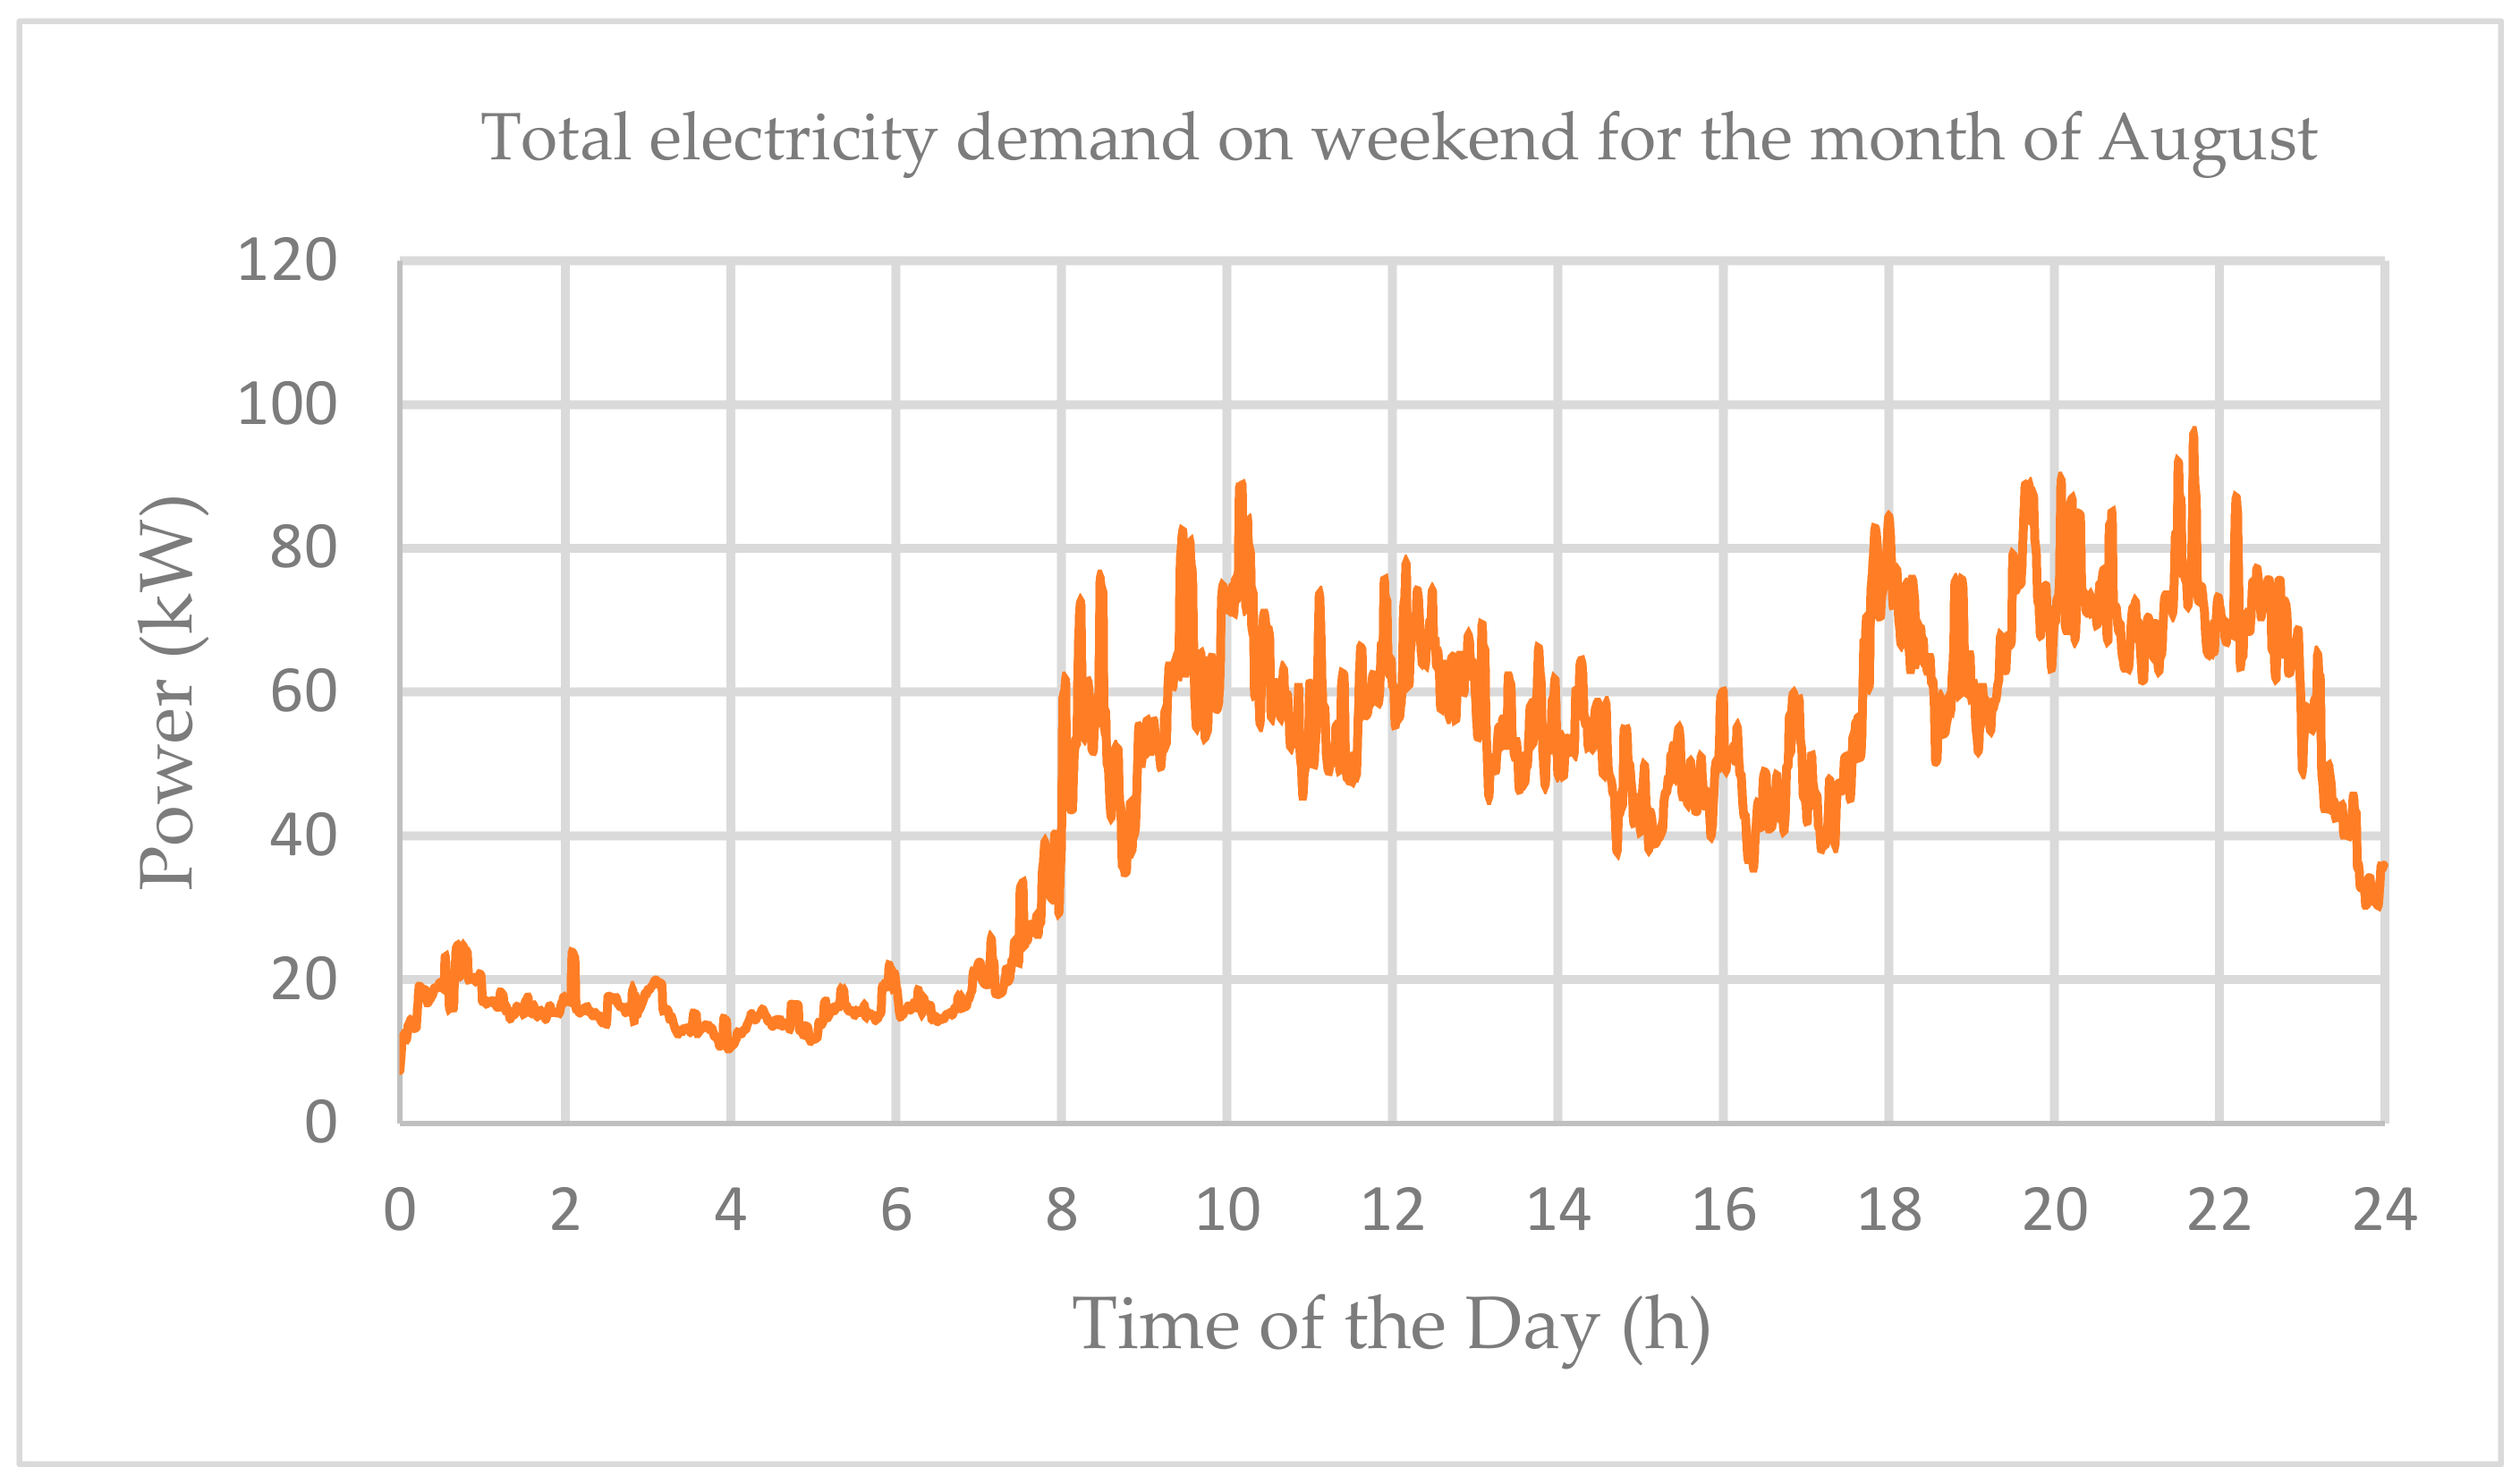
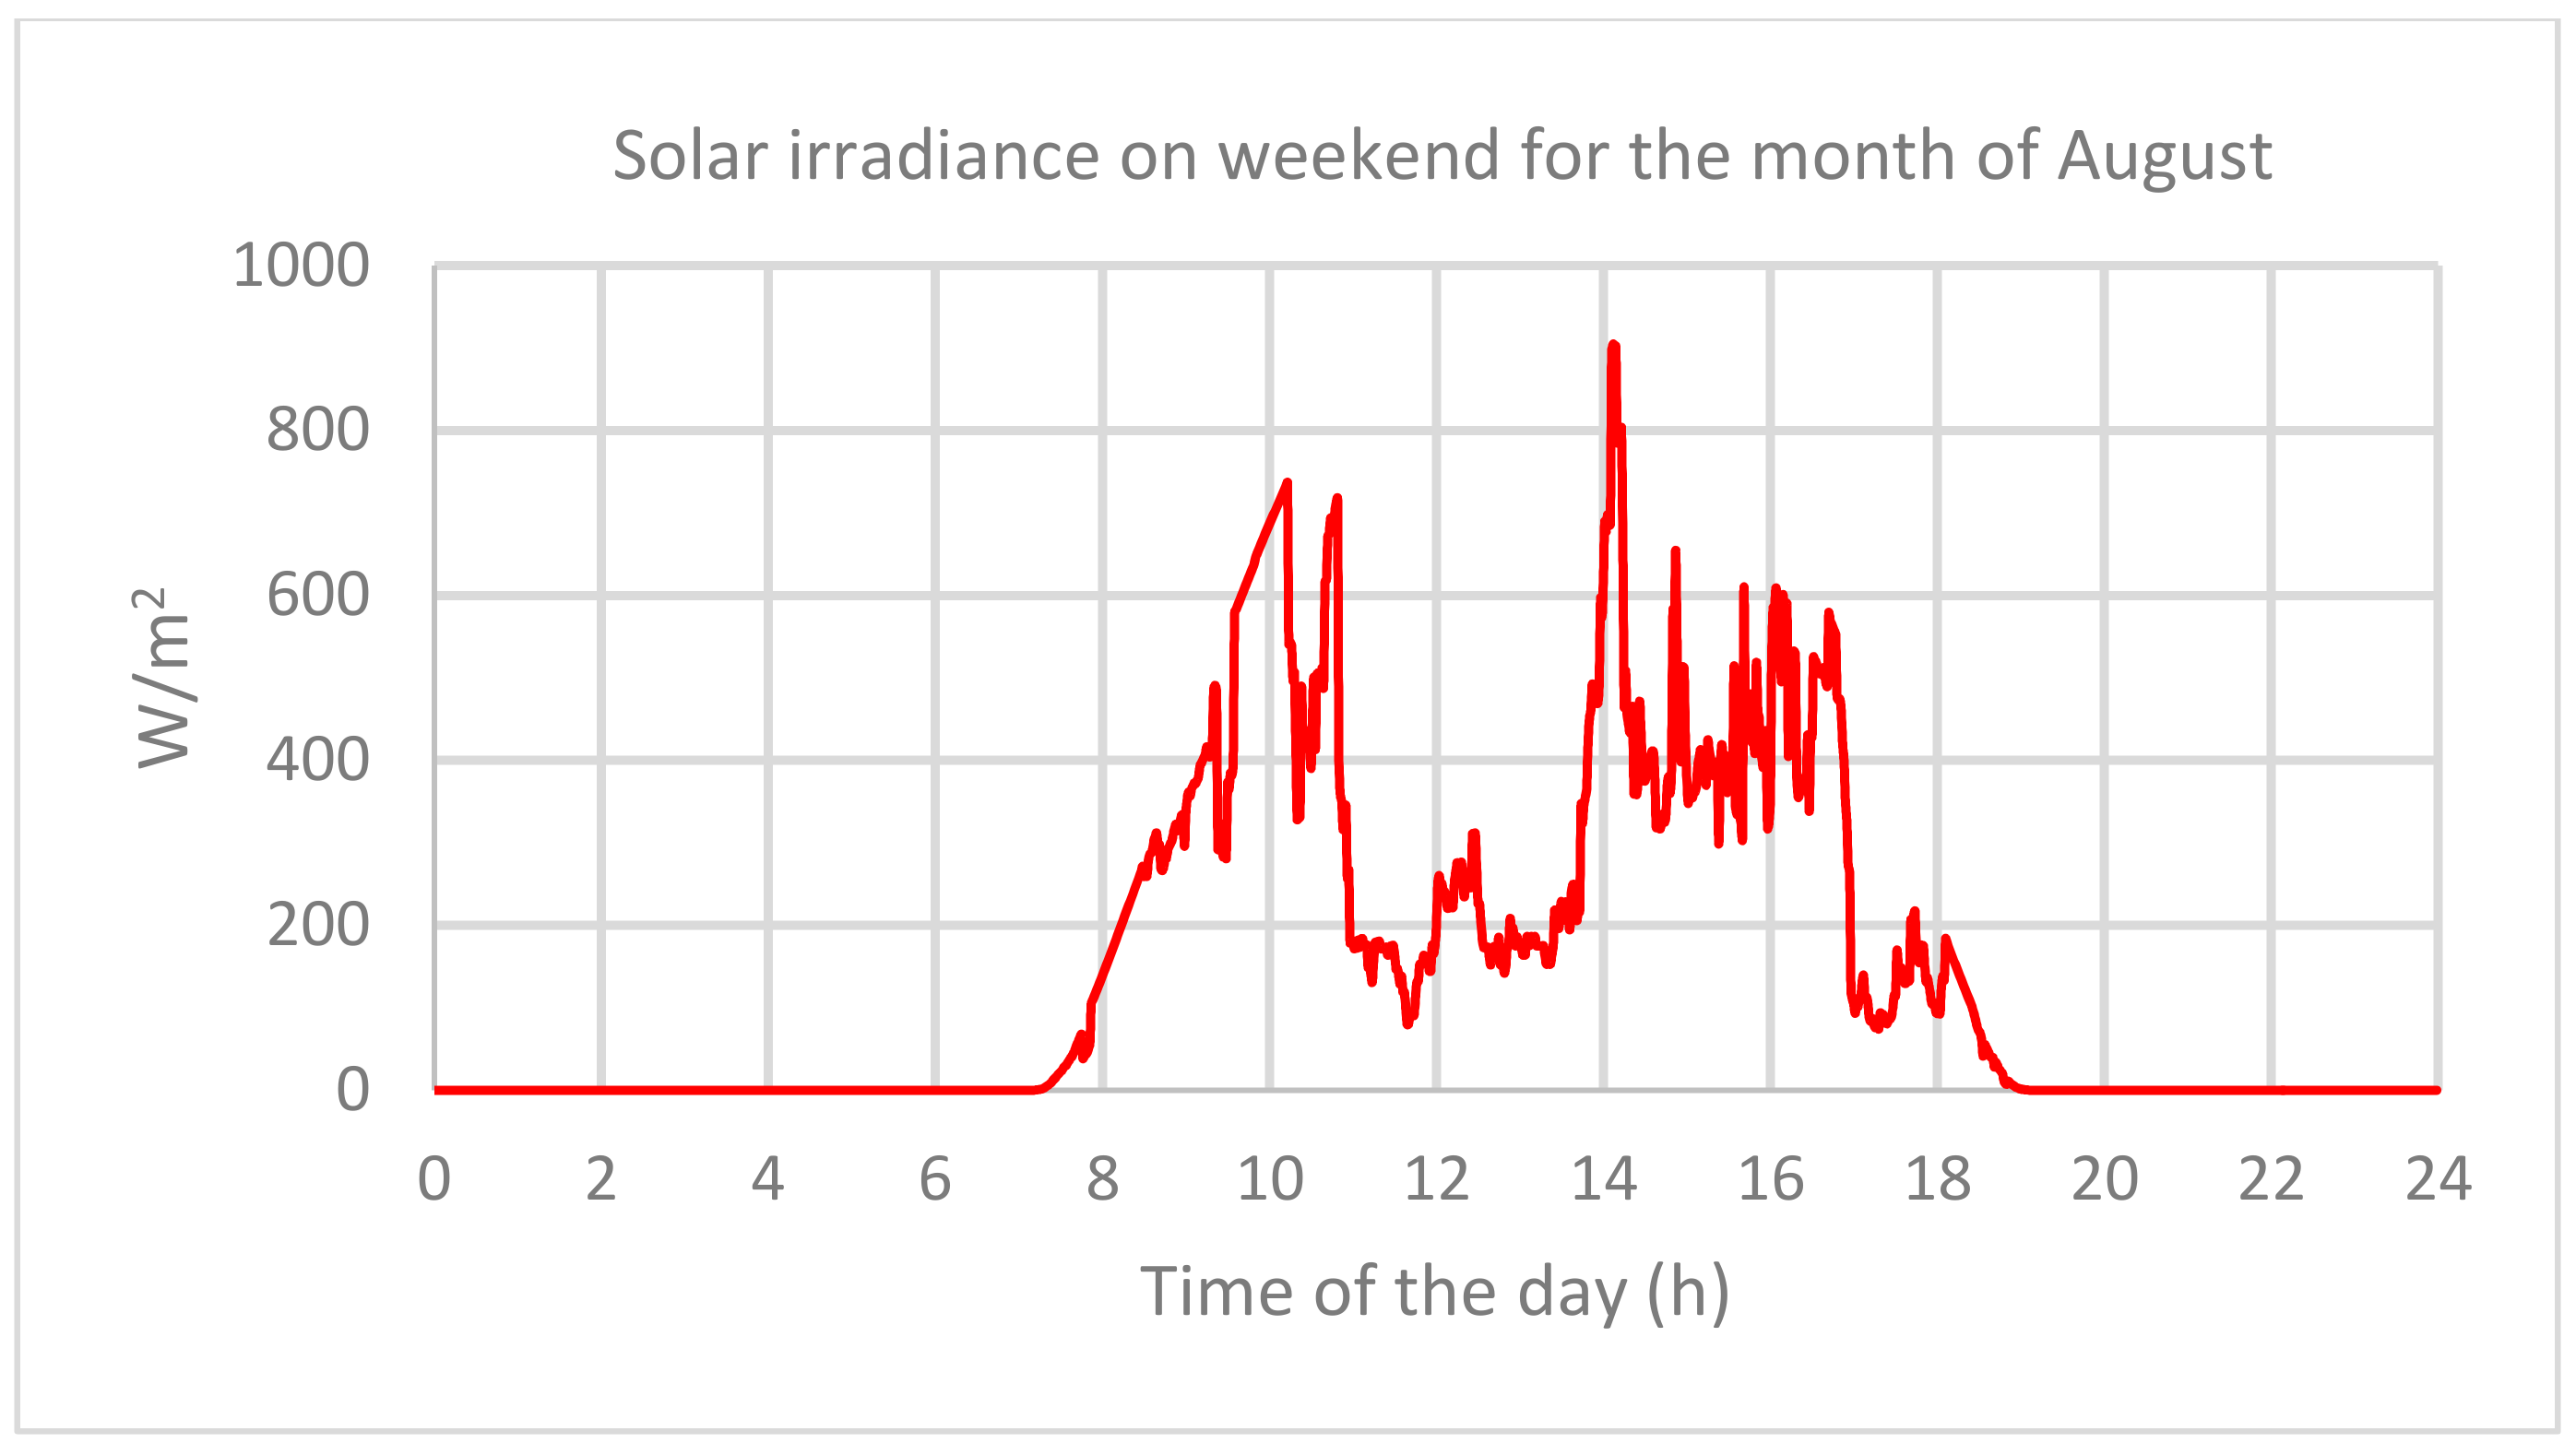
Figure 7 shows the load profile 2 for the month of August. It can be seen that electricity usage is very low from midnight until 6:00, it increases exponentially after 6:00 a.m. due to increased activity of habitants. The electricity consumption it remains high throughout the day except between 14:00 to 18:00 when dip in the consumption is seen. During the day, the PV system is not receiving a sufficient amount of solar irradiance. Therefore, the PV system produces less power during the day and can provide insufficient power to charge the flywheel. Depending on its percentage state of charge (%SoC), it will be a major challenge for the flywheel to shave off the peak demand and reduce fuel consumption of DGen to satisfy the load demand. Figure 8 represents the solar irradiance for load profile 2, From 11:00 to 14:00 there is significant dip in the irradiance due to cloud passing, comparing the load demand during this time it will be challenging for PV to meet the load demand alone.
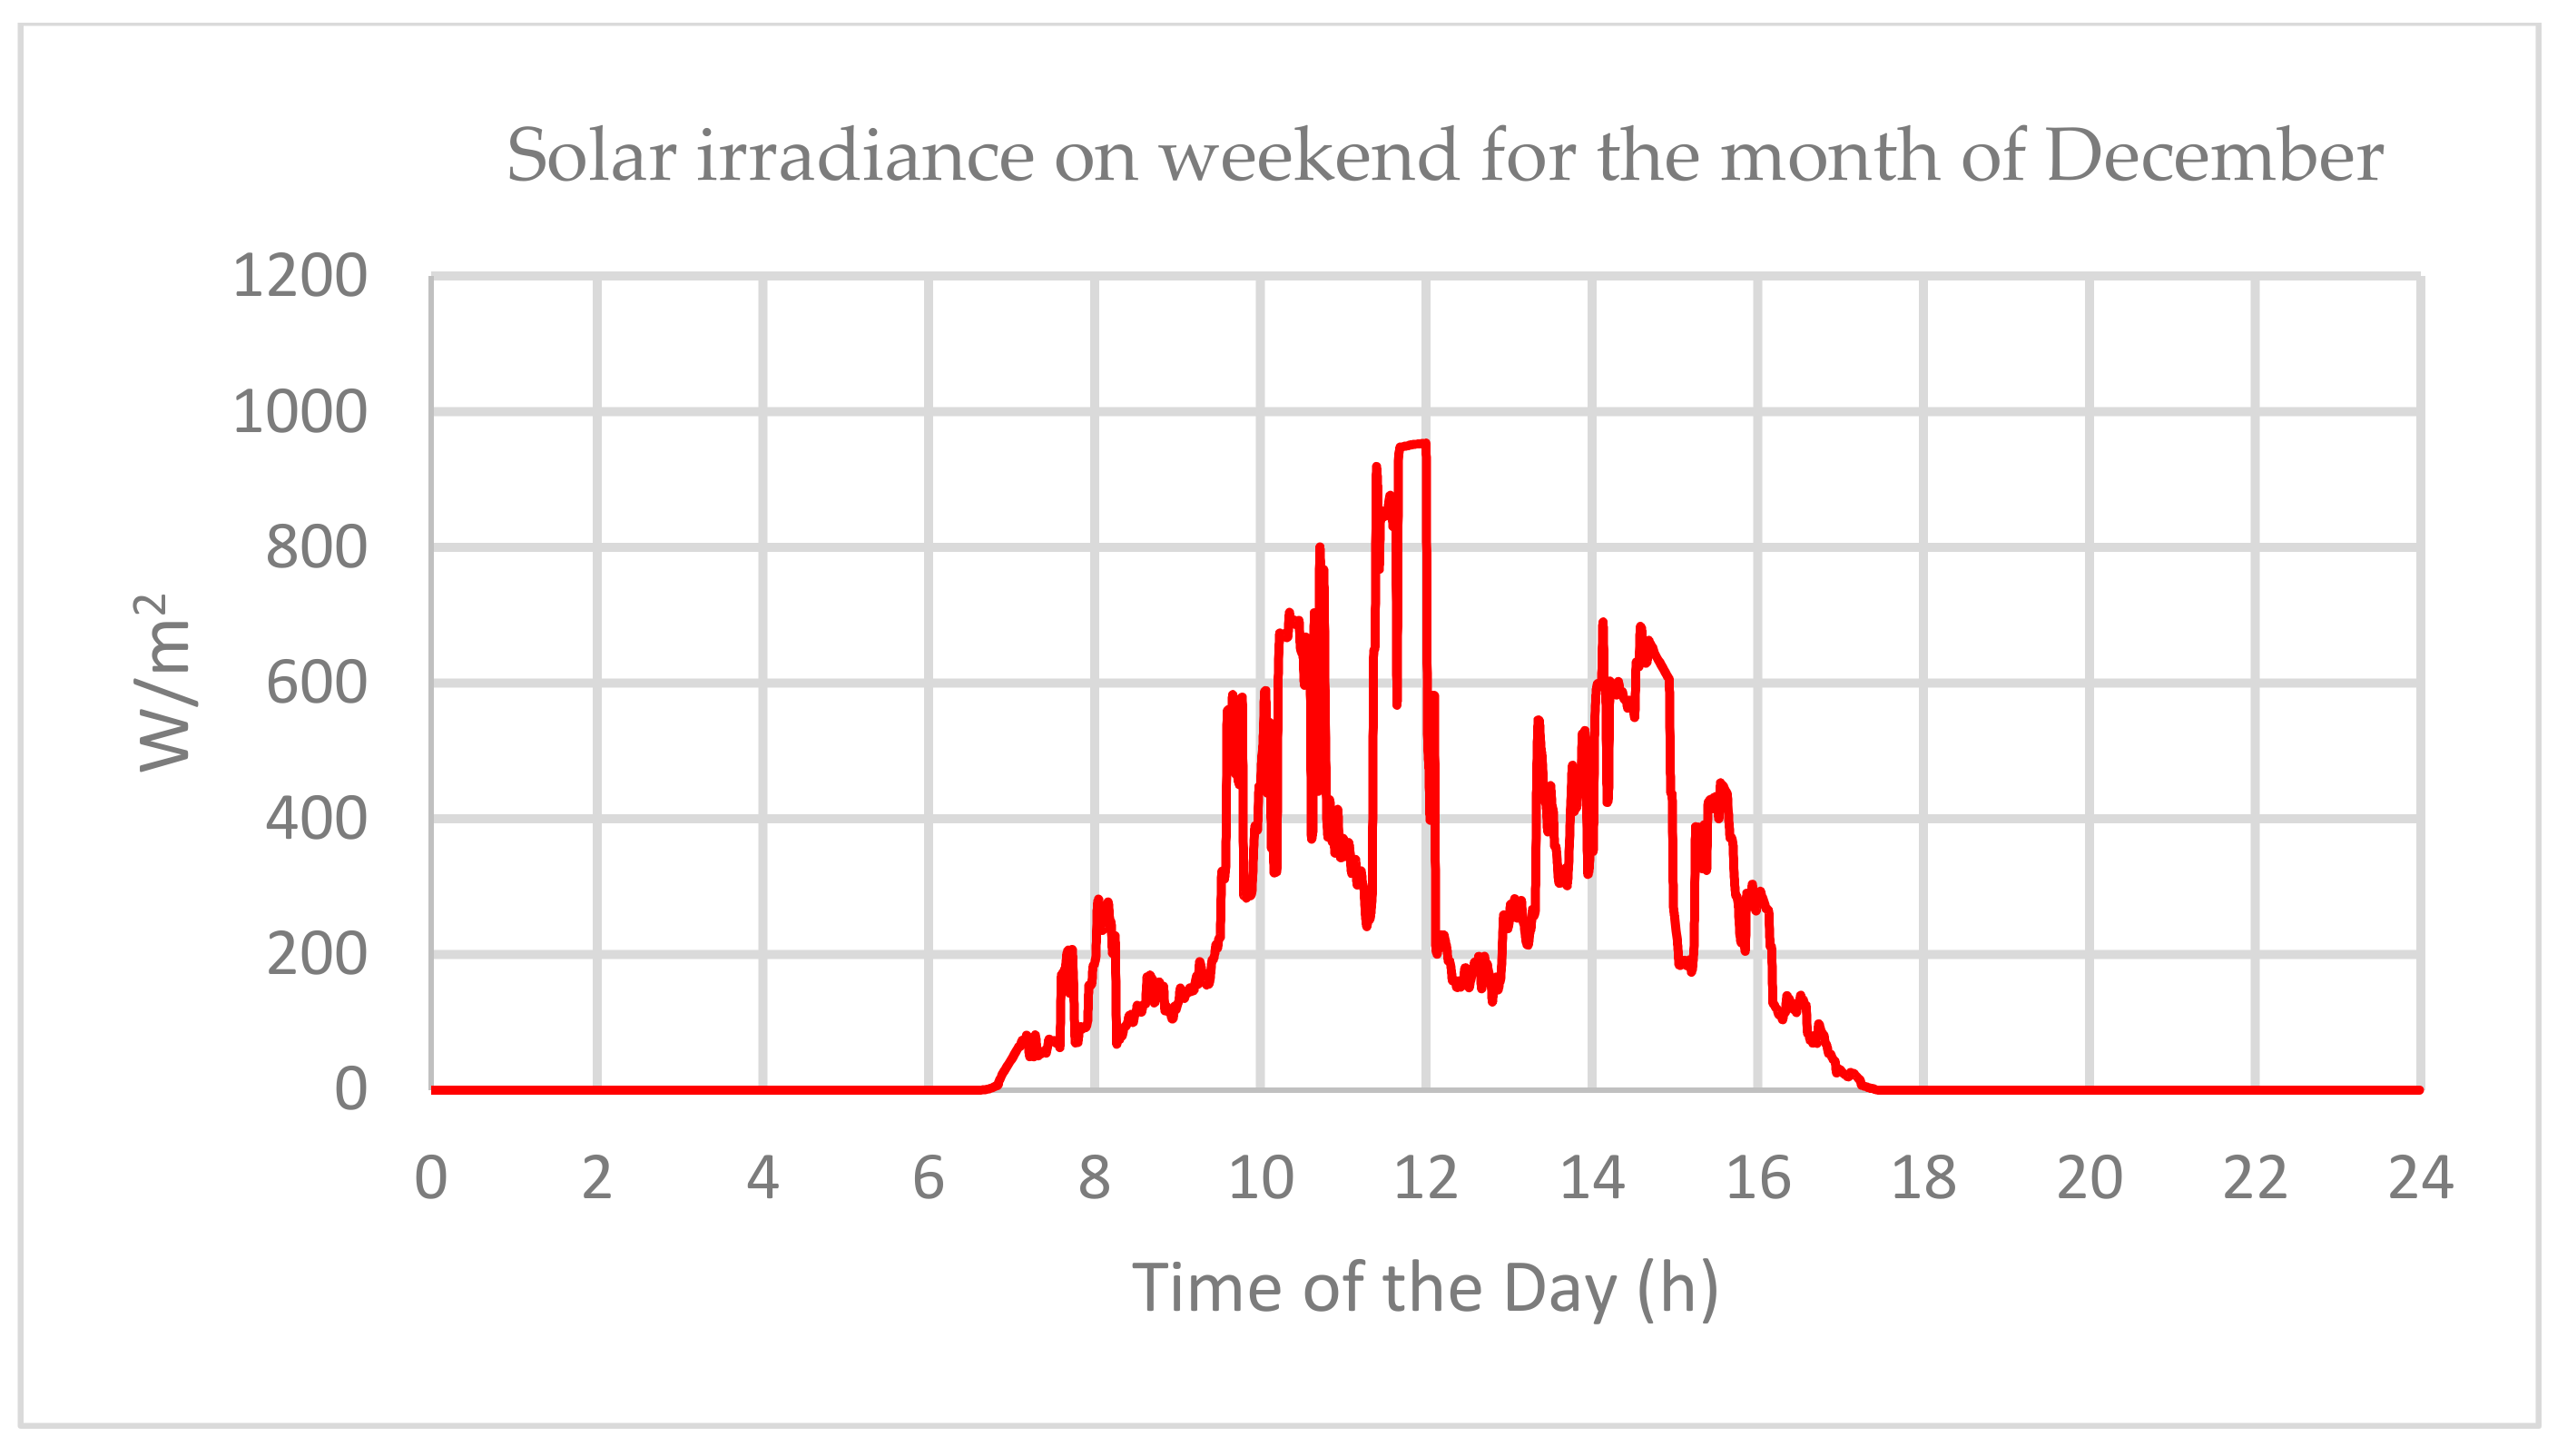
Figure 9 presents load profile 3 for the month of December on weekend. The electricity consumption is high during morning between 9:00 to 11:00 (85 kW) and during evening between 18:00 to 22:00 (98 kW). The load demand has some random peaks and dips during the day. The solar irradiance corresponding to the load demand on weekend is shown in Figure 10, it can be seen that before 7:00 in the morning and after 17:00 in the evening there is no sun and PV cannot meet the load demand. During these periods of time, the DGen and FESS can play their roles keeping the system stable by satisfying the load demand at all instances. It can also be seen the solar irradiance is fluctuation during entire day. The peak solar irradiance appears for barely 30 min. between 11:00 and 12:00.
The solar irradiance model of load profile 1 represents the clear/sunny day with some fluctuations, in this case surplus energy from PV system can be available to charge the flywheel, whereas the solar irradiance in case of load profile 2 and 3 present cloudy days with very less irradiance and substantial fluctuations. These examples will show the dynamic response of the FESS in different weather conditions throughout the year.
4. Methodology
The PVHMS presented in this paper is standalone model consisted of diesel engine, PV system and the flywheel energy storage system. The PV system is interfaced to DC-link through DC-DC boost converter it extracts the maximum power from PV modules under all load conditions. The DGen and the residential load are connected to an AC bus. The power flow from AC bus to DC-link takes place through AC-DC bi-directional converter.
The output power of the PV system is proportional to input solar irradiance (W/m2). When photovoltaic power output reduces, MSC allows the FESS to provide the power back to DC bus. In the load profiles presented above (Figure 6, Figure 8 and Figure 10), output of the PV system is zero because of the zero-input solar irradiance from 00:00 in the midnight till 6:00 in the morning. During this time there is very less total electricity demand due to less activities in the dwellings. Therefore, at nighttime, the DGen can be used to meet the load demand and charge the flywheel. The DGen will only operate until flywheel is charged enough to meet the load demand or the PV system generates enough power compared to the electricity consumption. During the day when there is maximum solar irradiance and the PV produces more power than the residential load power, the excess power can be used to charge the flywheel in order to store the kinetic energy. The stored energy can be converted into the electrical energy which can be used to feed the residential load when the power generated by PV system is not sufficient. Figure 11 shows the concept map of the proposed logic control scheme studied in this paper.
The stable operation of the PVHMS is achieved by reliable coordination of the DGen, the FESS and the PV system. The flywheel is assumed to be charged 50% initially. The logic control scheme compares the %SoC of the flywheel with the difference of load demand and the PV output power. When PV output is not enough to meet load demand and the FESS is charged enough then power is provided by discharging the FESS. When FESS discharges to 0% and PV output is still not able to meet the load demand then the DGen is turned on to ensure continuity of power flow in the system in order to keep the system stable and running. For simulation purpose, data models of solar irradiance (Figure 6, Figure 8 and Figure 10) are selected based on difficult effect of cloud passing which will test the dynamic response of the flywheel to intermittent nature of PV output. The continuous fluctuations in selected range of data model will justify the use of flywheel for the applications requiring more charge-discharge cycles with unaffected performance unlike batteries. The selected time rages of the data models (load profiles) will also test the response of the islanded model when there is no power available from renewable source (PV) in case of zero solar irradiance irrespective of the load demand. During the night time from 12:00 p.m. to 7 a.m. (when PV power is zero) the load demand is low due to less activity of the habitant during this time more power can be directed to charge the flywheel from DGen. Conversely during the evening time (after 6 p.m.) the load demand is high due to increased occupancy and activities in the dwellings. During this time the flywheel can share the power demand with diesel generator or it may alone meet the maximum load demand depending on it %SoC.
5. Results and Analysis
In this section the simulated results of PVHM model integrated with residential load are analyzed. The dynamic behavior of the system and power exchange between different power sources (FESS, DGen and PV) is studied. The performance of the system for load profiles of different patterns is tested by analyzing power outputs of the DGen, the FESS and solar PV system.
In order to analyze the role of the FESS in the model, first, the operation of DGen and solar PV is analyzed without the FESS while supplying the load. This is helpful in allowing calculation of fuel consumption and amount of CO2 emissions produced due to running of DGen. In order to ensure stability of the system, the DGen must be operated all the time since the PV power can fall away at any time with cloud passing and if the DGen was every switched off, it would take several seconds to start up and come back on line.
5.1. Islanded Operation without Flywheel Energy Storage
In this operation scenario, the electrical demand of the residential load is supplied by the DGen and solar PV system only. The maximum output power of the PV system is approximately 90 kW, the electrical demand greater than maximum PV output power is supplied by the DGen. The DGen is designed for a maximum power of 100 kW in order to meet the peak demand. In case of excess power in the system, when load demand is less than PV output then excess power generated by the PV system is dissipated in the dump load to keep the system voltage and frequency stable. The results of the simulation are described in the following section.
5.1.1. Load Profile 1
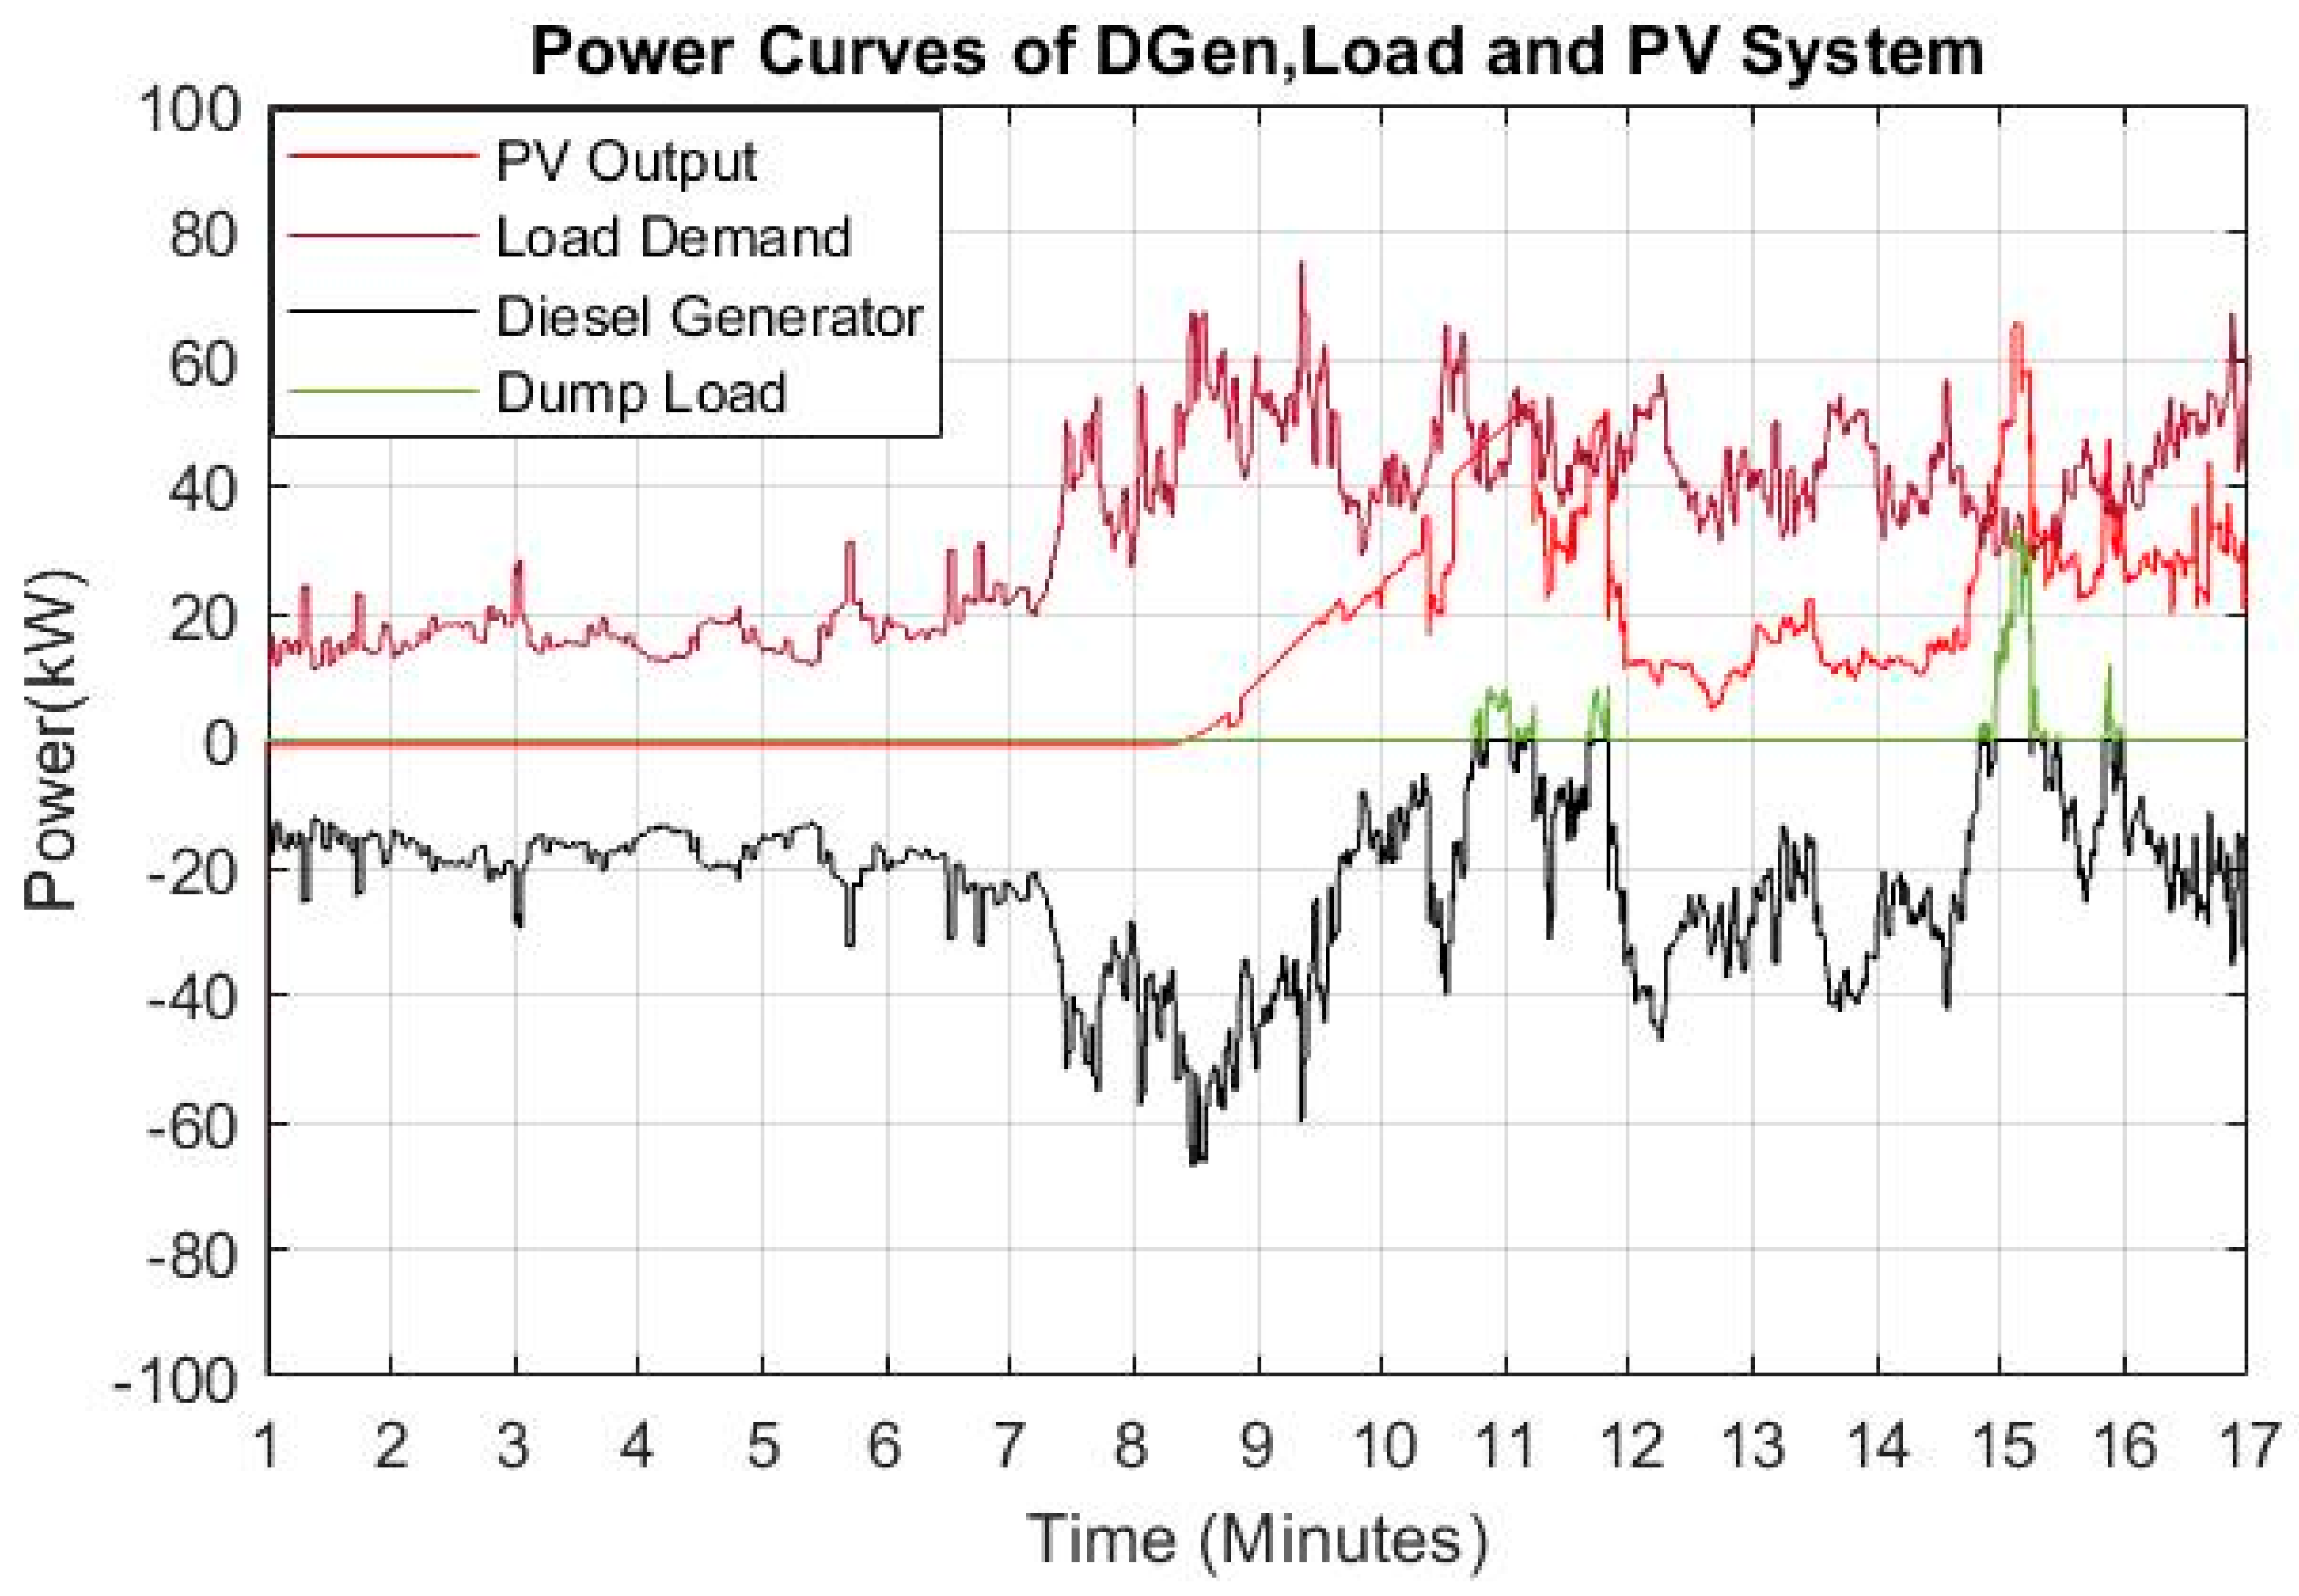
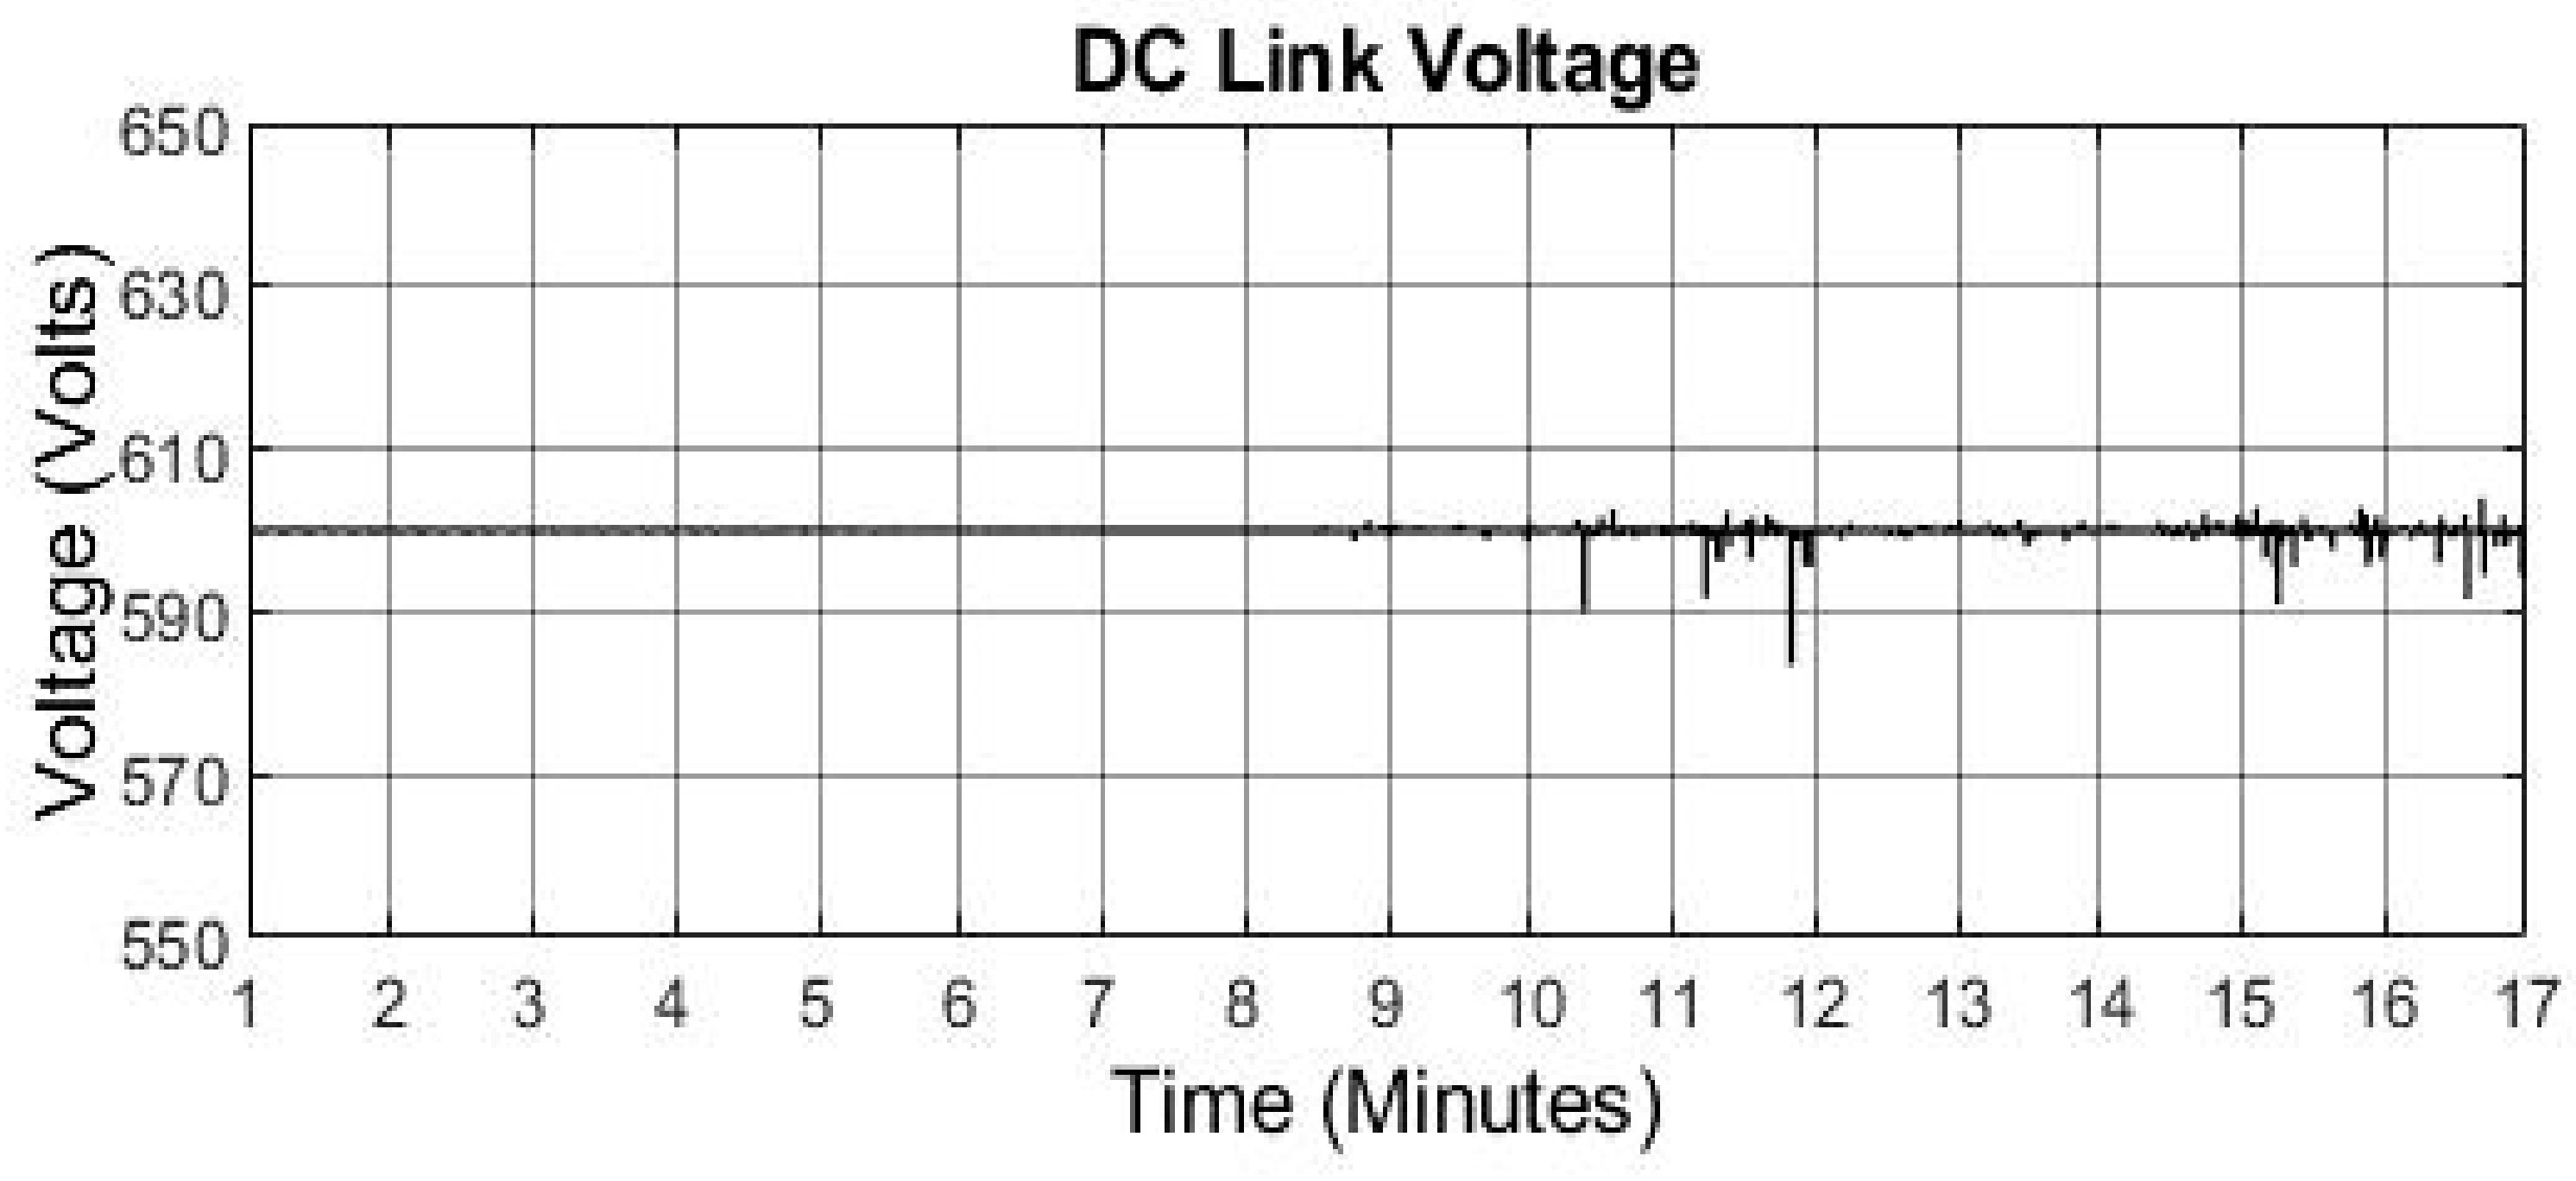
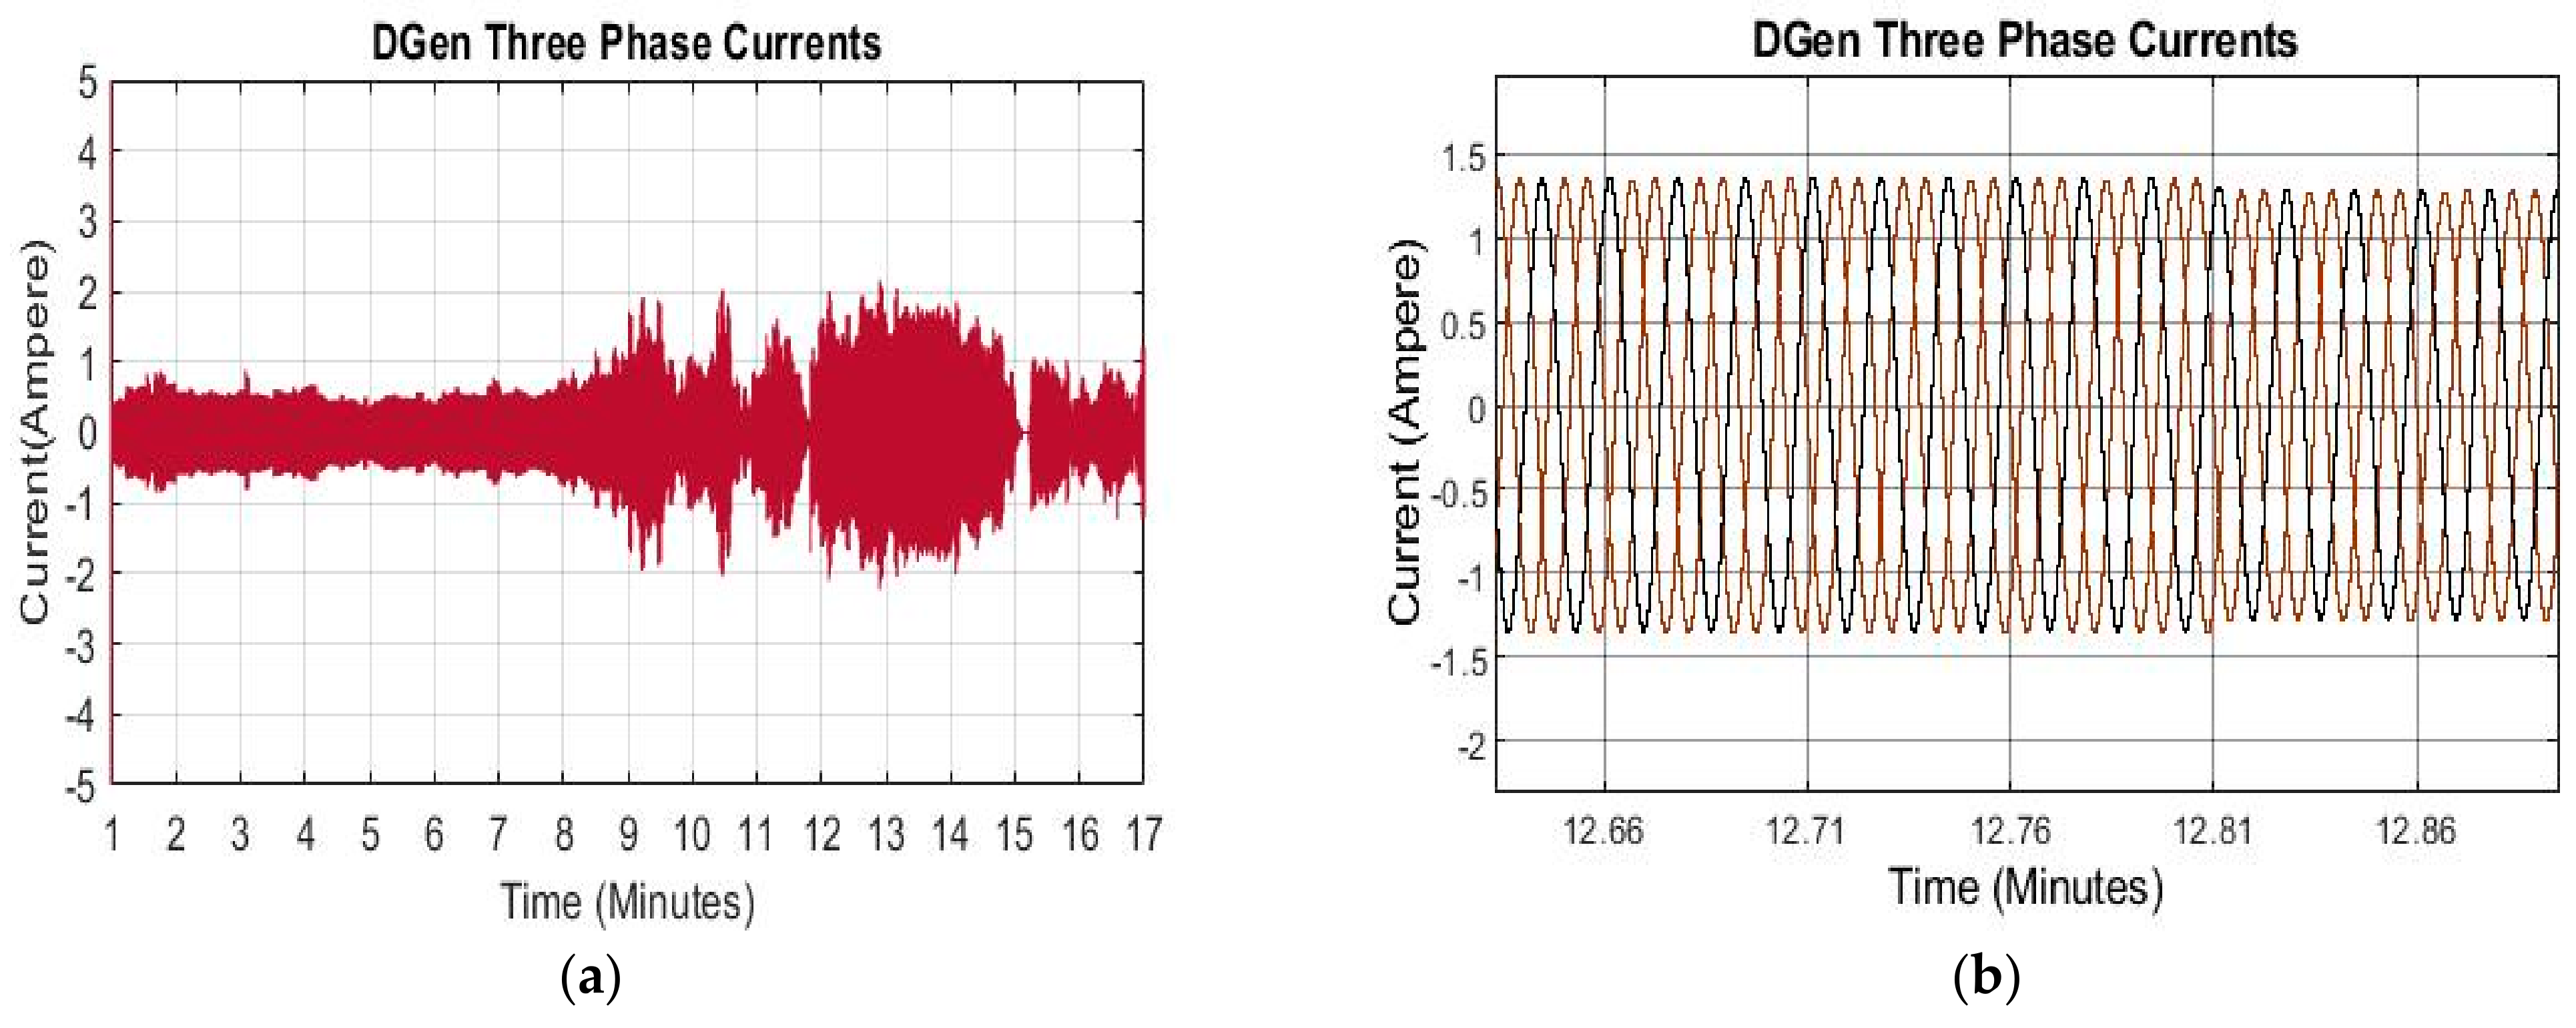
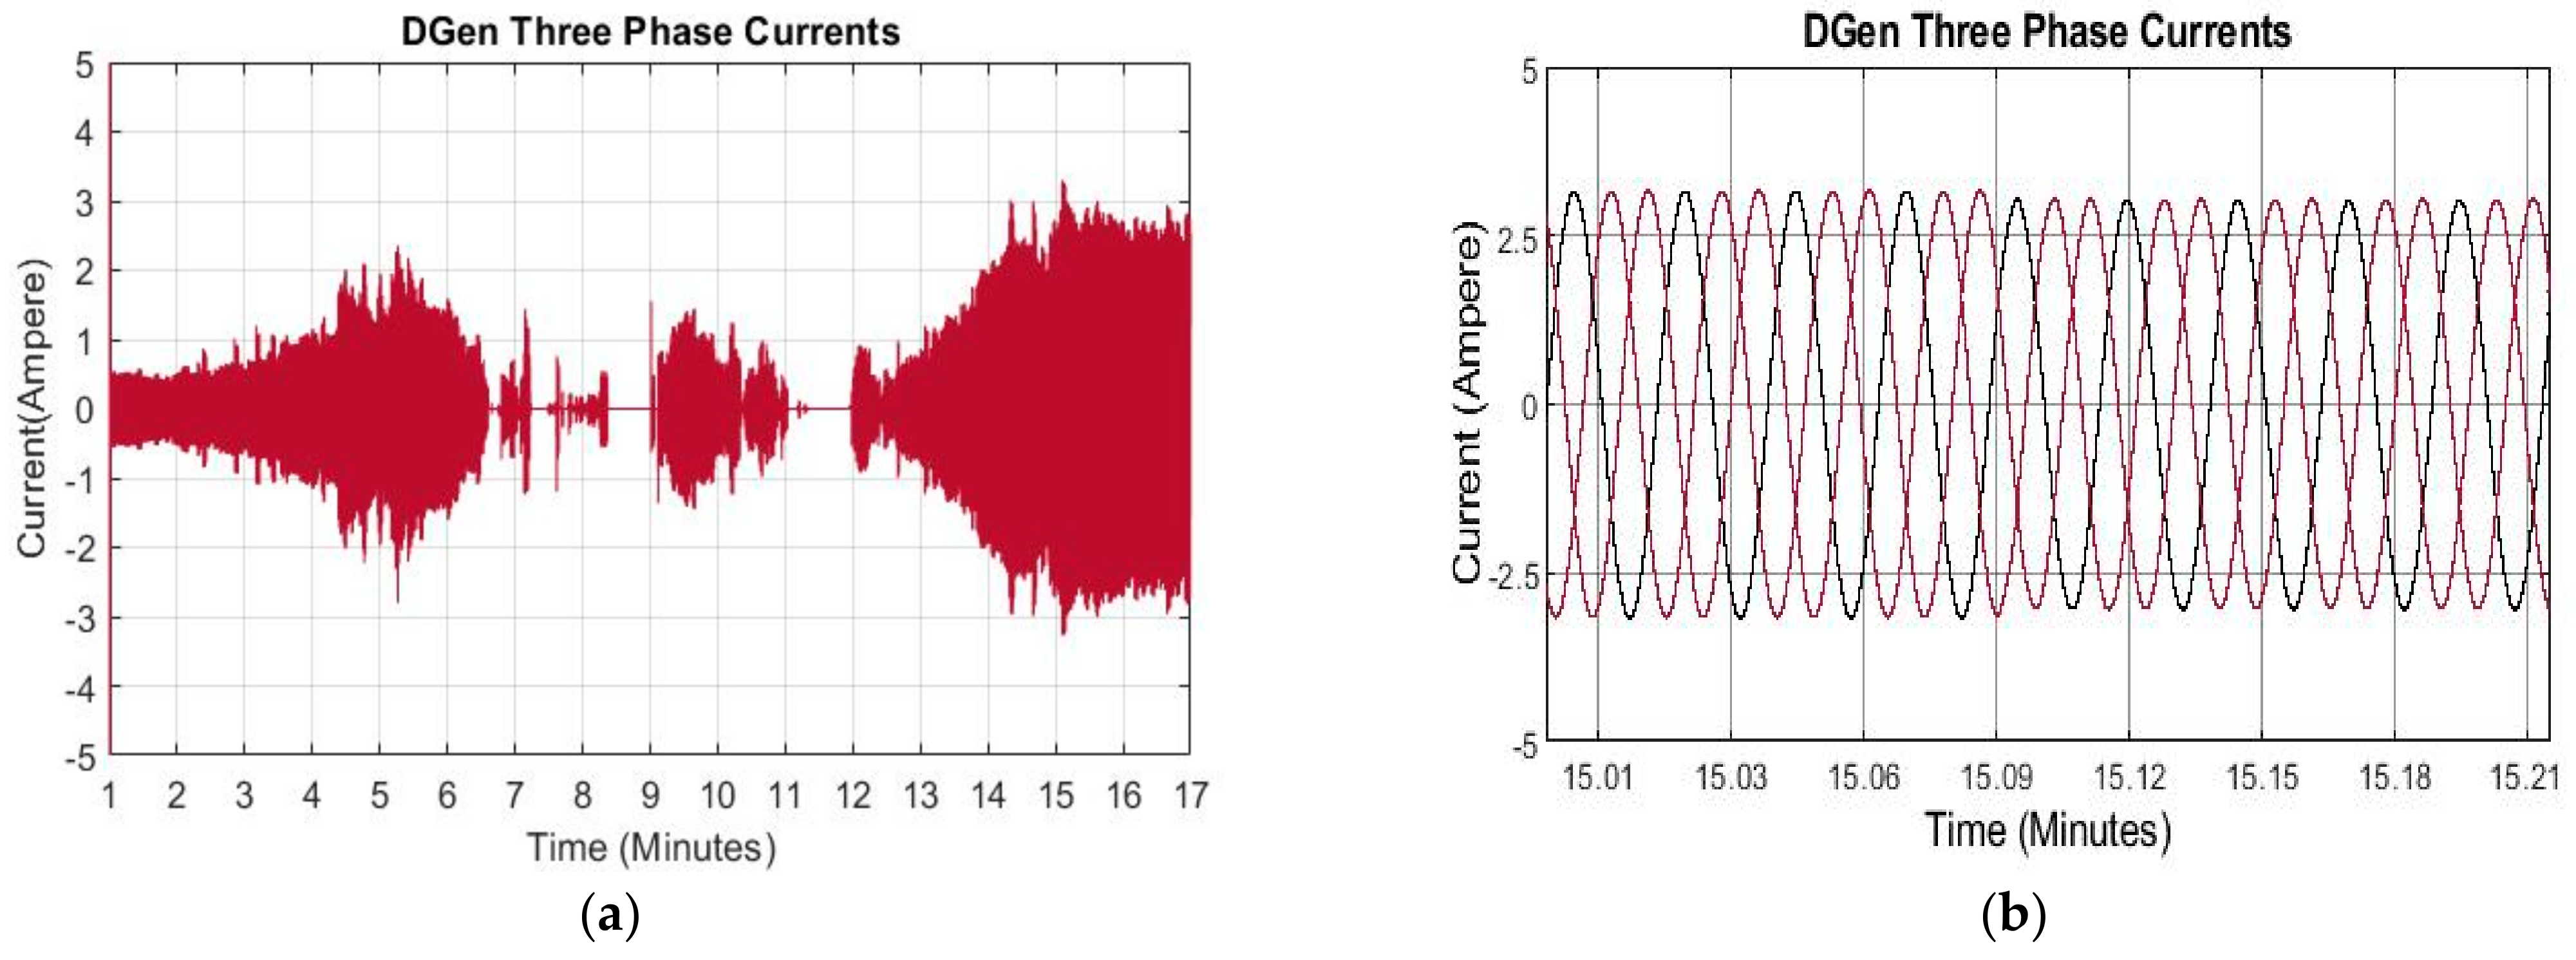
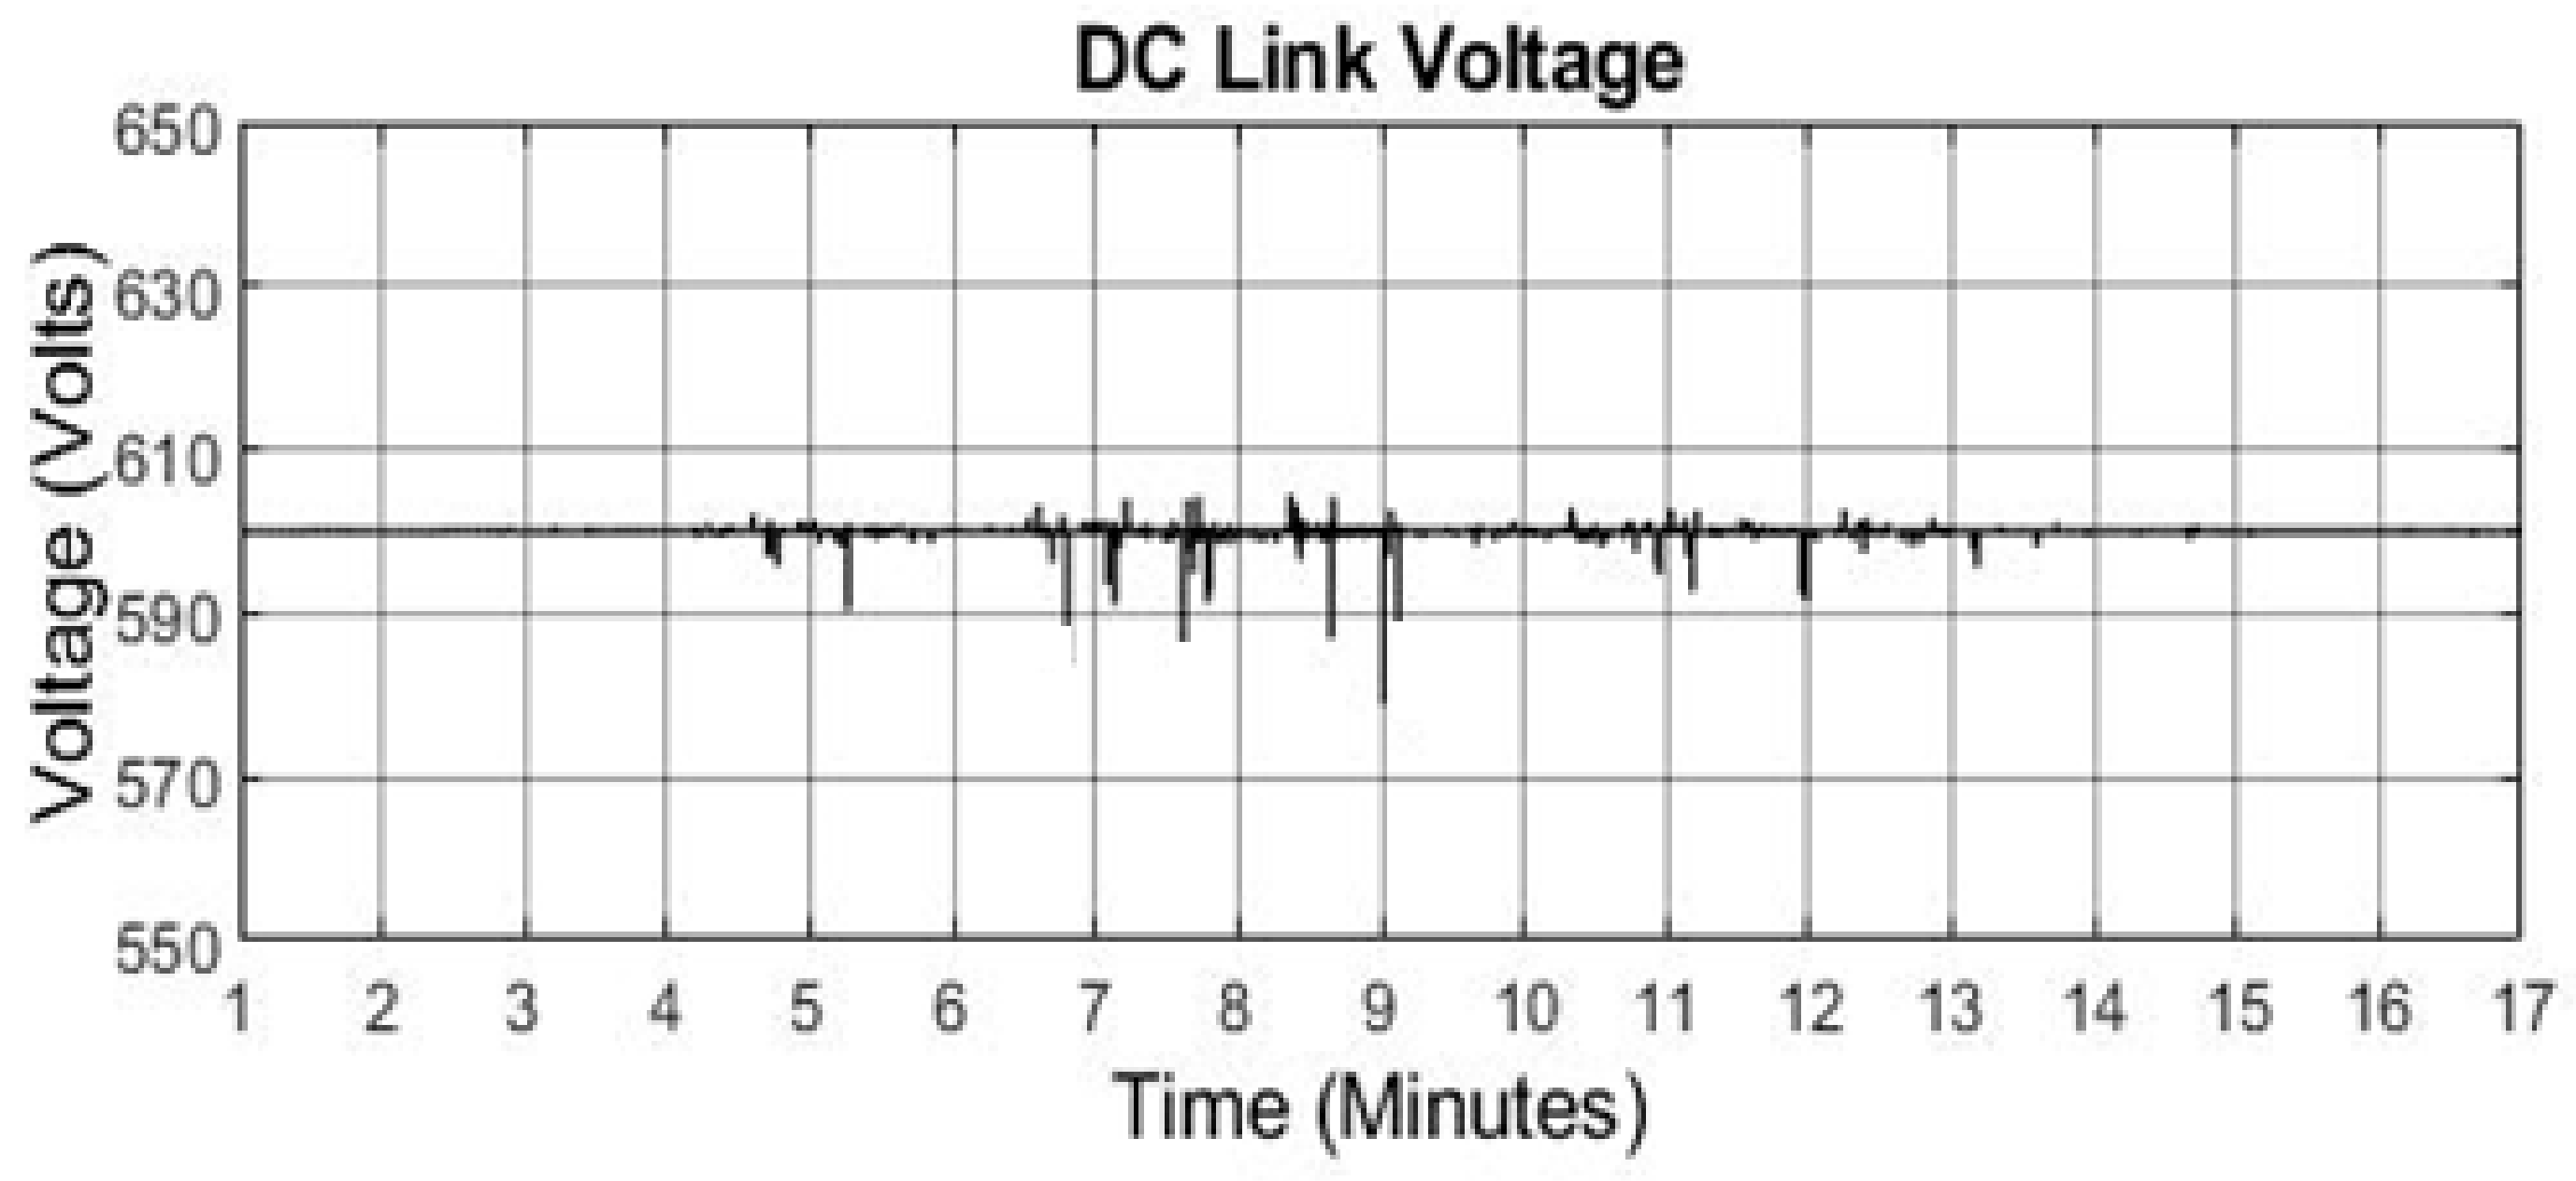
Figure 12 shows the power curves of the load demand, DGen and PV system. The load profile 1 is simulated for 19 min. The portion of the load profile is selected for the time when surplus energy from PV system will be available due higher solar irradiance (Figure 6). Surplus energy can be sore in the flywheel and can be converted back to share the load demand with PV. It can be seen that the load demand is not significant within the period 1–2.5 min and here, PV output is zero. However, the DGen must be on providing power. The maximum power generated by PV system occurs in the period 6.5–10 min, at this time the load demand is less than the PV. Therefore, the excess power generated by PV system is dissipated in the dump load and during this time the DGen remains off. After 12.5 min the PV output starts to decrease and the load demand is increasing therefore the PV system struggles to meet the load demand and generator is turned on. The maximum demand of 100 kW appears after 15 min when PV output is zero due to no solar irradiance during and the maximum demand is also supplied by the DGen. The system operates stably for 19 min which can be seen from stable DC link voltage in Figure 13. The spikes seen in the figure are due to switching effects of the power sources and power transfer between them. Figure 14 shows the three phase currents of the DGen during the 19 min time period, with a detailed view of the currents around a time of 18 min.
5.1.2. Load Profile 2
In this case the DGen is loaded for entire operation except for few minutes after 15 min when PV power output is slightly greater than the load demand and the excess power is dissipated into the dump load. In Figure 15, from 1 to 8.5 min, the PV output is zero and entire load demand is supplied by the DGen. Due to the less sunny day/cloud passing the power output of the PV system is fluctuating and it struggles to provide the load demand during entire operation. Figure 16 shows the DC link voltage for load profile 2, there are small spikes in the DC voltage which are not significant to affect the quality of DC link voltage. Figure 17 shows the current waveforms of DGen which conform with the output power of the generator.
5.1.3. Load Profile 3
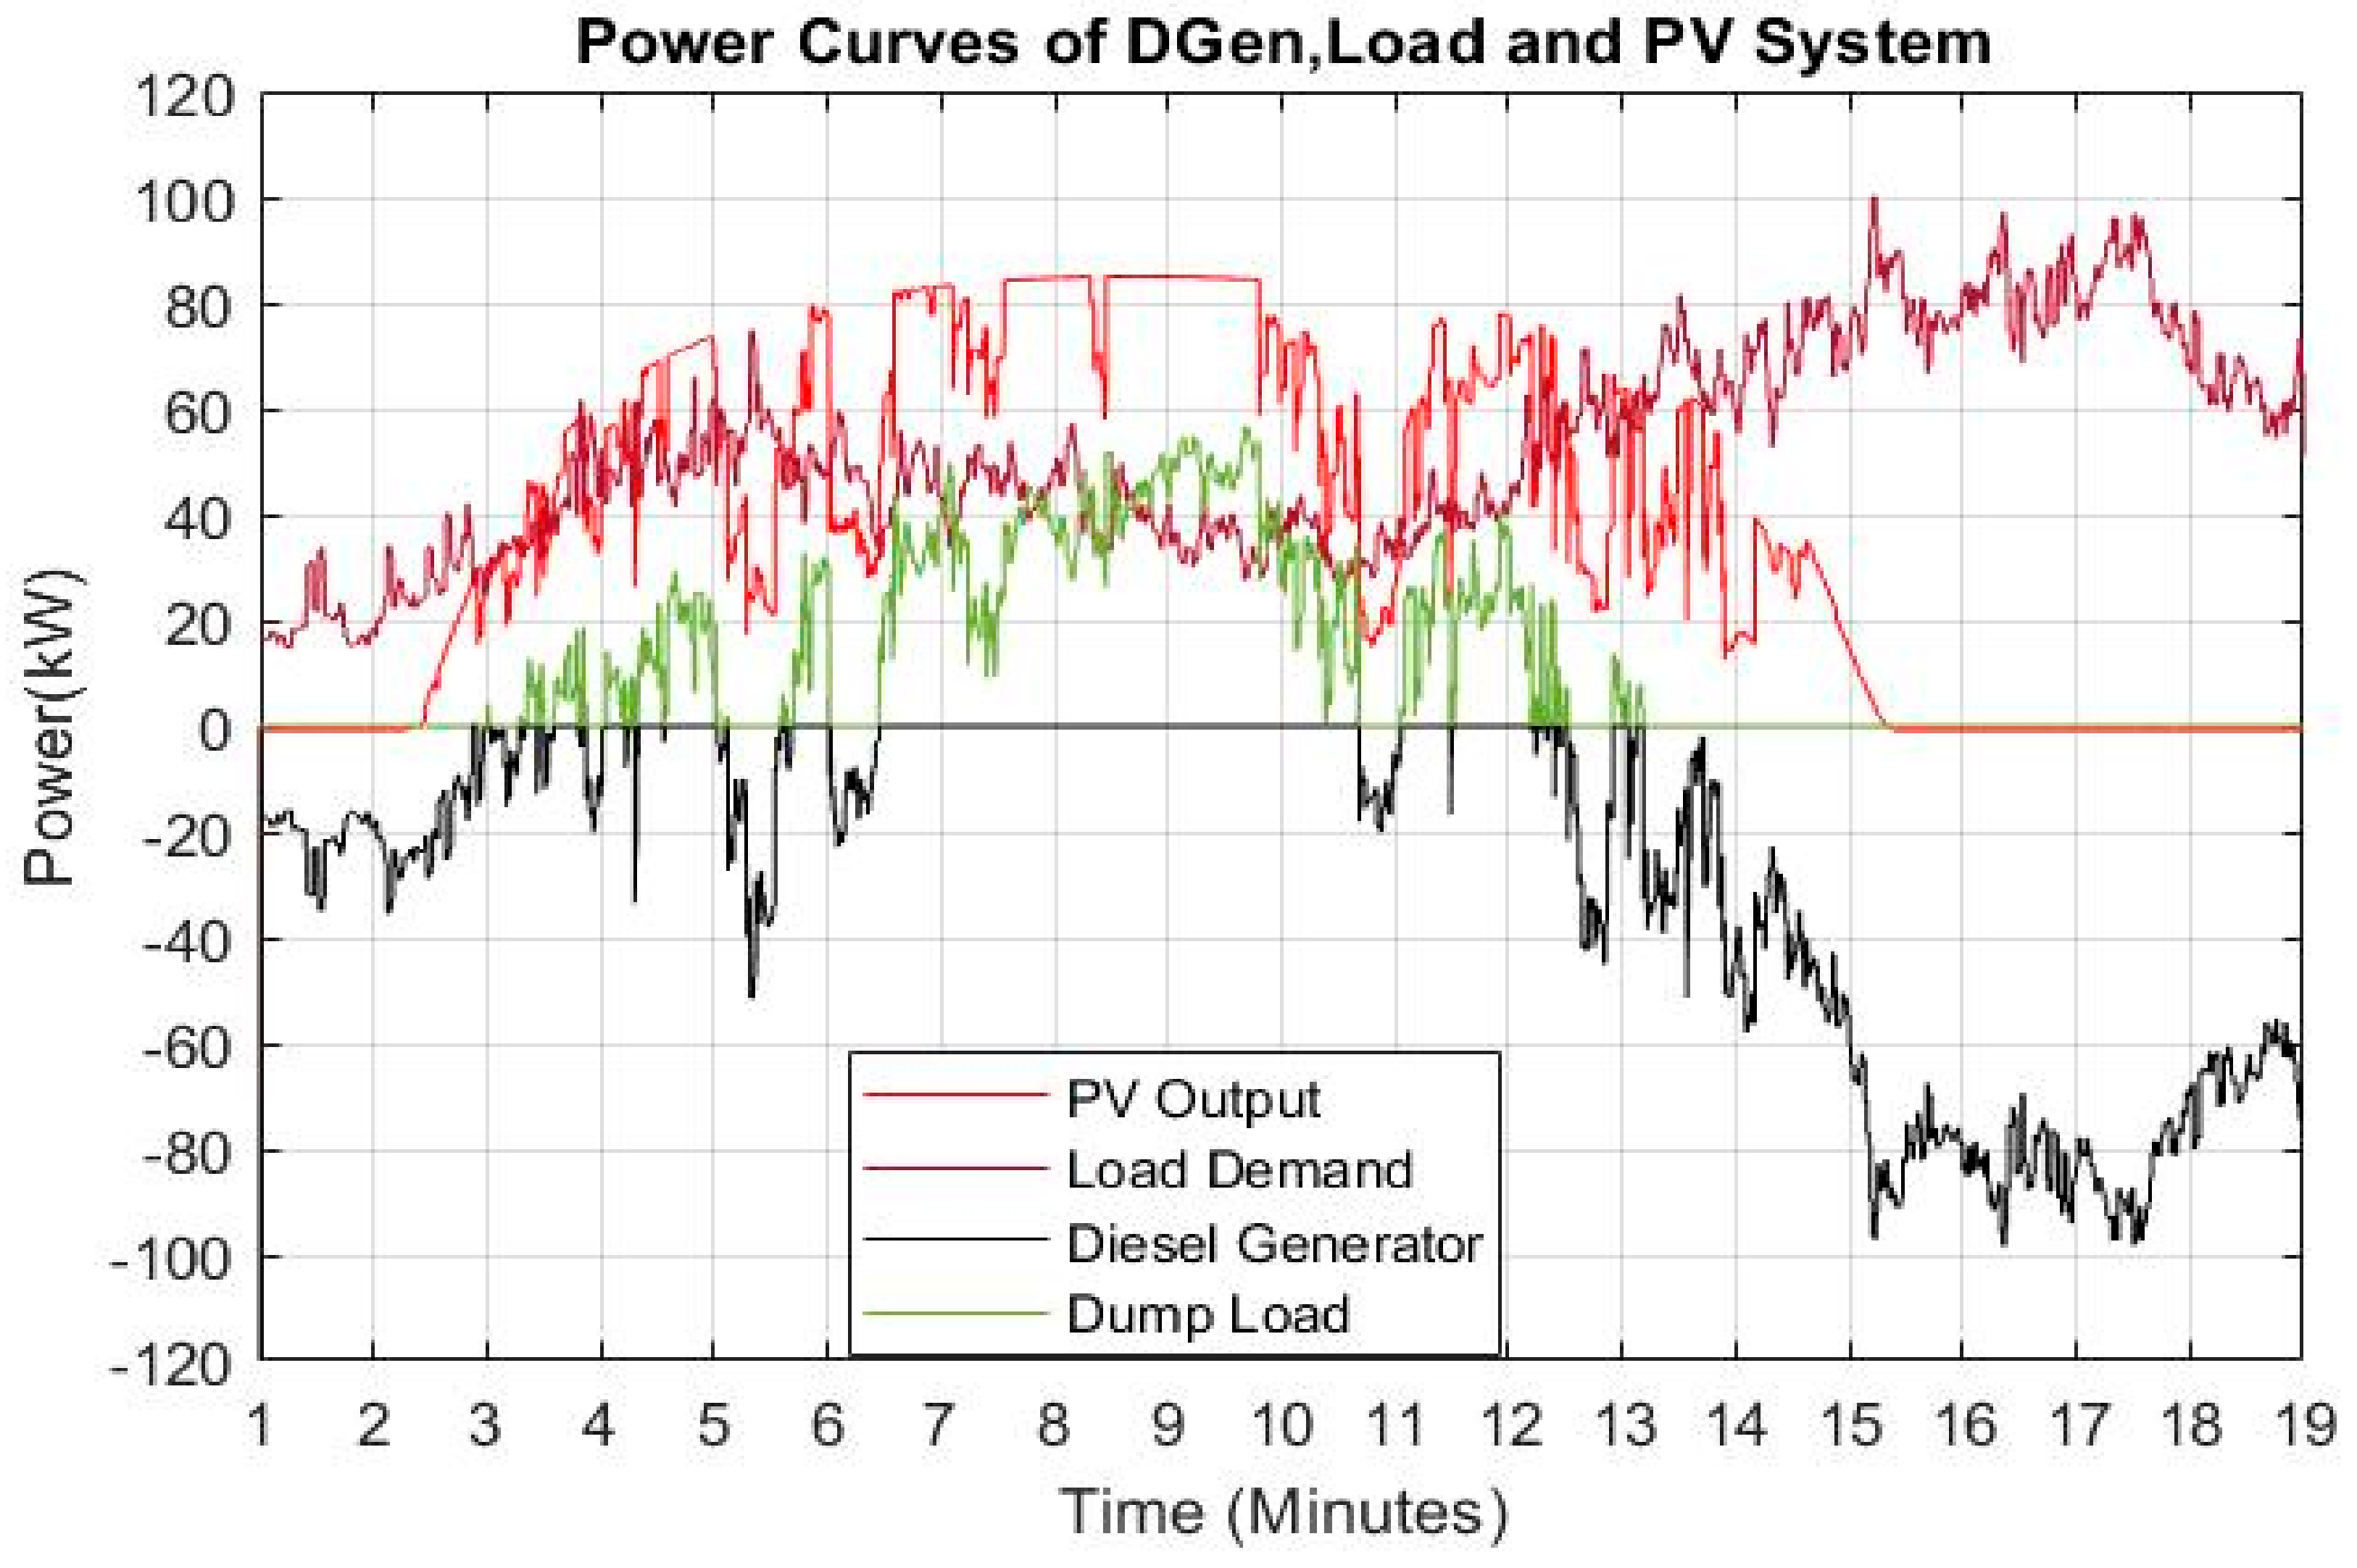
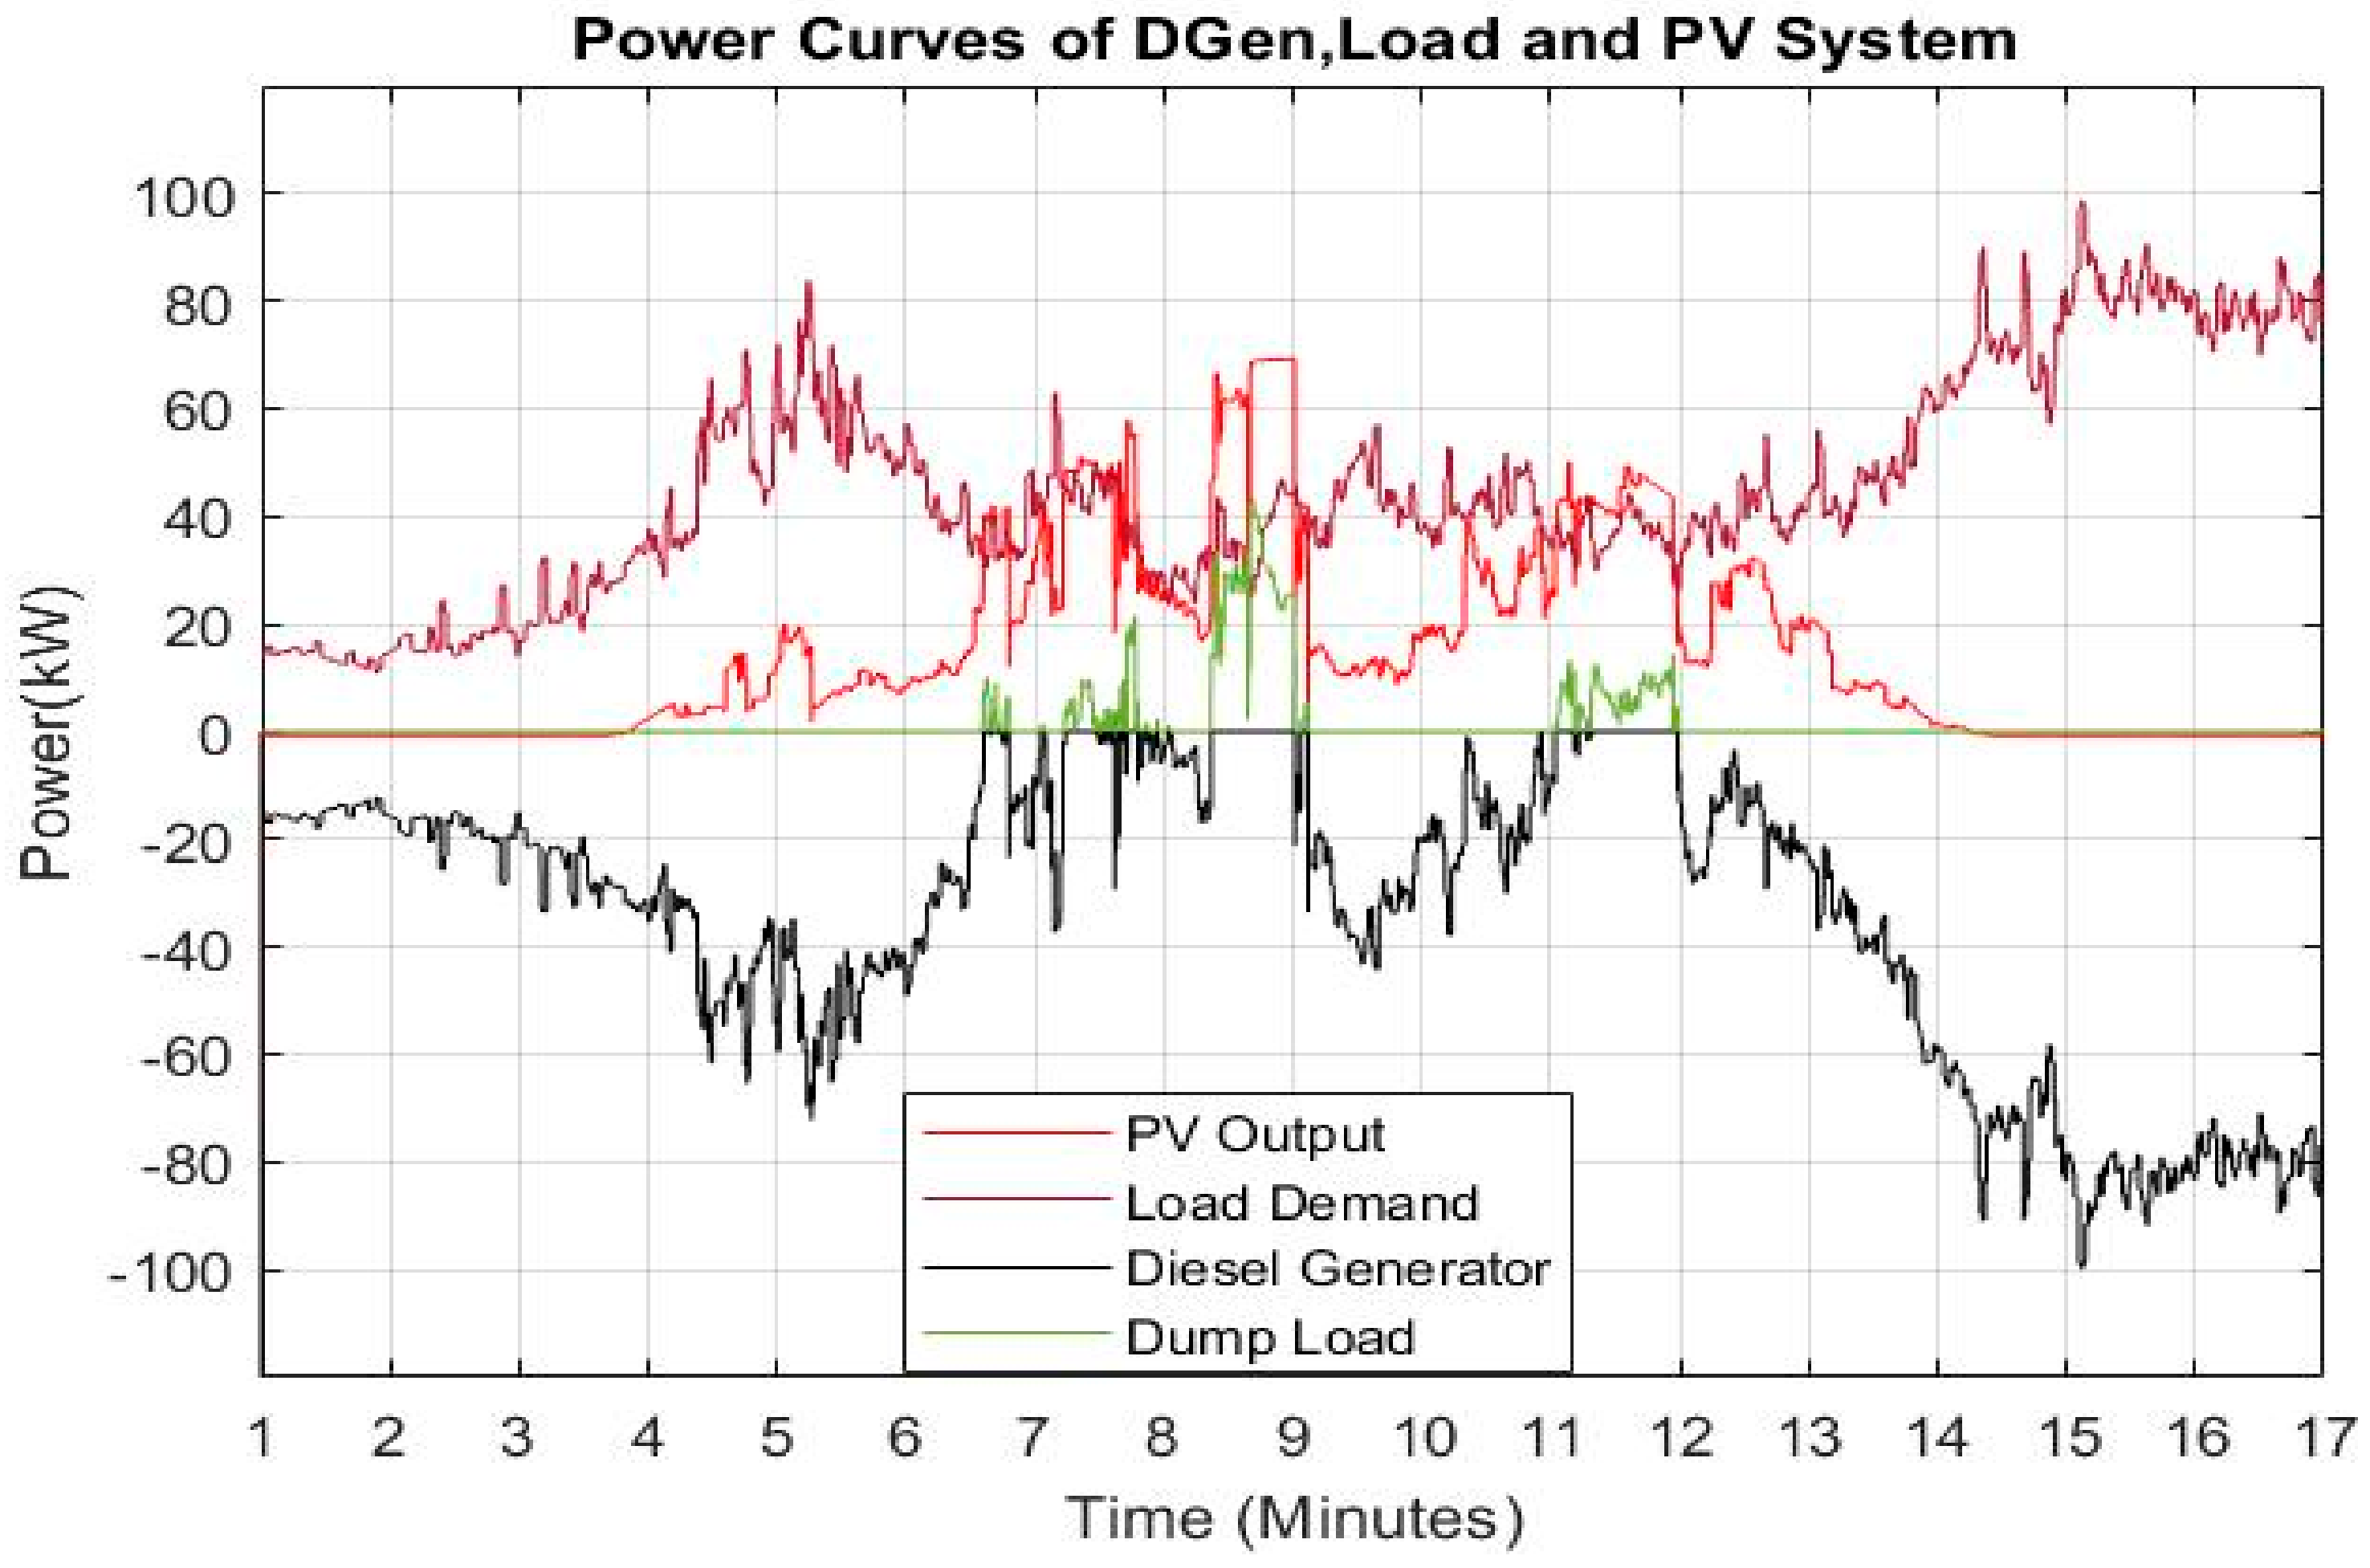
Load profile 3 is selected from 4:00 to 20:00 (Figure 10), this covers the entire changes in solar irradiance during the day time which will test the dynamic response of the FESS to drastic and continuous variations in PV output power. In Figure 18, it can be seen that the load demand is rising after 3 min and the first peak power demand appears at 6.15 min which is shared by Dgen and the PV system. The Dgen remains on almost during entire operation of 17 min except between 8 to 9 min when Dgen is turned off and excess power is dissipated in dump load. At 14 min, the solar irradiance is deceased to zero due to sun set. The power demand from 14 to 17 min the load demand is supplied by Dgen. The second peak demand occurs at 15 min which is due to increased activity and inhabitance in the houses and it is supplied by the Dgen only.
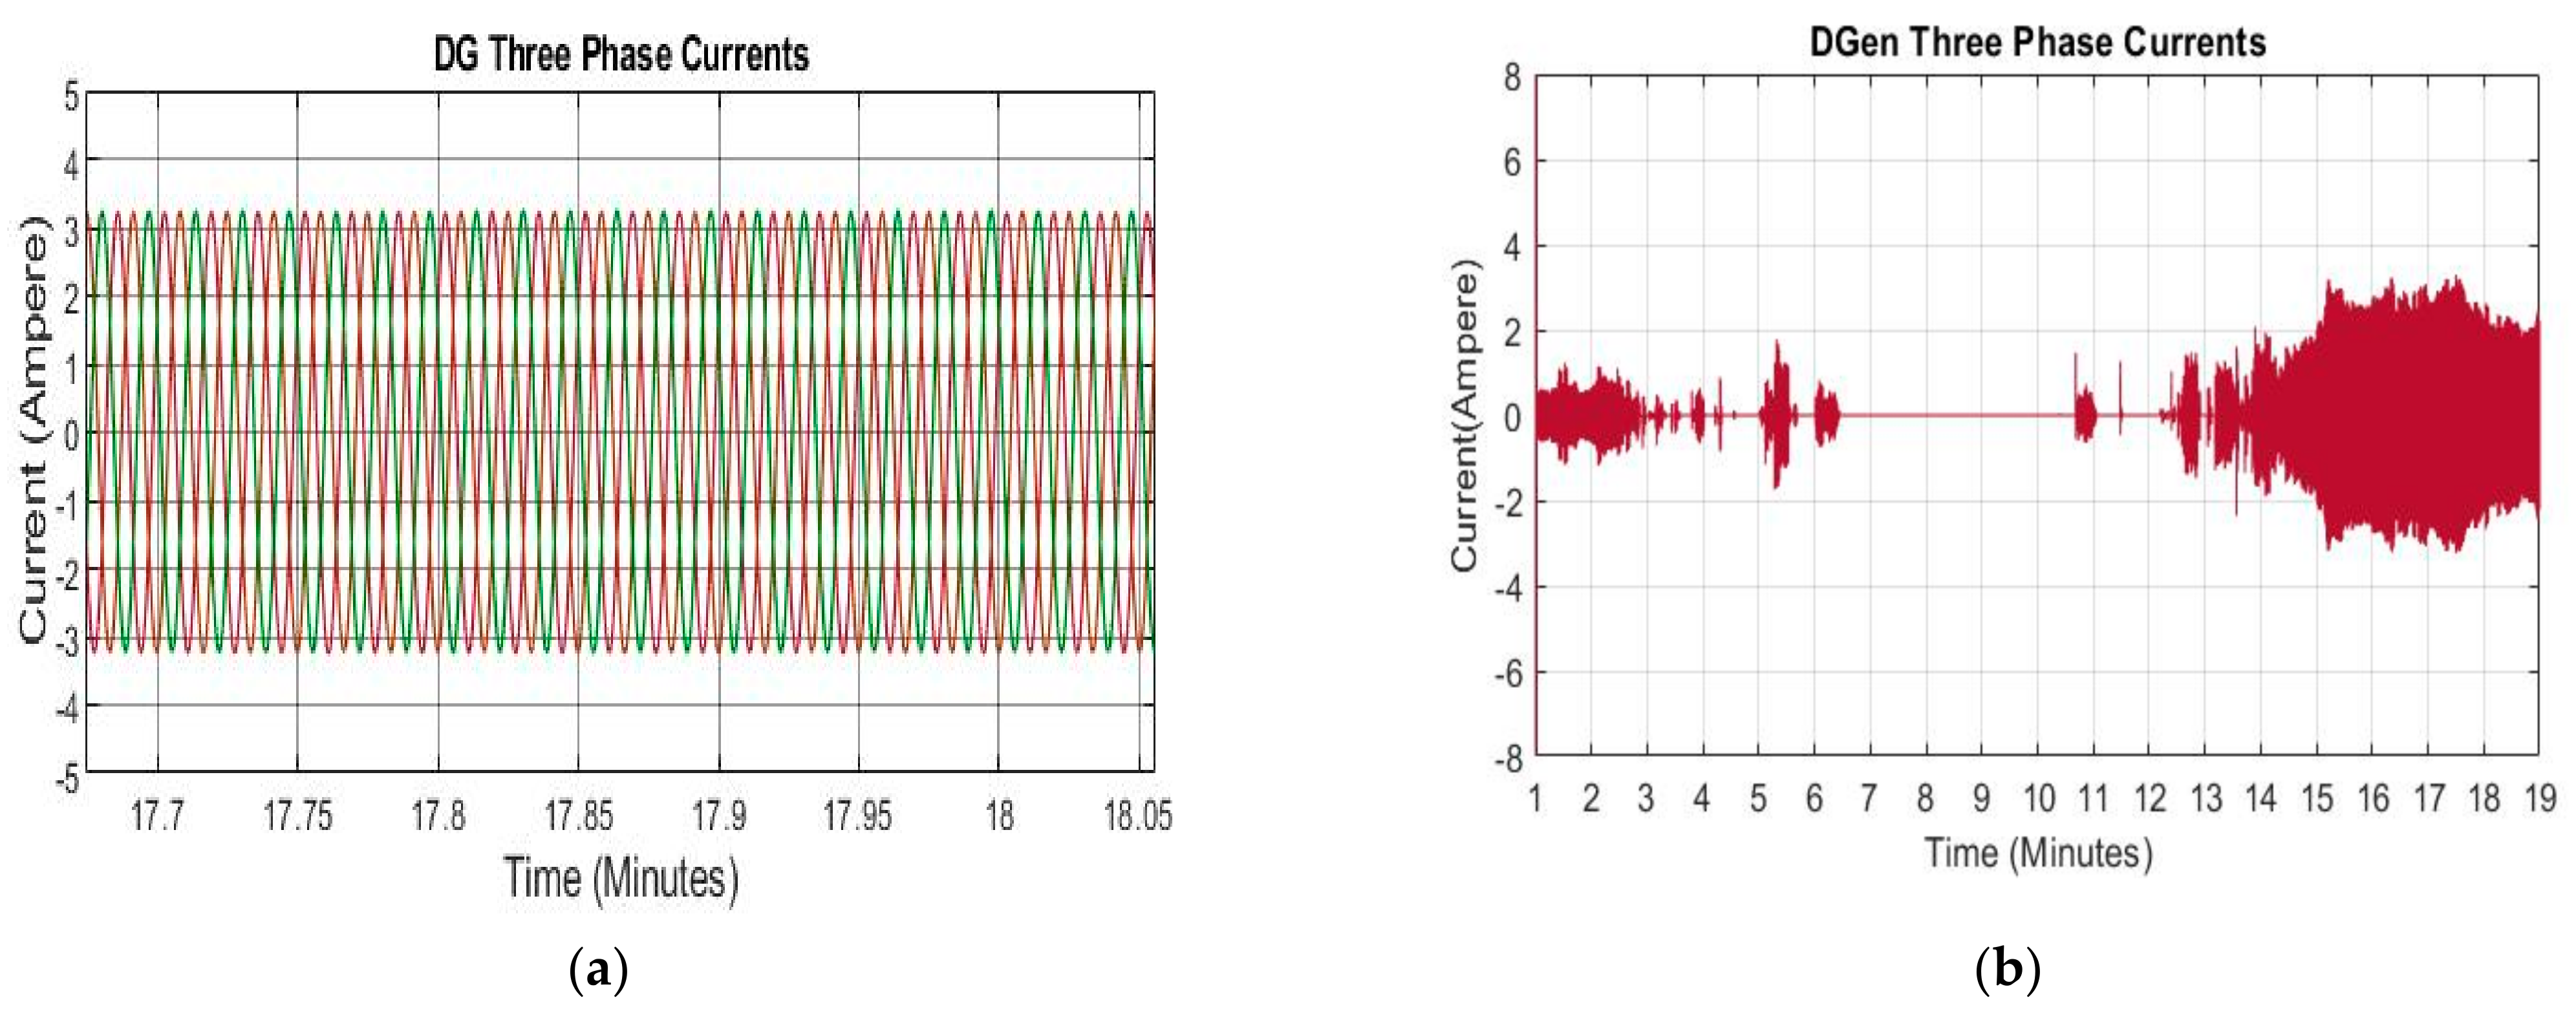
Figure 19 and Figure 20 show the three phase currents and DC link voltage respectively. Three phase currents show the compliance with output of Dgen and its fluctuations. Additionally, it can be seen that DC link voltage is stable during entire operation. However, the Dgen has to operate all the time and much of it under part load when specific fuel consumption is high. Even worse, significant energy must be wasted in dump resistors.
5.2. Islanded Operation with Flywheel Energy Storage
In this section, the FESS is integrated into the system in order to keep the Dgen turned off as much as possible, this reducing CO2 emissions, fuel costs and hours of running of the Dgen. The PV system can generate up to 90 kW of power for all load profiles. The Dgen is sized according to the maximum demand as it can provide with the maximum load demand when neither PV and nor flywheel are available.
The operation of the FESS is controlled based on its %SoC and communication between PV system and the load demand, when the load is greater than output of PV system the FESS is discharged and it provides the power to the load if it is running at 50% of its rated speed (10 krpm). If the FESS is completely discharged and the load is higher than PV output power then the Dgen is turned on to supply the residential load and charge the FESS. The signal to start the Dgen is given before the FESS is fully depleted. When the PV output power is more than what is required by the load then the controller generates a positive torque and the flywheel is charged from excess PV power. The results of the dynamic operation of islanded system with FESS for each load profile are described in following sections.
5.2.1. Load Profile 1
In this operation scenario, the PV output power remains sufficient to meet the load demand from 4 to 12 min and it is highest between 7–9. The dynamic operation of PVHM and power sharing of sources is present in Figure 21. The FESS is charged by the Dgen from 1–3 min, when PV output power is slightly higher than load demand the Dgen turns off, the load demand is shared between the FESS and PV system from 3 to 6.5 min. The FESS starts to charge after sharing power with PV system at 6.5, the flywheel is 100% charged at 11 min. The FESS provides the backup power by discharging when the PV system cannot catch up with load demand (at 13 min) and its output starts decreasing after peak power generation. The FESS shaves off the load spikes from 13.5 to 17.45 min and it also meets the maximum load demand of 100kW alone (at t = 15.10 min). The Dgen is turned on at 17.5 min when flywheel is completely discharged (%SoC = 0), the Dgen supplies the power to the load for rest of the operation (2.5 min) and charges the FESS as well.
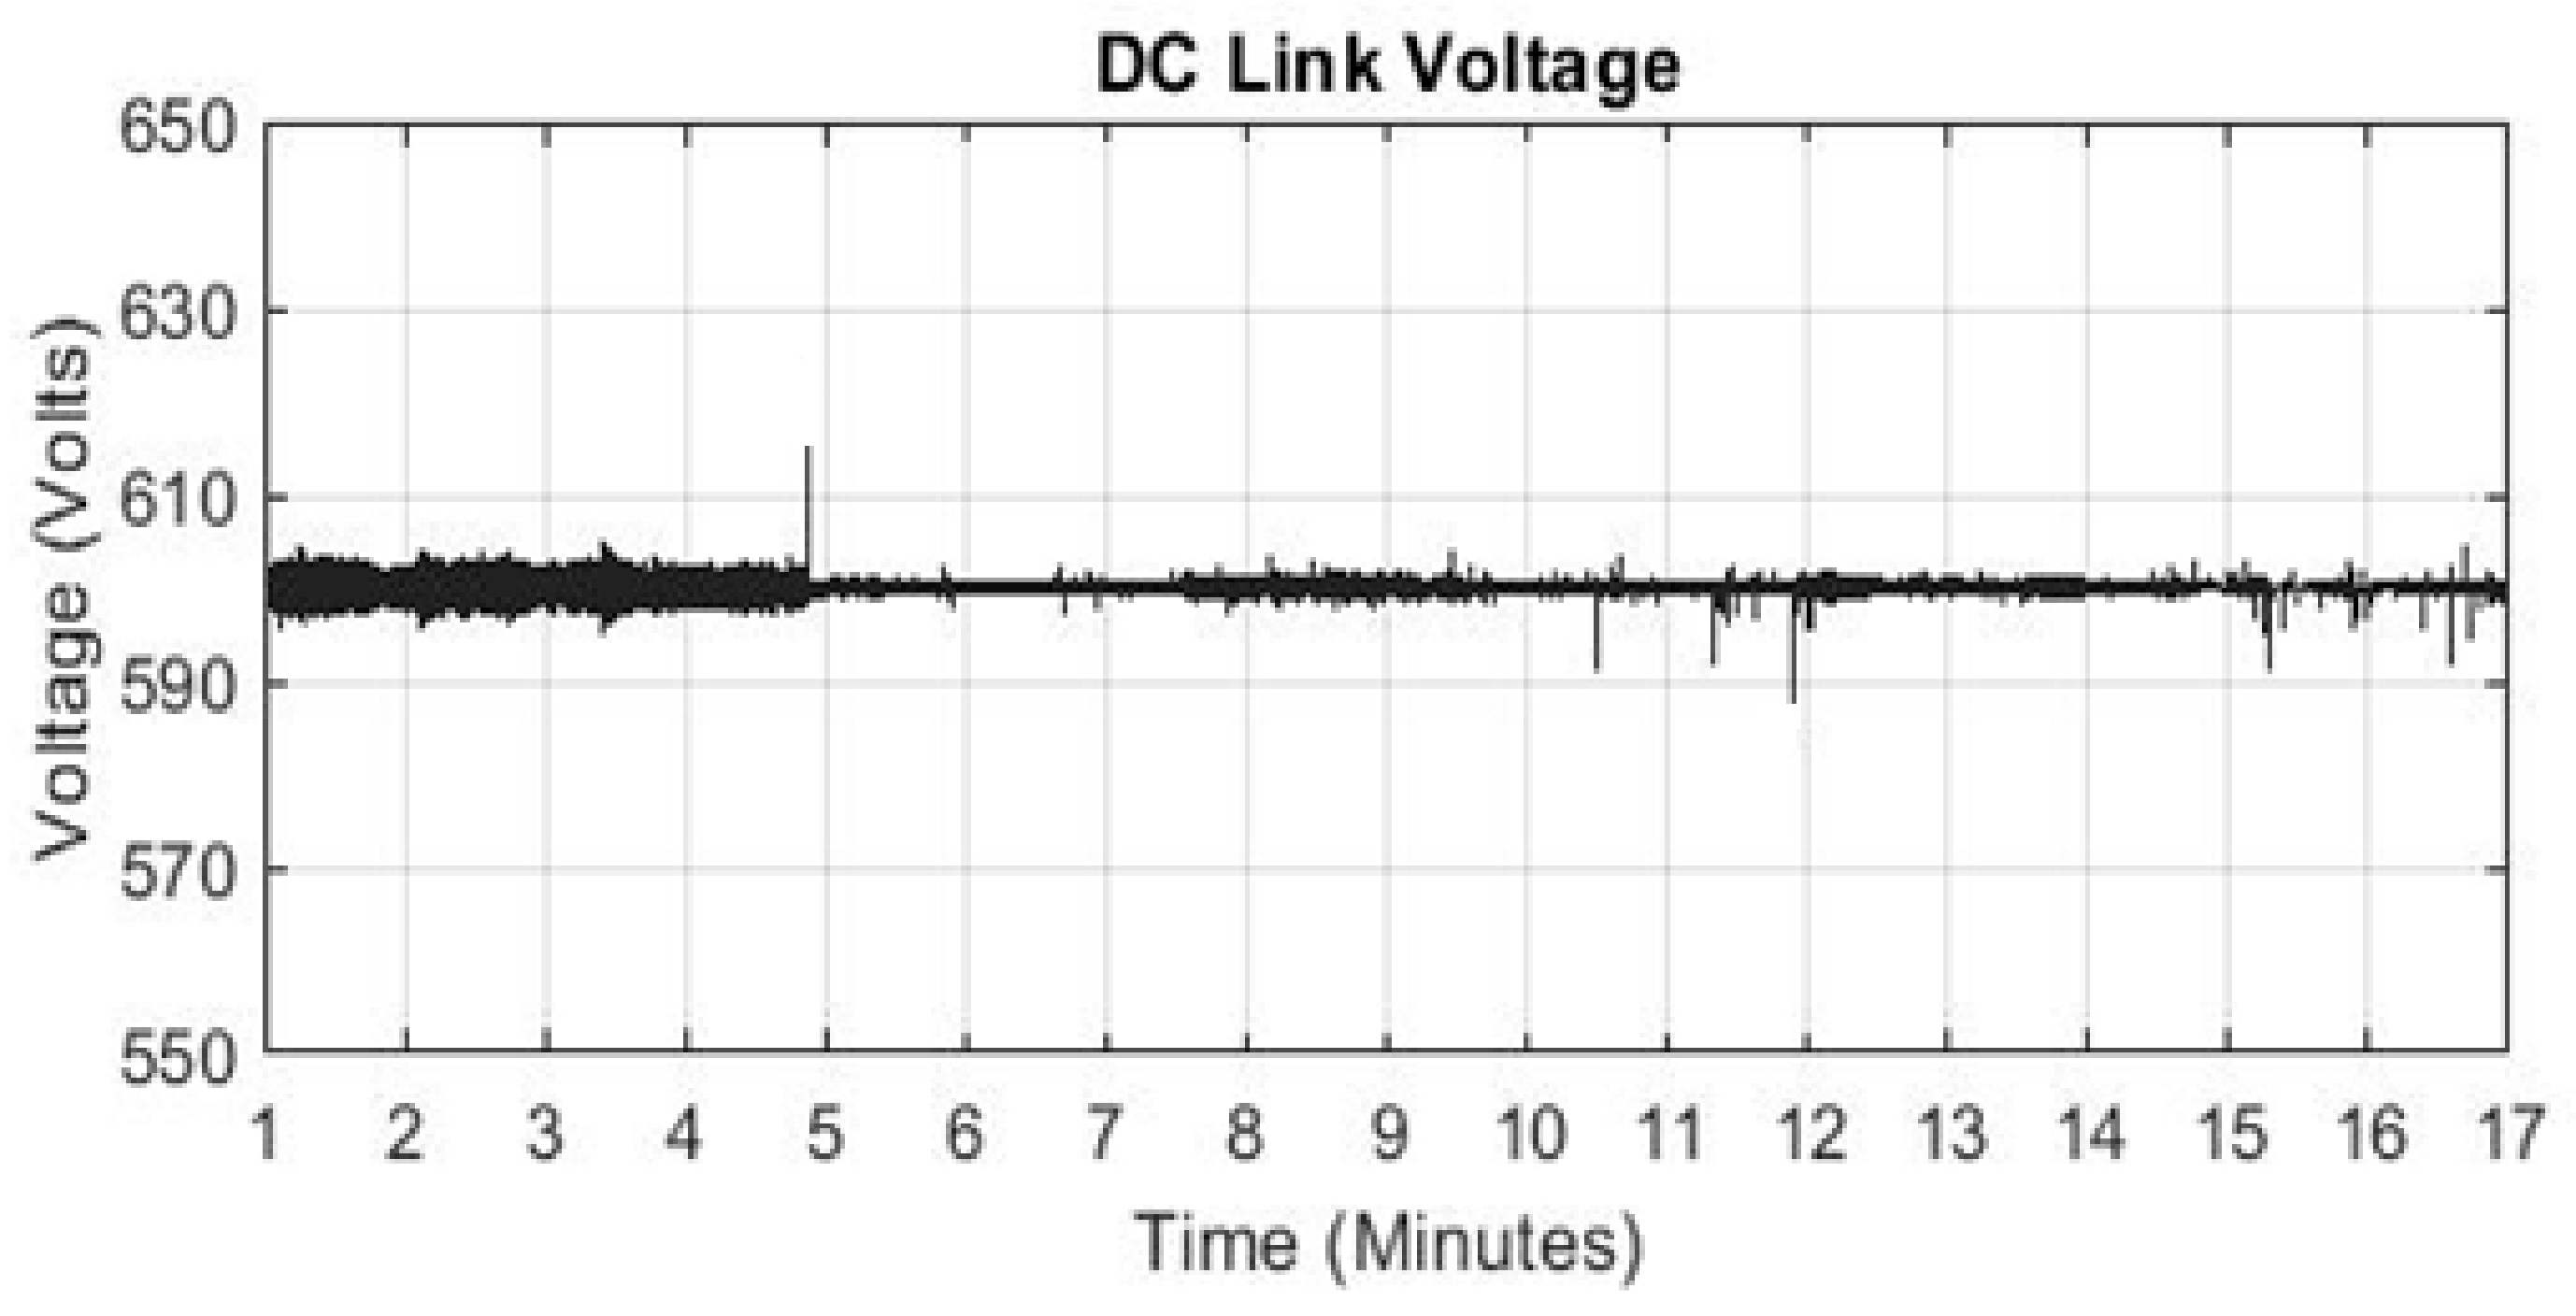
Comparing Figure 12 and Figure 21, it can be clearly seen that how integration of the FESS has reduced the operation of the Dgen significantly even during the times of peak demand. Figure 22 shows stable DC link voltage, it can be seen that the DC link voltage is stable across the entire operation of 19 min.
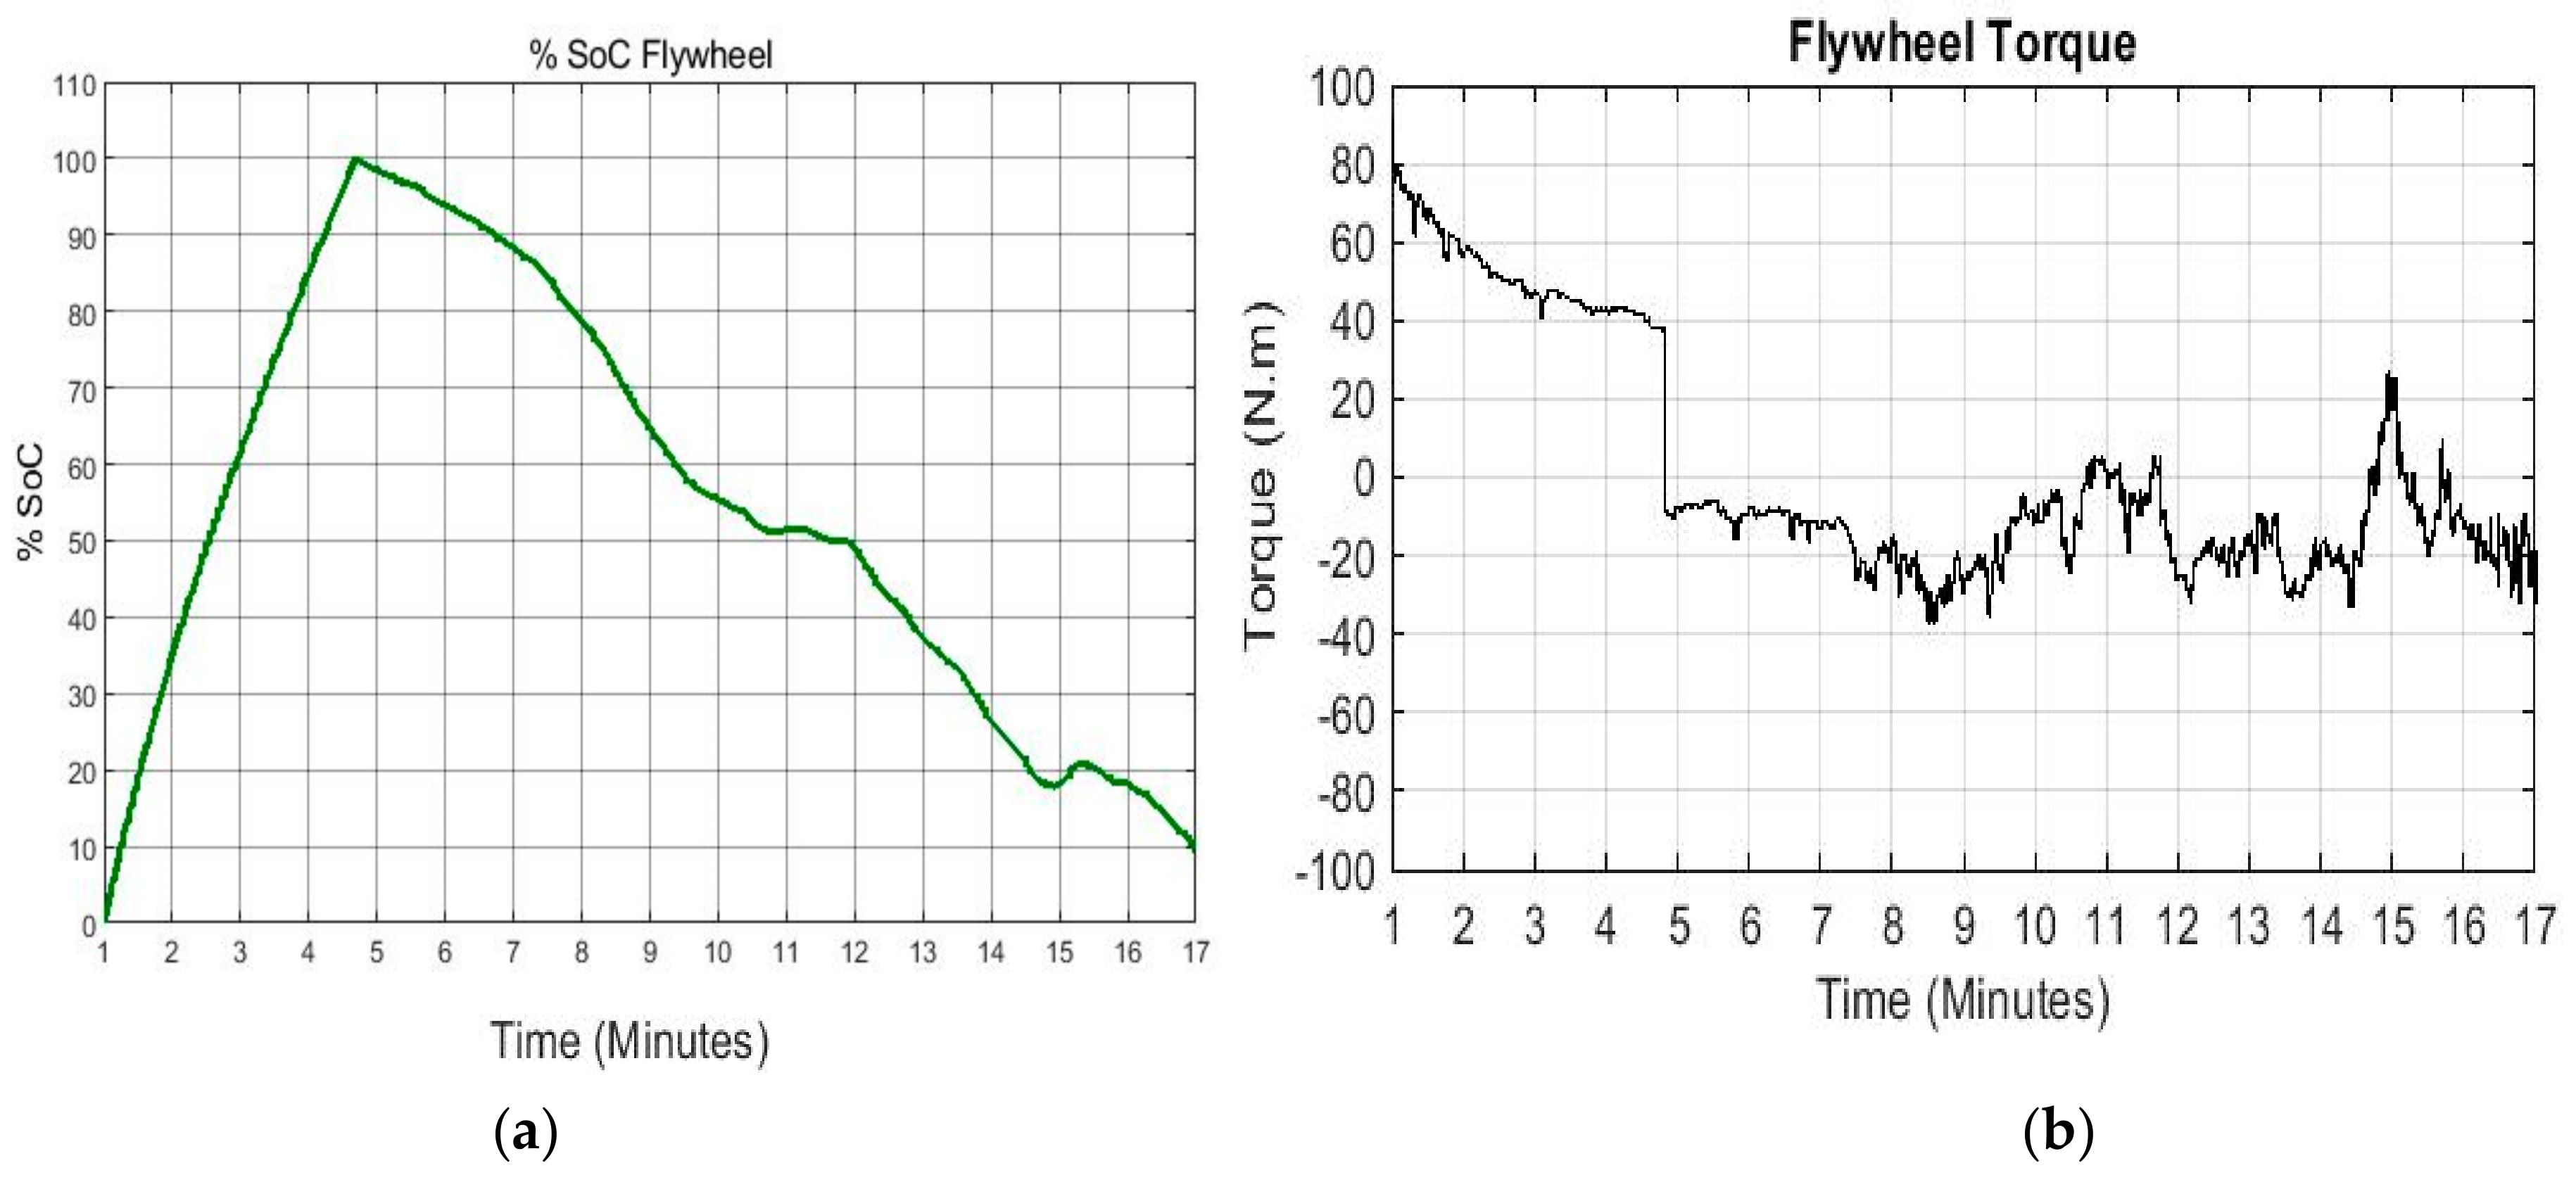
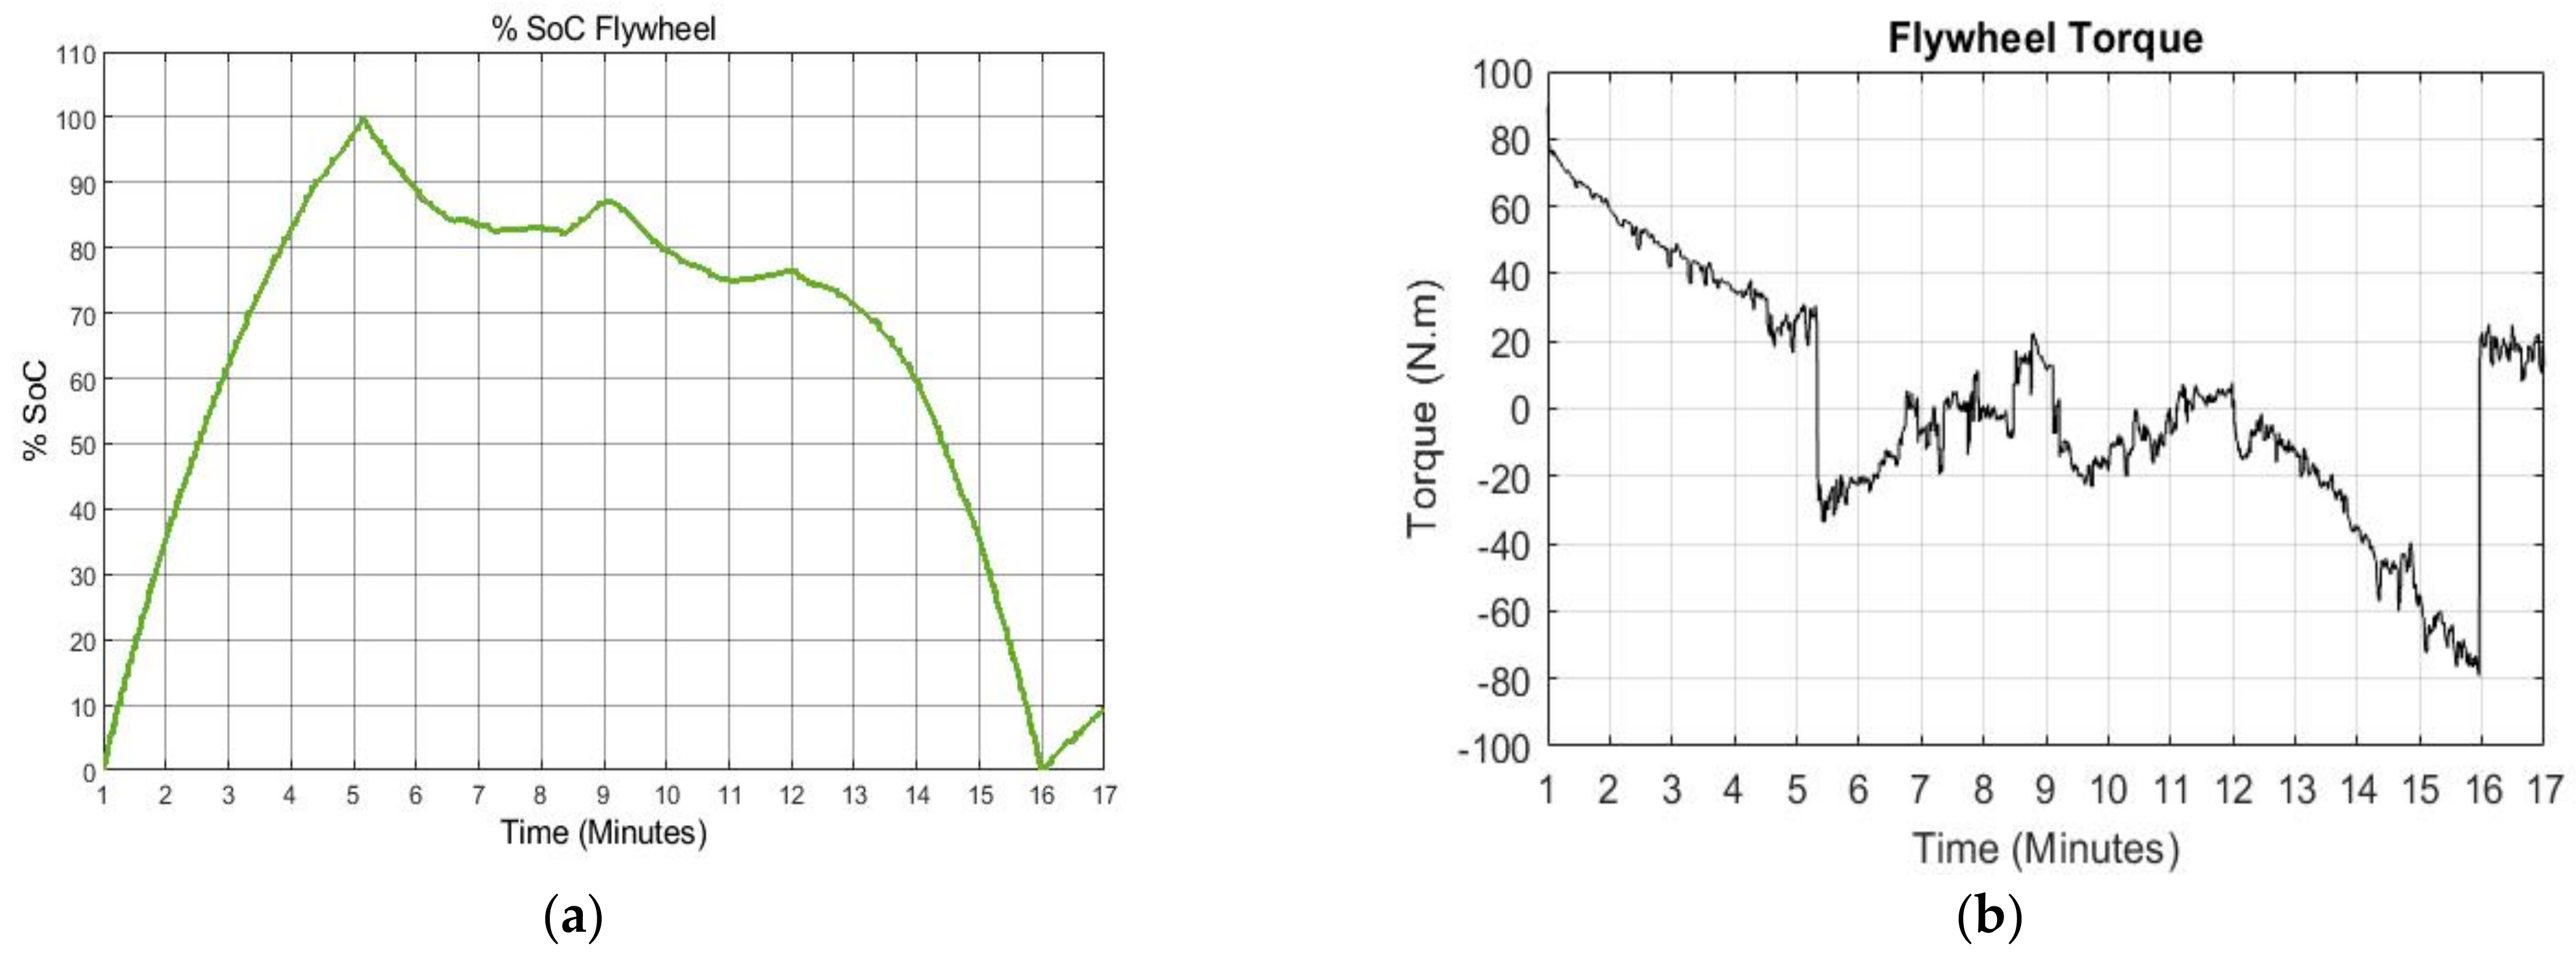
Figure 23 presents the %SoC and shaft torque of MG in the FESS. The %SoC profile of the FESS can be seen mapping to the torque input and outputs over time. The flywheel is charged with positive torque which is generated based on the excess power coming either from PV system or the Dgen. The flywheel is discharged and negative torque is generated based on the difference in the power output of the PV system and the load demand. Figure 24 shows the three-phase current of the Dgen.
5.2.2. Load Profile 2
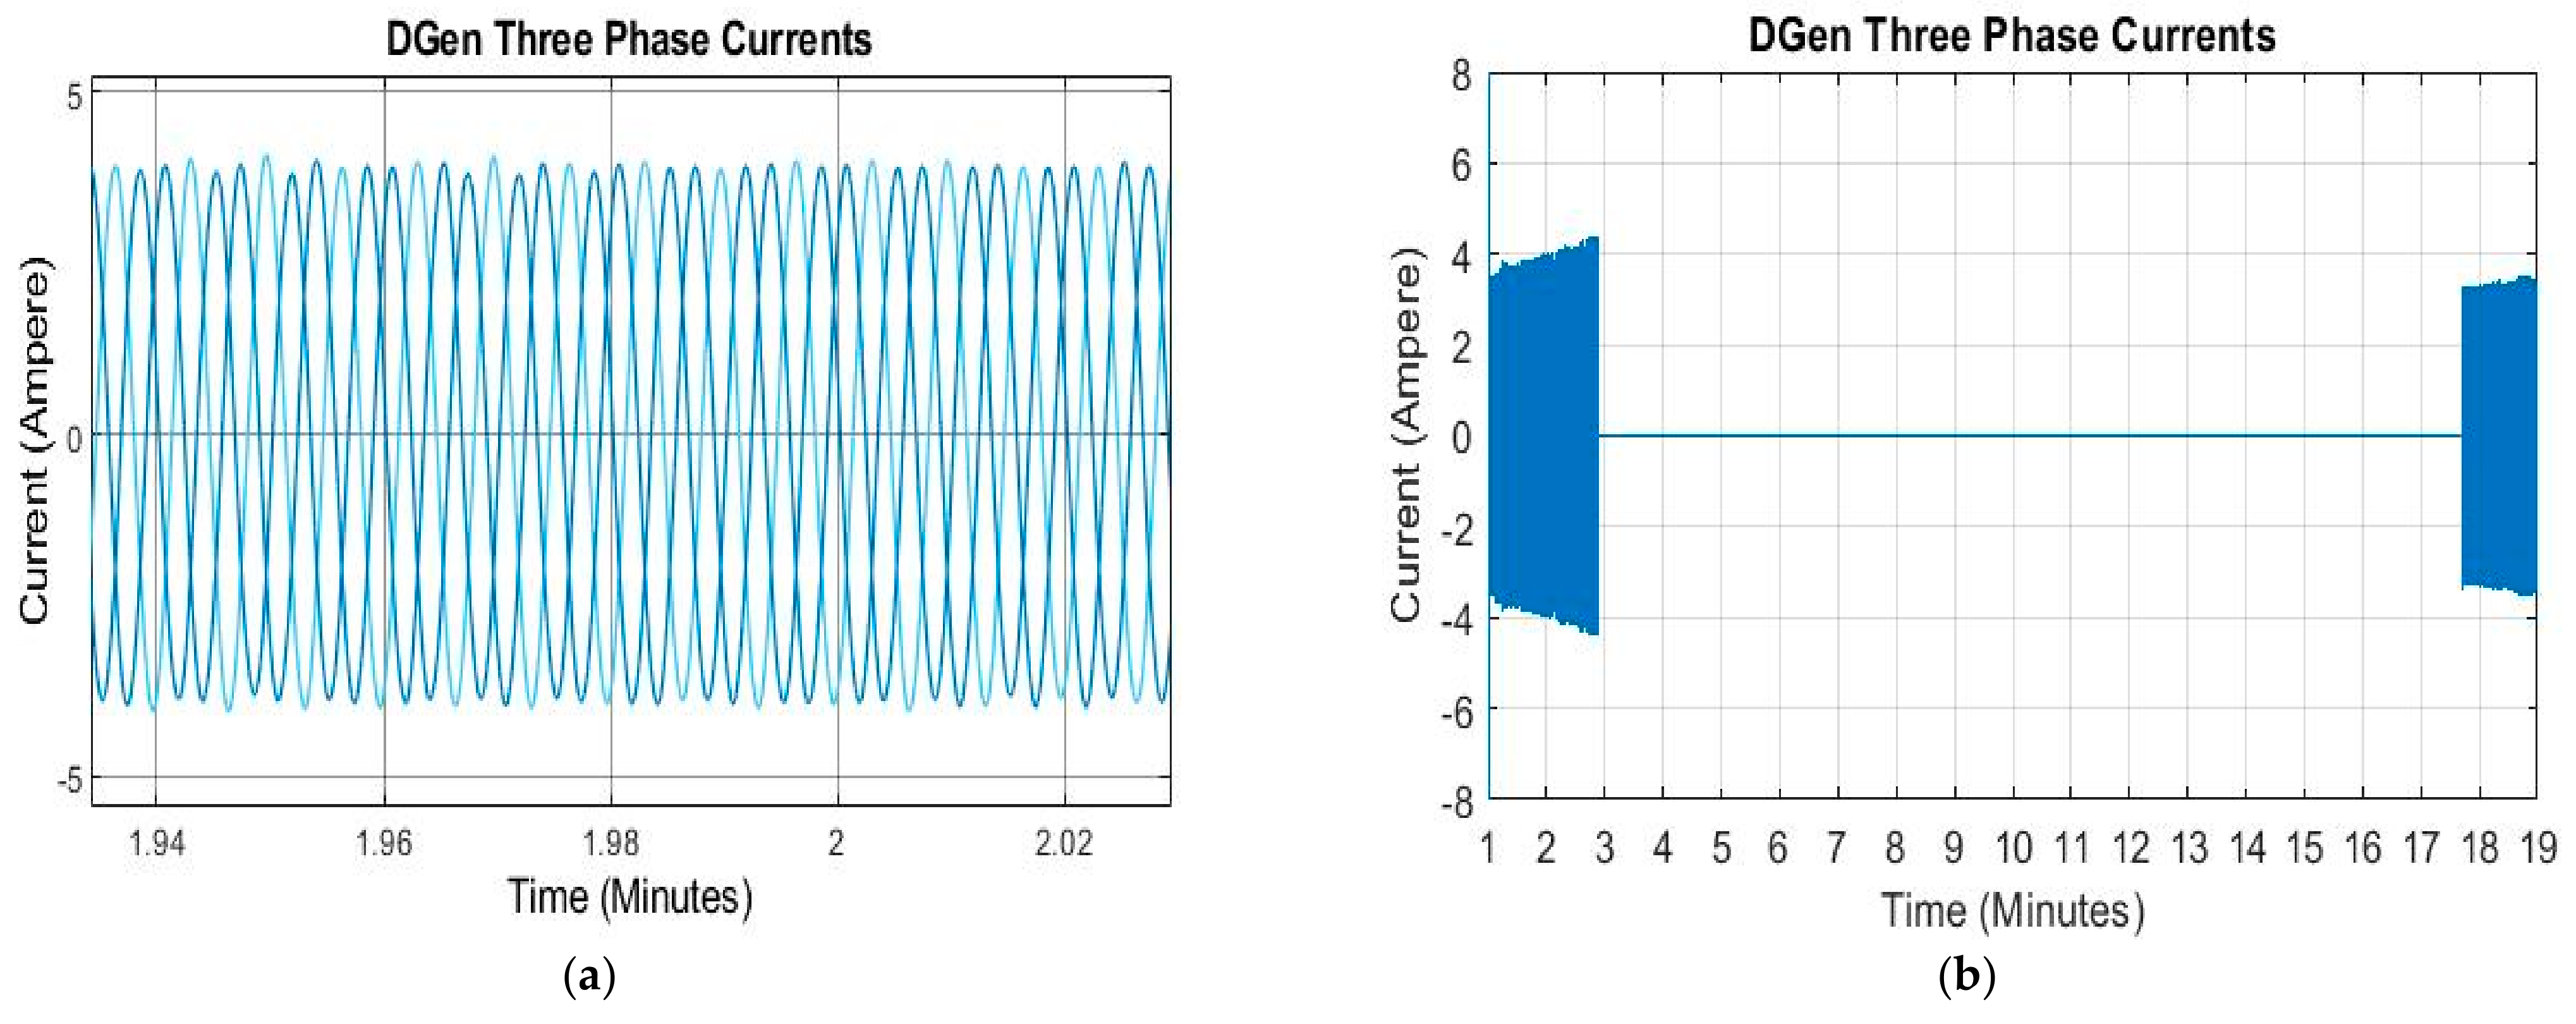
Load profile 2 is simulated for 17 min, the time range of load profile 2 is selected based on concept of testing the response of the flywheel when PV output power is zero due no solar irradiance and when PV output power fluctuates repeatedly. Figure 25 shows the power flow curves of PV system, FESS and DGen. It is seen that the DGen is tuned on and operated at full load from 1 to 3.9 min to supply the load demand and charge the FESS. The FESS is charged 100% at 3.9 min and DGen is tuned off. The FESS starts to discharge at 5 min and provides back-up power to the system when PV output power is not sufficient to feed the load demand from 5 to 17 min. Between 15 to 16 min the output of PV system is slightly more than the load demand and the FESS is charged by the excess PV power. The DGen remains off during entire operation of PVHM (after t = 5 min) and the power is exchanged between FESS and the PV system. In this operation scenario, there are sharp fluctuations in solar irradiance and power produced by the PV system is not enough to supply the load demand alone except for few seconds, it can be seen that by providing backup power to the system the FESS has significantly reduced the use of the DGen in the system when sufficiently charged which can be clearly seen by comparing Figure 15 and Figure 25.
Charge-discharge cycles and torque curves of FESS are shown in Figure 26, it can be seen that the variations in the flywheel are in accordance with %SoC. The DC link voltage is shown in Figure 27, it can be seen that the DC voltage is stable. Figure 28 shows three phase currents of the DGen, it can be seen that the variations in the current waveform comply with the power curves of DGen.
5.2.3. Load Profile 3
In this operation scenario of PVHM the load profile is selected from sun rise to sun set in order to cover all variations in solar irradiance during the entire day and analyze the performance of the FESS. It can be seen that the solar irradiance fluctuates due to cloud passing therefore the PV system alone is not able to supply load demand during the entire operation. The DGen is turned on until the flywheel is charged 100%. At 5.10 min the FESS starts to share power demand with PV system and levels off the power demand. Two power peaks appear during the operation at 5.5 and 15 min which are 80 kW and 100 kW respectively, at the time of both power spikes in either PV power is zero or it not sufficient to meet the demand. However, the FESS is sufficiently charged to shave off the peaks and keep the system stable without need for operation of the DGen.
The power produced by PV system is significantly in excess only between 8 to 9 min which is used to charge the FESS. At 16 min the FESS is completely discharged and at this nighttime there is zero power output from PV system, the DGen is turned on in order to charge the flywheel and meet the load demand. The power curves of the load demand, FESS, PV system and DGen are shown in Figure 28. It can be seen from combined power curves that how flywheel is providing back-up power support by quick response.
Figure 29 shows the %SoC and torque of the flywheel for charge-discharge cycles. The negative power refers to the discharge operation of the flywheel and the positive power to the charging operation. It can be seen that the torque and %SoC comply with the power flow in and out of the FESS.
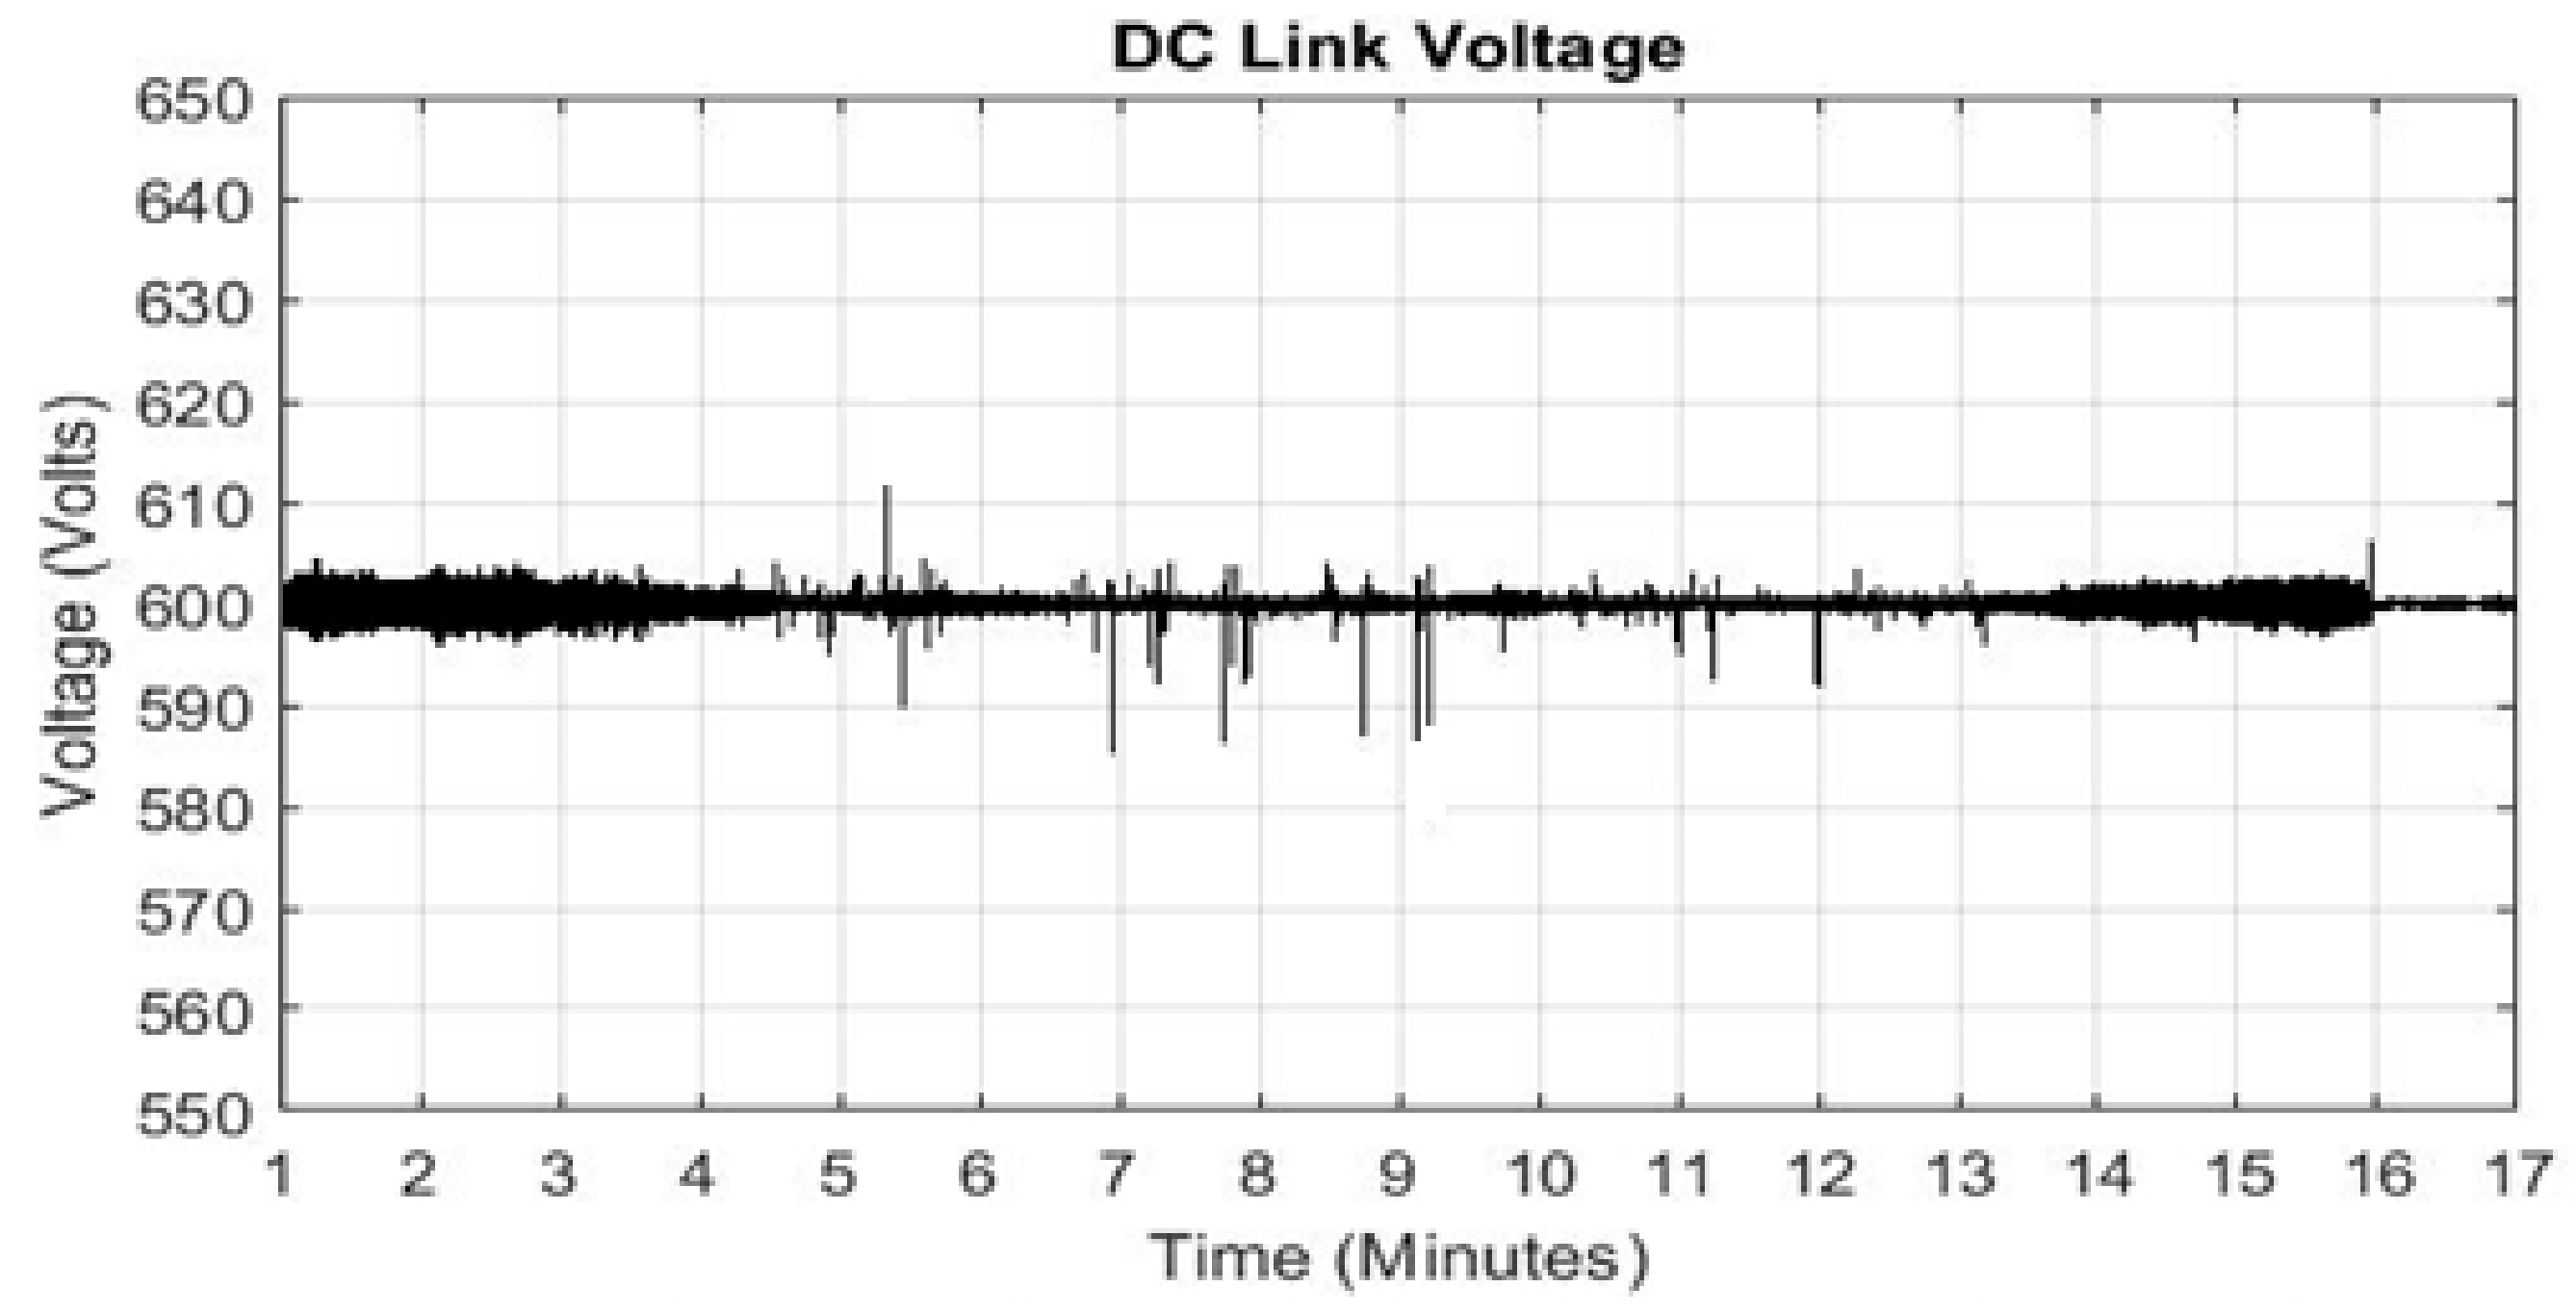
The DC link voltage for the operation of load profile 3 is shown in Figure 30. Little spikes and ripples can be seen in the DC voltage which are due to switching of the sources, however, it remains stable (600 V) during entire operation. The three phase currents of Dgen are shown are Figure 31, it can be seen that the three phase currents of Dgen comply with variations in torque and %SoC.
Comparing the operation of the system with and without FESS for the load profile 3 (Figure 16 and Figure 28) it can be clearly seen that the FESS has considerably reduced the operation of DGen from approximately 13.5 min to 5 min. Additionally, the operation with the FESS has saved the CO2 emissions and the fuel cost. The fuel consumption analysis of the DGen with and without the FESS is provided in the next section.
6. Diesel Generator Fuel Consumption and CO2 Emission Analysis
A diesel engine operates efficiently near full load whereas at partial load the efficiency of the engine is poor and it leads to increased fuel cost. The fuel consumption of DGen in the islanded model presented in this paper depends upon the operation of FESS and the PV power output. The state of charge of the flywheel and PV output power decide the state (on or off) of the diesel generator. In case of load profile 1 with FESS integrated, the diesel generator was barely used for 3.5 min, for the rest of the operation the PV system and flywheel were engaged to share the load demand. Operation PVHM for load profile 2 was challenging for PV system as well as for the flywheel as there were significant fluctuations in PV output power. The DGen was turned on for approximately 4 min during nighttime in order to charge the flywheel to 100%. For load profile 3, the DGen operated for 5 min during entire operation of 17 min, for the rest of the time flywheel could provide back-up power to shave off the peak power demand. The analyses and comparison of CO2 emission and fuel cost are presented in following sections.
6.1. Diesel Fuel Consumption Analysis
The consumption diesel fuel and the fuel cost savings were calculated for different load profiles including operations with and without the FESS and results are presented in tabular and graphical forms.
Table 3 shows the calculations of diesel fuel consumption with and without FESS in the system. Without integration of the flywheel, the DGen remains partially loaded during entire operations for all three load profiles which leads to the poor performance of the DGen and increased fuel cost and CO2 emissions. Therefore, adding energy storage along with RES in islanded system is best solution to save the cost and the environment, provided that ESS is itself environmentally friendly such as the flywheel. The percentage loading of the DGen is categorized in three loading levels in order to calculate the consumption according the manufacturer specifications.
Table 4 shows the fuel consumption analysis of DGen with FESS. From Figure 21, Figure 25 and Figure 28 it can be seen that the load on the DGen is maximum because the flywheel system acts as an added load on the generator during charging state. With the flywheel technology in PVHMS there is significant reduction in fuel consumption and the operating hours of diesel engine are considerably reduced as well. In case of load profile 2, the percentage operation ratio of the DGen is more than load profiles 1 and 3, this is because the load profile 2 was more challenging and PV output power and the flywheel system could not supply the load demand.
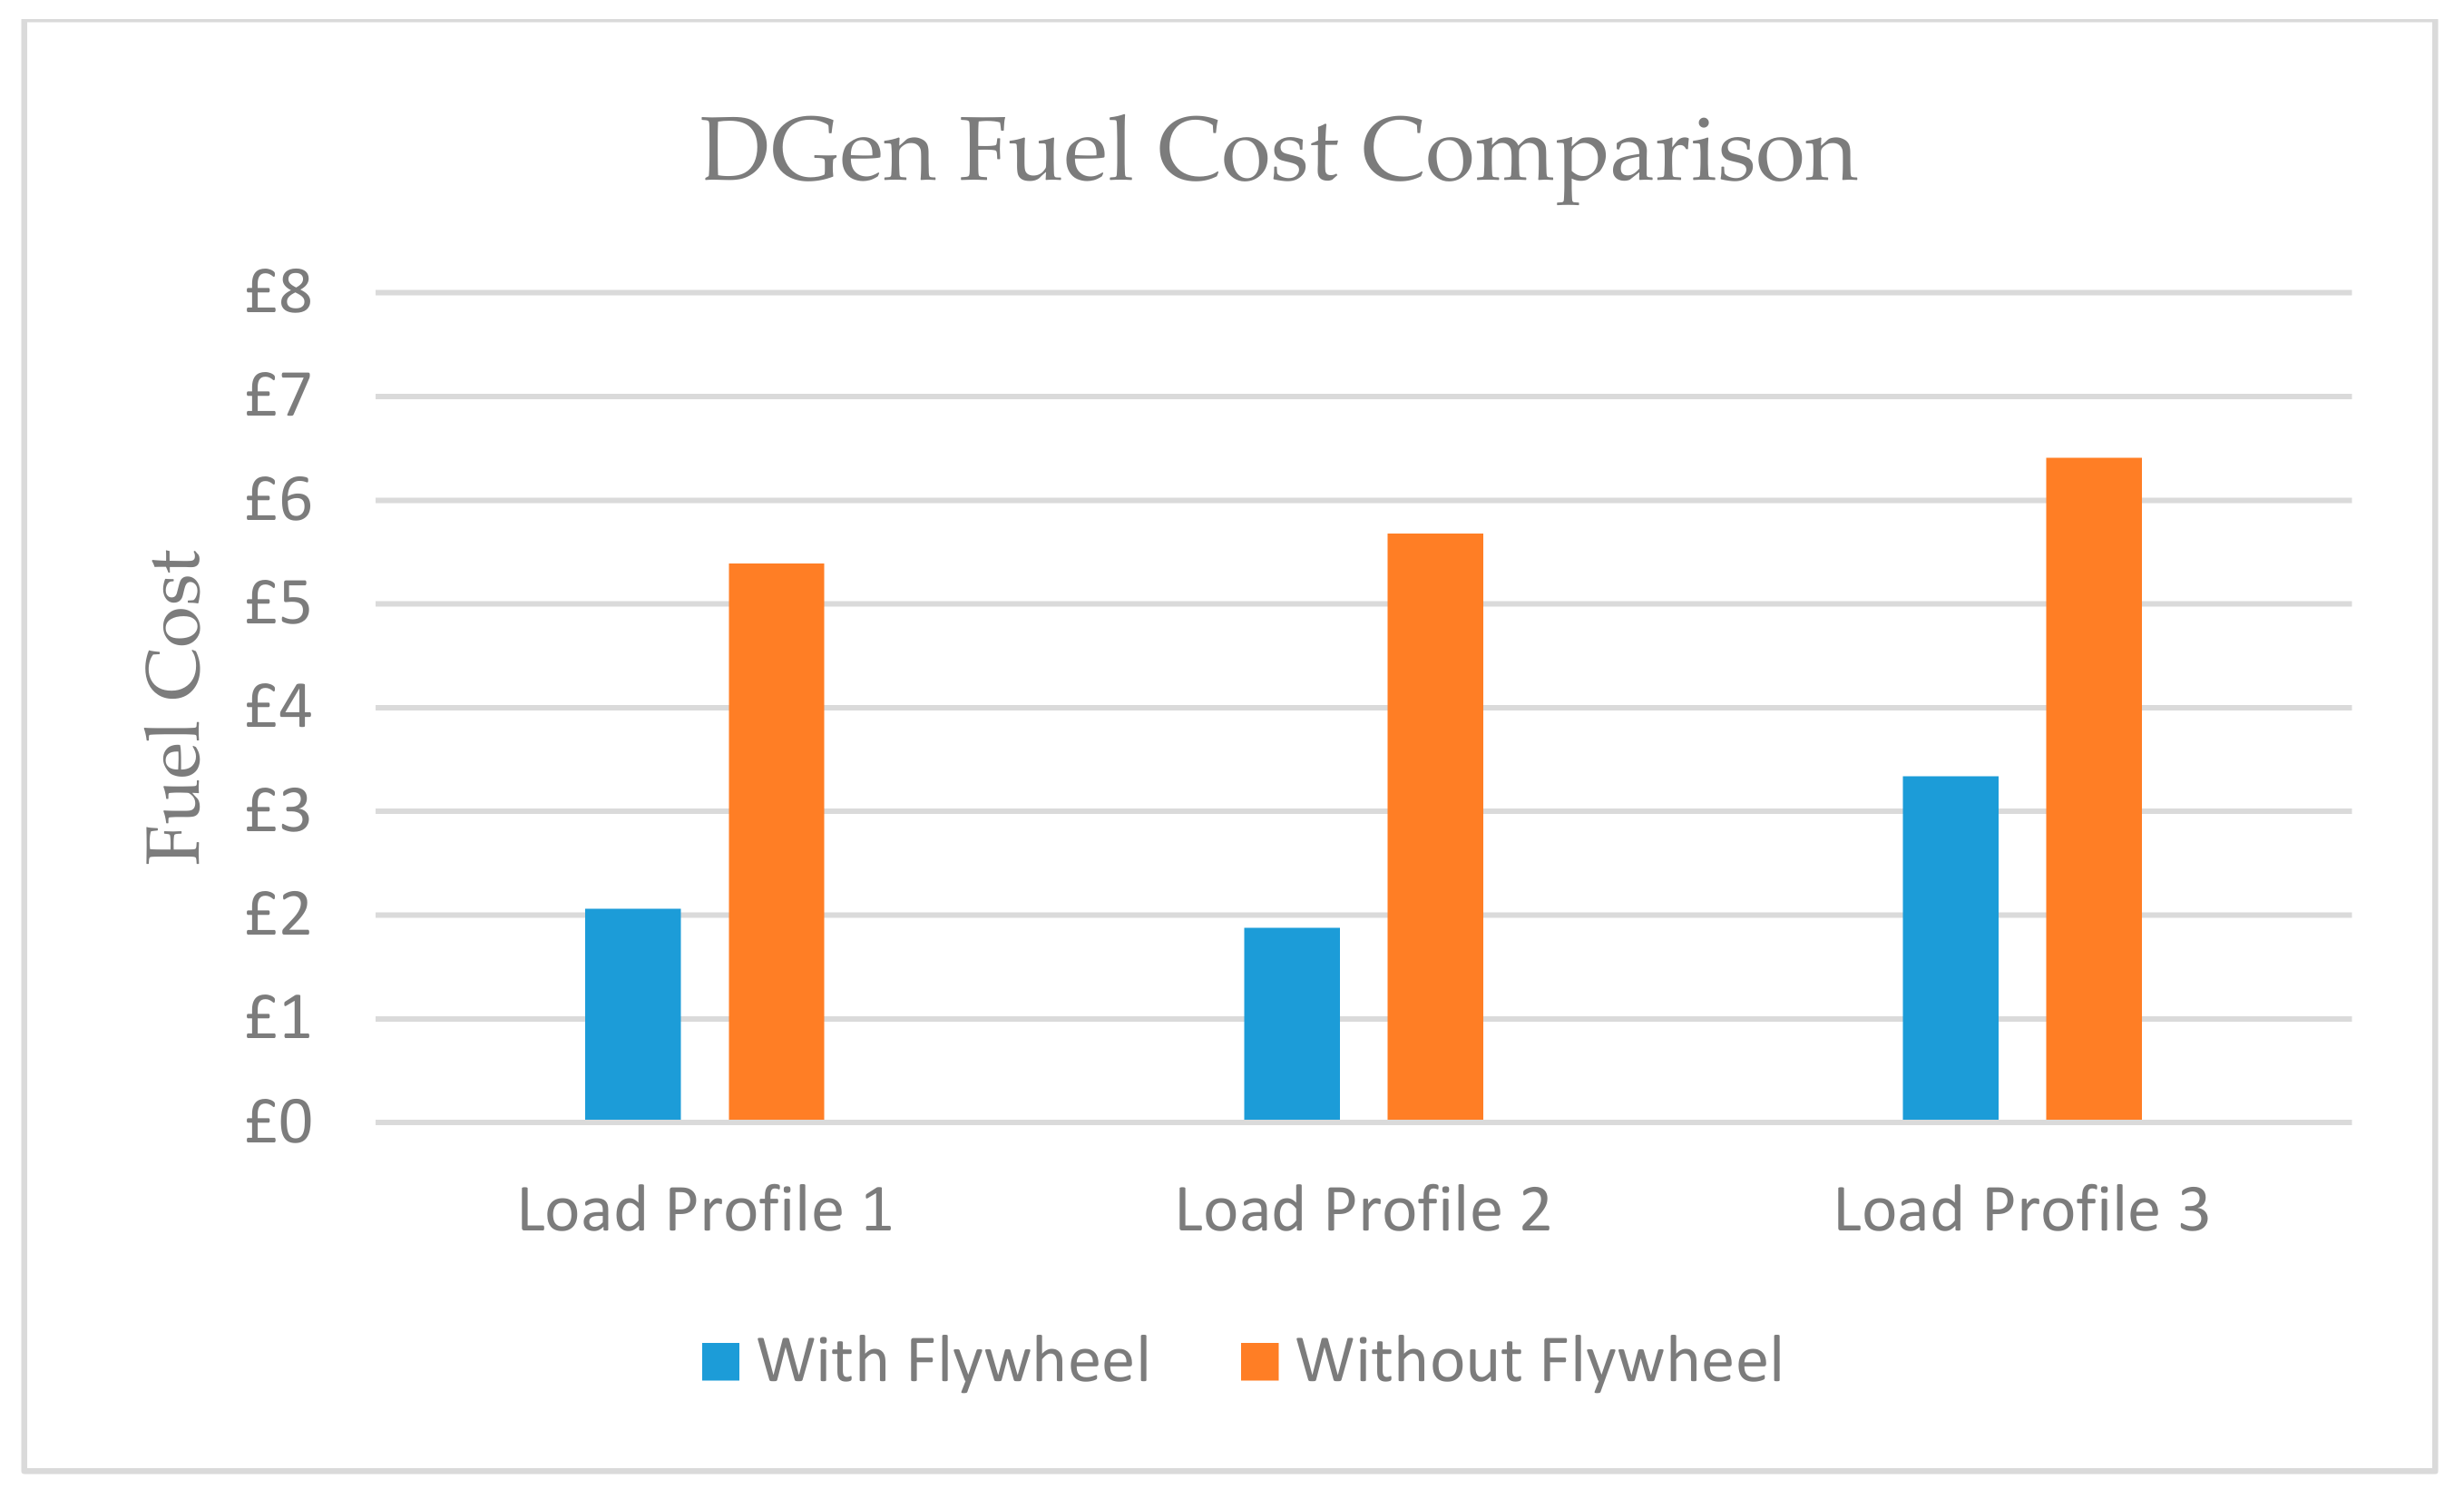
Figure 32 shows the fuel cost comparison of DGen, it shows that the cost of the fuel is significantly reduced. In case of load profile 1, the cost of the fuel is brought down from £5.3 to £2 which represents 61% saving for 19 min of operation. Similarly, for load profile 2 and 3 approximately the savings are 67% and 51%, respectively. The cost of the fuel is calculated by considering current per liter rate of diesel fuel and total fuel burned during operation of each load profile.
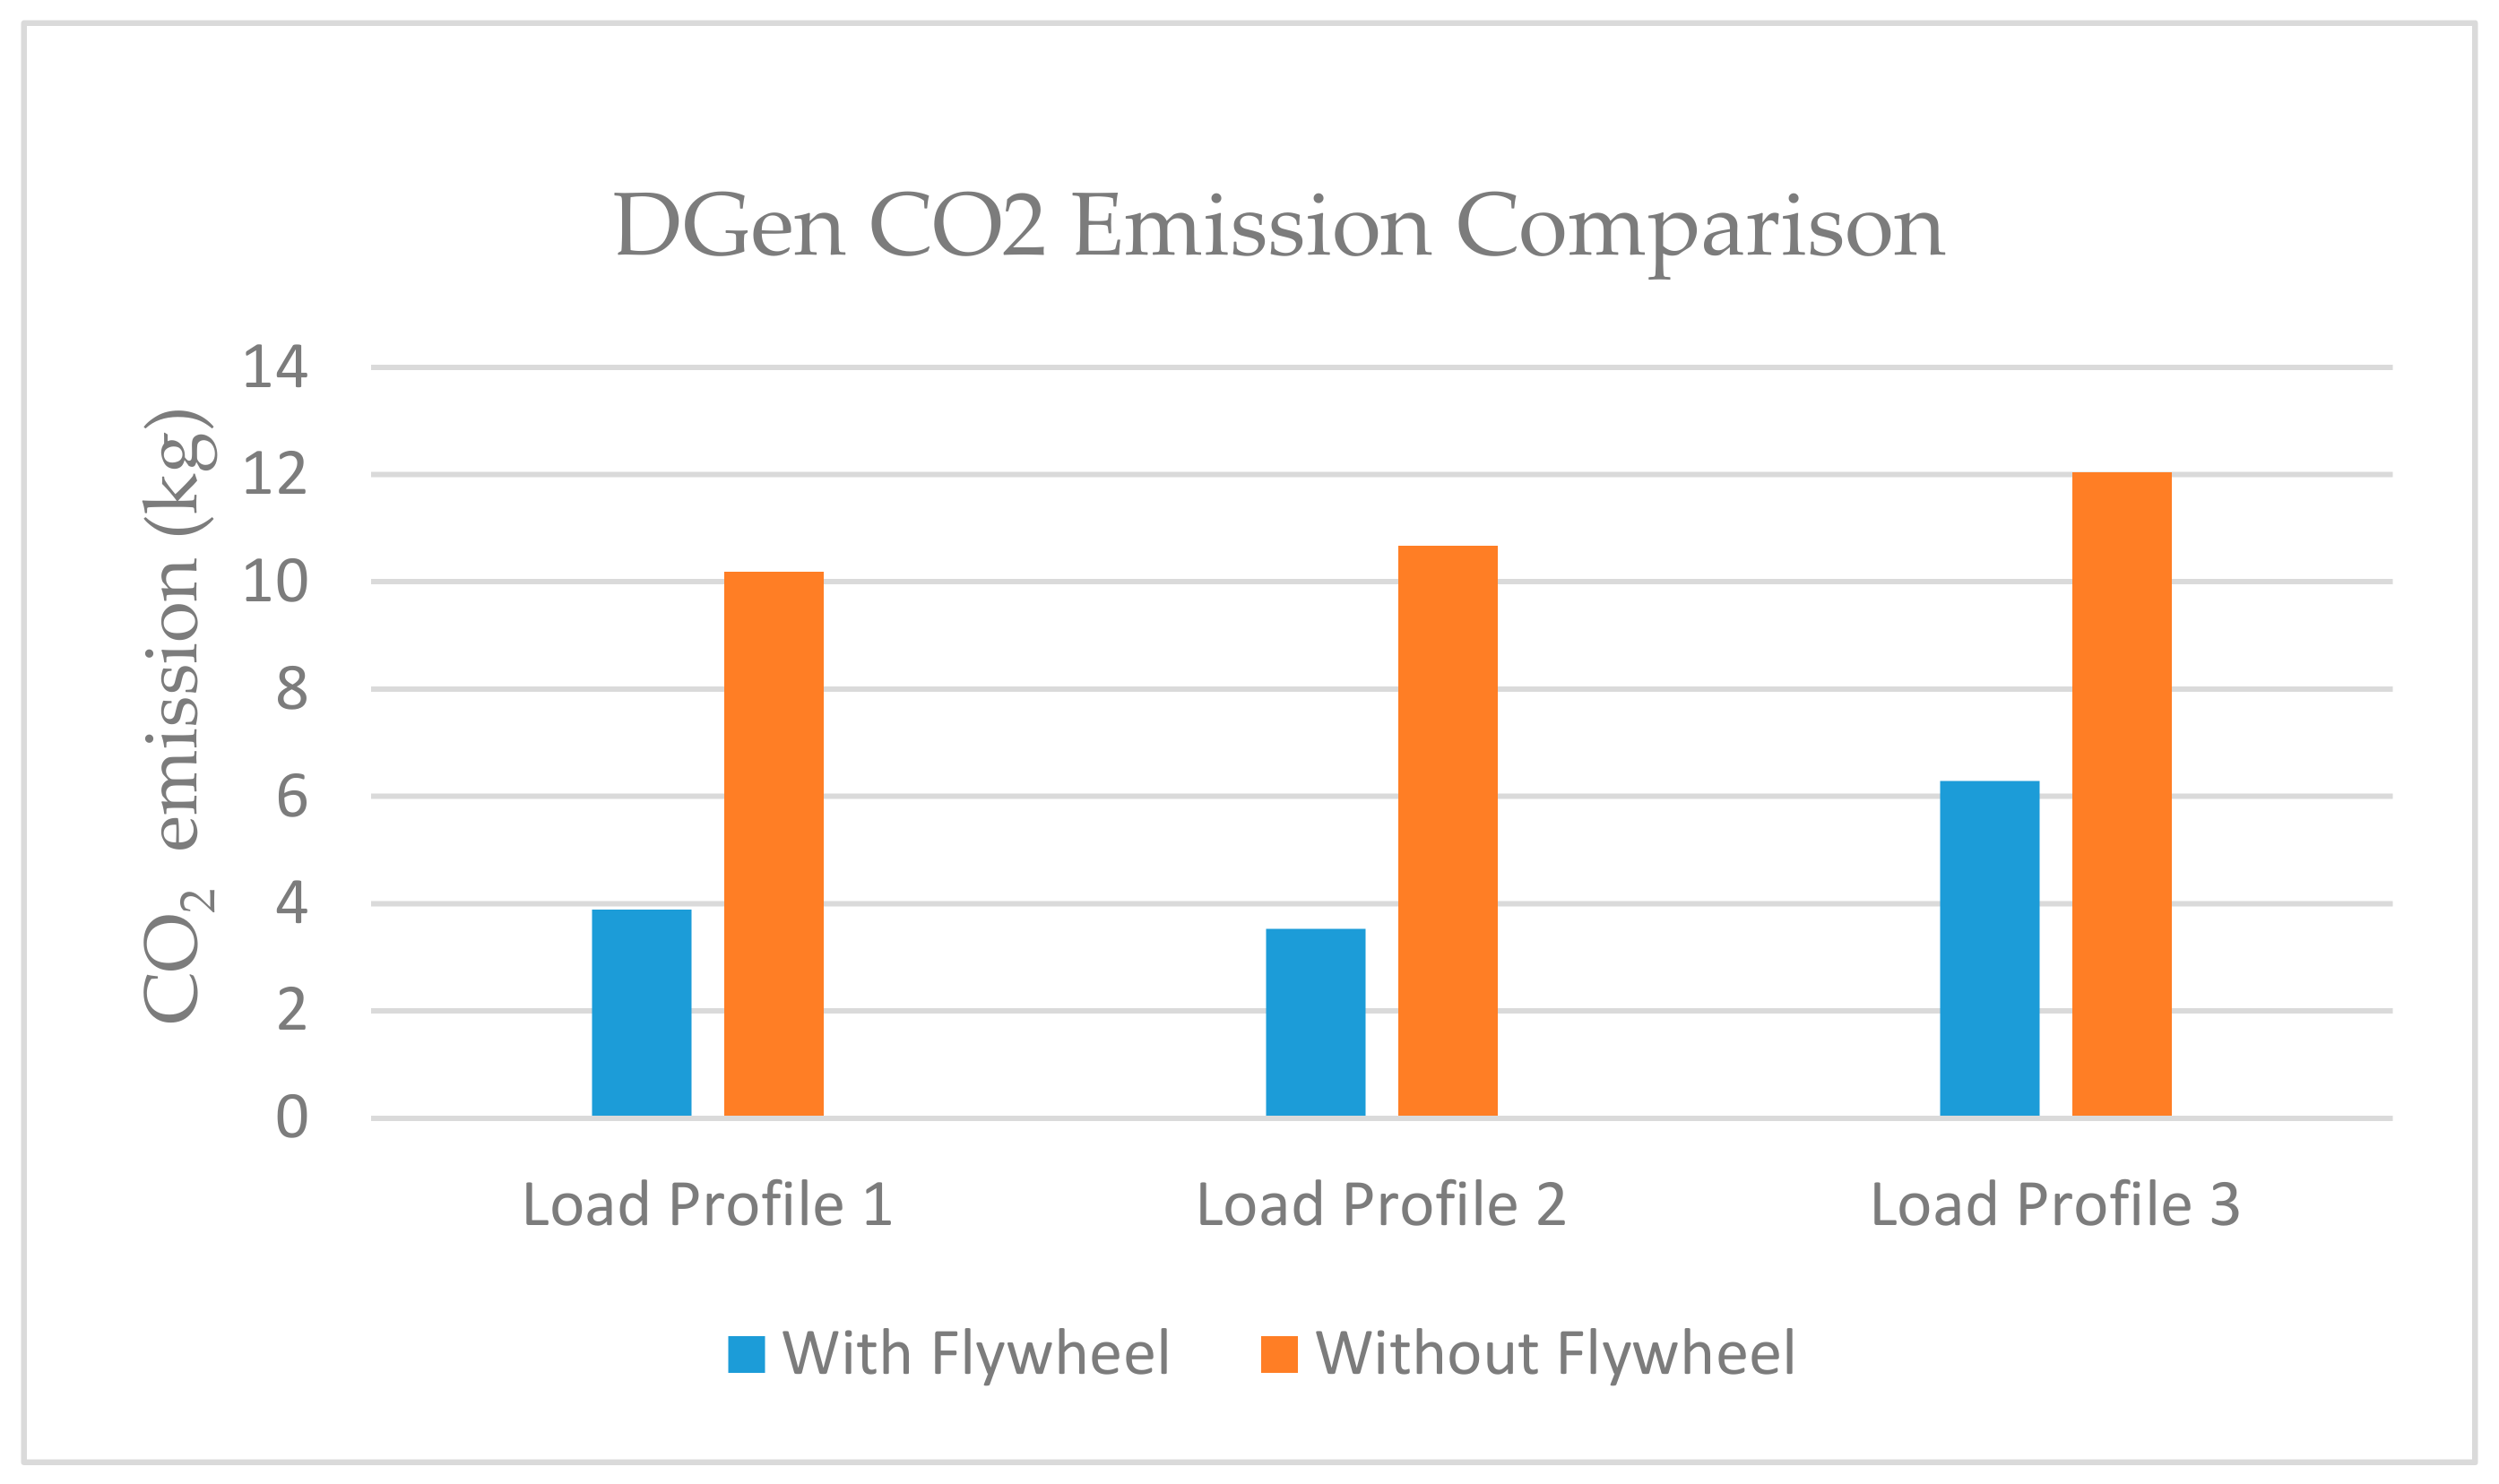
6.2. Diesel CO2 Emission Analysis
The calculation of CO2 emission depends on the type of the fuel and amount of its consumption by DGen. The diesel fuel emits 2.7 kg of CO2 per liter. Different types of fuels have different carbon contents; however, an average carbon content in diesel fuel can be considered in order to estimate the CO2 [17].
Figure 33 presents the CO2 emission analysis; it can be seen that there is huge reduction in carbon emissions with integration of flywheel technology in PVHMS. In the case of load profile 3 without the flywheel, the DGen emits 12 kg of CO2 during 17 min of operation, which drops to 6.1kg of CO2 when flywheel is added in the system. The significant drop can be seen in case in load profile 1 and 3 as well. However, the emissions can further be reduced if size of the energy storage is increased or another type of ESS is integrated in the system besides the flywheel such as battery system.
7. Conclusions
Frequent variations in solar irradiance due to cloud passing make it difficult for PV systems to meet the load demand alone in islanded mode operation, therefore a DGen is an ideal back-up power source to share the load demand with PV system. Additionally, during the night, power is still required and the PV system cannot meet this. During some instances during the day the PV system generates more power than the demand which leads to imbalance between demand and supply, dissipating the excess power in dump load can keep the system stable but is not an efficient solution. Therefore, storing the excess power in a storage device is a is a more sustainable option.
In this paper, a PV hybrid micro islanded system was presented with backup sources of flywheel and DGen. The residential load profile models were created with the help of a high-resolution energy demand model. The residential load was assumed to be of a small town located in remote area. Different load profiles were simulated and the dynamic performance of a hybrid PV system connected with microgrid was analyzed with and without the operation of FESS. The performance of PVHMS and coordination of system components (PV, Flywheel and DGen) when sharing the load was discussed. The impact of the flywheel technology on CO2 emission and fuel cost savings was also discussed and analyzed.
Based on the results, it was concluded that the integration of flywheel energy storage in stand-alone islanded system provides back-up storage, fuel cost reductions, fuel savings and reduced greenhouse gasses. The performance of DGen is less efficient at partial loads which happens when PV system and DGen share the load demand. FESS avoids the frequent variations in diesel generator output which leads to maximum loading of diesel generator. Furthermore, the operation hours of DGen can be reduced further if battery system is introduced as a secondary storage along with the FESS in PVHMS. The battery life and performance can be improved with the operation of the flywheel reducing the load fluctuations. A hybrid model and analysis of the battery and flywheel system for PV applications will be explored in the future work. Another area that will be studied in future research will focus on a detailed cost analysis of the flywheel storage systems addressing the return for investment for a number of common applications.
Author Contributions
Conceptualization, methodology and software, A.S.; investigation, K.R.P.; writing—original draft preparation, A.S.; writing—review and editing, K.R.P. and M.E.A.; supervision, K.R.P. All authors have read and agreed to the published version of the manuscript.
Funding
This research received no external funding.
Informed Consent Statement
No applicable.
Data Availability Statement
No applicable.
Conflicts of Interest
The authors declare no conflict of interest.
References
- AlSkaif, T.; Zopata, M.G.; Boris, B.; Anders, N. A distributed power sharing framework among households in microgrids: A repeated game approach. Comput. Arch. Inform. Numer. Comput. 2016, 99, 23–27. [Google Scholar] [CrossRef] [Green Version]
- Godina, R.; Rodrigues, E.M.G.; Pouresmaeil, E.; Matias, J.C.O.; Catalao, J.P.S. Model Predictive Control Home Energy Management and Optimization Strategy with Demand Response. Appl. Sci. 2018, 8, 408. [Google Scholar] [CrossRef] [Green Version]
- Yan, B.; Wang, B.; Zhu, L.; Liu, H.; Liu, Y.; Ji, X.; Liu, D. A Novel, Stable, and Economic Power Sharing Scheme for an Autonomous Microgrid in the Energy Internet. Energies 2015, 8, 12741–12764. [Google Scholar] [CrossRef] [Green Version]
- Shaahid, S.; Elhadidy, M. Technical and economic assessment of grid-independent hybrid photovoltaic–diesel–battery power systems for commercial loads in desert environments. Renew. Sustain. Energy Rev. 2007, 11, 1794–1810. [Google Scholar] [CrossRef]
- Guney, M.S.; Tepe, Y. Classification and assessment of energy storage systems. Renew. Sustain. Energy Rev. 2017, 75, 1187–1197. [Google Scholar] [CrossRef]
- Dehghani-Sanij, A.; Tharumalingam, E.; Dusseault, M.; Fraser, R. Study of energy storage systems and environmental challenges of batteries. Renew. Sustain. Energy Rev. 2019, 104, 192–208. [Google Scholar] [CrossRef]
- Belfkira, R.; Zhang, L.; Barakat, G. Optimal sizing study of hybrid wind/PV/diesel power generation unit. Sol. Energy 2011, 85, 100–110. [Google Scholar] [CrossRef]
- Ogunjuyigbe, A.; Ayodele, T.; Akinola, O. Optimal allocation and sizing of PV/Wind/Split-diesel/Battery hybrid energy system for minimizing life cycle cost, carbon emission and dump energy of remote residential building. Appl. Energy 2016, 171, 153–171. [Google Scholar] [CrossRef]
- Amiryar, M.E.; Keith, P.R. Assessment of the Carbon and Cost Savings of a Combined Diesel Generator, Solar Photovoltaic, and Flywheel Energy Storage Islanded Grid System. Energies 2019, 12, 3356. [Google Scholar] [CrossRef] [Green Version]
- Arani, A.K.; Karami, H.; Gharehpetian, G.; Hejazi, M. Review of Flywheel Energy Storage Systems structures and applications in power systems and microgrids. Renew. Sustain. Energy Rev. 2017, 69, 9–18. [Google Scholar] [CrossRef]
- Holm, S.R. Modelling and Optimization of Permanent Magnet Machine in a Flywheel. Ph.D. Thesis, Delft University of Technology, Delft, The Netherland, 2003. [Google Scholar]
- Feng, J.; Gonbao, W.; Lijun, F.; Ruitian, W.; Zhen, X. Controller design of flywheel energy storage sysems in microgrid. In Proceedings of the 17th International Conference on Electrical Machines and Systems (ICEMS), Hangzhou, China, 22–25 October 2014. [Google Scholar]
- Amezquita-Brooks, L.; Liceaga-Castro, J.; Liceaga-Castro, E. Speed and Position Controllers Using Indirect Field-Oriented Control: A Classical Control Approach. IEEE Trans. Ind. Electron. 2014, 61, 1928–1943. [Google Scholar] [CrossRef]
- Diaz-Gonzalez, F.; Sumper, A.; Gomis-Bellmunt, O. Energy Storage in Power Systems; John Wiley & Sons Ltd.: Hoboken, NJ, USA, 2016. [Google Scholar]
- Palacios-Garcia, E.J.; Moreno-Muñoz, A.; Santiago, I.; Moreno-Garcia, I.M.; Milanés-Montero, M.I. PV Hosting Capacity Analysis and Enhancement Using High Resolution Stochastic Modeling. Energies 2017, 10, 1488. [Google Scholar] [CrossRef] [Green Version]
- McKenna, E.; Thomson, M. High-resolution stochastic integrated thermal–electrical domestic demand model. Appl. Energy 2016, 165, 445–461. [Google Scholar] [CrossRef] [Green Version]
- Jakhrani, A.Q.; Othman, K.A.; Rigit, R.H.A.; Samo, S.R.; Kamboh, S.A. Estimation of Carbon Footprints from Diesel Generator Emissions. In Proceedings of the 2012 International Conference in Green and Ubiquitous Technology, Bandung, Indonesia, 7–8 July 2012. [Google Scholar]
Figure 1.
Structure of flywheel energy storage systems (FESS).

Figure 2.
Control structure of MSC and GSC in SCIM-FESS.

Figure 3.
Schematic design of proposed PVHMS.

Figure 4.
Simulink Model of FESS.

Figure 5.
Load profile 1 for the month of April over 24 h.

Figure 6.
Solar Irradiance on weekday for the month of April over 24 h.

Figure 7.
Load profile 2 for the month of August over 24 h.

Figure 8.
Irradiance on weekend for the month of August over 24 h.

Figure 9.
Load profile 3 for the month of December over 24 h.

Figure 10.
Irradiance on weekend for the month of December over 24 h.

Figure 11.
Logic Control Scheme of proposed PVHMS.

Figure 12.
Power curves of solar PV, load demand and diesel generator.

Figure 13.
DC Link voltage for Load Profile 1.

Figure 14.
(a) Zoom in view of three phase currents. (b) Three phase currents of Diesel Generator.

Figure 15.
Power curves of Dgen, load demand and PV system for load profile 2.

Figure 16.
DC link voltage profile for load model 2.

Figure 17.
(a) Dgen three phase currents; (b) Zoom in view of currents.

Figure 18.
Power curves of PV system, load demand and Dgen for load profile 3.

Figure 19.
(a) Diesel generator three phase currents; (b) Zoom in view of currents.

Figure 20.
DC link voltage for load profile 3.

Figure 21.
Combined power curves of Dgen, load demand PV system and flywheel.

Figure 22.
DC link voltage for load profile 1 with flywheel.

Figure 23.
(a) %SoC of flywheel; (b) Flywheel torque.

Figure 24.
(a) Zoom in view of three phase currents. (b) Three phase currents of DGen.

Figure 25.
Combined power curves of Flywheel, DGen and PV system.

Figure 26.
(a) %SoC of flywheel; (b) Flywheel torque.

Figure 27.
A DC link voltage for load profile 2 with flywheel operation.

Figure 28.
Combined power curves of Load, PV system, Flywheel and DGen.

Figure 29.
(a) %SoC of flywheel; (b) Flywheel torque.

Figure 30.
DC link voltage for load profile 3 with flywheel operation.

Figure 31.
(a) Three phase currents of DGen; (b) Zoom in view of three phase currents.

Figure 32.
Fuel cost comparison of DGen with and without FESS.

Figure 33.
DGen emission comparison with and without FESS.


Table 1.
Parameters of proposed SCIM-FESS.
| Parameter | Value |
|---|---|
| Stator Resistance | 11.85 mΩ |
| Rotor Resistance | 9.29 mΩ |
| Stator leakage inductance | 0.2027 mH |
| Rotor leakage inductance | 0.2027 mH |
| Mutual Inductance | 9.295 mH |
| Rated magnetic flux | 0.75 Weber |
| Power rating | 100 kW |
| Maximum speed | 20 krpm |
| Minimum speed | 10 krpm |
| Switching frequency | 20 kHz |
| DC bus voltage | 600 V |
| Flywheel rotor outer diameter | 0.4 m |
| Shaft diameter | 0.025 m |
Table 2.
Parameter specifications of DGen and the PV system used in proposed PVHMS.
| Source Type | Specification | Value/Description | |
|---|---|---|---|
| Synchronous Diesel Generator | Nominal Power | 100 (kW) | |
| Nominal Frequency | 50 (Hz) | ||
| Power Factor | 0.8 | ||
| % Load | liter/h | ||
| Fuel Consumption | 100 | 26.7 | |
| 75 | 20.2 | ||
| 50 | 14.1 | ||
| Model | 1104C-44TAG2 | ||
| Engine Speed | 1800 (rpm) | ||
| Engine Make | PERKINS | ||
| Solar Photovoltaic System | Model | SunPower SPR-305E-WHT-D | |
| Maximum power | 305.226 (W) | ||
| Temperature | 40 (°C) | ||
| Maximum irradiance | 1200 (W/m2) | ||
| Maximum power point current | 5.58 (A) | ||
| Maximum power point voltage | 54.7 (V) | ||
| Parallel strings | 50 | ||
| Series connected strings | 5 | ||
Table 3.
DGen fuel consumption without FESS.
| Operation Scenario | Operation Ratio at % Load | Total Fuel Consumption (Liters) | ||||
|---|---|---|---|---|---|---|
| 50% | 75% | 100% | 50% | 75% | 100% | |
| Load Profile 1 | 47% | 7.5% | 15% | 1.9 | 0.505 | 1.26 |
| Load Profile 2 | 93.5% | 6.5% | 0% | 3.6 | 0.24 | 0 |
| Load Profile 3 | 56% | 15% | 18% | 2.16 | 0.841 | 1.33 |
Table 4.
DGen Fuel Consumption with FESS.
| Operation Scenario | Operation Ratio at % Load | Total Fuel Consumption (Liters) | ||||
|---|---|---|---|---|---|---|
| 50% | 75% | 100% | 50% | 75% | 100% | |
| Load Profile 1 | %0 | %0 | 17.5% | 0 | 0 | 1.4 |
| Load Profile 2 | %0 | %0 | 23.7% | 0 | 0 | 1.27 |
| Load Profile 3 | %0 | %0 | 31% | 0 | 0 | 2.26 |
Publisher’s Note: MDPI stays neutral with regard to jurisdictional claims in published maps and institutional affiliations. |
© 2021 by the authors. Licensee MDPI, Basel, Switzerland. This article is an open access article distributed under the terms and conditions of the Creative Commons Attribution (CC BY) license (https://creativecommons.org/licenses/by/4.0/).
Share and Cite
MDPI and ACS Style
Soomro, A.; Pullen, K.R.; Amiryar, M.E. Hybrid PV System with High Speed Flywheel Energy Storage for Remote Residential Loads. Clean Technol. 2021, 3, 351-376. https://0-doi-org.brum.beds.ac.uk/10.3390/cleantechnol3020020
AMA Style
Soomro A, Pullen KR, Amiryar ME. Hybrid PV System with High Speed Flywheel Energy Storage for Remote Residential Loads. Clean Technologies. 2021; 3(2):351-376. https://0-doi-org.brum.beds.ac.uk/10.3390/cleantechnol3020020
Chicago/Turabian StyleSoomro, Abid, Keith R. Pullen, and Mustafa E. Amiryar. 2021. "Hybrid PV System with High Speed Flywheel Energy Storage for Remote Residential Loads" Clean Technologies 3, no. 2: 351-376. https://0-doi-org.brum.beds.ac.uk/10.3390/cleantechnol3020020