Article

Impact of Pyrolysis Oil Addition to Ethanol on Combustion in the Internal Combustion Spark Ignition Engine

by
Magdalena Szwaja
1,
Mariusz Chwist
1,
Stanislaw Szwaja
1,* and
Romualdas Juknelevičius
2
1
Faculty of Mechanical Engineering and Computer Science, Czestochowa University of Technology, 21 Armii Krajowej St., 42-200 Czestochowa, Poland
2
Faculty of Mechanics, Vilnius Gediminas Technical University, J. Basanavicius str. 28, 03224 Vilnius, Lithuania
*
Author to whom correspondence should be addressed.
Submission received: 19 March 2021 / Revised: 22 April 2021 / Accepted: 28 April 2021 / Published: 26 May 2021
(This article belongs to the Special Issue Fuel Processing and Internal Combustion Engines)

Abstract

:
Thermal processing (torrefaction, pyrolysis, and gasification), as a technology can provide environmentally friendly use of plastic waste. However, it faces a problem with respect to its by-products. Pyrolysis oil obtained using this technology is seen as a substance that is extremely harmful for living creatures and that needs to be neutralized. Due to its relatively high calorific value, it can be considered as a potential fuel for internal combustion spark-ignition engines. In order make the combustion process effective, pyrolysis oil is blended with ethanol, which is commonly used as a fuel for flexible fuel cars. This article presents results from combustion tests conducted on a single-cylinder research engine at full load working at 600 rpm at a compression ratio of 9.5:1, and an equivalence ratio of 1. The analysis showed improvements in combustion and engine performance. It was found that, due to the higher calorific value of the blend, the engine possessed a higher indicated mean effective pressure. It was also found that optimal spark timing for this ethanol-pyrolysis oil blend was improved at a crank angle of 2–3° at 600 rpm. In summary, ethanol-pyrolysis oil blends at a volumetric ratio of 3:1 (25% pyrolysis oil) can successfully substitute ethanol in spark-ignition engines, particularly for vehicles with flexible fuel type.

1. Introduction

Pyrolysis oil (PO) is a black, liquid substance obtained from the thermal processing of organic substances at temperatures of 350–600 °C in the absence of oxygen. This thermal process is known as pyrolysis. It is considered the most effective technology for the subsequent utilization of used tires, as well as other organic compounds. As a result of this process, three products are generated: carbon-rich char, gases, and hydrocarbon vapors, which condense to liquids when cooled to ambient temperatures. The liquids can be treated as alternative fuels; hence, they can be burned in internal combustion engines. Thermal processing technologies—including torrefaction, pyrolysis, and gasification—are commonly used for biomass processing, with a focus on the production of charcoal and syngas, which can be used as alternative fuels.
The amount of both producer gas and charcoal depends on the following: the input feedstock, the process temperature, and the retention time of the feedstock inside a pyrolysis reactor. In addition, the physicochemical properties of the liquid fuel obtained from the pyrolysis process also vary depending on the feedstock [1,2,3,4]. Furthermore, at various process temperatures (350–600 °C), the ratio of char, oil and syngas also vary. Table 1 shows the percentage of gaseous, liquid, and solid products from pyrolysis in plants presented in papers [5,6,7,8].
The quality of the pyrolysis oil depends on its further processing. To that end, distillation is applied to obtain physical and chemical properties like those of diesel fuel [9]. Vihar et al. [9] found that their pyrolysis oil was more viscous than diesel fuel. As stated by Marinangelli [10], Chwist [11] and Mikulski [12], the pyrolysis liquid fractions were characterized by a lower viscosity in comparison to diesel fuel. Another parameter that has been found to be significant in terms of fuel suitability is acid number. For commercial diesel fuel, the acid number amounted to less than 0.08 mg KOH/g. Pyrolysis oil is usually characterized by acid numbers higher than 2 mg KOH/g, depending on distillation temperature [9,11]. The standard allows acid numbers no higher than 0.5 mg KOH/g.
The application of pyrolysis oil as a potential engine fuel can be divided into two types of engines as follows:
  • Compression ignition (CI) engines,
  • Spark ignition (SI) engines.

1.1. Compression Ignition Engines

The use of pyrolysis oil as a potential fuel for internal combustion (IC) CI diesel engines is more common than for IC SI engines. This is due to the cetane number of the pyrolysis oil, which is indicative of the ease of the fuel’s self-ignition [12,13,14]. The literature contains reports on research on the use of pyrolysis oil as an additive in regular diesel fuel, as well as its use as a stand-alone fuel. For example, Koc et al. [15] conducted an analysis of engine operation using a mixture of diesel fuel, biodiesel, and pyrolysis oil obtained from waste rubber (tires). The addition of individual components was as follows: 80% diesel fuel, 10% biodiesel, and 10% pyrolysis oil. The authors found that the addition of this pyrolysis oil increased the engine torque and power, while reducing NOx and CO emissions. They concluded that the disadvantage of pyrolysis oil was the need for it to be first filtered and desulphurized. Koc paid further attention to the fact that pyrolysis oil is better used as a fuel additive than as a stand-alone fuel. Vihar et al. [9] used tire pyrolysis oil as fuel for a four-cylinder diesel engine. They concluded that even though their pyrolysis oil had a lower cetane rating, it was still a promising alternative fuel. They observed that the engine was only able to work when pyrolysis oil was used without the addition of improvers to obtain a higher cetane number. The use of oil from the pyrolysis of tires makes it possible to maintain the exhaust emission of toxic gas components levels comparable to those where the engine is running on regular diesel fuel. Due to problems with solubility in diesel fuel, Krutof [16] suggested adding methanol to pyrolysis oil—a bio-oil mixture. Hurdogan et al. [17] used oil from tire pyrolysis as a diesel fuel additive. The authors created mixtures with 10%, 20%, and 50% by volume of pyrolysis oil. They concluded that the addition of 10% pyrolysis oil could result in an alternative fuel that provided satisfactory engine performance, as well as beneficial environmental aspects. Kumar et al. [18] confirmed usability of pyrolysis oil from plastic waste at 10% additive to diesel fuel. They also tested pyrolysis oil at amount of 20 and 30%, but 10% was found as the best with respect to increase in engine brake thermal efficiency and brake specific fuel consumption. The 10% pyrolysis oil in blends with diesel fuel had similar properties of the diesel fuel and can be used as a partial replacement of that fuel. Tomar et al. [19] observed reduction of 30% in NOx, CO, and UHC emissions in comparison with neat diesel fuel while adding pyrolysis oil at amount of 20% by volume. Kim and Lee [20] stated that pyrolysis oil is chemically unstable resulting in polymerization, increasing its viscosity. Hence, they proposed to mix it with butanol before use in a CI engine.
There are several studies confirming that pyrolysis oil can be successfully used as the additive to diesel fuel. However, there are several drawbacks regarding as follows:
  • The purity of the pyrolysis oil is critical due to applying high pressure injection systems based on 3rd generation of piezoceramic injectors [12,21],
  • The poor solubility in diesel fuel and the mixture stability. Chwist et al. [11,22] found that the mixture of pyrolysis oil and diesel fuel after several hours in a tank forms a jelly-like substance that can clog a fuel pump.
Therefore, research efforts undertaken by the authors of this article were concentrated on applying pyrolysis oil as a blend with ethanol for SI engines. To increase octane rating of the final fuel, ethanol was used as the effective solvent for pyrolysis oil. Additionally, it caused better stability of the blend in comparison to pyrolysis oil blended with diesel fuel.

1.2. Spark Ignition Engines

Among others, Kalagaris et al. [23] and Yongsheng et al. [24] made attempts to use alcohol-pyrolysis oil blends for the spark ignition engine. Kalagaris presented results of the experiment on combustion of the mixture of pyrolysis bio-oil with alcohols (methanol, ethanol) in the spark ignition engine. Other ecological aspects, which leads to decrease in exhaust emission, is the use of alcohol fuel for the engine. Using an alcohol for the CI engine was difficult because of their high auto-ignition temperature and high latent heat of vaporization. Both of these parameters obstruct ignition. As stated by Kalargaris [23] use of hydrocarbon-alcohol blends in the CI engine causes a decrease in CO2 and soot emissions. Sunaryo et al. [25] tested pyrolysis oil from plastic waste in an internal combustion spark ignited (SI) engine. The research was focused on engine performance and exhaust emissions. The results showed that the characteristics of pyrolysis oil have similar physical properties when compared to gasoline fuels. The oil produced exhaust gas emissions in the form of lower HC and CO and more efficient fuel consumption compared to gasoline. These results indicated that the pyrolysis oil of plastic waste can be a promising alternative fuel to be applied to the SI engine. Kareddula et al. [26] investigated influence of plastic based pyrolysis oil blended gasoline and ethanol on engine performance. Experiments were conducted on the Maruti 800 spark ignited engine. The authors used gasoline blended with 15% pyrolysis oil and with and without ethanol additive at amounts of 5%. The experimental outcomes determined the brake thermal efficiency of 15% pyrolysis oil was lower than that of pure gasoline while the NOx emissions were remarkably increased. Hence, ethanol was used as additive to reduce the NOx emissions. They found engine performance was slightly improved compared to pure gasoline with 15% pyrolysis oil.
Based on a literature survey, the authors of this article concluded that there is a gap in research works on applying pyrolysis oil blended alcohols as the fuel for the spark ignition engine. Hence, the main target of the work raised by authors, was to investigate impact of pyrolysis oil addition at 25% to ethanol on combustion process and performance (indicated mean effective pressure—IMEP) in the spark ignition engine.

2. Methodology and Setup

The fuel proposed for investigation was the blend of ethanol and pyrolysis oil at ratio of 3:1, respectively. A percentage of 75:25 (3:1) was selected regarding the fraction for pyrolysis oil, that resulted in non-knocking combustion in the SI engine. Due to performing comparative analysis of the pyrolysis oil blended ethanol, pure ethanol was used as the reference fuel for combustion tests.
The physical-chemical properties of the pyrolysis oil used for investigation are depicted in Table 2. In Table 3 test matrix is presented. As depicted, the preliminary tests were done to find the spark timing (ST) optimal, which is associated with maximum IMEP generated by the engine. In next stage, combustion phases were determined and comparison between combustion tests of ethanol + PO and pure ethanol were made.
In Figure 1 a simplified diagram of the test bench is shown. The main part of the test bench is the UIT 85 engine with the engine technical specifications given in Table 4. This is a single cylinder spark-ignition engine with variable compression ratio that had several modifications to work on various alternative fuels. The most important change was the modification of the fueling system. A Port Fuel Injection (PFI) system with an injector mounted in the intake manifold was used. The fuel pump was replaced with a fuel buffer tank with constant pressure inside maintained by a compressor. This solution provided for a more stable fuel dosing.
As shown in Figure 1 the test bench consists of the IC engine (11), the fueling system (4), control unit (10) and data acquisition system (8,9). The driving pressure in the fuel system is set to 4 bar. An electronic control unit (10) is used to set spark timing, coil dwell time (influencing the spark discharge power), injection dose and injection timing. The system uses an encoder (12) attached to the camshaft for generating pulses that synchronize in-cylinder pressure with engine crankshaft position. All the measured parameters are analyzed in real-time. The air intake system consists of the following: an air filter (1), an air flow meter (2) and a plenum with volume of 120 dm3 (3) to suppress pressure pulsations from the engine intake charge exchange process. Lambda air ratio and temperature is measured with the aid of a wide-band UEGO sensor (14) and the exhaust gas temperature sensor (15), respectively. The engine (11) during the tests was working at a constant speed of 600 rpm to be consistent with regulations for fuel octane rating from combustion tests in the CFR engine. The load generated by the engine was transferred to a brake unit, that was an asynchronous electric motor controlled by a frequency inverter. The engine features with a variable compression ratio mechanism from 7 to 13.5 realized through lifting up or down its cylinder head. In these combustion studies, the engine compression ratio was set at 9.5. Table 4 presents in detail engine specifications.

Measurement Apparatus

The following parameters were measured: in-cylinder pressure, pressure in the intake manifold, intake temperature, ambient temperature and pressure, exhaust temperature, air flow rate, air excess ratio “lambda”, crankshaft position and its speed. Information on types and accuracies of the measurement instrumentation is included in Table 5.
Viscosity was measured at 20 °C with the aid of Brookfield DV-II+ viscometer. Elemental analysis CHN was made with the aid of Leco CHN628. A sample was burned in pure oxygen at 950 °C. Higher heating value was determined with the aid of LECO AC500. GC + MS Agilent, in Split mode was used to determine several specific compounds.

3. Results and Discussion

The main objective of the research was to prove pyrolysis oil blended with ethanol can be used as the fuel to SI engine without significant change in engine performance expressed by IMEP and combustion thermodynamics expressed by combustion duration phases.
The investigation was divided into three tasks as follows:
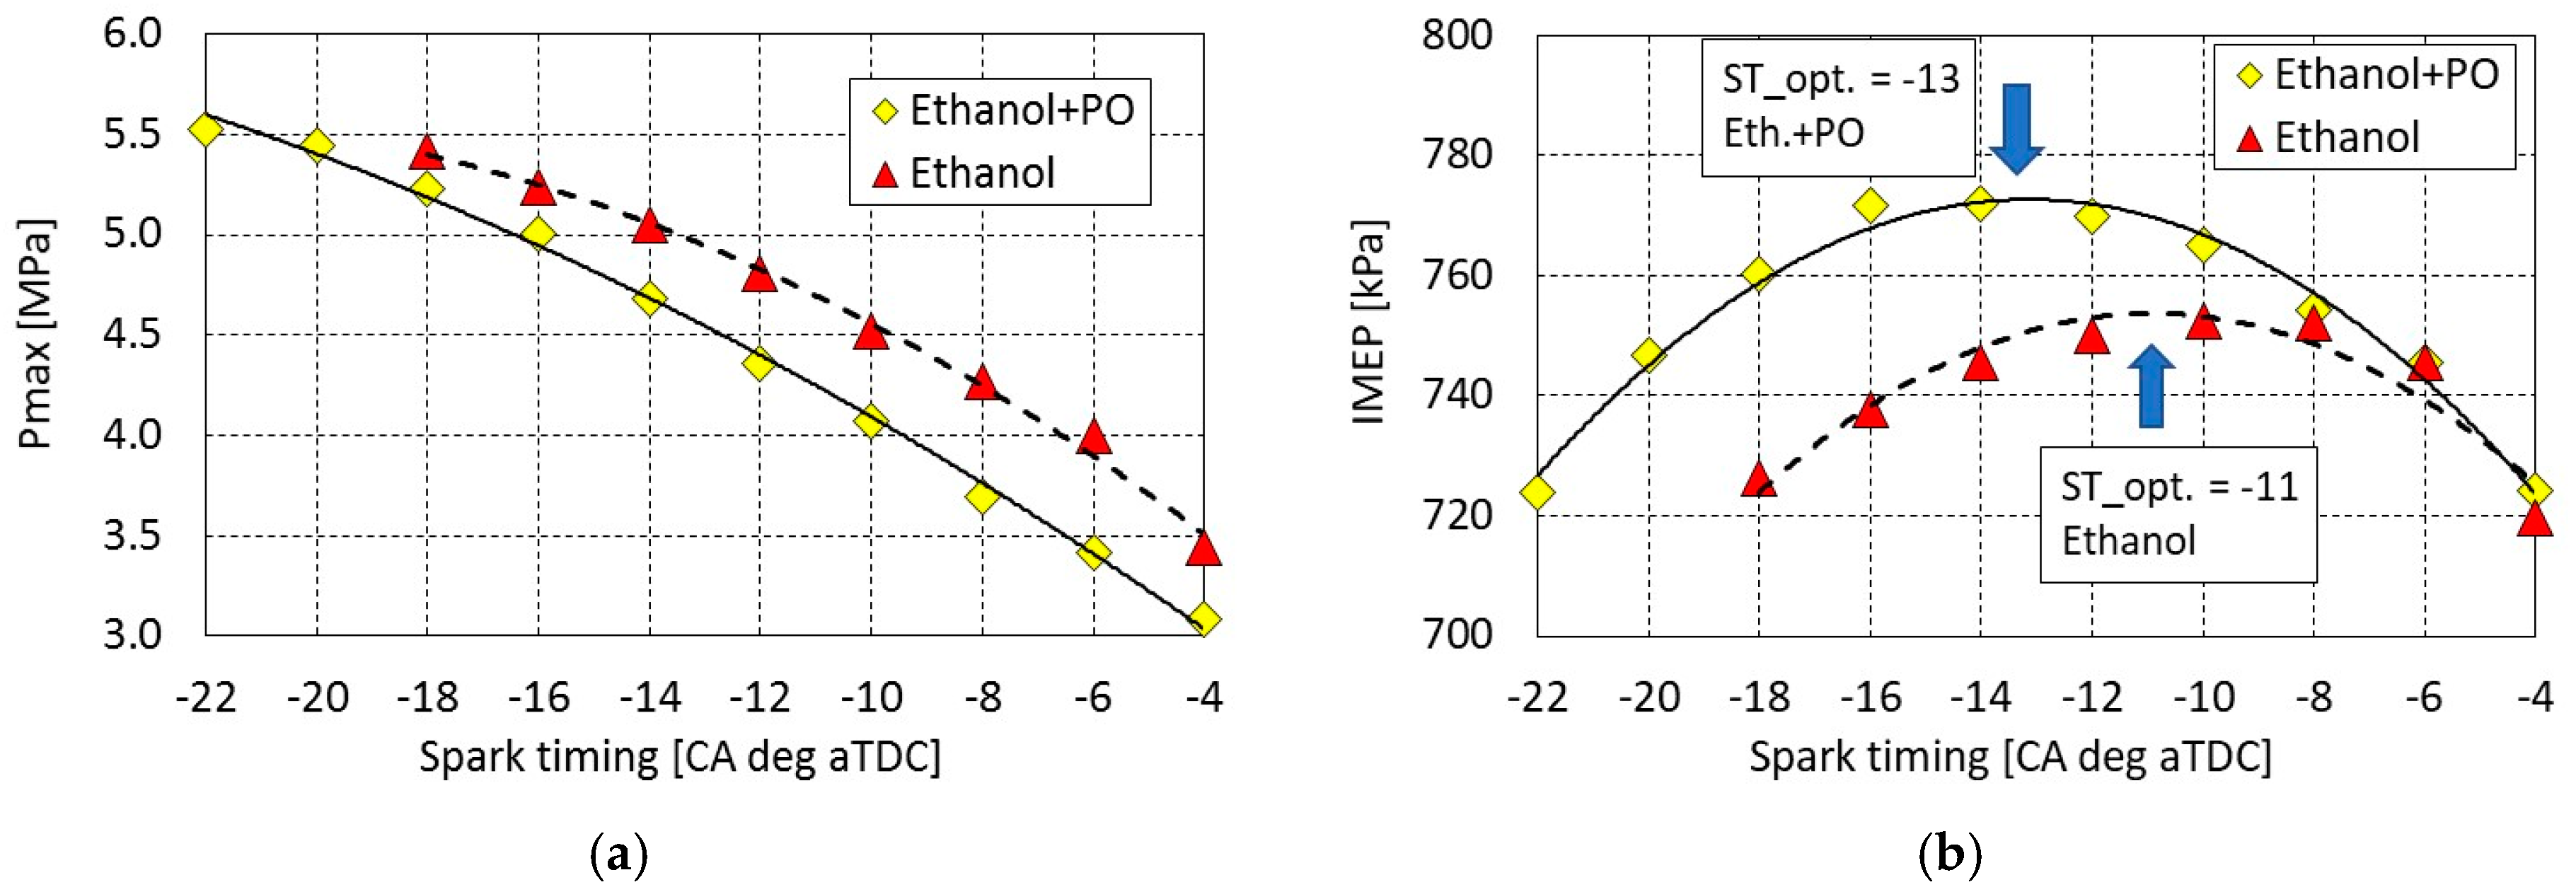
  • Preliminary research with changing spark timing to determine its optimal location vs. crank angle. Hence, optimal spark timing at maximum IMEP was determined. Additionally, maximum IMEP and coefficient of variance (COV) of IMEP were calculated;
  • Investigation on combustion duration phases—two combustion duration phases expressed in crank angle (CA) deg were determined on the basis of energy conservation law and in-cylinder combustion pressure traces as follows:
    -
    initial combustion phase CA0-10, which shows the first 10% heat released (considered as 10% fuel burnt) and it can correspond to ignition delay;
    -
    main combustion phase CA10-90 presenting next 80% heat released;
    -
    middle location of combustion CA50;
  • Investigation on knocking like conditions on the basis of pressure rise rate (defined as derivative dp/dCA).

3.1. Optimal Spark Timing and Engine Performance

As mentioned in the test matrix (Table 2) ST in combustion tests for both these fuels was changed from −22 to −4 CA deg referred to after top dead center (aTDC). Negative values mean that spark timing occurred before TDC. Maximum (peak) combustion pressure Pmax presented in Figure 2a systematically increases with ST being more advanced, however, IMEP has its maximum in this ST range as depicted in Figure 2b. This plot is useful for determination of optimal spark timing (ST_opt). Following the polynomial trend line of second order for these both cases the ST_opt was calculated and determined as follows: −13 CA deg aTDC and −11 CA deg aTDC for ethanol + PO and ethanol, respectively. However, as observed in Figure 2b the maximum in IMEP is located between −16 and −12 CA deg aTDC for ethanol + PO and between −12 and −8 deg aTDC for pure ethanol.
The tests were performed under strict conditions at fixed fuel doses and constant lambda. Hence, these both parameters cannot affect engine performance, so does IMEP. The only parameter influencing on engine performance was the spark timing. The IMEP higher for ethanol + PO (3:1) when compared to ethanol, was caused by high calorific value of the pyrolysis oil. Hence, mixture of pyrolysis oil and ethanol also featured with higher calorific value. Summary of optimal spark timing was presented in Table 5.
Table 6 contains information summarizing results for optimal spark timings.
To smooth the results of multiple test runs, the COV of IMEP is used. It is defined as follows in Equation (1):
C O V ( I M E P ) = s t d ( I M E P ) m e a n ( I M E P ) · 100 %  
where std(IMEP)—standard deviation from the IMEP population of 100 combustion events and mean(IMEP)—mean of this IMEP population.
As concluded from Figure 3, the engine fueled with ethanol + PO (3:1) worked with relatively higher variance in consecutive combustion events. Its maximum equals 2.5% at ST = −4 CA deg aTDC. In general, the COV of IMEP below 5% is accepted for engines working in heat and power generation units. It was likely caused by combustion instabilities during ignition while the engine was fueled with ethanol + PO.

3.2. Combustion Duration Phases

Combustion duration phases were determined on the basis of combustion progress by mass of a single fuel doses injected and burnt in the engine cylinder during engine work. There are various methods for calculating progress in fuel consumption by flame inside the engine cylinder. In this case, the method based on energy conservation law seems to be the most appropriate. As known, heat release rate (HRR) (Equation (2)) and accumulated heat (after integrating HRR) from the single combustion event can be determined from pressure traces with the aid of energy conservation law and equation for ideal gas. The progress in mass fraction fuel burnt (MFB) can be determined on the basis of accumulated heat released from combustion and next normalized to range 0...1 (Equation (3)):
H R R ( α ) = d Q n e t d α = γ γ 1 p d V d α + 1 γ 1 V d p d α
M F B ( α ) = Q n e t ( α ) Q n e t ( e n d )
where γ—the ratio of specific heats (cp/cv) at constant pressure and constant volume, respectively, p—in-cylinder combustion pressure, V—in-cylinder volume, α—crank angle (CA) deg and Qnet—cumulative net heat released during combustion.
Thus, MFB profile shows progress in fuel combustion in the range from 0 (or 0% expressing percentage of combustion products) to 1 (or 100% combustion products: exhaust gases) vs. CA deg. As depicted in Figure 4a, combustion phase denoted as CA0-10 expresses initial phase of combustion in crank angle degrees. It is measured from ignition point (spark timing in these cases) to 10% heat released or fuel burnt. As shown, ignition delay expressed by CA0-10 does not depend significantly on spark timing. CA0-10 duration is longer for the mixture ethanol + PO than for pure ethanol. It is in the range from 10.9 to 11.7 and from 12.1 to 13.3 CA deg for ethanol and ethanol + PO blend, respectively. On the other hand, the main combustion phase denoted as CA10-90 (Figure 4b) is strictly in line with the spark timing. In the case of spark timing being more advanced, CA10-90 became shorter because this combustion phase approached the TDC point where the temperature due to the compression stroke is the highest. As observed, addition of pyrolysis oil to butanol remarkably increased both CA0-10 (ignition delay) and main combustion phase CA10-90.
As concluded from Figure 4 and Figure 5, the longest overall combustion durations (CA0-90) for these both fuels were observed at retarded spark timing of -4 CA deg aTDC (Figure 5a). It is an obvious conclusion if one can correlate combustion phases with the center of combustion denoted as CA50.
As depicted in Figure 5b, CA50 for the spark timing of −4 CA deg aTDC is located at 16 and 21 CA deg aTDC for ethanol and ethanol + PO blend, respectively. Hence, the main combustion phase CA10-90 extends into the expansion stroke, where temperature starts decreasing, hence combustion reaction rates also decrease. As result of slower combustion reaction, longer combustion duration is observed that caused decrease in IMEP generated by the engine. Based on data presented in Figure 2b and Figure 5b, the graph IMEP vs. CA50 is depicted in Figure 6.
As seen in Figure 6, the ST_opt is strictly correlated with the optimal CA50 which lies in the range from 8.5 to 11.5 CA deg aTDC as regards the trend line for these cases. The optimal CA50 location does not depend on fuel composition.

3.3. Pressure Rise Rate

The pressure rise rate can provide information on potential knock phenomenon and level during a heavily-loaded engine run. The rapid increase in combustion pressure is usually observed before end-fuel self-ignition [27]. This rapid increase in pressure rise rate is considered as the first symptom of approaching the combustion limits of knock. In Figure 7a pressure in the engine cylinder focused on combustion events is plotted. There are 2 pressure traces for these two fuels. Each pressure plot is a mean pressure obtained from averaging over 100 consecutive combustion events taken from combustion series at spark timing of −10 and −14 CA deg aTDC for pure ethanol and ethanol + PO, respectively. Pressure rise rates depicted in Figure 7b were determined as derivative dp/dCA from averaged pressures presented in Figure 7a. As presented in Figure 7b, both these pressure rise rate plots do not differ significantly from each other. Hence, one can conclude that there is not any likelihood of fuel self-ignition that usually might occur at the end of regular combustion process initiated by the spark plug. In the plots there are points showing locations of CA50, which are in the optimal range for maximum IMEP.

4. Conclusions

The following conclusions were drawn from the presented research work:
  • Although pyrolysis oil can be applied as a single fuel in compression ignition engines due to its good self-ignition tendency, it can be also be used in spark-ignition engines. The proposed mixture which can be applied as the engine fuel is the mixture consisting of ethanol and pyrolysis oil at ratio of 3:1 by volume, respectively. At this proportion, the fuel can be burnt without any significant deterioration in the engine performance.
  • Addition of pyrolysis oil to ethanol at ratio of 3:1 causes lengthening both the initial combustion phase CA0-10 and the main combustion phase CA10-90 as well as overall combustion denoted as CA0-90. Thus, optimal spark timing should be corrected to get maximum engine work when the fuel is changed from ethanol to ethanol + PO (3:1) in the modern engine installed in a flexible fuel type vehicle.
  • Optimal spark timing for the ethanol-pyrolysis oil mixture is shifted to be more advanced in comparison to pure ethanol, therefore modifications in the control algorithm for ignition module in the engine control unit must be taken into consideration.
  • Even though pyrolysis oil characterizes with relatively low octane rating, its addition to ethanol at amounts of 25% does not lead to any knock symptoms.
Summing up, raw pyrolysis oil can be used as an additive to be mixed with ethanol. The blend can be considered as a potential useful fuel to the internal combustion spark-ignition engine working in flexible fuel mode. The proposed pyrolysis oil amount in the blend with ethanol should not exceed 25% (the ratio 3:1 ethanol to pyrolysis oil).

Author Contributions

Conceptualization, S.S. and M.S.; methodology, S.S. and R.J.; software, M.S. and M.C.; validation, M.C.; formal analysis, S.S. and M.S.; investigation, M.C. and S.S.; resources, R.J.; data curation, M.C.; writing—original draft preparation, M.S. and S.S.; writing—review and editing, S.S.; visualization, M.S.; supervision, R.J.; funding acquisition, M.S. All authors have read and agreed to the published version of the manuscript.

Funding

This research was funded by POLISH NATIONAL AGENCY FOR ACADEMIC EXCHANGE Iwanowska Programme, grant number PPN/IWA/2019/1/00149/U/00001.

Institutional Review Board Statement

Not applicable.

Informed Consent Statement

Not applicable.

Data Availability Statement

Not applicable.

Acknowledgments

The research was additionally supported by Faculty of Mechanical Engineering and Computer Science of Czestochowa University of Technology.

Conflicts of Interest

The authors declare no conflict of interest. The funders had no role in the design of the study; in the collection, analyses, or interpretation of data; in the writing of the manuscript, or in the decision to publish the results.

Abbreviations

A/F stoic.Air to fuel stoichiometric ratio
BDCBottom Dead Center
aTDCafter Top Dead Center
bTDCbefore Top Dead Center
CACrank Angle
CFRCooperative Fuel Research
CICompression Ignition
COCarbon Monoxide
COVCoefficient of Variation
CRCompression Ratio
HCHydrocarbons
ICInternal Combustion
IMEPIndicated Mean Effective Pressure
LHVLower Heating Value
PAHPolycyclic Aromatic HC
POPyrolysis Oil
SISpark Ignition
STSpark Timing
TDCTop Dead Center
UEGOUniversal Exhaust gas Oxygen
WOTWidely Open Throttle

References

  1. Klinger, J.; Bar-Ziv, E.; Shonnard, D. Unified Kinetic Model for Torrefaction-Pyrolysis. Fuel Process. Technol. 2015, 138, 175–183. [Google Scholar] [CrossRef] [Green Version]
  2. Kumaravel, S.T.; Murugesan, A.; Kumaravel, A. Tyre Pyrolysis Oil as an Alternative Fuel for Diesel Engines—A Review. Renew. Sustain. Energy Rev. 2016, 60, 1678–1685. [Google Scholar] [CrossRef]
  3. Umeki, E.R.; de Oliveira, C.F.; Torres, R.B.; dos Santos, R.G. Physico-Chemistry Properties of Fuel Blends Composed of Diesel and Tire Pyrolysis Oil. Fuel 2016, 185, 236–242. [Google Scholar] [CrossRef]
  4. Wongkhorsub, C.; Chindaprasert, N. A Comparison of the Use of Pyrolysis Oils in Diesel Engine. Energy Power Eng. 2013, 5, 350–355. [Google Scholar] [CrossRef]
  5. Čížková, A.; Juchelková, D. Comparison of Yield of Tires Pyrolysis in Laboratory and Pilot Scales. Geosci. Eng. 2009, 4, 60–65. [Google Scholar]
  6. Kaminsky, W.; Mennerich, C. Pyrolysis of Synthetic Tire Rubber in a Fluidised-Bed Reactor to Yield 1,3-Butadiene, Styrene and Carbon Black. J. Anal. Appl. Pyrolysis 2001, 58–59, 803–811. [Google Scholar] [CrossRef]
  7. Barbooti, M.M.; Mohamed, T.J.; Hussain, A.A.; Abas, F.O. Optimization of Pyrolysis Conditions of Scrap Tires under Inert Gas Atmosphere. J. Anal. Appl. Pyrolysis 2004, 72, 165–170. [Google Scholar] [CrossRef]
  8. Boxiong, S.; Chunfei, W.; Cai, L.; Binbin, G.; Rui, W. Pyrolysis of Waste Tyres: The Influence of USY Catalyst/Tyre Ratio on Products. J. Anal. Appl. Pyrolysis 2007, 78, 243–249. [Google Scholar] [CrossRef]
  9. Vihar, R.; Žvar Baškovič, U.; Seljak, T.; Katrašnik, T. Combustion and Emission Formation Phenomena of Tire Pyrolysis Oil in a Common Rail Diesel Engine. Energy Convers. Manag. 2017, 149, 706–721. [Google Scholar] [CrossRef] [Green Version]
  10. Marinangelli, R.; Boldingh, E.; Cabanban, S.; Fei, S.; Ellis, G.; Bain, R.; Hsu, G.; Elliott, D.C. Pyrolysis Oil to Gasoline-Final Report; No. PNNL-19053; Pacific Northwest National Lab: Richland, WA, USA, 2009. [Google Scholar]
  11. Chwist, M.; Szwaja, S.; Grab-Rogalinski, K.; Pyrc, M. Bio-Oil Blended Butanol as a Fuel to the Spark Ignition Internal Combustion Reciprocating Engine. Combust. Engines 2017, 169, 93–96. [Google Scholar] [CrossRef]
  12. Mikulski, M.; Ambrosewicz-Walacik, M.; Hunicz, J.; Nitkiewicz, S. Combustion Engine Applications of Waste Tyre Pyrolytic Oil. Prog. Energy Combust. Sci. 2021, 85, 100915. [Google Scholar] [CrossRef]
  13. Zahir Hussain, A.; Santhoshkumar, A.; Ramanathan, A. Assessment of Pyrolysis Waste Engine Oil as an Alternative Fuel Source for Diesel Engine. J. Therm. Anal. Calorim. 2020, 141, 2277–2293. [Google Scholar] [CrossRef]
  14. Karagoz, M.; Uysal, C.; Agbulut, U.; Saridemir, S. Energy, Exergy, Economic and Sustainability Assessments of a Compression Ignition Diesel Engine Fueled with Tire Pyrolytic Oil−diesel Blends. J. Clean. Prod. 2020, 264, 121724. [Google Scholar] [CrossRef]
  15. Koc, A.B.; Abdullah, M. Performance of a 4-Cylinder Diesel Engine Running on Tire Oil–Biodiesel–Diesel Blend. Fuel Process. Technol. 2014, 118, 264–269. [Google Scholar] [CrossRef]
  16. Krutof, A.; Hawboldt, K. Blends of Pyrolysis Oil, Petroleum, and Other Bio-Based Fuels: A Review. Renew. Sustain. Energy Rev. 2016, 59, 406–419. [Google Scholar] [CrossRef]
  17. Hürdoğan, E.; Ozalp, C.; Kara, O.; Ozcanli, M. Experimental Investigation on Performance and Emission Characteristics of Waste Tire Pyrolysis Oil–Diesel Blends in a Diesel Engine. Int. J. Hydrog. Energy 2017, 42, 23373–23378. [Google Scholar] [CrossRef]
  18. Kumar, R.; Mishra, M.K.; Singh, S.K.; Kumar, A. Experimental Evaluation of Waste Plastic Oil and Its Blends on a Single Cylinder Diesel Engine. J. Mech. Sci. Technol. 2016, 30, 4781–4789. [Google Scholar] [CrossRef]
  19. Tomar, M.; Jain, A.; Pujari, P.C.; Dewal, H.; Kumar, N. Potentials of Waste Plastic Pyrolysis Oil as an Extender Fuel for Diesel Engine. Arab. J. Geosci. 2020, 13, 1–10. [Google Scholar] [CrossRef]
  20. Kim, T.Y.; Lee, S.H. Combustion and Emission Characteristics of Wood Pyrolysis Oil-Butanol Blended Fuels in a DI Diesel Engine. Int. J. Automot. Technol. 2015, 16, 903–912. [Google Scholar] [CrossRef]
  21. Hossain, A.K.; Davies, P.A. Pyrolysis Liquids and Gases as Alternative Fuels in Internal Combustion Engines—A Review. Renew. Sustain. Energy Rev. 2013, 21, 165–189. [Google Scholar] [CrossRef]
  22. Chwist, M.; Pyrc, M.; Gruca, M.; Szwaja, M. By-Products from Thermal Processing of Rubber Waste as Fuel for the Internal Combustion Piston Engine. Combust. Engines 2020, 181, 11–18. [Google Scholar] [CrossRef]
  23. Kalargaris, I.; Tian, G.; Gu, S. Combustion, Performance and Emission Analysis of a DI Diesel Engine Using Plastic Pyrolysis Oil. Fuel Process. Technol. 2017, 157, 108–115. [Google Scholar] [CrossRef] [Green Version]
  24. Fan, Y.; Cai, Y.; Li, X.; Jiao, L.; Xia, J.; Deng, X. Effects of the Cellulose, Xylan and Lignin Constituents on Biomass Pyrolysis Characteristics and Bio-Oil Composition Using the Simplex Lattice Mixture Design Method. Energy Convers. Manag. 2017, 138, 106–118. [Google Scholar] [CrossRef]
  25. Sunaryo, S.; Effendy, M.; Sarjito, S.; Kamarrudin, N.S. Pyrolysis of Plastic Waste as an Alternative Fuels in Spark Ignition Engine. Int. J. Emerg. Trends Eng. Res. 2019, 7, 454–459. [Google Scholar] [CrossRef]
  26. Kareddula, V.K.; Puli, R.K. Influence of Plastic Oil with Ethanol Gasoline Blending on Multi Cylinder Spark Ignition Engine. Alexandria Eng. J. 2018, 57, 2585–2589. [Google Scholar] [CrossRef]
  27. Szwaja, S. Dilution of Fresh Charge for Reducing Combustion Knock in the Internal Combustion Engine Fueled with Hydrogen Rich Gases. Int. J. Hydrog. Energy 2019, 44, 19017–19025. [Google Scholar] [CrossRef]
Figure 1. Test bench: 1—Air filter; 2—Rotor flowmeter; 3—Plenum of 120 dm3 for dumping pressure pulsations; 4—Fueling system; 5—MAP sensor; 6—Port fueled injector; 7—Spark plug with a piezoceramic Kistler pressure sensor; 8—PC computer for real-time data analysis; 9—Data acquisition system; 10—Electronic control unit; 11—UIT-85 IC engine; 12—Crank angle encoder installed on the camshaft; 13—Exhaust gases analyzer; 14—Wide-band UEGO sensor; 15—Exhaust temperature sensor.
Cleantechnol 03 00026 g001
Figure 2. Maximum combustion pressure Pmax (a) and IMEP (b) vs. spark timing for ethanol + PO blend and pure ethanol tested at CR of 9.5 and engine speed of 600 rpm.
Cleantechnol 03 00026 g002
Figure 3. COV of IMEP for ethanol + PO blend and pure ethanol vs. spark timing at CR of 9.5 and 600 rpm.
Cleantechnol 03 00026 g003
Figure 4. (a) Combustion duration CA0-10; (b) Combustion duration CA10-90; for ethanol + PO blend and pure ethanol vs. spark timing at CR of 9.5 and 600 rpm.
Cleantechnol 03 00026 g004
Figure 5. (a) Combustion duration CA0-90; (b) Combustion center CA50; for ethanol + PO blend and pure ethanol vs. spark timing at CR of 9.5 and 600 rpm.
Cleantechnol 03 00026 g005
Figure 6. IMEP vs. CA50 for ethanol + PO blend and pure ethanol at CR of 9.5 and 600 rpm.
Cleantechnol 03 00026 g006
Figure 7. (a) In-cylinder pressure focused on combustion phase; (b) Pressure rise rate; vs. crank angle for ethanol + PO blend and pure ethanol tested at CR of 9.5 and engine speed of 600 rpm.
Cleantechnol 03 00026 g007
Table 1. Comparison between individual fractions from pyrolysis process.
Pyrolysis PlantProcess
Temperature
CharOilGas
[C][%]
CSN ISO 647 [5]52038.544.516.8
Pilot plant [5]60039.251.87.9
Barbooti [7]46034.153.012.9
Kaminsky [6]60040519.1
Boxioing [8]50037.645.716.5
Table 2. Properties of pyrolysis oil from waste plastics/rubber pyrolysis.
PropertyUnitEthanolPyrolysis OilEthanol + PO
LHVMJ/kg26.739.130.0
A/F stoic.-10.414.511.4
Water content% mass<1<1<1
Sulphur content% mass<0.0<0.5<0.13
Carbon content% mass528560
Hydrogen content% mass131012
Chemical constituents Ethanol 99%straight alkanes, PAH alkanesEthanol 75%
Pyro. oil 25%
Table 3. Test matrix.
Fuels Applied for Tests
FuelPrimary fuelReference fuel
Ethanol + PO (3:1)Ethanol
LHV (MJ/kg)30.026.9
Preliminary tests to determine optimal spark timing
Spark timing in
CA deg aTDC
sweeping:
−2...−20
sweeping:
−2...−16
Air excess ratio “lambda”1.00...1.071.00...1.09
Secondary tests to determine optimal combustion duration
Spark timing in CA deg aTDC−10 (for Ethanol)
and −14 (for Ethanol+PO)
Air excess ratio “lambda”nearly stoichiometric
1.00...1.06
Other parameters common for all tests
Engine speed (rpm)600 rpm
Engine compression ratio9.5
Engine loadFull load at WOT,
IMEP = 720...775 kPa
Ambient pressure1007 hPa
Air intake temperature21.3 °C
Table 4. Technical data of the engine UIT 85.
Type of EngineFour-Stroke, Spark Ignited,
Naturally Aspirated
Number of cylinders1
Number of valves2
Cylinder bore85 mm
Piston stroke115 mm
Connecting rod266 mm
Engine displacement652 cm3
Compression ratio9.5
Intake valve open10 CA deg aTDC
Intake valve closure145 CA deg bTDC
Exhaust valve open178 CA deg aTDC
Exhaust valve closure5 CA deg aTDC
Crank shaft speed600 rpm
Coolingwater cooling system
Table 5. Main component specification of the measurement system.
InstrumentRangeResolution and/or Accuracy
Charge amplifier: Kistler 5018A2 ÷ 10 pC
10 ÷ 100 pC
100 ÷ 2,200,000 pC
resolution: 0.01 pC
accuracy: <±2%, <±0.6%, <±0.3%, respectively to range
Pressure sensor: Kistler 6118C0 ÷ 200 barresolution: 10 pC/bar, accuracy: <±1%
MAP sensor0 ÷ 1.1 baraccuracy: <2.5%
Data acquisition system:
USB-1608HS
±10 Vaccuracy: 16 bits ±1 LSB,
sampling rate: 50 kHz
Rotor flowmeter CGR-FX0.25 ÷ 25.00 m3/haccuracy: 6.45∙10 × 10−5 m3/h
Temperature sensor: thermocouple NiCr-Ni (K)−40 … 1000 °Caccuracy: ±1 °C
Crank angle encoder PR90max 6000 rpmres.: 720 pulses per rev.
Table 6. Optimal spark timings under criterion of maximum IMEP.
FuelST_opt (CA deg aTDC)
Ethanol−10 as the middle in the range: −12…−8
−11 from trend line
Ethanol + PO (3:1)−14 as the middle in the range: −16…−12
−13 from trend line
Publisher’s Note: MDPI stays neutral with regard to jurisdictional claims in published maps and institutional affiliations.

