
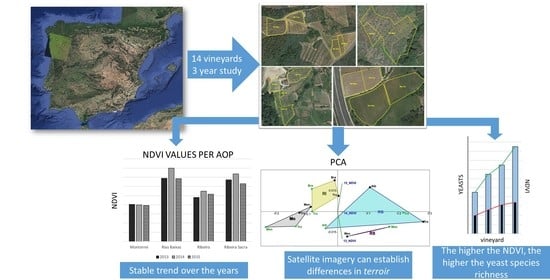
Spatio-Temporal Analysis of Satellite Imagery (NDVI) to Identify Terroir and Vineyard Yeast Differences according to Appellation of Origin (AOP) and Biogeographic Origin

 ,
,  ,
,
Abstract
:
1. Introduction
2. Materials and Methods
2.1. Satellite Imagery
2.2. Vineyards
2.3. Sample Processing and Yeast Isolation
2.4. Statistical and Data Analysis
3. Results
4. Discussion
5. Conclusions
Author Contributions
Funding
Acknowledgments
Conflicts of Interest
References
- Jones, G.V.; Hellman, E. Site Assessment. In Oregon Viticulture, 5th ed.; Hellman, E., Ed.; Oregon State University Press: Corvallis, OR, USA, 2003; pp. 44–50. [Google Scholar]
- Robinson, J. The Oxford Companion to Wine; Oxford University Press (OUP): Oxford, UK, 2006; pp. 693–695. [Google Scholar]
- Cosme, F.; Vilela, A.; Moreira, L.; Moura, C.; Enríquez, J.; Filipe-Ribeiro, L.; Nunes, F. Terroir Effect on the Phenolic Composition and Chromatic Characteristics of Mencía/Jaen Monovarietal Wines: Bierzo D.O. (Spain) and Dão D.O. (Portugal). Molecules 2020, 25, 6008. [Google Scholar] [CrossRef] [PubMed]
- Seguin, G. ‘Terroirs’ and pedology of wine growing. Cell. Mol. Life Sci. 1986, 42, 861–873. [Google Scholar] [CrossRef]
- Vivas, C.; Sousa, A. La globalización en el sector del vino: Nuevo mundo, viejo mundo y Portugal. In XXVII AEDEM Annual Meeting; ESIC Editorial: Huelva, Spain, 2013. [Google Scholar]
- Krishna, K.R. Push Button Agriculture: Robotics, Drones, Satellite-Guided Soil and Crop Management; Apple Academic Press: Palm Bay, FL, USA; CRC Press: Boca Raton, FL, USA; Taylor & Francis Group: Milton Park, UK, 2016; ISBN 13978-1-77188-305-4. [Google Scholar]
- Rouse, J.W., Jr.; Haas, R.H.; Schell, J.A.; Deering, D.W. Monitoring Vegetation Systems in the Great Plains with ERTS; NASA: Washington, DC, USA, 1973. [Google Scholar]
- Vélez, S.; Rubio, J.A.; Andrés, M.I.; Barajas, E. Agronomic classification between vineyards (‘Verdejo’) using NDVI and Sen-tinel-2 and evaluation of their wines. Vitis J. Grapevine Res. 2019, 58, 33–38. [Google Scholar] [CrossRef]
- Anastasiou, E.; Balafoutis, A.; Darra, N.; Psiroukis, V.; Biniari, A.; Xanthopoulos, G.; Fountas, S. Satellite and Proximal Sensing to Estimate the Yield and Quality of Table Grapes. Agriculture 2018, 8, 94. [Google Scholar] [CrossRef] [Green Version]
- Johnson, L.F.; Bosch, D.F.; Williams, D.C.; Lobitz, B.M. Remote sensing of vineyard management zones: Implications for wine quality. Appl. Eng. Agric. 2001, 17, 557–560. [Google Scholar] [CrossRef]
- Martinez-Casasnovas, J.A.; Agelet-Fernandez, J.; Arnó, J.; Ramos, M.C. Analysis of vineyard differential management zones and relation to vine development, grape maturity and quality. Span. J. Agric. Res. 2012, 10, 326. [Google Scholar] [CrossRef] [Green Version]
- Johnson, L.F. Temporal stability of an NDVI-LAI relationship in a Napa Valley vineyard. Aust. J. Grape Wine Res. 2003, 9, 96–101. [Google Scholar] [CrossRef]
- Vélez, S.; Barajas, E.; Rubio, J.A.; Vacas, R.; Poblete-Echeverría, C. Effect of Missing Vines on Total Leaf Area Determined by NDVI Calculated from Sentinel Satellite Data: Progressive Vine Removal Experiments. Appl. Sci. 2020, 10, 3612. [Google Scholar] [CrossRef]
- Lamb, D.; Weedon, M.; Bramley, R. Using remote sensing to predict grape phenolics and colour at harvest in a Cabernet Sauvignon vineyard: Timing observations against vine phenology and optimising image resolution. Aust. J. Grape Wine Res. 2004, 10, 46–54. [Google Scholar] [CrossRef] [Green Version]
- Vélez, S.; Barajas, E.; Rubio, J.A.; Poblete-Echeverría, C.; Olmedo, G.F. Chapter 10. Remote Sensing: In the Digital Viticulture Era. In Vitis: Biology and Species; Nova Publishers: Hauppauge, NY, USA, 2020; ISBN 978-1-53618-308-5. [Google Scholar]
- Matese, A.; Toscano, P.; Di Gennaro, S.F.; Genesio, L.; Vaccari, F.P.; Primicerio, J.; Belli, C.; Zaldei, A.; Bianconi, R.; Gioli, B. Intercomparison of UAV, Aircraft and Satellite Remote Sensing Platforms for Precision Viticulture. Remote. Sens. 2015, 7, 2971–2990. [Google Scholar] [CrossRef] [Green Version]
- Markham, B.; Storey, J.; Morfitt, R. Landsat-8 Sensor Characterization and Calibration. Remote. Sens. 2015, 7, 2279–2282. [Google Scholar] [CrossRef] [Green Version]
- Hall, C.M.; Mitchell, R. Wine Marketing: A Practical Guide, 1st ed.; Elsevier: Amsterdam, The Netherlands; Boston, MA, USA, 2008; ISBN 978-0-7506-5420-3. [Google Scholar]
- Barata, A.; Malfeito-Ferreira, M.; Loureiro, V. The microbial ecology of wine grape berries. Int. J. Food Microbiol. 2012, 153, 243–259. [Google Scholar] [CrossRef] [PubMed]
- Bokulich, N.A.; Thorngate, J.H.; Richardson, P.M.; Mills, D.A. PNAS Plus: From the Cover: Microbial biogeography of wine grapes is conditioned by cultivar, vintage, and climate. Proc. Natl. Acad. Sci. USA 2014, 111, E139–E148. [Google Scholar] [CrossRef] [Green Version]
- Ribéreau-Gayon, P.; Dubourdieu, D.; Donèche, B. Handbook of Enology, 2nd ed.; John Wiley: Chichester, UK; Hoboken, NJ, USA, 2006; ISBN 978-0-470-01034-1. [Google Scholar]
- Ciani, M.; Comitini, F.; Mannazzu, I.; Domizio, P. Controlled mixed culture fermentation: A new perspective on the use of non-Saccharomyces yeasts in winemaking. FEMS Yeast Res. 2010, 10, 123–133. [Google Scholar] [CrossRef] [PubMed] [Green Version]
- Tofalo, R.; Patrignani, F.; Lanciotti, R.; Perpetuini, G.; Schirone, M.; Di Gianvito, P.; Pizzoni, D.; Arfelli, G.; Suzzi, G. Aroma profile of Montepulciano d’Abruzzo wine fermented by single and co-culture starters of autochthonous Sac-charomyces and Non-Saccharomyces yeasts. Front. Microbiol. 2016, 7, 610. [Google Scholar] [CrossRef]
- Bokulich, N.A.; Collins, T.S.; Masarweh, C.; Allen, G.; Heymann, H.; Ebeler, S.E.; Mills, D.A. Associations among Wine Grape Microbiome, Metabolome, and Fermentation Behavior Suggest Microbial Contribution to Regional Wine Characteristics. mBio 2016, 7, e00631-16. [Google Scholar] [CrossRef] [Green Version]
- Alexandre, H. Wine Yeast Terroir: Separating the Wheat from the Chaff—For an Open Debate. Microorganisms 2020, 8, 787. [Google Scholar] [CrossRef]
- Castrillo, D.; Rabuñal, E.; Neira, N.; Blanco, P. Oenological potential of non-Saccharomyces yeasts to mitigate effects of climate change in winemaking: Impact on aroma and sensory profiles of Treixadura wines. FEMS Yeast Res. 2019, 19, foz065. [Google Scholar] [CrossRef]
- Castrillo, D.; Rabuñal, E.; Neira, N.; Blanco, P. Yeast diversity on grapes from Galicia, NW Spain: Biogeographical patterns and the influence of the farming system. OENO One 2018, 53. [Google Scholar] [CrossRef]
- Hall, A.; Lamb, D.; Holzapfel, B.P.; Louis, J.P. Within-season temporal variation in correlations between vineyard canopy and winegrape composition and yield. Precis. Agric. 2010, 12, 103–117. [Google Scholar] [CrossRef]
- Castrillo Cachón David (2018) Study of Yeast Diversity in Organic and Conventional Grapes from GALICIA: Biogeographic Patterns and Influence on the Chemical and Sensory Characteristics of Wine. Available online: https://www.educacion.gob.es/teseo/imprimirFicheroTesis.do?idFichero=ifNKOOHc9YI%3D (accessed on 25 June 2021).
- Drumonde-Neves, J.; Franco-Duarte, R.; Lima, T.; Schuller, D.; Pais, C. Yeast Biodiversity in Vineyard Environments Is Increased by Human Intervention. PLoS ONE 2016, 11, e0160579. [Google Scholar] [CrossRef] [Green Version]
- Botha, A. Yeasts in Soil. In Biodiversity and Ecophysiology of Yeasts; Springer Science and Business Media LLC: Berlin/Heidelberg, Germany, 2006; pp. 221–240. [Google Scholar]
- Consolidated text: Regulation (EU) No 1151/2012 of the European Parliament and of the Council of 21 November 2012 on Quality Schemes for Agricultural Products and Foodstuffs. Available online: http://data.europa.eu/eli/reg/2012/1151/2019-12-14 (accessed on 14 June 2021).
- Francesca, N.; Canale, D.E.; Settanni, L.; Moschetti, G. Dissemination of wine-related yeasts by migratory birds. Environ. Microbiol. Rep. 2011, 4, 105–112. [Google Scholar] [CrossRef] [Green Version]
- Schuller, D.; Alves, H.; Dequin, S.; Casal, M. Ecological survey of Saccharomyces cerevisiae strains from vineyards in the Vinho Verde Region of Portugal. FEMS Microbiol. Ecol. 2005, 51, 167–177. [Google Scholar] [CrossRef] [Green Version]
- Mortimer, R.; Polsinelli, M. On the origins of wine yeast. Res. Microbiol. 1999, 150, 199–204. [Google Scholar] [CrossRef]
- Ramírez, M.; López-Piñeiro, A.; Velázquez, R.; Muñoz, A.; Regodón, J.A. Analysing the vineyard soil as a natural reservoir for wine yeasts. Food Res. Int. 2020, 129, 108845. [Google Scholar] [CrossRef]
- Belda, I.; Zarraonaindia, I.; Perisin, M.; Palacios, A.; Acedo, A. From Vineyard Soil to Wine Fermentation: Microbiome Approximations to Explain the “terroir” Concept. Front. Microbiol. 2017, 8, 821. [Google Scholar] [CrossRef] [PubMed] [Green Version]
- Comitini, F.; Ciani, M. Influence of fungicide treatments on the occurrence of yeast flora associated with wine grapes. Ann. Microbiol. 2008, 58, 489–493. [Google Scholar] [CrossRef]
- Drumonde-Neves, J.; Franco-Duarte, R.; Lima, T.; Schuller, D.; Pais, C. Association between Grape Yeast Communities and the Vineyard Ecosystems. PLoS ONE 2017, 12, e0169883. [Google Scholar] [CrossRef]
- Grangeteau, C.; Roullier-Gall, C.; Rousseaux, S.; Gougeon, R.; Schmitt-Kopplin, P.; Alexandre, H.; Guilloux-Benatier, M. Wine microbiology is driven by vineyard and winery anthropogenic factors. Microb. Biotechnol. 2017, 10, 354–370. [Google Scholar] [CrossRef] [PubMed]
- Setati, M.E.; Jacobson, D.; Andong, U.-C.; Bauer, F. The Vineyard Yeast Microbiome, a Mixed Model Microbial Map. PLoS ONE 2012, 7, e52609. [Google Scholar] [CrossRef] [Green Version]
- Bagheri, B.; Bauer, F.F.; Setati, M. The Diversity and Dynamics of Indigenous Yeast Communities in Grape Must from Vineyards Employing Different Agronomic Practices and their Influence on Wine Fermentation. S. Afr. J. Enol. Vitic. 2016, 36, 243–251. [Google Scholar] [CrossRef] [Green Version]
- Pierce, F.J.; Clay, D. GIS Applications in Agriculture; CRC Press: Boca Raton, FL, USA, 2007; ISBN 978-0-8493-7526-2. [Google Scholar]
- Knight, S.; Klaere, S.; Fedrizzi, B.; Goddard, M.R. Regional microbial signatures positively correlate with differential wine phenotypes: Evidence for a microbial aspect to terroir. Sci. Rep. 2015, 5, 14233. [Google Scholar] [CrossRef] [PubMed] [Green Version]
- Mezzasalma, V.; Sandionigi, A.; Guzzetti, L.; Galimberti, A.; Grando, M.S.; Tardaguila, J.; Labra, M. Geographical and Cultivar Features Differentiate Grape Microbiota in Northern Italy and Spain Vineyards. Front. Microbiol. 2018, 9, 946. [Google Scholar] [CrossRef] [PubMed]


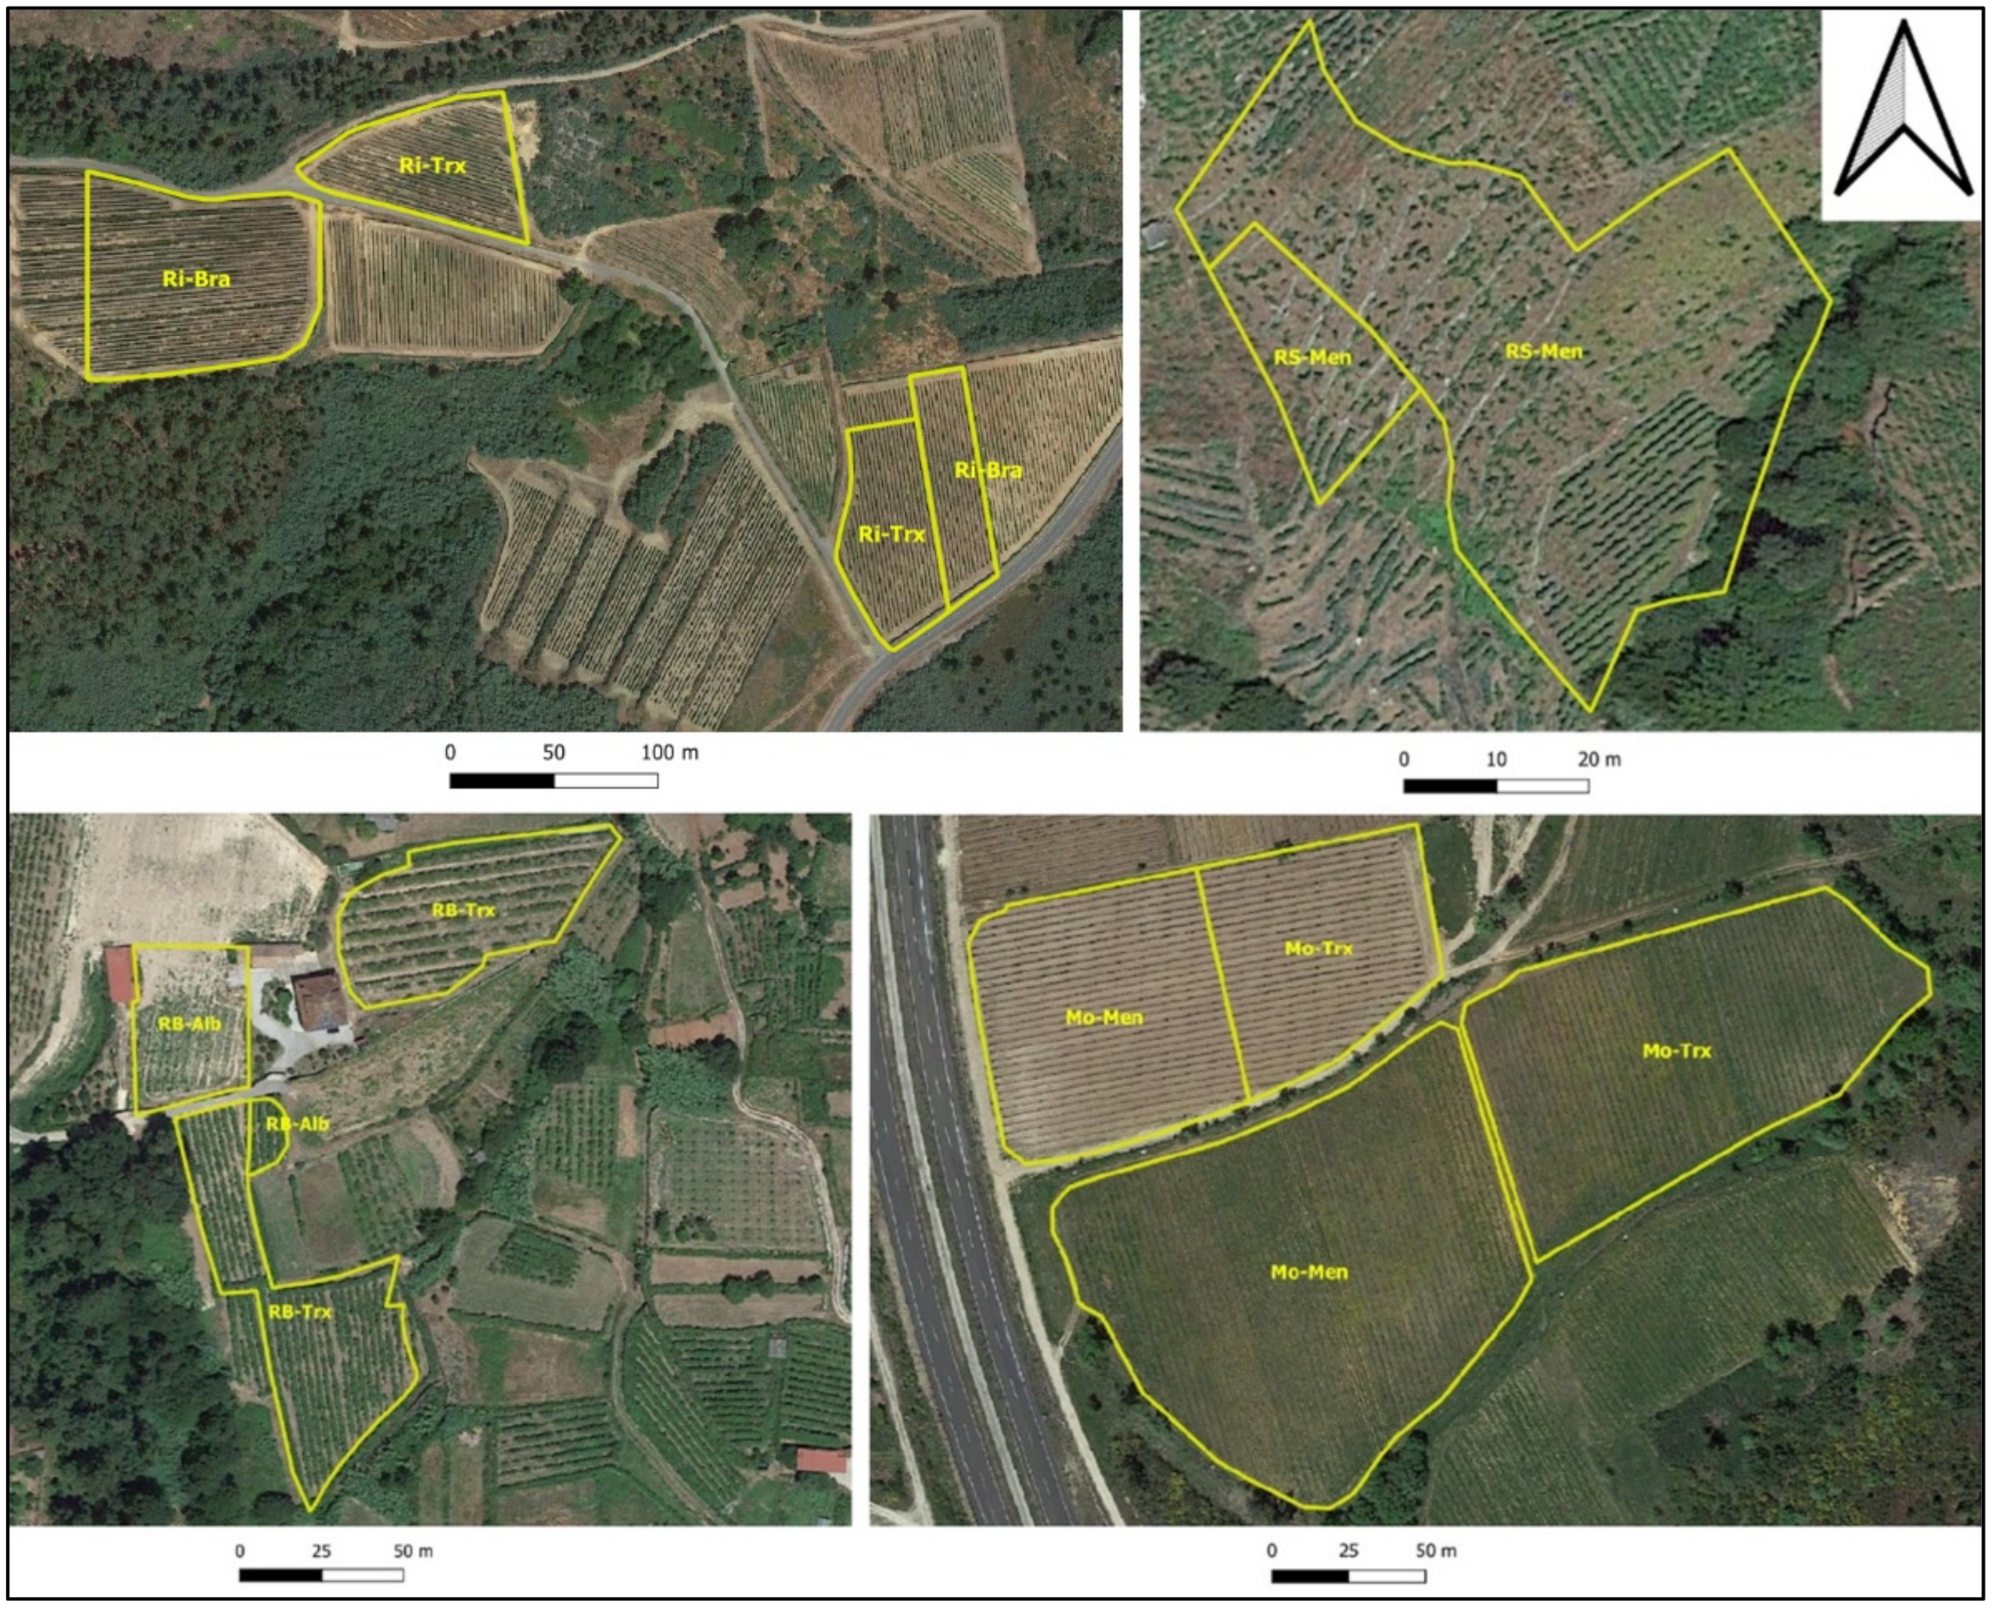
| AOP | Cultivar | Code | Coordinates | Elevation (m) | Average Annual Rainfall (L/m2) 2013-2014-2015 | Row Orientation |
|---|---|---|---|---|---|---|
| Monterrei | Treixadura | Mo-Trx | 41°52′11.9″ N, 7°25′49.7″ W 41°52′12.8″ N, 7°25′54.5″ W | 406 402 | 787-928-595 | N–S E–W |
| Mencía | Mo-Men | 41°52′11.0″ N, 7°25′51.9″ W 41°52′12.5″ N, 7°25′56.9″ W | 404 399 | N–S E–W | ||
| Ribeiro | Brancellao | Ri-Bra | 42°19′24.8″ N, 8°6′7.8″ W 42°19′22.3″ N, 8°5′51,7″ W | 270 290 | 1211-1351-752 | E–W N–S |
| Treixadura | Ri-Trx | 42°19′27.6″ N, 8°6′2.0″ W 42°19′22.0″ N, 8°5′52.4″ W | 278 289 | E–W N–S | ||
| Ribeira Sacra | Mencía | RS-Men | 42°34′11.5″ N, 7°43′3.4″ W 42°34′11.4″ N, 7°43′3.5″ W | 243 244 | 1075-1197-719 | NE–SW NE–SW |
| Rías Baixas | Albariño | RB-Alb | 42°5′47.9″ N, 8°21′18.1″ W 42°5′46.8″ N, 8°21′16.9″ W | 74 72 | 1489-1649-1071 | N−S N−S |
| Treixadura | RB-Trx | 42°5′48.2″ N, 8°21′15.1″ W 42°5′46.2″ N, 8°21′17.7″ W | 75 71 | E–W N–S |
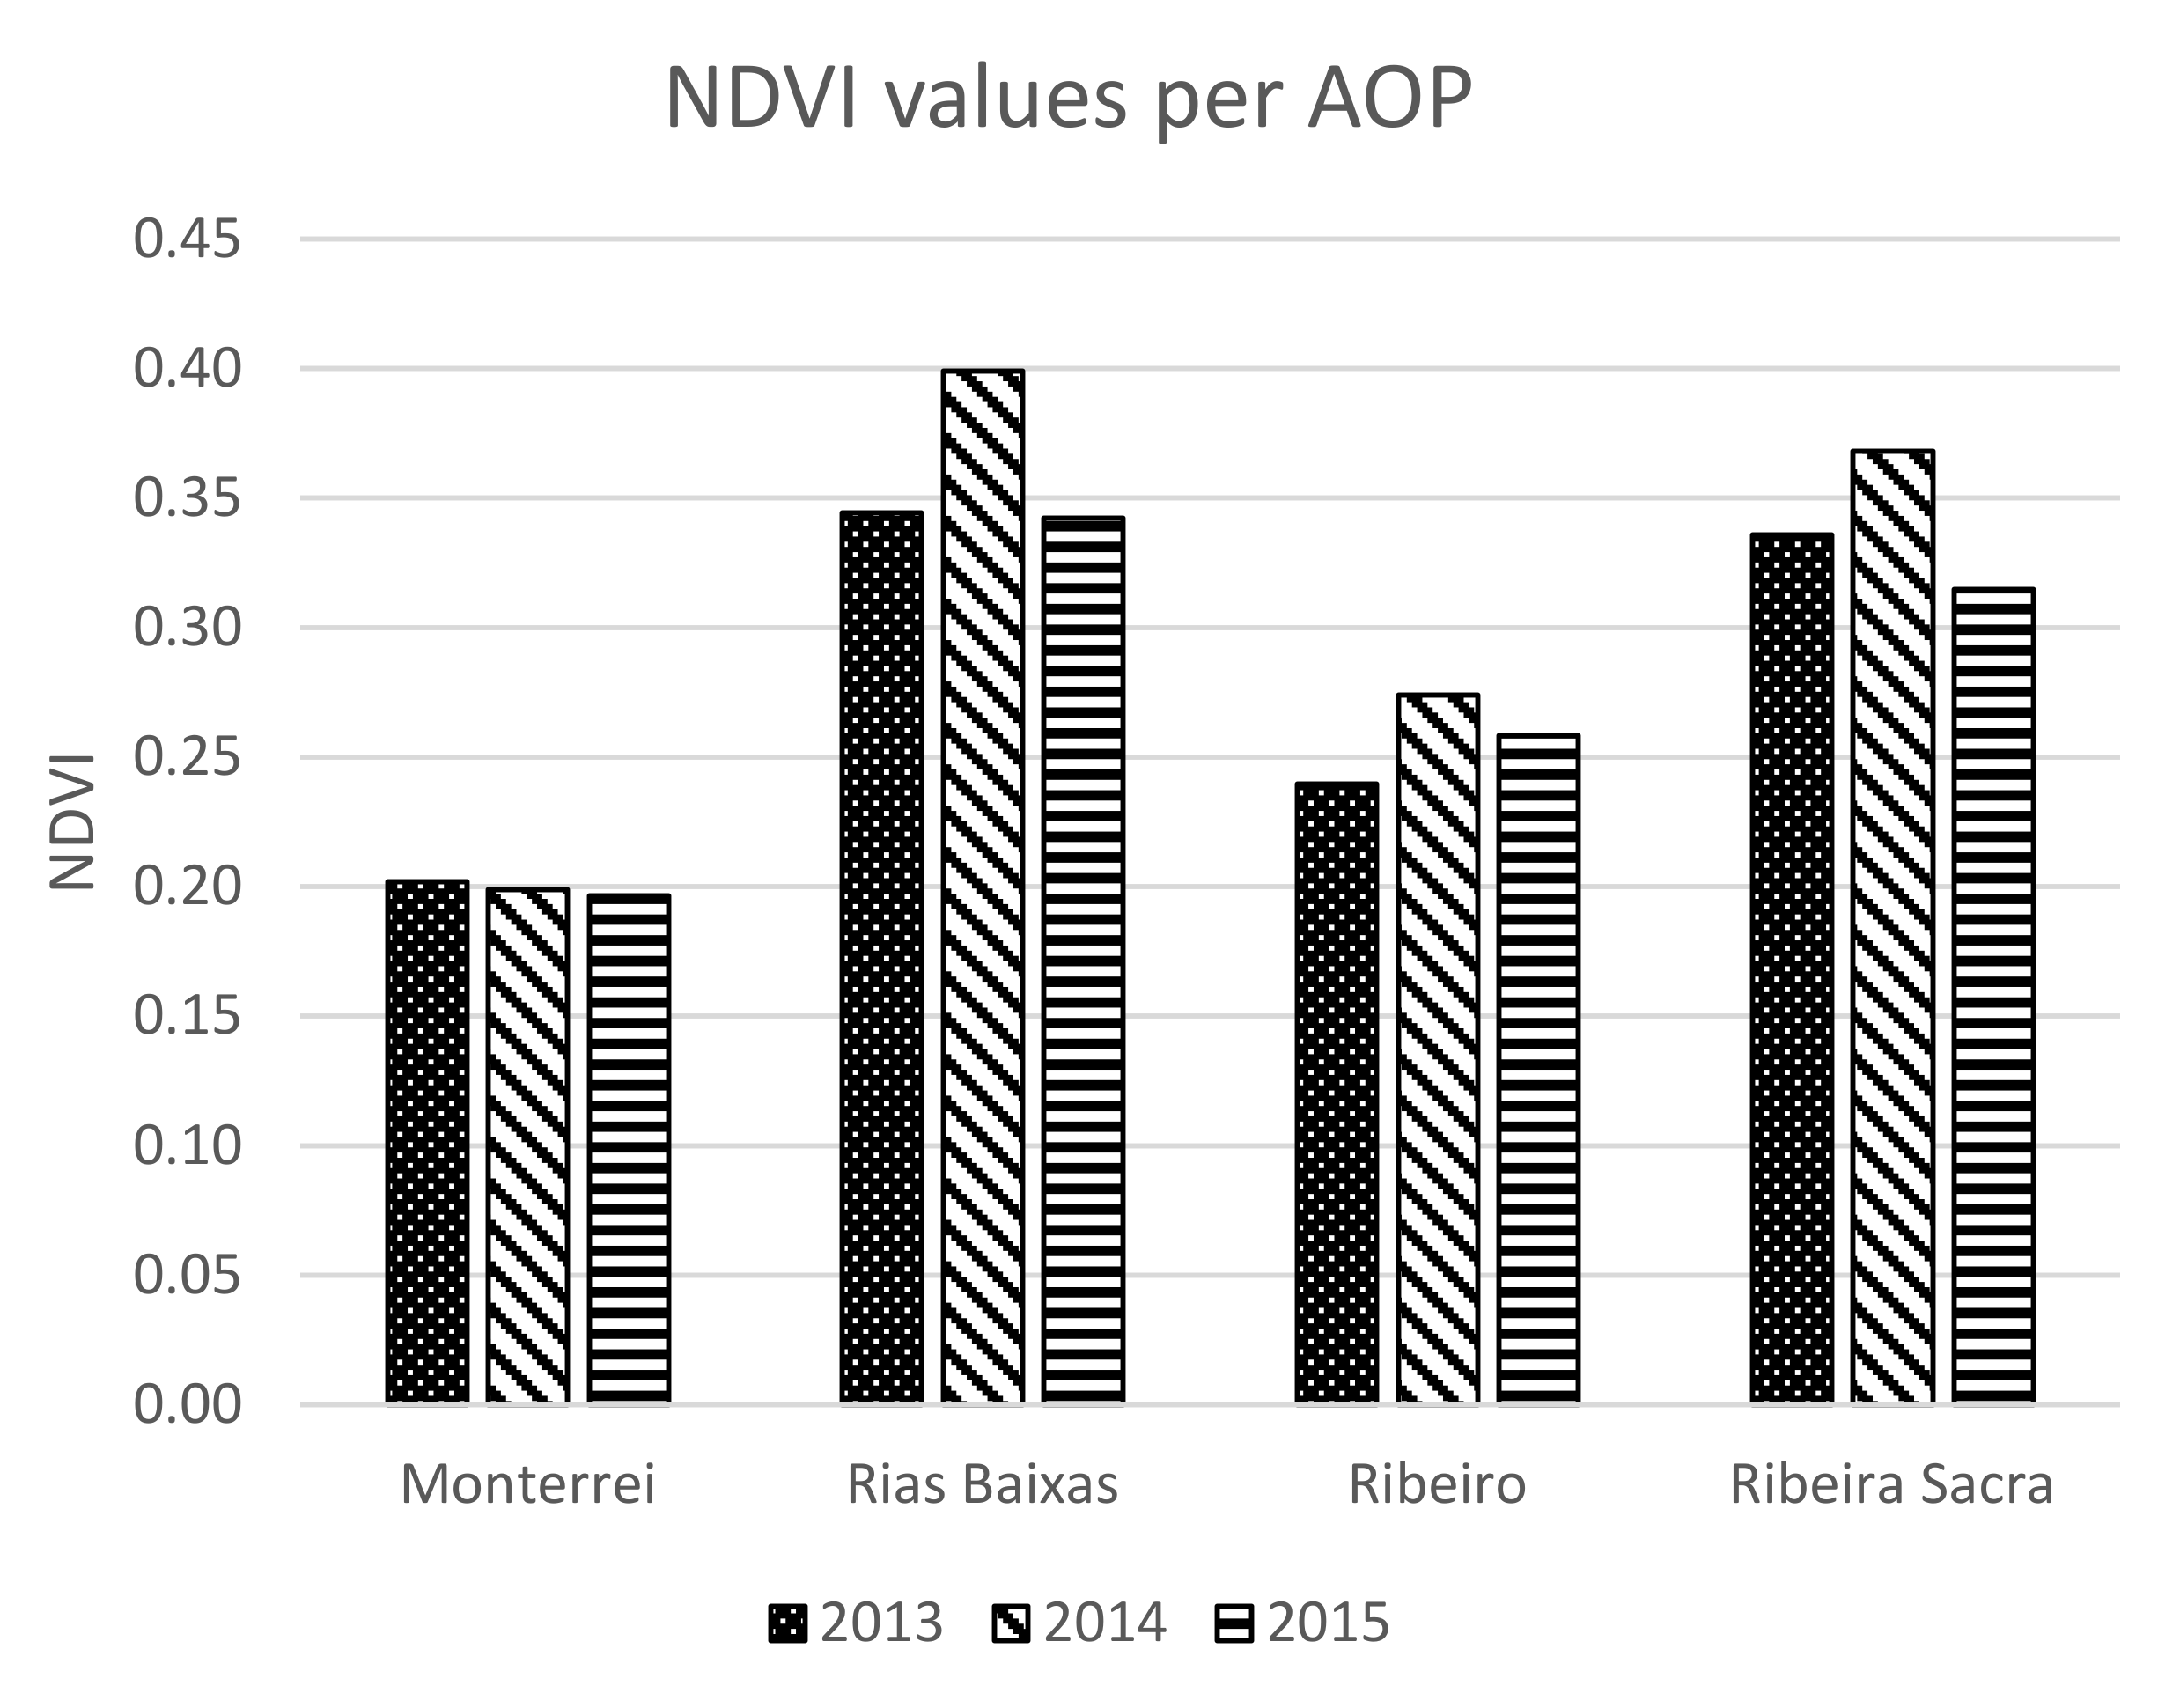
| Vineyard | 6 July 2013 | 23 August 2013 | 9 July 2014 | 25 July 2014 | 12 July 2015 | 29 August 2015 |
|---|---|---|---|---|---|---|
| Mo-Men-A | 0.25 | 0.22 | 0.22 | 0.24 | 0.23 | 0.24 |
| Mo-Men-B | 0.17 | 0.14 | 0.14 | 0.15 | 0.15 | 0.13 |
| Mo-Trx-A | 0.23 | 0.20 | 0.19 | 0.22 | 0.20 | 0.23 |
| Mo-Trx-B | 0.23 | 0.18 | 0.23 | 0.20 | 0.20 | 0.17 |
| RB-Alb-A | 0.36 | 0.26 | 0.39 | 0.36 | 0.36 | 0.32 |
| RB-Alb-B | 0.27 | 0.25 | 0.30 | 0.26 | 0.25 | 0.24 |
| RB-Trx-A | 0.48 | 0.38 | 0.49 | 0.48 | 0.43 | 0.41 |
| RB-Trx-B | 0.39 | 0.36 | 0.46 | 0.47 | 0.37 | 0.37 |
| Ri-Bra-A | 0.26 | 0.24 | 0.31 | 0.29 | 0.31 | 0.26 |
| Ri-Bra-B | 0.25 | 0.19 | 0.23 | 0.25 | 0.26 | 0.22 |
| Ri-Trx-A | 0.29 | 0.24 | 0.32 | 0.29 | 0.29 | 0.27 |
| Ri-Trx-B | 0.23 | 0.23 | 0.25 | 0.25 | 0.24 | 0.22 |
| RS-Men-A | 0.31 | 0.29 | 0.33 | 0.31 | 0.31 | 0.24 |
| RS-Men-B | 0.39 | 0.35 | 0.45 | 0.38 | 0.39 | 0.31 |
Publisher’s Note: MDPI stays neutral with regard to jurisdictional claims in published maps and institutional affiliations. |
© 2021 by the authors. Licensee MDPI, Basel, Switzerland. This article is an open access article distributed under the terms and conditions of the Creative Commons Attribution (CC BY) license (https://creativecommons.org/licenses/by/4.0/).
Share and Cite
Vélez, S.; Barajas, E.; Blanco, P.; Rubio, J.A.; Castrillo, D. Spatio-Temporal Analysis of Satellite Imagery (NDVI) to Identify Terroir and Vineyard Yeast Differences according to Appellation of Origin (AOP) and Biogeographic Origin. J 2021, 4, 244-256. https://0-doi-org.brum.beds.ac.uk/10.3390/j4030020
Vélez S, Barajas E, Blanco P, Rubio JA, Castrillo D. Spatio-Temporal Analysis of Satellite Imagery (NDVI) to Identify Terroir and Vineyard Yeast Differences according to Appellation of Origin (AOP) and Biogeographic Origin. J. 2021; 4(3):244-256. https://0-doi-org.brum.beds.ac.uk/10.3390/j4030020
Chicago/Turabian StyleVélez, Sergio, Enrique Barajas, Pilar Blanco, José Antonio Rubio, and David Castrillo. 2021. "Spatio-Temporal Analysis of Satellite Imagery (NDVI) to Identify Terroir and Vineyard Yeast Differences according to Appellation of Origin (AOP) and Biogeographic Origin" J 4, no. 3: 244-256. https://0-doi-org.brum.beds.ac.uk/10.3390/j4030020