
Affinity and Correlation in DNA


Istituto di Chimica dei Composti OrganoMetallici (UOS Pisa)—CNR, Area della Ricerca di Pisa, Via G Moruzzi, 1, 56124 Pisa, Italy
J 2022, 5(2), 214-231; https://0-doi-org.brum.beds.ac.uk/10.3390/j5020016
Submission received: 28 January 2022
/
Revised: 6 March 2022
/
Accepted: 8 April 2022
/
Published: 14 April 2022
(This article belongs to the Section Biology & Life Sciences)
Abstract
:A statistical analysis of important DNA sequences and related proteins has been performed to study the relationships between monomers, and some general considerations about these macromolecules can be provided from the results. First, the most important relationship between sites in all the DNA sequences examined is that between two consecutive base pairs. This is an indication of an energetic stabilization due to the stacking interaction of these couples of base pairs. Secondly, the difference between human chromosome sequences and their coding parts is relevant both in the relationships between sites and in some specific compositional rules, such as the second Chargaff rule. Third, the evidence of the relationship in two successive triplets of DNA coding sequences generates a relationship between two successive amino acids in the proteins. This is obviously impossible if all the relationships between the sites are statistical evidence and do not involve causes; therefore, in this article, due to stacking interactions and this relationship in coding sequences, we will divide the concept of the relationship between sites into two concepts: affinity and correlation, the first with physical causes and the second without. Finally, from the statistical analyses carried out, it will emerge that the human genome is uniform, with the only significant exception being the Y chromosome.
1. Introduction
DNA and proteins are long sequences of monomers, and nucleotides and amino acids, respectively. Each nucleotide is composed of one of the four nitrogen-containing nucleobases (adenine (A), thymine (T), cytosine (C) or guanine (G)), a deoxyribose sugar and a phosphate group. Considering the double strand of DNA and the nitrogenous base pairs, we can consider the base pairs A–T and C–G as the monomers of DNA.
Proteins are macromolecules made up of one or more chains of the standard 20 amino acids, with a length range of a few dozen to thousands of these residues. Each residue contains a central carbon atom, the α-carbon, which both an amino and a carboxyl group are attached to, together with a hydrogen atom and the R group that identifies the specific molecule of the amino acid.
There is, however, a difference between the sequences of these two macromolecules. In the DNA, we can identify some sequences of nucleotides that encode the proteins, and which, therefore, have a clear biological function, and other several sequences which are not easy to associate with a function. In particular, in complex organisms, only a small fraction of the DNA (1.5–2%) is coding for proteins. In the past, the non-coding part of DNA received the collective name of ‘junk DNA’. Susumo Ohno, writing in the Brookhaven Symposia in Biology in 1972 [1], is credited with introducing the term. Today, this name is considered completely inappropriate, mainly because it is not possible to define the majority of DNA as junk. However, it is not easy to link these multiple DNA sequences to specific biological functions. In proteins, instead, such a large distinction with respect to their biological activity cannot be made. In these macromolecules, one or more parts directly connected to a biological function can be identified, but the rest of the molecule is essential for positioning and connecting these sites, and no one has ever spoken of a part of the proteins as junk.
It is possible to identify and understand some of the types of relationships between monomers both in DNA and proteins chains. As a matter of fact, these relationships are directly linked in the case of the coding sequences of DNA and their respective proteins. Strictly speaking, the link is between a nucleotide triplet of RNA (codon) and an amino acid of the protein. However, because of the close connection between RNA and DNA, we can consider a direct relationship between a nucleotide triplet of DNA (seen as a codon in which the U base of RNA has been replaced by the T base of DNA) and an amino acid. Similarly, if there is a relationship between two subsequent monomers in proteins, then there is a distant relationship of three bases along the chain, and vice versa, due to the biological role played by codons in the DNA coding sequences.
Other types of relationships between monomers of DNA have been identified over time. In particular, with the expression “long-range correlation” (or simply, “correlations”) between site i and site j in DNA, we mean that the conditional frequency (the measure of the probability of an event occurring, given that another event has already occurred) of the two bases in these two sites, separated in the polymer chain by a large number of monomers, is different from that of a random sequence. In recent years, many authors have discussed the relationships of nucleotides in DNA sequences in general terms [2,3,4,5,6,7,8,9,10,11,12,13,14,15,16,17], and some have moved on to the specifics of them based on information theory [18,19,20,21], such as in this paper. These studies, which focused on long-range correlations, rarely have discussed relationships in DNA as an energetic interaction of two adjacent bases. However, if we want to consider all kinds of relationships among the monomers of a DNA chain, it is also necessary to consider the stacking energy between these two adjacent bases. We believe that these relevant energetic interactions along these chains must have a specific name different from that of the other relationships between sites, and thus, we propose to use the name affinity for the interactions causally related and the name correlation for the relationships that are only statistical evidence.
The current idea is that both DNA and protein sequences are not random, but they are only slightly different from randomness, considering only the symbolic coding of both amino acid residues and nucleotides. In any case, this has nothing to do with their actual biological functions in terms of protein coding and catalysis. Incidentally, the sequences most departing from randomness (in the case of DNA) have very repetitive pericentric and terminal long repeats that do not exert any physiological role in terms of coding for proteins because these sequences play a mainly structural role for chromosome integrity. The same holds for very repetitive sequences (e.g., silk fibroin) that has nothing to do with the catalytic work of enzymes.
In the case of DNA, for example, this thesis presupposes two things:
- (a)
- There is a statistical difference between the coding and non-coding areas of DNA. The different statistical behavior of these two kinds of sequences can be used to build methods for identifying these areas of the DNA. For example, a fractal method to distinguish coding and non-coding sequences in a complete genome has been proposed [22]. This method shows that, following the thermodynamics formulation of multifractal measures, in a graphic of the analogous of specific heat, points of coding and non-coding sequences of many prokaryote genomes are roughly distributed in different regions.
- (b)
- This statistical difference is not due to the biological function of DNA. In general, any sequence of letters is quasi-random, and the regularities have nothing to do with the message conveyed, but only with specific properties of the used language. The same letter translated from English in Italian or in French will have other regularities (departures from randomness) due to the different letter usage of Latin origin languages with respect to English language. This happens every time when in the presence of a code.
However, this thesis is not consistent with the fact that when comparing the informational entropy values of exons and introns of the same chromosome, we observe that they are significantly different in all cases, and we remember that if a sequence has lower entropy, it has less randomness. In particular, the average topological entropy value of exons is lower than that of introns on each chromosome in the human genome, and the entropy values of promoters are even lower than those of exons [23].
The first quantum calculations on base stacking in DNA were reported almost 25 years ago and were executed at the MP2 level [24,25,26,27], but we now know that these early quantum calculations were far from converging and this fact has motivated many subsequent studies which refine the quantum picture of base stacking [28,29,30] interaction. While the early studies are good models for the analysis of the magnitude of base stacking, the correct description of the nucleic acid chain requires accurate calculations of interactions between multiple neighboring moieties at varying distances, where many body effects could play an important role [31,32]. In recent years, several studies have appeared that have investigated not just stacked nucleobases, but also stacked base pairs, i.e., systems with four nucleobases [33,34,35,36,37], since in the DNA double helix, two consecutive, stacked base pairs are known as base pair steps.
In this work, we want to present a theoretical study of the relationships between monomers in many sequences of DNA, the relationships considered as a difference between the frequencies found in these specific biological systems and the random sequences with the same monomeric composition. In this work, in fact, with the expression “random sequence”, we will always indicate a sequence built with a certain percentage of bases, but with a random order. Quantum calculations and statistical analyses of important DNA sequences have been analyzed. We believe that a comprehensive study of the relationships between sites in these macromolecules must concentrate upon both short- and long-range correlations. On the other hand, all previous studies about correlations in DNA sequences have focused on long-range correlations and have not considered the relationship between two adjacent DNA bases due to the stacking interaction. This article is the first comprehensive study about the relationships between monomers and their coding parts in human chromosomes. This article provides several general considerations on these sequences, and our results are also compared to those of other studies in the literature.
In this paper, first we will describe the method used to carry out this study and discuss our choices about the systems studied. Next, we will study some human chromosomes and their relative coding parts, as well as a specific sequence, Alu, which is very important and largely present in DNA. We will focus particularly on the relationships between codons of the coding part of DNA. Furthermore, some rules regarding the composition of these parts of the DNA, such as Chargaff′s second rule and CG percentage, will be evaluated and compared to previous studies of these systems. On the basis of these results, it is possible to draw some general conclusions about the relationships in the coding and non-coding regions of DNA.
2. Method
To study the relationships in macromolecular chains, we will use information theory and, in particular, relative entropy. Shannon′s work on information measurement broadened the concept of entropy, which has since been widely applied in biology. The information function (named Shannon entropy) is given by:
where pi is the relative frequency of the occurrence of the symbols and, given the total sum of the probabilities, pi equals unity.
The Kullbach–Leibler divergence [38] DKL (also called relative entropy) is a function used in statistics and probability theory as a measure of how a probability distribution (P) is different from a reference probability distribution, (Q) and thus, provides the measure of information lost when using Q instead of P.
Given the two discrete probability distributions P and Q, the Kullbach–Leibler divergence is defined as
with the following properties:
- DKL(P,Q) > 0, DKL(P,Q) ≠ DKL(Q,P) and DKL(Pi,Qi) = 0 if, and only if, Pi = Qi.
The concept of relative entropy, defined as the ratio of the Shannon genome information to a random sequence’s information, has been largely applied to the genome by several authors [13,20,21,22,39] in order to quantify to what extent the information contained in the genome is different from the information in a random DNA sequence.
We define the relationship Ck between two sites at distance k along a DNA sequence as:
with Pi,j(X,Y) as the conditional probability that, given X in site i, we will find Y in site j, and with Pi(X) and Pj(Y) as the relative frequencies of X at site i and Y at site j in a random sequence with the same composition in X and Y. In this equation, we have chosen the base of the logarithm equal to the size of the alphabet (in this case, four) in order to normalize the entropies.
There are two different types of correlations in DNA and proteins, named short-range and long-range correlations. The most important correlation, and often the only relevant, short-range one in these chains, is C1, and it expresses a causal link between two consecutive base pairs, or consecutive amino acids, along the chain. These short-range correlations are determined by chemical–physical and energetic causes due to the stacking interactions between these two base pairs in DNA and to a generic interaction between two consecutive amino acids along the protein chain that deserve to be studied in more detail. The difficulty in the study of the energetic aspects of the correlations between neighboring amino acids in proteins is due to the fact that, while for the DNA base pairs there are 16 dimers (which are reduced to 10 different dimers for symmetry reasons), in the case of amino acids, we will have 400 different dimers. To our knowledge, while more than one accurate quantum computation has been performed for the dimers of the DNA base pairs, no systematic quantum computations have ever been done for these 400 amino acid dimers.
Due to the interaction along the amino acid chain, in the corresponding coding sequence of DNA, there must exist a correlation, C3. Since no specific calculations have been done on the interactions of the dimers of amino acids, we will use the correlation between codons as indirect evidence of this interaction.
As we said, we believe that these relevant energetic interactions along these chains (C1 in DNA and protein sequences and C3 in the coding DNA sequences) must have a specific name different from that of the other relationships between the sites, and we have proposed to use the name affinity for these causally related interactions. On the other hand, the long-range correlations (or simply named “correlations”) in DNA and proteins are statistical evidence, and, in general, they do not express a direct causal link and a chemical–physical energetic interaction between two distant sites along these chains. These correlations are the indirect consequence of:
- The propagation of short-range correlations (affinities);
- The large amount of specific sequences in DNA, for example, the Alu sequence, which we will consider later; and
- The hydrogen or disulfide bridges in proteins that directly bind two distant sites in these sequences.
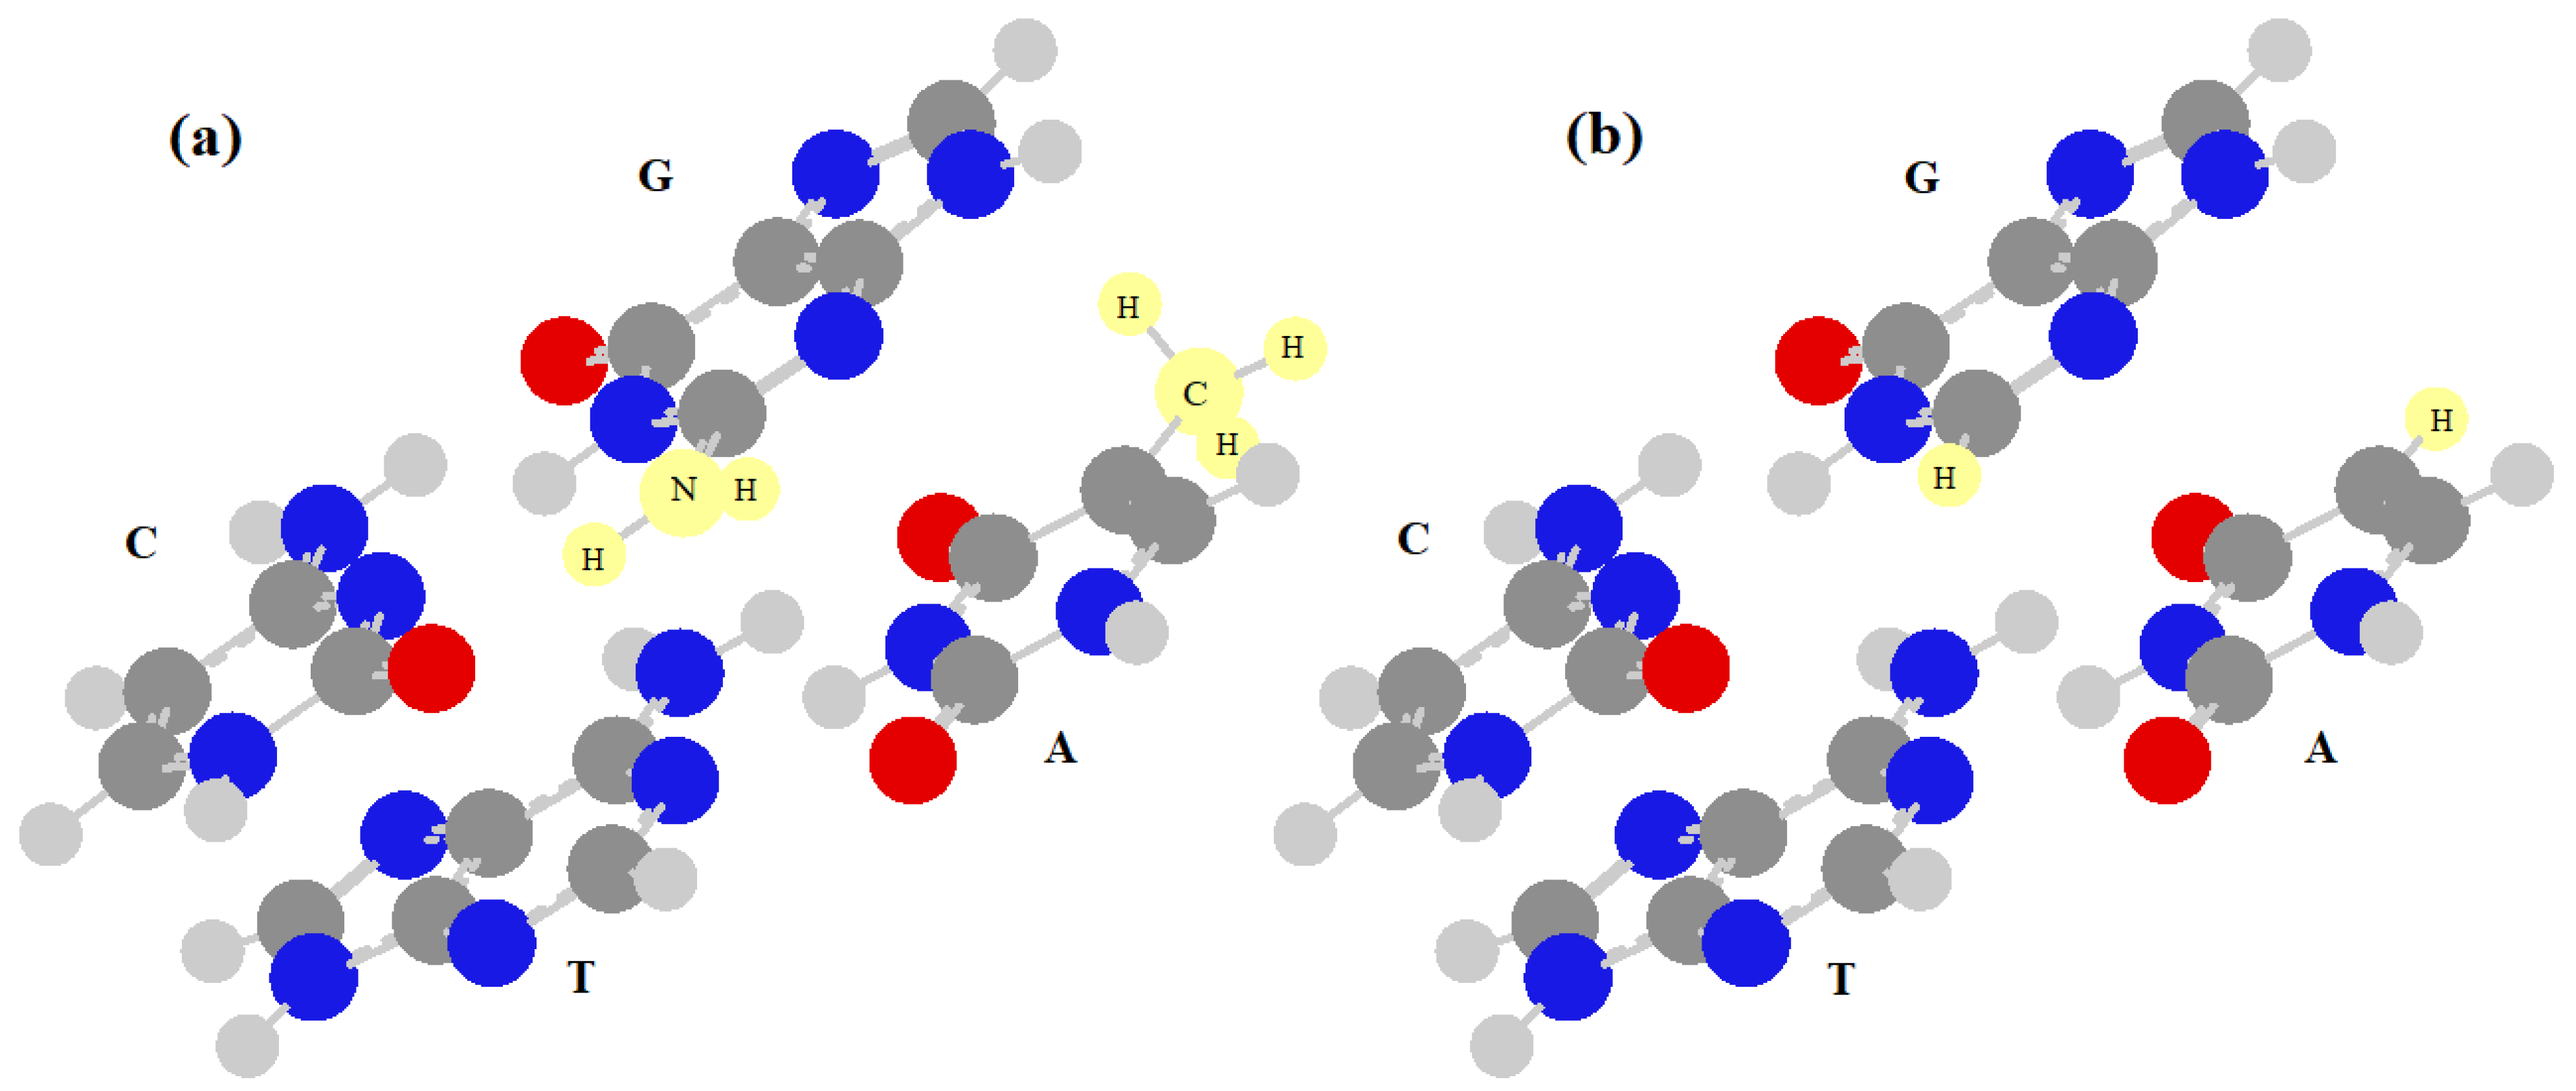
In this paper, to consider the energetic interactions between neighboring base pairs in DNA, we will mainly use the results of [37]. This study, in fact, reports the most accurate stacking energies of the 16 dimers of base pairs, but it does not take into account the possible energy differences between the two base pairs of the dimer. In practice, the energy of the two base pairs forming the dimer is equal to 8 dimers (ApA, ApT, TpA, TpT, CpC, CpG, GpC and GpG), where the notation is the usual one ((base) + (phosphate) + (next base), read along the single strand in upstream direction), while in the other 8 dimers (ApC, ApG, TpC, TpG, CpC, CpG, GpC and GpG), the two base pairs have different energies, which must be calculated. The energies of the two consecutive base pairs are important because the effective interaction (and the affinity) between them will be calculated here by diagonalizing a 2 × 2 matrix that has these energies on the diagonal terms and the stacking interactions on the extra-diagonal ones. This effective local Hamiltonian can be used to compute the energetic part of the affinity between two consecutive monomers. When the two base pairs of the dimer are equal, it is sufficient to assume both energies are equal to zero, but when the two base pairs in the dimer are different, we may assume one energy is equal to zero and the other is equal to the difference of energy between them. Therefore, it is necessary to know only the value of the energy that is the difference of the energy between two different base pairs of a dimer. It is not possible to obtain this value of energy from two simple quantum calculations of the energies of the base pairs because these base pairs have different numbers of atoms (A–T=C10N7H11 e C–G=C9N8H10), and this value would be very high and unrealistic. To calculate a reasonable value for this energy difference, we have modified the base pairs as shown in Figure 1. We have replaced a CH3 group with an H atom in the adenine and a NH2 group with an H atom in the guanine, obtaining the formula C9N7H9 for both base pairs, but preserving the aromatic parts of the system which are responsible for the stacking interactions.
By performing an MP2/cc-pVDZ calculation (with an accuracy similar to that of [37] and including single, double, triple and quadruple excitations in the energy) in the geometries of [37] and averaging over the dimers with different base pairs, we can obtain a ΔE of 9.41 kcal/mol.
The geometries of the base pair dimers in [37] were obtained by optimising the gas phase geometry at the MP2/cc-pVTZ level of CS symmetry-bound theory, and this symmetry constraint is necessary for idealised planar base pairs, preventing a potential non-planarity due to the pyramidalization of the amino group. In addition, to create idealized base pair geometries, they chose the ″natural″ arrangement of B-DNA using a 36° helical twist and a 0° helix.
Our results on modified dimers are also in the gas phase and in the idealized approach, but we reduced the basis set from cc-pVTZ to cc-pVDZ and did not perform a re-optimization of the geometries. Our goal, in fact, was only to obtain an average energy value difference for two adjacent base-pairs (X and Y (with X ≠ Y)) and the differences between the specific dimers are estimated to be greater than those due to these approximations.
In any case, all inter- and intra-strand interactions are included in our calculations, as in the aforementioned previous study. Also, as mentioned in [37], these systems are not very sensitive to small differences in geometries since the base pair stacking energy corresponds to the low energy conformational region sampled by the thermal motions in a double helix B-DNA.
All the DNA sequences analyzed in this paper have been obtained from GenBank. In particular, the GRCh38.p13 Primary Assembly has been used for the human chromosomes. Using the “coding” option in GenBank, we will get a file with numerous gene repeats. All calculations on the coding parts of DNA sequences have been performed on files cleaned of these repeats (Table A1).
3. Results and Discussion
In this paper, we perform an analysis of the affinities/correlations in DNA, and we show the difference between the correlations that we may consider as statistical evidence and some affinities with a specific biological meaning. Unless otherwise specified, all affinities and correlations are calculated with Equation (3). This means that all the relationships between monomers can be directly compared. The separation of the relationships between sites in two different groups, called affinity and correlation, is therefore only in the interpretation of the results and not in different ways of calculation. In particular, we will perform a statistical analysis of the following human chromosomes: chromosome 1 (indicated as Chr1) and the sexual chromosomes X and Y (ChrX and ChrY) as a comparison; in some cases, we computed some parts of the affinities/correlations in all the human chromosomes. We also analyzed the correspondent coding parts of these chromosomes. A specific, non-coding DNA sequence (Alu) has also been considered.
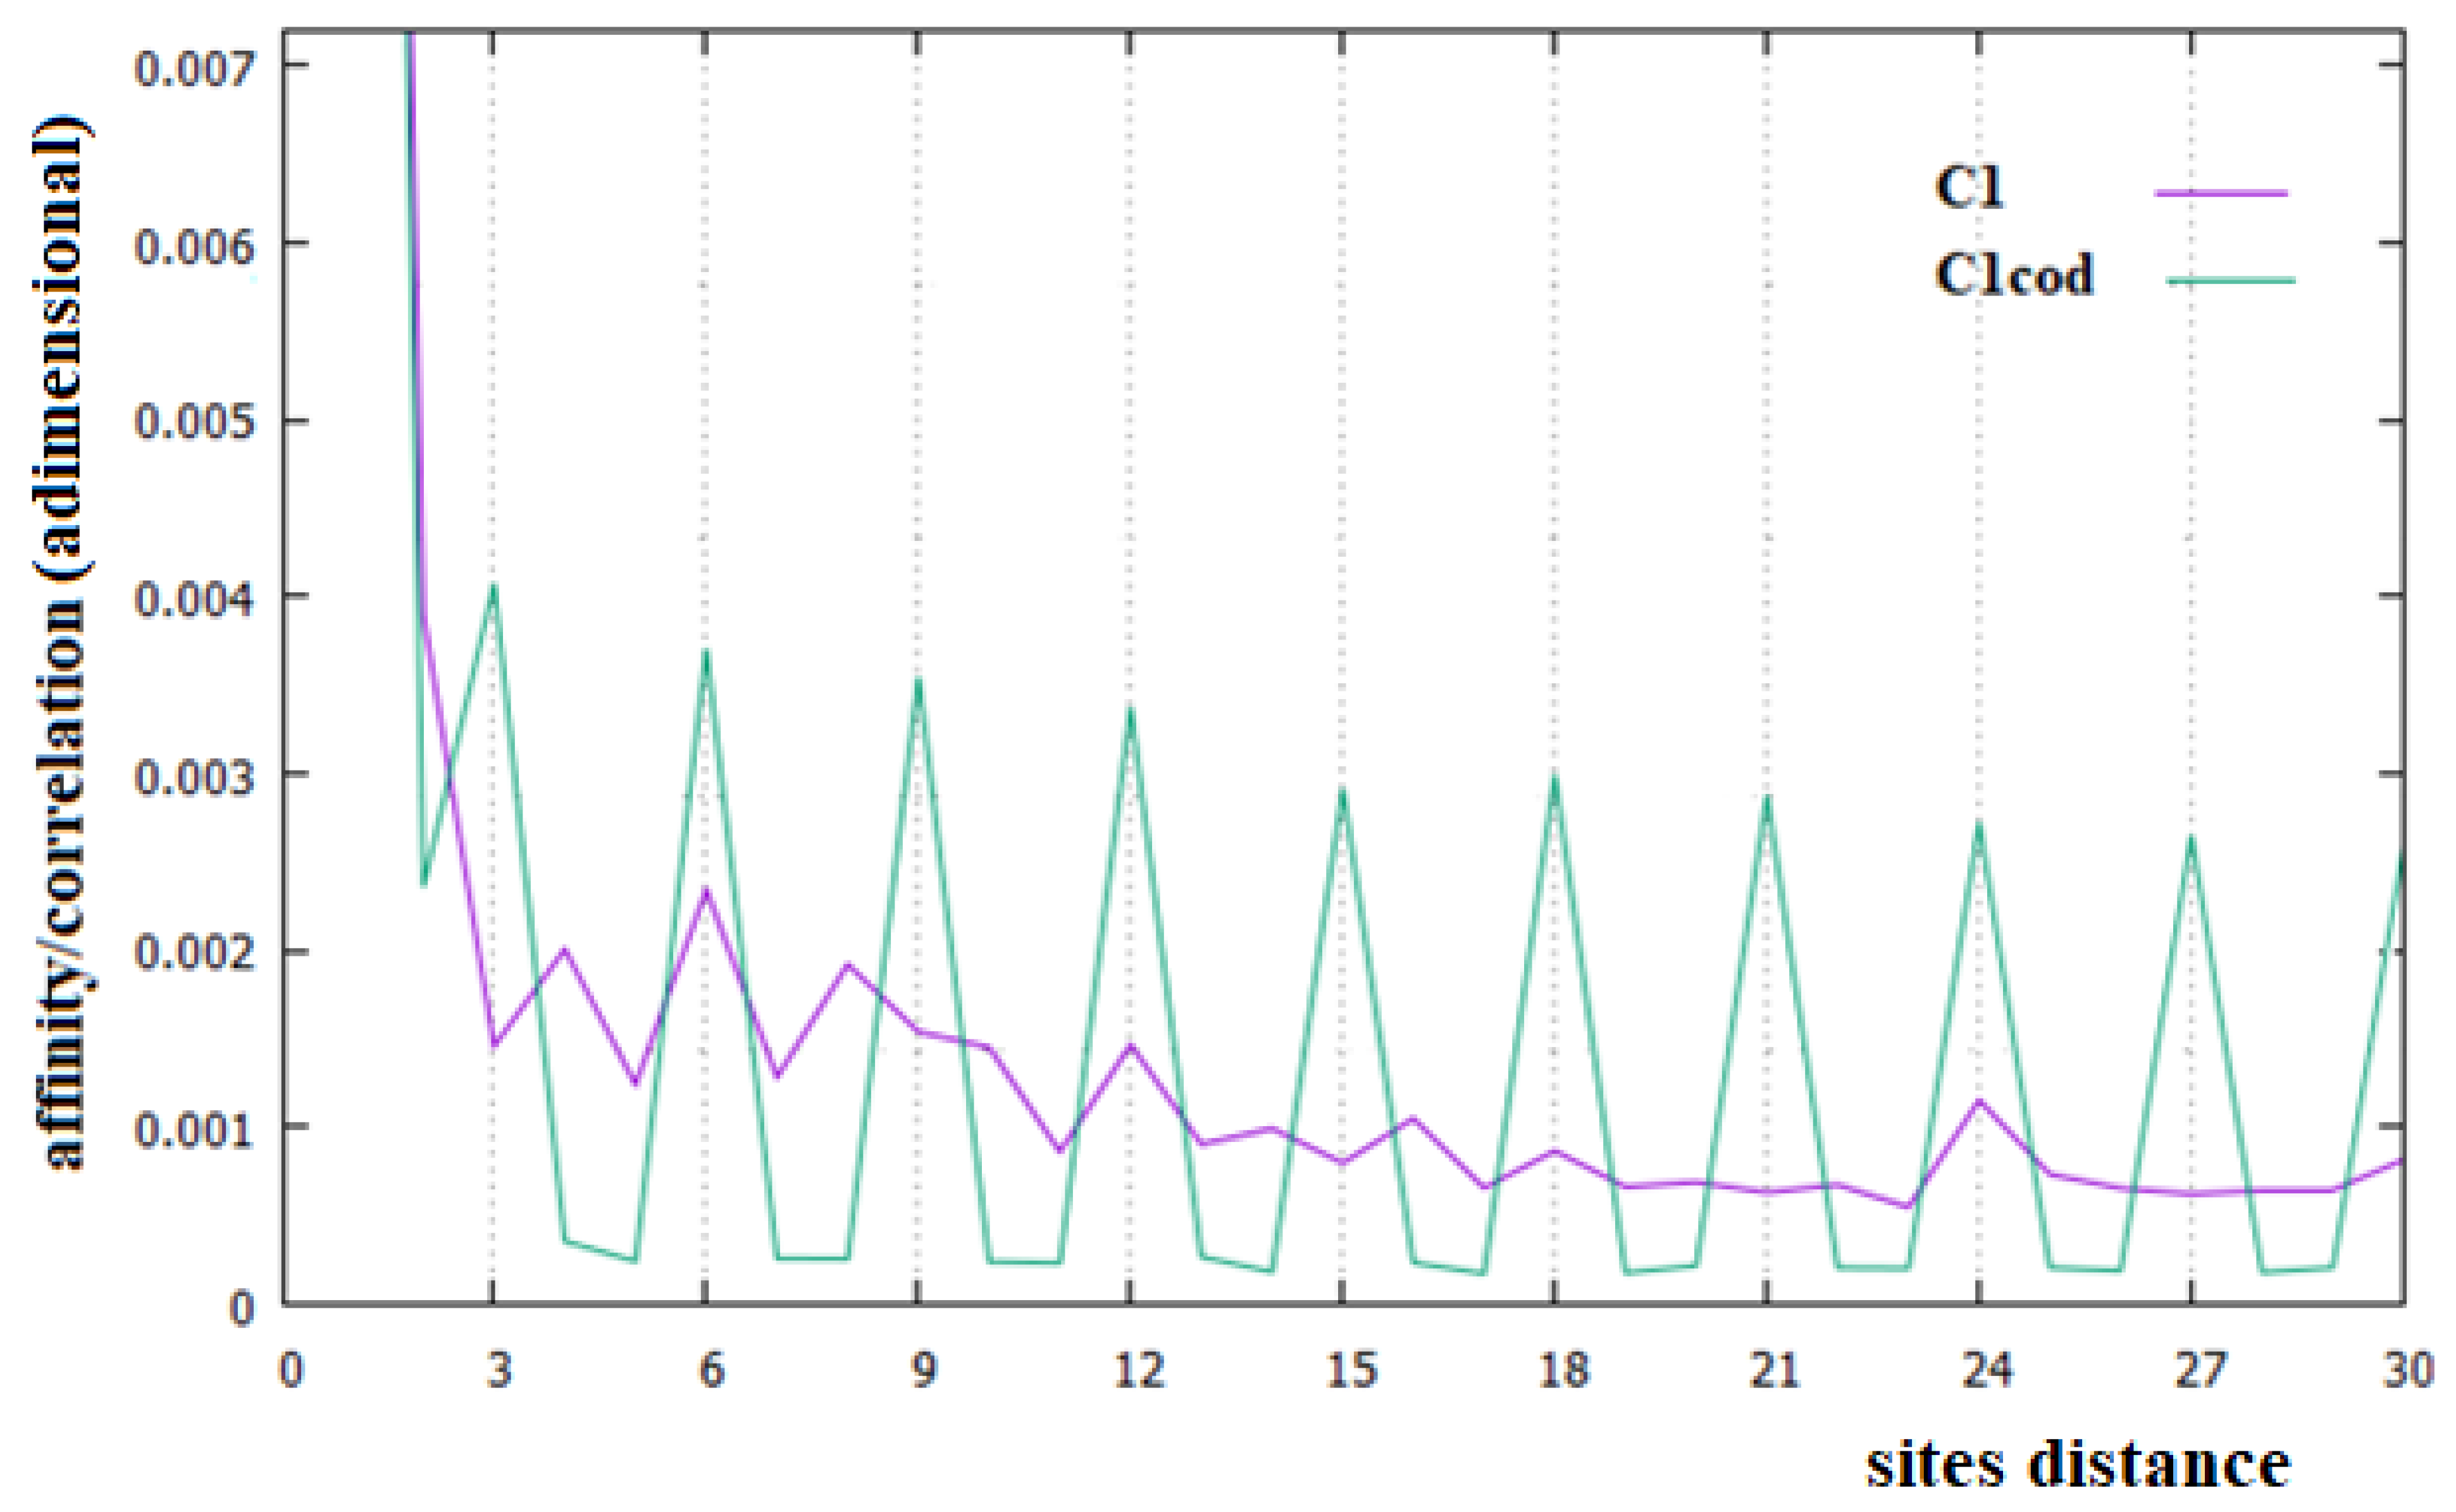
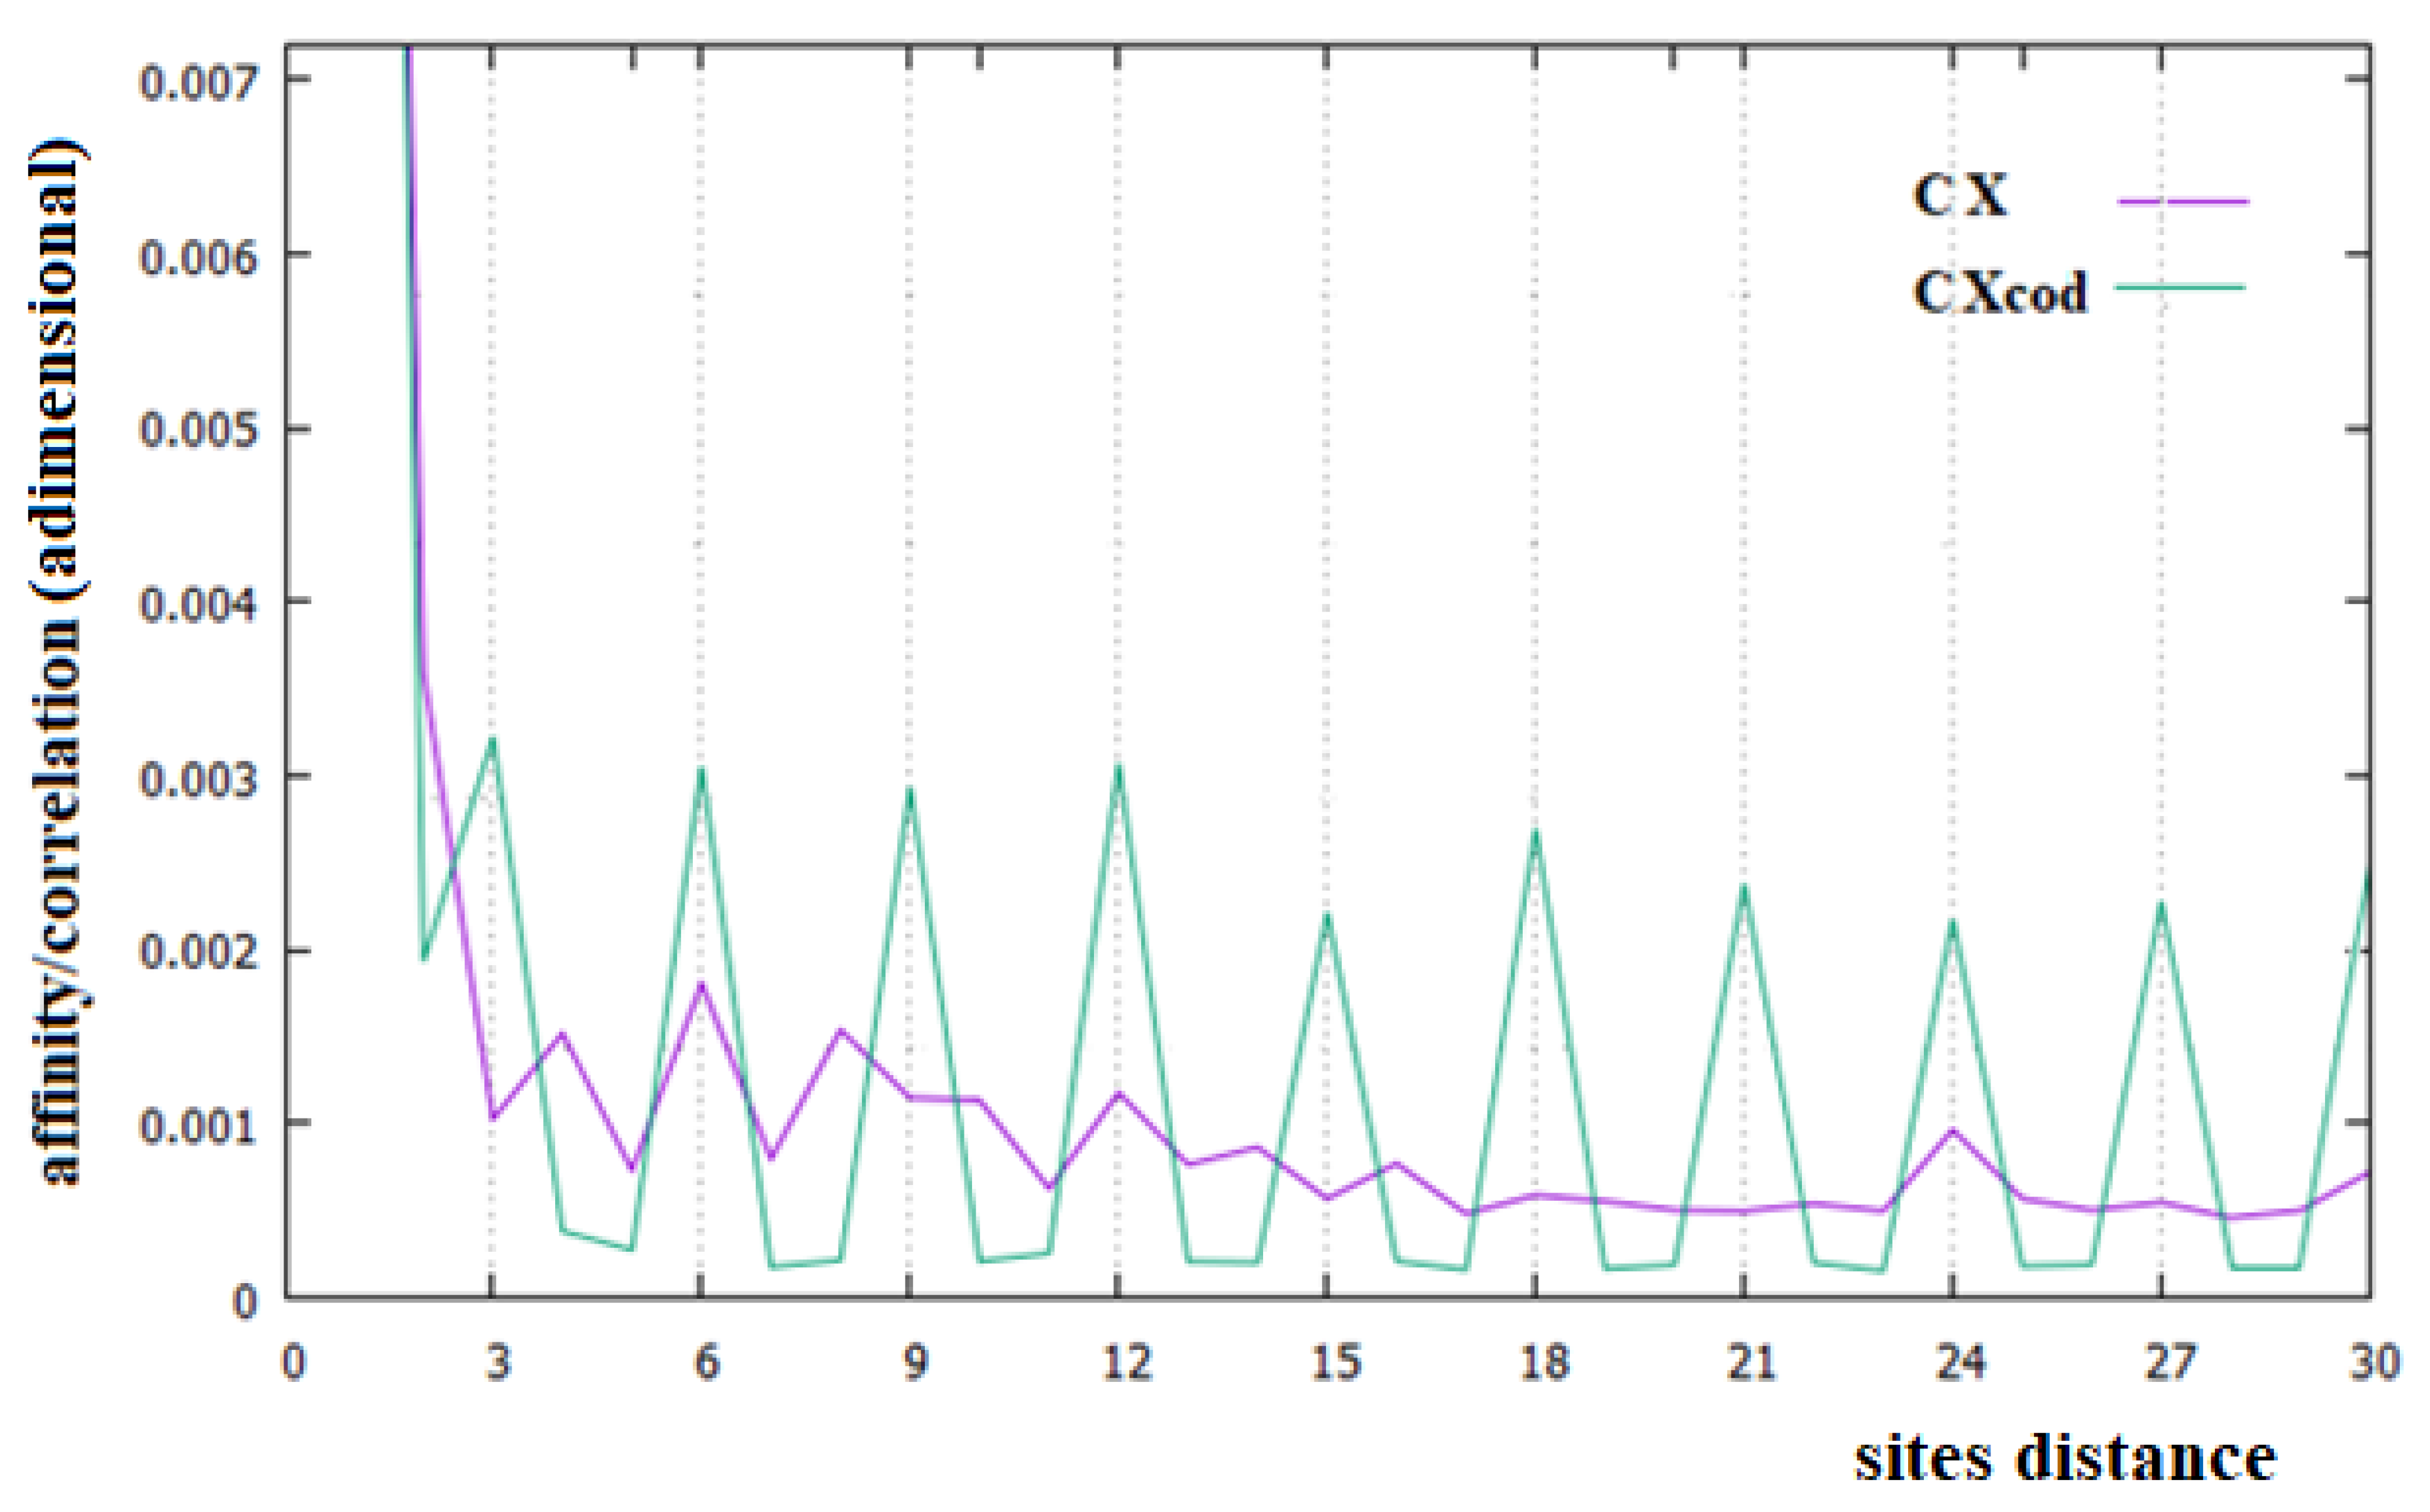
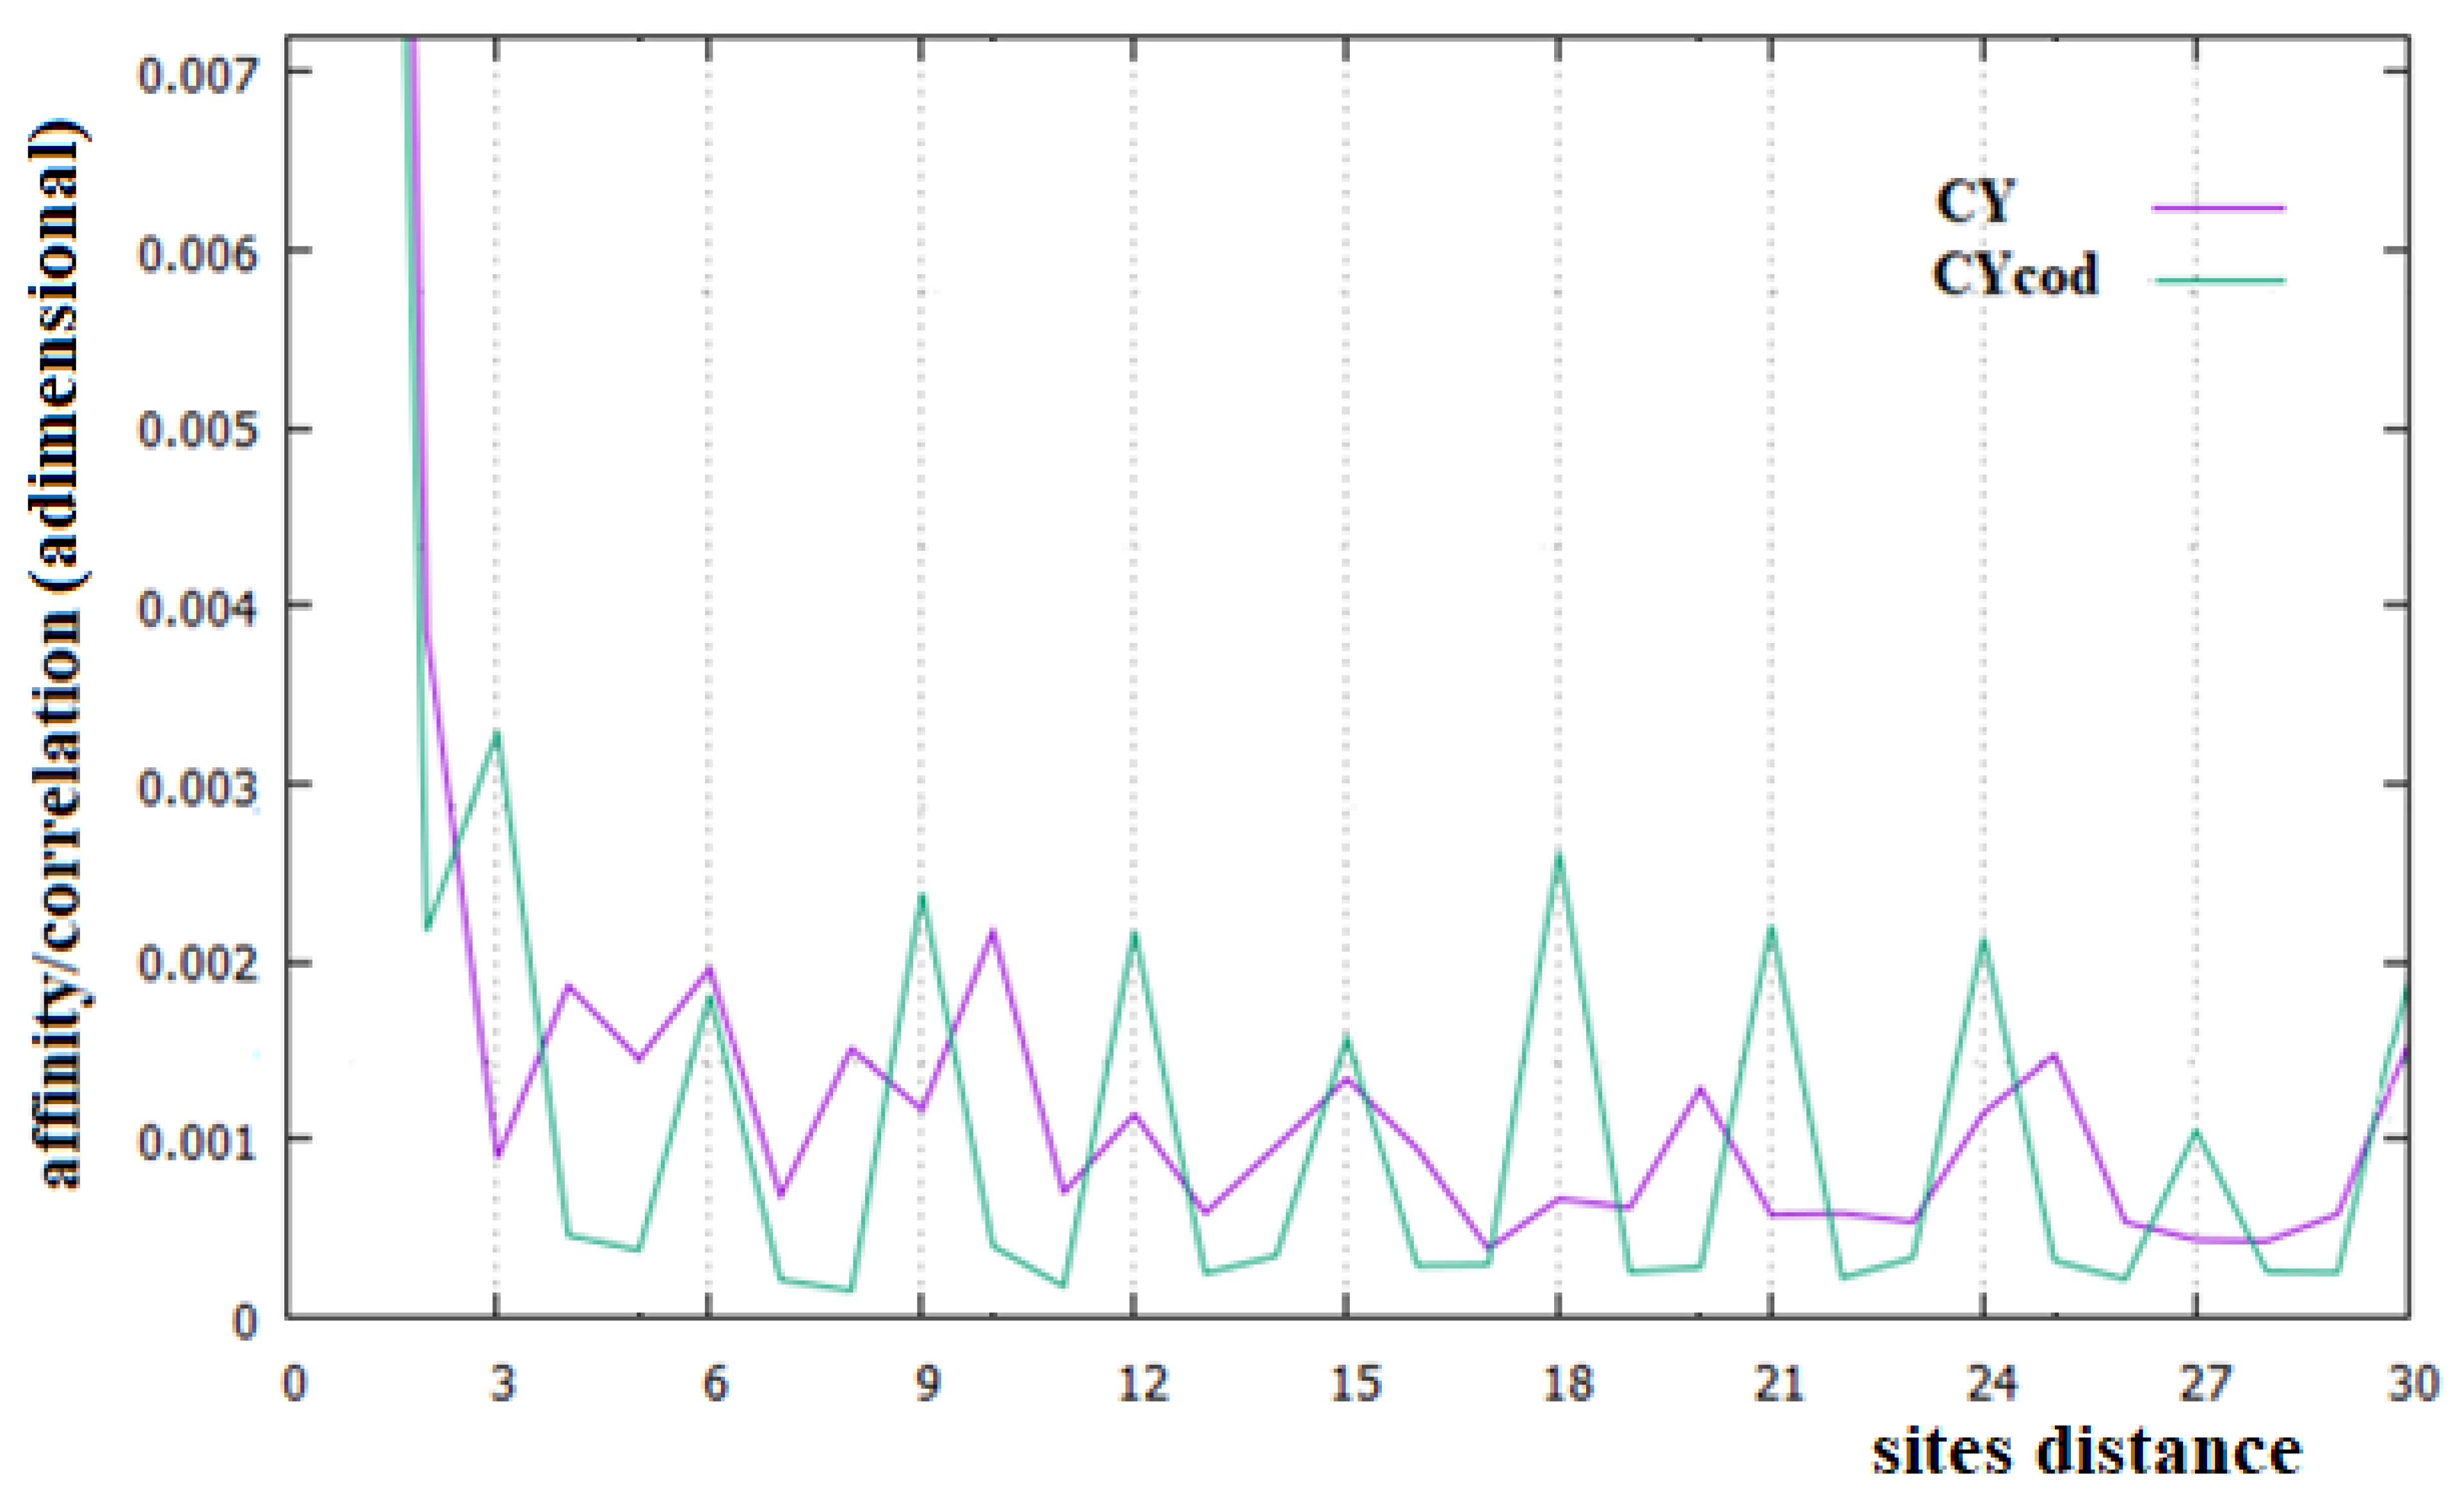
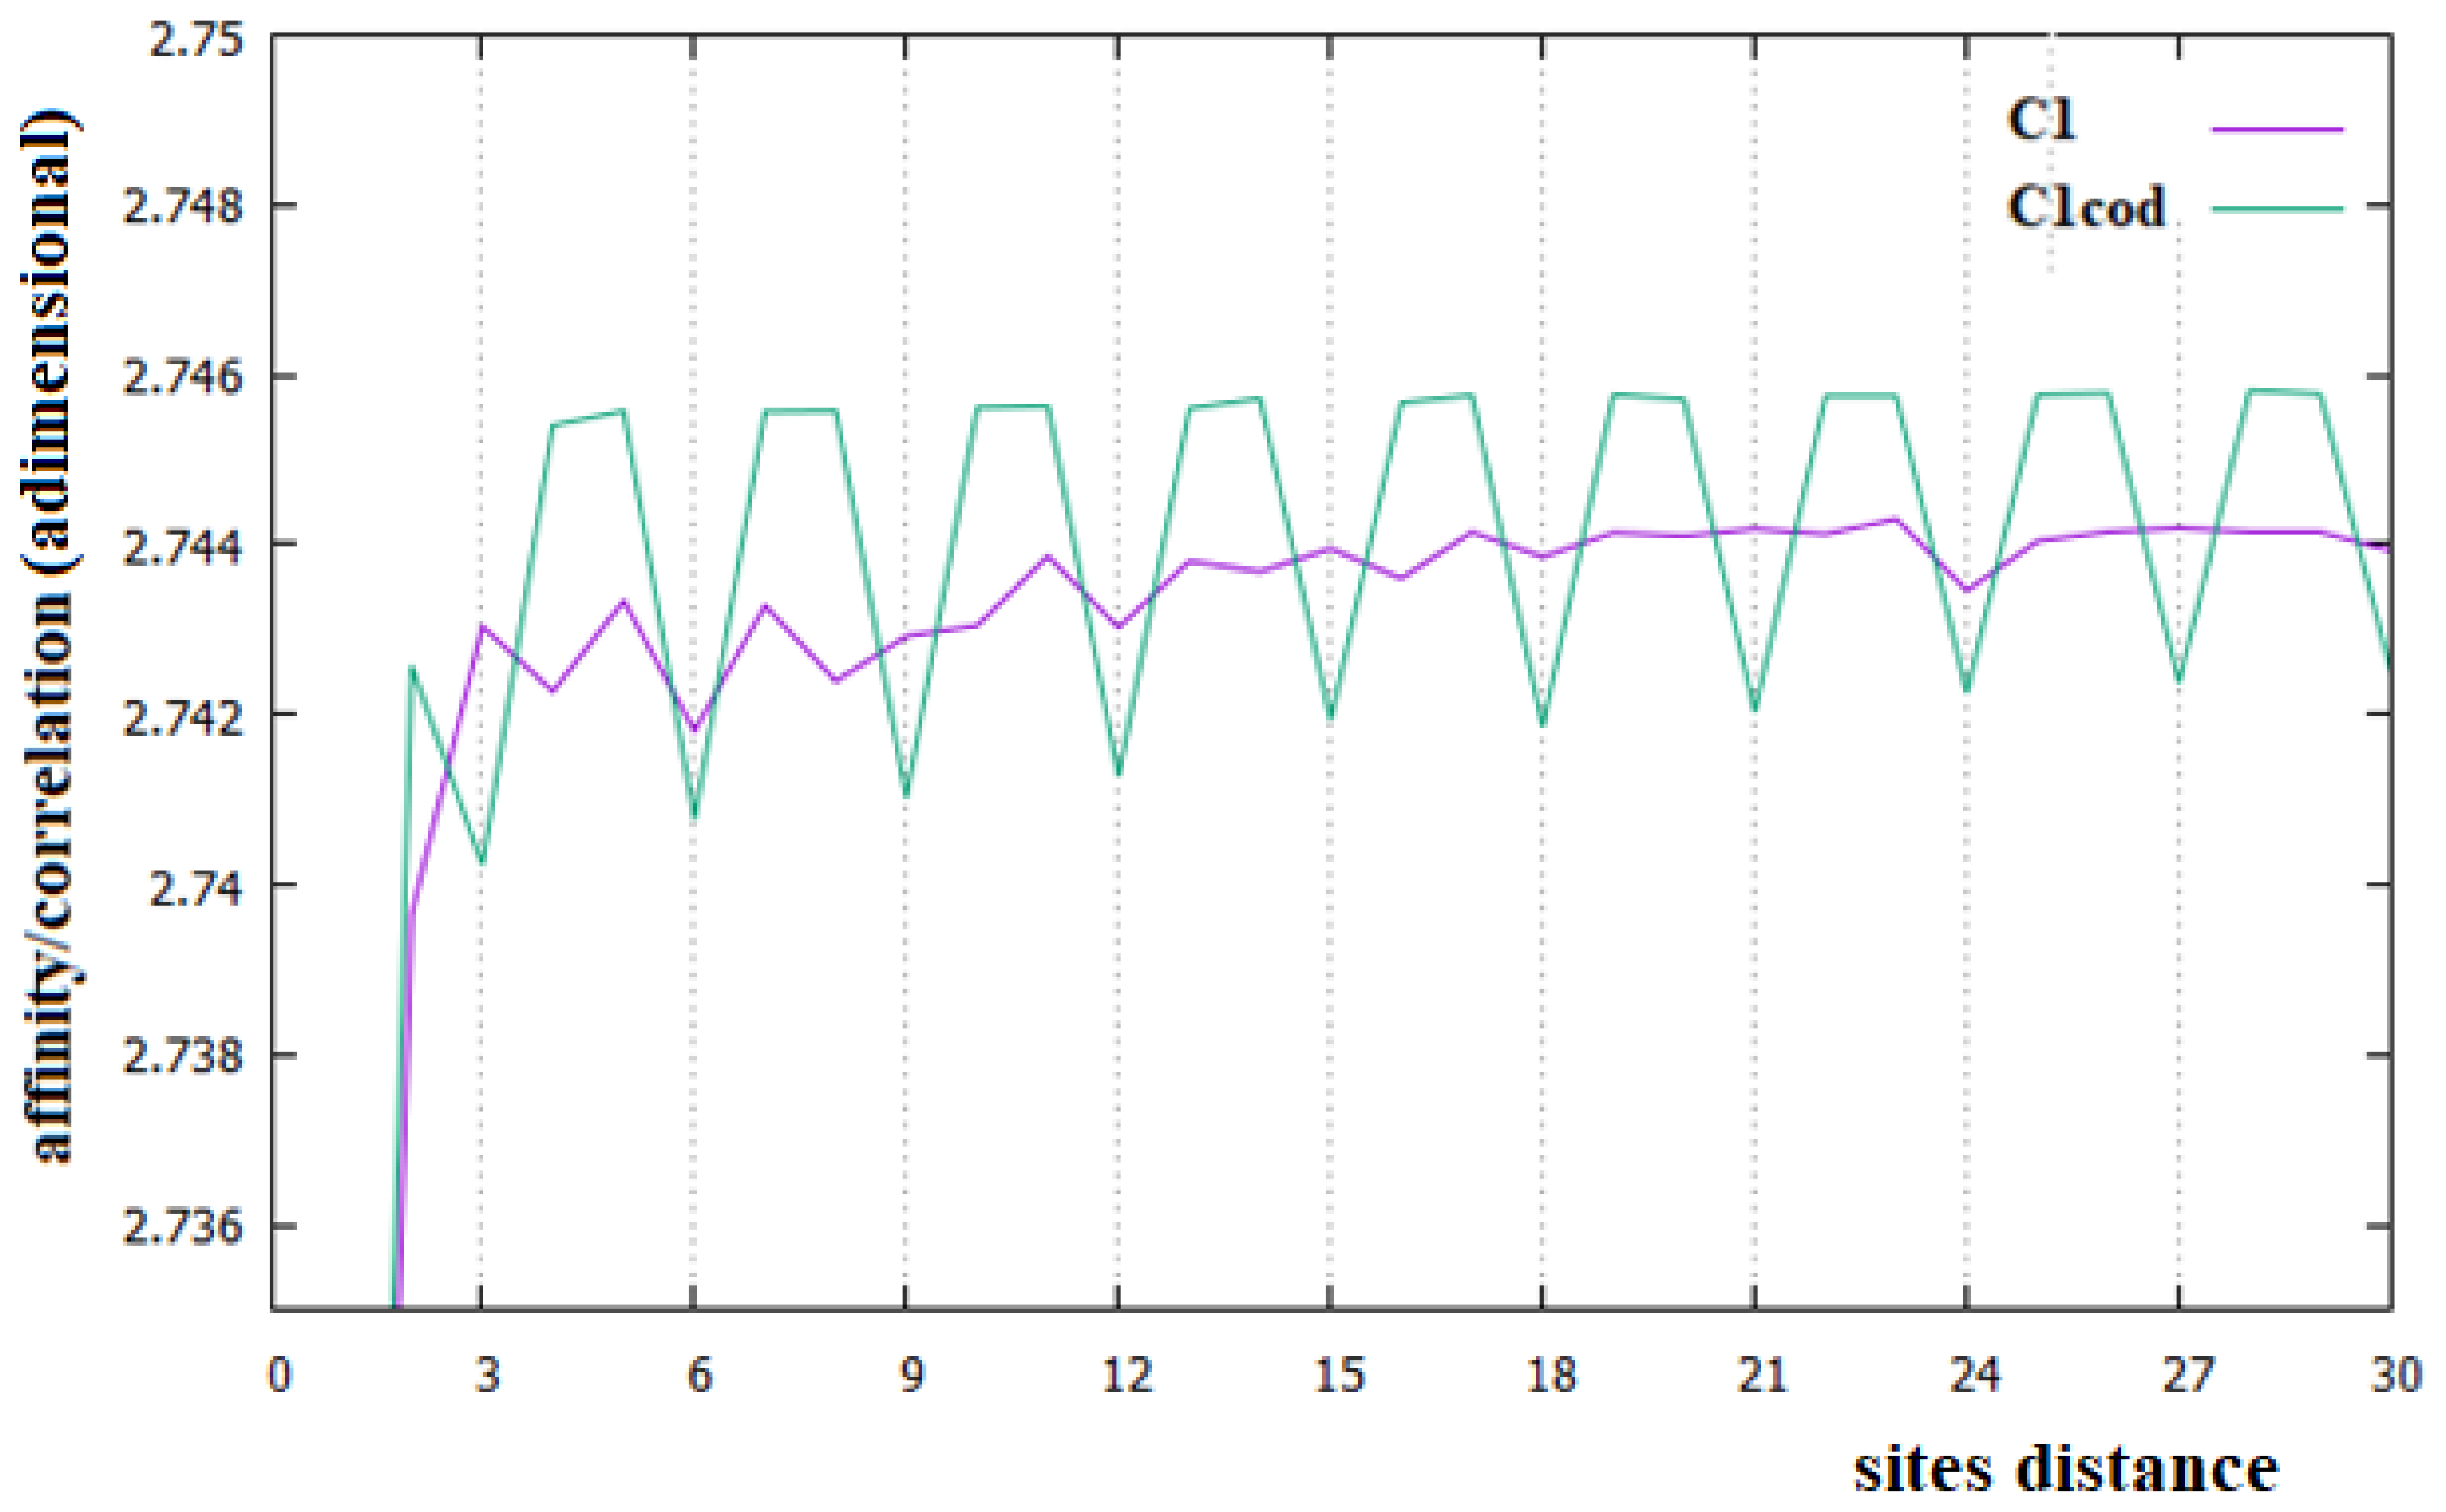
In Figure 2, Figure 3 and Figure 4, the affinities/correlations Ck, for k in the range 1 to 30 of the human chromosomes Chr1, ChrX and ChrY, and the affinities/correlations of the coding parts of these chromosomes are shown. The value of the affinity C1 is the highest (and it is out of range) in these figures in all cases, and it is around 0.023, an order of magnitude larger than the other values. Differently from what it has been said by the authors of [18,40], for both the coding and the non-coding sequences, and despite the strong random drift of DNA, the coding sequences, strictly bonded by the C3 affinity along the chains, cannot be considered as similar to almost random sequences.
In Figure 5, we show the same affinities/correlations of Figure 2, but calculated with the Tsallis method of [41], in which the author started from the equation of informational entropy SI as follows:
where W is the total number of possible (microscopic) configurations and (pi) is the associated probabilities, and they have arrived to the relationship between two sites at distance k along a DNA sequence as:
This method is particularly suitable for long-range correlations. Even with this method, however, we see the same behavior as in Figure 2, Figure 3 and Figure 4 for the chromosomes considered (compare Figure 2, Figure 3, Figure 4 and Figure 5, as an example).
From Figure 2, Figure 3 and Figure 4, it appears evident that the major difference in the relationships between sites of the coding and non-coding sequences is the presence of a triplet-frame in the coding (exon) part, as well as the absence of such a frame in all non-coding (intron) regions. The C3 relationship of the coding sequences can be considered an affinity since this is not statistical evidence as the correlations, but it is related to the causal interactions with C1 in the protein. Looking at the correlations of the coding parts of the human Chr1, ChrX and ChrY of Figure 2, Figure 3 and Figure 4 (green curves), we see that in these figures there is not only the C3 affinity, but also the C6, C9, …, C30 correlations. Does this statistical evidence also have physical cause significance? Does a base in site i directly and causally affect the frequency of a base in the i plus 30 site? To answer this question, let us ask ourselves what we should expect in the frequency of the base in the i plus 30 site in order to have a null correlation with the base in position i. For having C30 = 0, the bases in the i plus 30 site must be distributed in a random way with respect to all bases in i. However, if the bases in the i plus 30 site were distributed in a random way, the base in the i plus 27 site would also have zero correlation with those in the i plus 30 position, and this is in contradiction with the existence of the C3 affinity that relates i plus 27 and i plus 30 sites. This argument could be extended to all pairs of positions with the multiple distances of three. Hence, as a consequence, the C3 affinity generates all the other C3∗n correlations.
The persistence or lack thereof of the C3 affinity in the entire DNA of different species has been interpreted in the literature as a measure of the percentage of the coding fraction [42]. This also means that these authors consider that this relationship between sites is different from the others because it has a close relationship with a biological cause. However, in the cases of the single human chromosome shown in Figure 2, Figure 3 and Figure 4, the percentage of the coding zone is not able to explain the accentuation, or lack thereof, of the affinity C3. In the purple curve of Figure 4, in fact, the C3 affinity is still visible, although the coding fraction of this chromosome is 0.34% of the complete chromosome, lower than that of both Chr1 (1.5%) and ChrX (0.94%), where such affinity is less visible.
Analyzing the correlations in the entire human chromosomes of Figure 2, Figure 3 and Figure 4 (purple curves), no specific correlations induced by the affinities C1 and C3 are found. In any case, the specific correlations in these sequences, probably related to the large number of repetitions present in these sequences, need further investigation. One of these widely found repetitions in DNA sequences is the Alu sequence, a non-coding sequence of about 300 base pairs repeated many times in more or less complete forms to represent about 11% of all DNA [43,44], which is why we have decided to study this sequence.
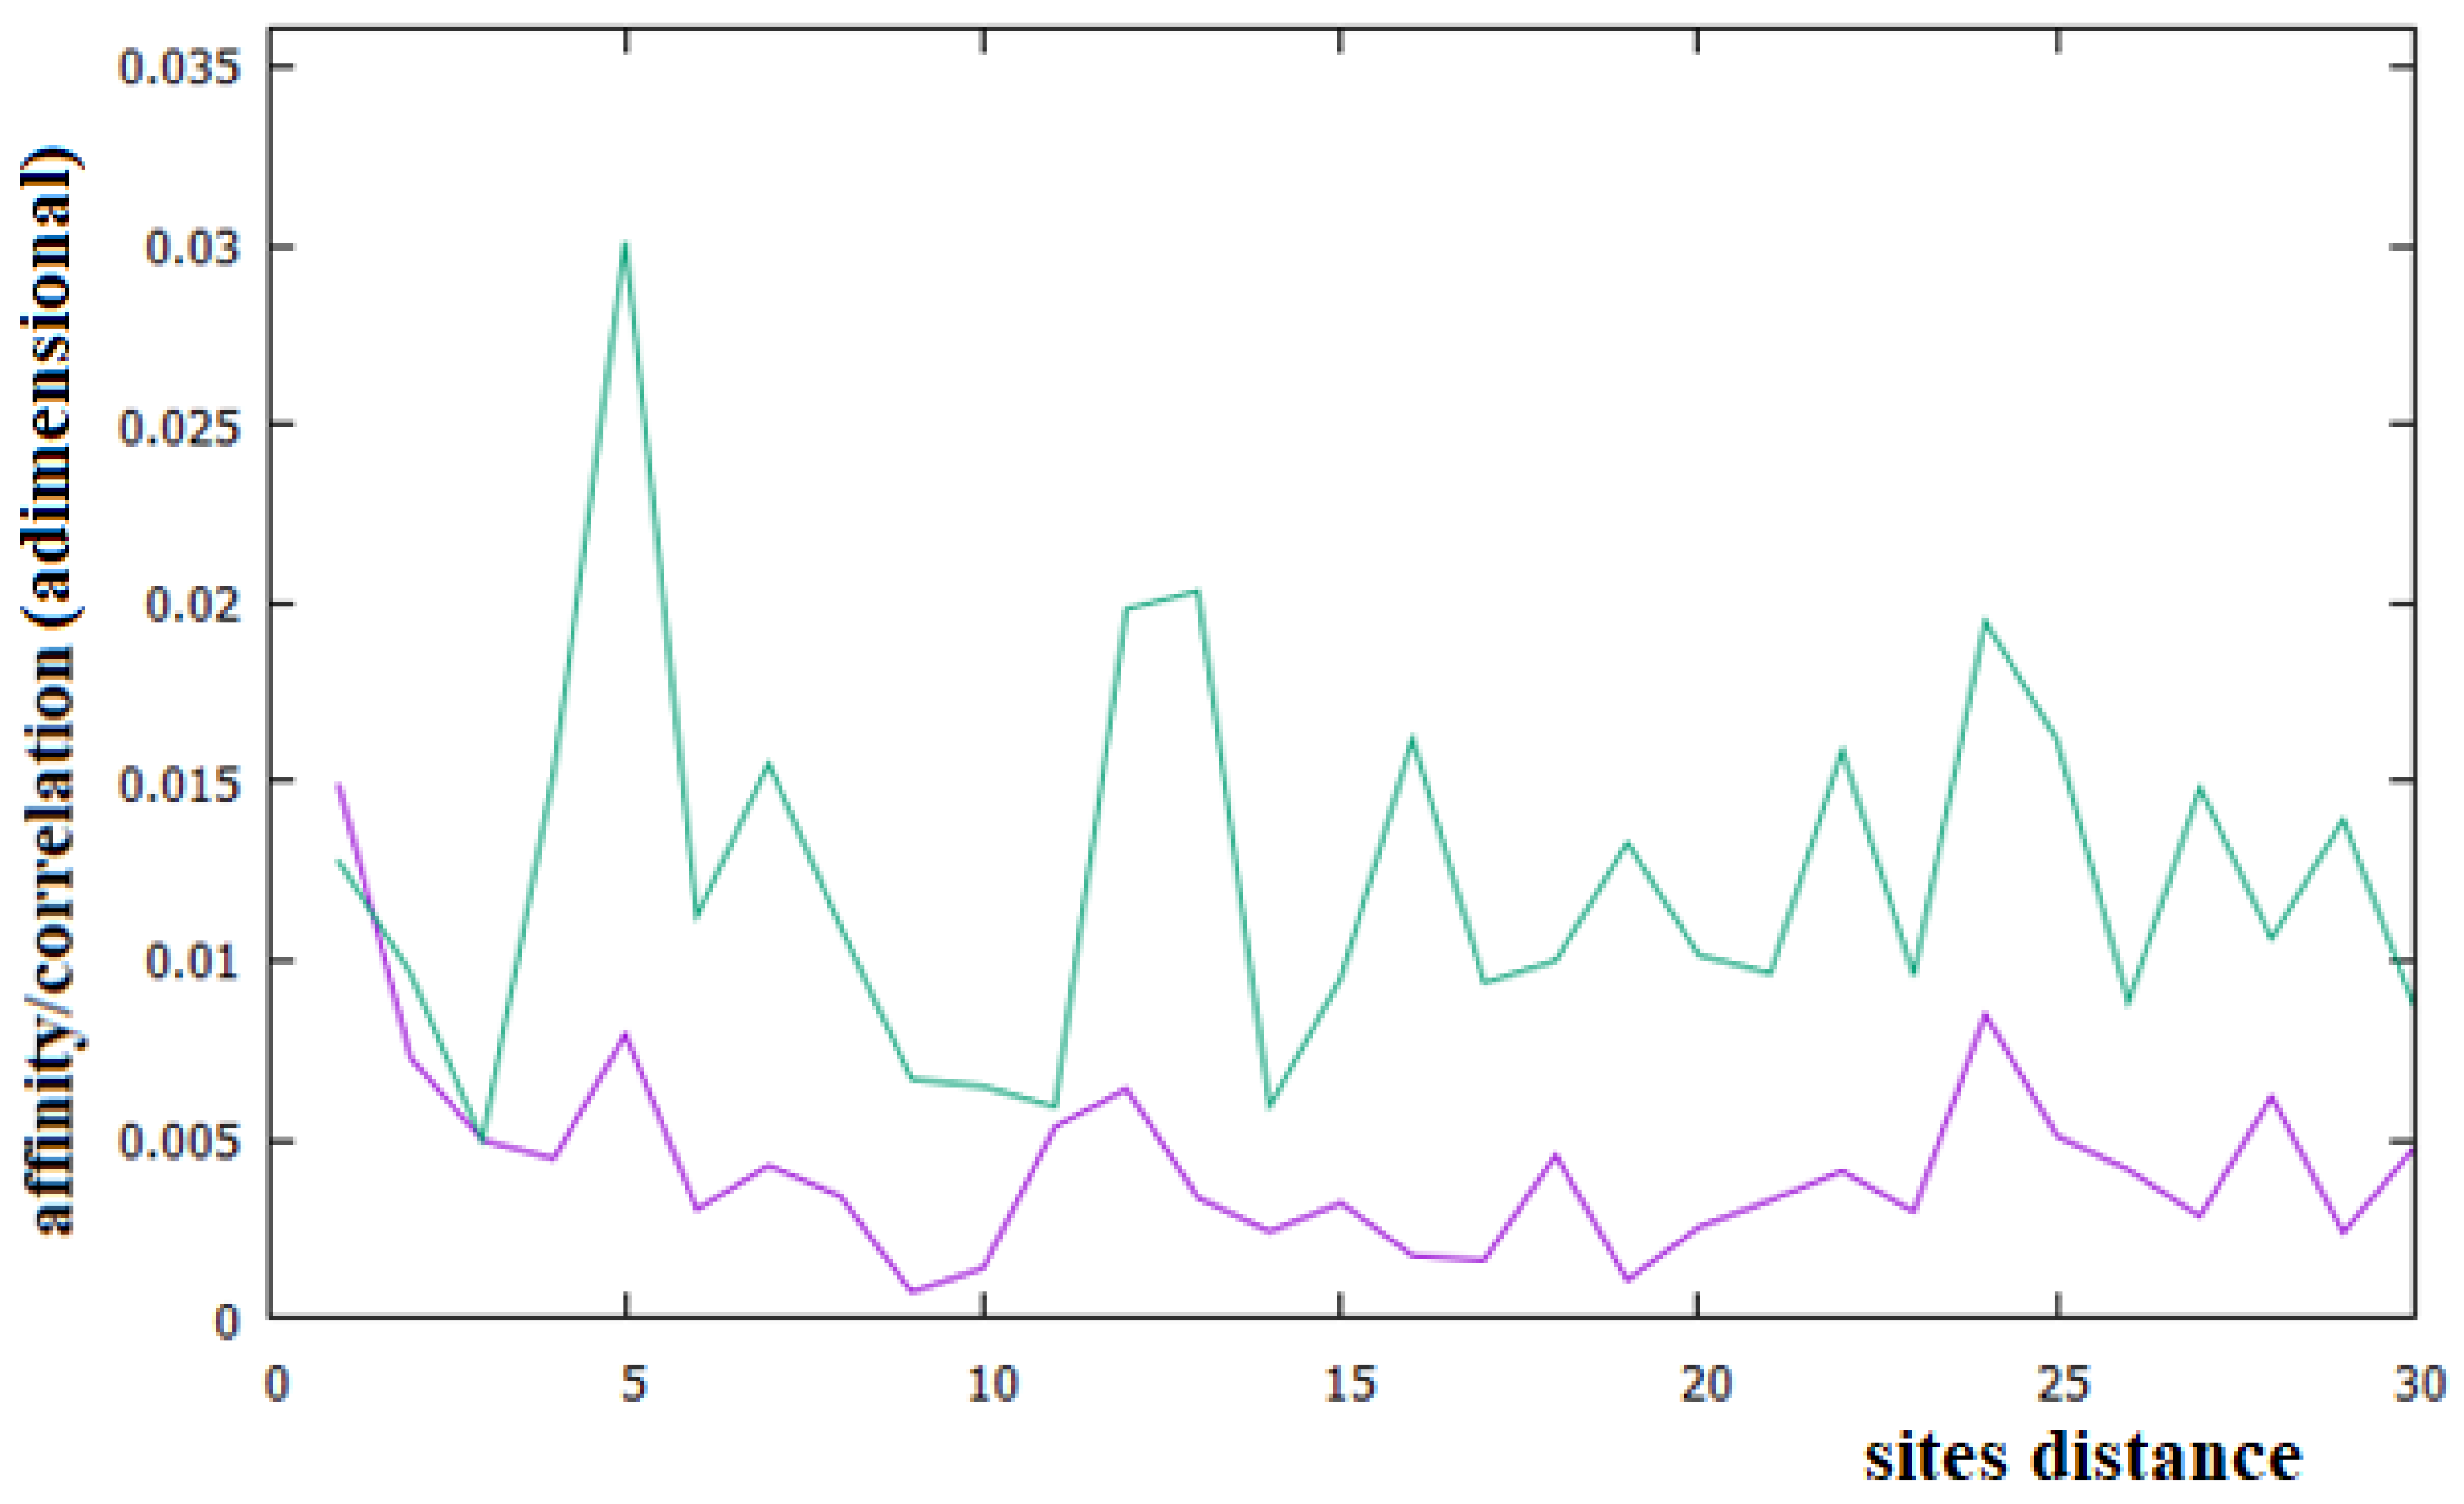
In Figure 6, we have reported the affinities/correlations of the Alu sequence (green curve) and that of a hypothetical sequence formed with the first five coding parts of Chr1 interspersed with four Alu sequences (purple curve). There are larger correlations between sites in the case of the Alu sequence than in the human chromosomes (note that the correlation scale of Figure 5 is five times greater than that of Figure 2, Figure 3 and Figure 4). Another important difference between Figure 6 and Figure 2, Figure 3 and Figure 4 is that the affinity C1 is not the largest one in the Alu sequence. In the case of the sequence formed with the coexistence of coding (with their affinities C1 and C3) and non-coding parts (Alu sequence), it can be seen that the figure shows an aspect more similar to that of a chromosome (compare the purple curves of Figure 6 with those of Figure 2, Figure 3 and Figure 4).
In this last case, there is, in fact, an evident decrease in the intensity of the correlations, the affinity C1 becomes the most important value of the curve and a random correlation trend appears. From the comparison of Figure 6 with Figure 2 and Figure 3, it is also evident that the persistence of the C12 and C24 correlations in the chromosomes 1 and X may be related to the presence of a large number of Alu sequences in these chromosomes. In general, we believe that the evidence of these correlations in a chromosome could be used as an indicator of a high percentage of Alu sequences in that chromosome.
If the affinity/correlation of a random sequence, constructed with the same percentage of bases, is subtracted from each correlation of a DNA sequence, a relative affinity/correlation value, which can be positive or negative, can be defined; this means that two base pairs at a distance of i sites can have a higher or lower frequency than that expected for the random sequence. For convenience, we have also identified the class of neutral correlations, i.e., a correlation with a small (positive or negative) value, assuming |Ci| ~ 0 for −0.02 < Ci < 0.02 (about one tenth of the major correlation value, see Table 1). In Table 1, we can see the relative affinity of each A, C, G and T base, with the consecutive one (C1) in the case of the human Chr1.
From an examination of Table 1, we see the A base along a strand of DNA having a positive affinity with the A and G bases. This means that this base has a greater probability of being immediately followed by the A and G bases in Chr1 than in a similar (with the same composition in the bases) but random sequence. The A base, instead, has a negative affinity with the C base and a neutral affinity with the T one; therefore, it has a lower probability, or approximately an equal one, than the random sequence of being followed by the C and T bases in the human Chr1, respectively.
In the literature, the presence of base correlations in DNA sequences has been related to two general processes, as discussed below. For example, Perez [45] wonders if certain DNA rules are “directly from an ancestral original source” or “the result of ongoing self-regulation and genome process tuning?”
- Evolutionary reasons could provide information on past DNA and allow us to identify the laws of its evolution. The correlations, therefore, would be a consequence of such laws of genome evolution, and current genomes could be seen as a picture of the ongoing genome evolution process and, assuming that the symmetries on its composition derive from past genomes, could shed some light on the origin of life [46,47,48]. In this case, however, we must take into account that genomes show a great variability of constituent elements as consequence of their rates of mutation, genetic recombination events, horizontal gene transfers and gene losses or gains [49]. For example, two random DNA sequences can show up to 50% identical sequences when gaps are allowed [50,51,52]. As a result, many evolutionary analysis tools work well at short evolutionary distances, but only a few of them have worked well over longer time distances [53].
- The structural reasons explain how DNA is made. In this case, given that the structure of DNA is determined by physical and system constraints, the latter is dependent on its information content. These authors show that the composition of these codes lie at or around the local minima of the information function. The fact that codes do not evolve towards maximizing the information function leads these authors to assume that there is a mechanism that induces genetic codes to minimize information and that this mechanism is driving the evolution of this code. At some point in the evolution of living organisms, the number of constituents was blocked, and the cell began to develop a genetic code with non-random information content that corresponds to a trend towards one of the lows of the information function, or at least close to such state. This image agrees with most of the considerations about the correlation between the complex biological systems and non-random information content. The authors of [54] also suggest that based on the complexity of DNA sequences, a model for duplications of DNA sequences can be a fruitful approach to understanding long-range correlations.
To these two processes, we believe a third must be added if we want to consider all types of relationships (affinities and correlations, for us) related to the energetic interaction between contiguous base pairs in the DNA sequence and between two consecutive amino acids in proteins.
The stacking energies of the 16 dimers of the base pairs obtainable from [37] can be summarized as set out below. Recall that, for symmetry reasons, ApA = TpT, ApC = GpT, ApG = CpT, CpC = GpG, TpC = GpA and TpG = CpA, and therefore, the 16 dimers of the base pairs give 10 different stacking energy values.
- (a)
- All stacking energies of the dimers are negative, i.e., the dimers are, in all cases, more stable than the two isolated base pairs.
- (b)
- There are 11 dimers (ApA, ApC, ApG, CpC, CpT, GpA, GpG, GpT, TpA, TpC and TpT) with equal or similar stacking energy. For these dimers, in fact, we have an average stacking energy of 13.56 kcal/mol with a small dispersion in the range [13.22 ÷ 13.96].
- (c)
- There is only one dimer, ApT, with a stacking energy value lower than that of group (b) and, in particular, with a stacking energy of 11.66 kcal/mol.
- (d)
- The other four dimers, ApT, CpA (and TpG equal to it) and CpG, have stacking energies higher than that of group (b), with an average value of 16.62 kcal/mol, a dispersion in the range [15.95 ÷ 18.44 and limit values of CpA = TpG = 15.95 kcal/mol and CpG = 18.44 kcal/mol.
In Table 2, we show the probabilities of the A, C, G and T bases followed by any other base in a DNA sequence, taking into account only the energetic aspect of [37], in the case of the human Chr1 system. The values of this table are obtained by the diagonalization of the 2 × 2 effective local-hamiltonian matrix, as explained in the previous paragraph.
In the calculation of the values of Table 2, a difference was considered between the dimers formed by two equal base pairs (the probabilities are highlighted in red in Table 2 and in the following two tables) and those formed by two different base pairs (probability in black in Table 2, Table 3 and Table 4). We remembered, in fact, that when we write XpY (read along the single strand in an upstream direction, of course), we mean the base pair X-cX (with cX the complementary base of X: cA = T, cT = A, cC = G and cG = C) in stacking interaction with Y-cY. The equality of the two base pairs occurs when Y is equal to X or cX. As mentioned previously, in fact, if the two base pairs are different, there is an energy difference of 9.41 kcal/mol between them. The red values of the probabilities in Table 2, both for the AT and CG pairs, are therefore determined by the value of the stacking energy, while the black values of the probabilities in Table 2 are determined by the stacking energy and the energy difference of the two base pairs. Finally, the normalization of the probabilities affects all the values in Table 2.
To compare the energetic aspect of the affinities between two consecutive base pairs of DNA with other aspects, in Table 3 and Table 4, we report the correlations, read along the upstream direction, of the human Chr1 (Table 3) and of its coding part (Table 4).
We note that the energetic aspect is an important factor in these C1 affinities, but not the only one that influences them. Obviously, the low amount of the CpG couple of bases, both in the coding part and in the entire Chr1, is due to a different cause (deamination of methylated cytosine to thymine) with respect to the purely energetic one, but also with respect to evolutionary or structural causes. It is well known that in human DNA, this successive couple of bases is less than a quarter, compared to a random prediction.
To calculate the incidence of the energetic aspect in C1−C3 of all human chromosomes, we take into account what summarized by the results of [37]. Since 11 dimers of base pairs have very similar stacking energies (13.56 kcal/mol), we exclude them in the calculation of the affinities/correlations.
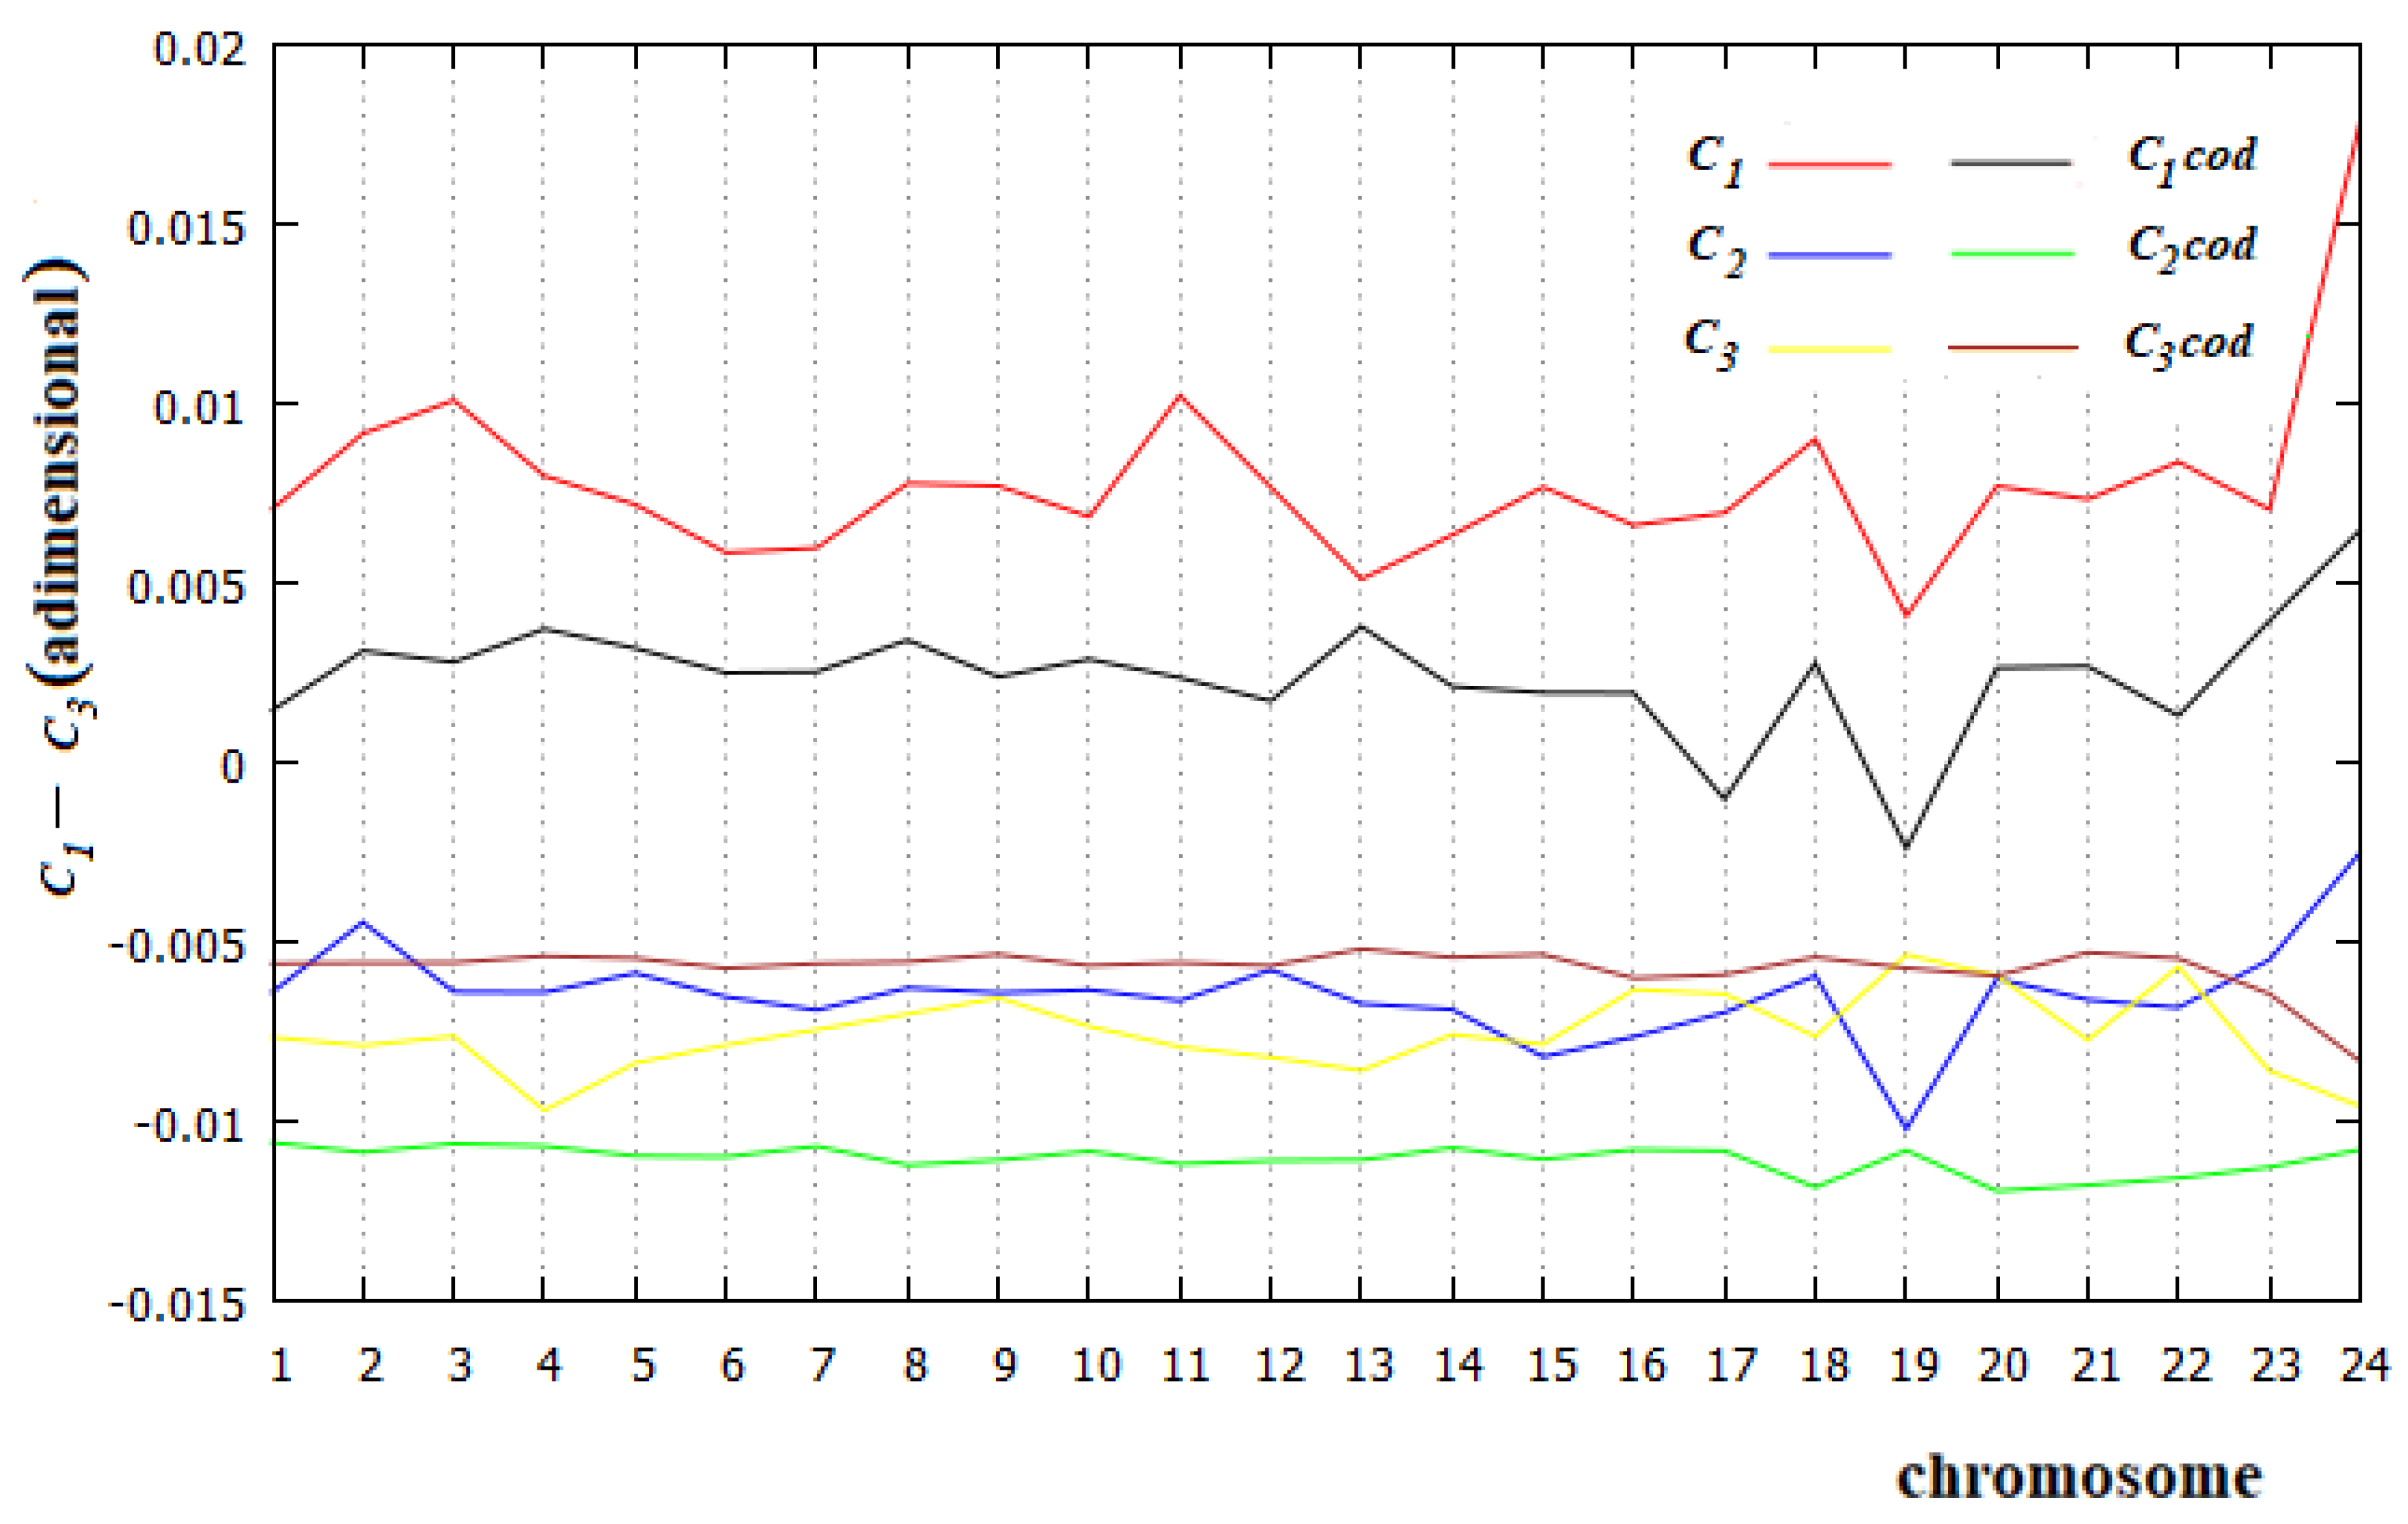
In Figure 7, we show the values of C1−C3 for all human chromosomes and the related coding parts calculated with Equation (3), but with the summations that concern only the five dimers ApT, CpA, CpG, GpC and TpG. Two results are evident from Figure 7: first, in all cases studied, the energetic part of the C1 affinity is the most relevant value; and second, the energetic part of C3 of the coding regions is larger than the corresponding part of C2 in all human chromosomes. This is evidence that the C3 relationship is an affinity, not a correlation, in the coding part of all these chromosomes.
Once again, we see that generalizing the application of rules (such as Chargaff′s second rule) to systems governed by biological or chemical processes may be misleading. Now, we are going to analyze Chargaff’s second rule and its application to human DNA.
Second Chargaff Rule (SCR)
Chargaff′s rules [55,56,57,58] assume that the same rules that are valid for double-stranded DNA can be applied to any single strand of DNA that is sufficiently long. In particular, SCR is the rule wherein the number of bases of A plus C is equal to the number of those of T plus G for both the single and the double strand. This rule has been revised [59] for the genome of many species, and it has been found to be valid for eukaryotic chromosomes and bacterial and archaeal chromosomes. However, this rule does not apply to mitochondria, plasmids, single-stranded DNA viruses and RNA viruses.
The validity of SCR is unclear, and Albrecht-Buehler [60] has suggested that this rule and its possible extension to triplet oligonucleotides might be a consequence of genomic evolution, particularly of transposon activity. In any case, the fundamental cause of the second Chargaff rule is controversial, and there is still no definitive explanation for it [61,62,63,64,65,66,67,68,69,70,71,72,73,74,75,76,77,78,79,80,81].
Some authors [79,81] have suggested that SCR would probably exist from the beginning of genome evolution and that the information revealed from modern genome structures could be helpful for the reconstruction of the primordial genome structure, as well as for understanding of the pattern of genome evolution. Assuming that the composition rules derive from primitive genomes, this could shed light on the origin of the genomes.
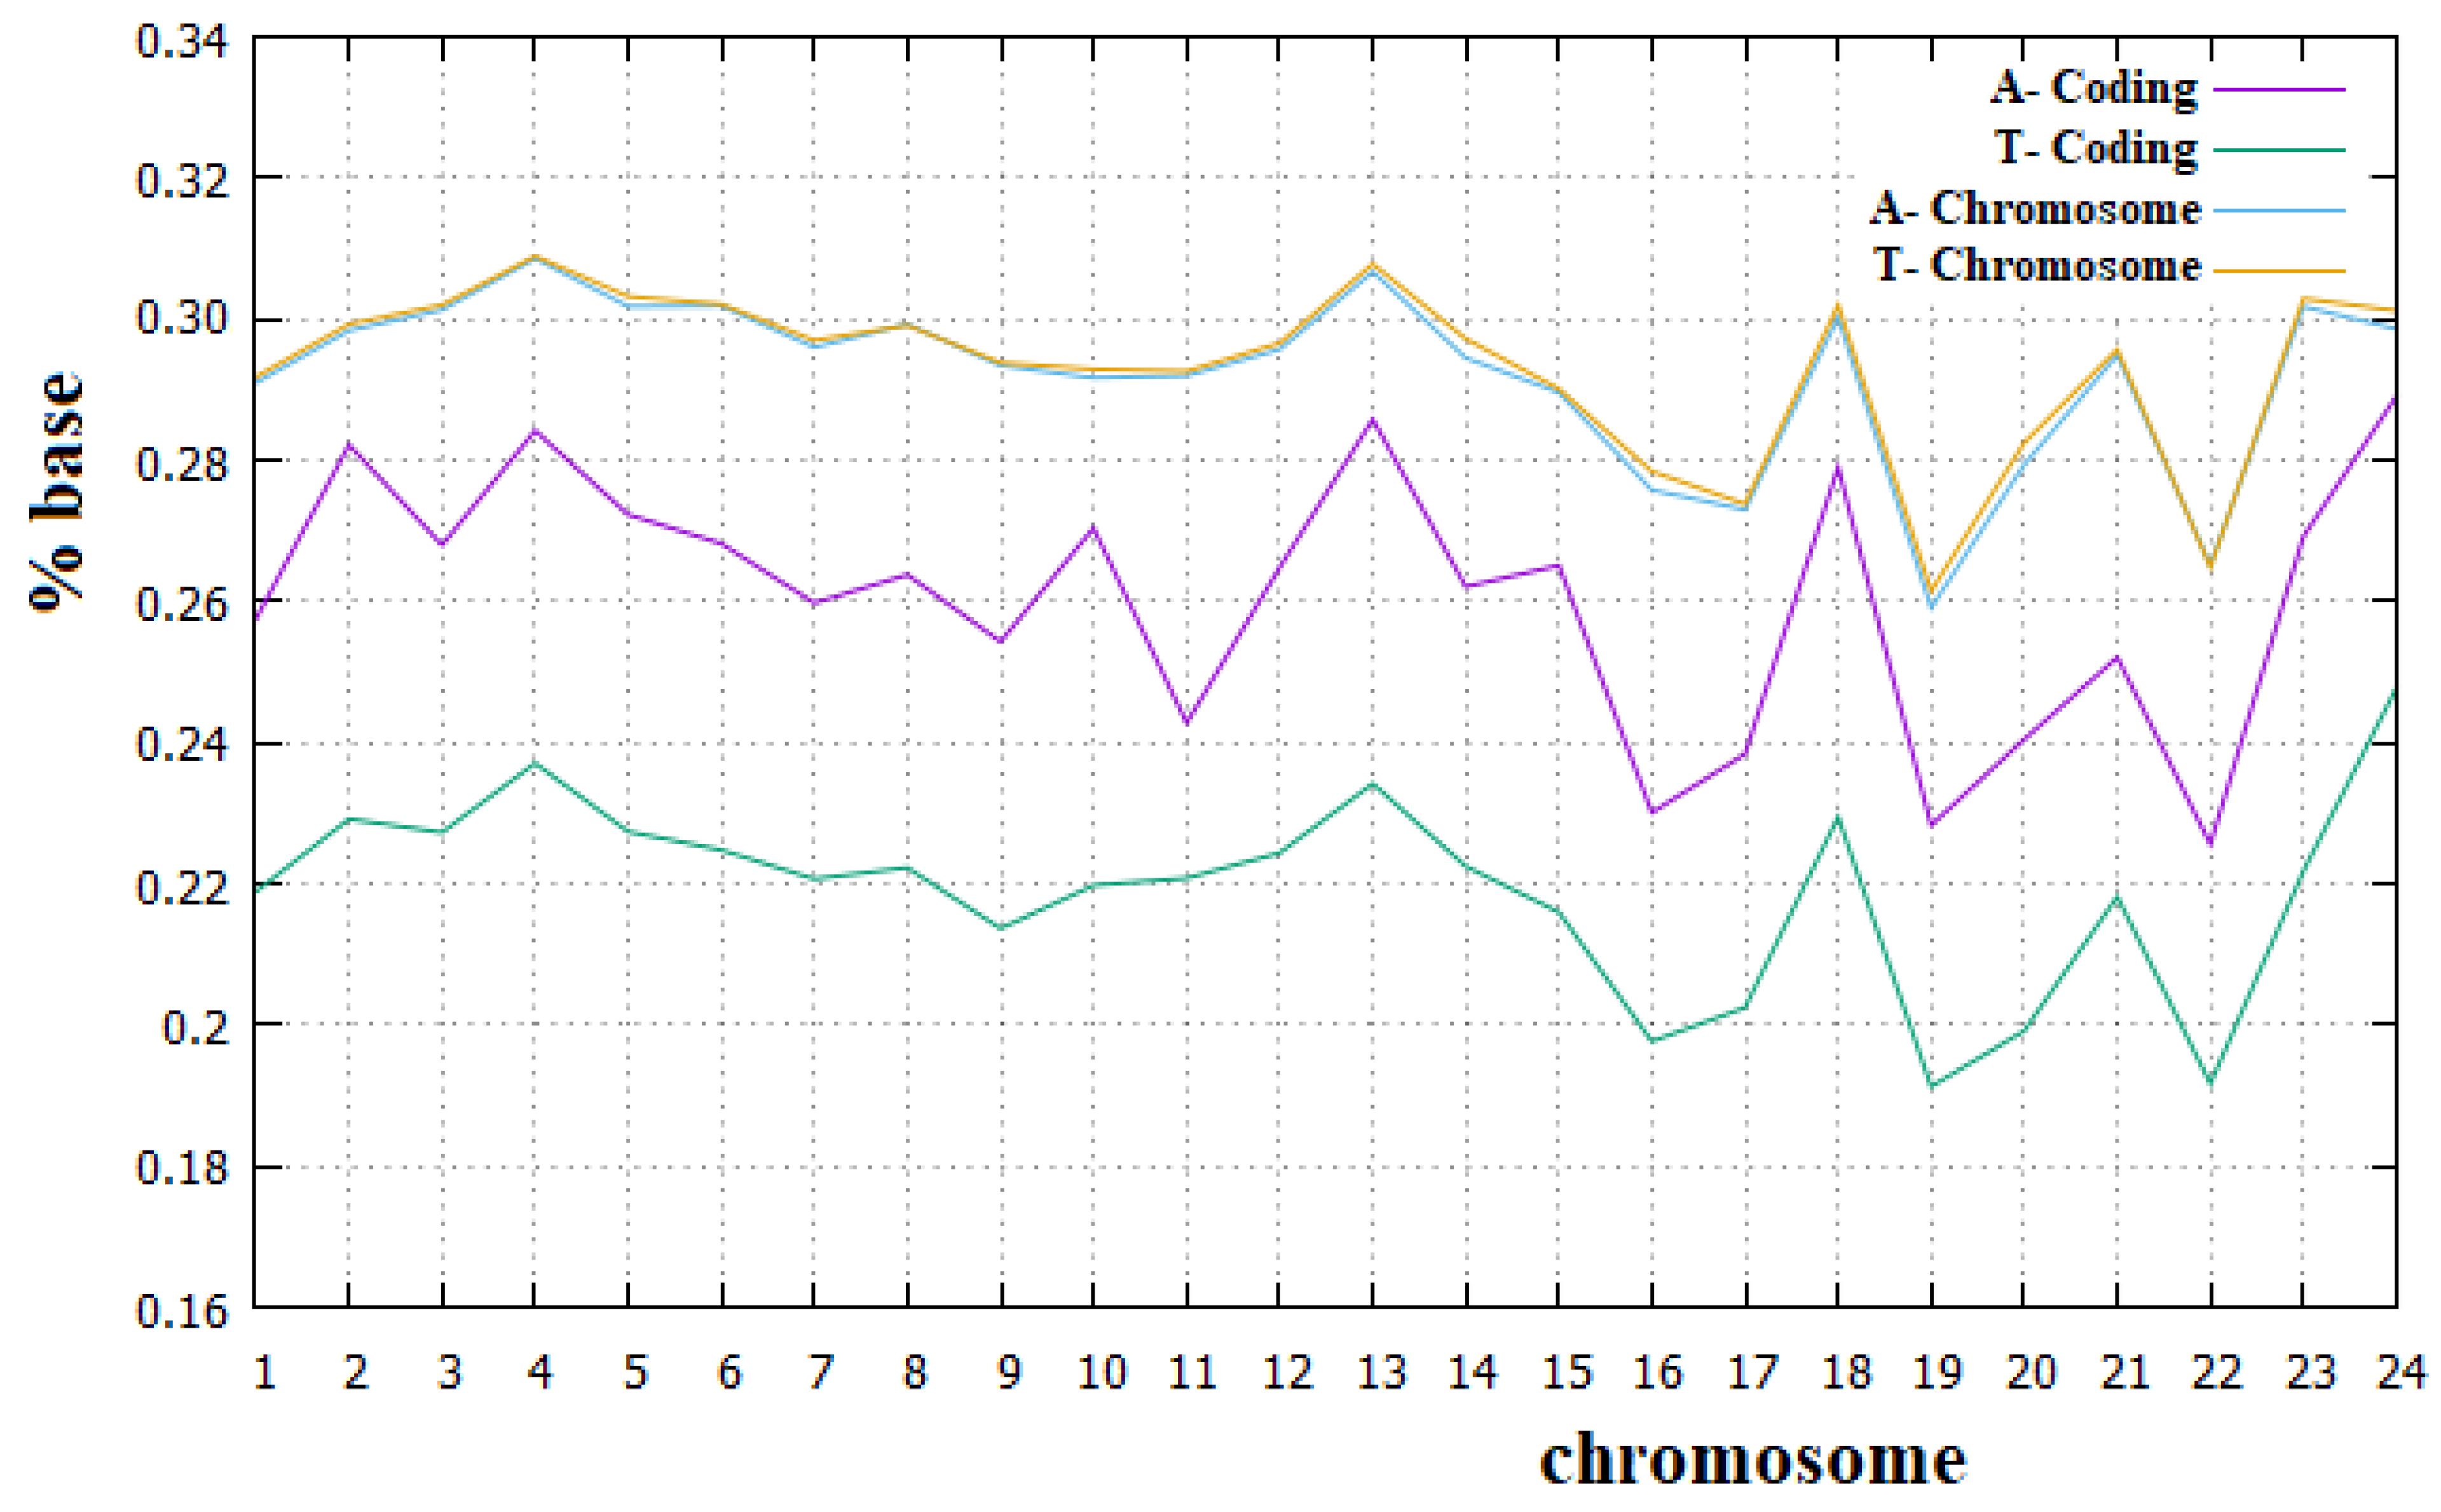
In Figure 8 and Figure 9, we have reported the percentage of the A and T bases and of C and G bases, respectively, in both human chromosomes and their coding parts.
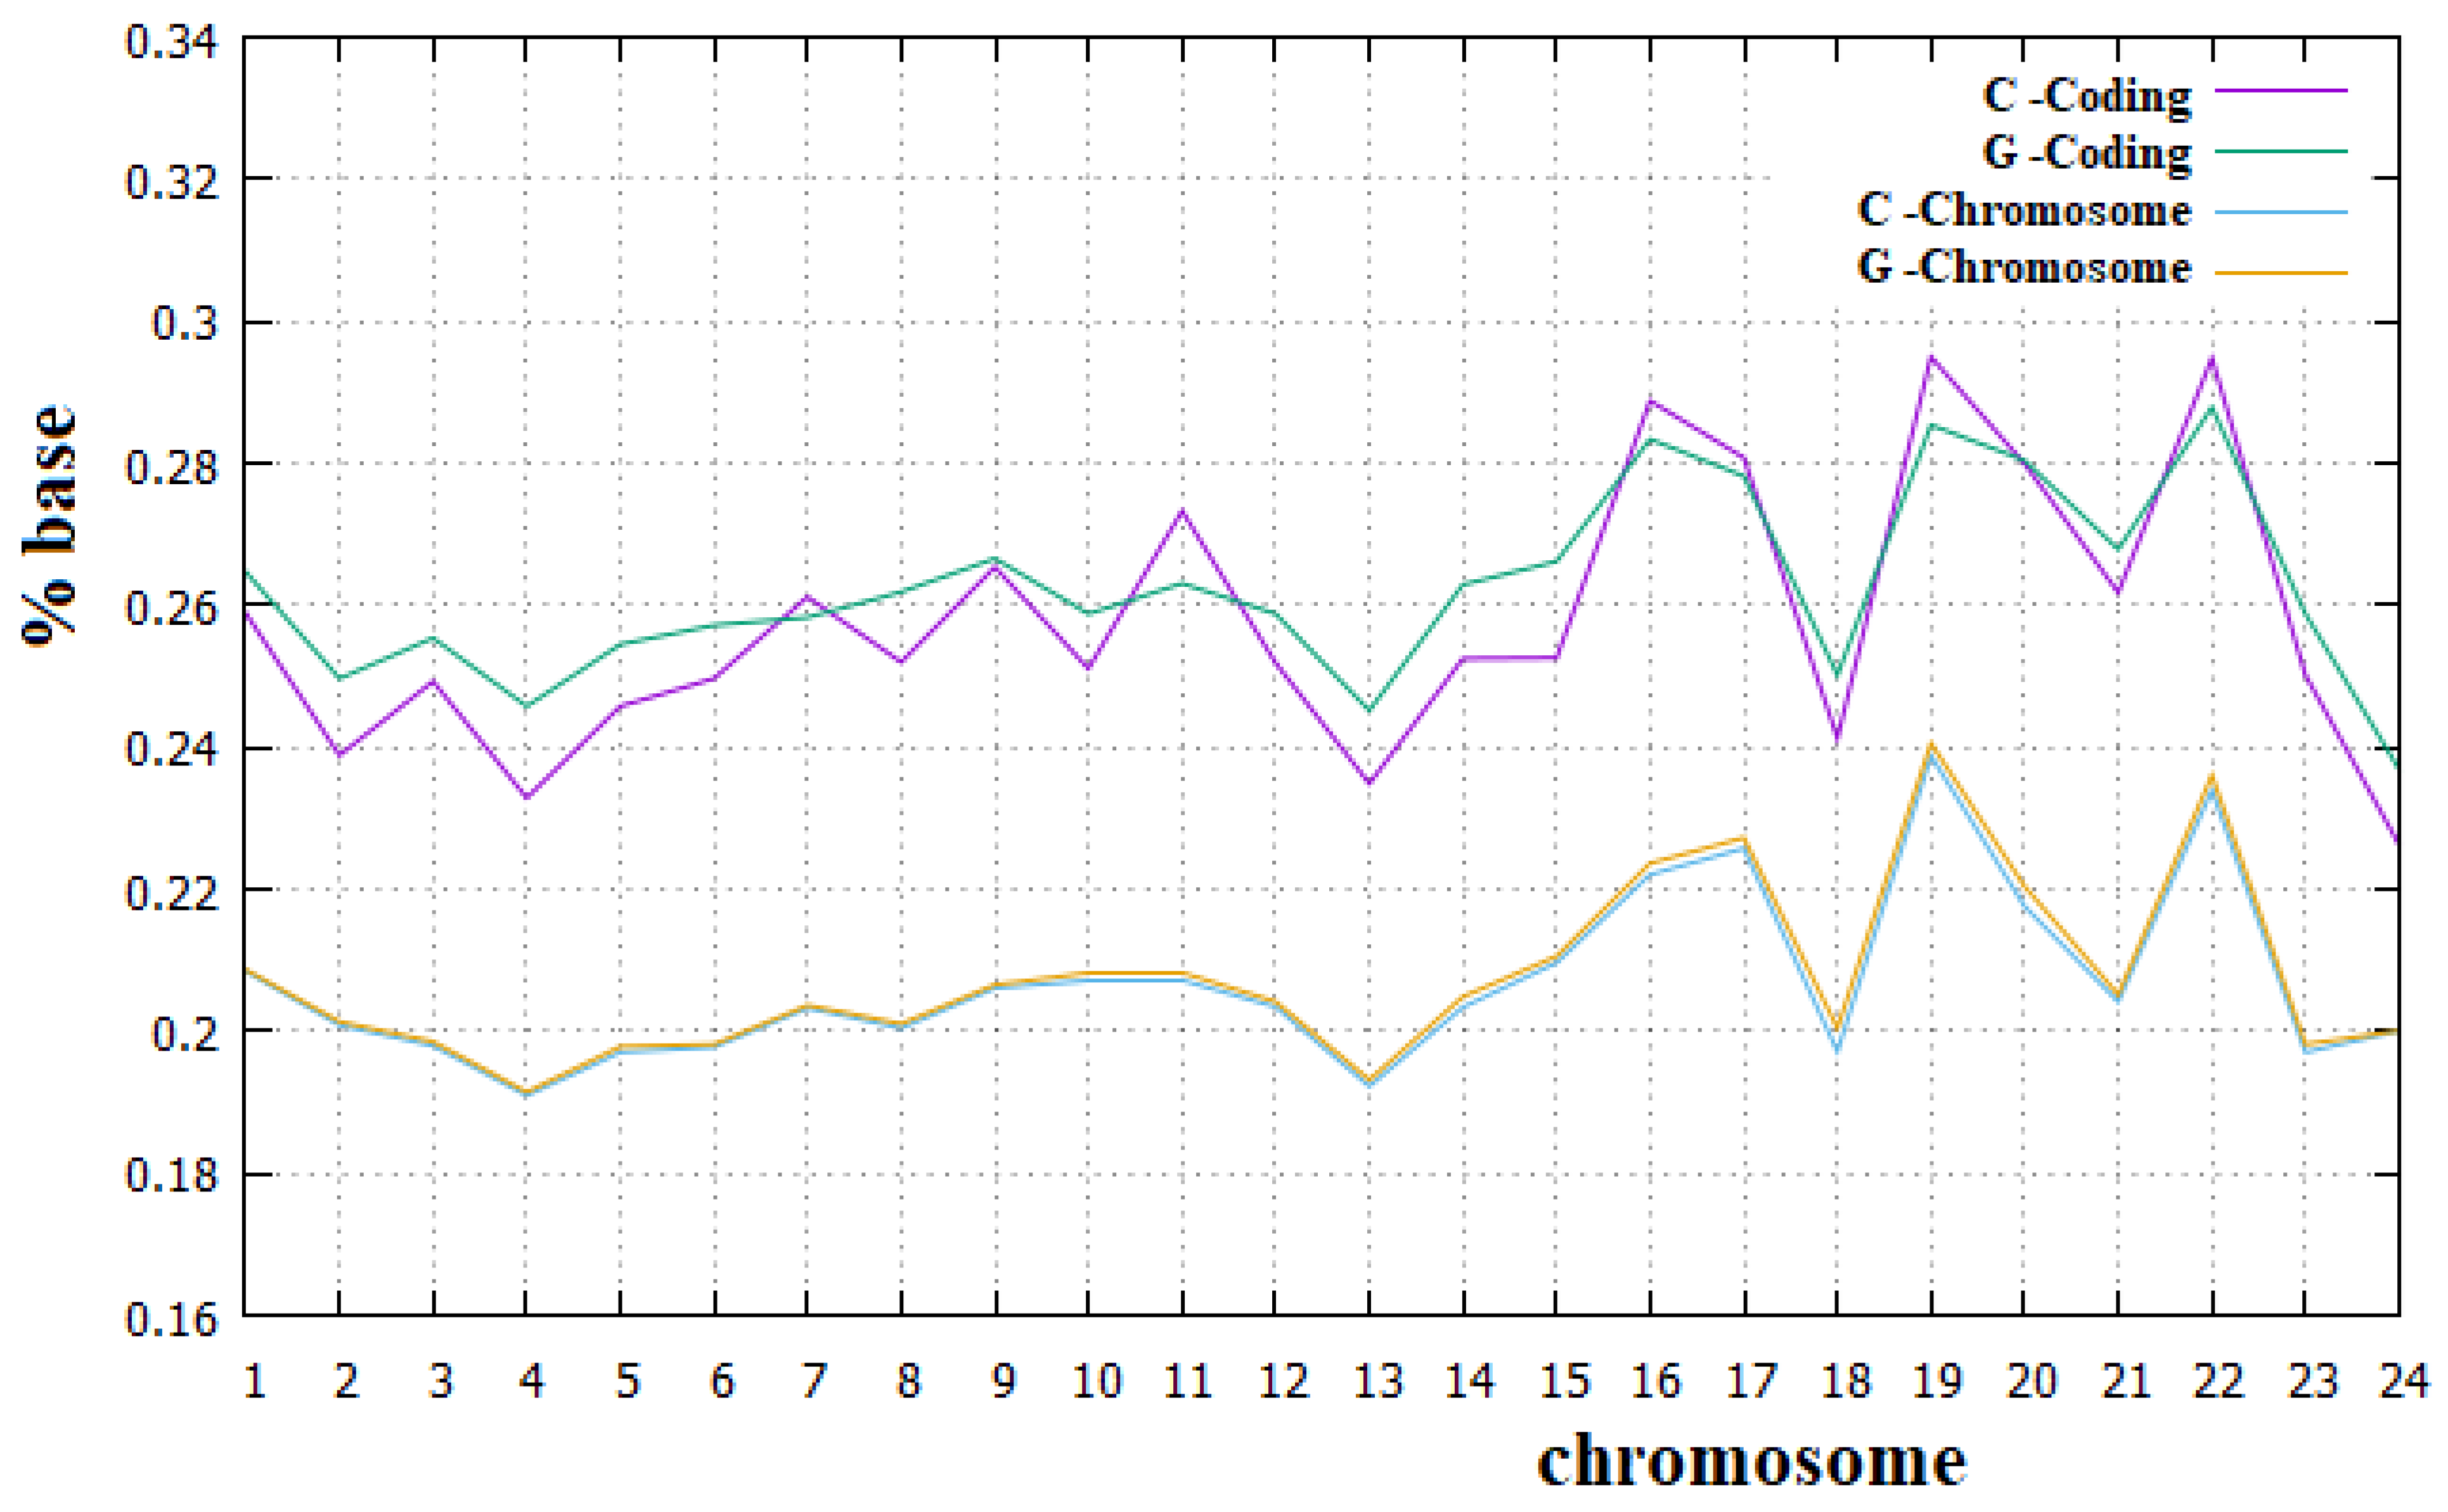
From these figures, we can see that Chargaff’s second rule applies very well to all human chromosomes. We can also note that for all human chromosomes, the percentage of C plus G bases is lower than that of A plus T bases. It is important to remember that each C and G base in a DNA strand implies a base pair between the two strands with three hydrogen bridges, while each A and T base implies only two hydrogen bridges between the two strands. Therefore, the higher percentage of A and T bases in human chromosomes implies a smaller number of hydrogen bridges stabilizing the double strand than is the case with preponderant percentages of C and G bases. Since it means a less stable DNA, this may seem surprising, but we must also consider that a more stable double strand of DNA requires a greater amount of energy in the separation phase of the two strands. The real optimal energy balance for the DNA is linked to these two opposite aspects. In Figure 8 and Figure 9, we can also see that Chargaff′s second rule does not apply to the coding parts of human chromosomes, and, in particular, that the deviation from this rule is greater for the A and T bases than for the C and G bases. Similarly, the C plus T ~50% rule also applies to the human chromosomes quite well. Both these rules have been widely used in the literature, but to our knowledge, they have never been fully verified for all human chromosomes and for their corresponding coding parts.
We believe that the incomplete applicability of Chargaff′s second rule to the coding parts of human chromosomes cannot be related to the fact that these parts of chromosomes are not sufficiently long DNA sequences. We want to recall, in fact, that these coding parts are portions of those chromosomes that can be considered long enough since they go from 89 Kbp (kilo base pairs) of the coding part of the Y chromosome to 3.4 Mbp (mega base pairs) of the coding part of chromosome 1. From these figures, it is also evident that the amount of the A base is always greater than that of the T base, with an almost constant difference of these two amounts in all human chromosomes. Finally, it is true that for all human chromosomes, the coding part is richer than the corresponding non-coding part in both the C and G bases and less rich in both the A and T bases. To our knowledge, a complete analysis of these aspects about the composition of the coding and non-coding part of human chromosomes has never been highlighted before in the literature.
4. Conclusions
In this paper, we have systematically analyzed the relationships between monomers of some human chromosomes and some rules in the composition of human DNA. Several general considerations can be obtained:
- The difference between human chromosome sequences and their coding parts is relevant both in the relationships between sites and in some specific compositional rules, such as the second Chargaff rule.
- The most important relationship between sites in all the DNA sequences examined is that between two consecutive base pairs, which indicates an energetic stabilization of these couples of base pairs due to the stacking interaction.
- The evidence of the relationship in two successive triplets of DNA-coding sequences demonstrates the existence of a relationship between two successive amino acids in proteins. This is obviously impossible if all the relationships between the sites of a macromolecule are statistical evidence and do not involve causes; in this article, due to stacking interactions and this relationship in coding sequences, we divided the concept of a relationship between sites into two concepts: affinity and correlation, the first with physical causes and the second without.
- The causal relationships, named in this paper affinity, of C1 in all chromosomes and of C3 in the related coding parts, are the most important relationships in DNA. This is in contrast to the current idea that all the relationships between sites of these macromolecules are only statistical evidence, but in perfect agreement with the results of [22,23]. These affinities may be due to different processes, but it is certainly also necessary to consider the energetic interaction between pairs of monomers, which is an interaction not considered in the literature.
- In some large sequences with several Mbp, such as those of some non-coding parts of chromosomes, there is evidence of specific, long-rage correlations that may be related to several large replicate sequences (for example, the Alu sequence).
- The second Chargaff rule is substantially valid for all human chromosomes, but not for their coding parts.
Our work brings us to a general consideration. We can state that a very uniform genome in human beings emerges from our statistical analysis, with the only well-known specificity of the Y chromosome. We believe that this uniformity in the relationships between monomers and in the compositional rules of DNA is an evident consequence of their history in terms of the theory of evolution.
Funding
This research received no external funding.
Informed Consent Statement
Informed consent was obtained from all subjects involved in the study.
Conflicts of Interest
The authors declare no conflict of interest.
Appendix A

Table A1.
The Alu sequence used in this paper is the following (in the FASTA form of GenBank).
| 1 | gccgggcgcg | gtggcgcgtg | cctgtagtcc | cagctactcg | ggaggctgag | gctggaggat |
| 61 | cgcttgagtc | caggagttct | gggctgtagt | gcgctatgcc | gatcgggtgt | ccgcactaag |
| 121 | ttcggcatca | atatggtgac | ctcccgggag | cgggggacca | ccaggttgcc | taaggagggg |
| 181 | tgaaccggcc | caggtcggaa | acggagcagg | tcaaaactcc | cgtgctgatc | agtagtggga |
| 241 | tcgcgcctgt | gaatagccac | tgcactccag | cctgggcaac | atagcgagac | cccgtctct |
References
- Ohno, S. So Much ‘Junk DNA’ in our Genome in Evolution of genetic systems. In Brookhaven Symposia in Biology; Smith, H.H., Ed.; Gordon and Breach: New York, NY, USA, 1972; Volume 23, pp. 366–370. [Google Scholar]
- Rowe, G.W.; Trainor, L.E.H. On the informational content of viral DNA. J. Theor. Biol. 1983, 101, 151–170. [Google Scholar] [CrossRef]
- Li, W.; Kaneko, K. Long-range correlation and partial 1=f spectrum in a noncoding DNA sequence. Europhys. Lett. 1992, 17, 655–660. [Google Scholar] [CrossRef] [Green Version]
- Peng, C.K.; Buldyrev, S.V.; Goldberger, A.L.; Havlin, S.; Sciortino, F.; Simons, M.; Stanley, H.E. Long-range correlations in nucleotide sequences. Nature 1992, 356, 168–170. [Google Scholar] [CrossRef] [PubMed]
- Nee, S. Uncorrelated DNA walks. Nature 1992, 357, 450. [Google Scholar] [CrossRef] [PubMed]
- Maddox, J. Long range correlations within DNA. Nature 1992, 358, 103–105. [Google Scholar] [CrossRef] [PubMed]
- Prabhu, V.V.; Claverie, J.M. Correlations in intronless DNA. Nature 1992, 359, 782–786. [Google Scholar] [CrossRef] [PubMed]
- Munson, P.J.; Taylor, R.C.; Michaels, G.S. DNA correlations. Nature 1992, 360, 636–640. [Google Scholar] [CrossRef]
- Lio, P.; Ruffo, S.; Buiatti, M. Third codon G+C periodicity as a possible signal for an internal selective constraint. J. Theor. Biol. 1992, 171, 215–223. [Google Scholar] [CrossRef]
- Buldyrev, S.V.; Goldberger, A.L.; Havlin, S.; Mantegna, R.N.; Matsa, M.E.; Peng, C.K.; Simons, M.; Stanley, H.E. Long range correlation properties of coding and noncoding DNA sequences. Phys. Rev. E 1995, 51, 5084–5091. [Google Scholar] [CrossRef]
- Arneodo, A.; Bacry, E.; Graves, P.V.; Muzy, J.F. Characterizing long-range correlations in DNA sequences from wavelet analysis. Phys. Rev. Lett. 1995, 74, 3293–3296. [Google Scholar] [CrossRef] [Green Version]
- Luo, L.F.; Tsai, L.; Zhou, Y.M. Informational parameters of nucleic acid and molecular evolution. J. Theor. Biol. 1988, 130, 351–361. [Google Scholar] [CrossRef]
- Luo, L.F.; Tsai, L. DNA walk and fractal analysis of nucleotide sequences. Acta Sci. Natur. Univ. Intramongolicae 1996, 27, 781–789. [Google Scholar]
- Voss, R.F. Evolution of long-range fractal correlations and 1/f noise in DNA base sequences. Phys. Rev. Lett. 1992, 68, 3805–3808. [Google Scholar] [CrossRef] [PubMed]
- Chechetkin, V.R.; Turygin, A.Y. The spectral criteria of disorder in nonperiodic sequences. J. Phys. A 1994, 27, 4875–4898. [Google Scholar] [CrossRef]
- Chechetkin, V.R.; Turygin, A.Y. Study of correlation in DNA sequence. J. Theor. Biol. 1996, 178, 205–217. [Google Scholar] [CrossRef]
- Luo, L.F.; Ji, F.M. The correlation spectrum of nucleotide sequences. How to extract signals from background noise? Acta Sci. Natur. Univ. Intramongolicae 1995, 26, 419–426. [Google Scholar]
- Luo, L.F.; Tsai, L. Fractal Dimension of Nucleic Acid Sequences and its Relation to Evolutionary Level. Chinese Phys. Lett. 1988, 5, 421–424. [Google Scholar]
- Gatlin, L. Information Theory and Living System; Columbia Univ. Press: New York, NY, USA, 1972. [Google Scholar]
- Luo, L.F.; Li, H. The statistical correlation of nucleotides in protein coding DNA sequences. Bull. Math. Biol. 1991, 53, 345–353. [Google Scholar] [CrossRef]
- Herzel, H.; Grosse, I. Measuring correlations in symbol sequences. Phys. A 1995, 216, 518–542. [Google Scholar] [CrossRef]
- Zhou, L.Q.; Yu, Z.G.; Deng, J.Q.; Anh, V.; Long, S.C. A fractal method to distinguish coding and non-coding sequences in a complete genome based on a number sequence representation. J. Theor. Biol. 2005, 232, 559–567. [Google Scholar] [CrossRef] [Green Version]
- Li, J.; Zhang, L.; Li, H.; Ping, Y.; Xu, Q.; Wang, R.; Tan, R.; Wang, Z.; Liu, B.; Wang, Y. Integrated entropy-based approach for analyzing exons and introns in DNA sequences. BMC Bioinform. 2019, 20, 283. [Google Scholar] [CrossRef] [PubMed] [Green Version]
- Šponer, J.; Leszczynski, J.; Hobza, P. Nature of Nucleic Acid-Base Stacking: Nonempirical Ab Initio and Empirical Potential Characterization of 10 Stacked Base Dimers. Comparison of Stacked and H-Bonded Base Pairs. J. Phys. Chem. 1996, 100, 5590–5596. [Google Scholar] [CrossRef]
- Hobza, P.; Šponer, J.; Polasek, M. H-Bonded and Stacked DNA-Base Pairs—Cytosine Dimer—An Ab-Initio 2nd-Order Møller-Plesset Study. J. Am. Chem. Soc. 1995, 117, 792–798. [Google Scholar] [CrossRef]
- Šponer, J.; Gabb, H.A.; Leszczynski, J.; Hobza, P. Base-Base and Deoxyribose-Base Stacking Interactions in B-DNA and Z-DNA: A Quantum-Chemical Study. Biophys. J. 1997, 73, 76–87. [Google Scholar] [CrossRef] [Green Version]
- Hobza, P.; Šponer, J. Structure, Energetics, and Dynamics of the Nucleic Acid Base Pairs: Nonempirical Ab Initio Calculations. Chem. Rev. 1999, 99, 3247–3276. [Google Scholar] [CrossRef]
- Parker, T.M.; Sherrill, C.D. Assessment of Empirical Models versus High-Accuracy Ab Initio Methods for Nucleobase Stacking: Evaluating the Importance of Charge Penetration. J. Chem. Theory Comput. 2015, 11, 4197–4204. [Google Scholar] [CrossRef]
- Poater, J.; Swart, M.; Bickelhaupt, F.M.; Fonseca Guerra, C. BDNA Structure and Stability: The Role of Hydrogen Bonding, π-π Stacking Interactions, Twist-Angle, and Solvation. Org. Biomol. Chem. 2014, 12, 4691–4700. [Google Scholar] [CrossRef] [Green Version]
- Hamlin, T.A.; Fonseca Guerra, J.; Bickelhaupt, F.M. B-DNA Model Systems in Non-Terran Bio-Solvents: Implications for Structure, Stability and Replication. Phys. Chem. Chem. Phys. 2017, 19, 16969–16978. [Google Scholar] [CrossRef] [Green Version]
- Řezáč, J.; Huang, Y.; Hobza, P.; Beran, G.J.O. Benchmark Calculations of Three-Body Intermolecular Interactions and the Performance of Low-Cost Electronic Structure Methods. J. Chem. Theory Comput. 2015, 11, 3065–3079. [Google Scholar] [CrossRef]
- Mahadevi, A.S.; Sastry, G.N. Cooperativity in Noncovalent Interactions. Chem. Rev. 2016, 116, 2775–2825. [Google Scholar] [CrossRef]
- Parker, T.M.; Hohenstein, E.G.; Parrish, R.M.; Hud, N.V.; Sherrill, C.D. Quantum-Mechanical Analysis of the Energetic Contributions to π Stacking in Nucleic Acids versus Rise, Twist, and Slide. J. Am. Chem. Soc. 2013, 135, 1306–1316. [Google Scholar] [CrossRef] [PubMed]
- Villani, G. Theoretical Investigation of the Coupling between Hydrogen-Atom Transfer and Stacking Interaction in Adenine–Thymine Dimers. Chem. Phys. Chem. 2013, 14, 1256–1263. [Google Scholar] [CrossRef] [PubMed]
- Villani, G. Theoretical investigation of the coupling between hydrogen atoms transfer and stacking interaction in guanine–cytosine dimers. Phys.Chem. Chem. Phys. 2013, 15, 19242–19252. [Google Scholar] [CrossRef] [PubMed]
- Villani, G. Coupling Between Hydrogen Atoms Transfer and Stacking Interaction in Adenine-Thymine/Guanine-Cytosine Complexes: A Theoretical Study. J. Phys. Chem. B 2014, 118, 5439–5452. [Google Scholar] [CrossRef] [PubMed]
- Kruse, H.; Banás, P.; Šponer, J. Investigations of Stacked DNA Base-Pair Steps: Highly Accurate Stacking Interaction Energies, Energy Decomposition, and Many-Body Stacking Effects. J. Chem. Theory Comput. 2019, 15, 95–115. [Google Scholar] [CrossRef] [PubMed]
- Kullback, S.; Leibler, R.A. On Information and Sufficiency. Ann. Math. Stat. 1951, 22, 79–86. [Google Scholar] [CrossRef]
- Chang, C.H.; Hsieh, L.C.; Chen, T.Y.; Chen, H.D.; Luo, L.; Lee, H.C. Shannon information in complete genomes. J. Bioinform. Comput. Biol. 2005, 3, 587–608. [Google Scholar] [CrossRef]
- Bouaynaya, N.; Schonfeld, D. Nonstationary Analysis of Coding and Noncoding Regions in Nucleotide Sequences. IEEE J. Sel. Top. Signal Processing 2008, 2, 357–364. [Google Scholar] [CrossRef] [Green Version]
- Tsallis, C. Possible generalization of Boltzmann-Gibbs statistics. J. Stat. Phys. 1988, 52, 479–487. [Google Scholar] [CrossRef]
- Guerra, J.C.O.; Licinio, P.; Andrade, P.C.P. Comparison of period-3 correlation amplitudes in genomic DNA sequences. Genet. Mol. Res. 2013, 12, 4459–4467. [Google Scholar] [CrossRef]
- Batzer, M.A.; Deininger, P.L. Alu repeats and human genomic diversity. Nat. Rev. Genet. 2002, 3, 370–379. [Google Scholar] [CrossRef] [PubMed]
- Deininger, P. Alu elements: Know the SINEs. Genome Biol. 2011, 12, 236. [Google Scholar] [CrossRef] [PubMed] [Green Version]
- Perez, J.C. Codon Populations in Single-stranded Whole Human Genome DNA. Are Fractal and Fine-tuned by the Golden Ratio 1.618. Interdiscip. Sci. Comput. Life Sci. 2010, 2, 228–240. [Google Scholar] [CrossRef] [PubMed]
- Sobottka, M.; Hart, A.G. A model capturing novel strand symmetries in bacterial DNA. Biochem. Biophys. Res. Commun. 2011, 410, 823–828. [Google Scholar] [CrossRef] [PubMed] [Green Version]
- Zhang, S.-H.; Huang, Y.-Z. Limited contribution of stem-loop potential to symmetry of single-stranded genomic DNA. Bioinformatics 2010, 26, 478–485. [Google Scholar] [CrossRef] [PubMed]
- Zhou, Y.; Mishra, B. Models of Genome Evolution. In Modeling in Molecular Biology; Ciobanu, G., Rozenberg, G., Eds.; Springer: Berlin, Germany, 2004; pp. 287–304. [Google Scholar]
- Zielezinski, A.; Vinga, S.; Almeida, J.; Karlowski, W.M. Alignment-free sequence comparison: Benefits, Applications, and Tools. Genome Biol. 2017, 18, 186. [Google Scholar] [CrossRef] [Green Version]
- Eddy, S.R. Where did the BLOSUM62 alignment score matrix come from? Nat. Biotechnol. 2004, 22, 1035–1036. [Google Scholar] [CrossRef]
- Gardner, P.P.; Wilm, A.; Washietl, S. A benchmark of multiple sequence alignment programs upon structural RNAs. Nucleic Acids Res. 2005, 33, 2433–2439. [Google Scholar] [CrossRef] [Green Version]
- Capriotti, E.; Marti-Renom, M.A. Quantifying the relationship between sequence and three-dimensional structure conservation in RNA. BMC Bioinform. 2010, 11, 322. [Google Scholar] [CrossRef] [Green Version]
- Earl, D.; Nguyen, N.; Hickey, G.; Harris, R.S.; Fitzgerald, S.; Beal, K.; Seledtsov, I.; Molodtsov, V.; Raney, B.J.; Clawson, H.; et al. Alignathon: A Competitive Assessment of Whole-Genome Alignment Methods. Genome Res. 2014, 24, 2077–2089. [Google Scholar] [CrossRef] [Green Version]
- Li, W.; Marr, T.G.; Kaneko, K. Understanding long-range correlations in DNA sequences. Phys. D 1994, 75, 392–416. [Google Scholar] [CrossRef]
- Chargaff, E. Structure and function of nucleic acids as cell constituents. Fed. Proc. 1951, 10, 654–659. [Google Scholar] [PubMed]
- Chargaff, E.; Lipshitz, R.; Green, C. Composition of the deoxypentose nucleic acids of four genera of seaurchin. J. Biol. Chem. 1952, 195, 155–160. [Google Scholar] [CrossRef]
- Rudner, R.; Karkas, J.D.; Chargaff, E. Separation of B. subtilis DNA into complementary strands, III. Proc. Natl. Acad. Sci. USA 1968, 60, 921–922. [Google Scholar] [CrossRef] [PubMed] [Green Version]
- Chargaff, E. Preface to a Grammar of Biology: A Hundred Years of Nucleic Acid Research. Science 1971, 172, 637–642. [Google Scholar] [CrossRef]
- Mitchell, D.; Bridge, R. A test of Chargaff’s second rule. Biochem. Biophys. Res. Commun. 2006, 340, 90–94. [Google Scholar] [CrossRef]
- Albrecht-Buehler, G. Asymptotically increasing compliance of genomes with Chargaff’s second parity rules through inversions and inverted transpositions. Proc. Natl. Acad. Sci. USA 2006, 103, 17828–17833. [Google Scholar] [CrossRef] [Green Version]
- Albrecht-Buehler, G. Inversions and inverted transpositions as the basis for an almost universal “format” of genome sequences. Genomics 2007, 90, 297–305. [Google Scholar] [CrossRef]
- Baisnee, P.F.; Hampson, S.; Baldi, P. Why are complementary DNA strands symmetric? Bioinformatics 2002, 18, 1021–1033. [Google Scholar] [CrossRef] [Green Version]
- Bell, S.J.; Forsdyke, D.R. Deviations from Chargaff’s second parity rule correlate with direction of transcription. J. Theor. Biol. 1999, 197, 63–76. [Google Scholar] [CrossRef]
- Chen, L.; Zhao, H. Negative correlation between compositional symmetries and local recombination rates. Bioinformatics 2005, 21, 3951–3958. [Google Scholar] [CrossRef] [PubMed] [Green Version]
- Fickett, J.W.; Torney, D.C.; Wolf, D.R. Base compositional structure of genomes. Genomics 1992, 13, 1056–1064. [Google Scholar] [CrossRef]
- Forsdyke, D.R. Relative roles of primary sequence and (G+C)% in determining the hierarchy of frequencies of complementary trinucleotide pairs in DNAs of different species. J. Mol. Evol. 1995, 41, 573–581. [Google Scholar] [CrossRef] [PubMed]
- Forsdyke, D.R.; Bell, S.J. Purine loading, stemloops and Chargaff’s second parity rule. Appl. Bioinform. 2004, 3, 3–8. [Google Scholar] [CrossRef]
- Hart, A.; Martínez, S. Statistical testing of Chargaff’s second parity rule in bacterial genome sequences. Stoch. Models 2011, 27, 272–317. [Google Scholar] [CrossRef]
- Hart, A.; Martínez, S.; Olmos, F. A Gibbs approach to Chargaff’s second parity rule. J. Stat. Phys. 2012, 146, 408–422. [Google Scholar] [CrossRef]
- Kong, S.G.; Fan, W.L.; Chen, H.D.; Hsu, Z.T.; Zhou, N.; Zheng, B.; Lee, H.C. Inverse symmetry in complete genomes and whole-genome inverse duplication. PLoS ONE 2009, 4, e7553. [Google Scholar] [CrossRef]
- Lobry, J.R.; Lobry, C. Evolution of DNA base composition under no-strand-bias conditions when the substitution rates are not constant. Mol. Bio. Evol. 1999, 16, 719–723. [Google Scholar] [CrossRef] [Green Version]
- Lobry, J.R.; Sueoka, N. Asymmetric directional mutation pressures in bacteria. Genome Biol. 2002, 3, research0058.1. [Google Scholar] [CrossRef] [Green Version]
- Mascher, M.; Schubert, I.; Scholz, U.; Friedel, S. Patterns of nucleotide asymmetries in plant and animal genomes. Biosystems 2013, 111, 181–189. [Google Scholar] [CrossRef]
- Okamura, K.; Wei, J.; Scherer, S.W. Evolutionary implications of inversions that have caused intra-strand parity in DNA. BMC Genom. 2007, 8, 160–166. [Google Scholar] [CrossRef] [PubMed] [Green Version]
- Powdel, B.R.; Satapathy, S.S.; Kumar, A.; Jha, P.K.; Buragohain, A.K.; Borah, M.; Ray, S.K. A study in entire chromosomes of violations of the intra-strand parity of complementary nucleotides (Chargaff’s second parity rule). DNA Res. 2009, 16, 325–343. [Google Scholar] [CrossRef] [PubMed] [Green Version]
- Rapoport, A.E.; Trifonov, E.N. Compensatory nature of Chargaff’s second parity rule. J. Biomol. Struct. Dyn. 2013, 31, 1324–1336. [Google Scholar] [CrossRef] [PubMed]
- Sueoka, N. Intrastrand parity rules of DNA base composition and usage biases of synonymous codons. J. Mol. Evol. 1995, 40, 318–325. [Google Scholar] [CrossRef]
- Wang, S.; Tu, J.; Jia, Z.; Lu, Z. High order intrastrand partial symmetry increases with organismal complexity in animal evolution. Sci. Rep. 2014, 4, 6400. [Google Scholar] [CrossRef] [Green Version]
- Zhang, S.H.; Huang, Y.Z. Characteristics of oligonucleotide frequencies across genomes: Conservation versus variation, strand symmetry, and evolutionary implications. Nat. Preced. 2008. [Google Scholar] [CrossRef]
- Zhang, H.; Li, P.; Zhong, H.S.; Zhang, S.H. Conservation vs. variation of dinucleotide frequencies across bacterial and archaeal genomes: Evolutionary Implications. Front. Microbiol. 2013, 4, 269–276. [Google Scholar] [CrossRef] [Green Version]
- Rosandić, M.; Vlahović, I.; Glunčić, M.; Paar, V. Trinucleotide’s quadruplet symmetries and natural symmetry law of DNA creation ensuing Chargaff’s second parity rule. J. Biomol. Struct. Dyn. 2016, 34, 1383–1394. [Google Scholar] [CrossRef]
Figure 1.
Dimer of CpT: (a) highlighting the CH3 and NH2 groups which will be replaced by hydrogen atoms in (b).
Figure 1.
Dimer of CpT: (a) highlighting the CH3 and NH2 groups which will be replaced by hydrogen atoms in (b).

Figure 2.
Affinities/Correlations in the human Chr1 (indicated as C1 and by a purple curve) and in its coding parts (C1cod/green curve).
Figure 2.
Affinities/Correlations in the human Chr1 (indicated as C1 and by a purple curve) and in its coding parts (C1cod/green curve).

Figure 3.
Affinities/Correlations in the human ChrX (indicated as CX and by a purple curve) and in its coding parts (CXcod/green curve).
Figure 3.
Affinities/Correlations in the human ChrX (indicated as CX and by a purple curve) and in its coding parts (CXcod/green curve).

Figure 4.
Affinities/Correlations in the human ChrY (indicated as CY and by a purple curve) and in its coding parts (CYcod/green curve).
Figure 4.
Affinities/Correlations in the human ChrY (indicated as CY and by a purple curve) and in its coding parts (CYcod/green curve).

Figure 5.
As in Figure 2, affinities/correlations in the human Chr1 (indicated as C1 and by a purple curve) and in its coding parts (C1cod/green curve), but with the affinities/correlations computed with the Tsallis method.
Figure 5.
As in Figure 2, affinities/correlations in the human Chr1 (indicated as C1 and by a purple curve) and in its coding parts (C1cod/green curve), but with the affinities/correlations computed with the Tsallis method.

Figure 6.
Affinities/Correlations in the Alu sequence (green curve) and in a reference sequence (purple curve).
Figure 6.
Affinities/Correlations in the Alu sequence (green curve) and in a reference sequence (purple curve).

Figure 7.
Energetic part of C1, C2 and C3 in each human chromosome and in the corresponding coding part.
Figure 7.
Energetic part of C1, C2 and C3 in each human chromosome and in the corresponding coding part.

Figure 8.
Percentage of the A and T bases in human chromosomes and in the corresponding coding parts.
Figure 8.
Percentage of the A and T bases in human chromosomes and in the corresponding coding parts.

Figure 9.
Percentage of the C and G bases in human chromosomes and in the corresponding coding parts.
Figure 9.
Percentage of the C and G bases in human chromosomes and in the corresponding coding parts.

Table 1.
Relative C1 affinity of the A, C, G and T bases in the human Chr1.
| A | C | G | T | |
|---|---|---|---|---|
| A | 0.0223 | −0.0406 | 0.0377 | −0.0194 |
| C | 0.0503 | 0.0406 | −0.1415 | 0.0506 |
| G | 0.0320 | 0.0031 | 0.0050 | −0.0401 |
| T | −0.1162 | 0.0049 | 0.0960 | 0.0153 |
Table 2.
Energetic part of the C1 affinity of the A, C, G and T bases in the human Chr1.
| A | T | C | G | |
|---|---|---|---|---|
| A | 0.3005 | 0.2621 | 0.2120 | 0.2254 |
| T | 0.2841 | 0.2764 | 0.1929 | 0.2466 |
| C | 0.2200 | 0.1850 | 0.2548 | 0.3402 |
| G | 0.1915 | 0.1936 | 0.3314 | 0.2835 |
Table 3.
C1 affinity of the A, C, G and T bases in the human Chr1.
| A | T | C | G | |
|---|---|---|---|---|
| A | 0.3265 | 0.2553 | 0.1729 | 0.2452 |
| T | 0.2164 | 0.3279 | 0.2059 | 0.2498 |
| C | 0.3489 | 0.3422 | 0.2594 | 0.0494 |
| G | 0.2878 | 0.2417 | 0.2109 | 0.2596 |
Table 4.
C1 affinity of the A, C, G and T bases in the coding part of the human Chr1.
| A | T | C | G | |
|---|---|---|---|---|
| A | 0.3045 | 0.2098 | 0.1983 | 0.2874 |
| T | 0.1661 | 0.2445 | 0.2438 | 0.3456 |
| C | 0.3325 | 0.2798 | 0.2795 | 0.1082 |
| G | 0.3142 | 0.1891 | 0.2420 | 0.2547 |
Publisher’s Note: MDPI stays neutral with regard to jurisdictional claims in published maps and institutional affiliations. |
© 2022 by the author. Licensee MDPI, Basel, Switzerland. This article is an open access article distributed under the terms and conditions of the Creative Commons Attribution (CC BY) license (https://creativecommons.org/licenses/by/4.0/).
Share and Cite
MDPI and ACS Style
Villani, G. Affinity and Correlation in DNA. J 2022, 5, 214-231. https://0-doi-org.brum.beds.ac.uk/10.3390/j5020016
AMA Style
Villani G. Affinity and Correlation in DNA. J. 2022; 5(2):214-231. https://0-doi-org.brum.beds.ac.uk/10.3390/j5020016
Chicago/Turabian StyleVillani, Giovanni. 2022. "Affinity and Correlation in DNA" J 5, no. 2: 214-231. https://0-doi-org.brum.beds.ac.uk/10.3390/j5020016