Article

The Use of Radioactive Tracers to Detect and Correct Feed Flowrate Imbalances in Parallel Flotation Banks

1
Minera Los Pelambres, Antofagasta Minerals, Salamanca 1950410, Chile
2
Department of Chemical and Environmental Engineering, Universidad Técnica Federico Santa María, Valparaíso 2390123, Chile
3
Automation and Supervision Centre for Mining Industry, CASIM, Universidad Técnica Federico Santa María, Valparaíso 2390123, Chile
4
Trazado Nuclear e Ingeniería, Santiago 7760016, Chile
*
Author to whom correspondence should be addressed.
Submission received: 22 March 2022 / Revised: 13 May 2022 / Accepted: 10 June 2022 / Published: 12 June 2022
(This article belongs to the Special Issue Applicable and Industrial Developments in Froth Flotation)

Abstract

:
This work presents the application of radioactive tracers to detect and correct feed flowrate imbalances in parallel rougher flotation banks. Several surveys were conducted at Minera Los Pelambres concentrator, in banks consisting of 250 m3 mechanical flotation cells. The feed pulp distribution was estimated from the mean residence times, which were obtained from residence time distribution measurements. The tracer was injected in the feed distributor and the inlet and outlet tracer signals of cells 1 and 2 were measured by on-stream sensors. The baseline condition for the pulp distribution was defined by the valve settings in the feed distributor, which led to an unbalanced condition for two parallel rougher banks, with 34% of the pulp being fed to bank A and 66% to bank B. New valve configurations were evaluated, with a fraction of the feed being directed to the rougher bank C, which was not initially fed from the same distributor. The feed distribution was finally balanced with 49% of the pulp being fed to bank A versus 51% to bank B. Thus, the radioactive traces proved to be a powerful tool to industrially detect and improve feed distributions in parallel flotation circuits.

1. Introduction

Radioactive tracers have extensively been used in flotation to characterize processes [1,2,3,4], determine the path of the different phases (solid, liquid, gas) throughout the machines and circuits [5,6,7,8], and estimate residence times and residence time distributions (RTD) in machines and machine arrangements [9,10,11,12]. The latter two are strongly dependent on equipment design and circuit configuration, which have been subject to significant changes due to the continuous increase in capacity in the mining industry. This capacity increase has been addressed by the installation of larger flotation machines and the use of parallel flotation banks [13,14,15,16]. The flowrate distribution in parallel banks is not reliably measured in real time at large scale and imbalances have been observed in industrial operations due to unknown configurations in the feed distributors [8,17]. Under unbalanced feed distributions, differences in mineral recoveries are expected as banks with shorter residence times are more sensitive to the slow-floating minerals.
Unknown feed distributions in flotation circuits challenge the evaluation and interpretation of metallurgical performances, particularly under differences in the mineral recoveries between parallel banks. Independent of the actual feed configuration, even distributions are assumed, which may bias metallurgical and kinetic characterizations in circuits under unbalanced distributions. Unbalanced distributions also hinder the circuit operation to keep or continuously improve performance indicators.
This paper presents the use of radioactive tracers to detect and improve feed flowrate imbalances in one of the flotation circuits of Minera Los Pelambres, Chile. RTD measurements were conducted in one rougher circuit consisting of two parallel banks (A and B), from which an uneven pulp distribution was observed. This imbalance was attributed to the valve configuration from the feed distributor, which was initially set to only feed the rougher banks A and B. This distributor optionally allowed a fraction of the pulp to be fed to a rougher bank C by means of a change in the valve configuration. From a sequence of RTD measurements under different valve settings, the potential to correct the pulp distribution was evaluated.

2. Materials and Methods

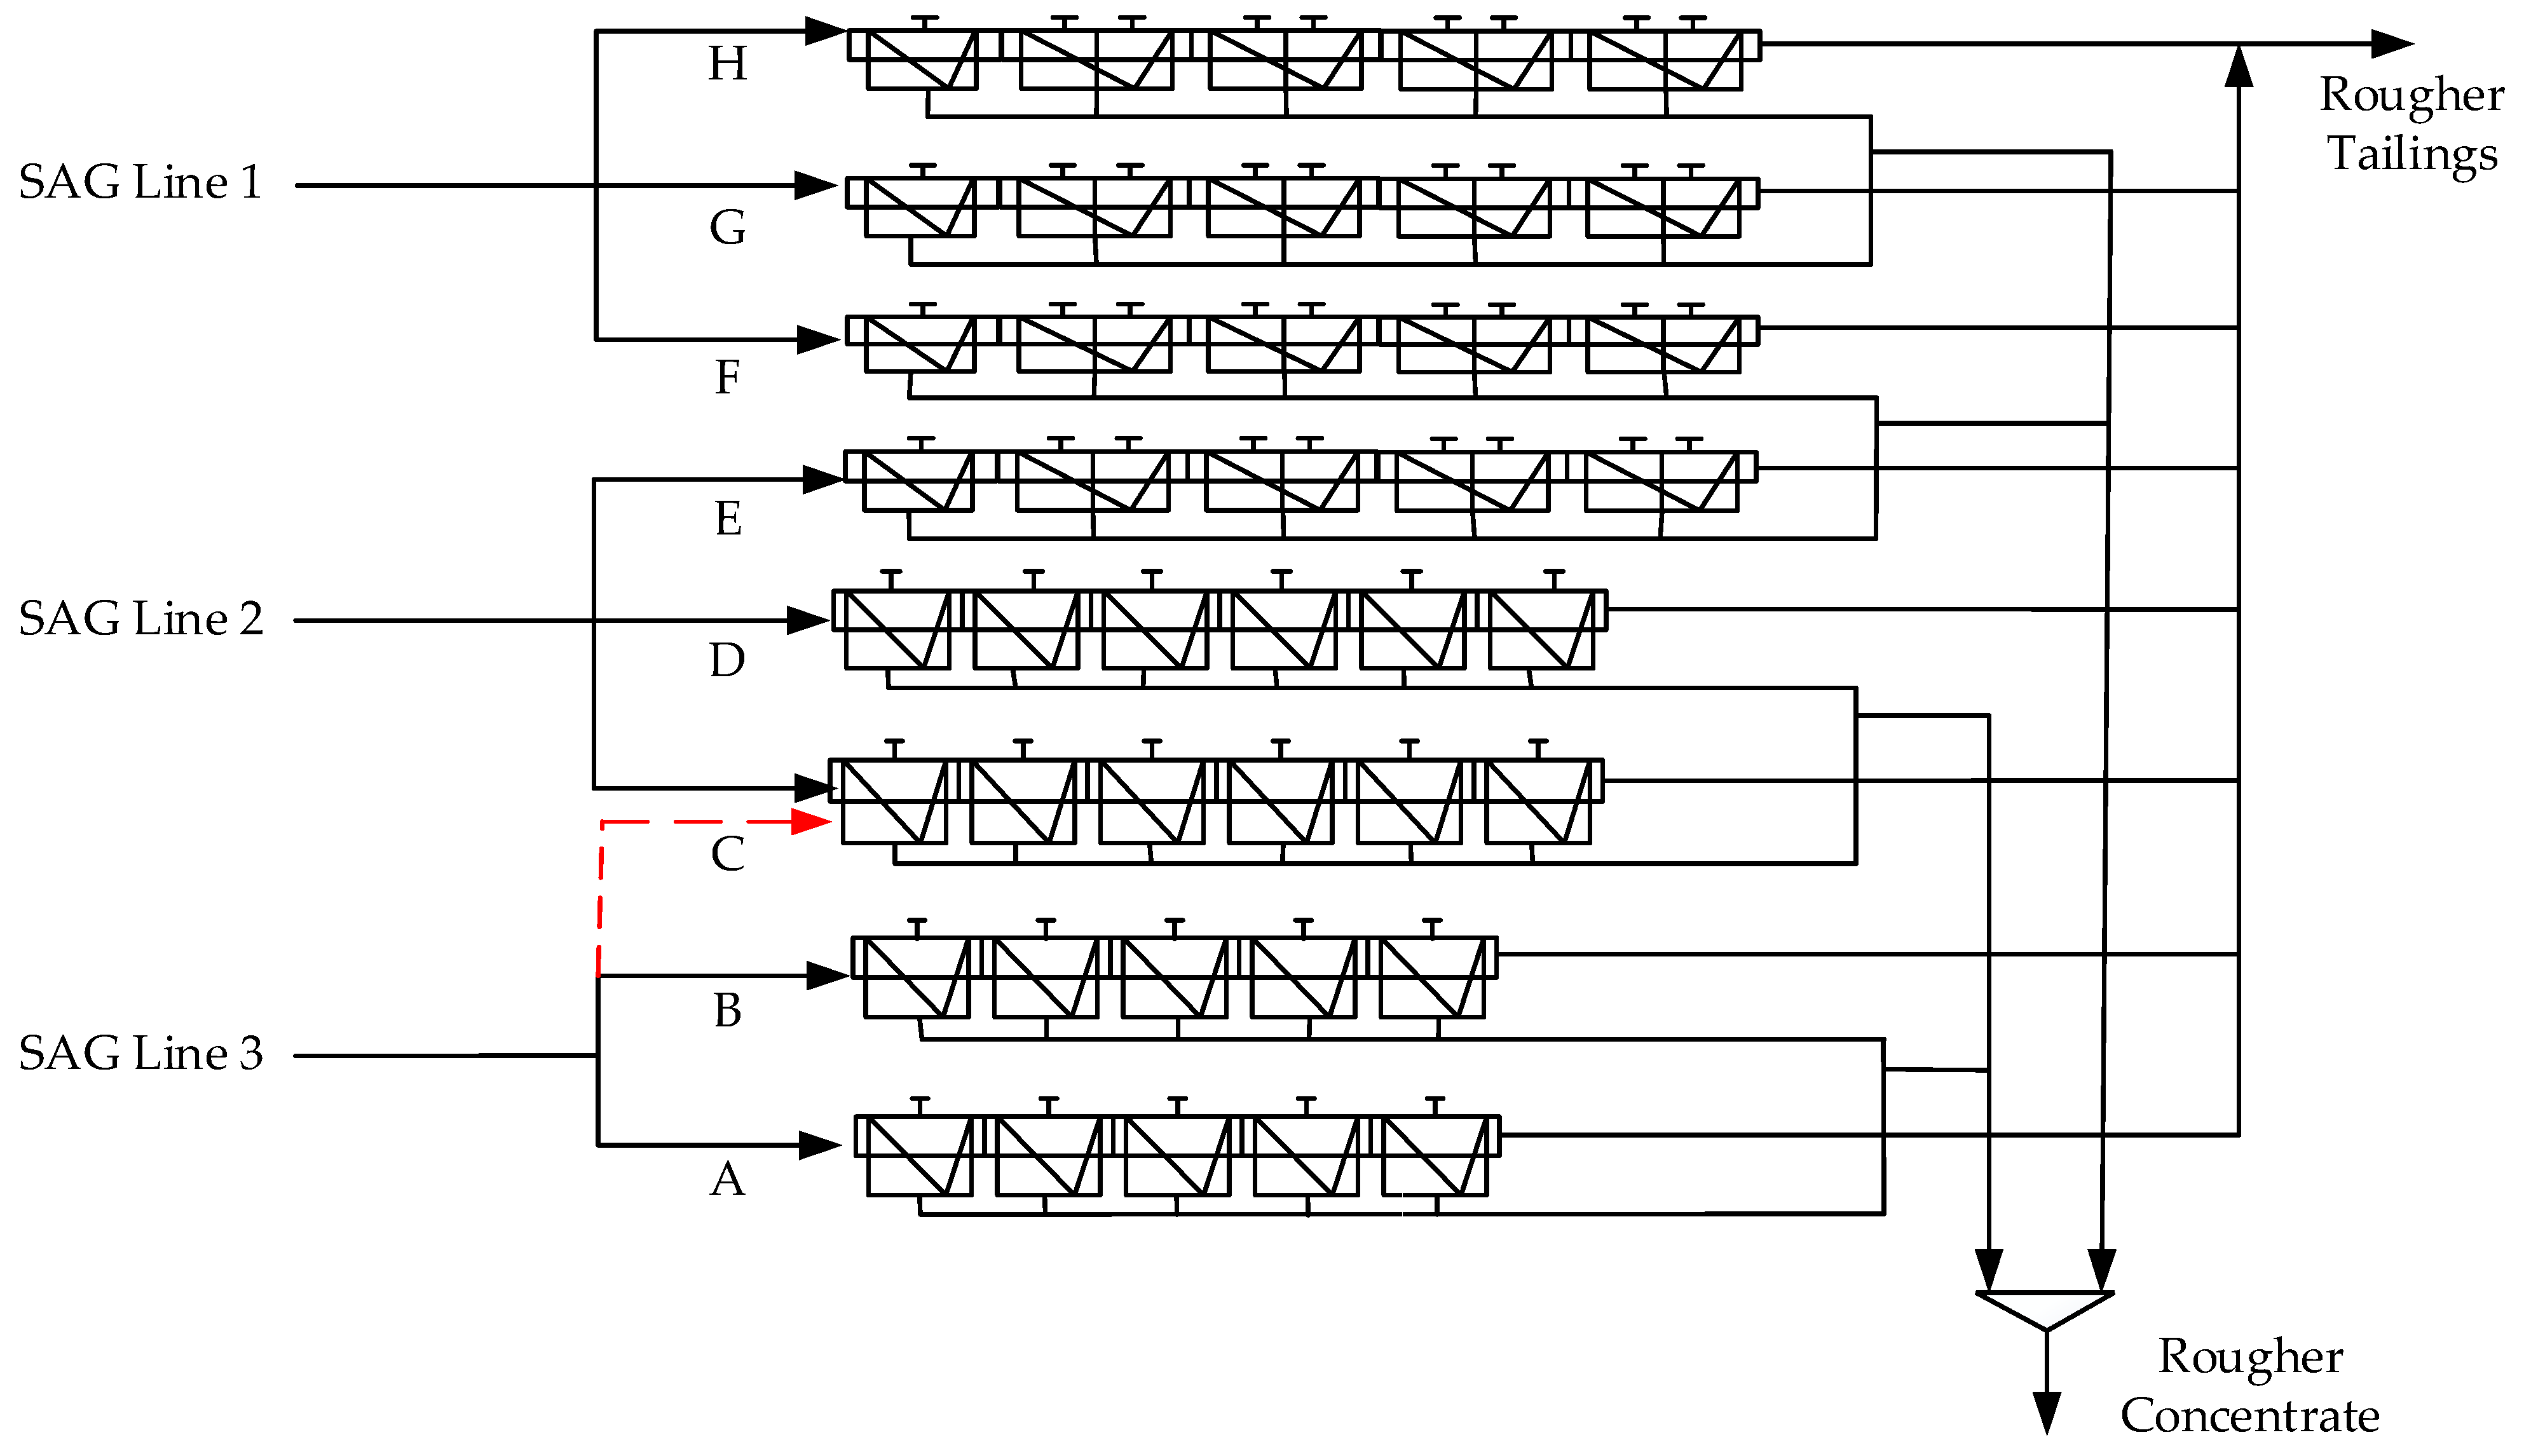
2.1. Rougher Flotation Circuit

Figure 1 shows the rougher flotation circuit of Minera Los Pelambres, which processes a copper ore with typical feed grades of 0.7%. The circuit consists of eight parallel flotation banks which are fed from three SAG (semi-autogeneous) grinding lines. The radioactive tracer tests were conducted in banks A, B and C. The overall throughput was approximately 6500 tph. The rougher banks A and B consist of five Dorr-Oliver Eimco cells of 250 m3, banks C and D of six Dorr-Oliver Eimco cells of 250 m3 and banks E to H of nine Wemco cells of 130 m3, respectively. The dashed red line in Figure 1 represents an optional configuration for the distributor box of the SAG line 3, which allows a fraction of the pulp to be fed to the rougher bank C.
The baseline along with two additional configurations for the valve openings were tested in the feed distributor. These additional configurations aimed for lower flowrates towards the rougher bank B to correct an imbalance observed in the first tests. Figure 2 shows the studied settings for the distributor box from SAG line 3. Figure 2a presents the baseline, whereas Figure 2b,c presents the alternative valve settings 1 and 2. Each box has six valves that are represented by circles when operated 100% open. The symbol x implies the valves were operated 100% closed. The two alternative options consider the use of the optional stream towards the rougher bank C, as shown in Figure 1.

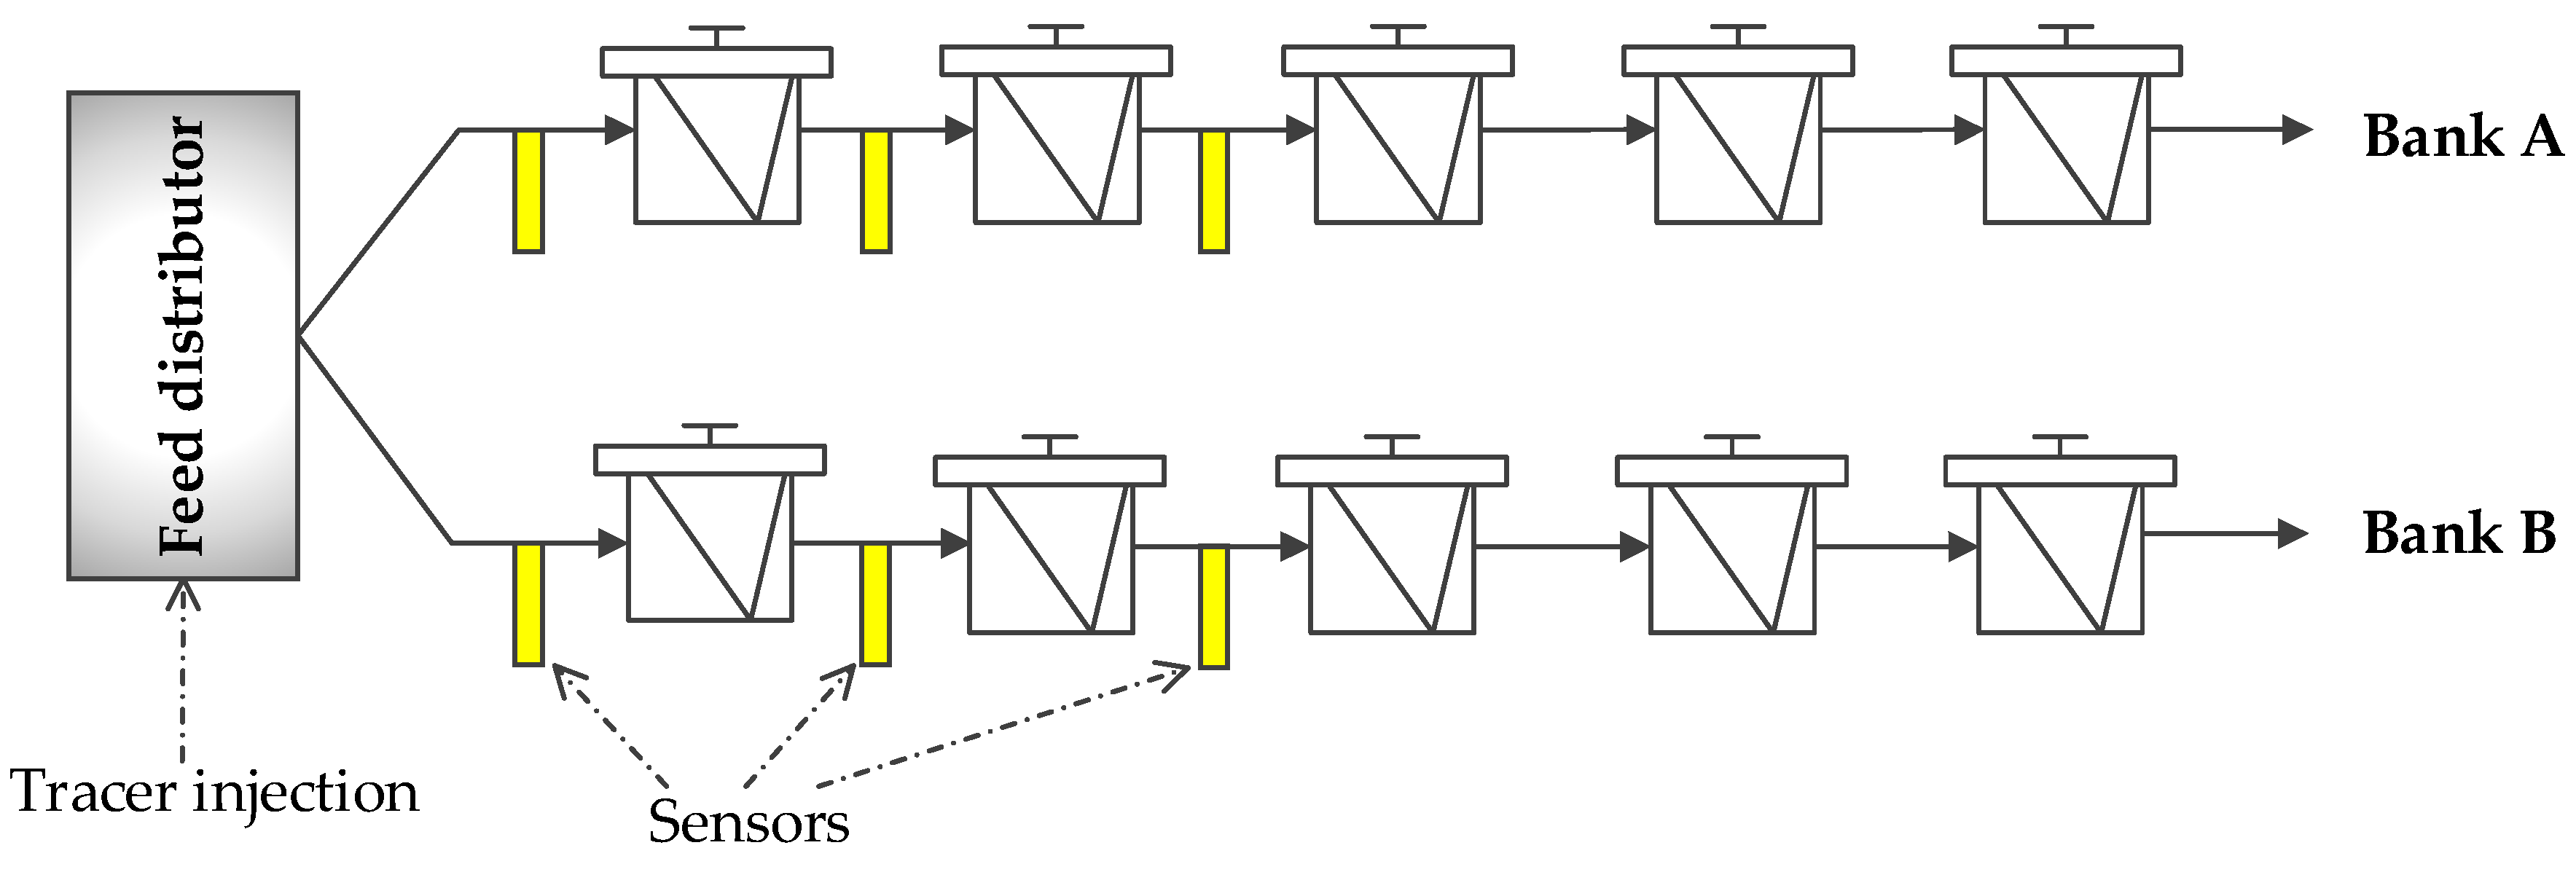
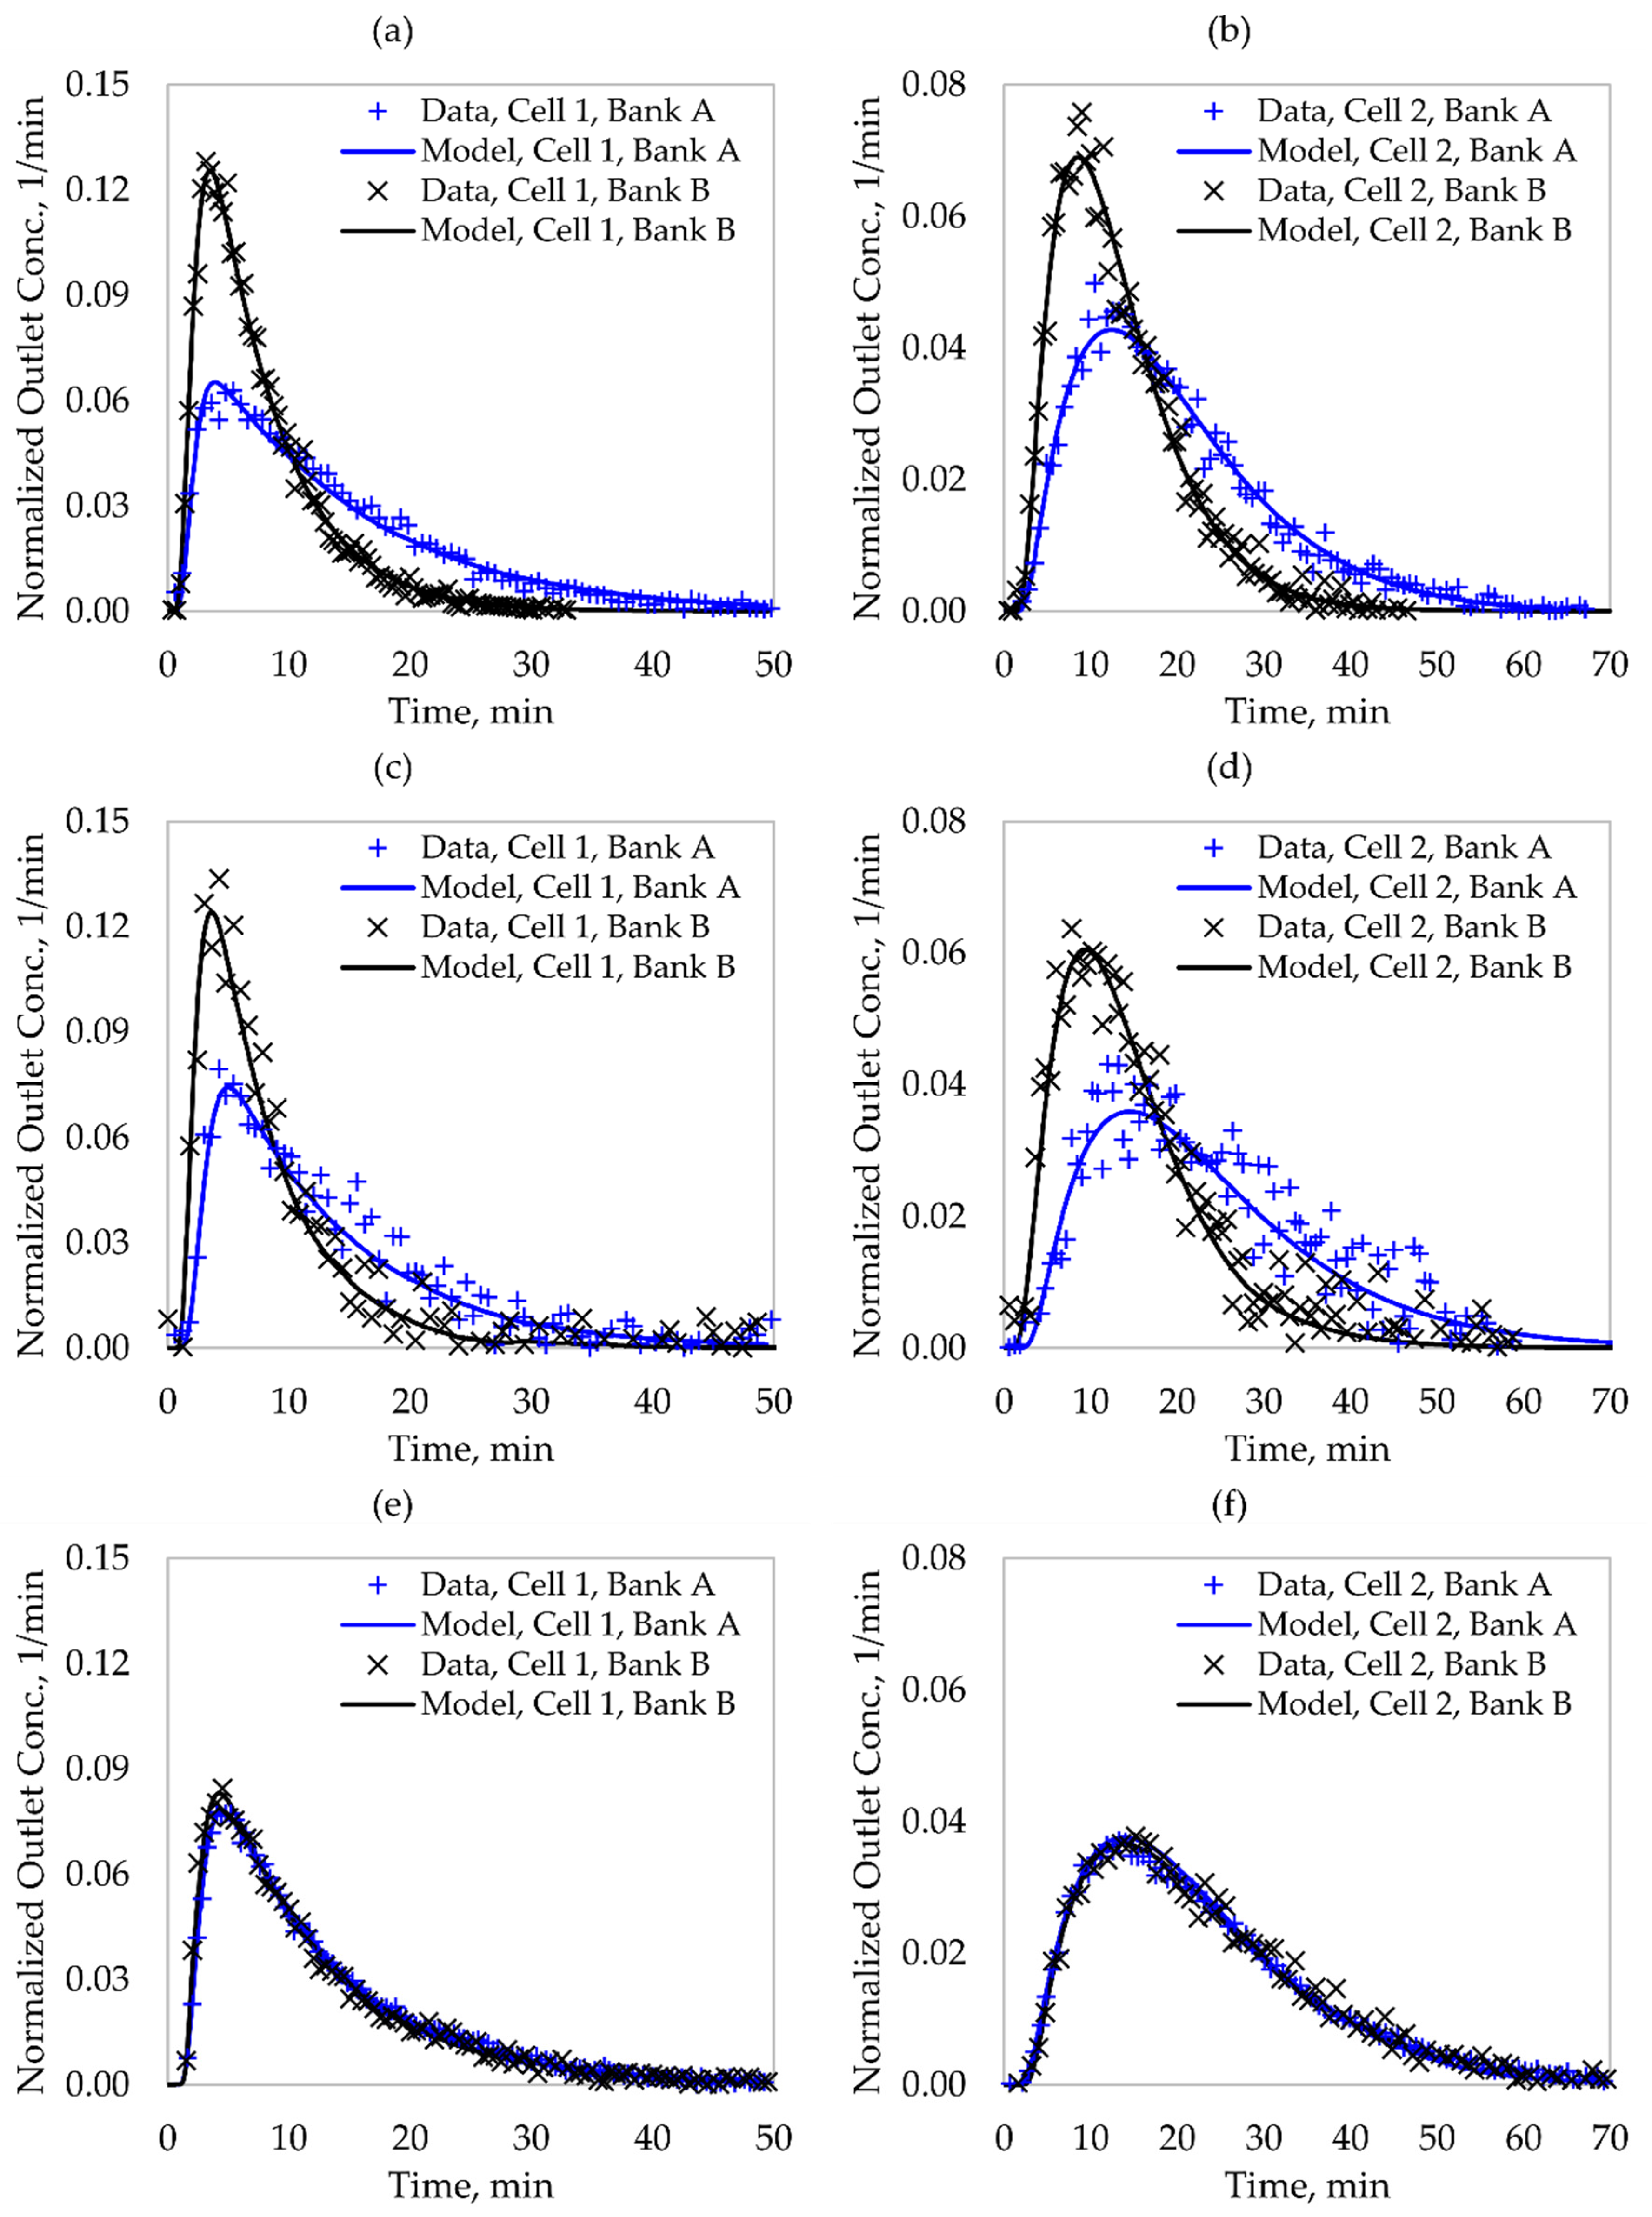
2.2. Residence Time Distribution Measurements

Radioactive tracer experiments were conducted to determine the pulp distribution in the parallel rougher banks A and B. The three valve settings shown in Figure 2 were evaluated. The sampling campaign was scheduled for being conducted in 4 days, taking into consideration the following aspects: (i) the plant availability; (ii) the measurement times per radioactive test (2–3 h); (iii) the time required to reach steady and stable operations after changing the valve settings; (iv) the tracer lifetimes; and (v) personnel availability. The two alternative valve settings shown in Figure 2 were chosen to obtain a range of flow distributions with adequate replicability at industrial scale. Therefore, the experimental conditions were selected based on the potential to characterize and improve the flow distribution, repeating all measurements. The tracer tests consisted of injecting a small amount of liquid or pulp tracer (approximately 100 mL) into the feed distributor, and the inlet and outlet tracer signals were measured using non-invasive sensors: scintillating crystals of NaI(Tl) of 1”×1.5” (Saphymo, Montigny-le-Bretonneux, France). Irradiated non-floatable solid and Br82 (both in water solution) were used as solid and liquid tracers, respectively. The non-floatable solid was sampled from the plant tailings and tested in three size classes (fine –45 µm; medium: −150 + 45 µm; and coarse: +150 µm). These three classes were chosen to consider the effect of solid segregation in the flow distribution. As reported by Yianatos and Díaz [8], solid segregation has been observed in rougher flotation banks, with the fine classes showing residence times comparable to those of the liquid phase and a decreasing trend towards the coarser classes. Appendix A illustrates a typical particle size distribution in the feed distributor to banks A and B. A pneumatic system was used to generate a pulse signal in the inlet streams (approaching an impulse). The size-by-size solid was irradiated at the nuclear reactor of the Chilean Commission of Nuclear Energy, in Santiago, Chile. The mean tracer lifetimes were 36 h and 15 h for liquid and solid, respectively. The radioactivity type and intensity were determined taking the pulp flowrates and fluid characteristics into consideration, which allowed for real-time measurements. The samples were irradiated in a thermal 5 MW reactor using a neutronic flux of up to 5 × 10¹³ n/cm2 s, spatially homogeneous in 4π. The samples were installed inside a grid with the combustible elements exposed to the neutronic flux for approximately 20 h, which guaranteed homogeneous activation of the selected elements in the sample (typically Na24). Br82 was also obtained from irradiated KBr. All tracer activities were calculated to provide enough significance (50 times) above typical local backgrounds (10–20 cps). Figure 3 shows the injection and measurement points in the rougher banks A and B at Los Pelambres. The on-stream sensors were located at the inlet and outlet streams of the first cell of each bank. The outlet stream of the second cell was also measured to obtain a second estimate for the pulp distribution. This installation allowed for short overall measurement times with respect to the entire rougher banks. The sensors were collimated to observe the tracer transport through the pipelines with negligible interferences from other sources.
Table 1 summarizes the type of tracer employed in each test, according to their availability. For the valve setting 1, the radioactive tests consider fine and medium solid tracers, whereas for the valve setting 2, liquid and coarse solid were employed in the experiments. In the baseline, all tracers were used.

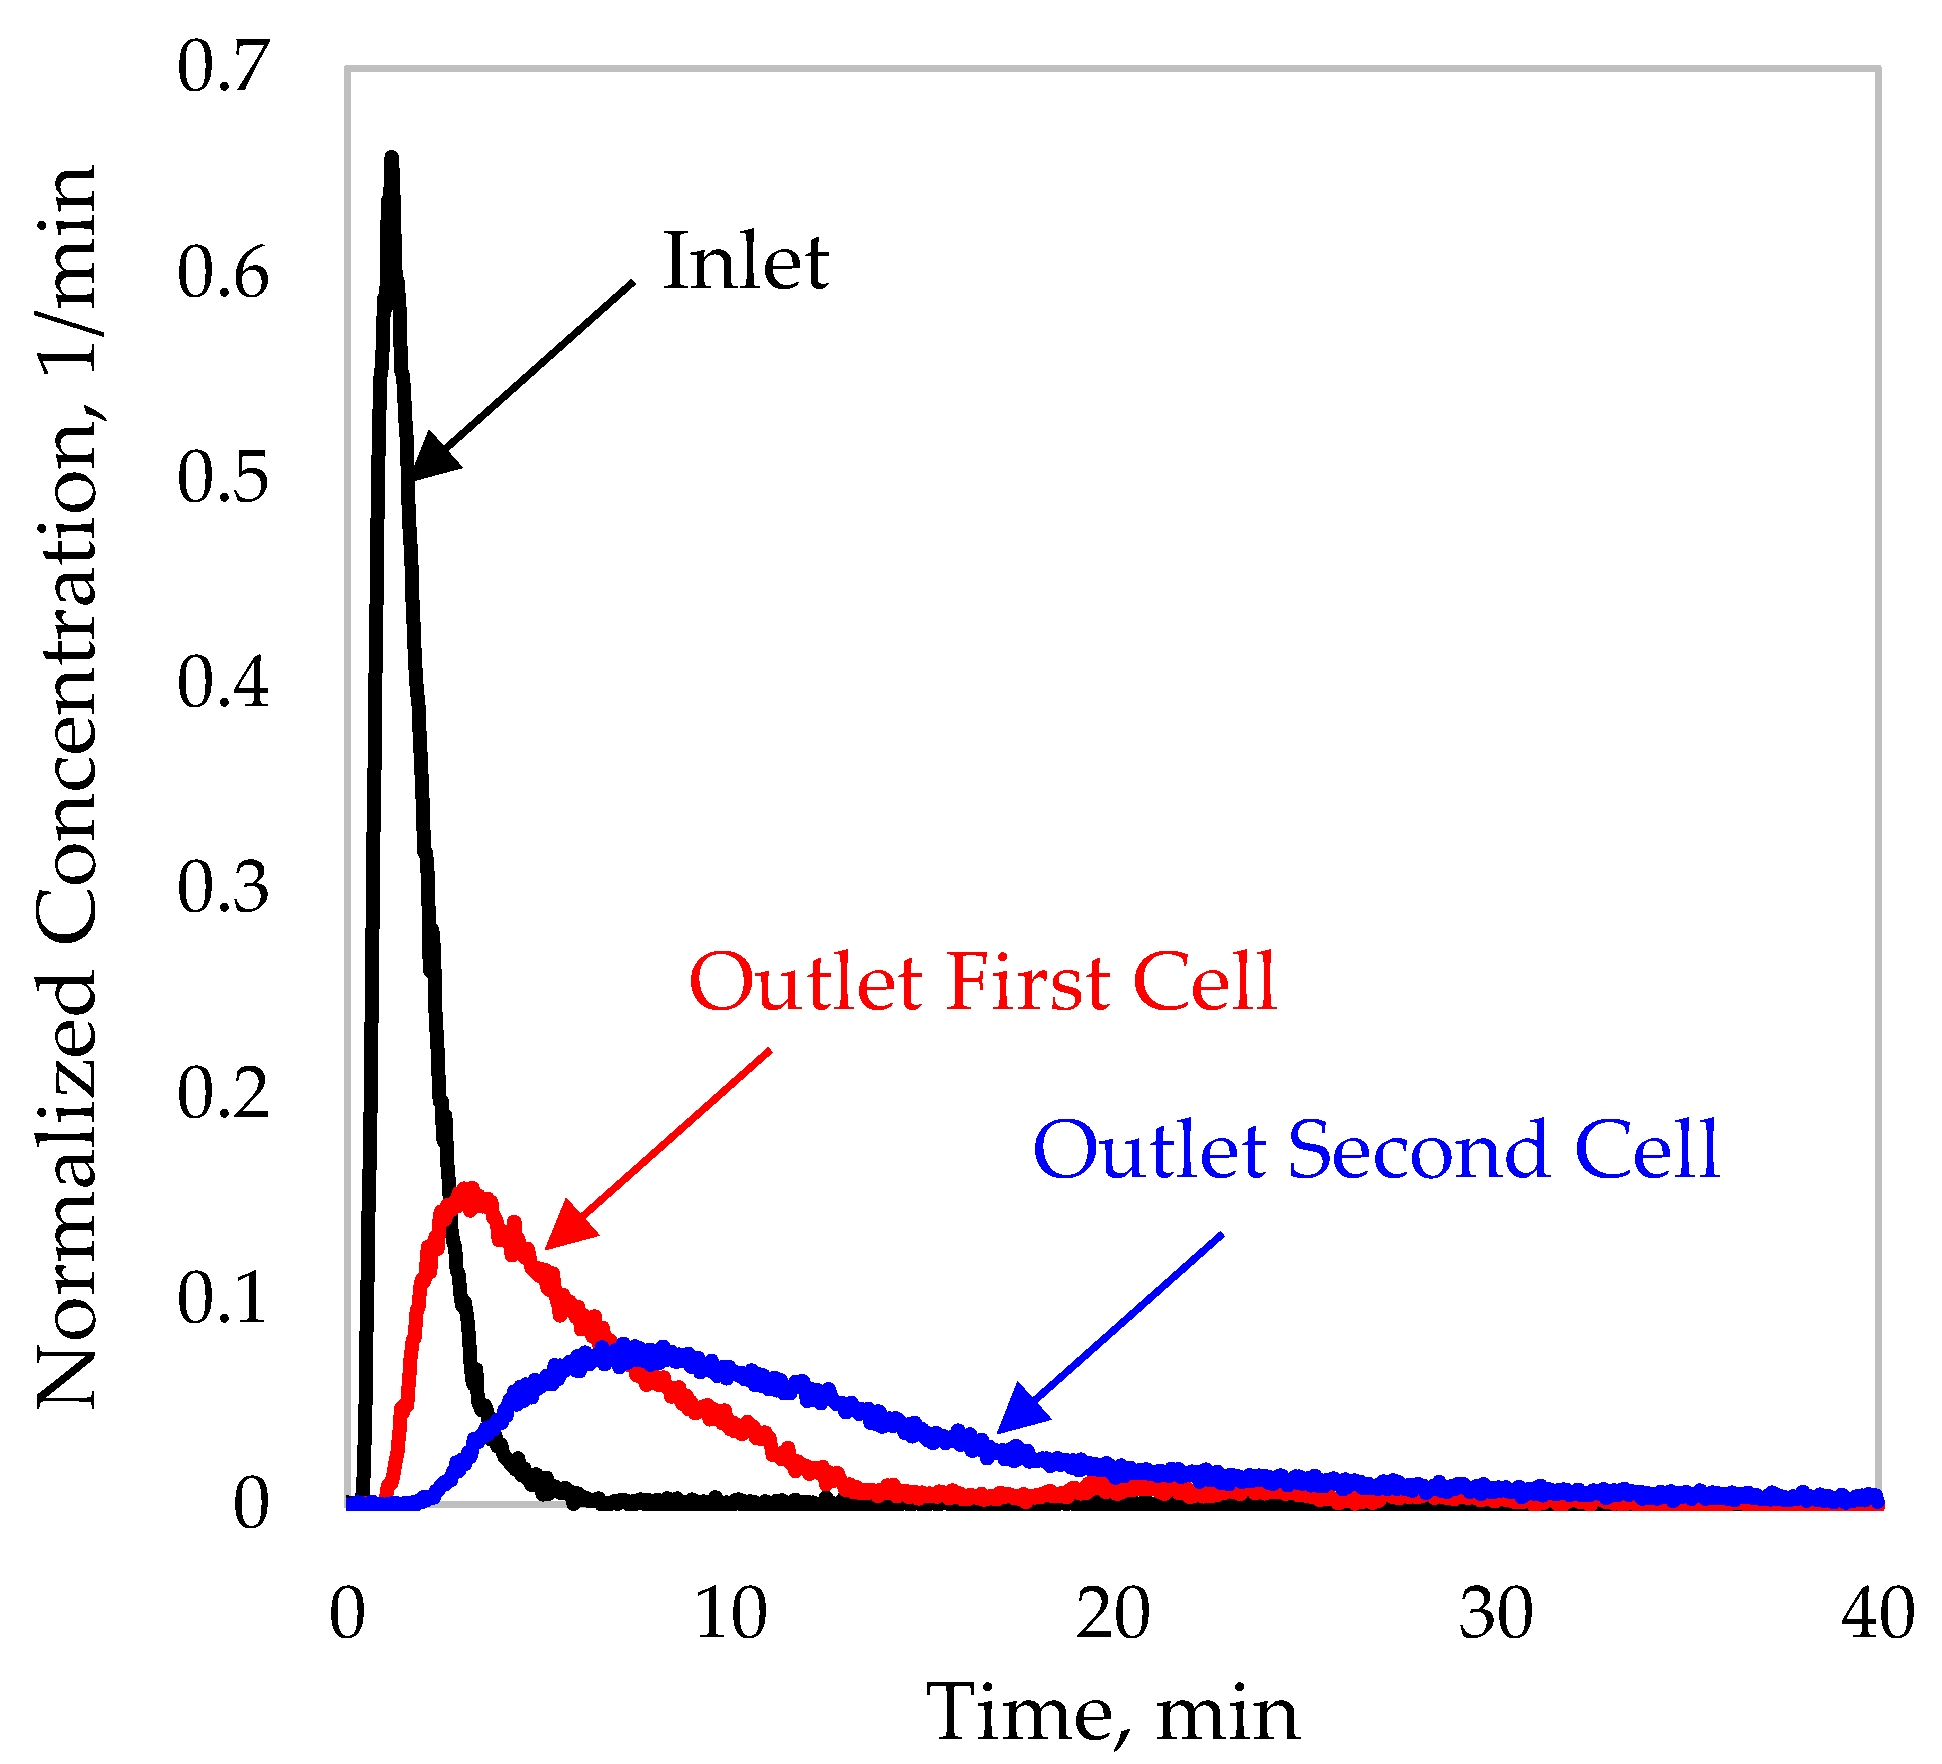
2.3. RTD Characterizations

Figure 4 illustrates radioactive tracer measurements in the feed and the outlet streams of cells 1 and 2 for the rougher bank A, using liquid tracer. From all measurements, the residence time distributions were estimated by deconvolution. Given the inlet (x) and outlet (y) tracer concentrations and an adequate model structure for the RTDs (h), the RTD parameters were estimated from Equation (1) to minimize the squared reconstruction errors for the outlet concentrations:
min   ( y x * h ) T ( y x * h )
where x, y and h are discretized, normalized and vectorized representations of x, y and h, respectively, ∗ corresponds to the convolution product and T denotes transposition. Equation (1) was implemented in Matlab, using the Optimization Toolbox (The MathWorks, Natick, MA, USA).
For single flotation cells, the Large and Small Tanks in Series (LSTS) model of Equation (2) was used, which adequately described the experimental data with only three parameters.
h ( t ) = exp [ ( t τ D ) / τ L ] exp [ ( t τ D ) / τ S ] τ L τ S ,         t τ D h ( t ) = 0 ,         0 t < τ D τ mean = τ L + τ S + τ D
Within Equation (2), t is the flotation time, τL the residence time of a large perfect mixer, τS the residence time of a small perfect mixer, τD a transport delay and τmean the mean residence time. The latter is directly obtained from the model parameters.
Similarly, the N perfectly-mixed-reactors-in-series model of Equation (3) was employed to represent the RTDs of an arrangement of two cells in series:
h ( t ) = ( t τ D ) N 1 τ M N Γ ( N ) exp [ ( t τ D / τ M ) ] ,         t τ D h ( t ) = 0 ,         0 t < τ D τ mean = N τ M + τ D
where N is the number of equivalent perfect mixers in series, τM the residence time of a single perfect mixer and Γ(N) the Gamma function. A transport delay was also incorporated in this model.

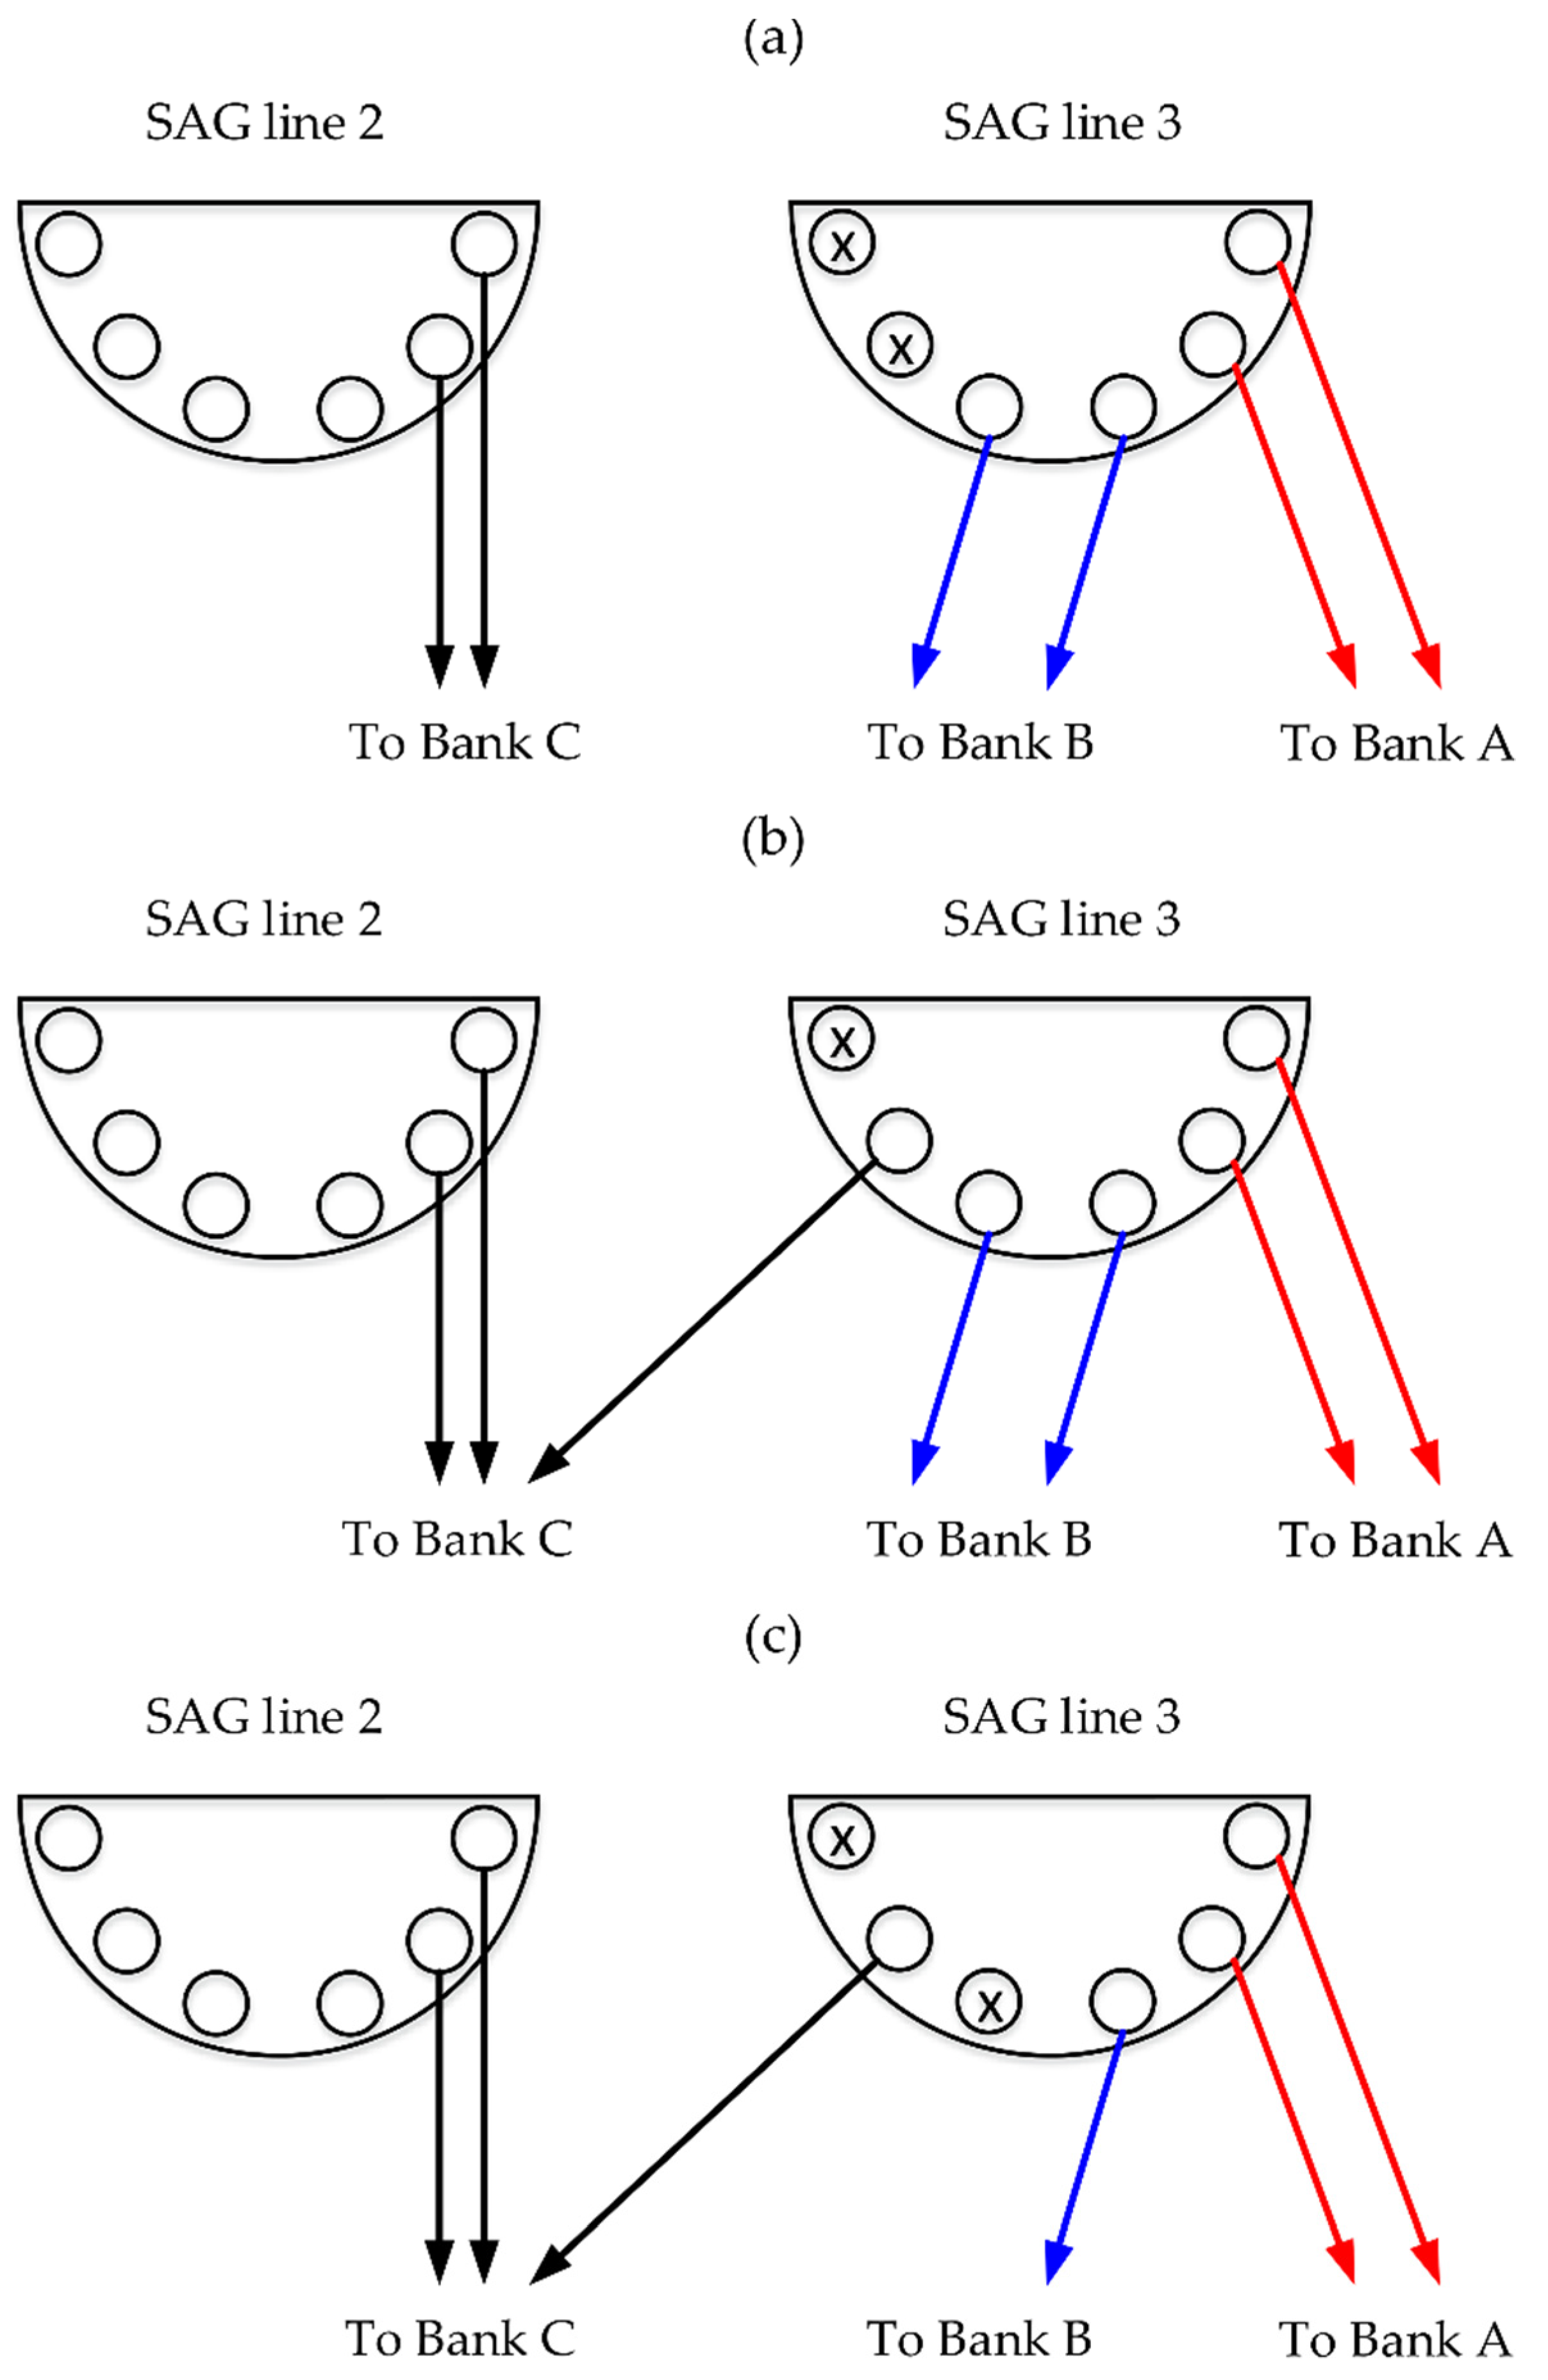
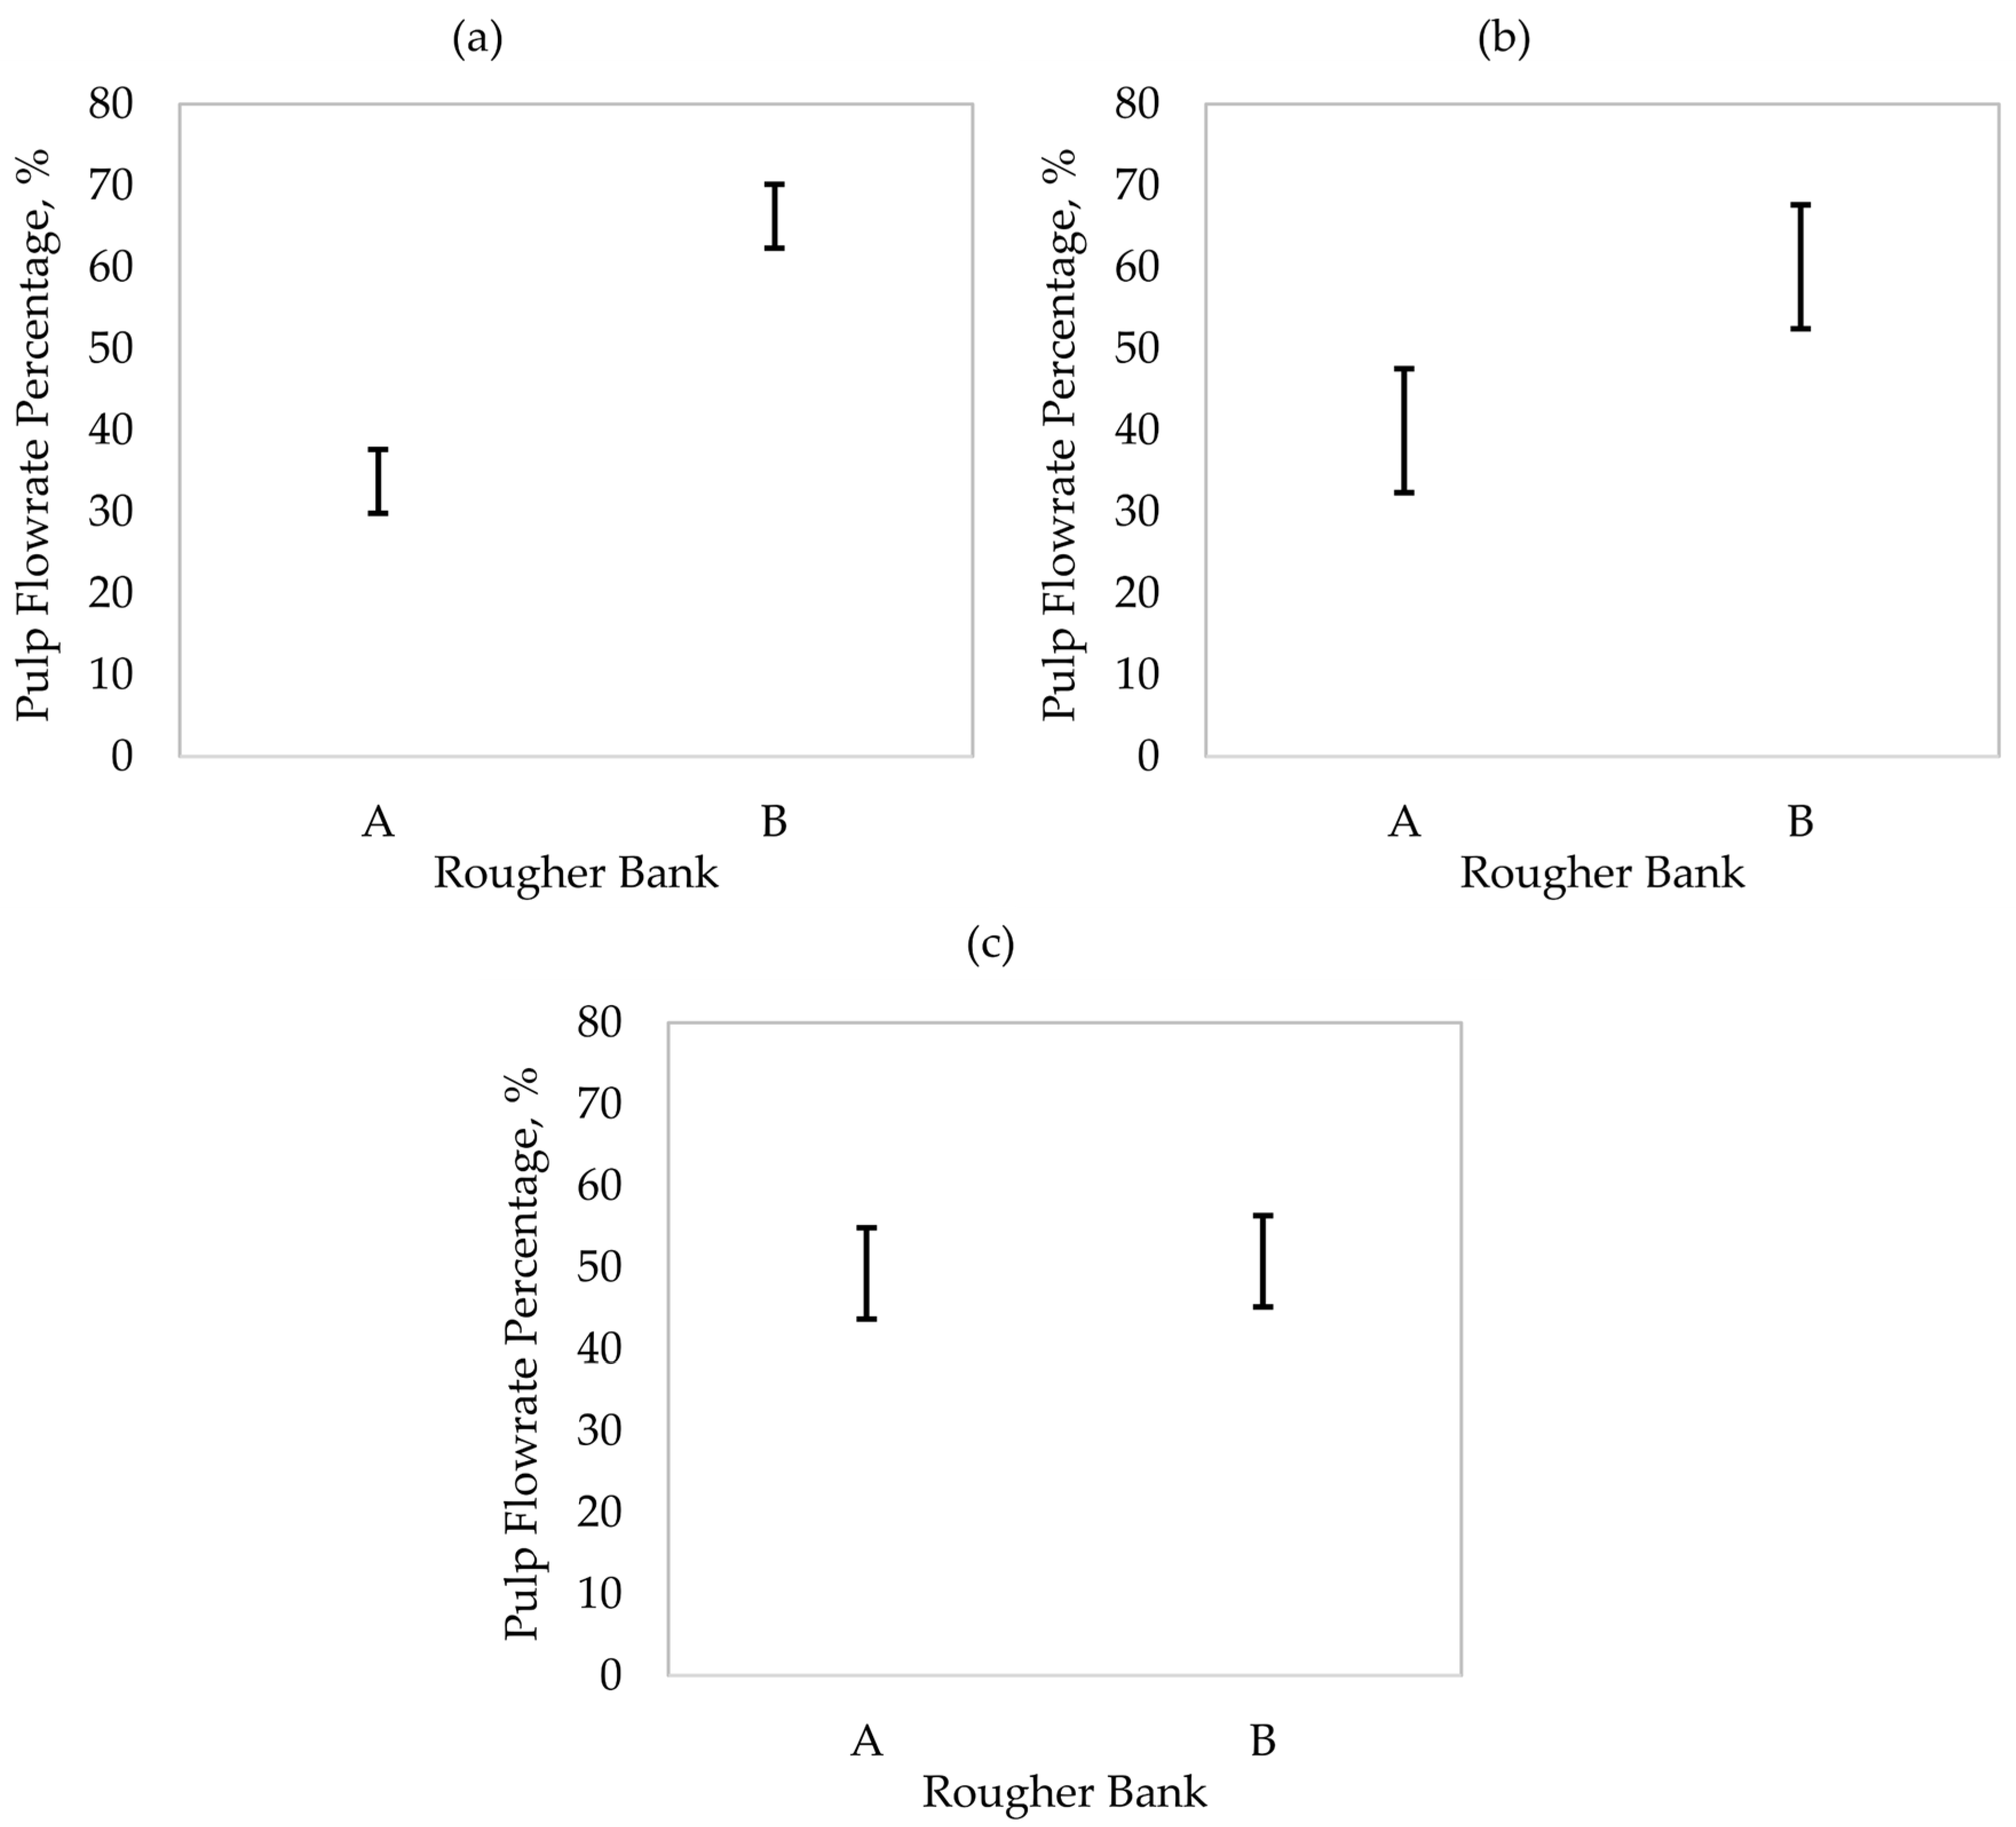
2.4. Pulp Distribution between Parallel Flotation Banks

For each RTD measurement detailed in Figure 3 and Table 1, the mean residence times were obtained from Equations (2) and (3). The volumetric pulp flowrates (Q = Veff/τmean) were then obtained [18], given an effective volume (Veff) for the flotation machines or arrangements. The design volume of each flotation cell was 250 m3. However, the effective volume also considers the gas hold-up in the flotation machines. As the flotation machines are self-aspirated, the same effective volumes were assumed in all cases with εG = 10%. The volumetric pulp flowrates were then inversely proportional to the mean residence times. Therefore, significant differences in the τmean values between parallel banks directly indicated pulp flowrate imbalances in the rougher circuit.

3. Results

Figure 5 illustrates the outlet tracer concentrations of cell 1 (Figure 5a,c,e) and 2 (Figure 5b,d,f) along with the model fitting for the three valve settings described in Figure 2. The baseline (Figure 5a,b, coarse solid tracer) and the valve setting 1 (Figure 5a,b, intermediate solid tracer) showed imbalance, with residence times significantly higher in the rougher bank A, which implied lower flowrates feeding that bank. The valve setting 1 did not allow for improvements in the pulp distribution despite a fraction of the feed was directed to the rougher bank C. The medium size tracer was more affected by radioactive decay due to the survey schedule, showing a lower signal to noise ratio as shown in Figure 5c,d. However, this sensitivity did not significantly affect the distribution estimates presented here. As shown in Figure 5e,f, the valve setting 2 was effective in improving the flow distribution between the rougher banks A and B. It should be noted that the residence time differences between the banks A and B, from the RTD measurements in one cell and two cells in series, were consistent. Therefore, these estimations were considered as repetitions.
Table 2 shows the estimated mean residence times in cell 1 and the arrangement of two cells in series (cells 1 + 2), for all tracers. The mean residence times from the baseline were significantly and consistently different between the rougher banks A and B. These differences slightly decreased with the valve setting 1. This condition was subject to some variability from the fine solid tracer due to a control instability in the second cell. Results from the valve setting 2 presented similar residence times between the rougher banks A and B in all measurements, showing the effectiveness of this configuration to balance the pulp distribution.
Figure 6 shows the estimated pulp distributions between the rougher banks A and B. The error bars correspond to the 95% confidence intervals of the mean. In the baseline [Figure 6a], the pulp distribution showed a significant imbalance, with 66% of the pulp being fed (on average) to the rougher bank B. With the valve setting 1 [Figure 6b], the feed distribution was slightly enhanced, with 60% of the pulp being directed to this bank. It should be noted that the distribution imbalances in the baseline and with the valve setting 1 were significant in terms of the mean (at a significance level of α = 5%), despite the variability of the latter. Results from the valve setting 2 [Figure 6c] showed that this configuration approximately balanced the pulp distribution with 49% versus 51% being fed to the rougher banks A and B, respectively. In addition, the confidence intervals of the mean were overlapped, showing that the differences were not significant at α = 5%.
Flotation banks with shorter residence times than the design values will be more sensitive to mineral losses. This sensitivity will be more significant in the slow-floating fractions (e.g., coarse and low-liberated particles) under increases in the feed flowrates. From kinetic studies previously conducted in the rougher circuit, a 10% pulp flowrate increase will decrease the recovery of the slow-floating particles by more than 2%, which will be even higher in flotation banks with shorter residence times. Thus, significant feed flowrate imbalances negatively affect the metallurgical performance, also hindering the circuit operation.
The radioactive tracer tests allowed an unbalanced feed distribution to be detected in an industrial flotation plant, using a non-invasive measurement technique. Given the flexibility of the evaluated circuit, the imbalance was corrected by changing the valve settings of the feed distributor, also directing a fraction of the feed to an additional rougher bank. Thus, the methodology proved to be industrially suitable for improving the pulp distribution between parallel flotation banks. Further efforts are being made to systematize the radioactive tests in industrial operations. The results presented here showed the need for reliable and robust pulp flowrate sensors to monitor possible imbalances at industrial scale.

4. Conclusions

Radioactive tracer tests were conducted in a rougher flotation circuit. From the surveys, the following results were obtained:
  • The radioactive tests allowed an imbalance between two parallel flotation banks (rougher banks A and B) to be detected by non-invasive measurements. The rougher bank B received approximately 66% of the feed from the distribution box. This operational problem was not observable by the online instrumentation available in the plant.
  • The plant flexibility made it possible for changes in the feed distributor to decrease the flowrate towards the rougher bank B.
  • An alternative valve configuration in the feed distributor was set, which allowed the residence times of the parallel banks to be balanced.
The radioactive tracer technique was suitable to industrially detect and correct operational problems associated with the pulp distribution in parallel flotation banks. Further studies are being conducted to systematize these measurements at industrial scale.

Author Contributions

Methodology, L.V., F.D., J.Y.; Software, L.V.; Formal Analysis, L.V., F.D., J.Y.; Writing—Original Draft Preparation, F.H., L.M., L.V., F.D., P.V., J.Y.; Writing—Review & Editing, F.H., L.M., L.V., F.D., P.V., J.Y.; Supervision, L.V., F.D., J.Y.; Project Administration, F.H., L.M., L.V., F.D., J.Y.; Funding Acquisition, F.H., L.M., L.V., F.D., J.Y. All authors have read and agreed to the published version of the manuscript.

Funding

Funding for process modeling and control research was provided by ANID, Project Fondecyt 1201335, and Universidad Técnica Federico Santa María, Project PI_LIR_2021_78.

Institutional Review Board Statement

Not applicable.

Informed Consent Statement

Not applicable.

Conflicts of Interest

The author declares no conflict of interest.

Appendix A

Figure A1 shows a typical particle size distribution in the feed distributor to the rougher banks A and B. The size classes −45 µm, +45–150 µm and +150 µm presented approximately 1/3 of the mass, respectively.
Figure A1. Typical particle size distribution in the flotation feed to the rougher banks A and B.
J 05 00020 g0a1

References

  1. Bogdanov, O.; Hainman, V.; Yanis, N.; Podnek, A. Investigation of the action of modifying agents in flotation by means of radioactive tracers. Int. J. Appl. Radiat. Isot. 1957, 2, 206–207. [Google Scholar] [CrossRef]
  2. Petryka, L.; Przewlocki, K. Radiotracer Investigations of Benefication Copper Ore in the Industrial Flotation Process. Isot. Isot. Environ. Health Stud. 1983, 19, 339–341. [Google Scholar] [CrossRef]
  3. Gaudin, A.; de Bruyn, P.; Bloecher, F.; Chang, C. Radioactive Tracers in Flotation. Min. Metall. 1948, 29, 432–435. [Google Scholar]
  4. Batty, J.V.; Gibbs, H.; Poston, A.M. Radioactive Techniques for Continuously Measuring Flotation Froth Density and Pulp Flow Rates; US Department of the Interior, Bureau of Mines: Washington, DC, USA, 1966; Volume 6855.
  5. Mesa, D.; Cole, K.; van Heerden, M.R.; Brito-Parada, P.R. Hydrodynamic characterisation of flotation impeller designs using Positron Emission Particle Tracking (PEPT). Sep. Purif. Technol. 2021, 276, 119316. [Google Scholar] [CrossRef]
  6. Waters, K.; Rowson, N.; Fan, X.; Parker, D.; Cilliers, J. Positron emission particle tracking as a method to map the movement of particles in the pulp and froth phases. Miner. Eng. 2008, 21, 877–882. [Google Scholar] [CrossRef]
  7. Boucher, D.; Jordens, A.; Sovechles, J.; Langlois, R.; Leadbeater, T.W.; Rowson, N.A.; Cilliers, J.J.; Waters, K.E. Direct mineral tracer activation in positron emission particle tracking of a flotation cell. Miner. Eng. 2017, 100, 155–165. [Google Scholar] [CrossRef]
  8. Yianatos, J.; Díaz, F. Hydrodynamic characterization of industrial flotation machines using radioisotopes. In Radioisotopes-Applications in Physical Sciences; InTech: Shanghai, China, 2011; pp. 391–416. [Google Scholar]
  9. Yianatos, J.; Bergh, L.; Vinnett, L.; Panire, I.; Diaz, F. Modelling of residence time distribution of liquid and solid in mechanical flotation cells. Miner. Eng. 2015, 78, 69–73. [Google Scholar] [CrossRef]
  10. Yianatos, J.; Vinnett, L.; Panire, I.; Alvarez-Silva, M.; Díaz, F. Residence time distribution measurements and modelling in industrial flotation columns. Miner. Eng. 2017, 110, 139–144. [Google Scholar] [CrossRef]
  11. Lelinski, D.; Allen, J.; Redden, L.; Weber, A. Analysis of the residence time distribution in large flotation machines. Miner. Eng. 2002, 15, 499–505. [Google Scholar] [CrossRef]
  12. Massinaei, M.; Kolahdoozan, M.; Noaparast, M.; Oliazadeh, M.; Yianatos, J.; Shamsadini, R.; Yarahmadi, M. Hydrodynamic and kinetic characterization of industrial columns in rougher circuit. Miner. Eng. 2009, 22, 357–365. [Google Scholar] [CrossRef]
  13. Mankosa, M.; Kohmuench, J.; Christodoulou, L.; Yan, E. Improving fine particle flotation using the StackCell™ (raising the tail of the elephant curve). Miner. Eng. 2018, 121, 83–89. [Google Scholar] [CrossRef]
  14. Wills, B.A.; Finch, J. Wills’ Mineral Processing Technology: An Introduction to the Practical Aspects of Ore Treatment and Mineral Recovery; Butterworth-Heinemann: Oxford, UK; Waltham, MA, USA, 2015. [Google Scholar]
  15. Leonida, C. Froth Flotation for the 21st Century. Eng. Min. J. 2019, 220, 58–64. [Google Scholar]
  16. Mesa, D.; Brito-Parada, P.R. Scale-up in froth flotation: A state-of-the-art review. Sep. Purif. Technol. 2019, 210, 950–962. [Google Scholar] [CrossRef]
  17. Yianatos, J.; Bergh, L.; Pino, C.; Vinnett, L.; Muñoz, C.; Yañez, A. Industrial evaluation of a new flotation mechanism for large flotation cells. Miner. Eng. 2012, 36–38, 262–271. [Google Scholar] [CrossRef]
  18. Levenspiel, O. Chemical Reaction Engineering, 3rd ed.; John Wiley & Sons: New York, NY, USA, 1998. [Google Scholar]
Figure 1. Rougher flotation circuit of Minera Los Pelambres. The dashed line represents an optional stream.
J 05 00020 g001
Figure 2. Valve configuration in the feed distributors of SAG lines 2 and 3: (a) Baseline; (b) Alternative valve setting 1; (c) Alternative valve setting 2.
J 05 00020 g002
Figure 3. Tracer injection and sensor location in rougher banks A and B.
J 05 00020 g003
Figure 4. Normalized tracer concentrations in the inlet and outlet of the first and second cells of the rougher bank A, liquid tracer.
J 05 00020 g004
Figure 5. Normalized outlet tracer concentrations: Baseline, coarse solid tracer (a) Cell 1, (b) Cell 2; Valve Setting 1, medium solid tracer (c) Cell 1, (d) Cell 2; Valve Setting 2, liquid tracer (e) Cell 1, (f) Cell 2.
J 05 00020 g005
Figure 6. Pulp distribution between the rougher banks A and B: (a) Baseline; (b) Valve setting 1; (c) Valve Setting 2. The error bars correspond to the 95% confidence intervals of the mean.
J 05 00020 g006
Table 1. Types of tracers employed in the pulp distribution measurements.
TracerBaselineValve Setting 1Valve Setting 2
Liquid-
Fine Solid-
Medium Solid-
Coarse Solid-
Table 2. Mean residence times for each valve setting and experimental condition.
TracerRougher BankMean Residence Times, min
BaselineValve Setting 1Valve Setting 2
Cell 1Cells 1 + 2Cell 1Cells 1 + 2Cell 1Cells 1 + 2
LiquidA10.516.6--10.822.9
B4.810.8--9.521.9
Fine
Solid
A15.921.213.422.9--
B5.811.79.119.5--
Medium
Solid
A14.421.310.321.3--
B6.012.85.413.6--
Coarse
Solid
A13.218.4--11.518.4
B6.011.6--10.221.9
Publisher’s Note: MDPI stays neutral with regard to jurisdictional claims in published maps and institutional affiliations.

