Article

A Comparison of the Qualitative Analytic Hierarchy Process and the Quantitative Frequency Ratio Techniques in Predicting Forest Fire-Prone Areas in Bhutan Using GIS

by
Kinley Tshering
1,
Phuntsho Thinley
2,3,
Mahyat Shafapour Tehrany
4,
Ugyen Thinley
5 and
Farzin Shabani
6,7,*
1
Forest Fire Management Section, Department of Forests and Park Services, Thimphu 11001, Bhutan
2
Ugyen Wangchuck Institute for Conservation and Environment, Lamaigoenpa, Bumthang 32001, Bhutan
3
Ecosystem Management, University of New England, Armidale NSW 2351, Australia
4
Department of Geodesy, Kandilli Observatory and Earthquake Research Institute, Bogazici University, 34680 Cengelkoy-Istanbul, Turkey
5
College of Natural Resources, Royal University of Bhutan, Lobesa, Punakha 13001, Bhutan
6
ARC Centre of Excellence for Australian Biodiversity and Heritage, Global Ecology, College of Science and Engineering, Flinders University, Adelaide, SA GPO Box 2100, Australia
7
Department of Biological Sciences, Macquarie University, Sydney NSW 2109, Australia
*
Author to whom correspondence should be addressed.
Submission received: 9 February 2020 / Revised: 24 March 2020 / Accepted: 27 March 2020 / Published: 30 March 2020

Abstract

:
Forest fire is an environmental disaster that poses immense threat to public safety, infrastructure, and biodiversity. Therefore, it is essential to have a rapid and robust method to produce reliable forest fire maps, especially in a data-poor country or region. In this study, the knowledge-based qualitative Analytic Hierarchy Process (AHP) and the statistical-based quantitative Frequency Ratio (FR) techniques were utilized to model forest fire-prone areas in the Himalayan Kingdom of Bhutan. Seven forest fire conditioning factors were used: land-use land cover, distance from human settlement, distance from road, distance from international border, aspect, elevation, and slope. The fire-prone maps generated by both models were validated using the Area Under Curve assessment method. The FR-based model yielded a fire-prone map with higher accuracy (87% success rate; 82% prediction rate) than the AHP-based model (71% success rate; 63% prediction rate). However, both the models showed almost similar extent of ‘very high’ prone areas in Bhutan, which corresponded to coniferous-dominated areas, lower elevations, steeper slopes, and areas close to human settlements, roads, and the southern international border. Moderate Resolution Imaging Spectroradiometer (MODIS) fire points were overlaid on the model generated maps to assess their reliability in predicting forest fires. They were found to be not reliable in Bhutan, as most of them overlapped with fire-prone classes, such as ‘moderate’, ‘low’, and ‘very low’. The fire-prone map derived from the FR model will assist Bhutan’s Department of Forests and Park Services to update its current National Forest Fire Management Strategy.

1. Introduction

Forest fire is an environmental catastrophe that threatens the safety of humans, infrastructure, and biodiversity [1,2]. Global climate change has led to the considerable decrease in precipitation and increase in the temperature, further influencing the occurrence of forest fires. There are other factors influencing forest fire increase, such as a longer arid season and contributing anthropogenic activities [3]. For example, the evidence for declining forest resilience to wildfires under climate change has been documented by Stevens-Rumann, Kemp [4], Allen, Macalady [5], and Rother and Veblen [6] (also see [7,8,9,10,11,12,13]). Abatzoglou and Williams [14] stated the increased fire activity in the western US and in the US Northern Rockies has been driven by both rising temperatures and widespread drought, particularly since 2000. These factors have altered the trend and frequency of forest fires at an alarming rate in many regions of the world [15,16,17]. It is, therefore, vital to have a reliable and precise approach to predict areas susceptible to forest fire. An accurate forest fire-prone map can assist forest management and planning authorities in allocating relevant resources, emergency responses, and early warning systems [18]. Several methods have been proposed and tested to map forest fire-prone regions. These approaches can be categorized into three major groups of physics-based techniques [19], statistical techniques [20], and machine learning techniques [21].
Many physics-based techniques existed, such as EMBYR [22], FARSITE—Fire Area Simulator [23], FIRETEC [24], FDS [25], and LANDIS-II [26]. Combinations of equations on fluid mechanics, combustion of canopy biomass, and heat transfer mechanisms are required for physics-based methods to recognize fire-prone areas including predicted forest fire periods. The main weak point of these approaches is the difficulty in measuring the amount of inherent errors [27]. Another disadvantage of the physics-based method is the requirement of having detailed data. For instance, data on locations and sizes of trees, fuel mass, soil moisture etc., have to be collected over large areas, making this a difficult task [28]. Therefore, these techniques may not be applicable in data-poor regions. Machine learning methods, such as the Artificial Neural Network [29], Support Vector Machine [30], and Decision Tree [31], are considerably time consuming and software dependent with a high computer capacity [31,32]. As such, these techniques also may not be practicable for regions with limited resources but requiring urgent actions.
However, statistical methods are more appropriate for forest fire susceptibility modeling in the case of large study areas, particularly in combination with Geographic Information System (GIS) technology [33]. GIS and Remote Sensing (RS) techniques make it considerably easy to collect and assess spatial data on large regions with different scales and resolutions [34,35]. Statistical methods are easily comprehensible and implementable, because they do not require specific tailor-made software. Statistical methods, such as Frequency Ratio (FR), quantitatively evaluate the correlation between conditioning factors and forest fire occurrence without involving any expert opinion in the analysis [36]. Conversely, qualitative methods like the Analytical Hierarchical Process (AHP) are based on knowledge of fire experts [37], but are also easily implementable if there is adequate knowledge of previous forest fire occurrences.
In this study, FR and AHP techniques were utilized for the spatial prediction of forest fire-prone areas based on a case study in Bhutan, which represents a data-poor country. Bhutan has more than 72% forest cover [38], which is the highest in the world in terms of proportion of land covered with forest. Every year, several forest fires are reported in various parts of the country. For instance, between 1993 and 2005, a staggering 868 forest fires were reported with 128,368 hectares of forested area reported to be burnt [39]. The country’s highly rugged terrain, which is compounded by a large accumulation of fuel load, poses significant challenges and risks in preventing and containing wildfires. Almost 30% of the country is covered with coniferous forest [40], which is considered as the most flammable forest type because of an accumulation of resin and dried needles [41]. Usually, the dry undercover of pine forests during sustained dry period that lasts for more than six months makes this forest type prone to wildfires. Repeated forest fires can potentially jeopardize sustainable management of Bhutan’s forests. Currently, there are no maps of forest fire-prone areas in Bhutan. This has greatly hindered the government, particularly the Department of Forests and Park Services, in developing an effective forest fire management strategy.
The main objective of this study is to generate forest fire-prone area maps and compare the efficiency of statistical-based and knowledge-based techniques to predict fire-prone areas, using the case of forest fire incidences in Bhutan. In addition, we test if Moderate Resolution Imaging Spectroradiometer (MODIS) fire points were reliable for predicting forest fires in the case of Bhutan. Using the outcome of this study, we intend to assist the Bhutan Government in forest fire prevention and management.

2. Methodology

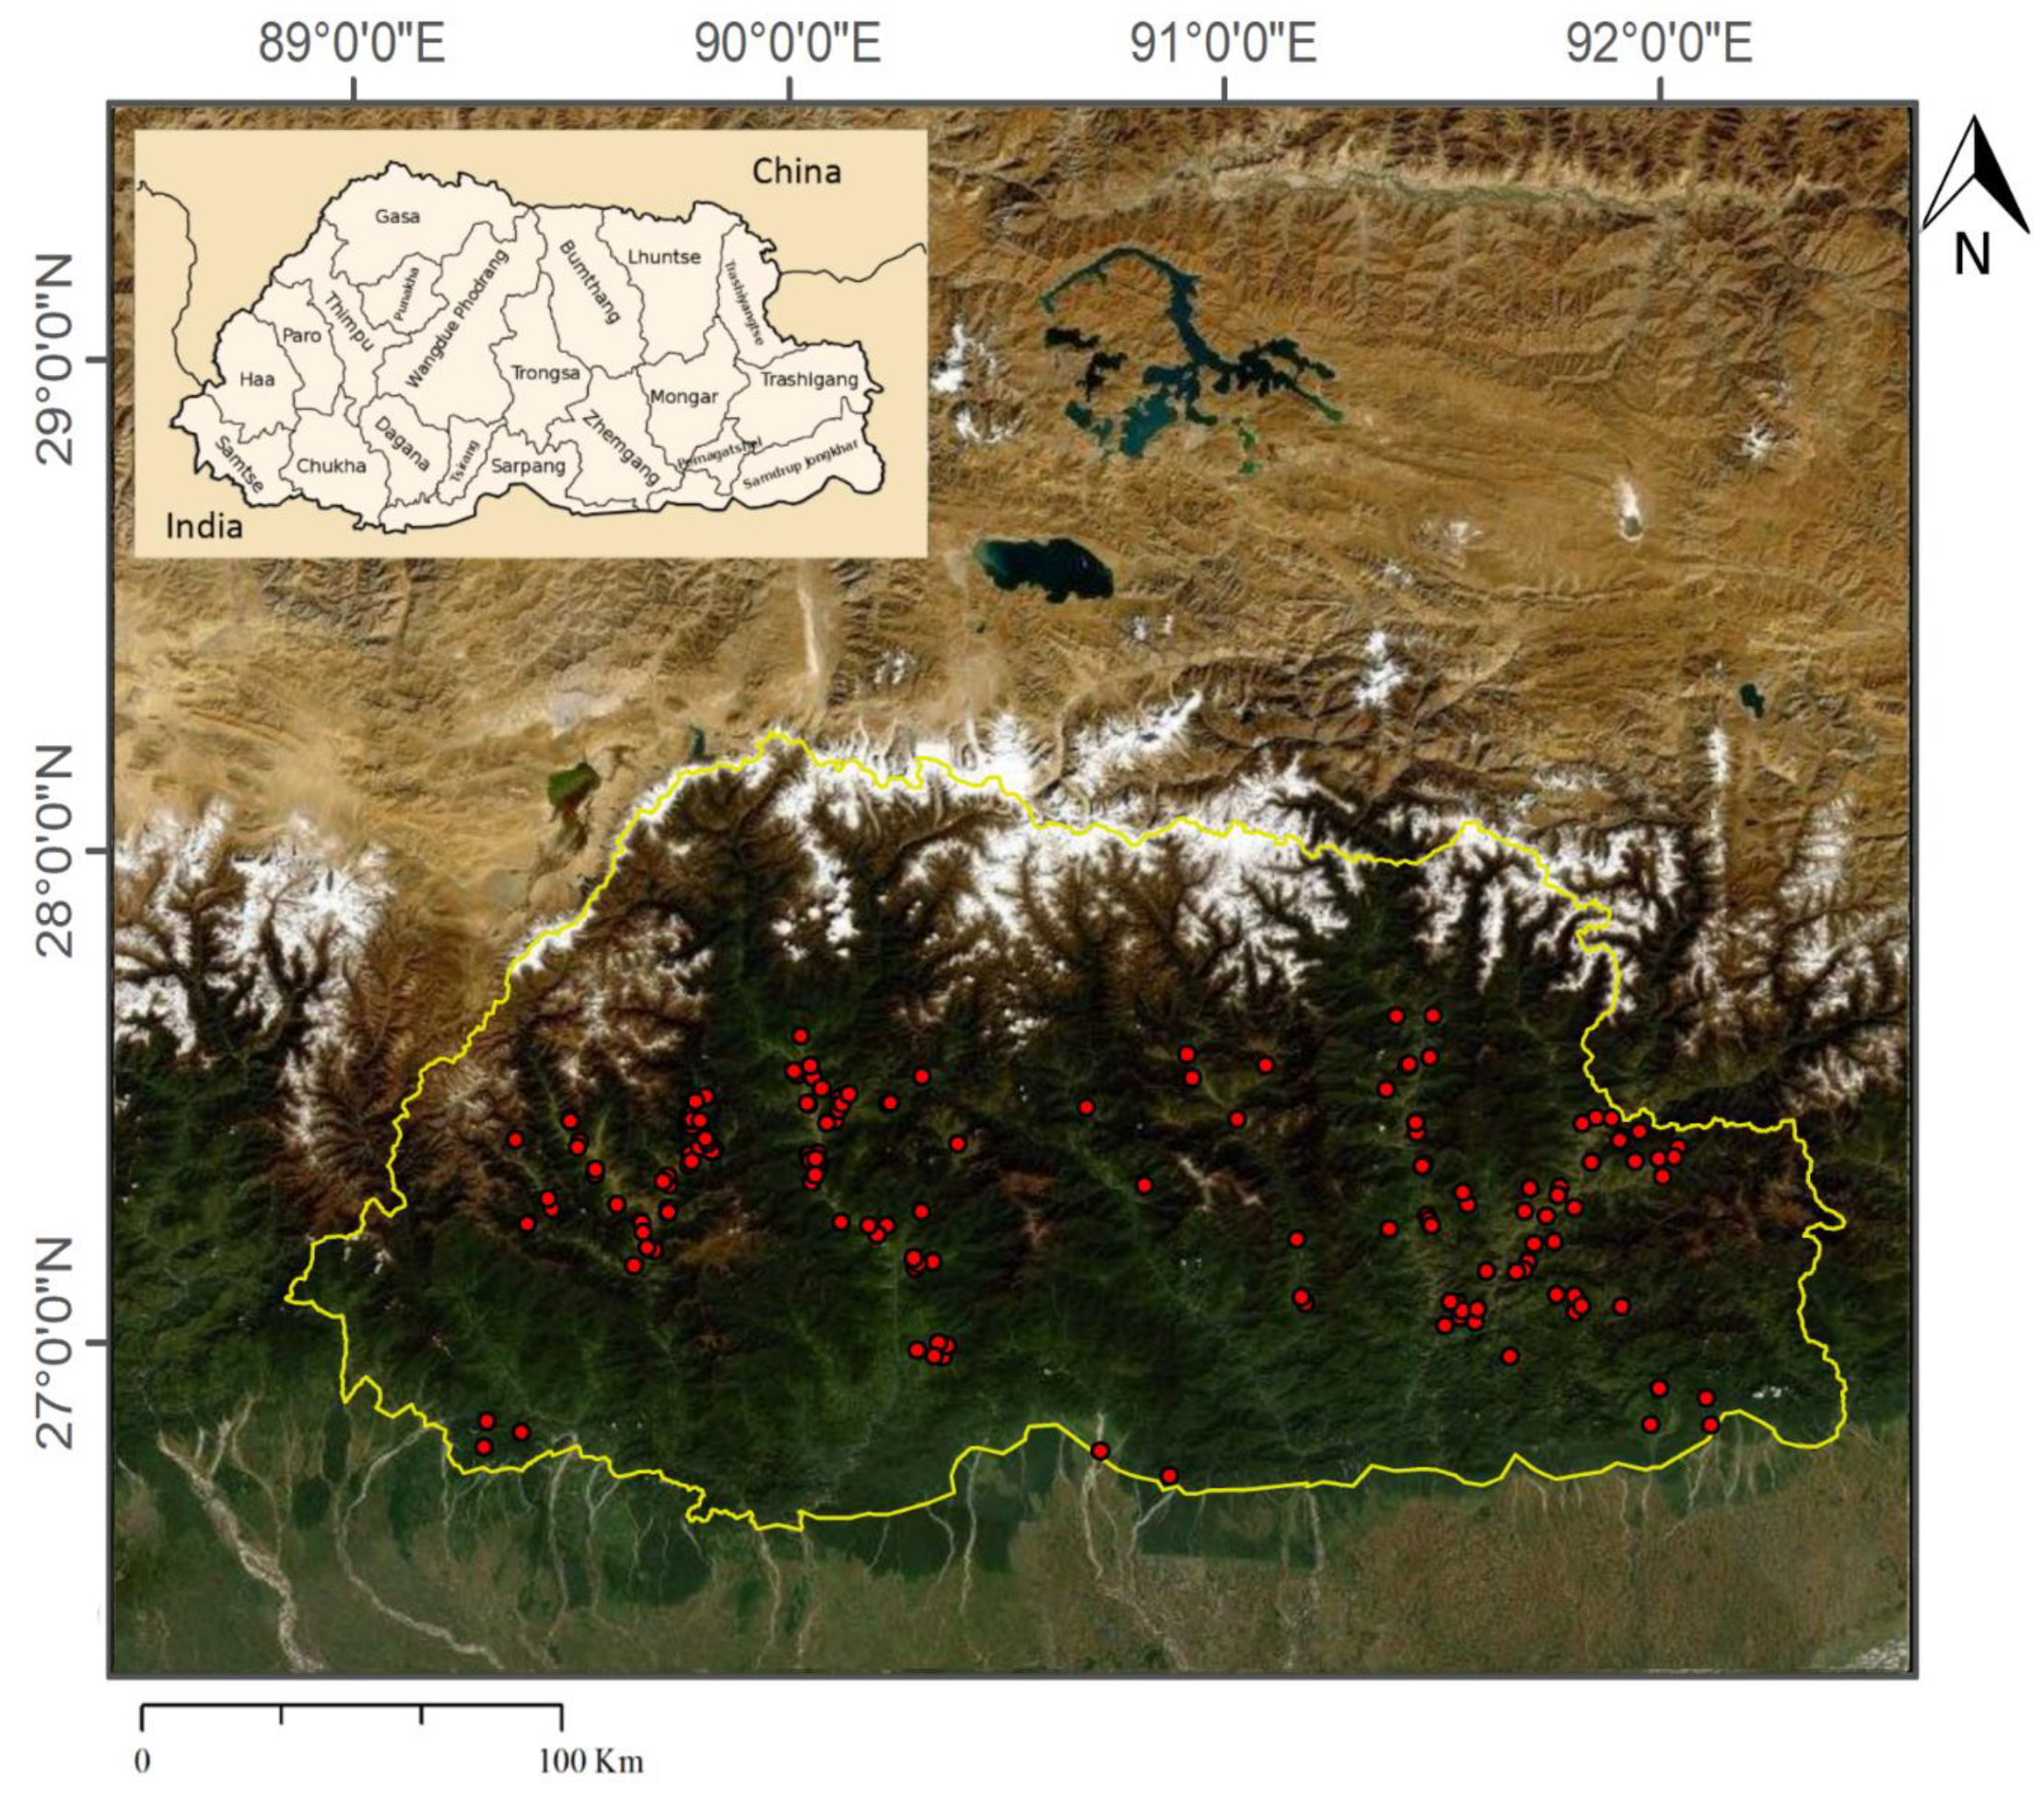
2.1. Study Area Description

Situated between 27° 30′ N latitude and 90°30′ E longitude and measuring approximately 38,394 km2 [NSB] [42], Bhutan is a Himalayan kingdom straddled between India and China, as shown in Figure 1. This tiny nation has 5369 plant species, 129 mammal species, 736 bird species, 125 fishes, 158 amphibian and reptile species, and 3966 invertebrate species (including 3511 insect species) [NBC] [43], all of which signify its importance in global and regional biodiversity conservation.
Geomorphologically, Bhutan is a highly mountainous country with approximately 95% of the total land situated 600 m above sea level (a.s.l), with landforms gradually rising from 97 m a.s.l. in the southern foothills to 7750 m a.s.l. in the northern snow-capped peaks [MoAF] [44]. The vegetation cover changes with elevation, with sub-tropical broadleaved forest occupying elevations below 1200 m a.s.l. and temperate cool broadleaved forests occupying elevations between 1200 and 2000 m a.s.l. Pine forests (with pure stands of blue pine Pinus wallichiana and sometimes mixed with oaks and rhododendron) are found between 1500 and 3200 m a.s.l., while mixed coniferous forests with stands of fir Abies densa, hemlock Tsuga dumosa, spruce Picea spinulosa, larch Larix griffithii, and juniper Juniperus indica occur between 2500 and 3500 m a.s.l. Pure stands of chirpine Pinus roxburghii are found in dry valleys between elevations of 1520 to 1860 m a.s.l. [45]. At higher elevations, sub-alpine forests (3300 to 3800 m a.s.l.) and alpine meadows (3800 to 4800 m a.s.l.) predominate. Areas above 4800 m a.s.l. are featured by alpine rocky outcrops, and those beyond 6000 m a.s.l. are permanently covered in snow [46]. The country has four seasons: spring (February to April), summer (May to July), autumn (August to October), and winter (November to January). Precipitation is mainly attributed to the summer monsoon which lasts from mid-April to mid-September. In terms of demography, Bhutan has a population of 733,003 people [NSB] [42], which is probably the lowest in Asia.

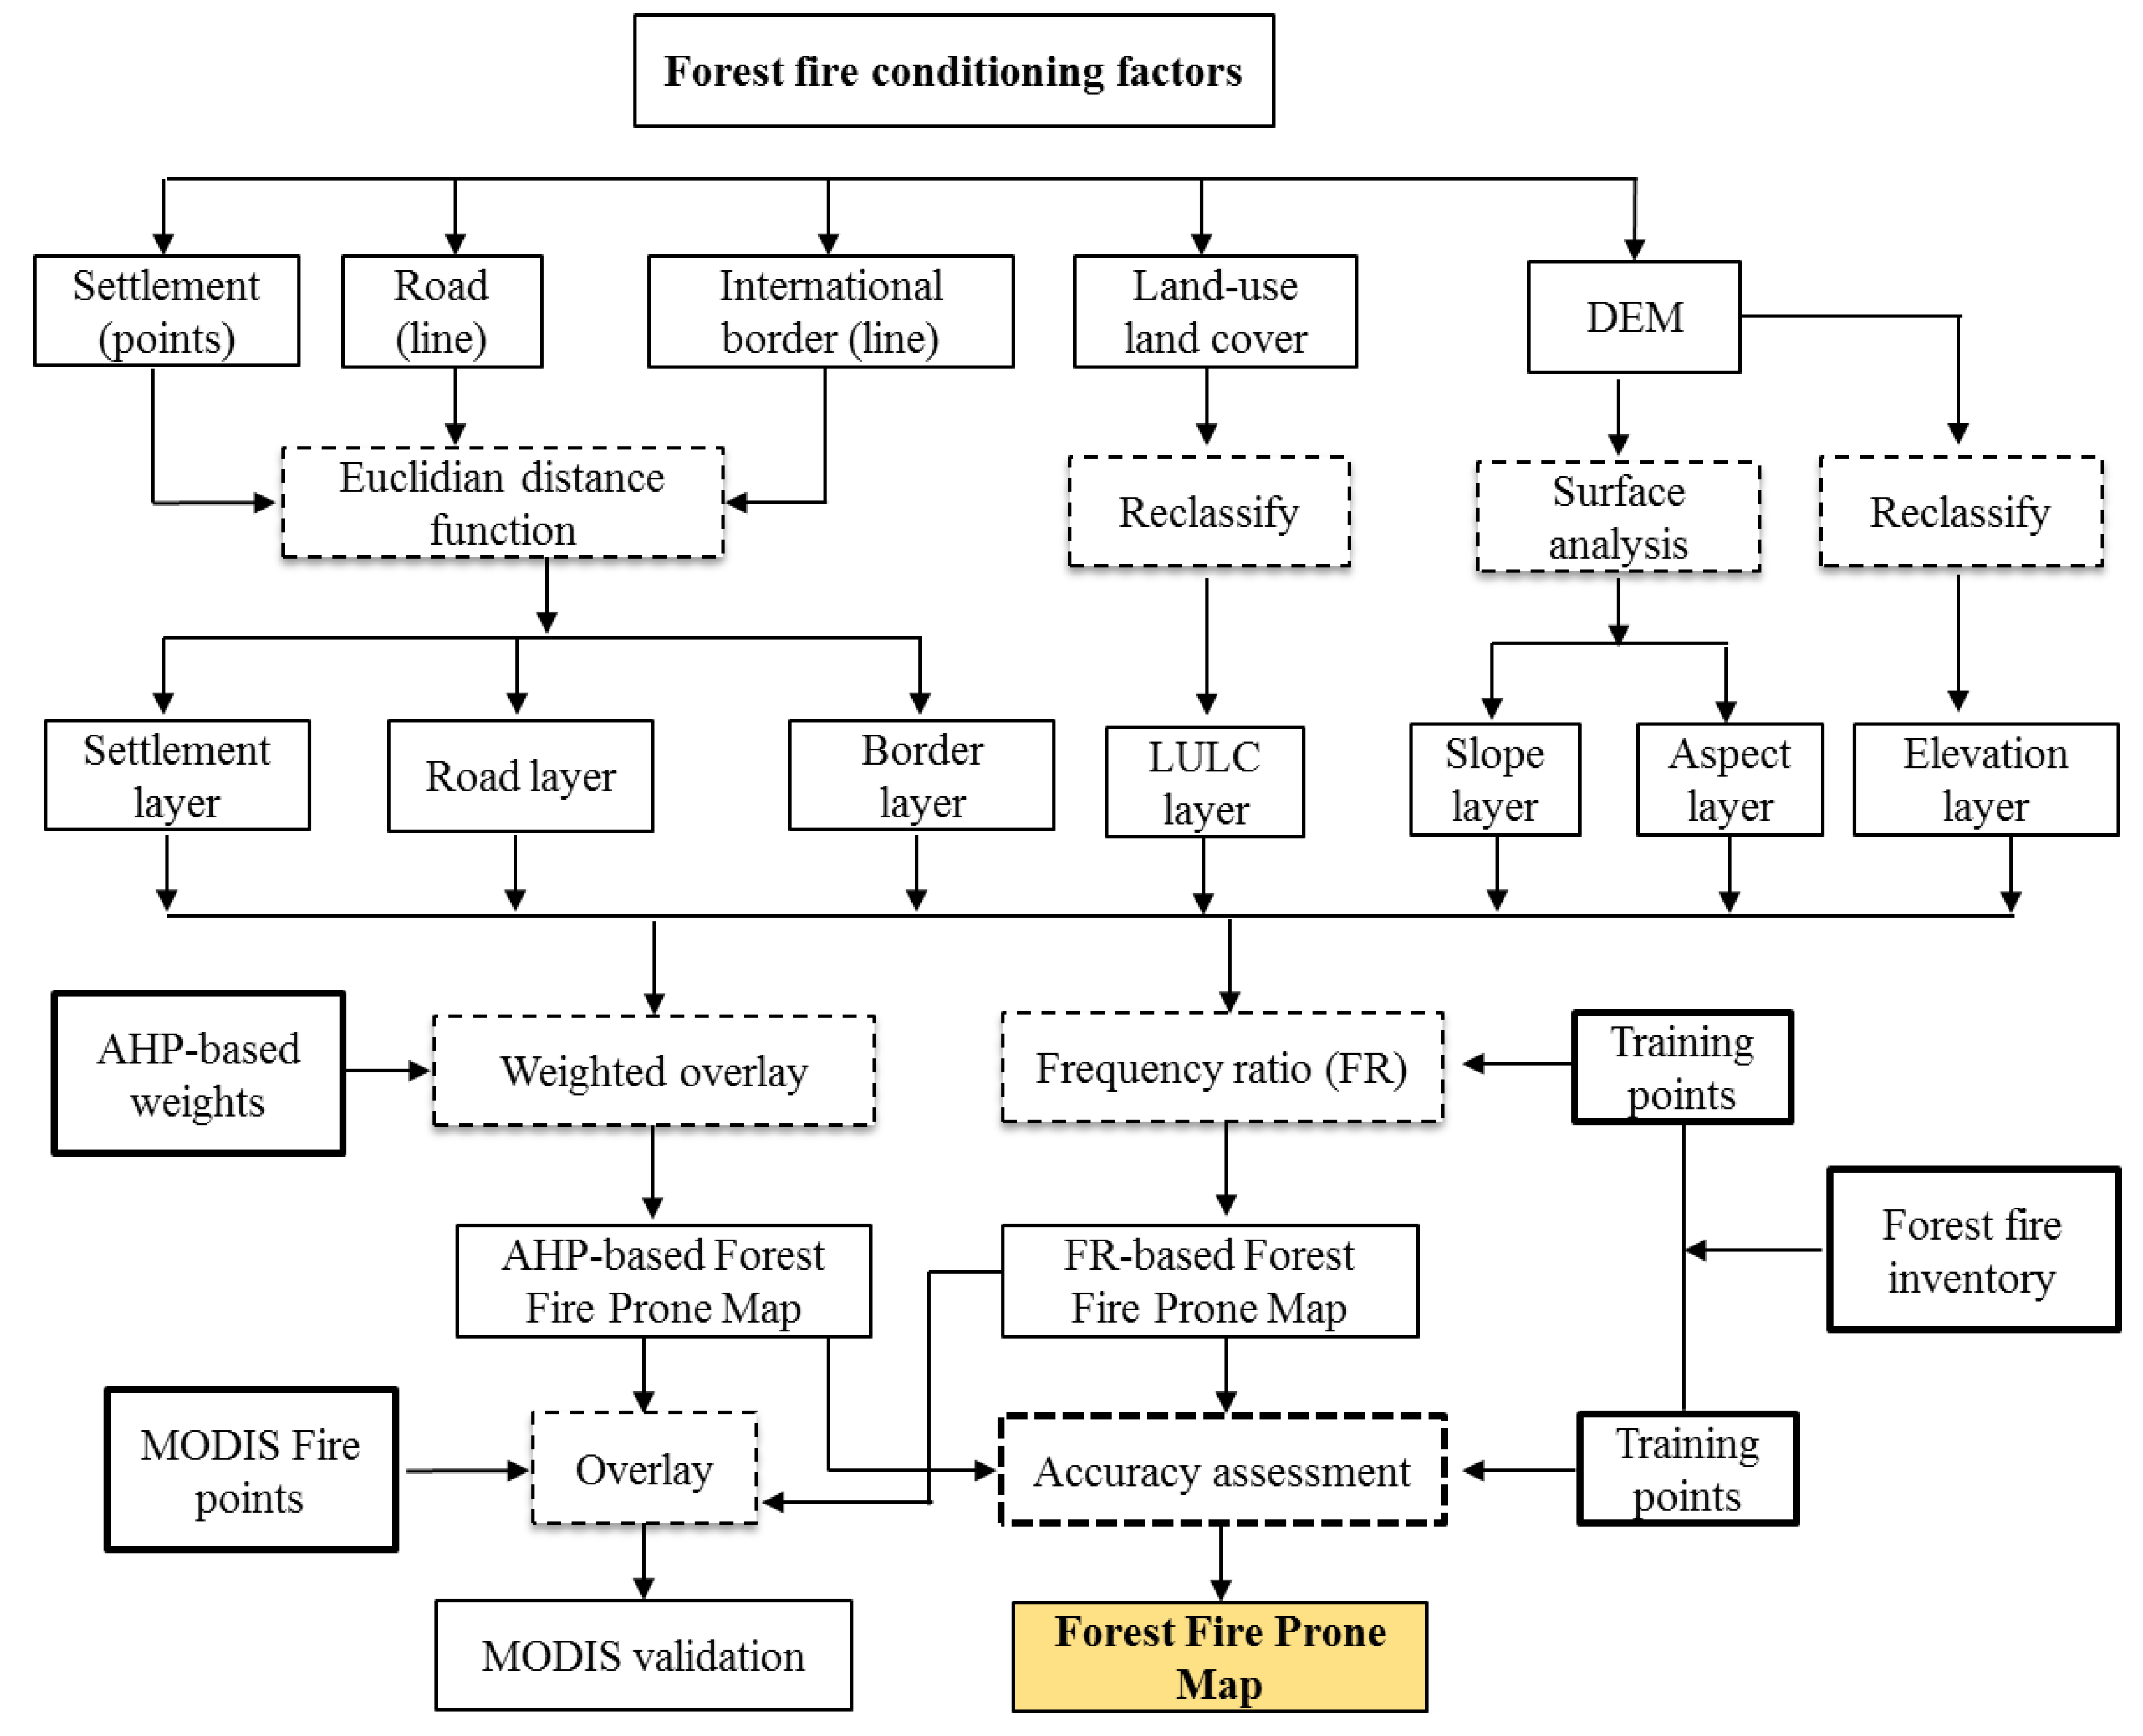
2.2. Forest Fire Modeling Flow Chart

The FR and AHP-based modeling were performed separately using forest fire inventory points recorded from 2013 to 2015 (as shown in Figure 1) maintained at the Forest Fire Management Section of the Department of Forests and Park Services. Two forest fire-prone maps were produced, and each map was assessed using the Area Under Curve (AUC) assessment technique. MODIS fire points were overlaid on the fire-prone maps. The step-by-step modeling flowchart is shown in Figure 2.

2.3. Data Used

2.3.1. Forest Fire Inventory

Forest fire-prone areas were detected by performing a correlation analysis between previous forest fire events and forest fire conditioning factors [47]. The first mandatory stage performed was to prepare a forest fire inventory map for which 177 historical fire locations, as shown in Figure 2, from three years (2013, 2014, and 2015) were gathered. These points were used for the FR technique in performing a correlation between previous forest fire events and their conditioning factors [47]. They were also used for accuracy assessment of fire-prone maps produced by both the techniques for which they were divided into training (n = 124; 70%) and testing (n = 53; 30%) datasets [20,48,49].

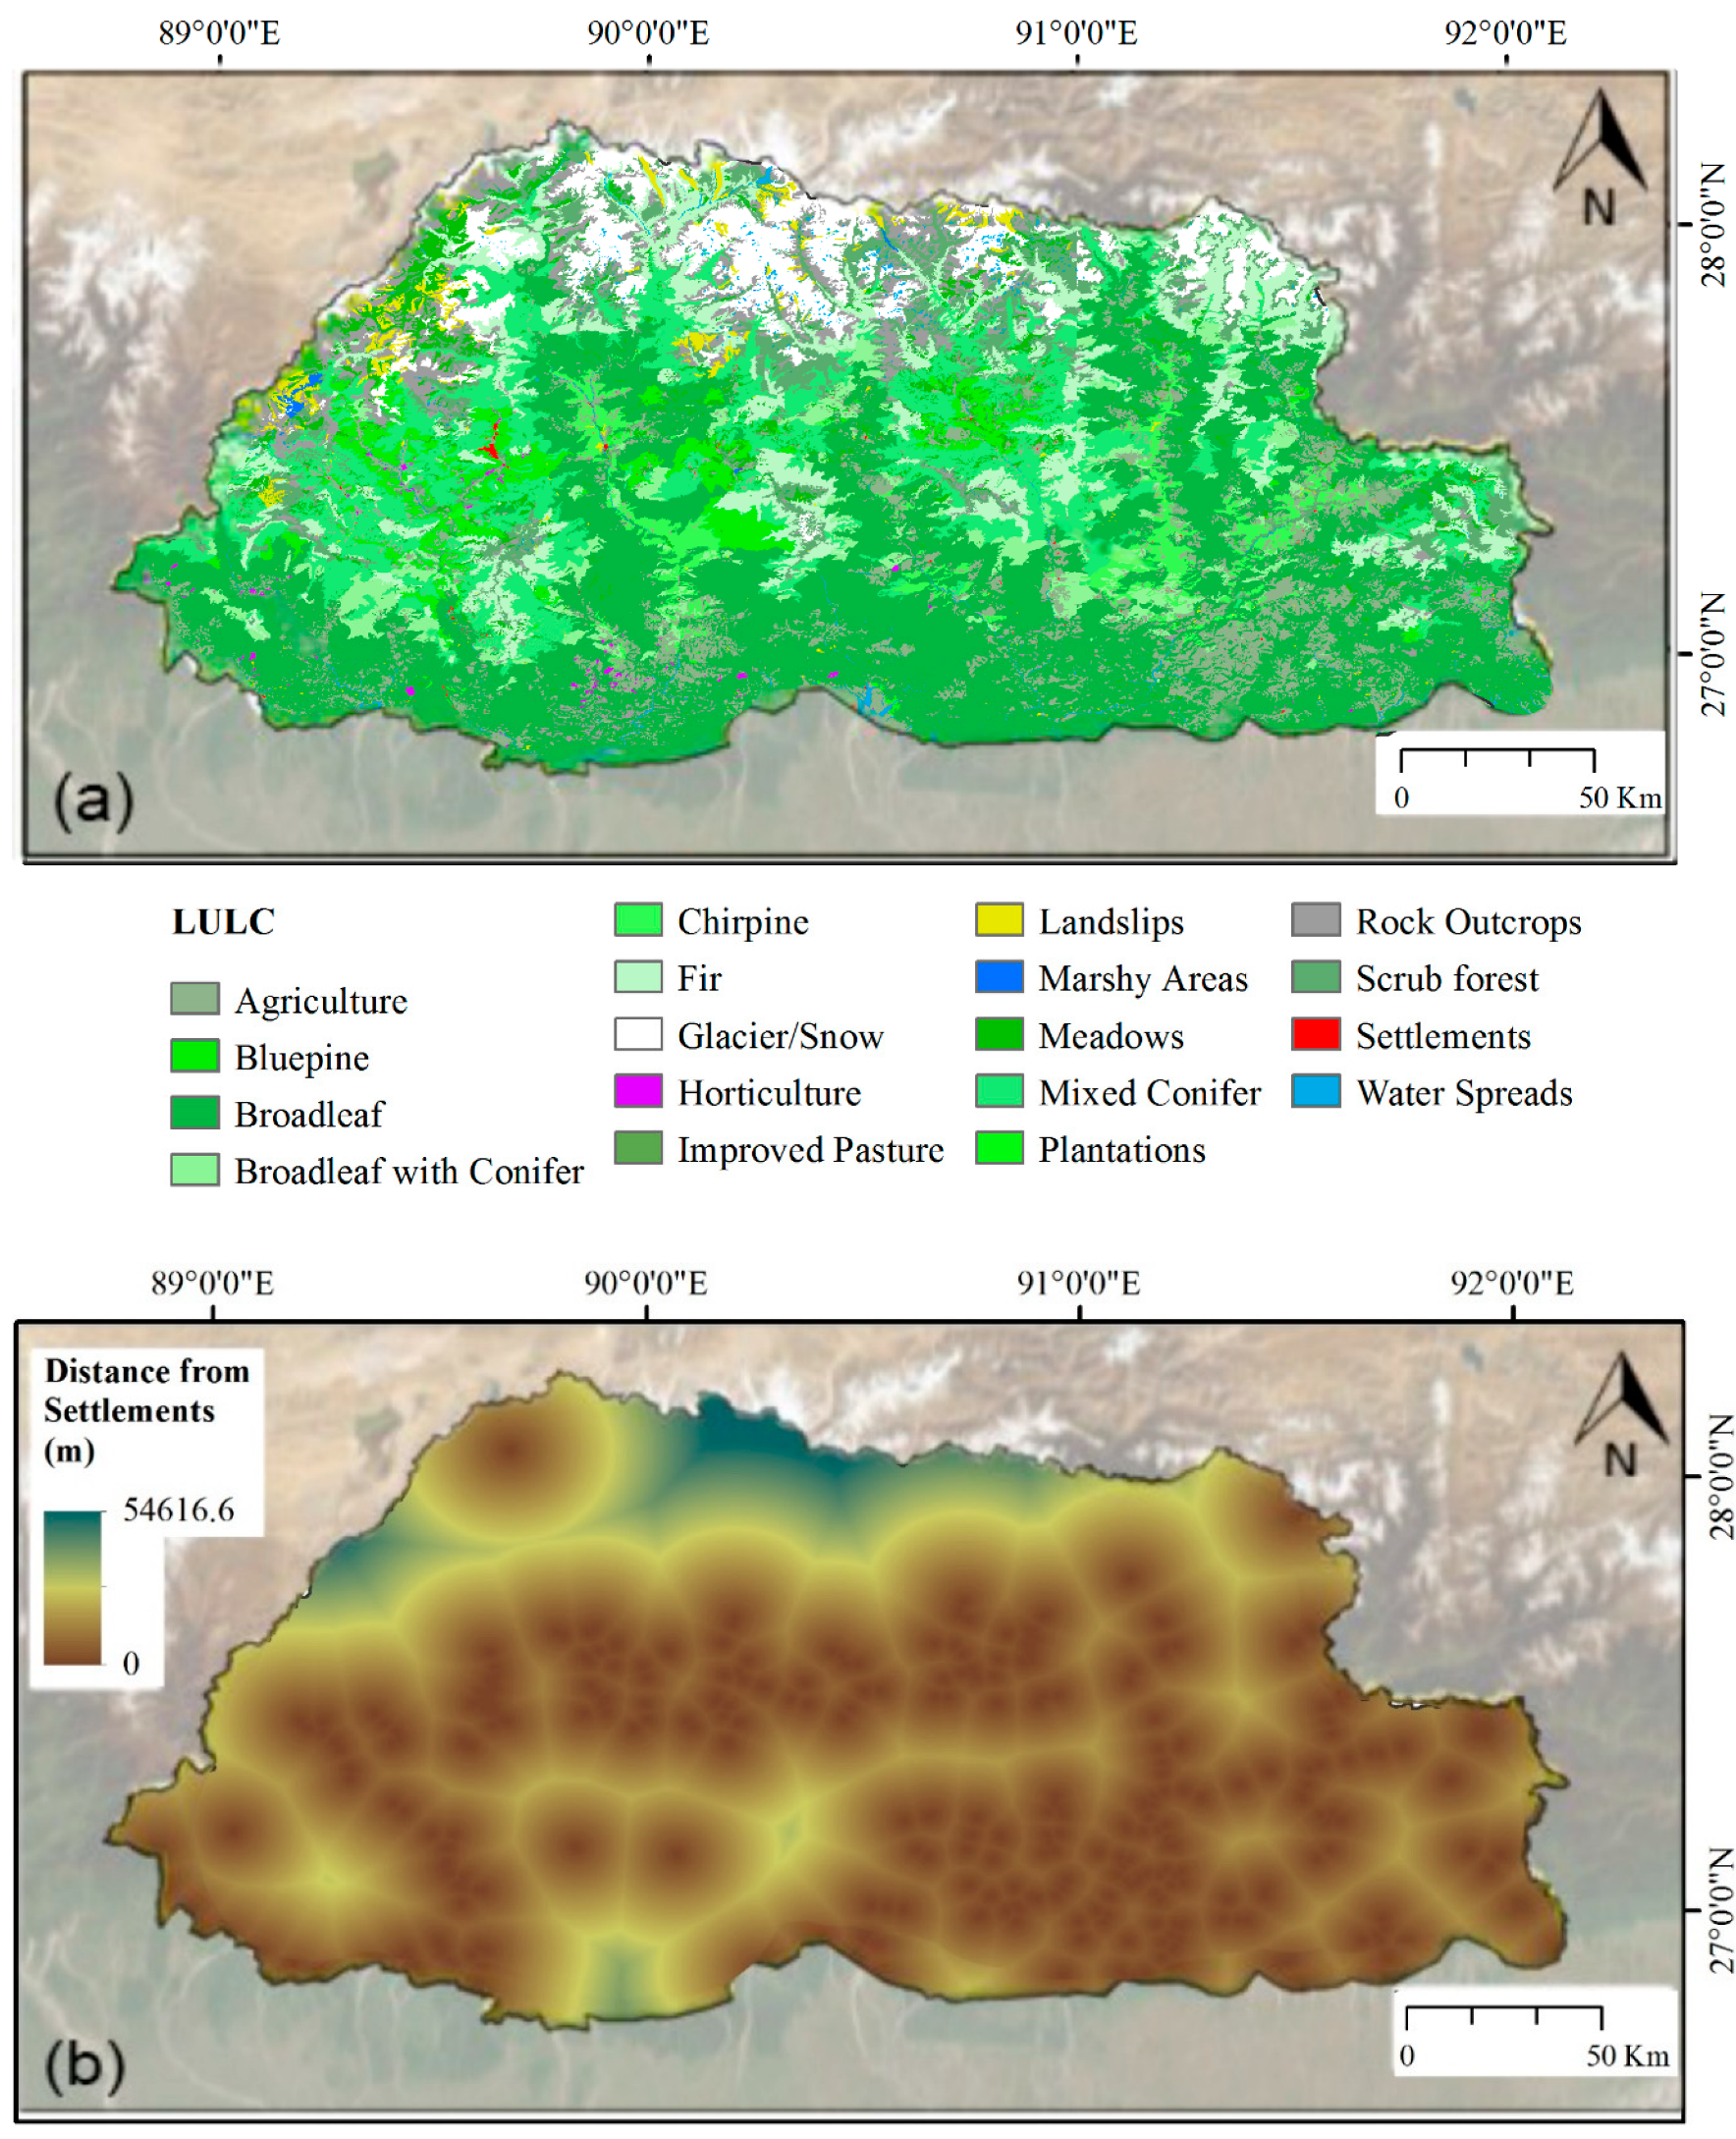
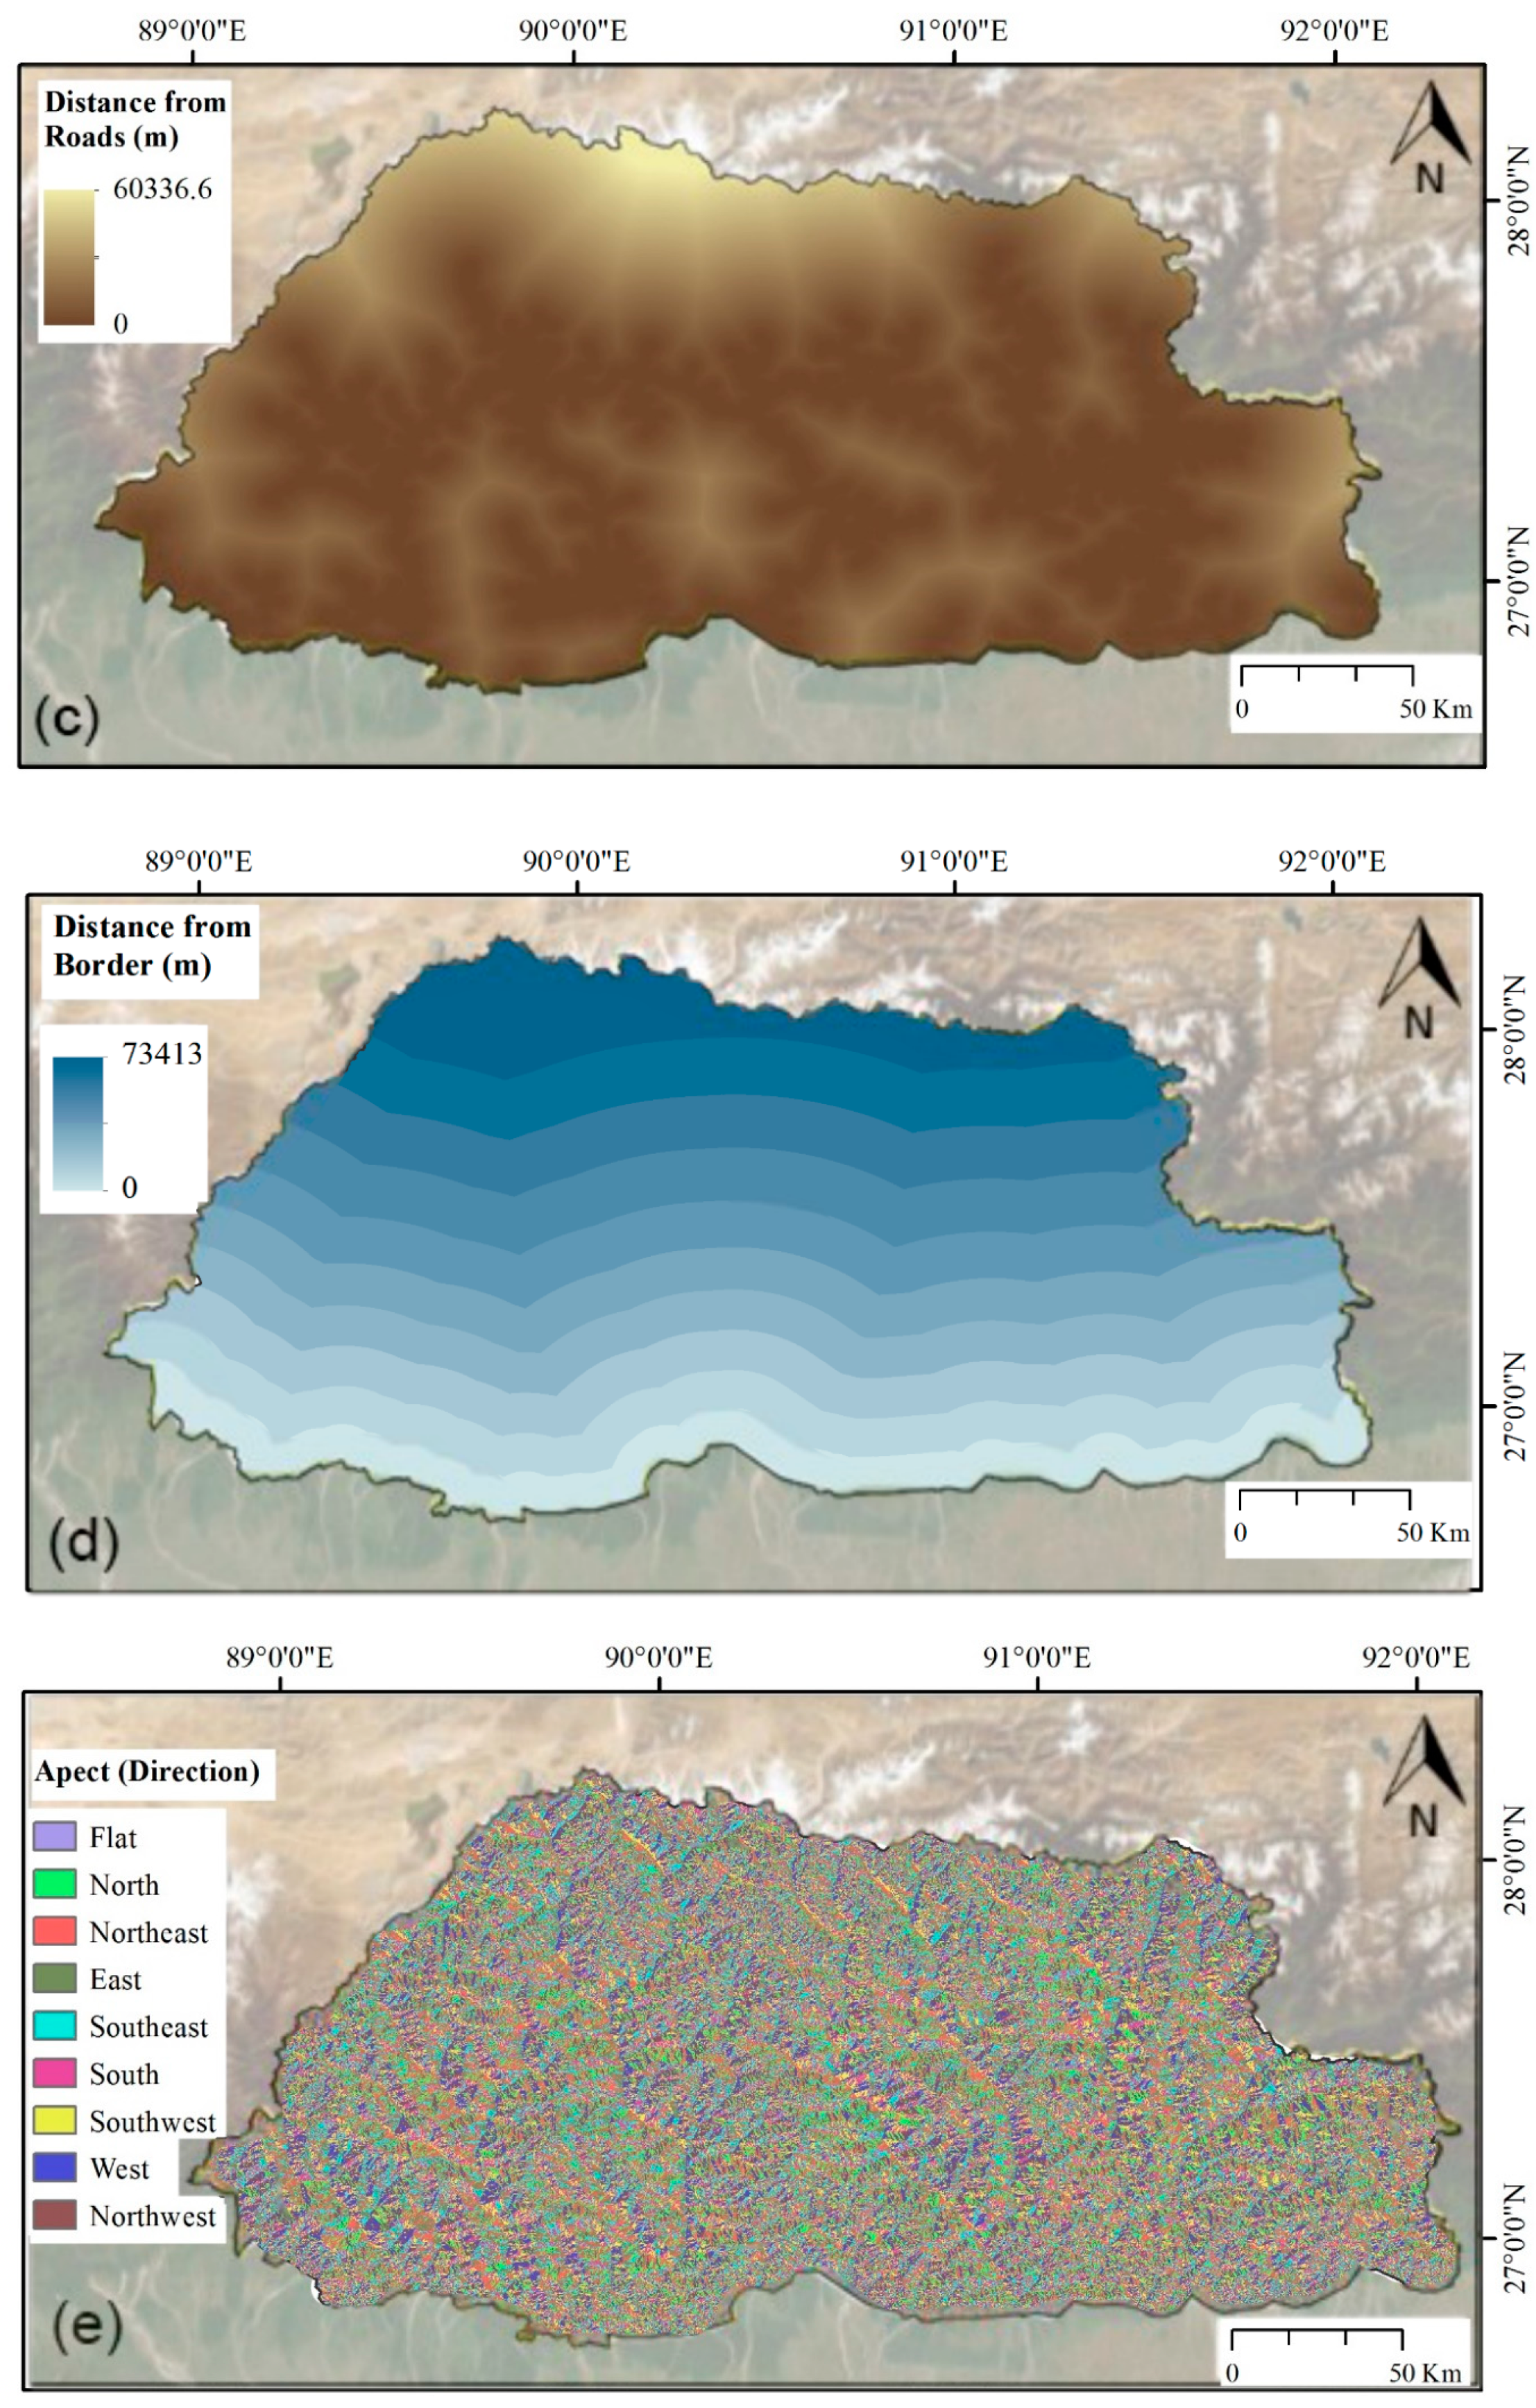
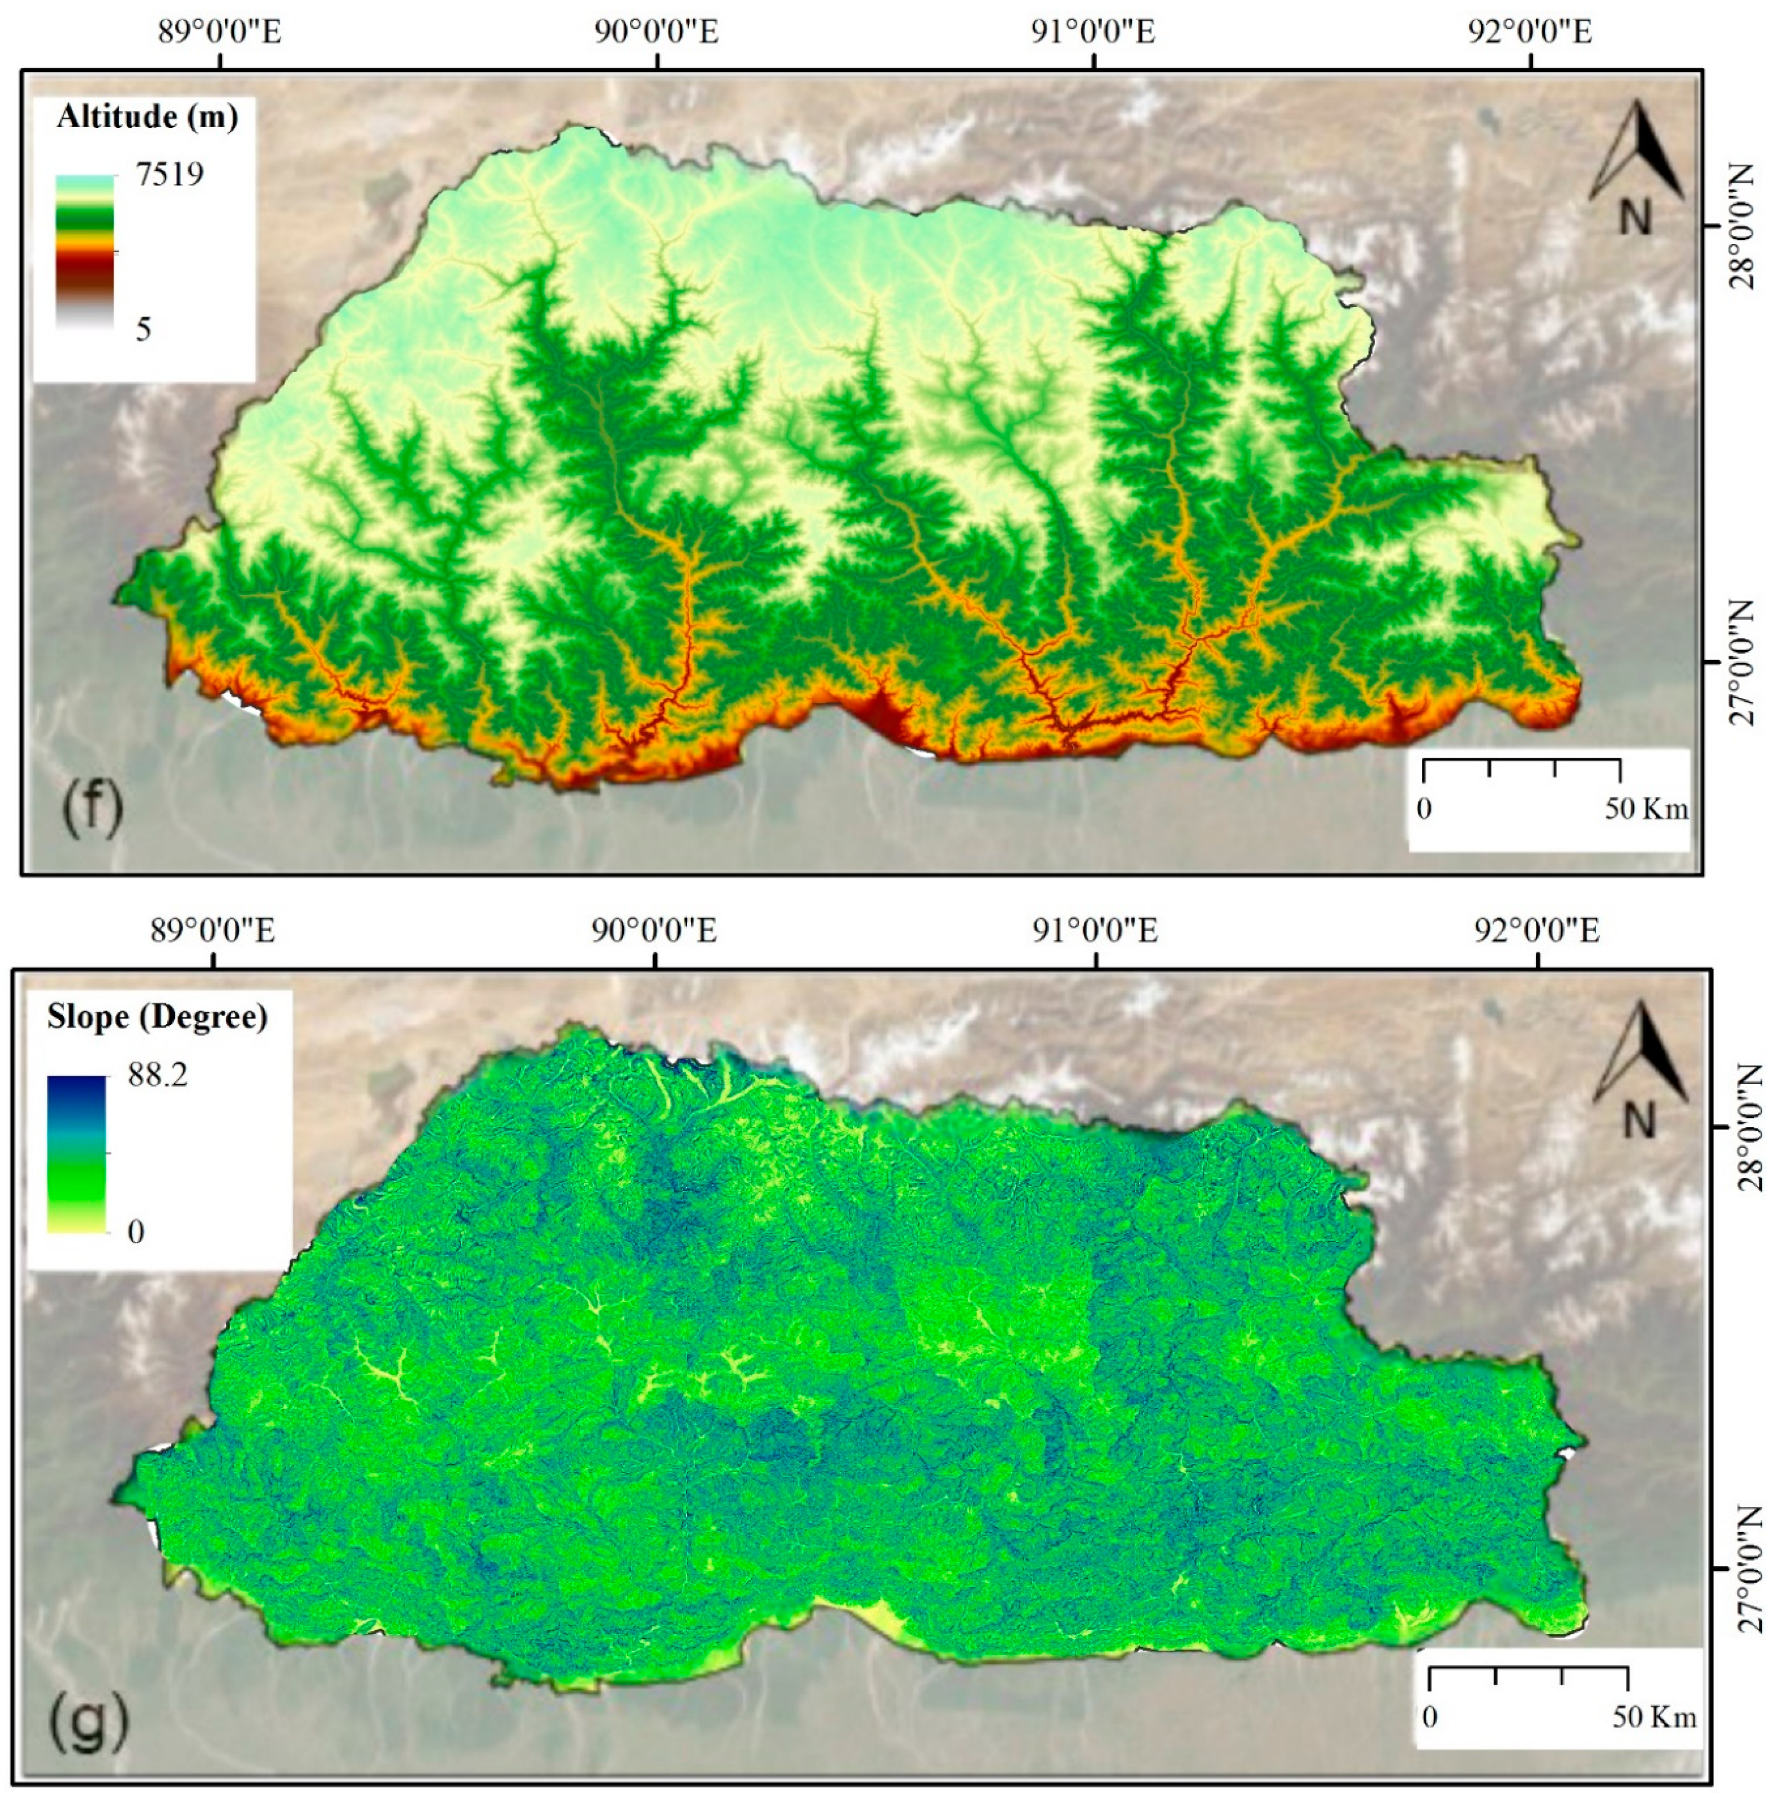
2.3.2. Forest Fire Conditioning Factors

A critical influential factor in the quality and precision of the final probability map is the proper selection of forest fire conditioning factors [50]. In this study, seven conditioning factors comprising Land-Use Land Cover (LULC), distance from road, distance from human settlement, elevation, slope, aspect, and distance from the southern international border (with India) were utilized, as shown in Figure 3. The selection of these factors was based on forest fire studies in the region, local knowledge on forest fire, and the availability of spatial layers [9,51,52,53,54,55].
Some spatial layers of these conditioning factors were obtained from offices of the Royal Government of Bhutan: the LULC map of Bhutan 2010 (in vector format) was obtained from the Policy and Planning Division; the road network map of Bhutan 2014 (in vector format) from the Department of Roads; and the human settlement map of Bhutan 2005 (in vector format) from the National Statistical Bureau. Three topographical factors of slope, aspect, and elevation were extracted from a Digital Elevation Model (DEM) for Bhutan created by Jarvis, Reuter [56]. All spatial input layers, including those in vector formats, were converted to a raster format with a standard cell size of 30 m × 30 m following the lowest resolution of the DEM. These input layers were classified prior to the analysis using the popular quantile method [57,58]. This is because FR and AHP evaluate the impact of each class on the forest fire occurrence separately.
Detailed steps in preparation of the input spatial layers for the AHP and their parameterization are described below. Local expert knowledge from field forest fire managers together with published literature were used to assign fire hazard values for the different classes of the spatial layers.
A LULC—The LULC map contained details of major forest types and other land use types found in Bhutan. As reported by Dorji [39], people deliberately set fire in chirpine forests for harvesting lemon grass Cymbopogon flexuosus. Since the frequency of forest fire is the highest in chirpine forests, it was assigned the highest fire hazard value, which was then followed by hazard values of blue pine forest and mixed broadleaved-conifer forest. Other land use types were rated as per their contribution to forest fire incidences, based on expert experience and records from past events, as shown in Table 1. Human land use activities could be ignition sources that induce forest fire susceptibility [59], and hence, agricultural lands were assigned higher hazard values compared to other non-forest land-use types.
B Settlement—Based on historical records of forest fires in Bhutan, most fires originated from agricultural lands and areas near human settlements. Thus far, more forest fires in the country have resulted from accidental escape from burning agricultural fields [DoFPS] [60]. Since forested areas located near settlements were highly vulnerable to fire [61], they were assigned high hazard values than those farther away, similar to the method employed by Opie, March [62] and Sivrikaya, Sağlam [63], as shown in Table 1.
C Roads—Most roads in Bhutan pass through highly forested areas. Roads influence forest fires during black-topping or surfacing by tar, which is conducted for new road construction and maintenance. Forest fires also occur when road travelers, either on foot or in vehicles, throw igniting substances such as un-extinguished cigarette butts [64]. Therefore, the presence of roads was deemed as increasing an area’s vulnerability to forest fire, and thus areas closer to roads were assigned higher hazard values, as shown in Table 1, similar to the approach used by Sowmya and Somashekar [65].
D International border—Frequent forest fires have been observed in areas near the international border with India, particularly in areas adjoining the Indian states of Assam, Arunachal Pradesh, and West Bengal [DoFPS] [60]. Wildlife managers and poachers deliberately light fires in these states to facilitate the growth of grasses for wild herbivores (Pers. Comm., Sonam Wangdi). Due to contiguous forest cover along many sections of the international border, such fires spread into Bhutan’s forests. Therefore, higher values were assigned to areas closer to the southern international border, as shown in Table 1.
E Aspect—Aspect has been widely used for forest fire modeling, because slope direction influences soil moisture and wind speeds that, in turn, affect fire behavior [66]. Moreover, in the northern hemisphere where Bhutan is located, south facing areas receive more sunlight which renders an area dry and prone to forest fire during dry seasons [67]. Hence, the highest hazard value was assigned to areas with a southerly aspect and the lowest to areas with a northerly aspect, as shown in Table 2.
F Elevation—Elevation is also considered as a factor influencing forest fire, as it indirectly influences evapotranspiration, temperature, humidity, and precipitation [50]. These conditions, in turn, determine an area’s susceptibility to forest fire. In Bhutan, most forest fires are known to occur frequently at lower elevations compared to higher elevations, and hence, higher hazard values were assigned to lower elevated areas, as shown in Table 2.
H Slope—Slope is a well-known contributing factor in forest fire susceptibility mapping. According to [61], fire travels faster up slope and slowly down slope, meaning the steeper the slopes, the faster the fire travels [68]. Therefore, steeper slopes were accorded higher hazard values, as shown in Table 2, similar to the methods applied by [67].

2.4. Modeling Forest Fire-Prone Areas

2.4.1. Analytic Hierarchy Process (AHP) Modeling

The AHP is a weight estimation technique that generates weights or ratio scales from paired comparisons [69]. It is widely used in Multi-Criteria Decision Analysis (MCDA), resource planning, and conflict resolution. AHP-based modeling has been used for forest fire hazard mapping in the south Asian region [37,70,71,72]. The AHP method basically employs a square matrix with ones on the (main) diagonal, weights on one side of the diagonal and reciprocal weights on the reverse side. In such a pair-wise comparison matrix, weightage of one factor over the other is assigned using a fundamental scale with numerical values ranging from 1/9 to 9 in the order of least comparative importance to highest comparative importance. It is during this step that expert knowledge on the subject matter becomes extremely useful. Expert knowledge was gathered from published literature, forest fire managers, field personnel, and field reports of forest fire incidences. Several rounds of consultations were held with forest fire managers to assign weights for an AHP matrix. Consistency of the weight matrix was measured by a Consistency Ratio (CR), which measures divergence of the weights from a principal eigenvalue. Recalibration of the weights was needed whenever the CR was greater than 0.10 (or 10%). Once a consistent matrix was obtained, a vector of relative weights for each factor was produced. In this study, a 7 × 7 AHP matrix was used, as shown in Table 3. A highly consistent CR value of 0.05 was obtained, and the relative weights were subsequently produced, as shown in Table 4. The highest weightage (45%) was assigned to the LULC layer, followed by the settlement layer (19%) and road layer (12%). The lowest weightage (4%) was assigned to the slope layer. These weights were used as the percentages of influence of each layer in the ‘weighted overlay’ process in ArcGIS to produce a map of forest fire-prone areas.

2.4.2. Frequency Ratio (FR) Modeling

The FR can be defined as the probability of occurrence of a specific attribute [73]. Higher FR weights illustrate a high relationship among that class and forest fire occurrence [74]. For modeling of forest fire-prone areas, an FR was used to extract the quantitative relationship between forest fire occurrence points and the seven forest fire conditioning factors. The FR-based modeling is a popular approach for computing the probabilistic relationship between a specific phenomenon and a set of contributing factors involved in the creation of a spatial layer of that phenomenon [75].
The following equation for the FR was used:
F R i = ( A i / B i ) / ( H i / L ) = P i / K
where:
  • F R i   = frequency ratio of a class for the i t h conditioning factor;
  • A i = area of a class for the   i t h conditioning factor;
  • B i = total area of the i t h   conditioning factor;
  • H i = number of pixels in each class of the i t h factor;
  • L = number of total pixels in the study area;
  • P i = the percentage for area with respect to a class for the i t h factor; and
  • K = is the percentage for the entire domain.

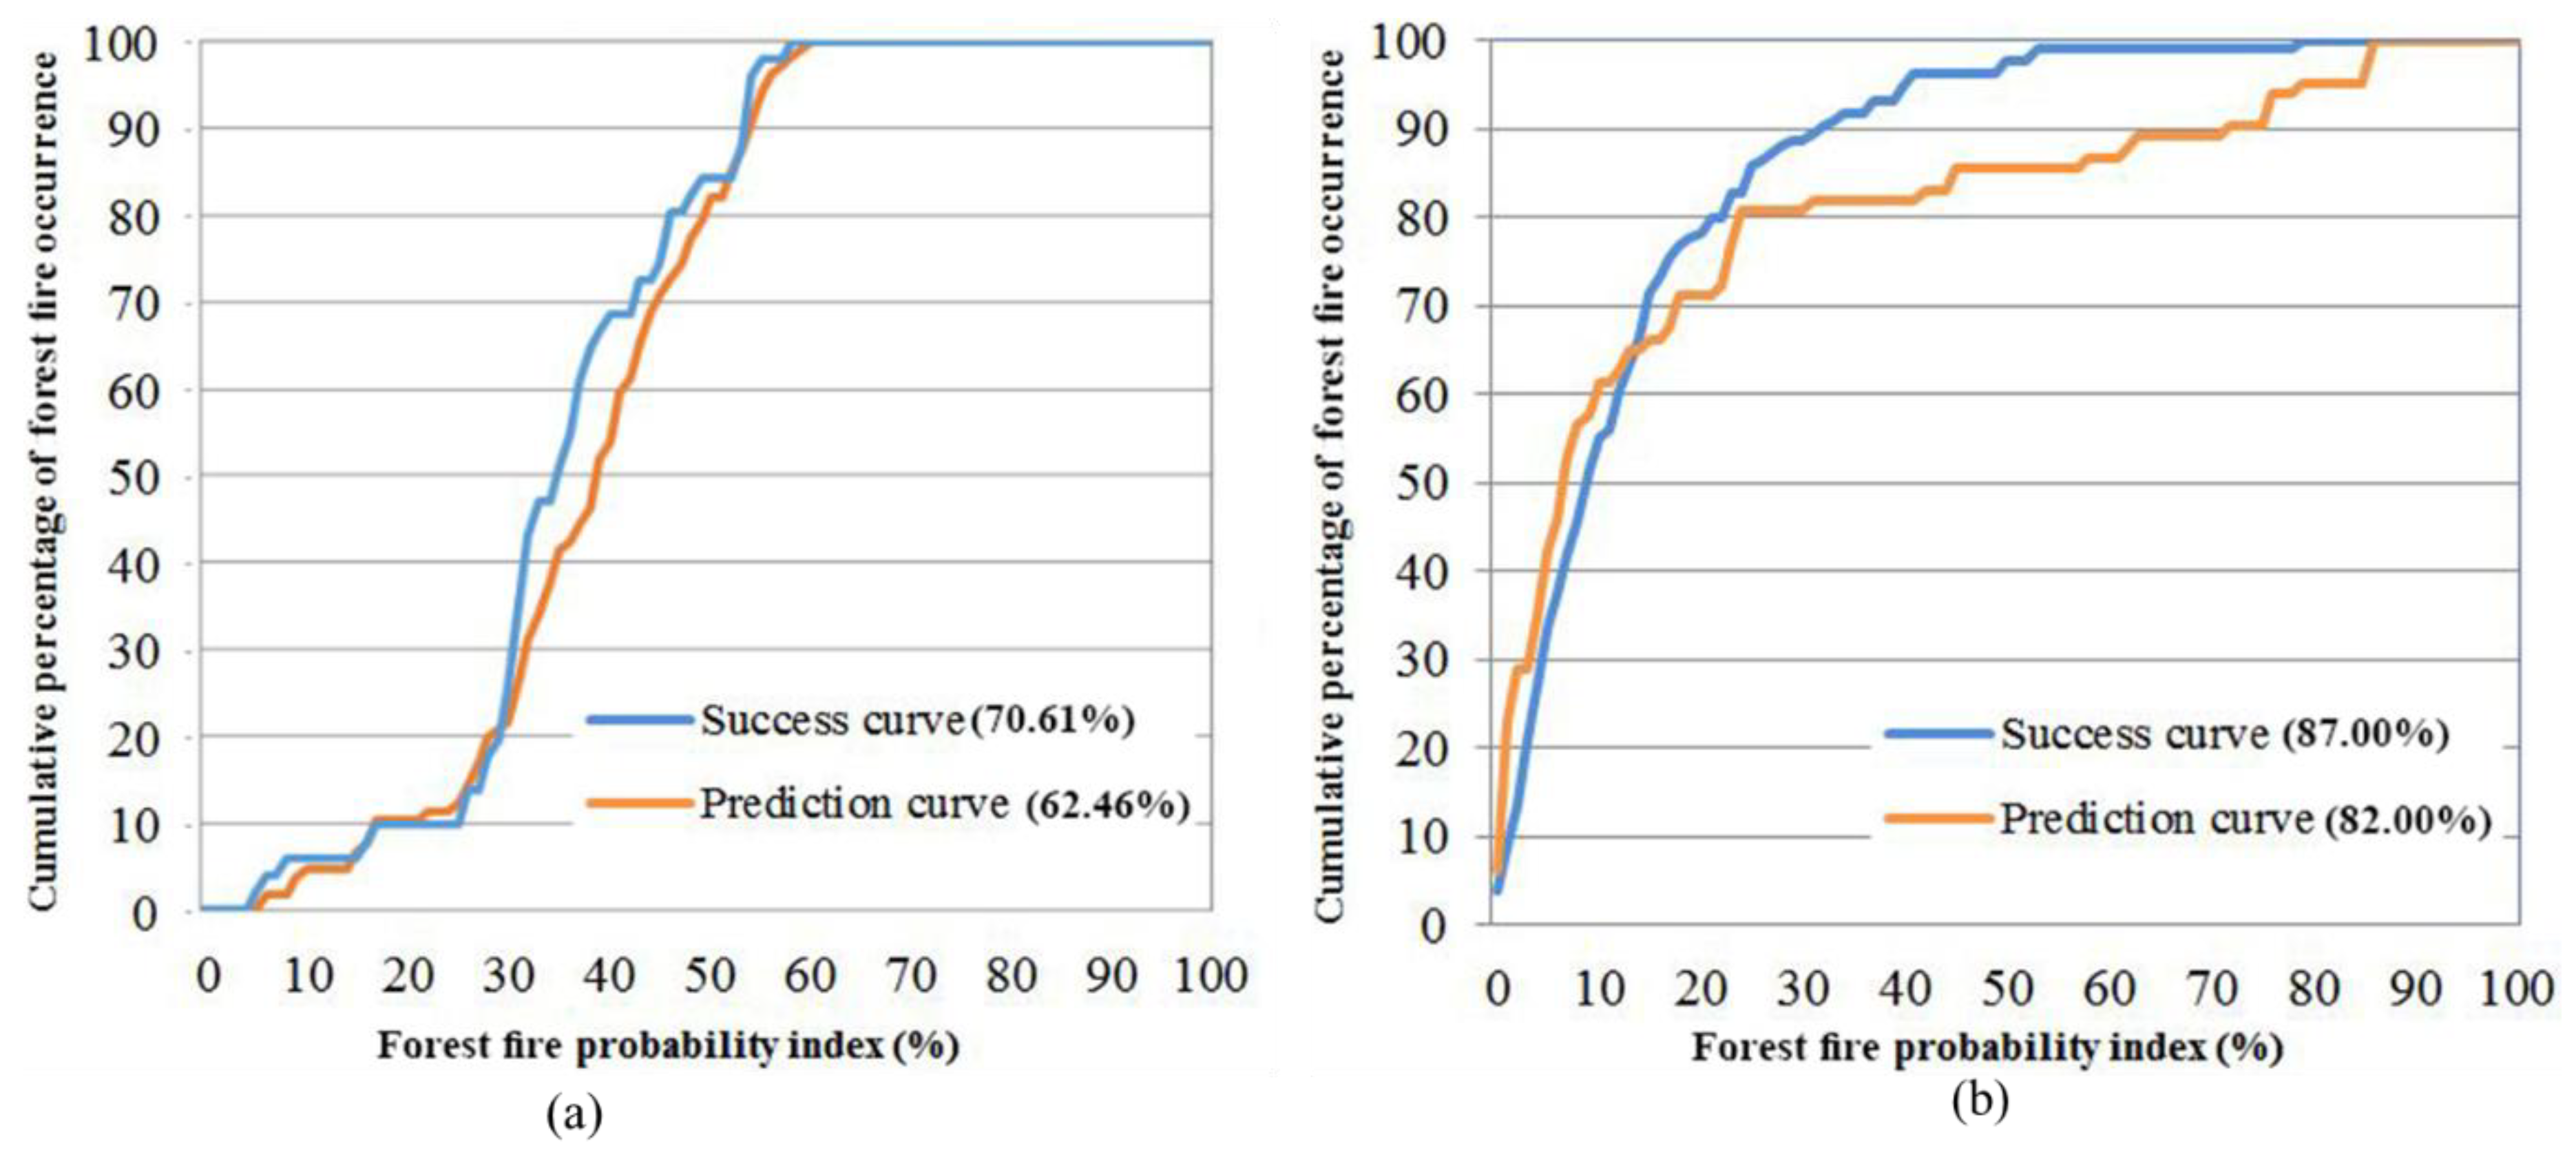
2.5. Accuracy Assessment of Model Outputs

The Area Under Curve (AUC) is an intuitive and comprehensive tool to evaluate the reliability and precision of the model outcomes [76]. The AUC method has been broadly applied in several studies to evaluate the efficiency of susceptibility mapping. It starts with dividing the forest fire probability map into equal area categories and then ranking them from a minimum to a maximum value. Curve creation is implemented by plotting the cumulative percentage of forest fire susceptible areas on the ‘x’ axis and the cumulative percentage of forest fire events on the ‘y’ axis. Prediction and success rate are two outputs of the AUC method [77]. The success and prediction curves determine the percentage of fire occurrence points in each probability category. The validation process was undertaken by comparing the existing forest fire inventory data with the model derived forest fire-prone areas maps. The AUC values range from 0.5 to 1.0 such that values closer to or equal to 0.5 indicate very poor fit or classification by chance, whereas those closer to or equal to 1 indicate perfect fit or perfect classification [78]. The success rate outcome was attained using the forest fire training dataset (70% of the inventory forest fire points). The real proficiency of the model output can be tested using the prediction rate, which was implemented using the test dataset (30% of the inventory forest fire points). This is because the prediction capability of the model cannot be achieved using the training data. The prediction rate shows how well the model can predict the forest fire proneness or susceptibility of an area.

2.6. Validation of MODIS Fire Points with Model Outputs

MODIS is a remote sensing sensor with fire detection capability mounted on two satellites that were launched in December 1999 and May 2002 by the National Aeronautics and Space Administration (NASA), USA. Each of these satellites records two fire observations daily, resulting in four daily observations [79]. The MODIS system carries out automated data acquisition, processing, reporting, and feedback on fire locations. It provides location information at 1 km × 1 km resolution on active fires present during the satellite’s hover across an area, twice in a day. The International Center for Mountain Development (ICIMOD), based in Nepal, has the ground receiving station, launched in January 2011, which is convenient for the south Asian countries to acquire data when required. The MODIS fire points from 2000 to 2013 for Bhutan were obtained from the ICIMOD. The detection algorithm identifies pixels with one or more actively burning fires that are commonly referred to as “fire pixels”. Each detected fire represents the center of a 1 km pixel that contains one or more fire hotspots. The actual pixel size varies depending on the location of an observation in the swath [80]. In this study, the MODIS points were overlaid on each of the forest fire-prone maps produced by the FR and AHP-based models. The number of points overlapped with each of the fire-prone categories were measured to determine the reliability of MODIS satellites and fire points in predicting forest fire-prone areas.

3. Results

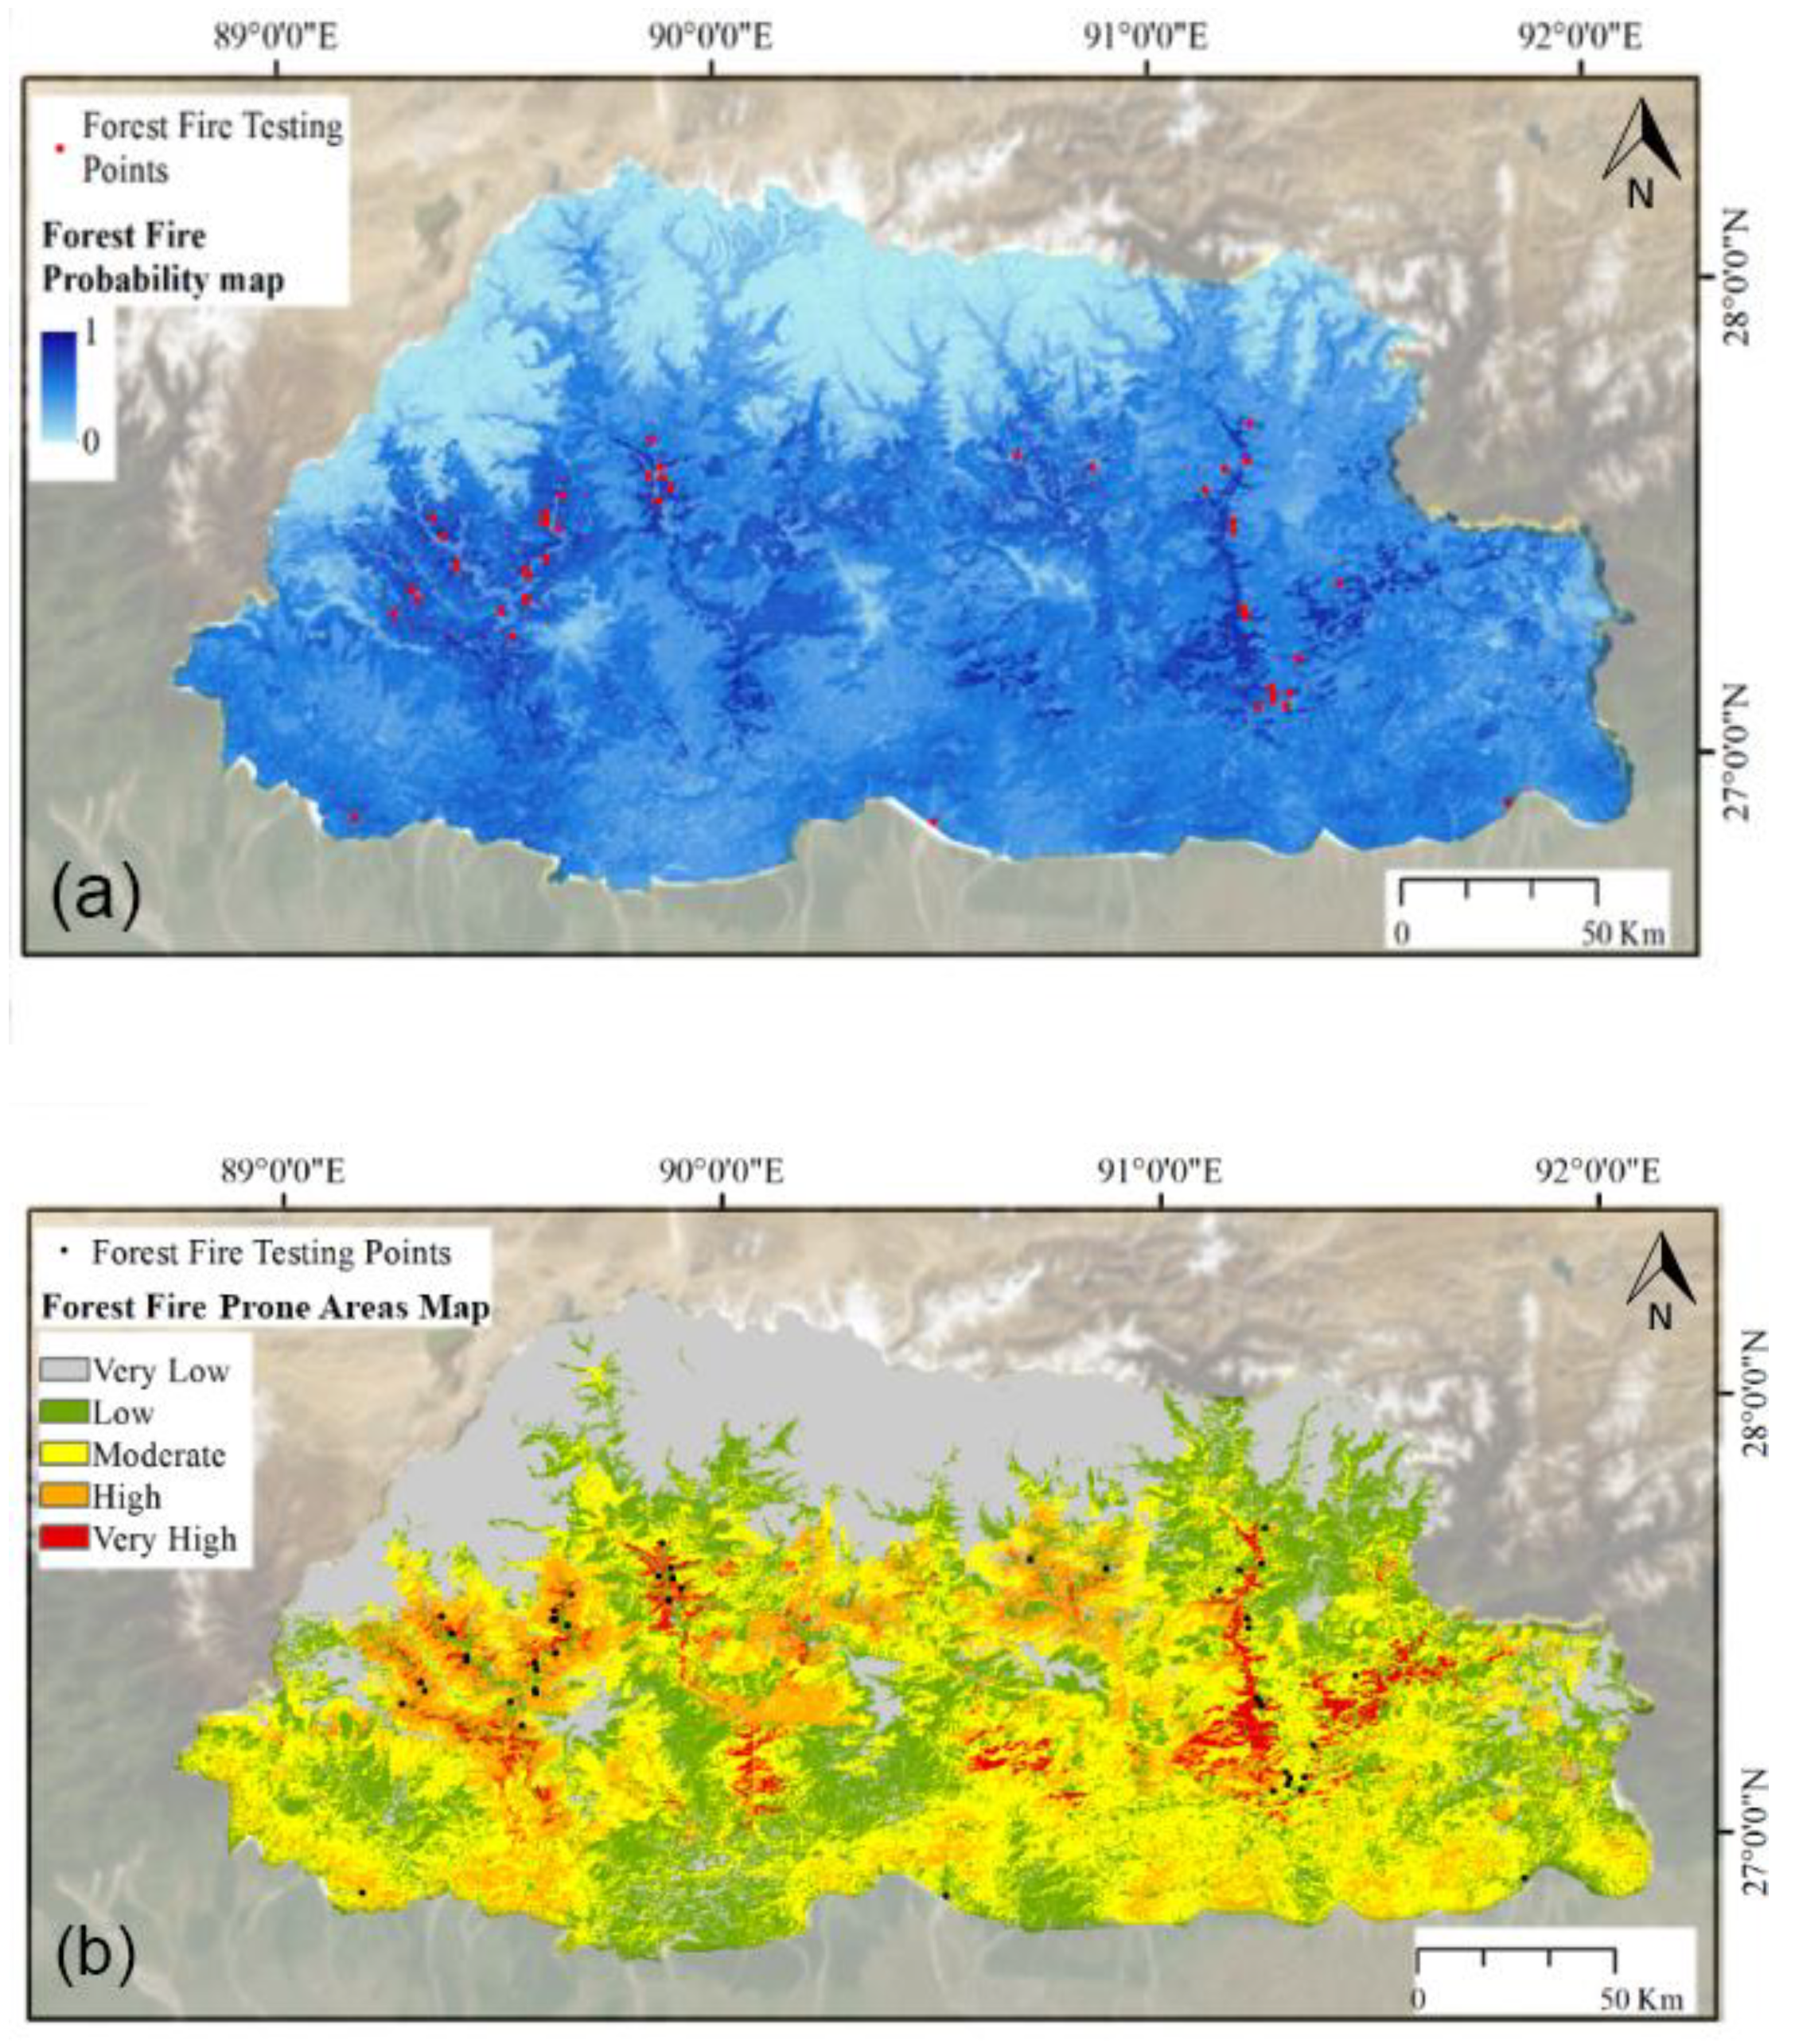
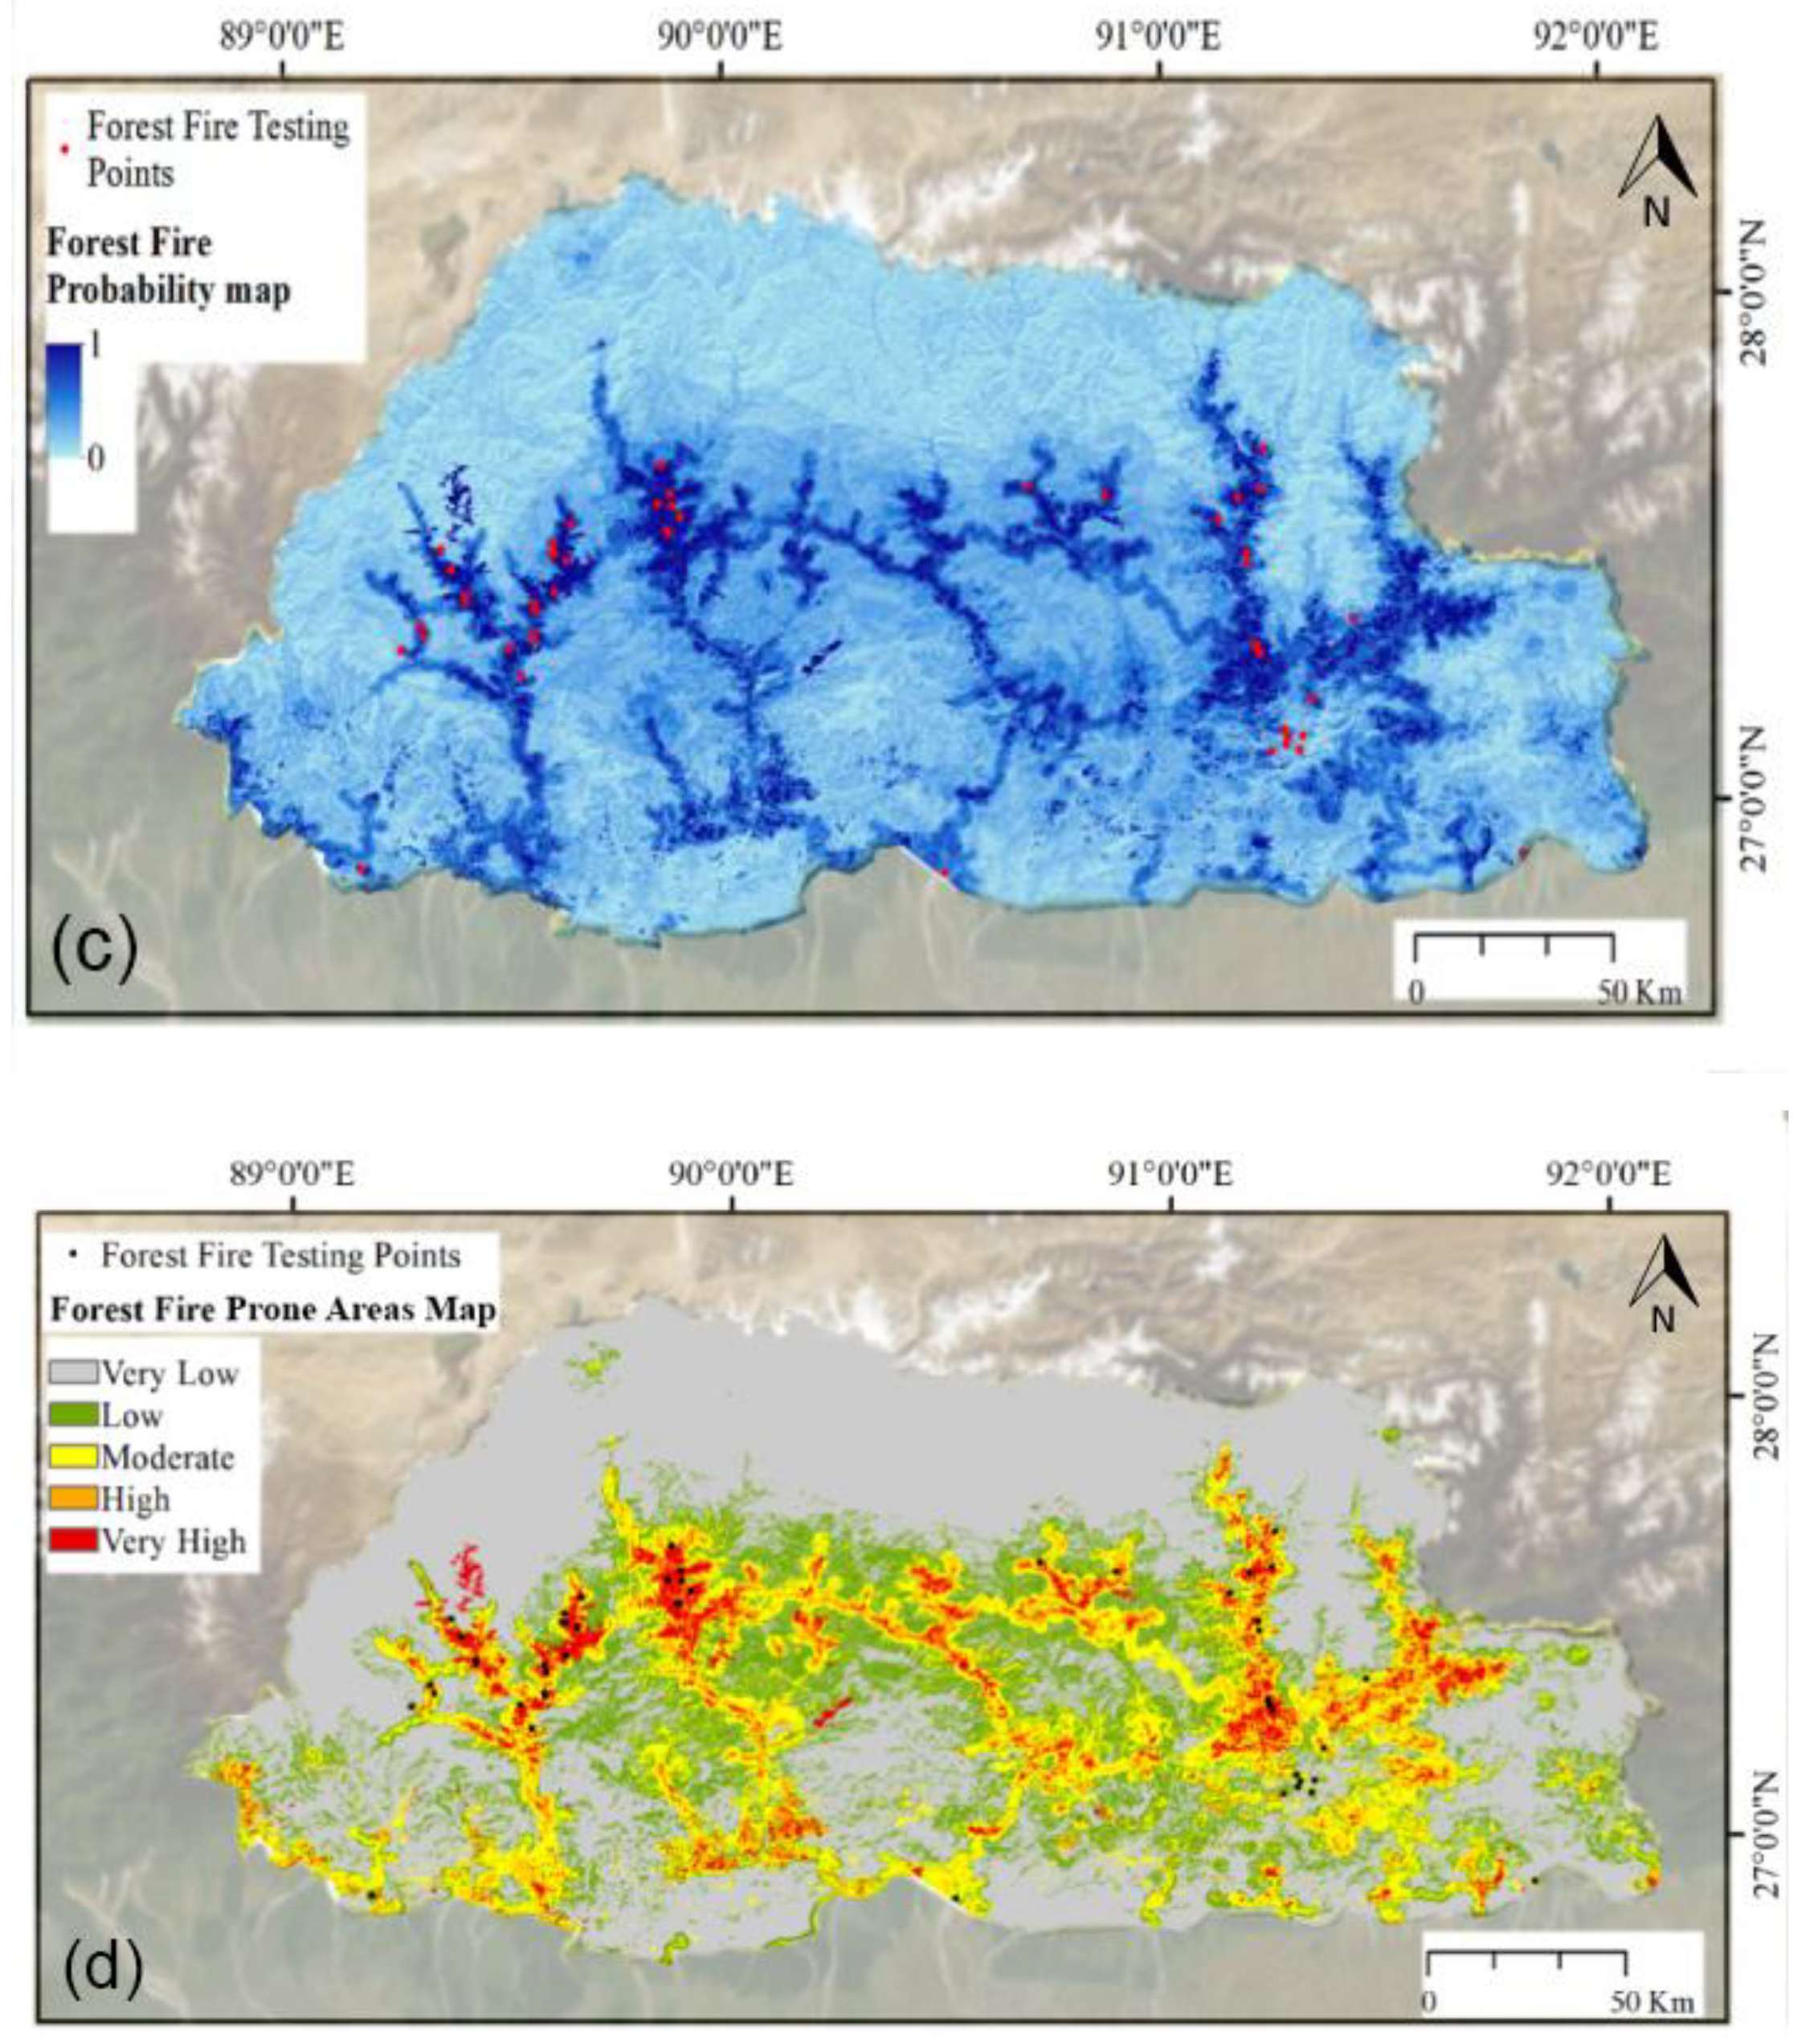
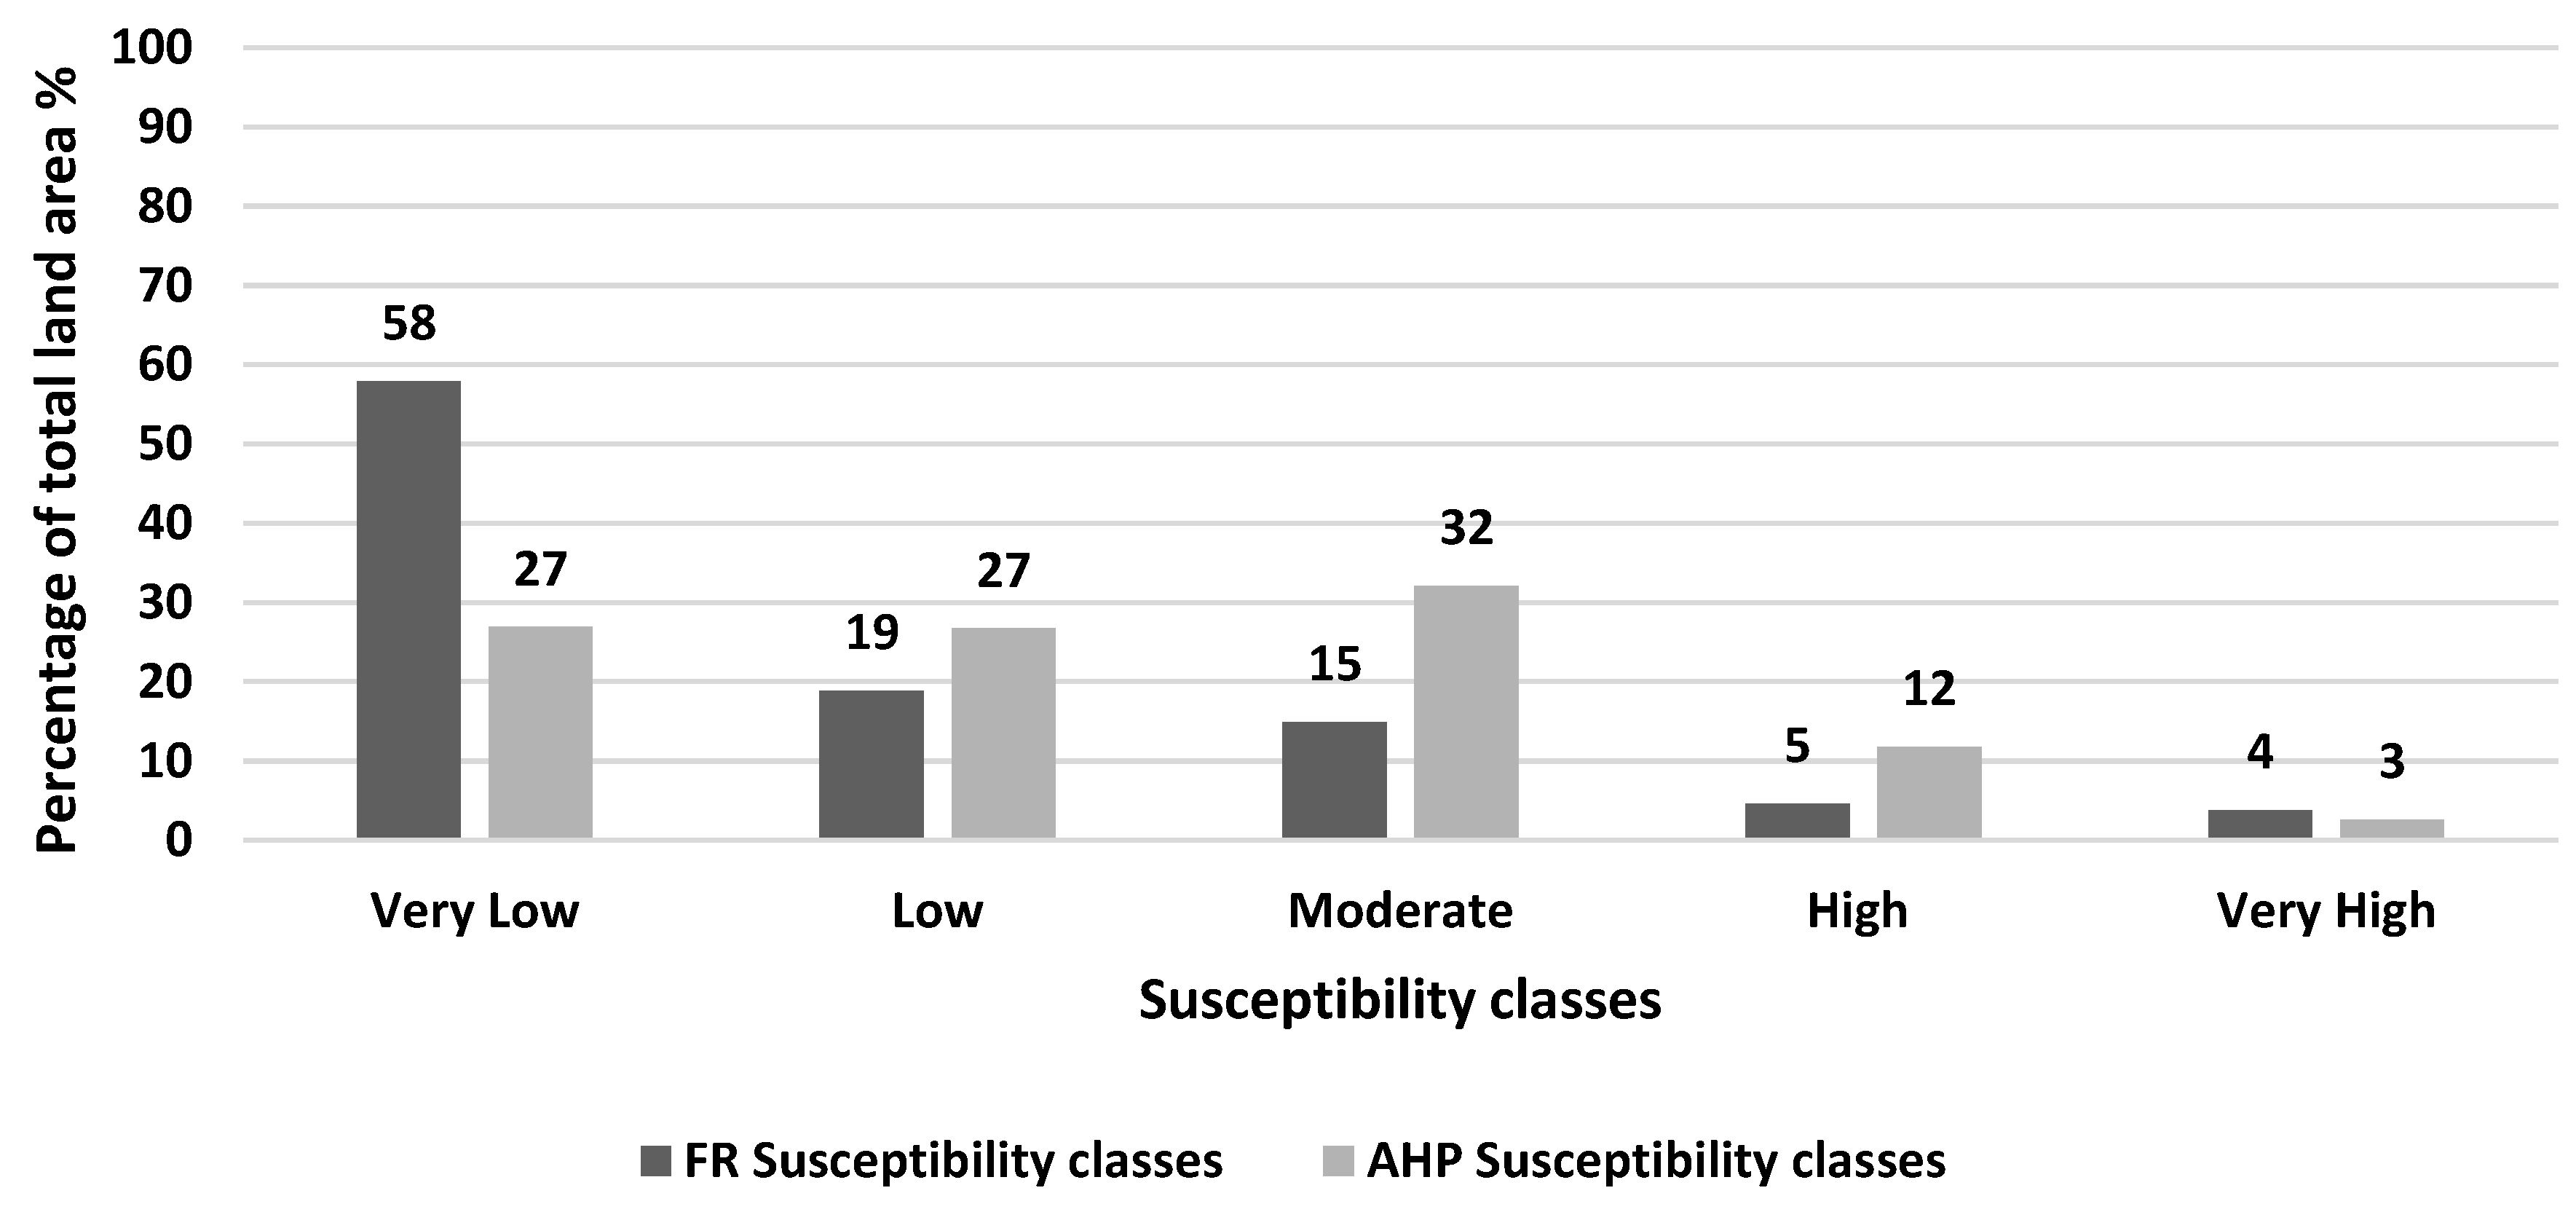
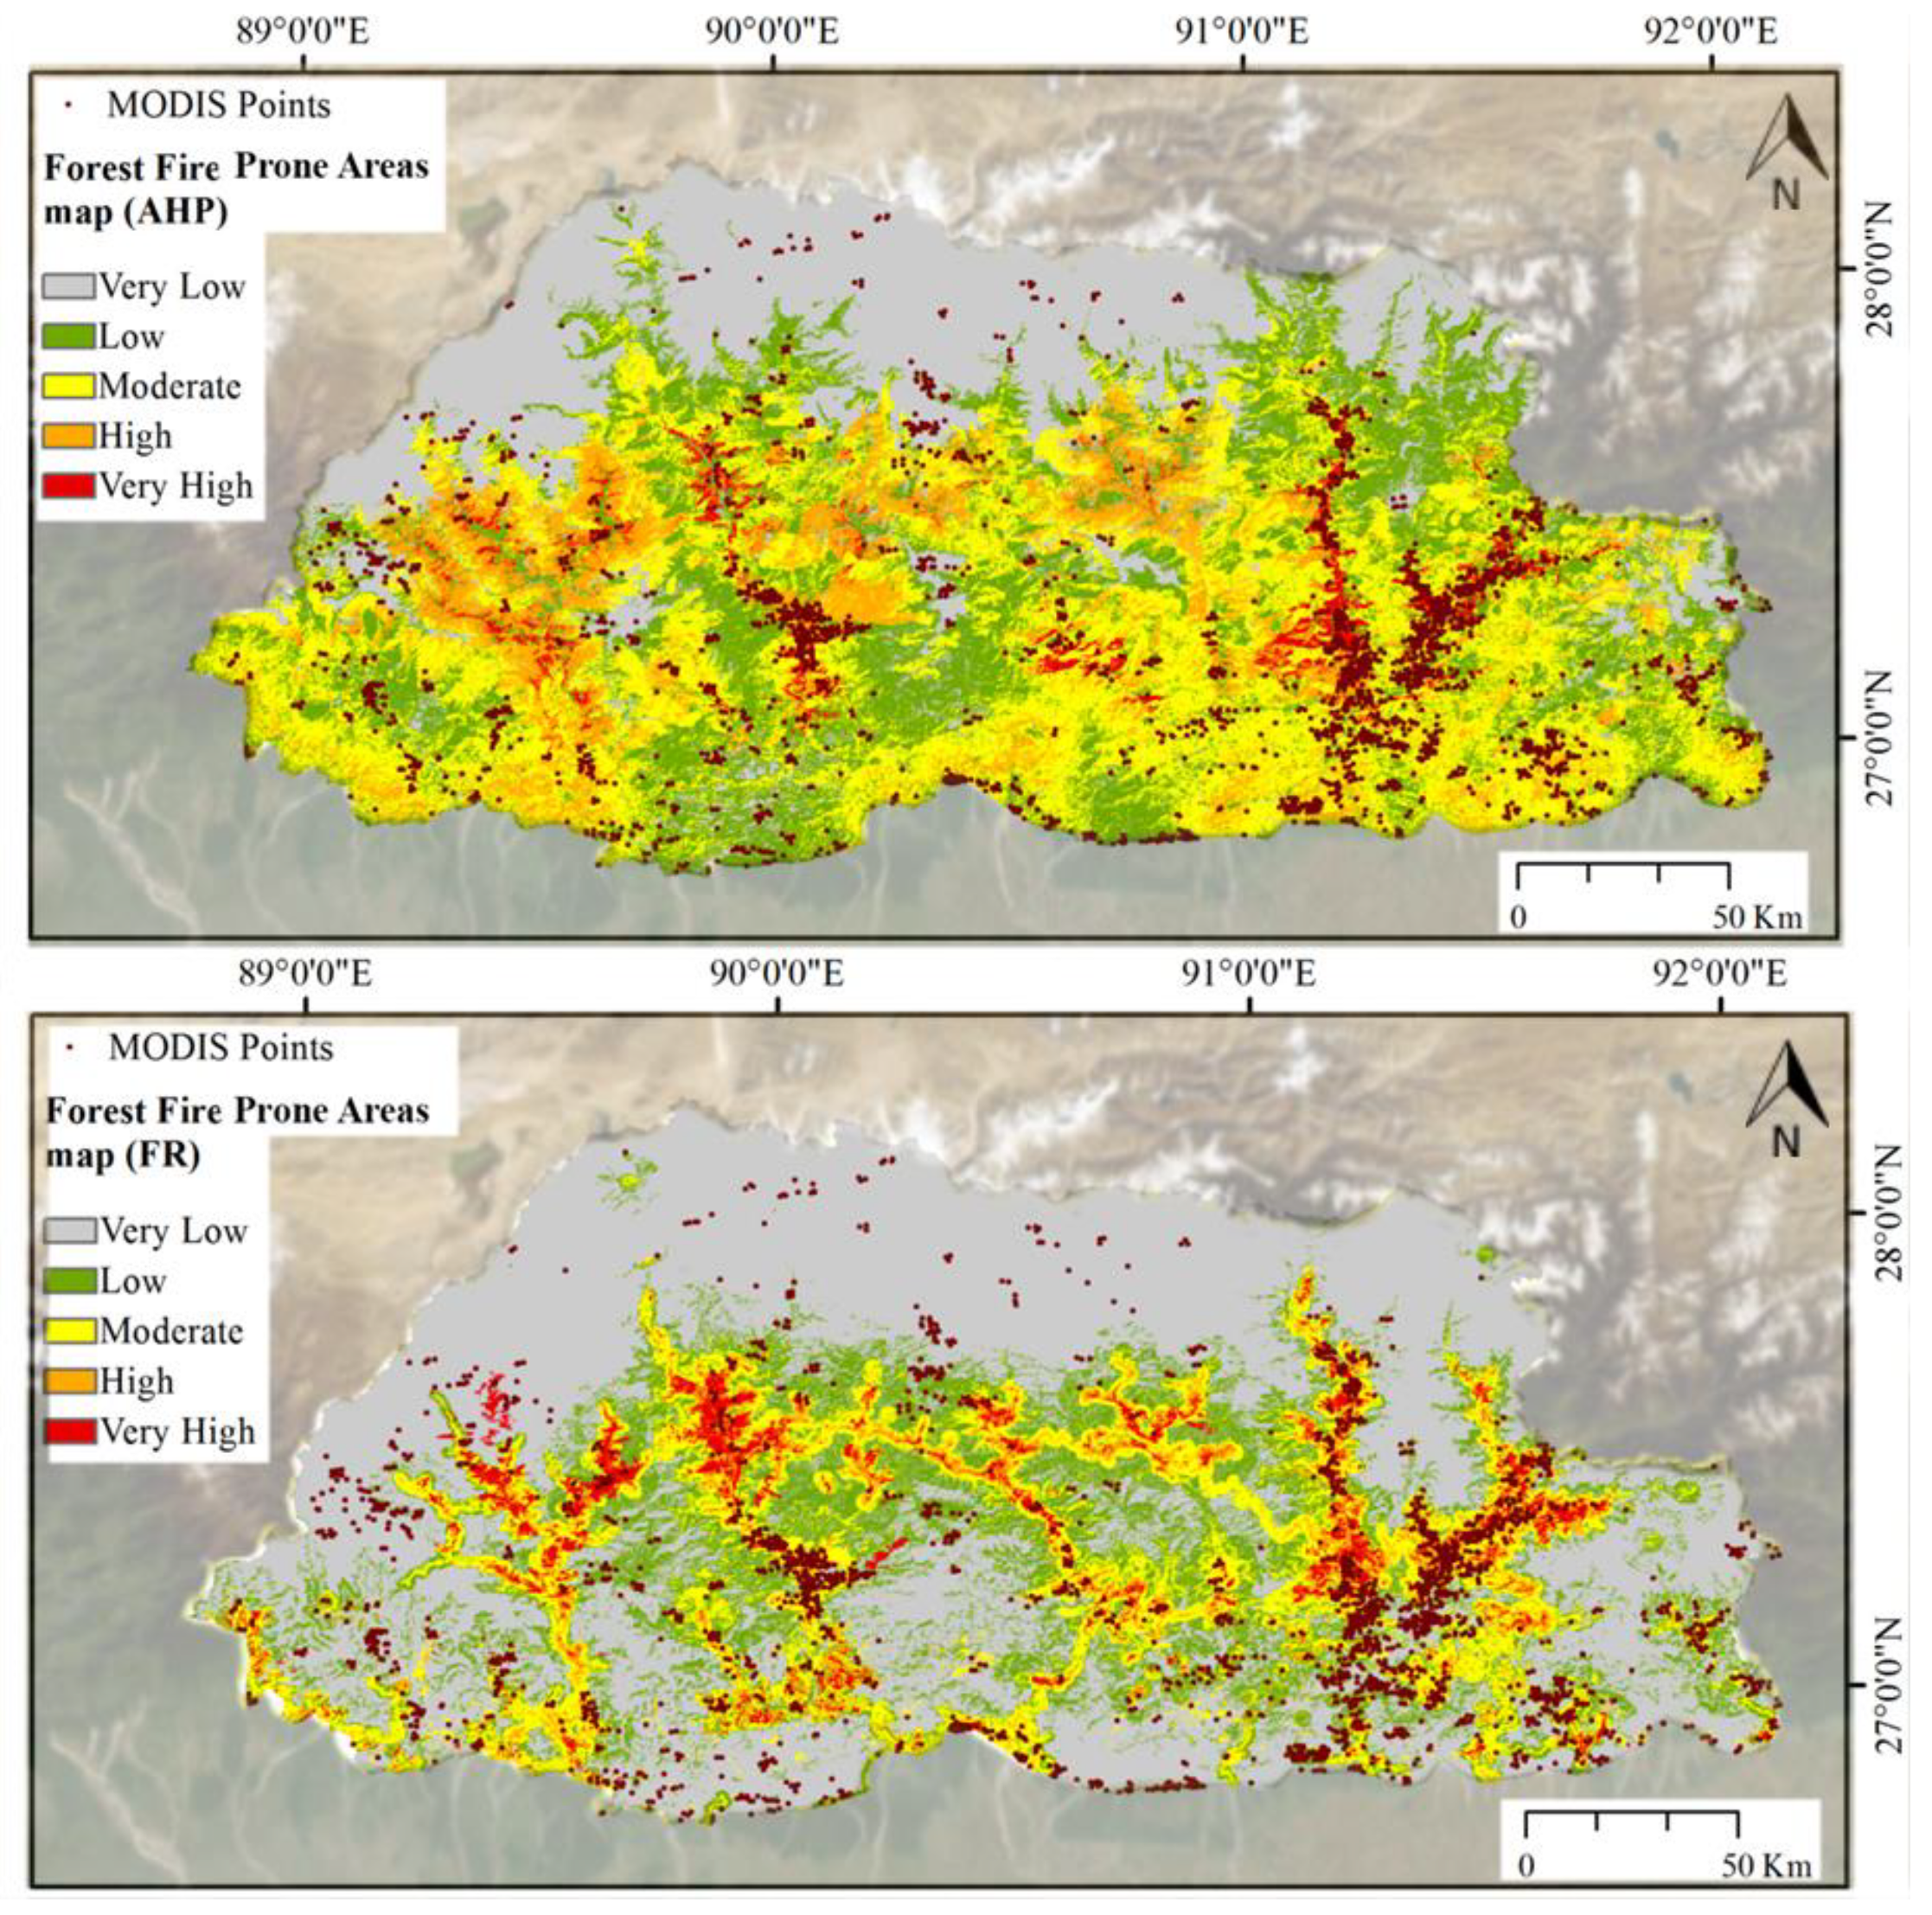
3.1. Model Outputs: Forest Fire-Prone Area Maps

Both AHP and FR models were performed, and two forest fire probability maps were initially produced. For a proper one-to-one comparison, both probability maps were normalized with probability values ranging from 0 to 1, as shown in Figure 4a,c. These probability maps were then classified into five different forest fire-prone classes: ‘very low’, ‘low’, ‘moderate’, ‘high’, and ‘very high’, using the quantile method of classification to produce the final forest fire-prone areas maps, as shown in Figure 4b,d.
The percentage of total land area encompassed by each fire-prone category generated by AHP and FR-based models can be seen in Figure 5. The AHP model depicted large areas for ‘moderate’ and ‘high’ prone classes, and together they covered 16,893 km2 (44%) of Bhutan’s total land area. The FR model showed the areas of each fire-prone class in a decreasing trend from ‘very low’ (22,268 km2; 58%) to ‘very high’ (1535 km2; 4%).
Most of the very high fire-prone areas detected by both the models were situated along the middle belt of the country, corresponding to areas dominated by pure stands of chirpine and blue pine forests, ranging between the 100 to 4962 m a.s.l. and between 0° to 75° slope, and areas close to the southern international border with India.
Figure 3. Spatial layers representing the seven conditioning factors: (a) Land-Use Land Cover (LULC), (b) distance from settlement, (c) distance from road, (d) distance from the southern international border, (e) aspect, (f) elevation, and (g) slope, for modeling forest fire-prone areas in Bhutan. All spatial input layers were classified prior to the analysis using the popular quantile method [57,58].
Forecasting 02 00003 g003aForecasting 02 00003 g003bForecasting 02 00003 g003c
Figure 4. Forest fire probability maps for Bhutan derived from (a) AHP and (c) FR; forest fire-prone area maps for Bhutan derived from (b) AHP and (d) FR.
Forecasting 02 00003 g004aForecasting 02 00003 g004b
Figure 5. Graphical comparison of relative difference in percentage of total land area in Bhutan encompassed by each fire-prone category yielded by AHP and FR-based models.
Forecasting 02 00003 g005

3.2. Accuracies of Model Outputs

While assessing the efficiency of each method using AUC, the AHP model produced a 70.61% success rate and a 62.46% prediction rate, whereas the FR model produced 87% success rate and 82% prediction rateas shown in Figure 6.

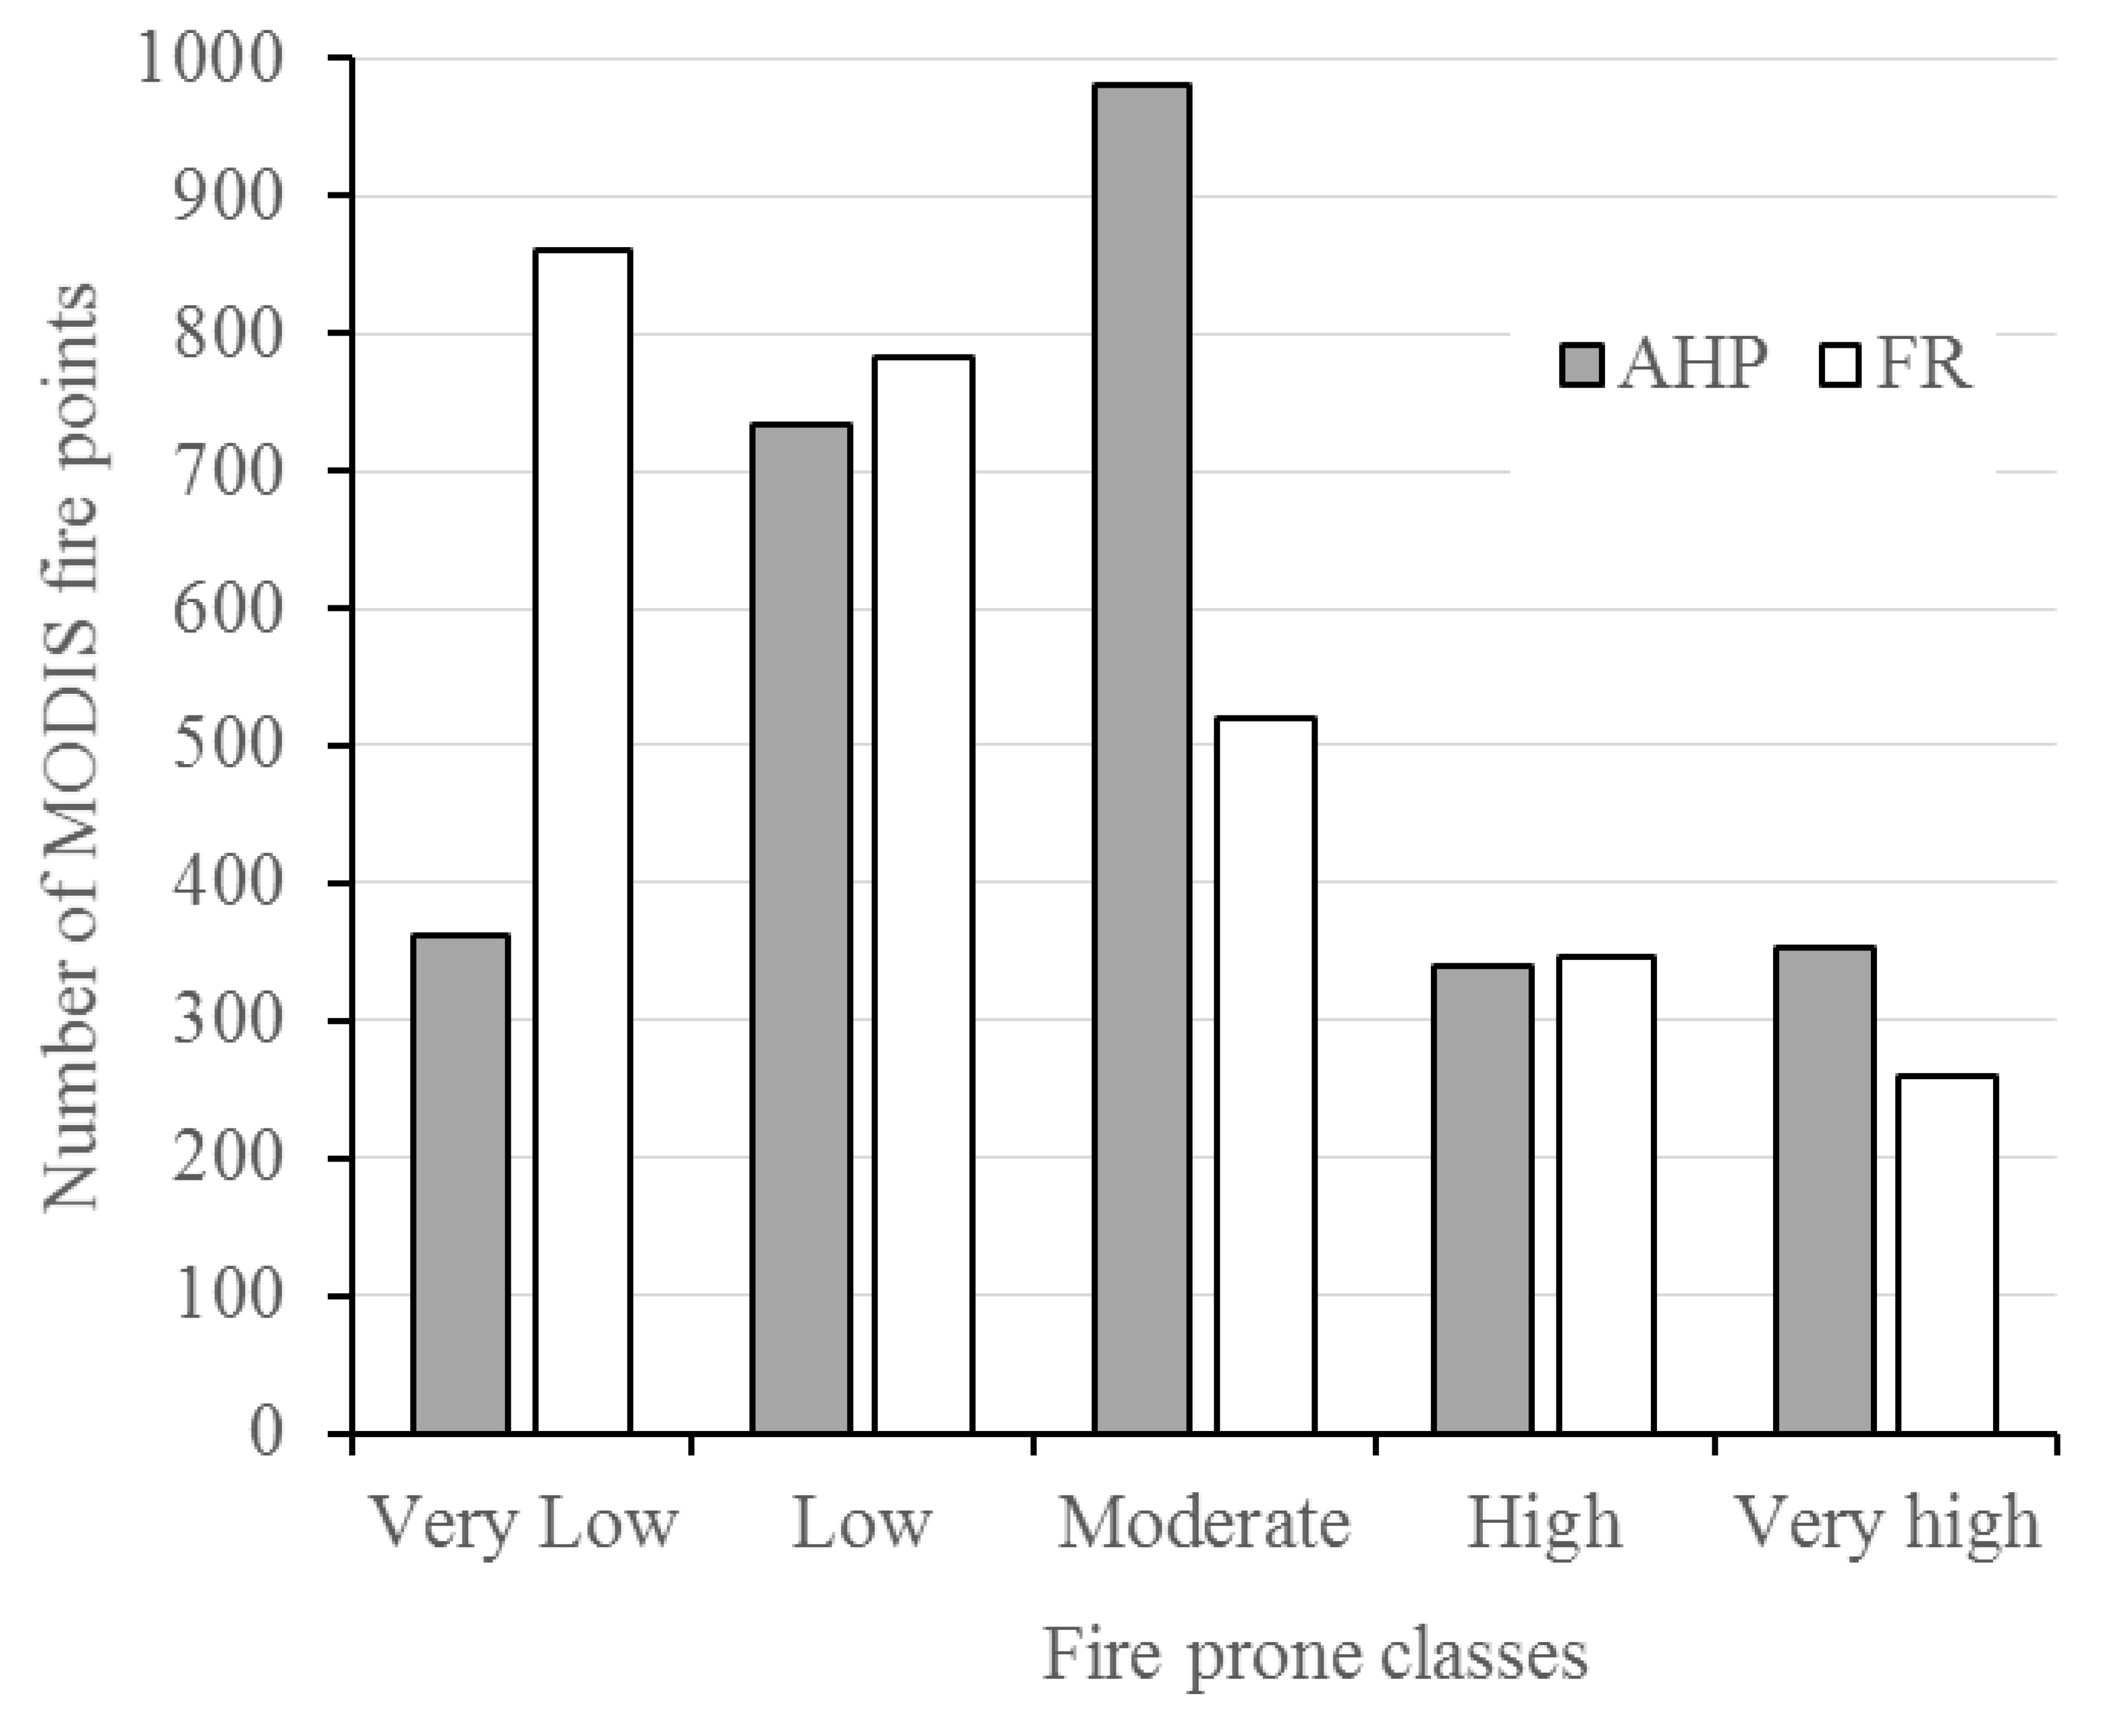
3.3. Validation of MODIS Fire Points

Upon overlay of 2769 MODIS fire points on the forest fire-prone maps, only 353 points (13%) overlapped with ‘very high’ and 340 points (12%) with ‘high’ classes on the fire-prone map yielded by the AHP model, as shown in Figure 7 and Figure 8. Similarly, only 260 points (9%) occurred on ‘very high’ and 346 points (13%) on ‘high’ classes of the FR-based fire-prone map. On the contrary, the highest number of MODIS points overlapped with ‘moderate’ class (n = 981; 35%) on the AHP-based map and ‘low’ class (n = 861; 31%) on the FR-based map.

4. Discussion

Due to the non-linear and complex nature of a forest fire, rapidly modeling this catastrophe at the regional scale is a challenge. In this study, two simple yet robust models for predicting forest fire-prone areas in Bhutan were presented and compared. The FR model was shown to produce a more accurate fire-prone map than the AHP model, based on the higher AUC values. Therefore, the use of the FR model is recommended. The weakness of the AHP model is due to potential errors in pair-wise comparisons of the conditioning factors. The AHP model is highly reliant on expert judgment that is prone to error in the sense that its accuracy can be greatly altered by divergent views from the fire experts. Such a possibility was also acknowledged by Rathore, Dubey [81] while creating an expert-based least-cost corridor for tigers Panthera tigris in Madhya Pradesh, India. Therefore, considerable attention is required in assigning values in an AHP matrix with repeated iterations, until a desired CR is attained. The FR modeling, on the other hand, produces outcomes based on mathematical analysis; hence, it does not require any expert judgments and is, therefore, less prone to errors emanating from expert opinion. In recent times in Bhutan, forest fires have been caused by electrical short circuits along the power transmission lines traversing coniferous forests. Due to the non-availability of a spatial layer on distance from power lines, it was not used as a conditioning factor in the modeling. However, it should be used in future studies if the spatial layer becomes available. One of the advantages of GIS-based modeling is that new spatial layers can be added, and the model repeatedly generated.
We have found that the MODIS fire points are not reliable in predicting forest fires, as most of the points overlapped with ‘moderate’ and ‘low’ prone classes on the AHP and FR model outputs, respectively. The low predictability of MODIS fire points in predicting forest fire-prone areas in Bhutan could be due to cloudy weather conditions in the Himalayan ranges that could shield forest fires from the satellites. It could also be possible that the timing of forest fires may not have coincided with the timing of satellite passes. Similar explanations are reported by Müller, Suess [82] in Lao People’s Democratic Republic. Additionally, in Thailand, there were false alarms observed during ground validation of fires in the hilly areas, although MODIS detection accuracy was 97% [83]. In the case of Bhutan, Pemagatshel Dzongkhag (‘district’ in Bhutanese national language) in the southeast was classified as a ‘moderate’ or ‘low’ fire-prone area by our models despite the large concentration of MODIS fire points (n = 327). In fact, most of these fire points represented fires from the burning of agricultural debris and from shifting cultivation, which is still being practiced at a small scale despite officially being banned. One should, therefore, exercise caution while developing any forest fire-prone maps using MODIS fire points.
This study has created the first ever forest fire-prone map for Bhutan (based on the FR model), which will be forwarded to the Department of Forests and Park Services for adoption. Such forest fire-prone area maps will be highly valuable to Bhutanese area managers and also to policy makers at regional and national levels for effective planning of resources to prevent and manage forest fires. This map is highly relevant and timely for the current situation in Bhutan, which still does not have an officially recognized forest fire-prone area map. Fire-prone classes, such as ‘very high’ and ‘high’, are predicted in the central districts of Bhutan. Mongar Dzongkhag has the highest percentage of fire-prone areas (combination of ‘very high’ and ‘high’ classes), followed by Wangduephodrang, Trashigang, Bumthang, Thimpu, and Paro Dzongkhags. These are areas with a corresponding high percentage of blue pine and chirpine forests along with high human populations and a comprehensive road network. Therefore, these areas need to be prioritized for any future fire prevention and management programs in Bhutan.

5. Conclusions

In this study, quantitative FR and qualitative AHP techniques were applied to map forest fire-prone areas in Bhutan and were compared in terms of accuracy of mapping. Seven forest fire conditioning factors, comprising LULC, distance from human settlement, distance from road, distance from the southern international border, aspect, elevation, and slope, were utilized for predicting fire-prone areas in Bhutan. The map produced by the FR model was found to be more accurate (with an 82% prediction rate). Therefore, we suggest using this to reliably predict forest fires and allocate resources to fire-prone areas for any prevention and suppression activities. MODIS forest fire points were found to be not reliable in predicting forest fires in Bhutan due to a high percentage of overlap with ‘low’ fire-prone areas. Hence, we caution their use for predicting forest fires. The forest fire-prone area maps generated in this research will be useful for the Bhutan Government to improve its current National Forest Fire Management Strategy.

Author Contributions

Conceptualization, K.T., P.T., M.S.T., and U.T.; methodology, K.T., P.T., M.S.T., and U.T.; Data analysis: K.T., P.T., M.S.T., U.T., and F.S.H; Draft preparation, review and editing: K.T., P.T., M.S.T., U.T., and F.S.H. All authors have read and agreed to the published version of the manuscript.

Funding

This research was funded by the Royal Government of Bhutan vide, grant number DoFPS/FFMS/ FY 2014-2015.

Acknowledgments

The authors would like to thank the Royal Government of Bhutan’s Department of Forests and Park Services (DoFPS) of the Ministry of Agriculture and Forests (MoAF) for kindly approving the study and providing necessary funding and data. We owe our gratitude to the Forest Fire Management Section of the DoFPS, and to the forest fire managers from various field offices in providing forest fire points and expert judgments on modeling forest fires. We are also thankful to the GIS officers from the Department of Roads, the DoFPS, and the Policy and Planning Division of the MoAF for providing us the requisite GIS spatial layers. Finally, we appreciate the valuable edits and comments provided on our manuscript by Rajanathan Rajaratnam from the University of New England in Australia.

Conflicts of Interest

The authors declare no conflict of interest.

References

  1. Tien Bui, D.; Bui, Q.T.; Nguyen, Q.P.; Pradhan, B.; Nampak, H.; Trinh, P.T. A hybrid artificial intelligence approach using gis-based neural-fuzzy inference system and particle swarm optimization for forest fire susceptibility modeling at a tropical area. Agric. For. Meteorol. 2017, 233, 32–44. [Google Scholar] [CrossRef]
  2. Huebner, K.; Lindo, Z.; Lechowicz, M. Post-fire succession of collembolan communities in a northern hardwood forest. Eur. J. Soil Biol. 2012, 48, 59–65. [Google Scholar] [CrossRef]
  3. Argañaraz, J.P.; Gavier Pizarro, G.; Zak, M.; Landi, M.A.; Bellis, L.M. Human and biophysical drivers of fires in semiarid Chaco mountains of Central Argentina. Sci. Total Environ. 2015, 520, 1–12. [Google Scholar] [CrossRef] [PubMed]
  4. Stevens-Rumann, C.S.; Kemp, K.B.; Higuera, P.E.; Harvey, B.J.; Rother, M.T.; Donato, D.C.; Morgan, P.; Veblen, T.T. Evidence for declining forest resilience to wildfires under climate change. Ecol. Lett. 2018, 21, 243–252. [Google Scholar] [CrossRef] [PubMed]
  5. Allen, C.D.; Macalady, A.K.; Chenchouni, H.; Bachelet, D.; Mcdowell, N.; Vennetier, M.; Kitzberger, T.; Rigling, A.; Breshears, D.D.; Hogg, E.H. A global overview of drought and heat-induced tree mortality reveals emerging climate change risks for forests. For. Ecol. Manag. 2010, 259, 660–684. [Google Scholar] [CrossRef] [Green Version]
  6. Rother, M.T.; Veblen, T.T. Limited conifer regeneration following wildfires in dry ponderosa pine forests of the Colorado Front Range. Ecosphere 2016, 7, e01594. [Google Scholar] [CrossRef]
  7. Keeley, J.E. Fire Intensity, Fire Severity and Burn Severity: A Brief Review and Suggested Usage. Int. J. Wildland Fire 2009, 18, 116–126. [Google Scholar] [CrossRef]
  8. Cannon, S.H.; Gartner, J.E. Wildfire-related debris flow from a hazards perspective. In Debris-Flow Hazards and Related Phenomena; Springer: Berlin/Heidelberg, Germany, 2005; ISBN 3-540-20726-0. [Google Scholar]
  9. Carabella, C.; Miccadei, E.; Paglia, G.; Sciarra, N. Post-wildfire landslide hazard assessment: The case of the 2017 montagna del morrone fire (central apennines, Italy). Geosciences 2019, 9, 175. [Google Scholar] [CrossRef] [Green Version]
  10. Wickramasinghe, C.H.; Jones, S.; Reinke, K.; Wallace, L. Development of a multi-spatial resolution approach to the surveillance of active fire lines using Himawari-8. Remote Sens. 2016, 8, 932. [Google Scholar] [CrossRef] [Green Version]
  11. Shakesby, R.; Doerr, S. Wildfire as a hydrological and geomorphological agent. Earth-Sci. Rev. 2006, 74, 269–307. [Google Scholar] [CrossRef]
  12. Esposito, G.; Parodi, A.; Lagasio, M.; Masi, R.; Nanni, G.; Russo, F.; Alfano, S.; Giannatiempo, G. Characterizing Consecutive Flooding Events after the 2017 Mt. Salto Wildfires (Southern Italy): Hazard and Emergency Management Implications. Water 2019, 11, 2663. [Google Scholar]
  13. Busico, G.; Giuditta, E.; Kazakis, N.; Colombani, N. A Hybrid GIS and AHP Approach for Modelling Actual and Future Forest Fire Risk Under Climate Change Accounting Water Resources Attenuation Role. Sustainability 2019, 11, 7166. [Google Scholar] [CrossRef] [Green Version]
  14. Abatzoglou, J.T.; Williams, A.P. Impact of anthropogenic climate change on wildfire across western US forests. Proc. Natl. Acad. Sci. USA 2016, 113, 11770–11775. [Google Scholar] [CrossRef] [Green Version]
  15. Littell, J.S.; Peterson, D.L.; Riley, K.L.; Liu, Y.; Luce, C.H. A review of the relationships between drought and forest fire in the United States. Glob. Chang. Biol. 2016, 22, 2353–2369. [Google Scholar] [CrossRef] [PubMed]
  16. Moritz, M.A.; Parisien, M.A.; Batllori, E.; Krawchuk, M.A.; Van Dorn, J.; Ganz, D.J.; Hayhoe, K. Climate change and disruptions to global fire activity. Ecosphere 2012, 3, 1–22. [Google Scholar] [CrossRef]
  17. Arpaci, A.; Malowerschnig, B.; Sass, O.; Vacik, H. Using multi variate data mining techniques for estimating fire susceptibility of Tyrolean forests. Appl. Geogr. 2014, 53, 258–270. [Google Scholar] [CrossRef]
  18. Eastaugh, C.S.; Hasenauer, H. Deriving forest fire ignition risk with biogeochemical process modelling. Environ. Modell. Softw. 2014, 55, 132–142. [Google Scholar] [CrossRef] [Green Version]
  19. Hoffman, C.M.; Canfield, J.; Linn, R.R.; Mell, W.; Sieg, C.H.; Pimont, F.; Ziegler, J. Evaluating crown fire rate of spread predictions from physics-based models. Fire Technol. 2016, 52, 221–237. [Google Scholar] [CrossRef] [Green Version]
  20. Pourtaghi, Z.S.; Pourghasemi, H.R.; Rossi, M. Forest fire susceptibility mapping in the minudasht forests, golestan province. Iran. Environ. Earth Sci. 2015, 73, 1515–1533. [Google Scholar] [CrossRef]
  21. Cheng, T.; Wang, J. Integrated spatio-temporal data mining for forest fire prediction. Trans. Gis. 2008, 12, 591–611. [Google Scholar] [CrossRef]
  22. Casbeer, D.W.; Kingston, D.B.; Beard, R.W.; McLain, T.W. Cooperative forest fire surveillance using a team of small unmanned air vehicles. Int. J. Syst. Sci. 2006, 37, 351–360. [Google Scholar] [CrossRef]
  23. Finney, M.A. FARSITE: Fire Area Simulator-Model Development and Evaluation; U.S. Department of Agriculture, Forest Service, Rocky Mountain Research Station: Ft. Collins, CO, USA, 1998; p. RMRS-RP-4. [Google Scholar]
  24. Mell, W.; Charney, J.; Jenkins, M.A.; Cheney, P.; Gould, J. Numerical simulations of grassland fire behavior from the LANL-FIRETEC and NIST-WFDS models. In Remote Sensing and Modeling Applications to Wildland Fires; Springer: Berlin/Heidelberg, Germany, 2013; pp. 209–225. Available online: https://0-doi-org.brum.beds.ac.uk/10.1007/978-3-642-32530-4_15 (accessed on 9 February 2020).
  25. Xue, W.; Zhang, G. FDS Fire Simulation and Application. Jilin Forestry Sci. Technol. 2006, 6, 4–8. Available online: http://en.cnki.com.cn/Article_en/CJFDTotal-JLLK200606004.htm (accessed on 11 January 2018).
  26. Sturtevant, B.R.; Scheller, R.M.; Miranda, B.R.; Shinneman, D.; Syphard, A. Simulating dynamic and mixed-severity fire regimes: A process-based fireextension for LANDIS-II. Ecol. Model. 2009, 220, 3380–3393. [Google Scholar] [CrossRef]
  27. Massada, A.B.; Syphard, A.D.; Hawbaker, T.J.; Stewart, S.I.; Radeloff, V.C. Effects of ignition location models on the burn patterns of simulated wildfires. Environ. Model. Softw. 2011, 26, 583–592. [Google Scholar] [CrossRef]
  28. Pimont, F.; Parsons, R.; Rigolot, E.; de Coligny, F.; Dupuy, J.-L.; Dreyfus, P.; Linn, R.R. Modeling fuels and fire effects in 3D: Model description and applications. Environ. Model. Softw. 2016, 80, 225–244. [Google Scholar] [CrossRef] [Green Version]
  29. Kanungo, D.P.; Arora, M.; Sarkar, S.; Gupta, R. A comparative study of conventional, ANN black box, fuzzy and combined neural and fuzzy weighting procedures for landslide susceptibility zonation in Darjeeling Himalayas. Eng. Geol. 2006, 85, 347–366. [Google Scholar] [CrossRef]
  30. Marjanovic, M.; Kovacevic, M.; Bajat, B.; Vozenilek, V. Landslide susceptibility assessment using SVM machine learning algorithm. Eng. Geol. 2011, 123, 225–234. [Google Scholar] [CrossRef]
  31. Tehrany, M.S.; Pradhan, B.; Jebur, M.N. Spatial prediction of flood susceptible areas using rule based decision tree (DT) and a novel ensemble bivariate and multivariate statistical models in GIS. J. Hydrol. 2013, 504, 69–79. [Google Scholar] [CrossRef]
  32. A Hybrid Intelligent Algorithm by Combining Particle Swarm Optimization with Chaos Searching Technique for Solving Nonlinear Bilevel Programming Problems. Available online: https://0-doi-org.brum.beds.ac.uk/10.1016/j.swevo.2012.08.001 (accessed on 22 October 2018).
  33. Teodoro, A.; Duarte, L.; Sillero, N.; Gonçalves, J.A.; Fonte, J.; Gonçalves-Seco, L.; Pinheiro da Luz, L.M.; dos Santos Beja, L.M.R. An integrated and open source GIS environmental management system for a protected area in the south of Portugal. In Proceedings of the SPIE 9644, Earth Resources and Environmental Remote Sensing/GIS Applications VI, Toulouse, France, 24 September 2015. [Google Scholar]
  34. Gitas, I.Z.; San-Miguel-Ayanz, J.; Chuvieco, E.; Camia, A. Advances in remote sensing and GIS applications in support of forest fire management. Int. J. Wildland Fire 2014, 23, 603–605. [Google Scholar] [CrossRef] [Green Version]
  35. Wittenberg, L.; Malkinson, D. Spatio-temporal perspectives of forest fires regimes in a maturing Mediterranean mixed pine landscape. Eur. J. Forest Res. 2009, 128, 297–304. [Google Scholar] [CrossRef]
  36. Tehrany, M.S.; Pradhan, B.; Jebur, M.N. Flood susceptibility analysis and its verification using a novel ensemble support vector machine and frequency ratio method. Stochastic Environ. Res. Risk Assess. 2015, 29, 1149–1165. [Google Scholar] [CrossRef]
  37. Kant Sharma, L.; Kanga, S.; Singh Nathawat, M.; Sinha, S.; Chandra Pandey, P. Fuzzy AHP for forest fire risk modeling. Disaster Prev. Manag. Int. J. 2012, 21, 160–171. [Google Scholar] [CrossRef]
  38. DoFPS (Department of Forests and Park Services). Forestry Facts and Figures; Kuensel Corporation Limited: Thimphu, Bhutan, 2015. [Google Scholar]
  39. Dorji, T. Forest fire situation in Bhutan. In International Forest Fire News (IFFN); FAO/UNECE: Geneva, Switzerland, 2006; p. 9. Available online: https://gfmc.online/wp-content/uploads/07-IFFN-34-Bhutan-1.pdf (accessed on 1 January 2020).
  40. Tshering, K. Development of an Effective Forest Fire Management Strategy for Bhutan; The University of Montana: Helena, MT, USA, 2006; p. 87. Available online: https://scholarworks.umt.edu/etd/2049/ (accessed on 21 February 2019).
  41. Climate Change Effects on Wildfire Hazards in the Wildland-Urban-Interface-Blue Pine Forests of Bhutan. Available online: https://0-doi-org.brum.beds.ac.uk/10.1016/j.foreco.2020.117927 (accessed on 18 February 2020).
  42. NSB (National Statistics Bureau). Bhutan at a Glance; National Statistics Bureau: Thimphu, Bhutan, 2018; Available online: http://www.nsb.gov.bt/publication/files/pub3kw5078sm.pdf (accessed on 18 February 2020).
  43. NBC (National Biodiversity Centre). Biodiversity Statistics of Bhutan 2017: A Preliminary Baseline; National Biodiversity Centre: Thimphu, Bhutan, 2017; p. 65. Available online: https://www.researchgate.net/publication/335001155_Biodiversity_Statistics_of_Bhutan_2017_-_A_Preliminary_Baseline (accessed on 12 December 2019).
  44. MoAF (Ministry of Agriculture and Forests). Atlas of Bhutan; Landuse Planning Section (LUPS), Policy and Planning Division: Thimphu, Bhutan, 1997; p. 49. [Google Scholar]
  45. Wangda, P.; Ohsawa, M. Gradational forest change along the climatically dry valley slopes of Bhutan in the midst of humid eastern Himalaya. Plant Ecol. 2006, 186, 109–128. [Google Scholar] [CrossRef]
  46. Ohsawa, M.E. Life Zone Ecology of the Bhutan Himalaya; Laboratory of Ecology, Chiba University: Chiba, Japan, 1987. [Google Scholar]
  47. Higuera, P.E.; Abatzoglou, J.T.; Littell, J.S.; Morgan, P. The changing strength and nature of fire-climate relationships in the northern Rocky Mountains, USA, 1902–2008. PLoS ONE 2015, 10, e0127563. [Google Scholar] [CrossRef] [Green Version]
  48. Tehrany, M.S.; Lee, M.-J.; Pradhan, B.; Jebur, M.N.; Lee, S. Flood susceptibility mapping using integrated bivariate and multivariate statistical models. Environ. Earth Sci. 2014, 72, 4001–4015. [Google Scholar] [CrossRef]
  49. Umar, Z.; Pradhan, B.; Ahmad, A.; Jebur, M.N.; Tehrany, M.S. Earthquake induced landslide susceptibility mapping using an integrated ensemble frequency ratio and logistic regression models in West Sumatera Province, Indonesia. Catena 2014, 118, 124–135. [Google Scholar] [CrossRef]
  50. Verde, J.; Zêzere, J. Assessment and validation of wildfire susceptibility and hazard in Portugal. Nat. Hazards Earth Syst. Sci. 2010, 10, 485–497. [Google Scholar] [CrossRef]
  51. Marsala, V.; Galli, A.; Paglia, G.; Miccadei, E. Landslide Susceptibility Assessment of Mauritius Island (Indian Ocean). Geosciences 2019, 9, 493. [Google Scholar] [CrossRef] [Green Version]
  52. Fell, R.; Corominas, J.; Bonnard, C.; Cascini, L.; Leroi, E.; Savage, W.Z. Guidelines for landslide susceptibility, hazard and risk zoning for land-use planning. Eng. Geol. 2008, 102, 99–111. [Google Scholar] [CrossRef] [Green Version]
  53. Roslee, R.; Mickey, A.C.; Simon, N.; Norhisham, M.N. Landslide susceptibility analysis (LSA) using weighted overlay method (WOM) along the Genting Sempah to Bentong Highway, Pahang. Malays. J. Geosci. 2017, 1, 13–19. [Google Scholar] [CrossRef]
  54. Robichaud, P.R.; Wagenbrenner, J.W.; Pierson, F.B.; Spaeth, K.E.; Ashmun, L.E.; Moffet, C.A. Infiltration and interrill erosion rates after a wildfire in western Montana, USA. Catena 2016, 142, 77–88. [Google Scholar] [CrossRef] [Green Version]
  55. Abbate, A.; Longoni, L.; Ivanov, V.I.; Papini, M. Wildfire Impacts on Slope Stability Triggering in Mountain Areas. Geosciences 2019, 9, 417. [Google Scholar] [CrossRef] [Green Version]
  56. Jarvis, A.; Reuter, H.I.; Nelson, A.; Geuvara, E. Hole-Filled SRTM for the Glove Version 3. Available online: http://srtm.csi.cgiar.org (accessed on 12 April 2016).
  57. Tehrany, M.S.; Pradhan, B.; Jebur, M.N. Flood susceptibility mapping using a novel ensemble weights-of-evidence and support vector machine models in GIS. J. Hydrol. 2014, 512, 332–343. [Google Scholar] [CrossRef]
  58. Akgun, A.; Dag, S.; Bulut, F. Landslide susceptibility mapping for a landslide-prone area (Findikli, NE of Turkey) by likelihood-frequency ratio and weighted linear combination models. Environ. Geol. 2008, 54, 1127–1143. [Google Scholar] [CrossRef]
  59. Huesca, M.; Litago, J.; Palacios-Orueta, A.; Montes, F.; Sebastián-López, A.; Escribano, P. Assessment of forest fire seasonality using MODIS fire potential: A time series approach. Agric. For. Meteorol. 2009, 149, 1946–1955. [Google Scholar] [CrossRef]
  60. DoFPS (Department of Forests and Park Services). Forest Fire Management Strategy of Bhutan; Kuensel Corporation Ltd.: Thimphu, Bhutan, 2012; p. 21. [Google Scholar]
  61. Erten, E.; Kurgun, V.; Musaoglu, N. Forest fire risk zone mapping from satellite imagery and GIS: A case study. In Proceedings of the XXth Congress of the International Society for Photogrammetry and Remote Sensing, Istanbul, Turkey, 12–23 July 2004; pp. 222–230. [Google Scholar]
  62. Opie, K.; March, A.; Leonard, J.; Newnham, G. Indicators of Fire Vulnerability: Risk Factors in Victorian Settlements. CSIRO and Melbourne University report to the Natural Disaster Resilience grants Scheme. Melbourne, Australia, 2014. Available online: https://msd.unimelb.edu.au/__data/assets/pdf_file/0005/2590628/Indices-report-Final-2014-April.pdf (accessed on 22 December 2019).
  63. Evaluation of Forest Fire Risk with GIS. Available online: http://www.pjoes.com/Evaluation-of-Forest-Fire-Risk-with-GIS,89182,0,2.html (accessed on 8 November 2019).
  64. Chuvieco, E.; Congalton, R.G. Application of remote sensing and geographic information systems to forest fire hazard mapping. Remote Sens. Environ. 1989, 29, 147–159. [Google Scholar] [CrossRef]
  65. Sowmya, S.; Somashekar, R. Application of Remote Sensing and Geographical Information System in Mapping Forest Fire Risk Zone at Bhadra Wildlife Sanctuary, India. 2010. Available online: https://0-www-ncbi-nlm-nih-gov.brum.beds.ac.uk/pubmed/21506484 (accessed on 16 March 2019).
  66. Schmidt, D.A.; Taylor, A.H.; Skinner, C.N. The influence of fuels treatment and landscape arrangement on simulated fire behavior, Southern Cascade range, California. For. Ecol. Manag. 2008, 255, 3170–3184. [Google Scholar] [CrossRef]
  67. Ghobadi, G.J.; Gholizadeh, B.; Dashliburun, O.M. Forest fire risk zone mapping from geographic information system in Northern Forests of Iran (Case study, Golestan province). Int. J. Agric. Crop Sci. 2012, 4, 818–824. [Google Scholar]
  68. Lentile, L.B.; Smith, F.W.; Shepperd, W.D. Influence of topography and forest structure on patterns of mixed severity fire in ponderosa pine forests of the South Dakota Black Hills, USA. Int. J. Wildl. Fire 2006, 15, 557–566. [Google Scholar] [CrossRef]
  69. Saaty, R.W. The analytic hierarchy process—What it is and how it is used. Math. Model. 1987, 9, 161–176. [Google Scholar] [CrossRef] [Green Version]
  70. Chhetri, S.; Kayastha, P. Manifestation of an analytic hierarchy process (AHP) model on fire potentialzonation mapping in Kathmandu Metropolitan City, Nepal. ISPRS Int. J. Geo-Inf. 2015, 4, 400–417. [Google Scholar] [CrossRef] [Green Version]
  71. Thakur, A.K.; Singh, D. Forest fire risk zonation using geospatial techniques and analytic hierarchy process in Dehradun District, Uttarakhand, India. Univ. J. Environ. Res. Technol. 2014, 4, 82–89. [Google Scholar]
  72. Vadrevu, K.P.; Eaturu, A.; Badarinath, K.V.S. Fire risk evaluation using multicriteria analysis—A case study. Environ. Monit. Assess. 2010, 166, 223–239. [Google Scholar] [CrossRef]
  73. Bonham-Carter, G.F. Geographic Information Systems for Geoscientists: Modeling with GIS; Pergamon Press: Oxford, UK, 1994. [Google Scholar]
  74. Ozdemir, A.; Altural, T. A comparative study of frequency ratio, weights of evidence and logistic regression methods for landslide susceptibility mapping: Sultan mountains, sw turkey. J. Asian Earth Sci. 2013, 64, 180–197. [Google Scholar] [CrossRef]
  75. Oh, H.J.; Kim, Y.S.; Choi, J.K.; Park, E.; Lee, S. GIS mapping of regional probabilistic groundwater potential in the area of Pohang City. Korea. J. Hydrol. 2011, 399, 158–172. [Google Scholar] [CrossRef]
  76. Pourghasemi, H.R.; Pradhan, B.; Gokceoglu, C. Application of fuzzy logic and analytical hierarchy process (AHP) to landslide susceptibility mapping at Haraz watershed, Iran. Nat. Hazards 2012, 63, 965–996. [Google Scholar] [CrossRef]
  77. Hong, H.; Biswajeet, P.; Bui, D.T.; Xu, C. Landslide susceptibility assessment at the Suichuan area (China) using support vector machine model. In Emerging Economies, Risk and Development, and Intelligent Technology: Proceedings of the 5th International Conference on Risk Analysis and Crisis Response, Tangier, Morocco, 1–3 June 2015; CRC Press: Boca Raton, FL, USA, 2015; Available online: https://www.researchgate.net/profile/Chong_Xu/publication/279456422_Landslide_susceptibility_assessment_at_the_Suichuan_area_China_using_support_vector_machine_model/links/580e9e9208ae7525273d299a/Landslide-susceptibility-assessment-at-the-Suichuan-area-China-using-support-vector-machine-model.pdf (accessed on 25 November 2019).
  78. Fielding, A.H.; Bell, J.F. A review of methods for the assessment of prediction errors in conservation presence/absence models. Environ. Conserv. 1997, 24, 38–49. [Google Scholar] [CrossRef]
  79. Müller, D.; Stefan, S. Can the MODIS Active Fire Hotspots be Used to Monitor Vegetation Fires in the Lao PDR? Climate Protection through Avoided Deforestation (CliPAD) programme, Deutsche Gesellschaft für Internationale Zusammenarbeit (GIZ): Vientiane, Lao PDR, 2011; p. 50. Available online: https://amor.cms.hu-berlin.de/~muelleda/download/Mueller_&_Suess_2011_MODIS_fire_hotspots_to_monitor_vegetation_fires_in_Laos.pdf (accessed on 22 October 2019).
  80. Justice, C.O.; Giglio, L.; Korontzi, S.; Owens, J.; Morisette, J.; Roy, D.; Descloitres, J.; Alleaume, S.; Petitcolin, F.; Kaufman, Y.J. The MODIS fire products. Remote Sens. Environ. 2002, 83, 244–262. [Google Scholar] [CrossRef]
  81. Rathore, C.S.; Dubey, Y.; Shrivastava, A.; Pathak, P.; Patil, V. Opportunities of habitat connectivity for tiger (Panthera tigris) between Kanha and Pench national parks in Madhya Pradesh, India. PLoS ONE 2012, 7, e39996. [Google Scholar] [CrossRef] [PubMed] [Green Version]
  82. Müller, D.; Suess, S.; Hoffmann, A.A.; Buchholz, G. The value of satellite-based active fire data for monitoring, reporting and verification of REDD+ in the Lao PDR. Human Ecol. 2013, 41, 7–20. [Google Scholar] [CrossRef]
  83. Tanpipat, V.; Honda, K.; Nuchaiya, P. MODIS Hotspot Validation over Thailand. Remote Sens. 2009, 1, 1043–1054. [Google Scholar] [CrossRef] [Green Version]
Figure 1. Study area (Bhutan) and forest fire inventories (record of forest fire incidences, shown in red dots from 2013 to 2015).
Forecasting 02 00003 g001
Figure 2. A flowchart of Analytic Hierarchy Process (AHP) and Frequency Ratio (FR)-based modeling of forest fire-prone areas in Bhutan using a Geographic Information System.
Forecasting 02 00003 g002
Figure 6. Comparison of the Area Under Curve (AUC) curves for assessing the predictive accuracies of (a) AHP and (b) FR modeling of forest fire-prone areas in Bhutan.
Forecasting 02 00003 g006
Figure 7. Moderate Resolution Imaging Spectroradiometer (MODIS) fire points (red dots) overlaid with final forest fire-prone areas maps in Bhutan.
Forecasting 02 00003 g007
Figure 8. Comparison of MODIS fire points overlaid with AHP and FR-based fire-prone classes in Bhutan.
Forecasting 02 00003 g008
Table 1. Land-use and anthropogenic factors that determine an area’s proneness to forest fire in Bhutan. Higher values reflect higher proneness. The values are assigned based on empirical field observations and expert judgments.
Spatial LayersClassesHazard Value
LULCGlaciers/Snow/Rock outcrops/ Water spreads/landslips/Marshy areas1
Meadows2
Scrub forest/Settlements/Agriculture/Improved pasture/horticulture3
Plantations4
Broadleaf5
Fir 6
Broadleaf with conifer7
Mixed Conifer 8
Blue pine9
Chirpine10
Settlement (Distance from human settlement in meters)0–1927.610
1927.7–3426.99
3427–5140.48
5140.5–6853.97
6854–8781.56
8781.6–11,1385
11,139–13,9224
13,923–17,9913
17,992–24,8452
24,846–54,6171
Road (Distance from road in meters)0–236.6110
236.62–1183.19
1183.2–2602.88
2602.9–4259.17
4259.2–61526
6152.1–8518.15
8518.2–11,3574
11,358–16,0903
16,091–25,7912
25,792–60,3371
Border (Distance from the southern international border with India in meters)0–3742.610
3742.7–83499
8349.1–13,2438
13,244–18,4257
18,426–24,1836
24,184–30,2295
30,230–36,8514
36,852–44,9123
44,913–54,4122
54,413–73,4131
Table 2. Geophysical factors that determine an area’s proneness to forest fire in Bhutan. Higher values reflect higher proneness.
Spatial LayersClassesHazard Value
Aspect (directions)Flat6
North1
Northeast4
East5
Southeast7
South9
Southwest8
West3
Northwest2
Elevation (meters above sea level)5–8911
891.001–14062
1406.01–18563
1856.01–22954
2295.01–27145
2714.01–31116
3111.01–35567
3556.01–40908
4090.01–46549
4654.01–75199
Slope (Degree)0–11.7581
11.759–16.62
16.601–20.4043
20.405–23.5164
23.517–26.6295
26.63–29.7416
29.742–32.8547
32.855–36.6588
36.659–41.8459
41.846–87.849
Table 3. A 7 × 7 Analytic Hierarchy Process (AHP) matrix showing pairwise comparison of forest fire conditioning factors with respect to perceived influence on forest fire susceptibility using expert knowledge in Bhutan. Unity of diagonal represents equality of weights, which range from 1/9 (extremely low importance) to 9 (extremely high importance).
FactorsLULCSettlementRoadBoundaryElevationAspectSlope
LULC1345678
Settlement1/3123456
Road1/41/212345
Boundary1/51/31/21234
Elevation1/61/41/31/2123
Aspect1/71/51/41/31/212
Slope1/81/61/51/41/31/21
Table 4. The weights for the seven conditioning factors in Bhutan with respect to influence on forest fire susceptibility derived from an Analytical Hierarchy Process with a consistency ratio of 0.05.
FactorsDerived Ratio ScalePercentage of Influence
LULC0.45145
Settlement0.18819
Road0.12412
Boundary0.0869
Elevation0.0636
Aspect0.0495
Slope0.044

