
A Real-Time Data Analysis Platform for Short-Term Water Consumption Forecasting with Machine Learning


IRIMAS Laboratory, University of Haute Alsace, 61 rue Albert Camus, 68093 Mulhouse, France
*
Author to whom correspondence should be addressed.
Forecasting 2021, 3(4), 682-694; https://0-doi-org.brum.beds.ac.uk/10.3390/forecast3040042
Submission received: 3 August 2021
/
Revised: 10 September 2021
/
Accepted: 22 September 2021
/
Published: 26 September 2021
(This article belongs to the Special Issue Feature Papers of Forecasting 2021)
Abstract
:This article presents a real-time data analysis platform to forecast water consumption with Machine-Learning (ML) techniques. The strategy fully relies on a web-oriented architecture to ensure better management and optimized monitoring of water consumption. This monitoring is carried out through a communicating system for collecting data in the form of unevenly spaced time series. The platform is completed by learning capabilities to analyze and forecast water consumption. The analysis consists of checking the data integrity and inconsistency, in looking for missing data, and in detecting abnormal consumption. Forecasting is based on the Long Short-Term Memory (LSTM) and the Back-Propagation Neural Network (BPNN). After evaluation, results show that the ML approaches can predict water consumption without having prior knowledge about the data and the users. The LSTM approach, by being able to grab the long-term dependencies between time steps of water consumption, allows the prediction of the amount of consumed water in the next hour with an error of some liters and the instants of the 5 next consumed liters in some milliseconds.
1. Introduction
Water consumption analysis is crucial as it assists building managers and operators to adopt better strategies to plan usages [1]. Forecasting is an important part for continuous monitoring and efficient management of consumption [2]. Furthermore, an accurate forecasting of consumption is essential for efficiently detecting and avoiding water leakages and wastes in distribution networks and installations [3]. Various methods to predict near-real-time water consumption and demand have been investigated. A complete literature review has been proposed in [4]. Among then, statistical methods, filtering and signal processing techniques, fuzzy logic, intelligent techniques and combinations of several models have shown more or less success. More recently, innovative models such as Machine-Learning (ML) techniques showed superior results when compared with classical models. Specifically, deep neural networks have emerged as efficient forecasting approaches. Regardless of the method, the robustness of the forecasting performance mainly depends on not only on the past water demand data but on contextual and environmental information (weather conditions, well-identified user profiles, knowledge about the architecture of the water distribution system, etc.), on redundancy of measurements and on the short, medium and long-term planning decisions to be addressed. Water demand forecasting remains a major research problem when no information is available behind the consumption of a single water meter.
This article presents a real-time data analysis platform to forecast water consumption with ML techniques only based on past water consumption, i.e., with no prior and contextual information. The strategy fully relies on a web-oriented architecture to ensure better management and optimized monitoring of water consumption [5]. It is a complete Advanced Metering Infrastructure (AMI) based on integrated Internet of Things (IoT) technologies [6] that offers the possibility of collecting, analyzing and monitoring daily water consumption [7]. To predict water consumption, we also propose a framework based on ML algorithms such as the Long Short-Term Memory (LSTM) [8] and the Back-Propagation Neural Network (BPNN). The water consumption data are stored as unevenly spaced time series constructed from the collected data issued from distributed smart meters. Then, time series are handled in two different ways, with an explicitly and an implicitly sampling [9]. With explicitly sampled time series, the ML approaches predict the quantity of water consumed in the next coming hours [10]. With implicitly sampled time series, the ML approaches predict the instants when the next liters will be consumed. Both cases are achieved using the LSTM [8,11] and the BPNN [12]. The accuracy and usability of the forecast are evaluated and compared. This study can be generalized for any other type of consumption such as electricity and gas for example.
The rest of this article is organized as follows: Section 2 briefly presents appropriate ML approaches for analyzing consumption data with different forecasting horizons. Section 3 details the architecture of the AMI for collecting data. Consumption data are presented in terms of water volumes, indexes and dates of events. In other words, these data are considered to be unevenly spaced time series or Load Curves (LC). A preprocessing strategy is also developed in this section to handle and to compensate for missing and abnormal water consumptions. The two ML strategy, for forecasting the number of consumed liters in the next hour and the instants of the future consumed liters, are presented in Section 4. This section also includes some experimental tests and evaluations. Finally, concluding remarks are provided in Section 5.
2. Machine-Learning Algorithms for Water Consumption Forecasting
2.1. Forecasting with Machine-Learning Algorithms
Short-term forecasts, whether in water [2,13], in electricity [14,15] or even in gas [16], have been reported in the literature with a variety of approaches and with different horizons. However, very few of them have treated individual customers in domestic buildings [8] with high resolution. In fact, the approach proposed in [17] is based on a model of non-homogeneous Markov chains allowing knowledge of the dynamics of water consumption. This model can predict behaviors of daily consumption based on other parameters such as exogenous factors represented by the climate [18], the day type, etc. Another study [19] deals with the water demand forecasting on weekly and hourly scales with an autoregressive model based on a periodic component on time series data to refine daily demand values and hours. This prediction uses a multitude of period models. Most of these studies focus on forecasting consumption by introducing other parameters using different predictive models depending on the nature of the input data and the sought objectives. Indeed, we note that the provided forecast horizon mainly depends on the input databases of the models. These database generally have annual, seasonal, monthly, weekly, daily or hourly resolutions. Most of the work, even based on intelligent techniques, are based on additional information. For example, the study in [20] uses support vector machines with monthly water demands, number of users, and total water consumption bills. Ref. [21] discusses residential water demand management based on pricing, restriction policies, climate, weather and demographic characteristics. For now, there is no study based on learning architectures such as direct or recurrent BPNN, Hopfield networks or LSTM to predict the water demand based on historical data from only one single measurement point.
On the other side, we propose more precise forecasts with data issued from smart meters with high resolution and no additional contextual information. In this paper, we focus on forecasting water consumption from a private building without any knowledge about appliances using water and the number of inhabitants.
2.2. Forecasting Framework Based on LSTM
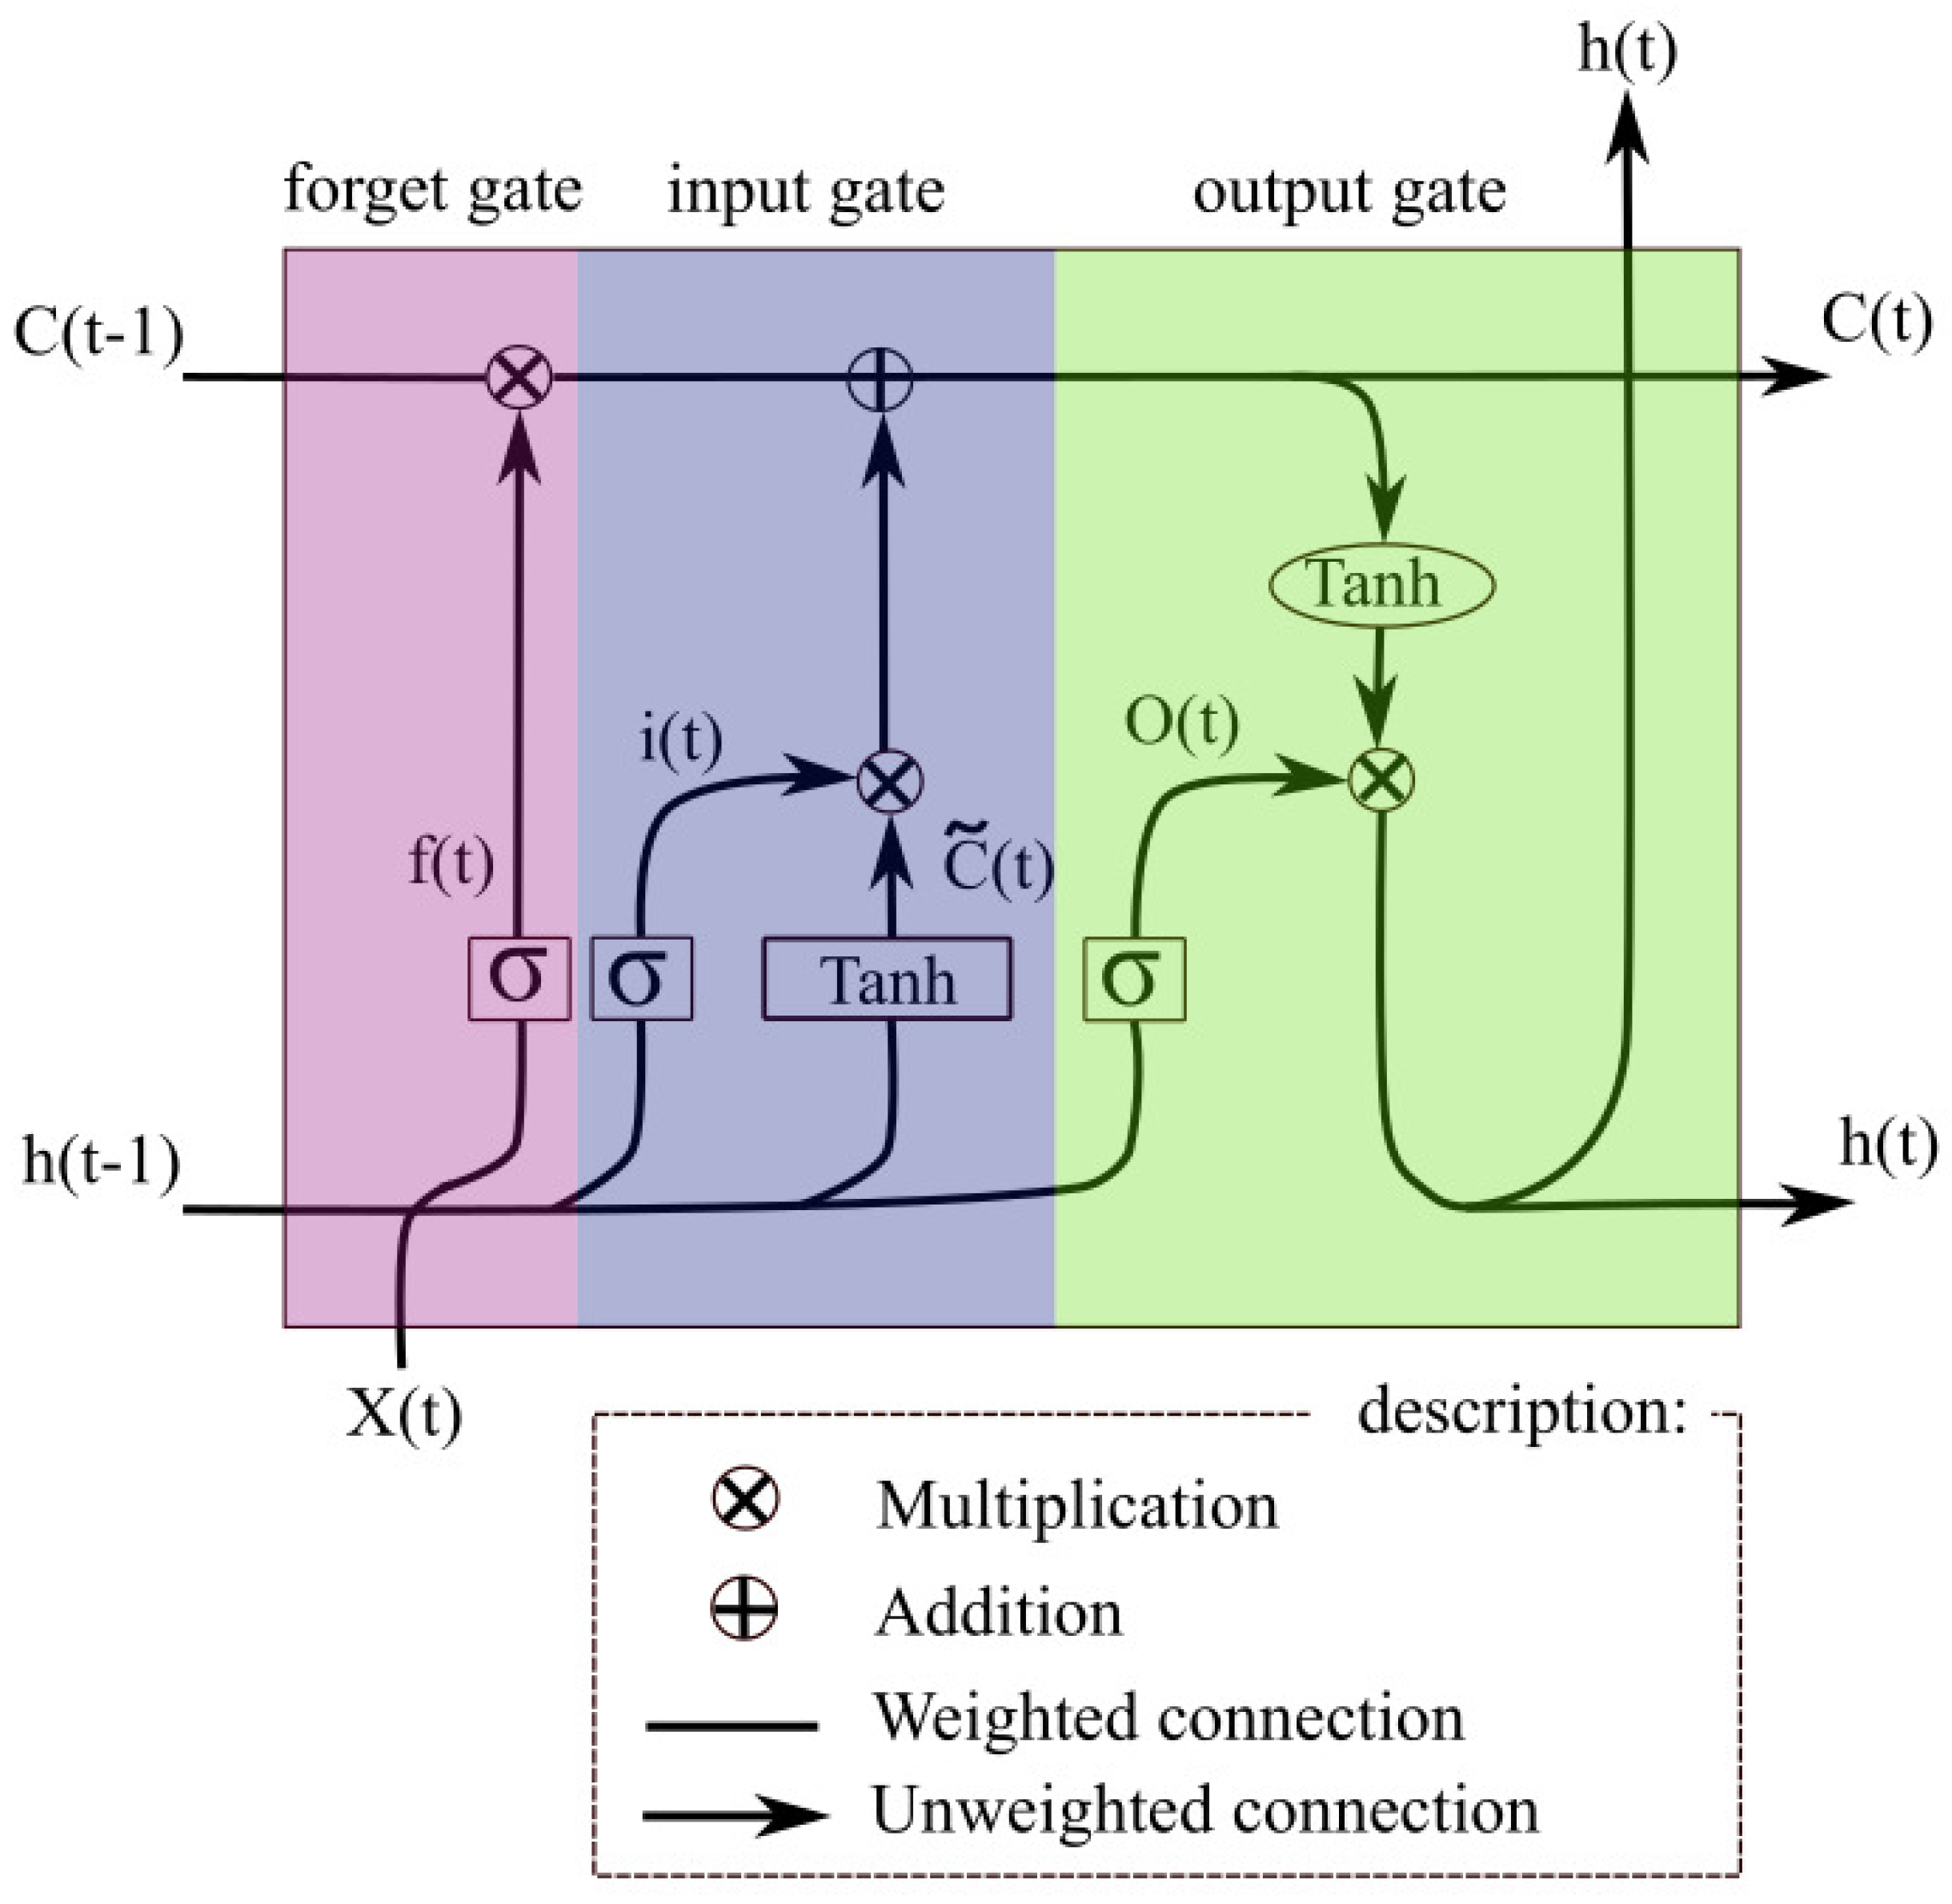
The LSTM [8] is a special type of recurrent neural network [8]. It is a sequential learning model which can establish temporal correlations between a previous instant t − 1 and a current instant t. Consequently, the LSTM seems the most suitable model for forecasting consumption processes, given its ability to deduce the intrinsic daily consumption resident routines. The LSTM is based on the Back-Propagation Through Time (BPTT) learning algorithm [8] to calculate the weights. It is made up of units called memory blocks. Each memory block contains an “input gate”, an “output gate” and a “forget gate”, as shown in Figure 1.
The behavior of each gate is represented by an equation. The input gate given in (1) consists of transmitting the output h at the previous instant and the input x at instant t through a sigmoid function :
A hyperbolic tangent function is applied to the input and the output data from the previous step to create a vector of a new value to be an internal state. The update of the internal state is carried out through:
The forget gate is calculated with another sigmoid function that takes for its input the output and the input :
Finally, the output gate described by (5) is based on the state . This state is updated with a hyperbolic tangent multiplied with the output of a sigmoid:
, , , , and , , , represent respectively the weights and the biases at the different levels in the LSTM memory block. They are adjusted iteratively with the BPTT learning algorithm [8] until convergence. At each step of the learning process, the performance of the LSTM can be evaluated by an error such as the Root Mean Square Error (RMSE) [22] where , and n are respectively the reference, the estimated value and the number of data:
This learning approach will be used in the following to forecast short-term water consumption.
3. Proposed Architecture and ML Framework to Collect and Analyze Water Consumption Data
3.1. Data Collecting with Smart Meters
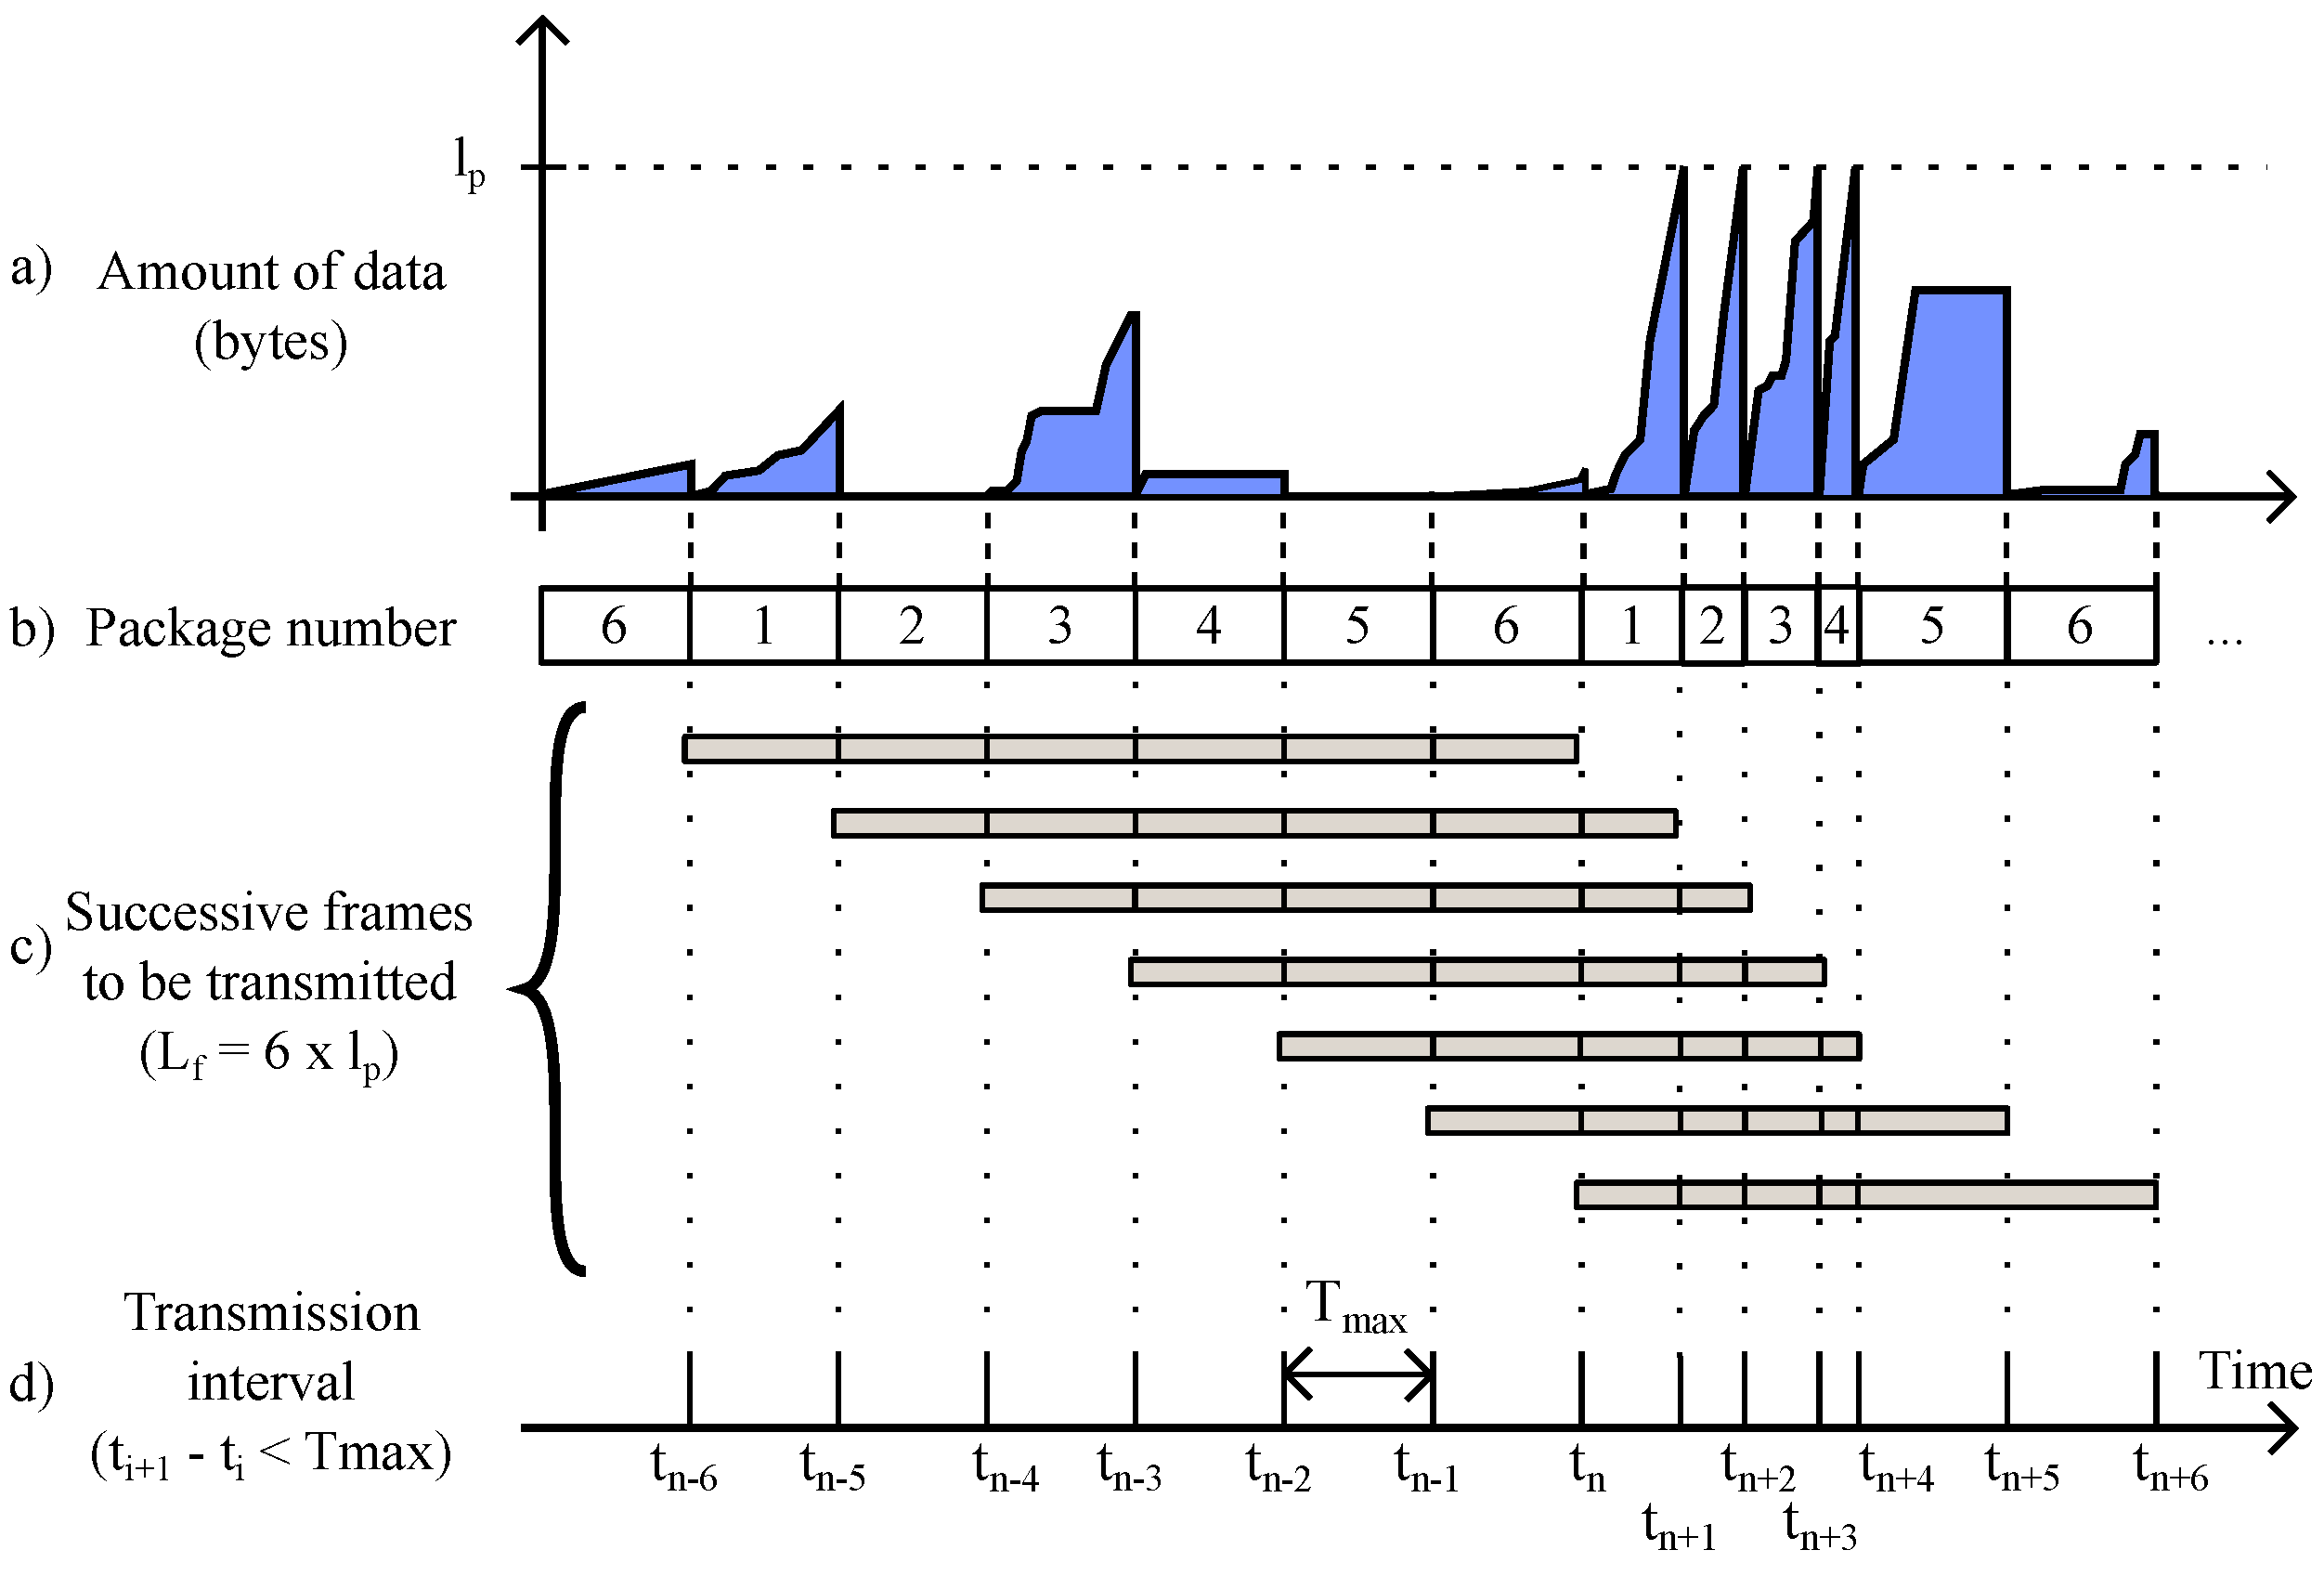
All the data used in this study are collected in an online database from smart water meters. Smart meters are IoT devices that are appropriate to build a sustainable and advanced consumption data system [23]. Most water distributors collect data from smart meters with a resolution of several minutes, for example every 15, 30 or 60 min, or even once a day [5]. This implies that the capacities of smart water meters are clearly not fully exploited [7]. This also means that the resolution of the consumption data is low. We use smart meters with the communication strategy proposed and developed in [24] to compress and to transmit the data with a very high resolution [7] according to industrial specifications. This strategy allows the dating on the server side of each liter consumed and reduces the energy consumption on the meter side. Indeed, emission duration that consumes a lot of energy for the smart meters have been greatly reduced. This strategy is embedded in the smart meters and transmits data in the form of frames with a interval which does not exceed 5 min. This interval is completely adaptive and related to the amount of consumed water [7]. Higher water consumption results in more data frames. To guarantee the reception of frames with no missing data, a sliding window is proposed which consists of packages. These packages are numbered and can be considered to be independent broadcasts in the transmitted frame. This ensures the redundancy of the data through successive frames. This principle is illustrated in Figure 2. The maximum length of a frame, with the length of a package, is set depending on the radio technology and frequency that are used. In our AMI, we chose a maximum value of 120 bytes for which is the limit of the frame size.
A web server receives all the transmitted frames from several smart meters. Here, a script receives, decompresses, and retrieves the data from the frames for storage in an SQL database [10]. This process runs continuously since 2014 and allows completion of the database in real time and under real operating conditions. The database contains raw data for each individual smart meter, i.e., the index which represents the volume of consumed water in liter and the instant when each liter has been consumed in millisecond. This instant is called a pulse or an event [7]. It is obvious that the data collected and stored according to this platform are of high resolution and therefore precisely represent consumption habits.
At any time, it is possible to extract from the database with another script, the data related to a well-defined smart meter by specifying the beginning and the end of a period. This is called a set of row data.
3.2. Data Description
The collected data are of a great value and must be analyzed. For this, the raw data must interpreted and therefore associated with some theoretical concepts and models. Among them are unevenly spaced time series or Load Curves (LC).
3.2.1. Water Consumption Time Series
A time series is a sequence of temporal data [25]. The time stamp of the series can be explicit such that a date is given for each data value or controlled by the appearance of the data represented by events perfectly dated. This is referred to as an unevenly spaced time series [9] defined by S in (7). In the context of water consumption, an event corresponds to each consumed liter and S is thus a sequence of scalar values of an incremented variable . S therefore corresponds to the raw data extracted from the previously described platform for one smart meter and is the result of a process observed during a period T. The platform and AMI proposed by [7] offer the possibility of recording the instants of consumption of each liter.
3.2.2. Cumulated Water Consumption: The Index and the Load Curve
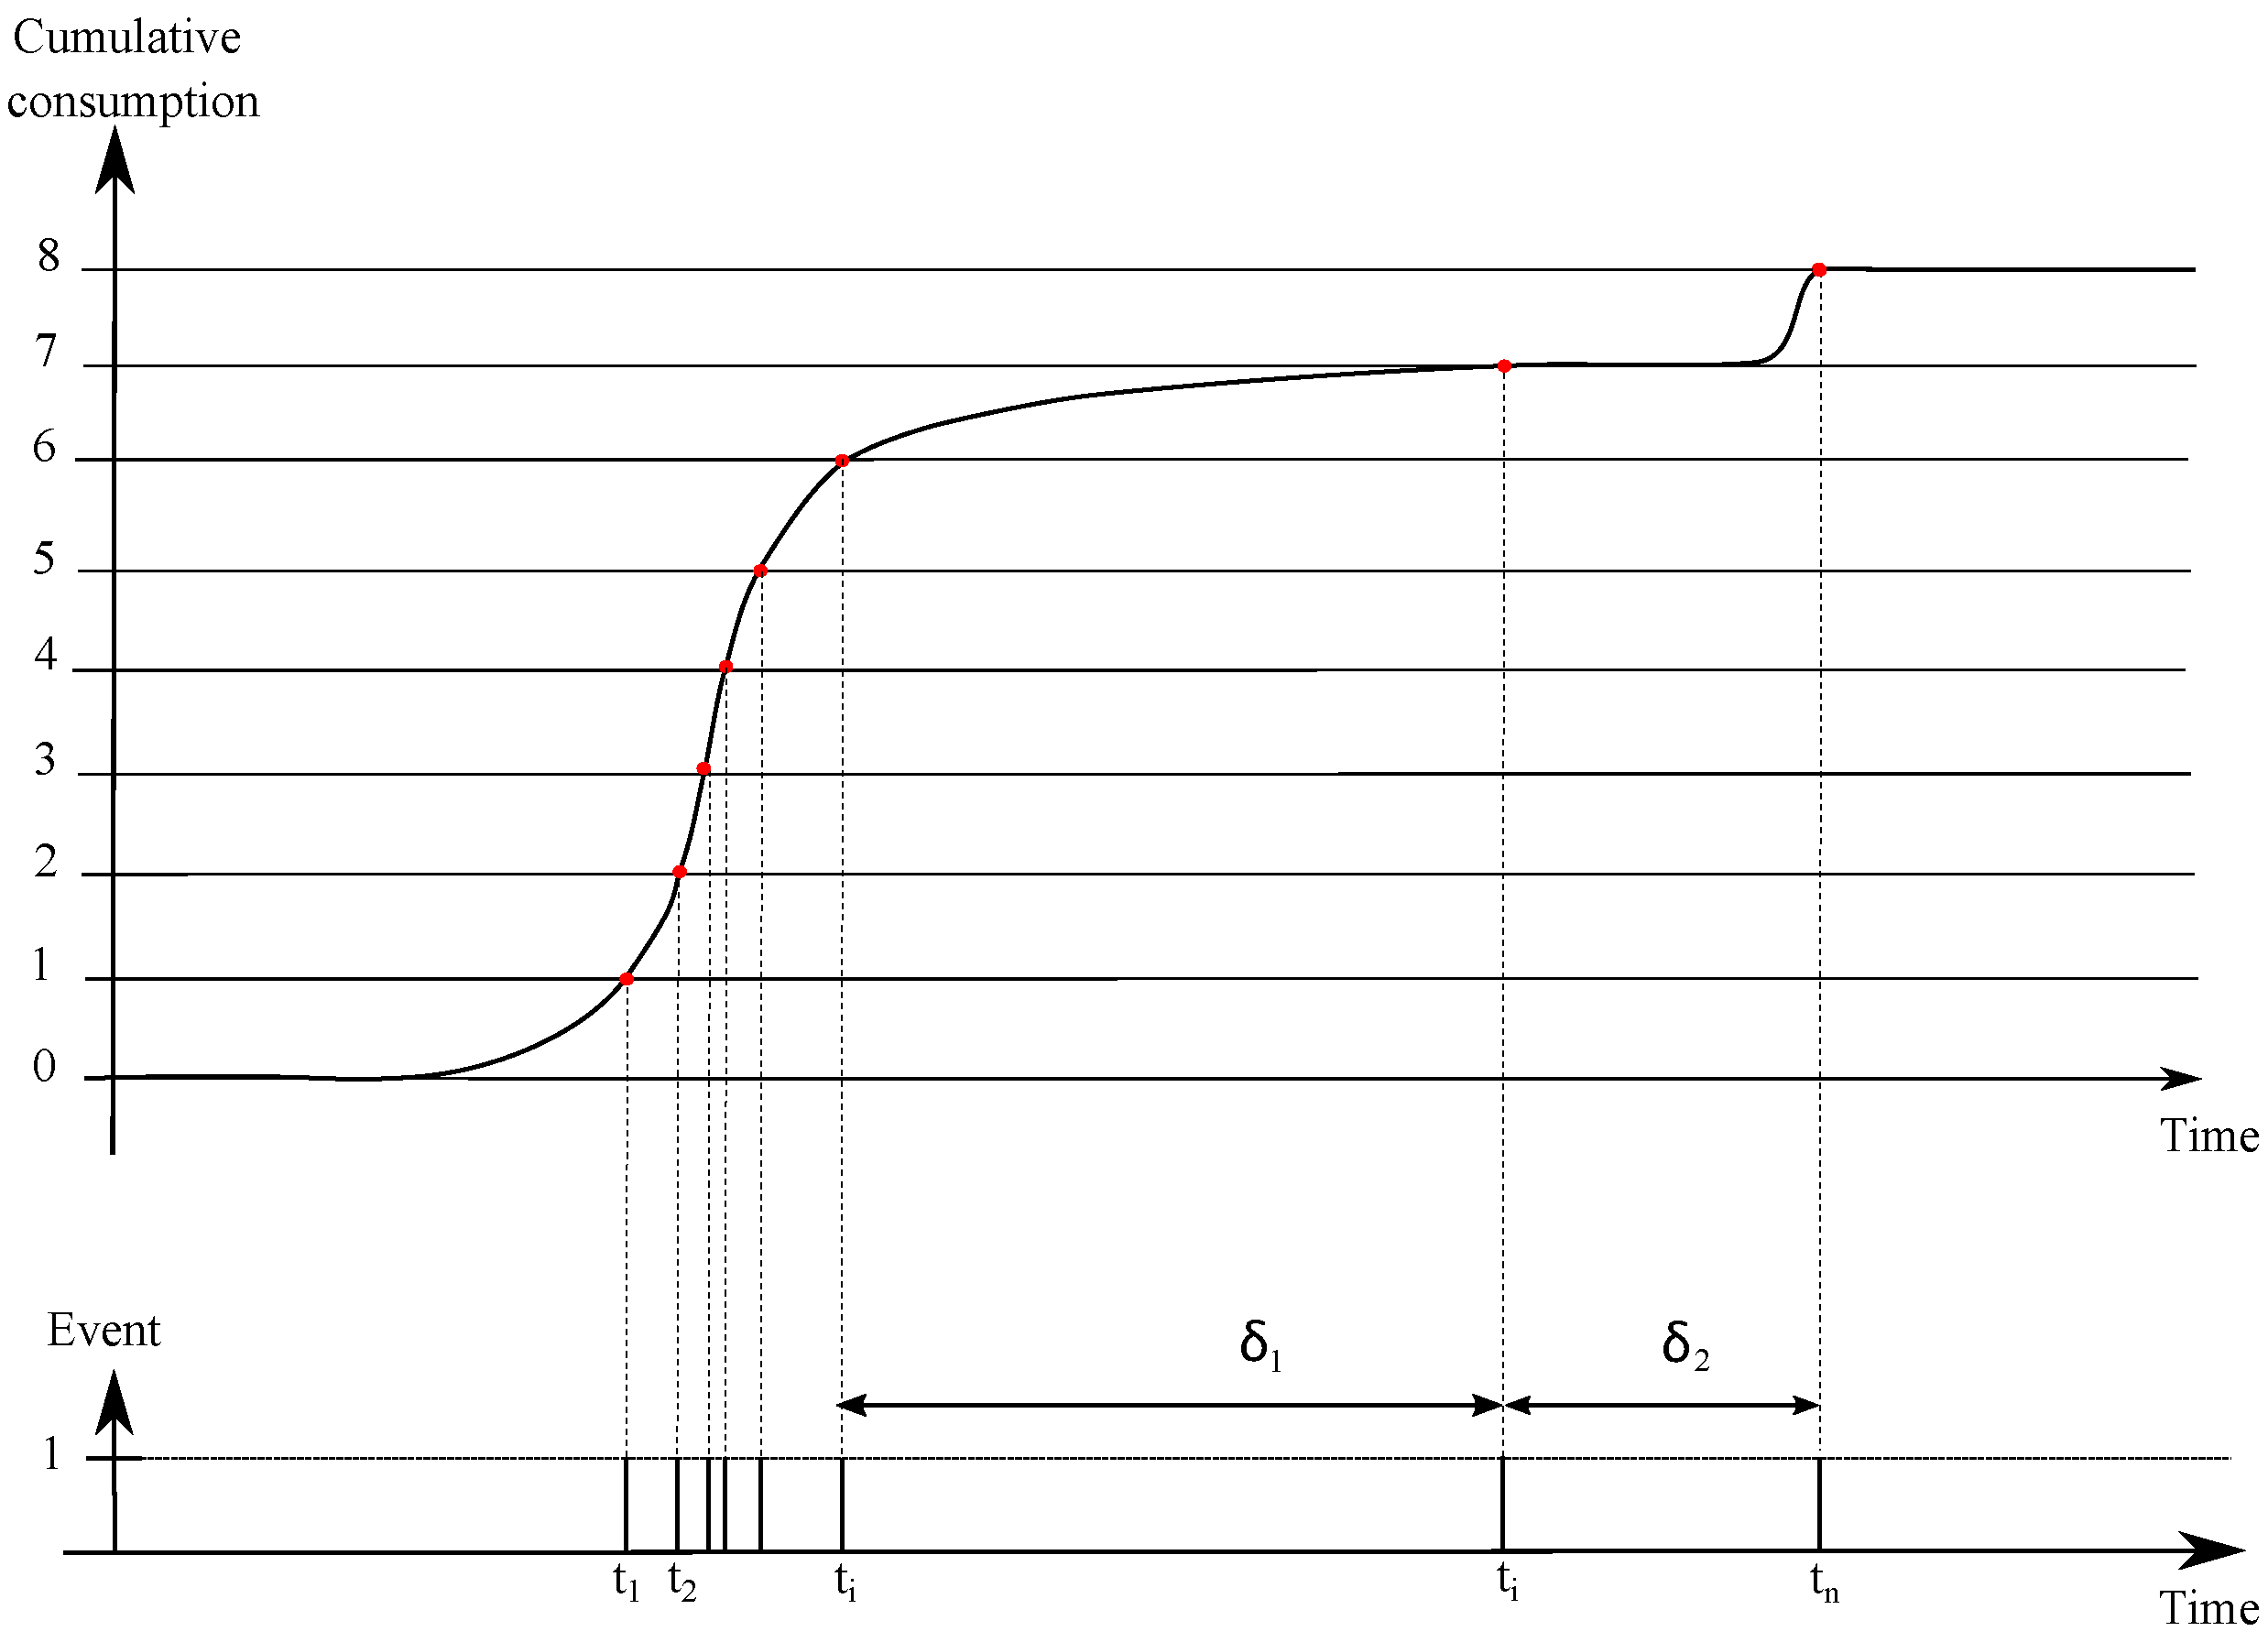
Each represents the index of a smart meter which is the cumulated volume of consumed water at each instant . The time between two instants and is not constant. The evolution of during a period T is called a cumulative LC. An example is provided by Figure 3, it is an alternative representation of S. LC are very useful for analyzing and comparing consumption over days, weeks, months. We than speak of daily LC, weekly LC or monthly LC.
3.2.3. Sampled Water Consumption Data Series
The data collected from the platform is unevenly spaced in time. Each consumed liter represents an event, the process of water consumption can also be seen as a process generating dated event. To make the data compliant with most of the popular data analysis tools and concepts, a sampling is proposed to make the series evenly spaced in time. The sampling can be made in minutes or in hours and results in a sequence of 1440 data per day or 24 data per day.
We also chose to derivate the cumulative LC in order work with sequences of n data that represents the number of liters consumed in each minute or hour. Consequently, a natural order of appearance constitutes an implicitly sampled chronological time series such as:
3.3. Data Integrity Checking and Interpolation
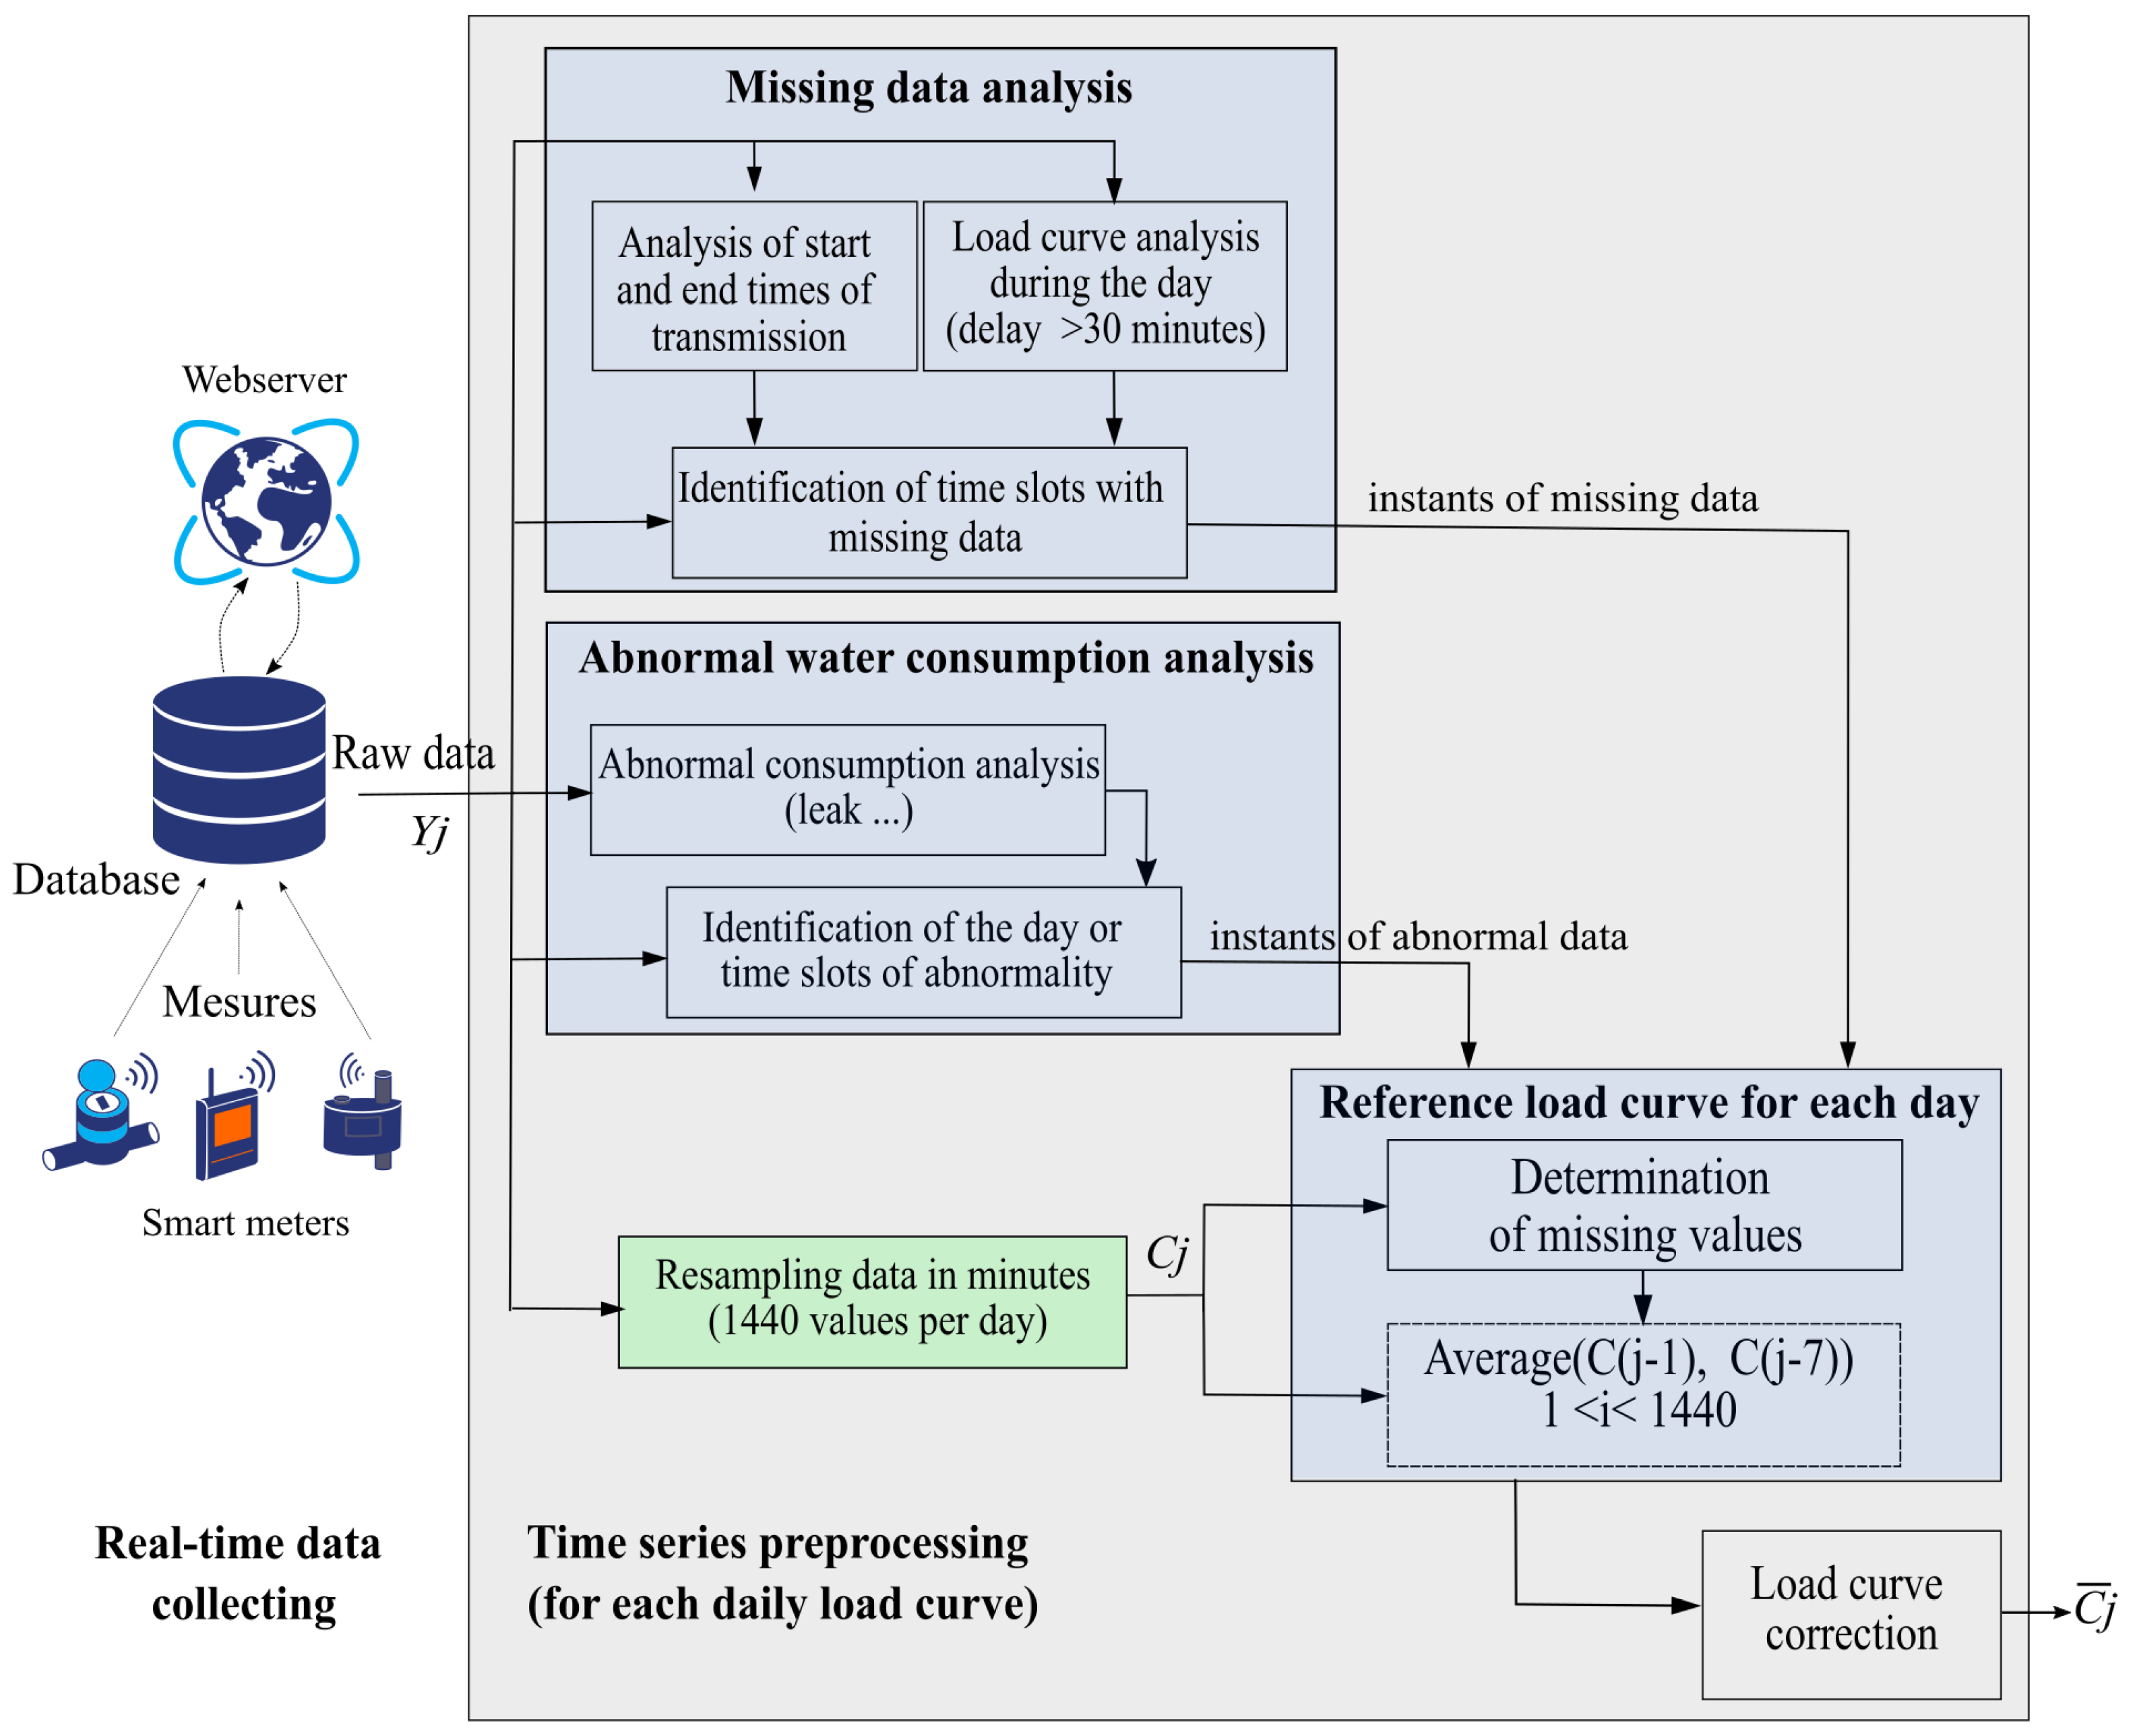
Under real operating conditions, the integrity of the data must be checked. Indeed, failures or malfunctions can lead to missing raw measurements in the database. We therefore propose a preprocessing step of the raw data to verify the data and to complete by interpolation eventually missing data. The whole proposed preprocessing strategy is represented by Figure 4. The raw time series is extracted from the database for each day. Since a forecast of water consumption is targeted with an accuracy of one hour, the data are sampled with a resolution of minute (i.e., 1440 mn per day). This preprocessing is achieved separately for each day. Then, periods without consumed liters, i.e., events, are identified and corrected by interpolation.
Data analysis and forecasting with ML algorithms needs to be achieved with no missing or inconsistent values. It is thus necessary to identify and separate abnormal consumption (such as water leakage, occasional consumption) which can influence water consumption) from normal and usual consumption. Abnormal water consumption is always due to an unusual and occasional behavior from the users [25]. The detection of abnormal water consumption is achieved as follows. A reference cumulative LC is calculated for each day of the week. This reference LC is completed with a minimum LC and a maximum LC for each day. Generally, a load profile for one day j is strongly correlated [26] with that for the previous day and to the day for the previous week . The reference cumulative LC is calculated with:
The minimum and a maximum LC for each day are calculated by the same way by changing the average function in (9) by and functions. The detection of normal consumption is based on the criteria given by:
where is standard deviation for each value of the LC and is a numerical variable chosen empirically, in our case . Additional tests can be achieved to see if the instantaneous consumption is out of the range defined by the minimum and maximum LC for the same day of the week and allow the detection of any additional consumption that deviates significantly from the "normal consumption" [10]. It can be noticed that the detection of abnormal and unusual consumptions is only based on water consumption data and some statistical indicators [10]. Abnormal and unusual consumptions are corrected by an interpolation during their duration and will not be taken into account in the learning processes. At the end, we obtain a time series sampled in minutes which corresponds to the LC without loss of data and without abnormal and unusual consumptions.
4. Water Consumption Forecasting
To evaluate the efficiency of the platform and the ML techniques, we focused on the water consumption of a private building. The water consumption is collected from a smart meter which is a single measurement point for the whole building. These are the only data available from the building and the users. The objective consists of forecasting the number of liters of consumed water with a horizon of one hour and to predict the instant of the next consumed liter by different ML approaches.
All the algorithms have been developed with the Matlab R2018b environment on a desktop computer with 4 cores (Intel i7 processors at 3.6 GHz) and 16 GB of memory. Experiments and tests have been carried out under the same conditions to find the values of the learning parameters by trial and error (learning rate value, number of neurons, number of hidden layers, type of activation function) to provide the smallest error.
4.1. Hourly Water Consumption Forecasting
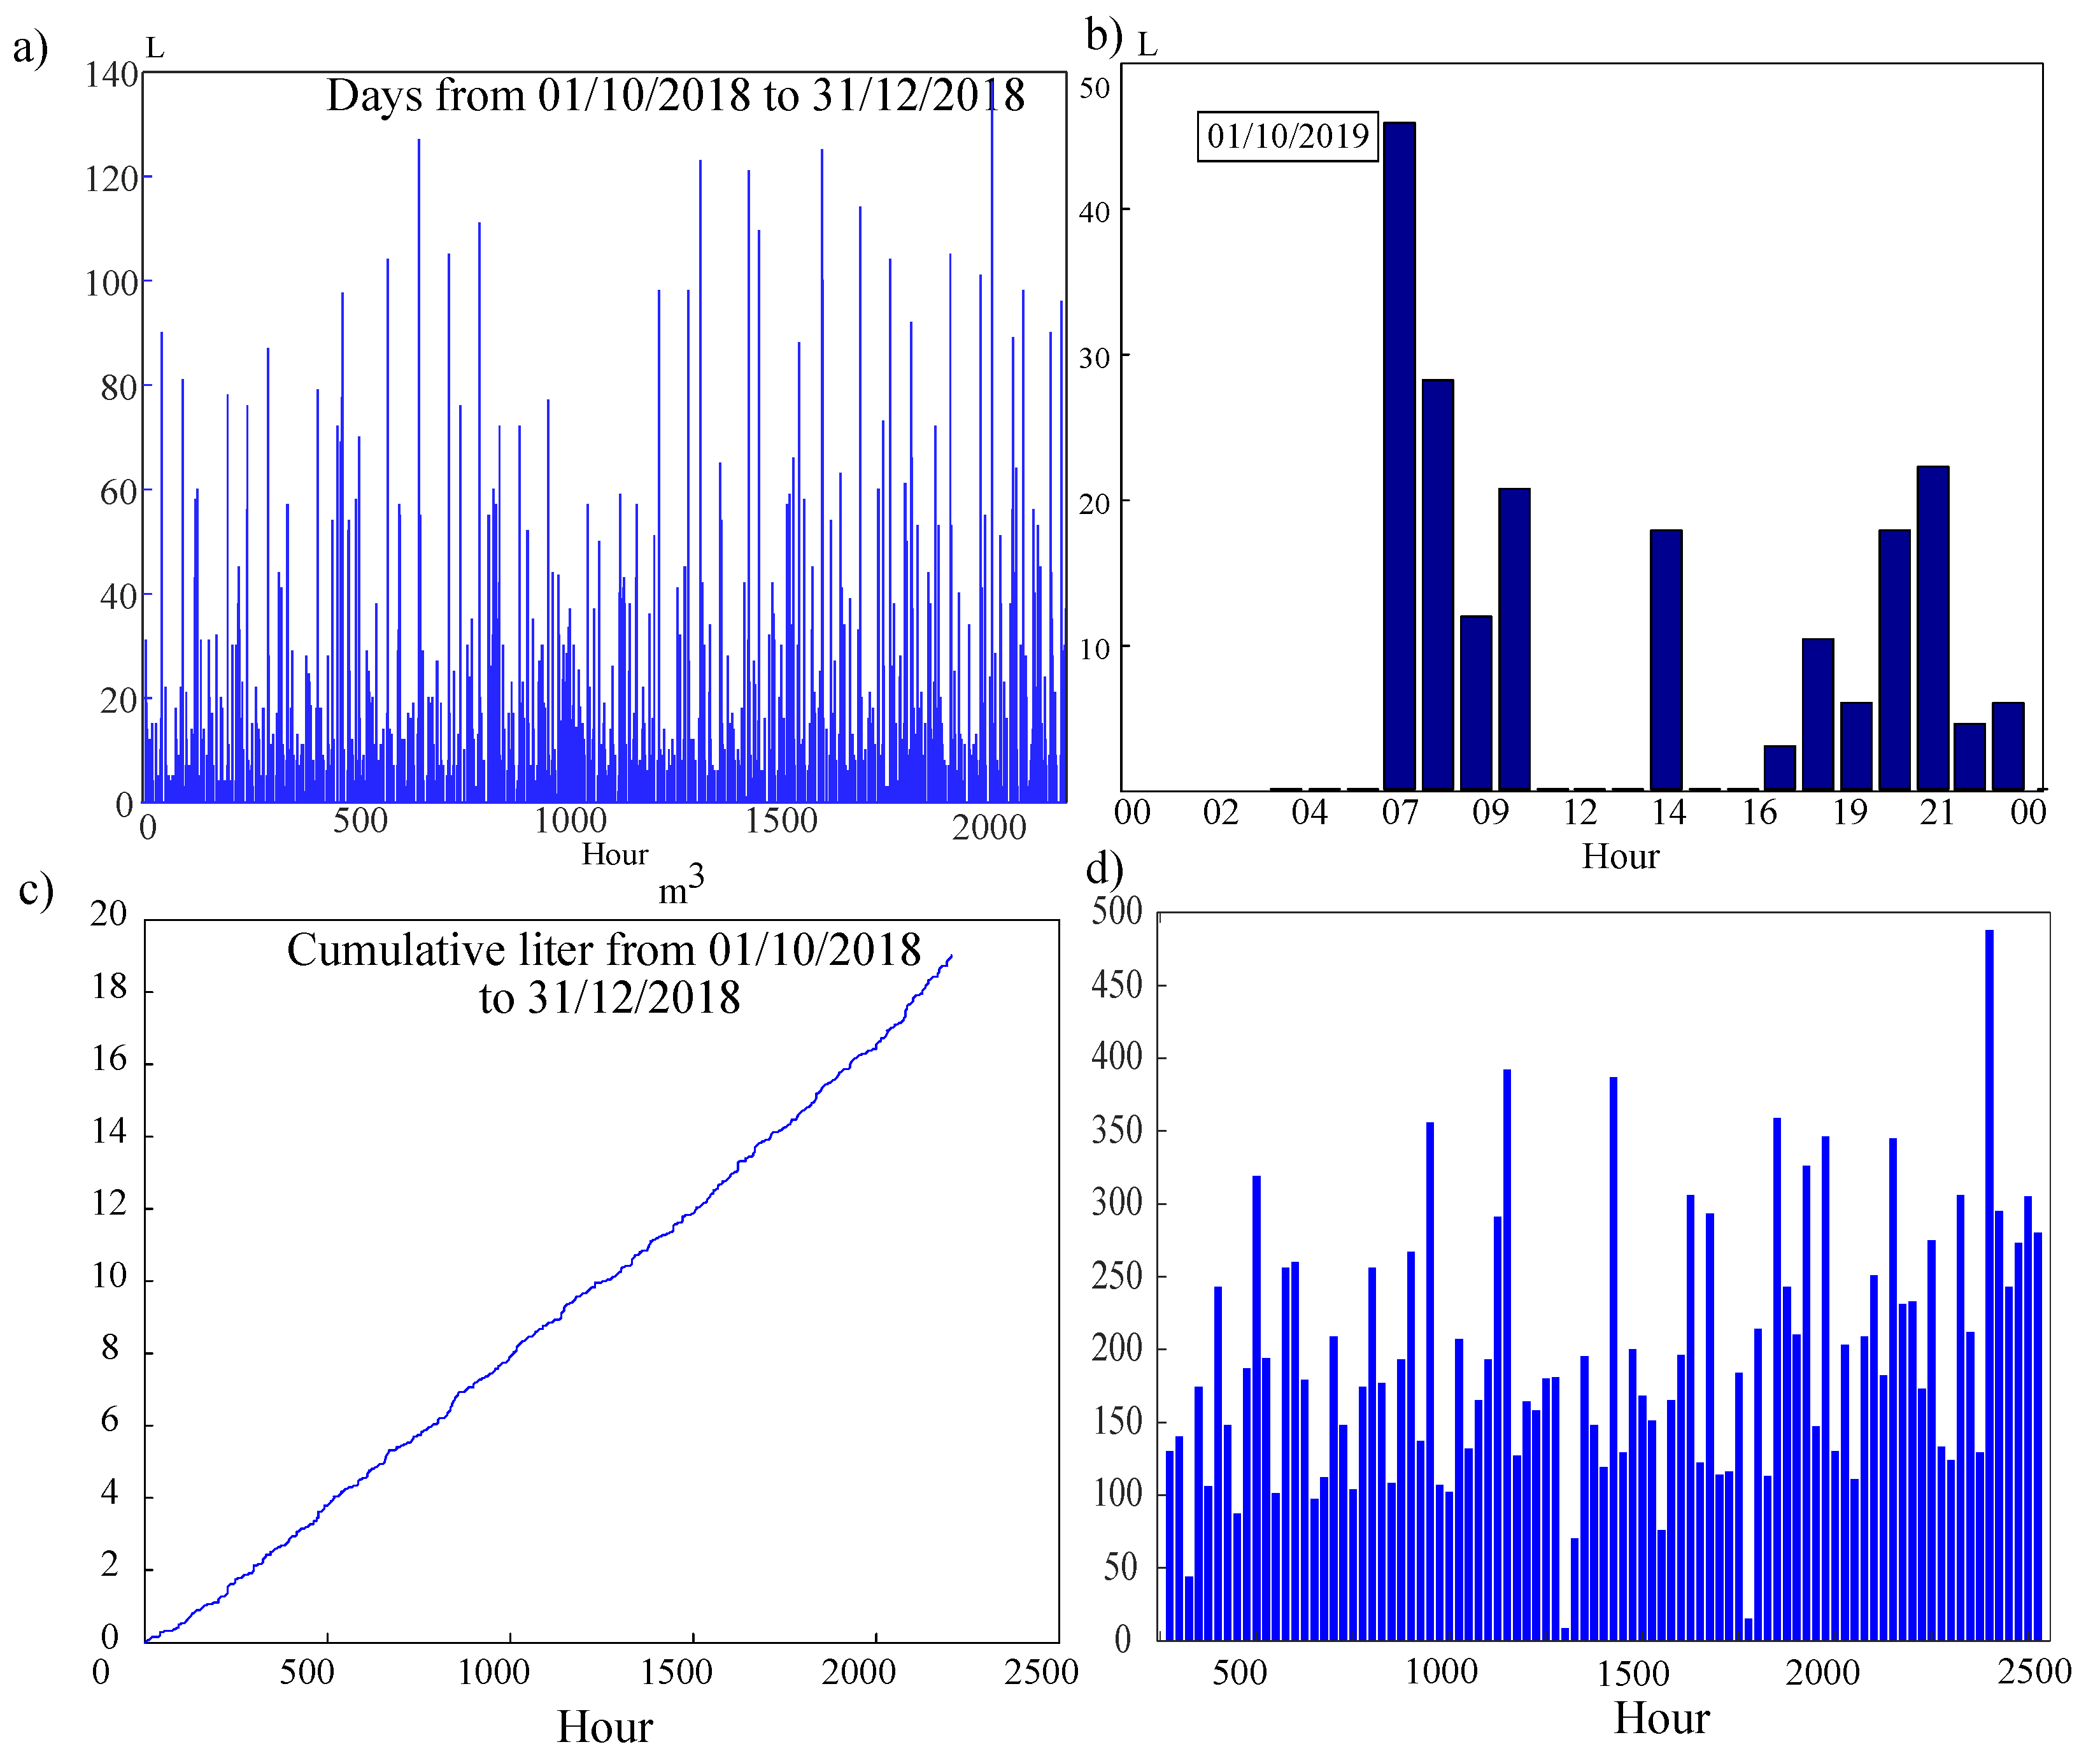
A three-month database (from October 2018 to December 2018) has been chosen to forecast the number of consumed water liters in the next coming hour. The data sequence is resampled with a resolution of one hour and is represented by Figure 5. This consumption has been recorded in a domestic house in France occupied by two people who consume on average 194 L per day (l/d). Household information will not be used by the ML approaches.
Two ML approaches have been implemented for a one-hour water consumption forecasting, the LSTM and the BPNN. For this case, the series represented by Figure 5c is the input of the forecast approaches. With the LSTM, input in Equations (1), (2), (4) and (5) is the preprocessed cumulative LC . We use the Adam algorithm, i.e., an optimization stochastic gradient descent for training deep learning approaches [27] to handle the noisy data. Indeed, the Adam algorithm is suitable for data with a lot of noise. We chose a learning rate value of 10 for the LSTM and 10 for the BPNN model and the training ends with a maximum number of epochs chosen at 100.
The forecast performances with the two learning approaches are evaluated with the RMSE and results are presented in Table 1. It can be seen that the LSTM can forecast the water consumption in the next hour with a precision of 6 L while the BPNN predicts the future consumption with a precision of 24 L (the consumption range is approximately between 1 to 50 L per days).
4.2. Forecasting Events of Water Consumption in Milliseconds
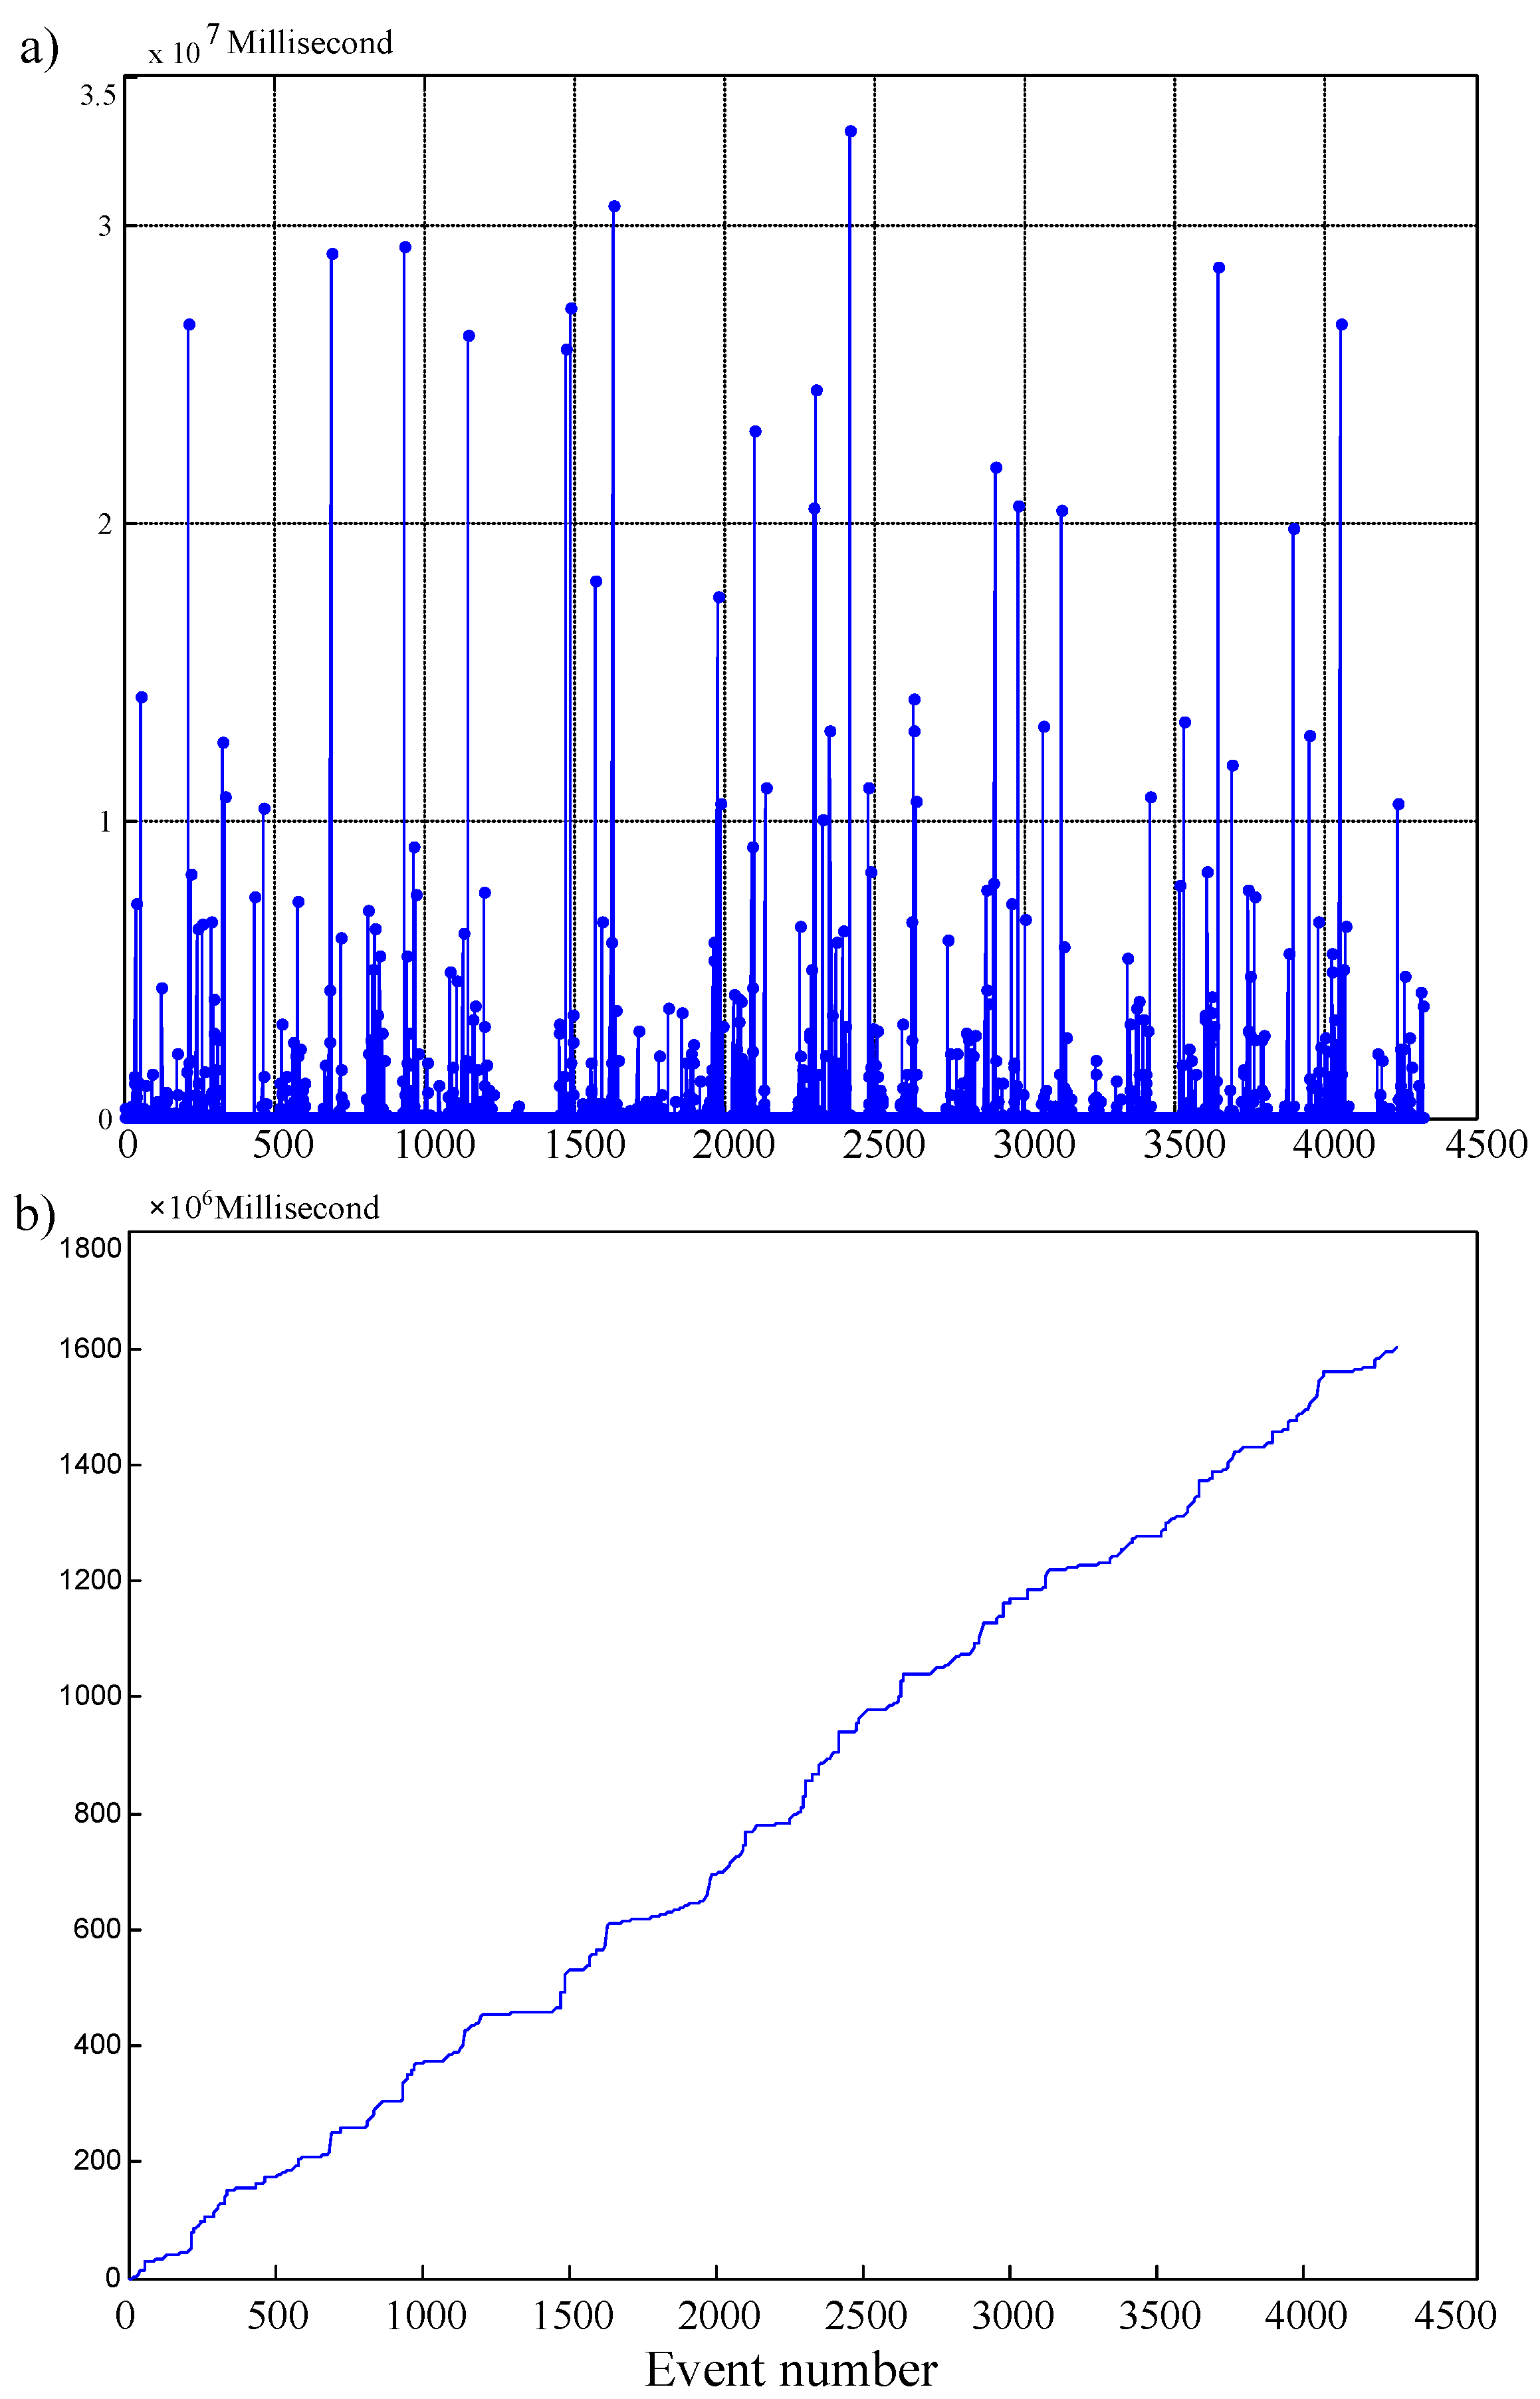
We also forecast the coming events, i.e., the instants when the next liters will be consumed. For this purpose, we chose a dataset composed of 4321 events dated in milliseconds, each representing the time difference between two consecutive liters. Obviously, this dataset provides more detailed information about the water consumption than in the previous experiment. The dataset has been recorded between December the 2nd to the 20st, 2018 and is represented by Figure 6. The dataset is divided into three subsets for the learning of the LSTM and the BPNN, the training, validation and test subsets which are respectively distributed in a percentage of the dataset: 60%, 0.3% and 40%. The parameters of two learning approaches are summarized in Table 2. Their input vector is composed of the time difference between two successive consumed liters, i.e., the values of represented by Figure 3. The Adam algorithm is also used her to optimize the learning of the LSTM and BPNN which use the same parameters as in the previous experiment optimization because the data are noisy. The learning rate is lr = 10. The training ends when the maximum number of epochs, 100 in our case, has been reached.
The results of two learning approaches are provided in Table 2. The instant of the next consumed liter of water is predicted respectively with an error (test RMSE) of 13 ms and 48 ms respectively with the LSTM and the BPNN. In addition, the forecast of the instant of the 5 next liters have also been calculated and are respectively estimated to occur at instants 450,925, 450,800, 451,200, 451,500 and 451,300 milliseconds. In other words, the next consumed liters have been correctly predicted on 21 December (2018) at 00:08:07.487, 00:15:38.287, 00:23:09.487, 00:30:40,987 and at 00:38:12.287. The accuracy objective of the predicted instants is justified by industrial specifications.
4.3. Discussion on the Hourly and Events Water Consumption Forecasting
Two forecasting tests have been experimented with the proposed water consumption collecting platform, i.e., hourly and event forecasting. The first case consists of predicting the amount of water consumed during the first hour that follows the period of the collected dataset. In the second case, the instant of the next consumed liters is predicted. In both cases, an LSTM and a BPNN architectures have been designed. Their performance has been evaluated under the same conditions and have been compared in terms of precision, computational resources and execution time. With very close resources and approximately the same execution time, the forecasting error obtained with LSTM is 3 times lower than with the BPNN. In both experiments, the LSTM is more appropriate than the BPNN to grab the temporality of the data sting tests have been experimented with the proposed water consumption collecting platform, i.e., hourly and event forecasting. This is because of its property of selectively remembering patterns in time series for long durations of time. Another reason is that the LSTM can better take into account the time-dependent structure of the data, i.e., the non-stationarity of the water data. The LSTM is therefore well suited to handle precise datasets over large periods of time such as water consumption.
5. Conclusions
In this study, we presented a web-oriented platform to collect in real-time water consumption data and to predict them with machine-learning approaches. The data are issued from smart meters and are transmitted to a server to be handled as unevenly spaced time series with high resolution, i.e., in milliseconds. Data sets are then extracted, preprocessed and eventually sampled to be used by machine-learning algorithms to predict the next consumptions. The preprocessing of the data consists of detecting missing values and in identifying abnormal consumption using a reference load curve for each day of the week. Then, machine-learning approaches such as the LSTM and BPNN have been implemented to forecast the next consumption. Two tests have been experimented for hourly and event water consumption forecasting in a private building. The first case consists of predicting the amount of water consumed during the hour that follows the period of the collected data. In the second case, the instants of the next consumed liters are predicted. By evaluating the performance of the LSTM and BPNN, it can be seen that the LSTM is more accurate than the BPNN. Indeed, the LSTM can predict the amount of consumed water in the next coming hour with an error of less than 6 L and is able to predict the instants of the 5 next consumed liters with an error of less than 15 ms. This can be considered to be very accurate prediction in the context of water consumption measurement and forecasting. This web-oriented platform endowed by its learning capabilities is generic and can be extended to other additional smart meters to measure and predict other variables such as power or gas consumptions.
Author Contributions
Conceptualization, A.B.; Funding acquisition, P.W.; Methodology, A.B., P.W.; Supervision, P.W.; Validation, P.W.; Visualization, P.W.; Writing— original draft preparation, A.B.; and Writing—review and editing, P.W. All authors have read and agreed to the published version of the manuscript.
Funding
This research received no external funding.
Institutional Review Board Statement
Not applicable.
Informed Consent Statement
Not applicable.
Data Availability Statement
Data were obtained from our IUT in Mulhouse, France.
Conflicts of Interest
The authors declare no conflict of interest.
Abbreviations
The following abbreviations are used in this manuscript:
| AMI | Advanced Metering Infrastructure |
| BPNN | Back-Propagation Neural Network |
| BPTT | Back-Propagation Through Time |
| LC | Load Curve |
| LSTM | Long Short-Term Memory |
| ML | Machine Learning |
| RMSE | Root Mean Square Error |
| SQL | Structured Query Language |
References
- Roccetti, M.; Delnevo, G.; Casini, L.; Salomoni, P. A Cautionary Tale for Machine Learning Design: Why we Still Need Human-Assisted Big Data Analysis. Mob. Netw. Appl. 2020, 25, 1075–1083. [Google Scholar] [CrossRef]
- Walker, D.; Creaco, E.; Vamvakeridou-Lyroudia, L.; Farmani, R.; Kapelan, Z.; Savić, D. Forecasting Domestic Water Consumption from Smart Meter Readings Using Statistical Methods and Artificial Neural Networks. Procedia Eng. 2015, 119, 1419–1428. [Google Scholar] [CrossRef] [Green Version]
- Petropoulos, F.; Spiliotis, E. The Wisdom of the Data: Getting the Most Out of Univariate Time Series Forecasting. Forecasting 2021, 3, 478–497. [Google Scholar] [CrossRef]
- de Souza Groppo, G.; Costa, M.A.; Libânio, M. Predicting water demand: A review of the methods employed and future possibilities. Water Supply 2019, 19, 2179–2198. [Google Scholar] [CrossRef]
- Boudhaouia, A.; Wira, P. Power and Water Consumption Monitoring with IoT Devices and Machine Learning Methods in a Smart Building; Presses Universitaires de Strasbourg: Strasbourg, France, 2019; Volume 346. [Google Scholar]
- Yang, L.; Yang, S.H. Domestic water consumption monitoring and behaviour intervention by employing the internet of things technologies. Procedia Comput. Sci. 2017, 111, 367–375. [Google Scholar] [CrossRef]
- Spiegel, J. Nouvelle Stratégie de Collecte de Données Pour les Compteurs d’eau Communicants. Ph.D. Thesis, Université de Haute Alsace, Mulhouse, France, 2019. [Google Scholar]
- Kong, W.; Dong, Z.Y.; Jia, Y.; Hill, D.J.; Xu, Y.; Zhang, Y. Short-Term Residential Load Forecasting Based on LSTM Recurrent Neural Network. IEEE Trans. Smart Grid 2017, 10, 841–851. [Google Scholar] [CrossRef]
- Rehfeld, K.; Marwan, N.; Heitzig, J.; Kurths, J. Comparison of correlation analysis techniques for irregularly sampled time series. Nonlinear Process. Geophys. 2011, 8, 389–404. [Google Scholar] [CrossRef] [Green Version]
- Boudhaouia, A.; Wira, P. Water Consumption Analysis for Real-Time Leakage Detection in the Context of a Smart Tertiary Building. In Proceedings of the 2018 International Conference on Applied Smart Systems (ICASS), Medea, Algeria, 24–25 November 2018; pp. 1–6. [Google Scholar] [CrossRef]
- Boudhaouia, A.; Wira, P. Comparison of machine learning algorithms to predict daily water consumptions. In Proceedings of the 2021 International Conference on Design & Test of integrated micro & nano-Systems (DTS), Sfax, Tunisia, 7–10 June 2021; pp. 1–6. [Google Scholar]
- Ali, Z.; Hussain, I.; Faisal, M.; Nazir, H.M.; Hussain, T.; Shad, M.Y.; Mohamd Shoukry, A.; Hussain Gani, S. Forecasting Drought Using Multilayer Perceptron Artificial Neural Network Model. Adv. Meteorol. 2017, 2017, 1–9. [Google Scholar] [CrossRef]
- Candelieri, A.; Soldi, D.; Archetti, F. Short-term forecasting of hourly water consumption by using automatic metering readers data. Procedia Eng. 2015, 119, 844–853. [Google Scholar] [CrossRef]
- Deb, C.; Zhang, F.; Yang, J.; Lee, S.E.; Shah, K.W. A review on time series forecasting techniques for building energy consumption. Renew. Sustain. Energy Rev. 2017, 74, 902–924. [Google Scholar] [CrossRef]
- Liu, M.; Liu, D.; Sun, G.; Zhao, Y.; Wang, D.; Liu, F.; Fang, X.; He, Q.; Xu, D. Deep Learning Detection of Inaccurate Smart Electricity Meters: A Case Study. IEEE Ind. Electron. Mag. 2020, 14, 79–90. [Google Scholar] [CrossRef]
- Szoplik, J. Forecasting of natural gas consumption with artificial neural networks. Energy 2015, 85, 208–220. [Google Scholar] [CrossRef]
- Abadi, M.L.; Same, A.; Oukhellou, L.; Cheifetz, N.; Mandel, P.; Feliers, C.; Chesneau, O. Predictive Classification of Water Consumption Time Series Using Non-homogeneous Markov Models. In Proceedings of the IEEE International Conference on Data Science and Advanced Analytics (DSAA), Tokyo, Japan, 19–21 October 2017; pp. 323–331. [Google Scholar] [CrossRef]
- Huntra, P.; Keener, T.C. Evaluating the Impact of Meteorological Factors on Water Demand in the Las Vegas Valley Using Time-Series Analysis: 1990–2014. ISPRS Int. J. Geo-Inf. 2017, 6, 249. [Google Scholar] [CrossRef] [Green Version]
- Alvisi, S.; Franchini, M.; Marinelli, A. A short-term, pattern-based model for water-demand forecasting. J. Hydroinformatics 2007, 9, 39–50. [Google Scholar] [CrossRef] [Green Version]
- de Souza Groppo, G.; Costa, M.A.; Libânio, M. Forecasting Water Demand in Residential, Commercial, and Industrial Zones in Bogotá, Colombia, Using Least-Squares Support Vector Machines. Math. Probl. Eng. 2016, 2016. [Google Scholar] [CrossRef] [Green Version]
- Kenney, D.S.; Goemans, C.; Klein, R.; Lowrey, J.; Reidy, K. Residential Water Demand Management: Lessons from Aurora, Colorado. JAWRA J. Am. Water Resour. Assoc. 2008, 44, 192–207. [Google Scholar] [CrossRef]
- Saigal, S.; Mehrotra, D. Performance comparison of time series data using predictive data mining techniques. Adv. Inf. Min. 2012, 4, 57–66. [Google Scholar]
- Cominola, A.; Giuliani, M.; Piga, D.; Castelletti, A.; Rizzoli, A. Benefits and challenges of using smart meters for advancing residential water demand modeling and management: A review. Environ. Model. Softw. 2015, 72, 198–214. [Google Scholar] [CrossRef] [Green Version]
- Spiegel, J.; Hermann, G.; Wira, P. A Comparative Experimental Study of Compression Algorithms for Enhancing Energy Efficiency in Smart Meters. In Proceedings of the IEEE 16TH International Conference of Industrial Informatics (INDIN 2018), Porto, Portugal, 18–20 July 2018. [Google Scholar]
- Benkabou, S.E. Détection d’Anomalies dans les séries Temporelles: Application aux Masses de Données sur les Pneumatiques. Ph.D. Thesis, Université Claude Bernard, Lyon, France, 2018. [Google Scholar]
- Lee, J.; Kim, J.; Ko, W. Day-Ahead Electric Load Forecasting for the Residential Building with a Small-Size Dataset Based on a Self-Organizing Map and a Stacking Ensemble Learning Method. Appl. Sci. 2019, 9, 1231. [Google Scholar] [CrossRef] [Green Version]
- Hochreiter, S.; Schmidhuber, J. Long Short-Term Memory. Neural Comput. 1997, 9, 1735–1780. [Google Scholar] [CrossRef] [PubMed]
Figure 1.
The LSTM unit architecture.

Figure 2.
Operating principle of the sliding window for ensuring the redundancy of transmitted data from smart water meters through successive frames [7].
Figure 2.
Operating principle of the sliding window for ensuring the redundancy of transmitted data from smart water meters through successive frames [7].

Figure 3.
Example of a cumulative load curve (LC) which shows the raw data by red dots unevenly spaced in time as recorded and transmitted by a smart sensor (the black curve is an interpolation) and with results from the sequence of events corresponding to each consumed liter.
Figure 3.
Example of a cumulative load curve (LC) which shows the raw data by red dots unevenly spaced in time as recorded and transmitted by a smart sensor (the black curve is an interpolation) and with results from the sequence of events corresponding to each consumed liter.

Figure 4.
Global architecture of the water consumption LC preprocessing.

Figure 5.
Water consumption time series: (a) LC from 1 October to 31 December 2018, (b) close-up view of the same time series for the first 24 h, (c) cumulative water LC over the whole period, (d) number of liters consumed per day.
Figure 5.
Water consumption time series: (a) LC from 1 October to 31 December 2018, (b) close-up view of the same time series for the first 24 h, (c) cumulative water LC over the whole period, (d) number of liters consumed per day.

Figure 6.
Time representation of the water consumption, (a) Time gap between 4321 events (i.e., consumed liters) from 02/12/2018 09:11:21.750 until 20/12/2018 23:23:40.625, (b) Cumulated duration as a function of consumed liters.
Figure 6.
Time representation of the water consumption, (a) Time gap between 4321 events (i.e., consumed liters) from 02/12/2018 09:11:21.750 until 20/12/2018 23:23:40.625, (b) Cumulated duration as a function of consumed liters.


Table 1.
Hourly prediction of water consumption in liters with the LSTM and BPNN.
| LSTM | BPNN | |
|---|---|---|
| Hidden Layer number | 2 | 3 |
| Number of neurons | 100/100 | 200/100/100 |
| Activation function | relu/relu | relu/relu/relu |
| Train RMSE (l) | 0.19 | 3.54 |
| Test RMSE (l) | 6.05 | 20.19 |
| Total execution time (ms) | 19.81 | 24.05 |
Table 2.
Event prediction of water consumption in ms with the LSTM and BPNN.
| LSTM | BPNN | |
|---|---|---|
| Hidden Layer number | 2 | 1 |
| Number of neurons | 200/120 | 150 |
| Activation function | relu/relu | relu |
| Train RMSE ( ms) | 0.33 | 0.39 |
| Test RMSE ( ms) | 0.13 | 0.48 |
| Total execution time (s) | 37.73 | 24.71 |
Publisher’s Note: MDPI stays neutral with regard to jurisdictional claims in published maps and institutional affiliations. |
© 2021 by the authors. Licensee MDPI, Basel, Switzerland. This article is an open access article distributed under the terms and conditions of the Creative Commons Attribution (CC BY) license (https://creativecommons.org/licenses/by/4.0/).
Share and Cite
MDPI and ACS Style
Boudhaouia, A.; Wira, P. A Real-Time Data Analysis Platform for Short-Term Water Consumption Forecasting with Machine Learning. Forecasting 2021, 3, 682-694. https://0-doi-org.brum.beds.ac.uk/10.3390/forecast3040042
AMA Style
Boudhaouia A, Wira P. A Real-Time Data Analysis Platform for Short-Term Water Consumption Forecasting with Machine Learning. Forecasting. 2021; 3(4):682-694. https://0-doi-org.brum.beds.ac.uk/10.3390/forecast3040042
Chicago/Turabian StyleBoudhaouia, Aida, and Patrice Wira. 2021. "A Real-Time Data Analysis Platform for Short-Term Water Consumption Forecasting with Machine Learning" Forecasting 3, no. 4: 682-694. https://0-doi-org.brum.beds.ac.uk/10.3390/forecast3040042