
Application of Agent-Based Modeling in Agricultural Productivity in Rural Area of Bahir Dar, Ethiopia


Abstract
:1. Introduction
1.1. Maize Production in Ethiopia
1.2. Maize Productivity in Ethiopia
1.3. Agricultural Inputs
1.4. Need of Seasonal Forecasts in Agriculture
1.5. Adoption of Seasonal Forecasts
1.6. Agent-Based Model in Agriculture Management
1.7. Agriculture Crop Models
2. Materials and Methods
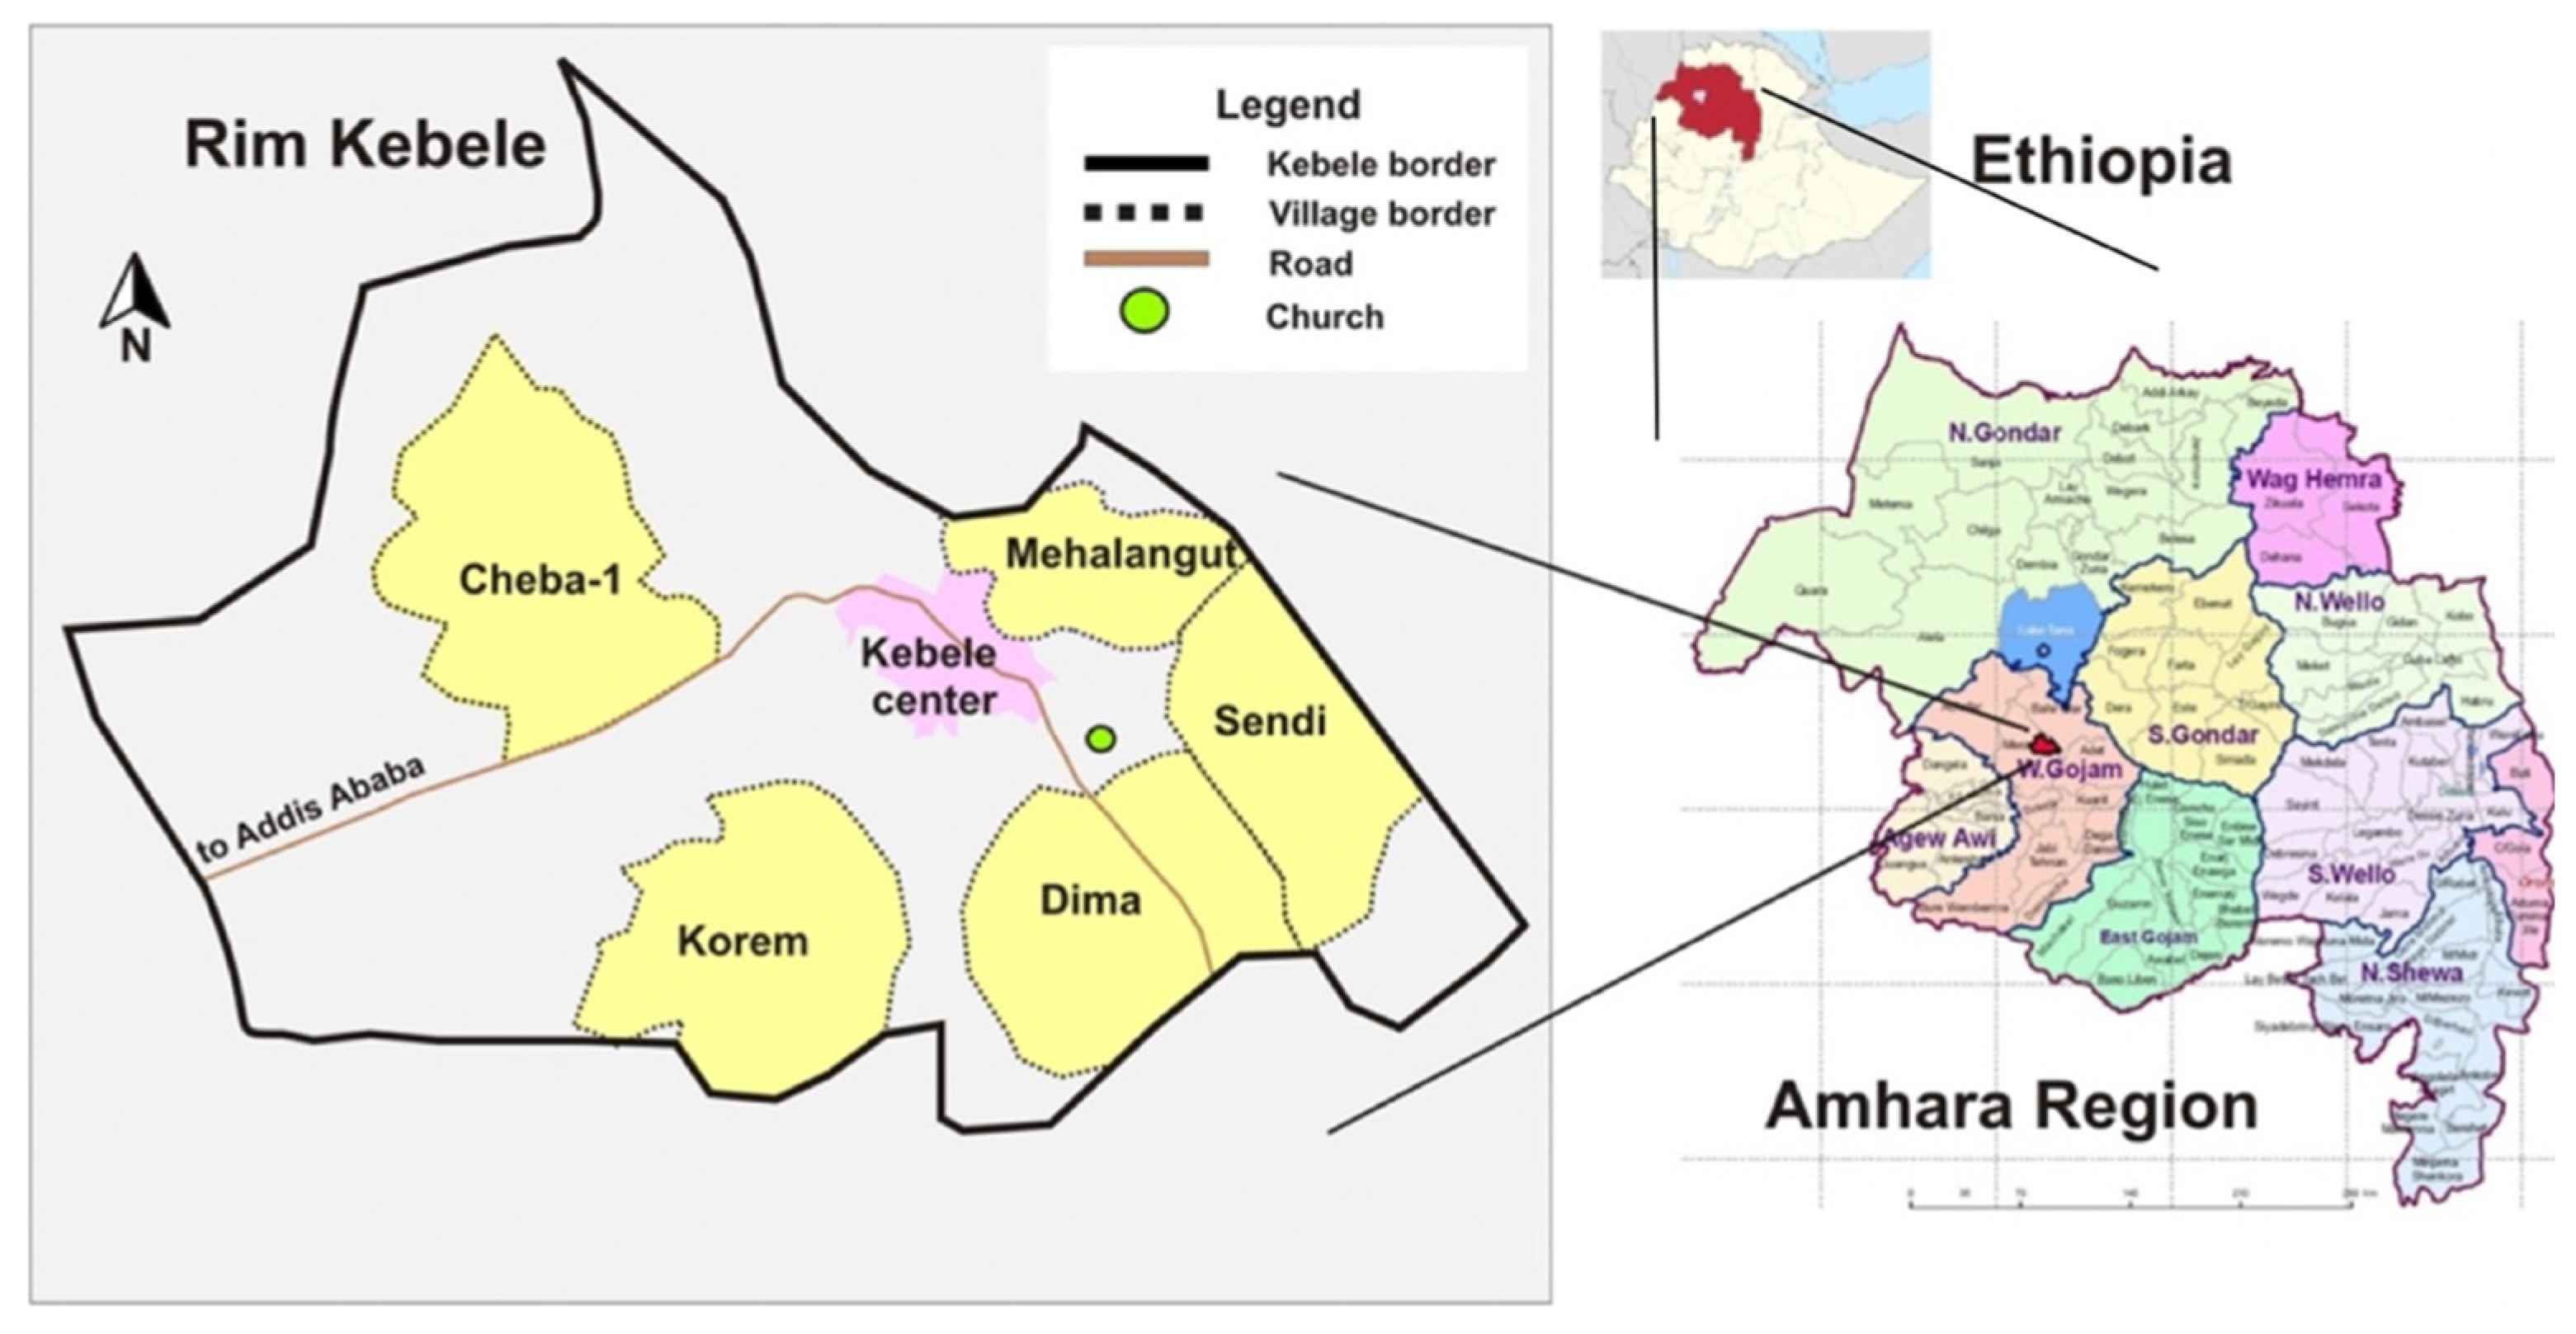
2.1. Description of the Area
2.2. Sampling and Data Collection
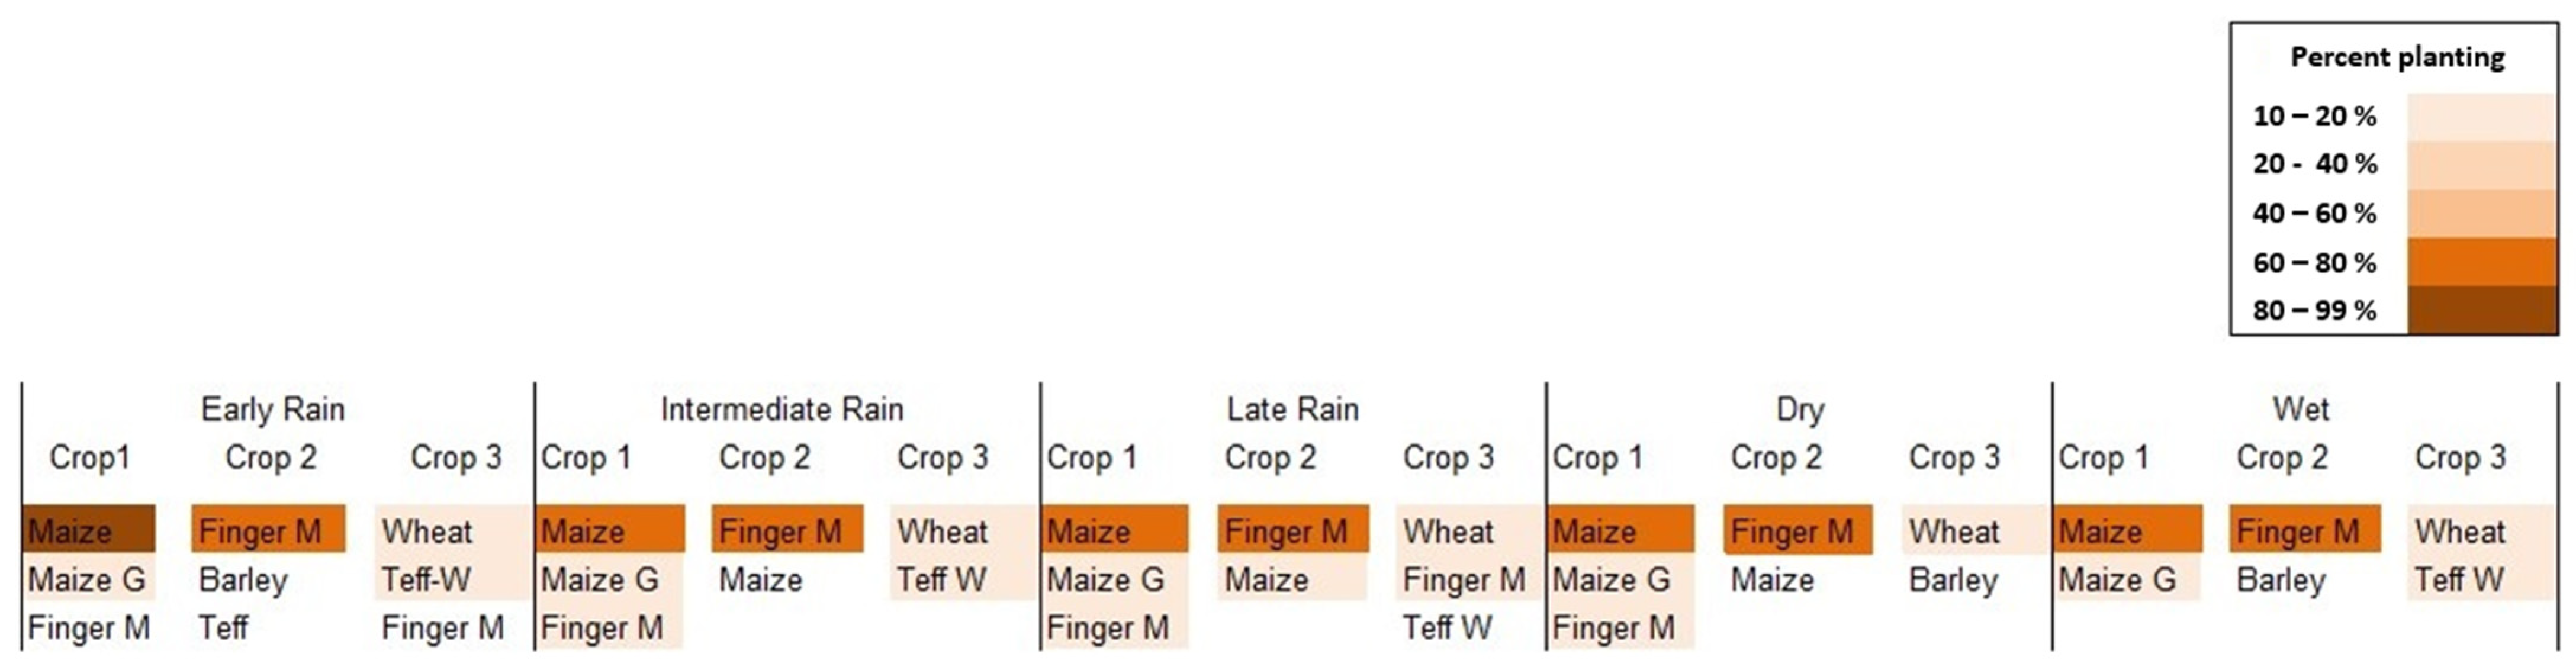
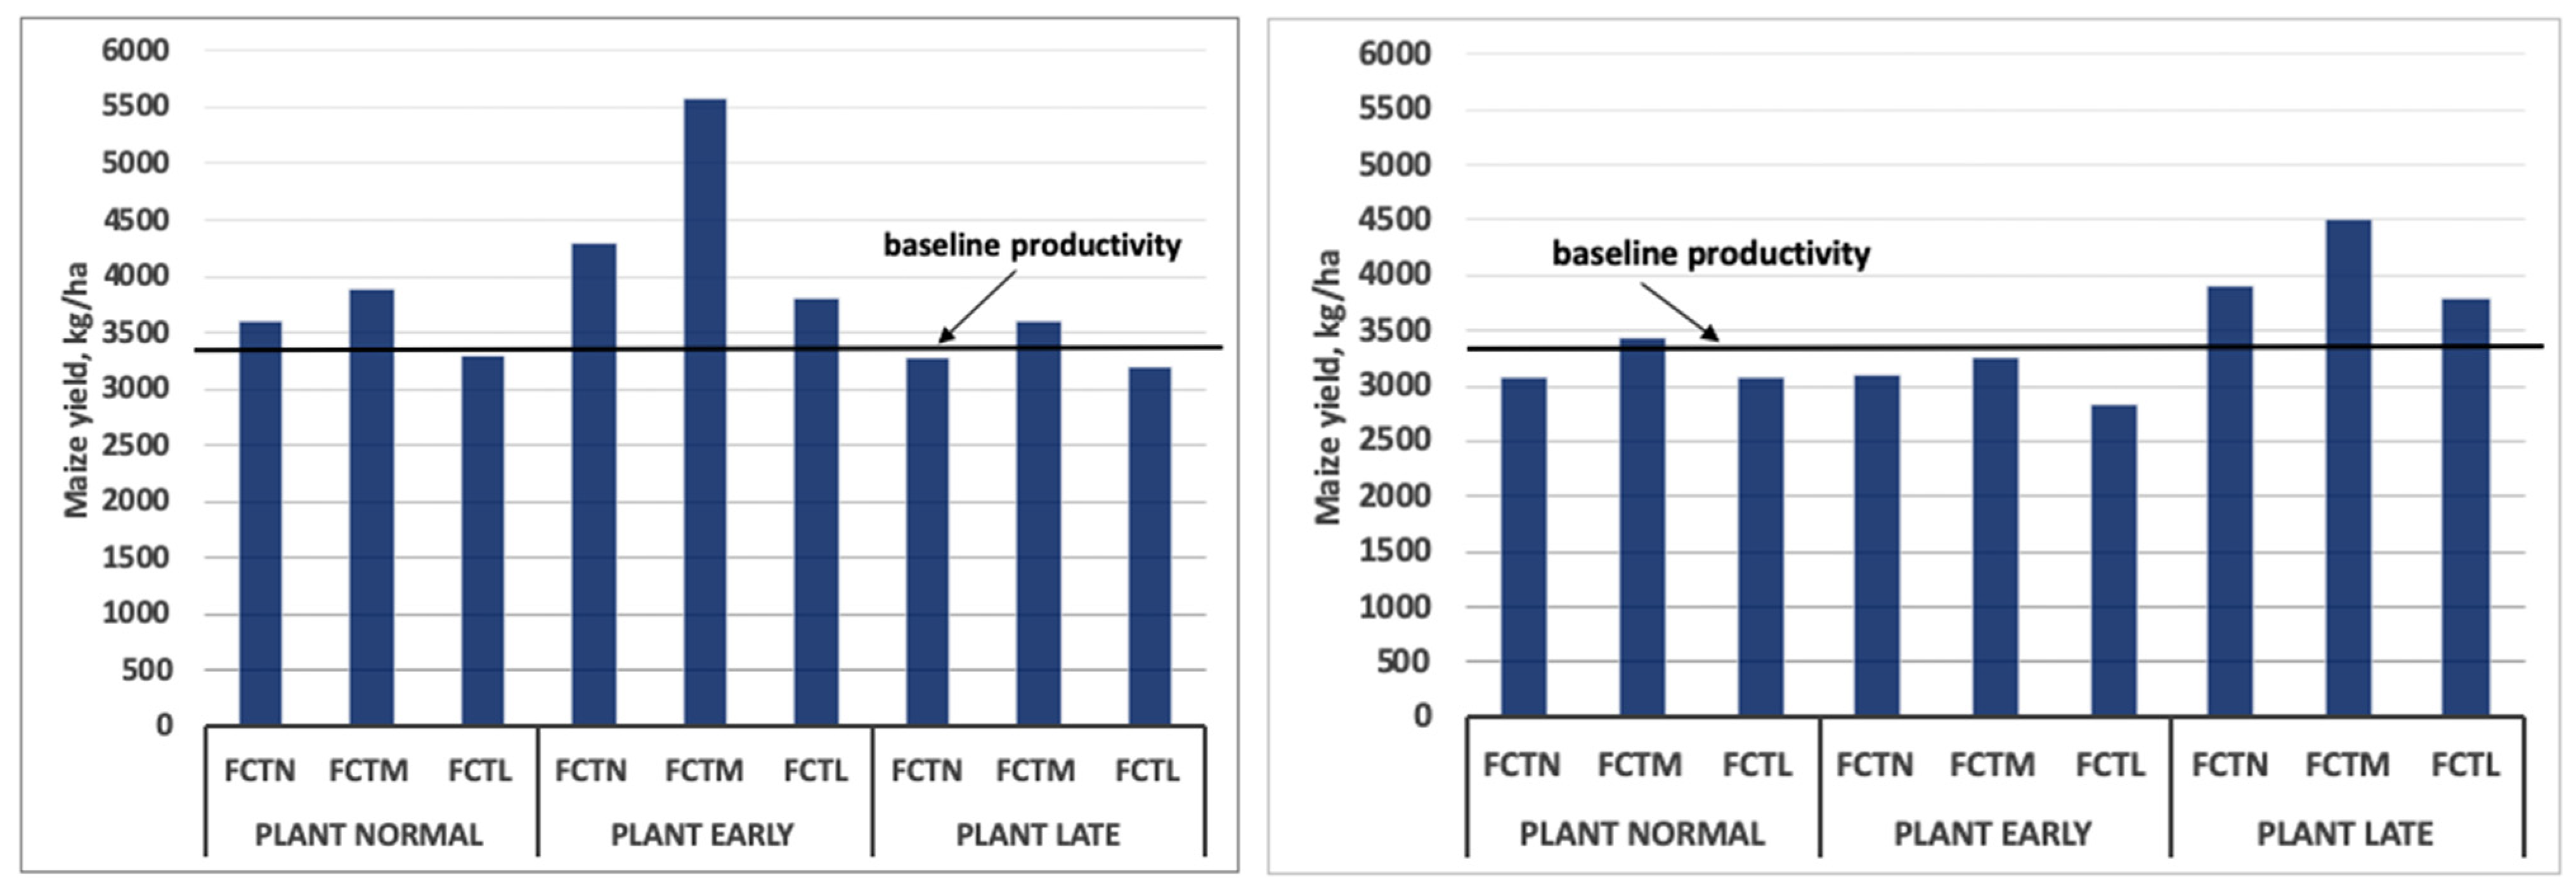
2.3. Crop Pattern
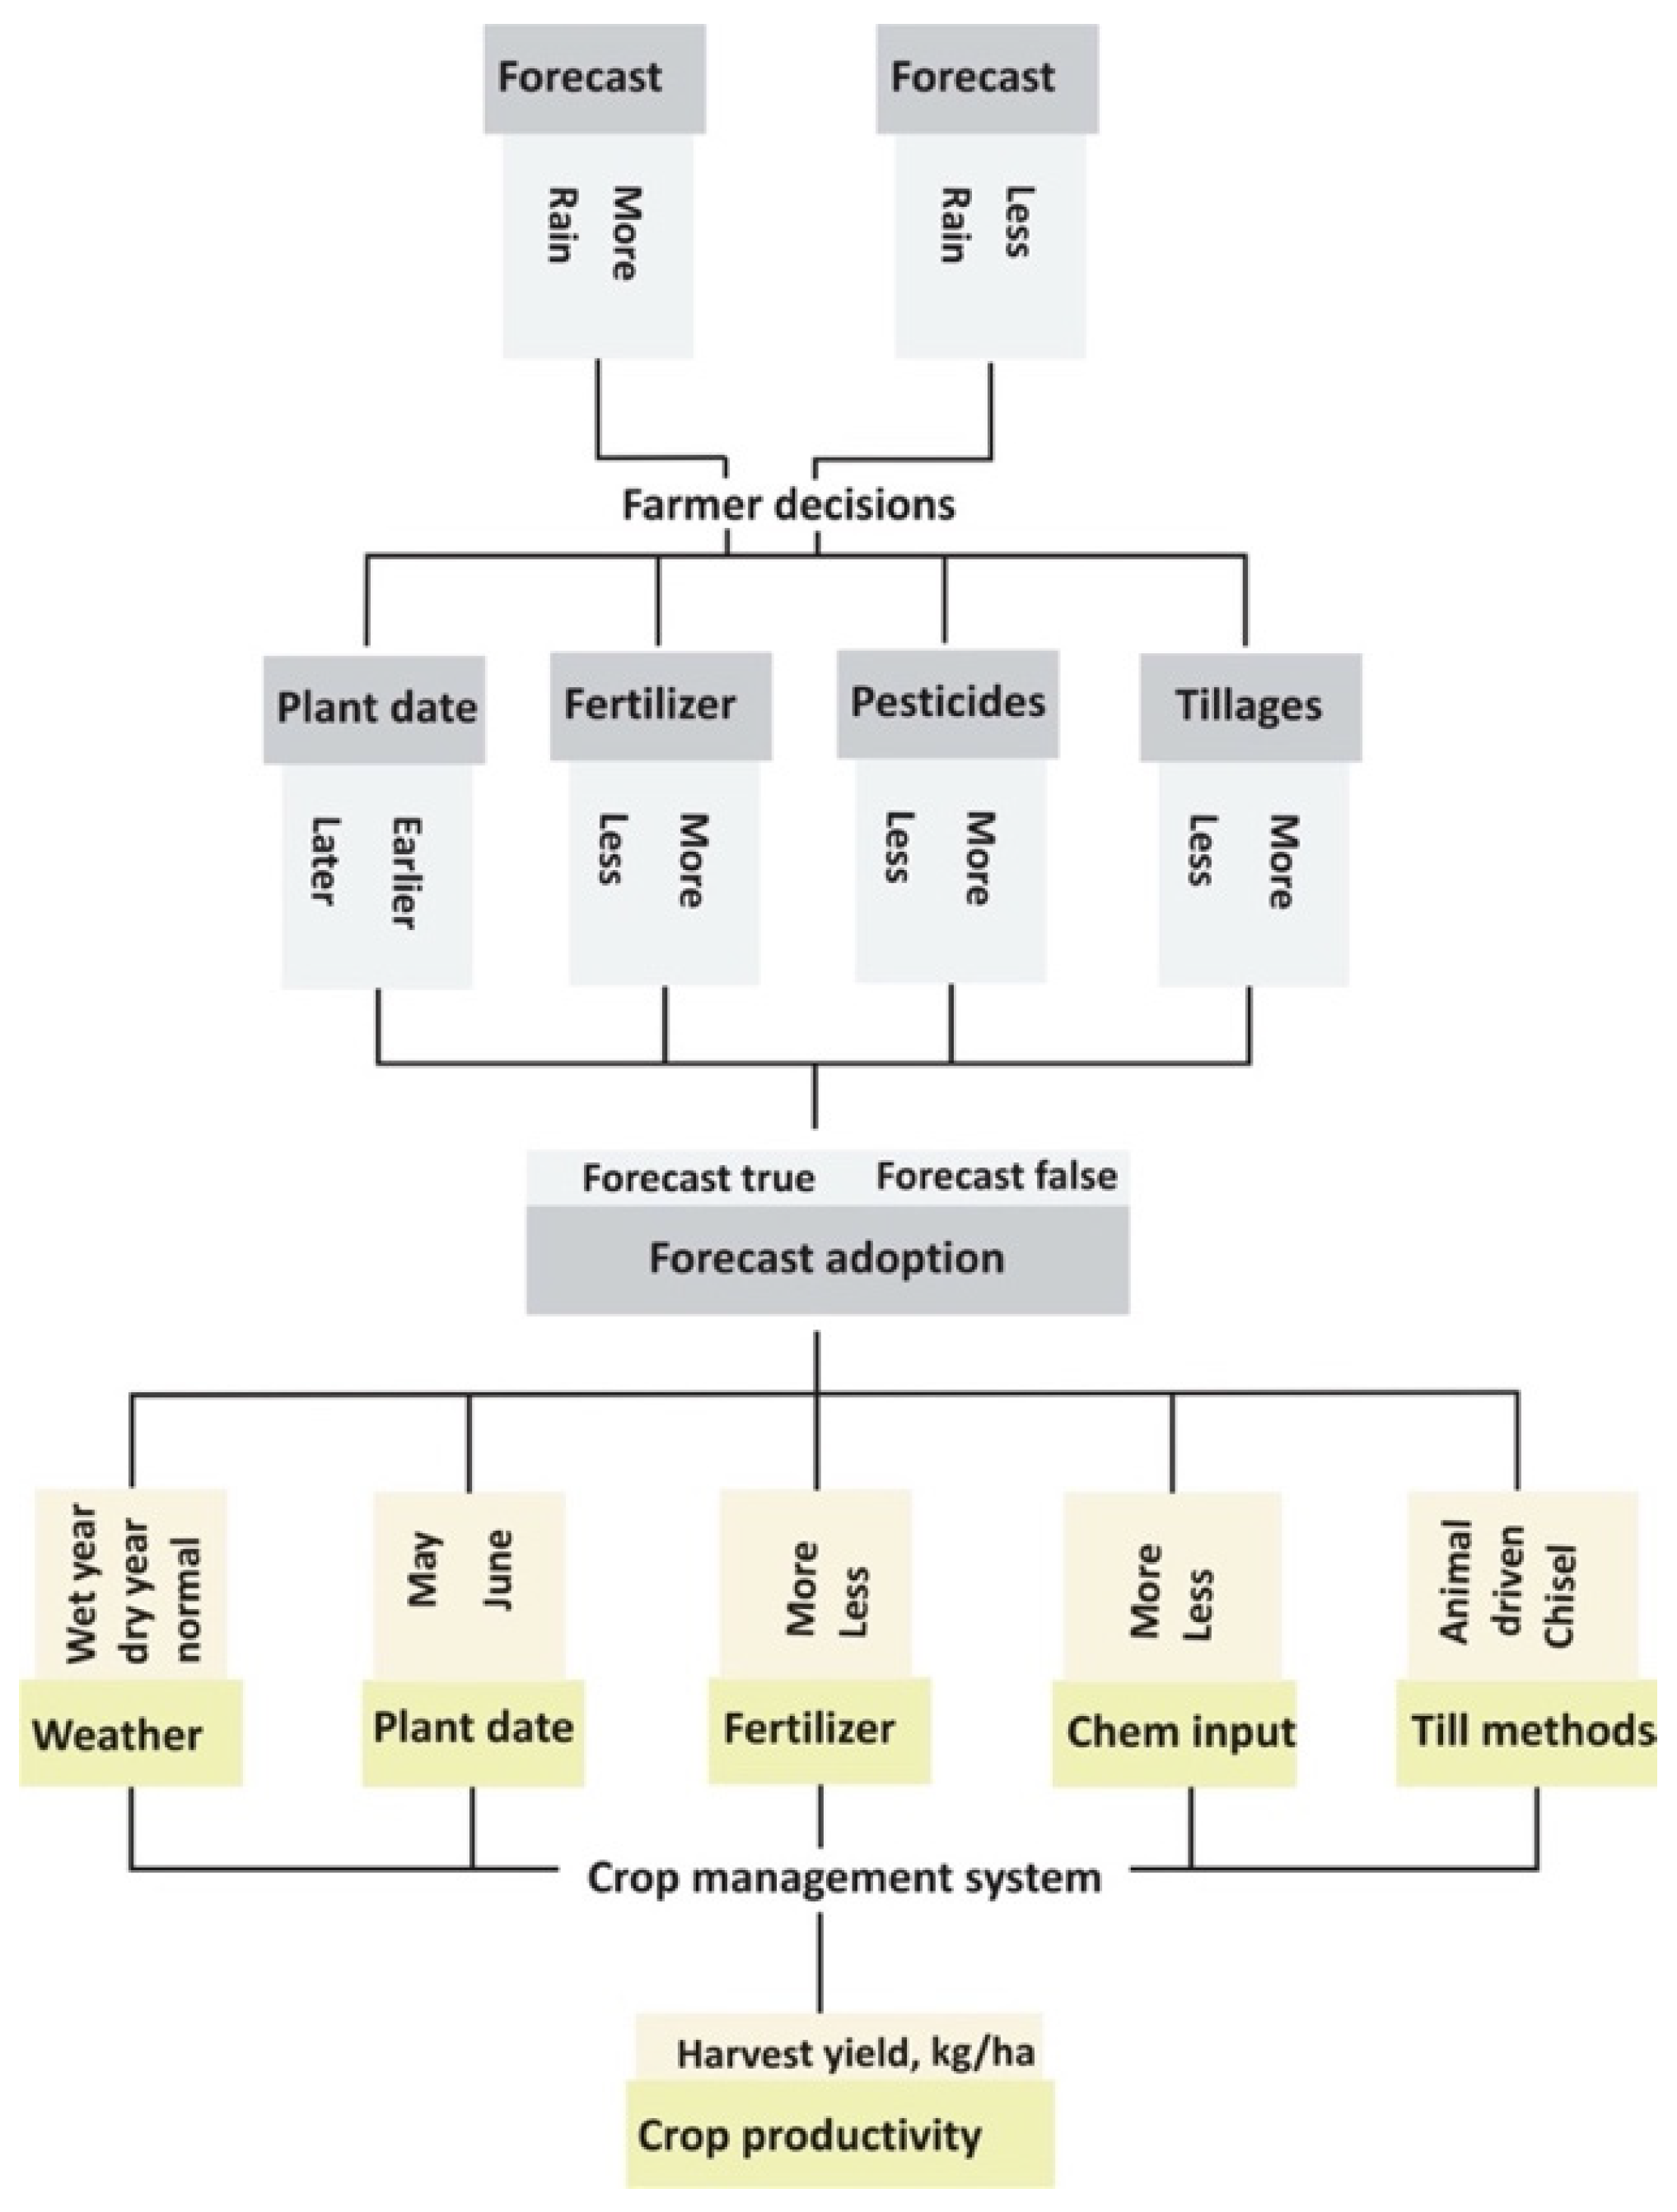
2.4. Farmers’ Decisions on Farming Activities under Different Rainfall Conditions
2.5. Coupled ABM and Crop Models
2.6. ABM Model
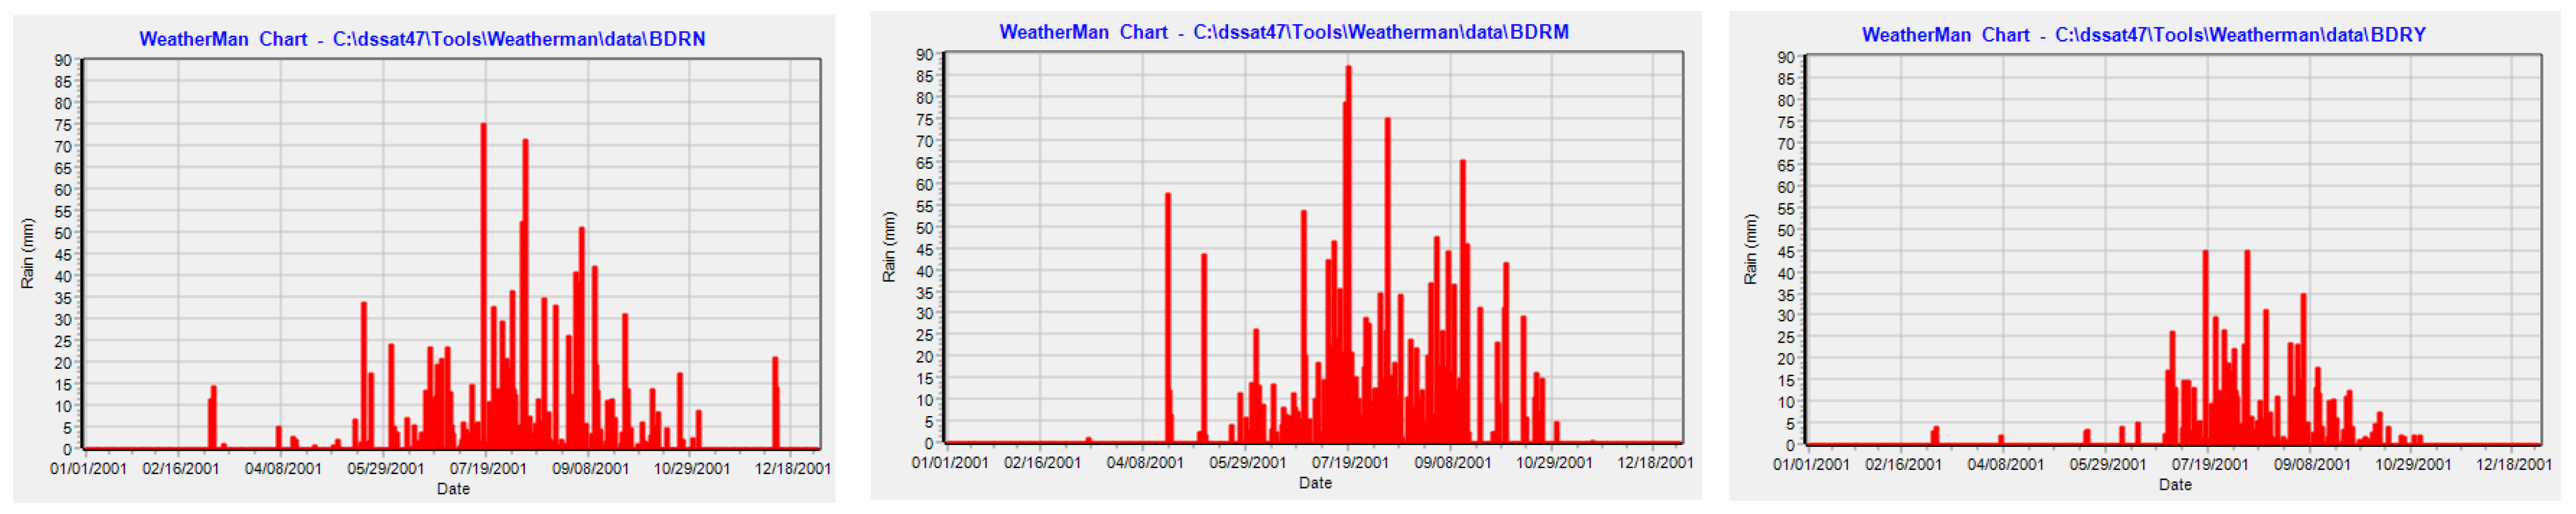
2.7. Crop Model
2.8. Crop Model Calibration
2.8.1. Seeds Amount Used
2.8.2. Herbicide Use
2.8.3. Fertilizer Use
2.8.4. Tillage Frequency
2.9. Crop Model Accuracy and Prediction
3. Results and Discussion
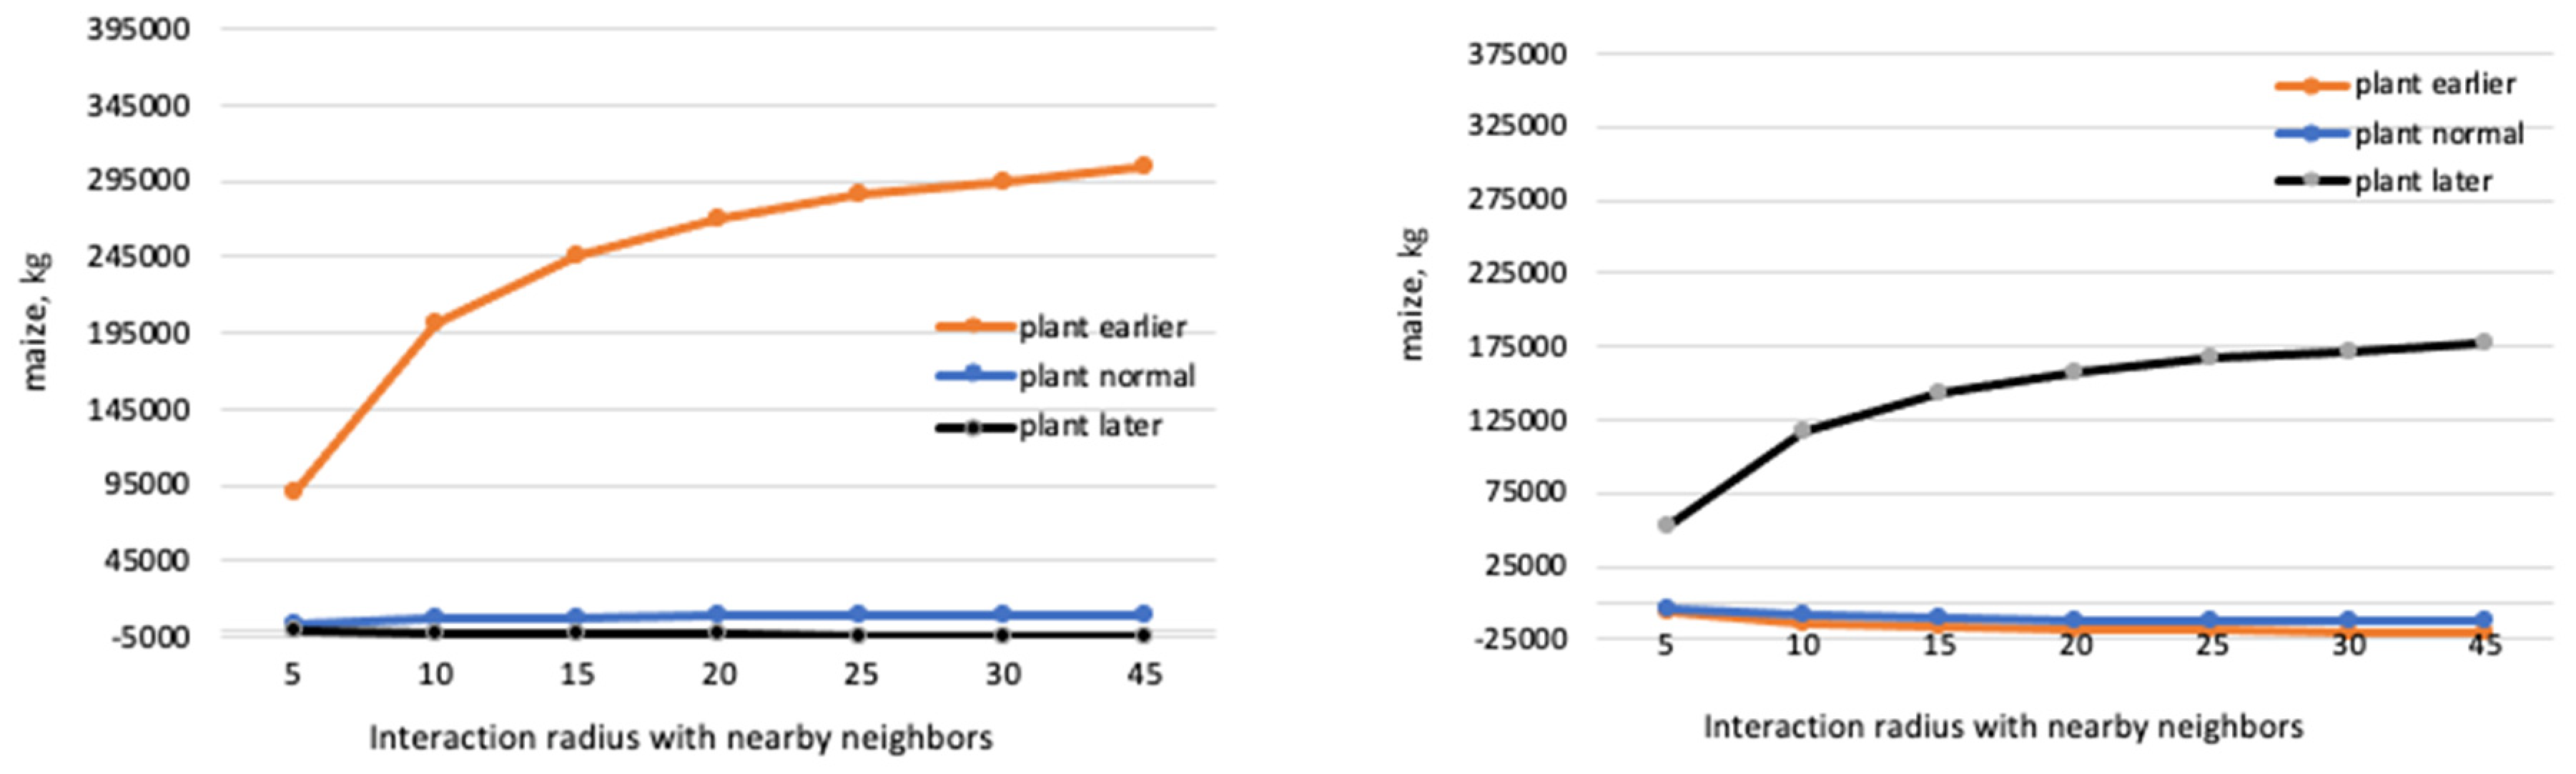
3.1. Farmers’ Interactions with Nearby Neighbor Farmers
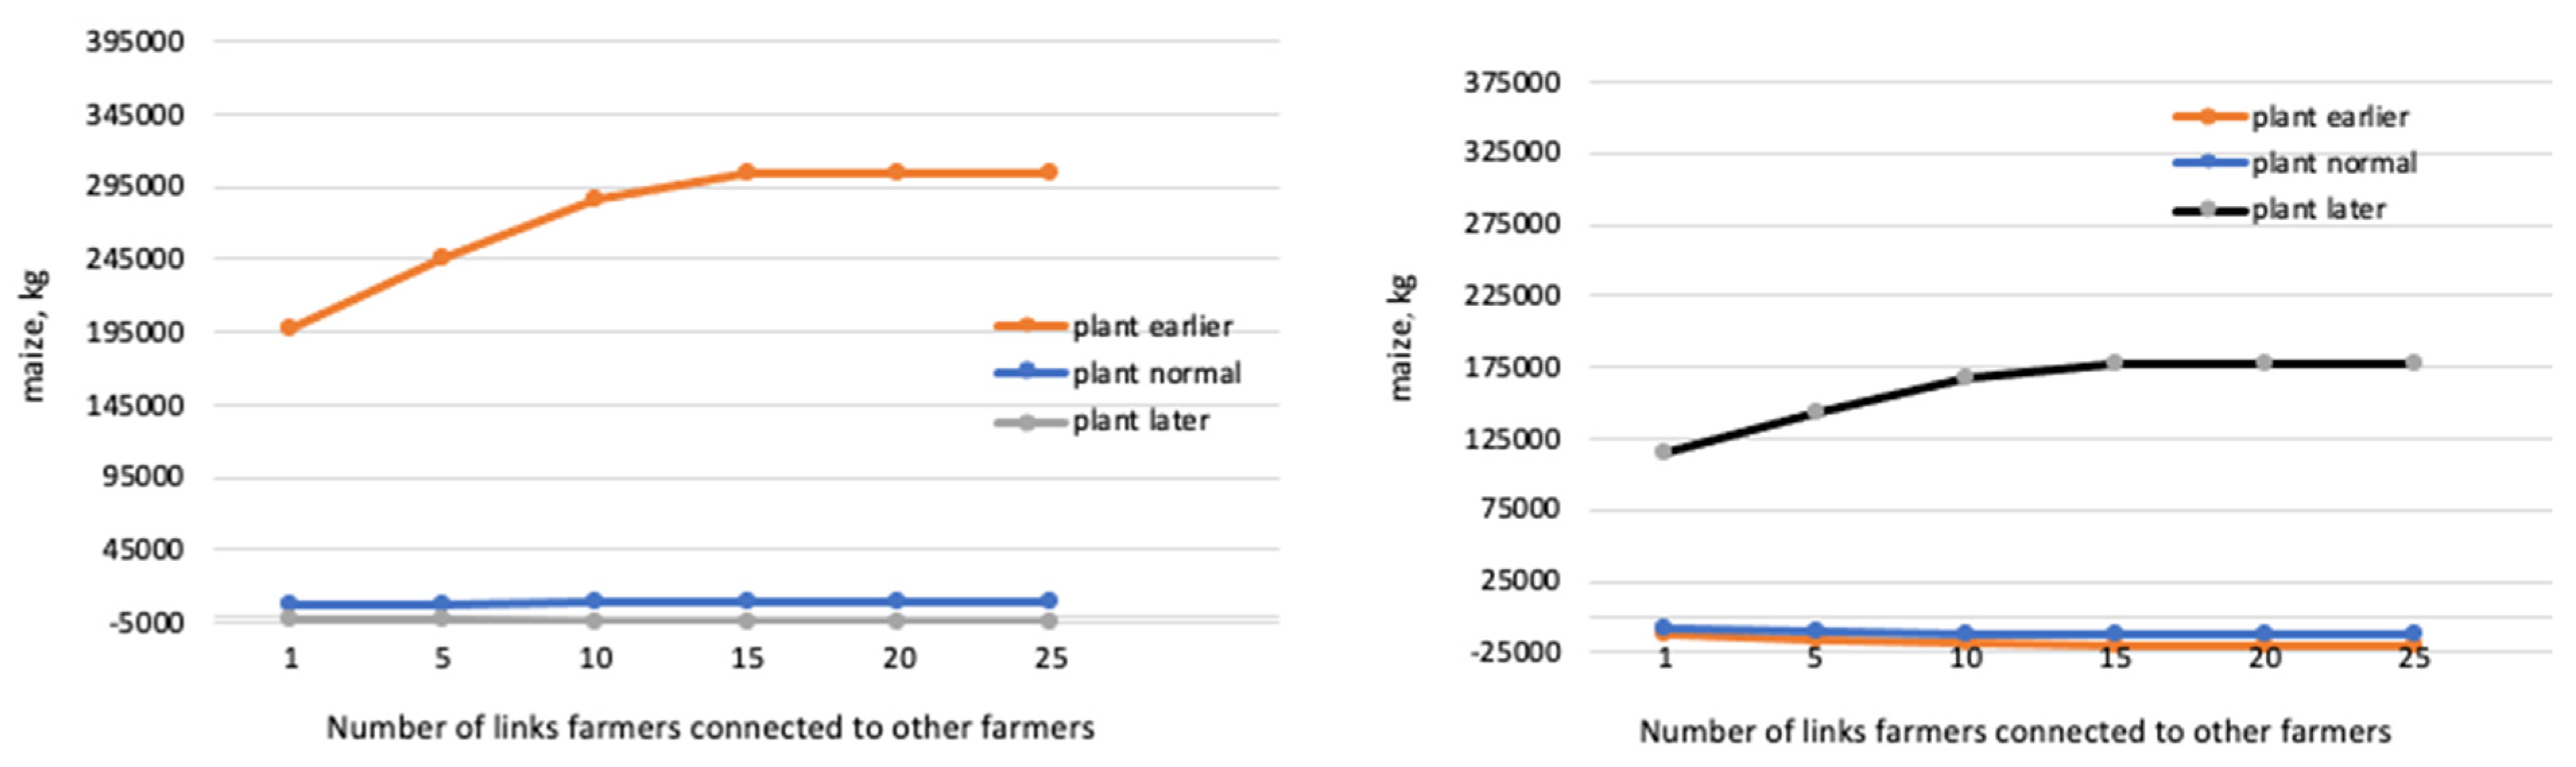
3.2. Farmers’ Interactions with Other Farmers in Their Network
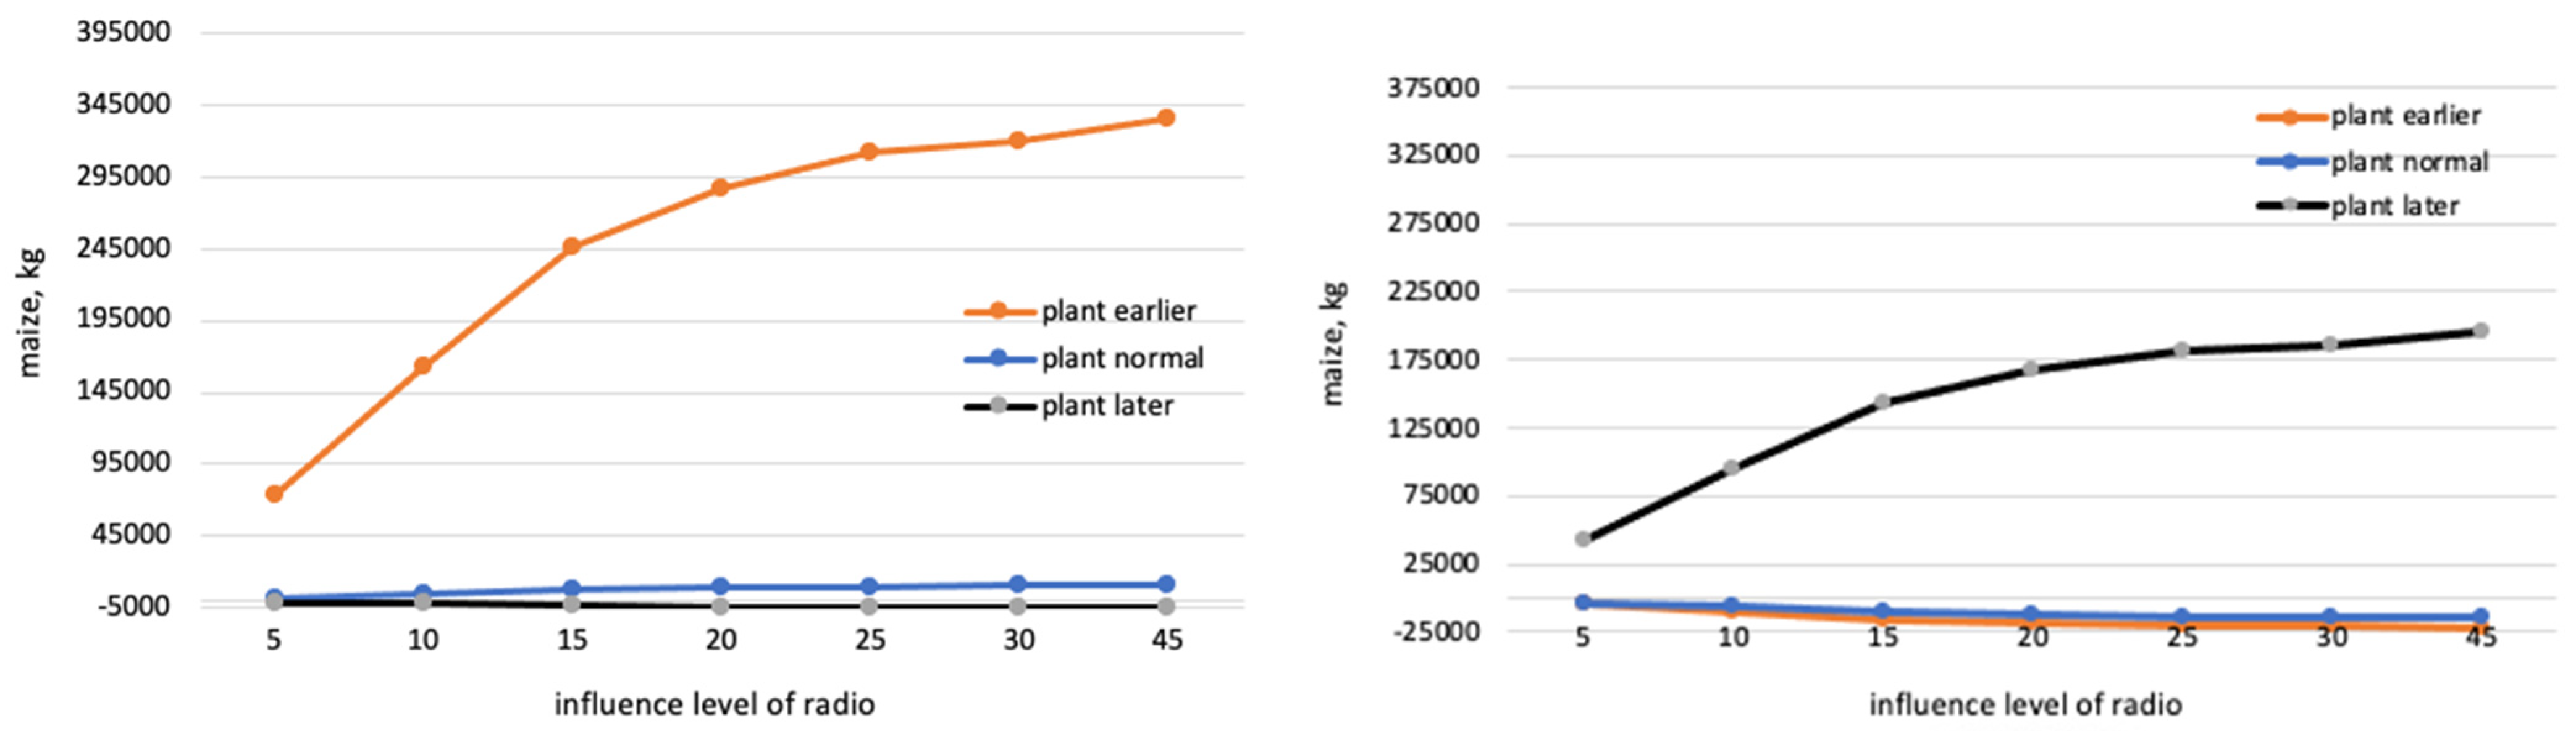
3.3. Influence of Radio in the Kebele
3.4. Farmers’ Interactions with Agriculture Extension Workers
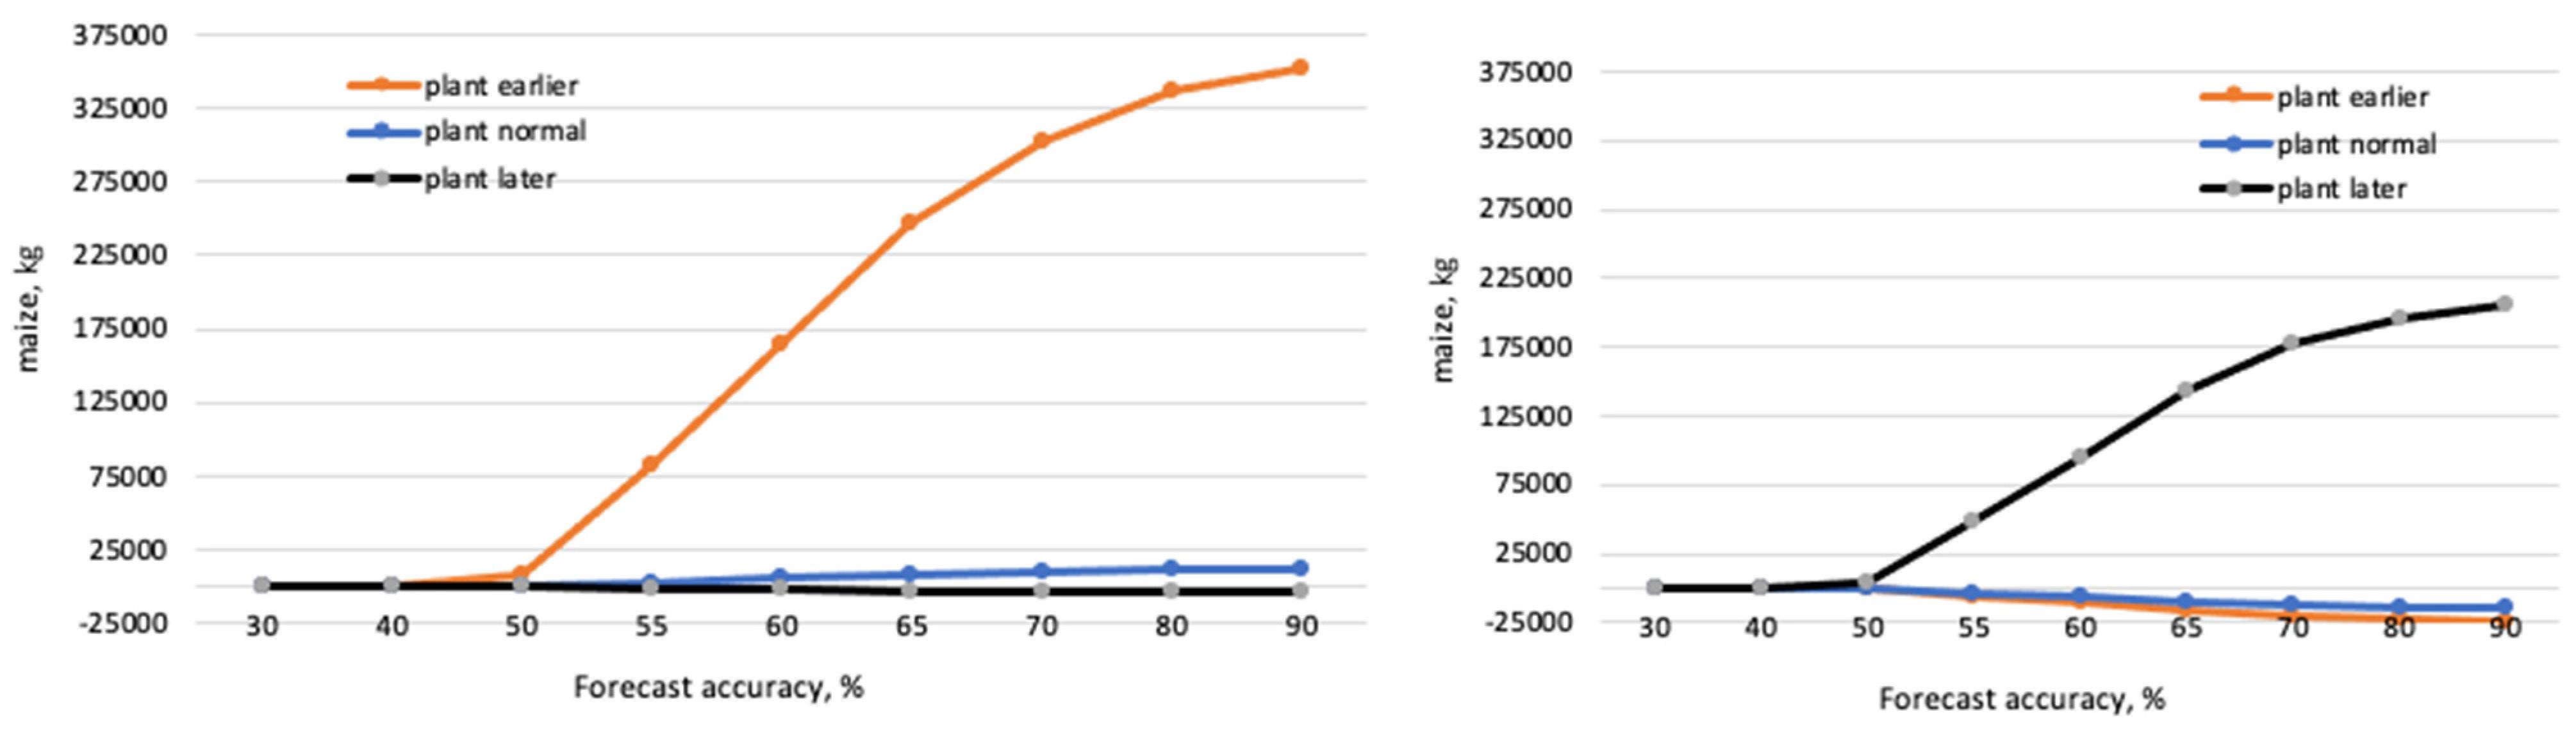
3.5. Impact of Forecast Accuracy on Agricultural Productivity
4. Conclusions
Author Contributions
Funding
Institutional Review Board Statement
Informed Consent Statement
Data Availability Statement
Acknowledgments
Conflicts of Interest
Appendix A

| Name of the Village | Estimated Household Size | Cultivated Land Out of Total Area (%) | Forest Land Out of Total Area (%) | Irrigated Land Out of Cultivated Land (%) | Irrigation User Households Out of Total Households (%) | |
|---|---|---|---|---|---|---|
| 1 | Angut Adis Alem | 45 | 81.5 | 4.2 | 0 | 0 |
| 2 | Angut–Mahal | 65 | 76.8 | 9.2 | 0 | 0 |
| 3 | Shafri | 65 | 81 | 4.2 | 0 | 0 |
| 4 | Wuren-1 | 65 | 81.8 | 4.2 | 0 | 0 |
| 5 | Wuren-2 | 60 | 81.8 | 42 | 0.05 | 10 |
| 6 | Wuren-3 | 60 | 81.8 | 4.2 | 0 | 0 |
| 7 | Cheba-1 | 60 | 81 | 4 | 0.05 | 10 |
| 8 | Cheba-2 | 55 | 81 | 4 | 0 | 0 |
| 9 | Deber Mender-1 | 55 | 81 | 4 | 0.05 | 10 |
| 10 | Deber Mender-2 | 48 | 81 | 4 | 0 | 0 |
| 11 | Babo Bate-1 | 45 | 76.5 | 9 | 0 | 0 |
| 12 | Babo Bate-2 | 45 | 77 | 9 | 0 | 0 |
| 13 | Kuyu | 50 | 81 | 4.2 | 0 | 0 |
| 14 | Ko Rim | 54 | 82 | 4 | 0 | 0 |
| 15 | Lay Gult | 50 | 82 | 4 | 0 | 0 |
| 16 | Sendi | 54 | 80 | 5 | 1 | 15 |
| 17 | Dima | 60 | 81 | 5 | 1 | 15 |
| 18 | Ketema | 387 | 2 | 10 | 0 | 0 |
| Rim Kebele | 1323 | 1916 ha (81.8%) | 100 ha (4.2%) | 20 ha (0.1%) | 22% | |
| Baseline Survey | All Sampled Farmers Maize Produce, kg, Added | All Farmers in the Kebele Maize Produce, kg, Added | Number of People Able to be Fed by the Produce Added | ||||||||||
|---|---|---|---|---|---|---|---|---|---|---|---|---|---|
| R-dist | # Adoptions | Plant Normal | Plant Earlier | Plant Later | Plant Normal | Plant Earlier | Plant Later | Plant Normal | Plant Earlier | Plant Later | Plant Normal | Plant Earlier | Plant Later |
| 5 | 11 | 2.09 | 7.81 | 1.1 | 400 | 12,351 | −168 | 2920 | 90,156 | −1226 | 58 | 1785 | −24 |
| 10 | 24.5 | 4.66 | 17.40 | 2.45 | 891 | 27,510 | −374 | 6503 | 200,801 | −2731 | 129 | 3976 | −54 |
| 15 | 30 | 5.7 | 21.3 | 3 | 1091 | 33,685 | −458 | 7963 | 245,879 | −3345 | 158 | 4869 | −66 |
| 20 | 33 | 6.27 | 23.43 | 3.3 | 1200 | 37,054 | −504 | 8760 | 270,467 | −3679 | 173 | 5356 | −73 |
| 25 | 35 | 6.65 | 24.85 | 3.5 | 1273 | 39,299 | −535 | 9291 | 286,859 | −3902 | 184 | 5680 | −77 |
| 30 | 36 | 6.84 | 25.56 | 3.6 | 1309 | 40,422 | −550 | 9556 | 295,055 | −4013 | 189 | 5843 | −79 |
| 45 | 37 | 7.03 | 26.27 | 3.7 | 1346 | 41,545 | −565 | 9822 | 303,251 | −4125 | 194 | 6005 | −82 |
| Baseline Survey | All Sampled Farmers Maize Produce, kg, Added | All Farmers in the Kebele Maize Produce, kg, Added | Number of People Able to be Fed by the Produce Added | ||||||||||
|---|---|---|---|---|---|---|---|---|---|---|---|---|---|
| R-dist | # Adoptions | Plant Normal | Plant Earlier | Plant Later | Plant Normal | Plant Earlier | Plant Later | Plant Normal | Plant Earlier | Plant Later | Plant Normal | Plant Earlier | Plant Later |
| 5 | 11 | 1.32 | 1.43 | 8.25 | −524 | −821 | 7185 | −3828 | −5994 | 52,449 | −76 | −119 | 1039 |
| 10 | 24.5 | 2.94 | 3.185 | 18.375 | −1168 | −1829 | 16,004 | −8526 | −13,349 | 116,818 | −169 | −264 | 2313 |
| 15 | 30 | 3.6 | 3.9 | 22.5 | −1430 | −2239 | 19,597 | −10,440 | −16,346 | 143,043 | −207 | −324 | 2833 |
| 20 | 33 | 3.96 | 4.29 | 24.75 | −1573 | −2463 | 21,556 | −11,484 | −17,981 | 157,347 | −227 | −356 | 3116 |
| 25 | 35 | 4.2 | 4.55 | 26.25 | −1669 | −2613 | 22,863 | −12,180 | −19,070 | 166,883 | −241 | −378 | 3305 |
| 30 | 36 | 4.32 | 4.68 | 27 | −1716 | −2687 | 23,516 | −12,528 | −19,615 | 171,651 | −248 | −388 | 3399 |
| 45 | 37 | 4.44 | 4.81 | 27.75 | −1764 | −2762 | 24,169 | −12,876 | −20,160 | 176,419 | −255 | −399 | 3493 |
| Baseline Survey | All Sampled Farmers Maize Produce, kg, Added | All Farmers in the Kebele Maize Produce, kg, Added | Number of People Able to be Fed by the Produce Added | ||||||||||
|---|---|---|---|---|---|---|---|---|---|---|---|---|---|
| # of Link | # Adoptions | Plant Normal | Plant Earlier | Plant Later | Plant Normal | Plant Earlier | Plant Later | Plant Normal | Plant Earlier | Plant Later | Plant Normal | Plant Earlier | Plant Later |
| 1 | 24 | 2.88 | 3.12 | 18 | −1144 | −1792 | 15,677 | −8352 | −13,077 | 114,434 | −165 | −259 | 2266 |
| 5 | 30 | 3.6 | 3.9 | 23 | −1430 | −2239 | 19,597 | −10,440 | −16,346 | 143,043 | −207 | −324 | 2833 |
| 10 | 35 | 4.2 | 4.55 | 26 | −1669 | −2613 | 22,863 | −12,180 | −19,070 | 166,883 | −241 | −378 | 3305 |
| 15 | 37 | 4.44 | 4.81 | 28 | −1764 | −2762 | 24,169 | −12,876 | −20,160 | 176,419 | −255 | −399 | 3493 |
| 20 | 37 | 4.44 | 4.81 | 28 | −1764 | −2762 | 24,169 | −12,876 | −20,160 | 176,419 | −255 | −399 | 3493 |
| 25 | 37 | 4.44 | 4.81 | 28 | −1764 | −2762 | 24,169 | −12,876 | −20,160 | 176,419 | −255 | −399 | 3493 |
| Baseline Survey | All Sampled Farmers Maize Produce, kg, Added | All Farmers in the Kebele Maize Produce, kg, Added | Number of People Able to be Fed by the Produce Added | ||||||||||
|---|---|---|---|---|---|---|---|---|---|---|---|---|---|
| # of Link | # Adoptions | Plant Normal | Plant Earlier | Plant Later | Plant Normal | Plant Earlier | Plant Later | Plant Normal | Plant Earlier | Plant Later | Plant Normal | Plant Earlier | Plant Later |
| 1 | 24 | 5 | 17 | 2 | 873 | 26,948 | −367 | 6371 | 196,703 | −2676 | 126 | 3895 | −53 |
| 5 | 30 | 6 | 21 | 3 | 1091 | 33,685 | −458 | 7963 | 245,879 | −3345 | 158 | 4869 | −66 |
| 10 | 35 | 7 | 25 | 4 | 1273 | 39,299 | −535 | 9291 | 286,859 | −3902 | 184 | 5680 | −77 |
| 15 | 37 | 7 | 26 | 4 | 1346 | 41,545 | −565 | 9822 | 303,251 | −4125 | 194 | 6005 | −82 |
| 20 | 37 | 7 | 26 | 4 | 1346 | 41,545 | −565 | 9822 | 303,251 | −4125 | 194 | 6005 | −82 |
| 25 | 37 | 7 | 26 | 4 | 1346 | 41,545 | −565 | 9822 | 303,251 | −4125 | 194 | 6005 | −82 |
| Baseline Survey | All Sampled Farmers Maize Produce, kg, Added | All Farmers in the Kebele Maize Produce, kg, Added | Number of People Able to be Fed by the Produce Added | ||||||||||
|---|---|---|---|---|---|---|---|---|---|---|---|---|---|
| Radinf | # Adoptions | Plant Normal | Plant Earlier | Plant Later | Plant Normal | Plant Earlier | Plant Later | Plant Normal | Plant Earlier | Plant Later | Plant Normal | Plant Earlier | Plant Later |
| 5 | 9 | 1.08 | 1.17 | 6.75 | −429 | −672 | 5879 | −3132 | −4904 | 42,913 | −62 | −97 | 850 |
| 10 | 20 | 2.4 | 2.6 | 15 | −954 | −1493 | 13,065 | −6960 | −10,897 | 95,362 | −138 | −216 | 1888 |
| 15 | 30 | 3.6 | 3.9 | 22.5 | −1430 | −2239 | 19,597 | −10,440 | −16,346 | 143,043 | −207 | −324 | 2833 |
| 20 | 35 | 4.2 | 4.55 | 26.25 | −1669 | −2613 | 22,863 | −12,180 | −19,070 | 166,883 | −241 | −378 | 3305 |
| 25 | 38 | 4.56 | 4.94 | 28.5 | −1812 | −2837 | 24,823 | −13,224 | −20,705 | 181,187 | −262 | −410 | 3588 |
| 30 | 39 | 4.68 | 5.07 | 29.25 | −1859 | −2911 | 25,476 | −13,572 | −21,250 | 185,956 | −269 | −421 | 3682 |
| 45 | 41 | 4.92 | 5.33 | 30.75 | −1955 | −3060 | 26,782 | −14,268 | −22,339 | 195,492 | −283 | −442 | 3871 |
| Baseline Survey | All Sampled Farmers Maize Produce, kg, Added | All Farmers in the Kebele Maize Produce, kg, Added | Number of People Able to be Fed by the Produce Added | ||||||||||
|---|---|---|---|---|---|---|---|---|---|---|---|---|---|
| Radinf | # Adoptions | Plant Normal | Plant Earlier | Plant Later | Plant Normal | Plant Earlier | Plant Later | Plant Normal | Plant Earlier | Plant Later | Plant Normal | Plant Earlier | Plant Later |
| 5 | 9 | 1.71 | 6.39 | 0.9 | 327 | 10,106 | −137 | 2389 | 73,764 | −1003 | 47 | 1461 | −20 |
| 10 | 20 | 3.8 | 14.2 | 2 | 727 | 22,457 | −305 | 5309 | 163,919 | −2230 | 105 | 3246 | −44 |
| 15 | 30 | 5.7 | 21.3 | 3 | 1091 | 33,685 | −458 | 7963 | 245,879 | −3345 | 158 | 4869 | −66 |
| 20 | 35 | 6.65 | 24.85 | 3.5 | 1273 | 39,299 | −535 | 9291 | 286,859 | −3902 | 184 | 5680 | −77 |
| 25 | 38 | 7.22 | 26.98 | 3.8 | 1382 | 42,668 | −580 | 10,087 | 311,447 | −4236 | 200 | 6167 | −84 |
| 30 | 39 | 7.41 | 27.69 | 3.9 | 1418 | 43,791 | −596 | 10,352 | 319,643 | −4348 | 205 | 6330 | −86 |
| 45 | 41 | 7.79 | 29.11 | 4.1 | 1491 | 46,036 | −626 | 10,883 | 336,035 | −4571 | 216 | 6654 | −91 |
| Baseline Survey | All Sampled Farmers Maize Produce, kg, Added | All Farmers in the Kebele Maize Produce, kg, Added | Number of People Able to be Fed by the Produce Added | ||||||||||
|---|---|---|---|---|---|---|---|---|---|---|---|---|---|
| Ext inf | # Adoptions | Plant Normal | Plant Earlier | Plant Later | Plant Normal | Plant Earlier | Plant Later | Plant Normal | Plant Earlier | Plant Later | Plant Normal | Plant Earlier | Plant Later |
| 5 | 5 | 0.6 | 0.65 | 3.75 | −238 | −373 | 3266 | −1740 | −2724 | 23,840 | −34 | −54 | 472 |
| 10 | 20 | 2.4 | 2.6 | 15 | −954 | −1493 | 13,065 | −6960 | −10,897 | 95,362 | −138 | −216 | 1888 |
| 15 | 30 | 3.6 | 3.9 | 22.5 | −1430 | −2239 | 19,597 | −10,440 | −16,346 | 143,043 | −207 | −324 | 2833 |
| 20 | 38 | 4.56 | 4.94 | 28.5 | −1812 | −2837 | 24,823 | −13,224 | −20,705 | 181,187 | −262 | −410 | 3588 |
| 25 | 38 | 4.56 | 4.94 | 28.5 | −1812 | −2837 | 24,823 | −13,224 | −20,705 | 181,187 | −262 | −410 | 3588 |
| 30 | 40 | 4.8 | 5.2 | 30 | −1907 | −2986 | 26,129 | −13,920 | −21,795 | 190,724 | −276 | −432 | 3777 |
| 45 | 42 | 5.04 | 5.46 | 31.5 | −2002 | −3135 | 27,435 | −14,616 | −22,884 | 200,260 | −289 | −453 | 3966 |
| Baseline Survey | All Sampled Farmers Maize Produce, kg, Added | All Farmers in the Kebele Maize Produce, kg, Added | Number of People Able to be Fed by the Produce Added | ||||||||||
|---|---|---|---|---|---|---|---|---|---|---|---|---|---|
| Ext inf | # Adoptions | Plant Normal | Plant Earlier | Plant Later | Plant Normal | Plant Earlier | Plant Later | Plant Normal | Plant Earlier | Plant Later | Plant Normal | Plant Earlier | Plant Later |
| 5 | 5 | 0.95 | 3.55 | 0.5 | 182 | 5614 | −76 | 1327 | 40,980 | −557 | 26 | 811 | −11 |
| 10 | 20 | 3.8 | 14.2 | 2 | 727 | 22,457 | −305 | 5309 | 163,919 | −2230 | 105 | 3246 | −44 |
| 15 | 30 | 5.7 | 21.3 | 3 | 1091 | 33,685 | −458 | 7963 | 245,879 | −3345 | 158 | 4869 | −66 |
| 20 | 38 | 7.22 | 26.98 | 3.8 | 1382 | 42,668 | −580 | 10,087 | 311,447 | −4236 | 200 | 6167 | −84 |
| 25 | 38 | 7.22 | 26.98 | 3.8 | 1382 | 42,668 | −580 | 10,087 | 311,447 | −4236 | 200 | 6167 | −84 |
| 30 | 40 | 7.6 | 28.4 | 4 | 1455 | 44,914 | −611 | 10,618 | 327,839 | −4459 | 210 | 6492 | −88 |
| 45 | 42 | 7.98 | 29.82 | 4.2 | 1527 | 47,159 | −641 | 11,149 | 344,231 | −4682 | 221 | 6816 | −93 |
| Baseline Survey | All Sampled Farmers Maize Produce, kg, Added | All Farmers in the Kebele Maize Produce, kg, Added | Number of People Able to be Fed for the Produce Added | ||||||||||
|---|---|---|---|---|---|---|---|---|---|---|---|---|---|
| Accur | # Adoptions | Plant Normal | Plant Earlier | Plant Later | Plant Normal | Plant Earlier | Plant Later | Plant Normal | Plant Earlier | Plant Later | Plant Normal | Plant Earlier | Plant Later |
| 30 | 0 | 0 | 0 | 0 | 0 | 0 | 0 | 0 | 0 | 0 | 0 | 0 | 0 |
| 40 | 0 | 0 | 0 | 0 | 0 | 0 | 0 | 0 | 0 | 0 | 0 | 0 | 0 |
| 50 | 1 | 0.12 | 0.13 | 0.75 | −48 | −75 | 653 | −348 | −545 | 4768 | −7 | −11 | 94 |
| 55 | 10 | 1.2 | 1.3 | 7.5 | −477 | −746 | 6532 | −3480 | −5449 | 47,681 | −69 | −108 | 944 |
| 60 | 20 | 2.4 | 2.6 | 15 | −954 | −1493 | 13,065 | −6960 | −10,897 | 95,362 | −138 | −216 | 1888 |
| 65 | 30 | 3.6 | 3.9 | 22.5 | −1430 | −2239 | 19,597 | −10,440 | −16,346 | 143,043 | −207 | −324 | 2833 |
| 70 | 37 | 4.44 | 4.81 | 27.75 | −1764 | −2762 | 24,169 | −12,876 | −20,160 | 176,419 | −255 | −399 | 3493 |
| 80 | 41 | 4.92 | 5.33 | 30.75 | −1955 | −3060 | 26,782 | −14,268 | −22,339 | 195,492 | −283 | −442 | 3871 |
| 90 | 43 | 5.16 | 5.59 | 32.25 | −2050 | −3210 | 28,089 | −14,964 | −23,429 | 205,028 | −296 | −464 | 4060 |
| Baseline Survey | All Sampled Farmers Maize Produce, kg, Added | All Farmers in the Kebele Maize Produce, kg, Added | Number of People Able to be Fed for the Produce Added | ||||||||||
|---|---|---|---|---|---|---|---|---|---|---|---|---|---|
| Accur | # Adoptions | Plant Normal | Plant Earlier | Plant Later | Plant Normal | Plant Earlier | Plant Later | Plant Normal | Plant Earlier | Plant Later | Plant Normal | Plant Earlier | Plant Later |
| 30 | 0 | 0 | 0 | 0 | 0 | 0 | 0 | 0 | 0 | 0 | 0 | 0 | 0 |
| 40 | 0 | 0 | 0 | 0 | 0 | 0 | 0 | 0 | 0 | 0 | 0 | 0 | 0 |
| 50 | 1 | 0.19 | 0.71 | 0.1 | 36 | 1123 | −15 | 265 | 8196 | −111 | 5 | 162 | −2 |
| 55 | 10 | 1.9 | 7.1 | 1 | 364 | 11,228 | −153 | 2654 | 81,960 | −1115 | 53 | 1623 | −22 |
| 60 | 20 | 3.8 | 14.2 | 2 | 727 | 22,457 | −305 | 5309 | 163,919 | −2230 | 105 | 3246 | −44 |
| 65 | 30 | 5.7 | 21.3 | 3 | 1091 | 33,685 | −458 | 7963 | 245,879 | −3345 | 158 | 4869 | −66 |
| 70 | 37 | 7.03 | 26.27 | 3.7 | 1346 | 41,545 | −565 | 9822 | 303,251 | −4125 | 194 | 6005 | −82 |
| 80 | 41 | 7.79 | 29.11 | 4.1 | 1491 | 46,036 | −626 | 10,883 | 336,035 | −4571 | 216 | 6654 | −91 |
| 90 | 43 | 8.17 | 30.53 | 4.3 | 1564 | 48,282 | −657 | 11,414 | 352,427 | −4794 | 226 | 6979 | −95 |
References
- Banu, S.; Rahman, A.; Adham, A. Assessment of the Effect of Climate Change on Vegetative Growth of Major Crops in Bangladesh Using DSSAT. Fundam. Appl. Agric. 2017, 2, 317. [Google Scholar] [CrossRef]
- CSA Agriculture Sample Survey Report on Area and Production of Crops; Central Statistical Agency: Addis Ababa, Ethiopia, 2015.
- CSA Agriculture Sample Survey Report on Area and Production of Crops; Central Statistical Agency: Addis Ababa, Ethiopia, 2013.
- CSA Agriculture Sample Survey Report on Area and Production of Crops; Central Statistical Agency: Addis Ababa, Ethiopia, 2012.
- Rashid, S.; Minot, N.; Lemma, S.; Behute, B. Are Staple Food Markets in Africa Efficient? Spatial Price Analyses and Beyond. In Proceedings of the Food Price Variability: Causes, Consequences, and Policy Options, Maputo, Mozambique, 25–26 January 2010. [Google Scholar]
- De Groote, H.; Doss, C.; Lyimo, S.D.; Mwangi, W. Adoption of Maize Technologies in East Africa—What Happened to Africa’s Emerging Maize Revolution? In Proceedings of the FASID Forum V “Green Revolution in Asia and its Transferability to Africa”, Tokyo, Japan, 8–10 December 2002; pp. 1–18. [Google Scholar]
- Gurmu, M.Y.; Meyer, F.; Hassan, R. Modelling Price Formation and Dynamics in the Ethiopian Maize Market. J. Agric. Sci. Technol. 2017, 19, 1439–1452. [Google Scholar]
- CSA Agriculture Sample Survey Report on Area and Production of Crops; Central Statistical Agency: Addis Ababa, Ethiopia, 2001.
- Abate, T.; Shiferaw, B.; Menkir, A.; Wegary, D.; Kebede, Y.; Tesfaye, K.; Kassie, M.; Bogale, G.; Tadesse, B.; Keno, T. Factors That Transformed Maize Productivity in Ethiopia. Food Secur. 2015, 7, 965–981. [Google Scholar] [CrossRef] [Green Version]
- FAO. Analysis of Price Incentives for Maize in Ethiopia for the Time Period 2005–2013; FAO: Rome, Italy, 2014. [Google Scholar]
- Dawit, A.; Shahidur, R.; Tripp, R. Seed System Potential in Ethiopia: Constraints and Opportunities for Enhancing the Seed Sector; International Food Policy Research Institute: Washington, DC, USA, 2010; pp. 1–42. [Google Scholar]
- Geta, E. Determinants of Farmers’ Decision on Soil Fertility Management Options for Maize Production in Southern Ethiopia. Am. J. Exp. Agric. 2013, 3, 226–239. [Google Scholar] [CrossRef]
- Wassie, S. Application of Stochastic Frontier Model on Agriculture: Empirical Evidence in Wheat Producing Areas of Amhara Region, Ethiopia; Books on Demand: Norderstedt, Germany, 2012. [Google Scholar]
- Isaac, O. Technical Efficiency of Maize Production in Oyo State. J. Econ. Int. Financ. 2011, 3, 211–216. [Google Scholar]
- Degefa, K.; Jaleta, M.; Legesse, B. Economic Efficiency of Smallholder Farmers in Maize Production in Bako Tibe District, Ethiopia. Dev. Ctry. Stud. 2017, 6, 80–86. [Google Scholar]
- Magreta, R.; Edriss, A.K.; Mapemba, L.; Zingore, S. Economic Efficiency of Rice Production in Smallholder Irrigation Schemes: A Case of Nkhate Irrigation Scheme in Southern Malawi. In Proceedings of the 4th International Conference of the African Association of Agricultural Economists, Hammamet, Tunisia, 22–25 September 2013. [Google Scholar]
- Regassa, B.A. Technical Efficiency Variation for Smallholder Irrigated Maize Producers: Stochastic Frontier Approach (A Case Study of Tibila Surface Water Irrigation Scheme). Master’s Thesis, Mekelle University, Tigray, Ethiopia, 2013. [Google Scholar]
- Temam, D.; Uddameri, V.; Mohammadi, G.; Hernandez, E.A.; Ekwaro-Osire, S. Long-Term Drought Trends in Ethiopia with Implications for Dryland Agriculture. Water 2019, 11, 2571. [Google Scholar] [CrossRef] [Green Version]
- Agnew, C.T.; Chappell, A. Drought in the Sahel. GeoJournal 1999, 48, 299–311. [Google Scholar] [CrossRef]
- Bureau of Rural Development. Rural Households Socioeconomic Baseline Survey of 56 Woredas in the Amhara Region; Crop Production and Protection: Bahir Dar, Ethiopia, 2003.
- IWMI Experiences and Opportunities for Promoting Small-Scale/ Micro Irrigation and Rainwater Harvesting for Food Security in Ethiopia; International Water Management Institute: Addis Ababa, Ethiopia, 2004.
- Gissila, T.; Black, E.; Grimes, D.I.F.; Slingo, J.M. Seasonal Forecasting of the Ethiopian Summer Rains. Int. J. Climatol. 2004, 24, 1345–1358. [Google Scholar] [CrossRef]
- Ifejika, S. Resilient Adaptation to Climate Change in African Agriculture; Deutsches Institut für Entwicklungspolitik: Bonn, Germany, 2010; p. 54. [Google Scholar]
- Broad, K.; Agrawala, S. The Ethiopian Food Crisis—Uses and Limits of Climate Forecasts. Science 2000, 289, 1693–1964. [Google Scholar] [CrossRef] [PubMed]
- Traoré, P.C.S.; Kouressy, M.; Vaksmann, M.; Tabo, R.; Maikano, I.; Traoré, S.B.; Cooper, P. Climate Prediction and Agriculture: What Is Different about Sudano-Sahelian West Africa? In Climate Prediction and Agriculture; Sivakumar, M., Hansen, J., Eds.; Springer: Berlin/Heidelberg, Germany, 2007; pp. 189–203. [Google Scholar]
- Ziervogel, G.; Bithell, M.; Washington, R.; Downing, T. Agent-Based Social Simulation: A Method for Assessing the Impact of Seasonal Climate Forecast Applications among Smallholder Farmers. Agric. Syst. 2005, 83, 1–26. [Google Scholar] [CrossRef]
- Warnasooriya, A.R. Interview on Jan 19 2016 with the Deputy Director; Forecasting Division, Department of Meteorology: Kathmandu, Nepal, 2016. [Google Scholar]
- Stigter, K. Applied Agrometeorology, 1st ed.; Stigter, K., Ed.; Springer: Berlin/Heidelberg, Germany, 2010; ISBN 978-3-540-74697-3. [Google Scholar]
- Berri, G.J.; Antico, P.L.; Goddard, L. Evaluation of the Climate Outlook Forums’ Seasonal Precipitation Forecasts of South East America during 1998–2002. Int. J. Climatol. 2005, 25, 365–377. [Google Scholar] [CrossRef]
- Power, S.; Casey, T.; Folland, C.; Colman, A.; Mehta, V. Inter-Decadal Modulation of the Impact of ENSO on Australia. Clim. Dyn. 1999, 15, 319–324. [Google Scholar] [CrossRef]
- Ash, A.; McIntosh, P.; Cullen, B.; Carberry, P.; Smith, M.S. Constraints and Opportunities in Applying Seasonal Climate Forecasts in Agriculture. Aust. J. Agric. Res. 2007, 58, 952. [Google Scholar] [CrossRef]
- Bryan, E.; Deressa, T.T.; Gbetibouo, G.A.; Ringler, C. Adaptation to Climate Change in Ethiopia and South Africa: Options and Constraints. Environ. Sci. Policy 2009, 12, 413–426. [Google Scholar] [CrossRef]
- Templeton, S.R.; Shane Perkins, M.; Aldridge, H.D.; Bridges, W.C.; Lassiter, B.R. Usefulness and Uses of Climate Forecasts for Agricultural Extension in South Carolina, USA. Reg. Environ. Chang. 2014, 14, 645–655. [Google Scholar] [CrossRef]
- Cabrera, V.E.; Breuer, N.E.; Bellow, J.G.; Fraisse, C.W. Extension Agent Knowledge and Perceptions of Seasonal Climate Forecasts in Florida. In Southeast Climate Consortium Technical Report Series; SECC Technical Report 06-001; Southeast Climate Consortium: Gainsville, FL, USA, 2006. [Google Scholar]
- Hammer, G.L.; Hansen, J.W.; Phillips, J.G.; Mjelde, J.W.; Hill, H.; Love, A.; Potgieter, A. Advances in Application of Climate Prediction in Agriculture. Agric. Syst. 2001, 70, 515–553. [Google Scholar] [CrossRef]
- Kenkel, P.L.; Norris, P.E. Agricultural producers’ willingness to pay for real-time mesoscale weather information. J. Agric. Resour. Econ. 1995, 20, 356–372. [Google Scholar]
- Mjelde, J.W.; Hill, H.S.J. The Effect of the Use of Improved Climate Forecasts on Variable Costs, Input Usage, and Production. Agric. Syst. 1999, 60, 213–225. [Google Scholar] [CrossRef]
- Hansen, J.W.; Mason, S.J.; Sun, L.; Tall, A. Review of Seasonal Climate Forecasting for Agriculture in Sub-Saharan Africa. Exp. Agric. 2011, 47, 205–240. [Google Scholar] [CrossRef] [Green Version]
- Amegnaglo, C.J.; Anaman, K.A.; Mensah-Bonsu, A.; Onumah, E.E.; Amoussouga Gero, F. Contingent Valuation Study of the Benefits of Seasonal Climate Forecasts for Maize Farmers in the Republic of Benin, West Africa. Clim. Serv. 2017, 6, 1–11. [Google Scholar] [CrossRef]
- Mudombi, S.; Nhamo, G. Access to Weather Forecasting and Early Warning Information by Communal Farmers in Seke and Murewa Districts, Zimbabwe. J. Hum. Ecol. 2014, 48, 357–366. [Google Scholar] [CrossRef]
- Mase, A.S.; Prokopy, L.S. Unrealized Potential: A Review of Perceptions and Use of Weather and Climate Information in Agricultural Decision Making. Weather Clim. Soc. 2014, 6, 47–61. [Google Scholar] [CrossRef]
- Mabe, F.N.; Nketiah, P.; Darko, D. Farmers’ Willingness to Pay for Weather Forecast Information in Savelugu-Nanton Municipality of the Northern Region. Rjoas 2014, 12, 34–44. [Google Scholar] [CrossRef]
- O’Brien, K.; Sygna, L.; Næss, L.O.; Kingamkono, R.; Hochobeb, B. Is Information Enough? User Responses to Seasonal Climate Forecasts in Southern Africa: Report to the World Bank, AFTE1-ENVGC Adaptation to Climate Change and Variability in Sub-Saharan Africa, Phase II; CICERO Senter for klimaforskning: Oslo, Norway, 2000; pp. 1–70. [Google Scholar]
- PytlikZillig, L.M.; Hu, Q.; Hubbard, K.G.; Lynne, G.D.; Bruning, R.H. Improving Farmers’ Perception and Use of Climate Predictions in Farming Decisions: A Transition Model. J. Appl. Meteorol. Climatol. 2010, 49, 1333–1340. [Google Scholar] [CrossRef] [Green Version]
- Ziervogel, G.; Calder, R. Climate Variability and Rural Livelihoods: Assessing the Impact of Seasonal Climate Forecasts in Lesotho. Area 2003, 35, 403–417. [Google Scholar] [CrossRef]
- Carberry, P.; Hammer, G.L.; Meinke, H.; Bange, M. The Potential Value of Seasonal Climate Forecasting in Managing Cropping Systems. In Applications of Seasonal Climate Forecasting Agricultural and Natural Ecosystems; Hammer, G., Nicholls, N., Mitchell, C., Eds.; Kluwer: Dordrecht, The Netherlands, 2000; pp. 167–180. [Google Scholar]
- Hammer, G.L.; Holzworth, D.P.; Stone, R. The Value of Skill in Seasonal Climate Forecasting to Wheat Crop Management in a Region with High Climatic Variability. Aust. J. Agric. Res. 1996, 47, 717–737. [Google Scholar] [CrossRef]
- Chattoe, E. Why Is Building Multi-Agent Models of Social Systems so Difficult? A Case Study of Innovation Diffusion. In Proceedings of the XXIV International Conference of Agricultural Economists (IAAE), Mini-Symposium on “Integrating Approaches for Natural Resource Management and Policy Analysis: Bioeconomic Models, Multi-Agent Systems and Cellular Automata”, Berlin, Germany, 13–18 August 2000; pp. 13–19. [Google Scholar]
- Berger, T. Agent-Based Spatial Models Applied to Agriculture: A Simulation Tool for Technology Diffusion, Resource Use Changes and Policy Analysis. Agric. Econ. 2001, 25, 245–260. [Google Scholar] [CrossRef]
- Brady, M.; Kellermann, K.; Sahrbacher, C.; Jelinek, L. Impacts of Decoupled Agricultural Support on Farm Structure, Biodiversity and Landscape Mosaic: Some EU Results. J. Agric. Econ. 2009, 60, 563–585. [Google Scholar] [CrossRef]
- Happe, K.; Kellermann, K.; Balmann, A. Agent-Based Analysis of Agricultural Policies: An Illustration of the Agricultural Policy Simulator AgriPolis, Its Adaptation and Behavior. Ecol. Soc. 2006, 11, 49. [Google Scholar] [CrossRef] [Green Version]
- Happe, K.; Balmann, A.; Kellermann, K.; Sahrbacher, C. Does Structure Matter? The Impact of Switching the Agricultural Policy Regime on Farm Structures. J. Econ. Behav. Organ. 2008, 67, 431–444. [Google Scholar] [CrossRef] [Green Version]
- Happe, K.; Hutchings, N.J.; Dalgaard, T.; Kellerman, K. Modelling the Interactions between Regional Farming Structure, Nitrogen Losses and Environmental Regulation. Agric. Syst. 2011, 104, 281–291. [Google Scholar] [CrossRef]
- Widener, M.J.; Bar-Yam, Y.; Gros, A.; Metcalf, S.S.; Bar-Yam, Y. Modeling Policy and Agricultural Decisions in Afghanistan. GeoJournal 2013, 78, 591–599. [Google Scholar] [CrossRef] [Green Version]
- Sengupta, R.; Lant, C.; Kraft, S.; Beaulieu, J.; Peterson, W.; Loftus, T. Modeling Enrollment in the Conservation Reserve Program by Using Agents within Spatial Decision Support Systems: An Example from Southern Illinois. Environ. Plan. B Plan. Des. 2005, 32, 821–834. [Google Scholar] [CrossRef] [Green Version]
- Carr, R.; Onzere, S.; Kalala, T.; Owusu-Daaku, K.; Rosko, H. Assessing Mali’s l’Agence Nationale de La Météorologie’s (Mali Meteo) Agrometeorological Advisory Program: Final Report in the Farmer Use of Advisories and the Implications for Climate Service Design; Engility Corporation: Washington, DC, USA, 2015. [Google Scholar]
- Matthews, R.B.; Gilbert, N.G.; Roach, A.; Polhill, J.G.; Gotts, N.M. Agent-Based Land-Use Models: A Review of Applications. Landsc. Ecol. 2007, 22, 1447–1459. [Google Scholar] [CrossRef] [Green Version]
- Reidsma, P.; Janssen, S.; Jansen, J.; van Ittersum, M.K. On the Development and Use of Farm Models for Policy Impact Assessment in the European Union—A Review. Agric. Syst. 2018, 159, 111–125. [Google Scholar] [CrossRef]
- Robinson, D.T.; Brown, D.G.; Parker, D.C.; Schreinemachers, P.; Janssen, M.A.; Huigen, M.; Wittmer, H.; Gotts, N.; Promburom, P.; Irwin, E.; et al. Comparison of Empirical Methods for Building Agent-Based Models in Land Use Science. J. Land Use Sci. 2007, 2, 31–55. [Google Scholar] [CrossRef]
- Jones, J.W.; Hoogenboom, G.; Porter, C.H.; Boote, K.J.; Batchelor, W.D.; Hunt, L.A.; Wilkens, P.W.; Singh, U.; Gijsman, A.J.; Ritchie, J.T. The DSSAT cropping system model. Eur. J. Agron. 2003, 18, 235–265. [Google Scholar] [CrossRef]
- White, J.W.; Jones, J.W.; Porter, C.; McMaster, G.S.; Sommer, R. Issues of Spatial and Temporal Scale in Modeling the Effects of Field Operations on Soil Properties. Oper. Res. 2010, 10, 279–299. [Google Scholar] [CrossRef]
- Keating, B.A.; Carberry, P.S.; Hammer, G.L.; Probert, M.E.; Robertson, M.J.; Holzworth, D.; Huth, N.I.; Hargreaves, J.N.G.; Meinke, H.; Hochman, Z.; et al. An Overview of APSIM, a Model Designed for Farming Systems Simulation. Eur. J. Agron. 2003, 18, 267–288. [Google Scholar] [CrossRef] [Green Version]
- Jones, J.W.; Antle, J.M.; Basso, B.; Boote, K.J.; Conant, R.T.; Foster, I.; Godfray, H.C.J.; Herrero, M.; Howitt, R.E.; Janssen, S.; et al. Brief History of Agricultural Systems Modeling. Agric. Syst. 2017, 155, 240–254. [Google Scholar] [CrossRef] [PubMed]
- Musayev, S.; Mellor, J.; Walsh, T.; Anagnostou, E. Development of an Agent-Based Model for Weather Forecast Information Exchange in Rural Area of Bahir Dar, Ethiopia. Sustainability 2021, 13, 4936. [Google Scholar] [CrossRef]
- Block, P.J. Mitigating the Effects of Hydrologic Variability in Ethiopia: An Assessment of Investments in Agricultural and Transportation Infrastructure, Energy and Hydroclimatic Forecasting; CPWF Working Paper 01; The CGIAR Challenge Program on Water and Food: Colombo, Sri Lanka, 2008. [Google Scholar]
- Melesse, A.M.; Abtew, W.; Setegn, S.G. Nile River Basin: Ecohydrological Challenges, Climate Change and Hydropolitics; Springer: Cham, Switzerland, 2014. [Google Scholar] [CrossRef]
- Goshu, Y.A.; Yitayew, A.E. Malaria Knowledge and Its Associated Factors among Pregnant Women Attending Antenatal Clinic of Adis Zemen Hospital, North-Western Ethiopia, 2018. PLoS ONE 2019, 14, e0210221. [Google Scholar] [CrossRef] [PubMed] [Green Version]
- Seleshi, Y.; Zanke, U. Recent Changes in Rainfall and Rainy Days in Ethiopia. Int. J. Climatol. 2004, 24, 973–983. [Google Scholar] [CrossRef]
- Van den Berg, H.; Ketelaar, J.W.; Dicke, M.; Fredrix, M. Is the Farmer Field School Still Relevant? Case Studies from Malawi and Indonesia. NJAS Wagening. J. Life Sci. 2020, 92, 100329. [Google Scholar] [CrossRef]
- Monge, M.; Hartwich, F.; Halgin, D. How Change Agents and Social Capital Influence the Adoption of Innovations among Small Farmers: Evidence from Social Networks in Rural Bolivia; International Food Policy Research Institute: Washington, DC, USA, 2008. [Google Scholar]
- Tuheirwe-Mukasa, D.; Haveraaen, M.; Sansa-Otim, J.; Kanagwa, B.; Mujuni, G.R. The Efficacy of ICT in Weather Forecast Information Dissemination: Evidence from Farming Communities in Mbale and Rakai Districts, Uganda. In Climate Change Management: Agriculture and Ecosystem Resilience in Sub Saharan Africa; Bamutaze, Y., Kyamanywa, S., Singh, B., Nabanoga, G., Lal, G., Eds.; Springer: Cham, Switzerland, 2019; pp. 571–593. [Google Scholar]
- Gurstein, P.C. Wired to the World, Chained to the Home: Telework in Daily Life; University of British Columbia Press: Vancouver, BC, Canada, 2001. [Google Scholar]
- Sear, C.B.; Tadesse, T.; Bettany, B.; Budgen, P.; Copley, V.; Griggs, D. The Presentation of Weather Information via the Media in Ethiopia. Meteorol. Appl. 2007, 3, 295–300. [Google Scholar] [CrossRef]
- Marsh, S. Formalizing Trust as a Computational Concept. Ph.D. Thesis, University of Stirling, Stirling, UK, 1994. [Google Scholar]
- NOAA Global Historical Climatology Network V2 Climate Data. Available online: http://www.ncdc.noaa.gov/oa/climate/ghcn-daily (accessed on 20 July 2017).
- SoilGrid Global Soil Data. Available online: www.isric.org/explore/soilgrids (accessed on 21 April 2021).
- Pang, X.P.; Letey, J.; Wu, L. Yield and Nitrogen Uptake Prediction by CERES-Maize Model under Semiarid Conditions. Soil Sci. Soc. Am. J. 1997, 61, 254–256. [Google Scholar] [CrossRef]
- Bert, F.E.; Laciana, C.E.; Podestá, G.P.; Satorre, E.H.; Menéndez, A.N. Sensitivity of CERES-Maize Simulated Yields to Uncertainty in Soil Properties and Daily Solar Radiation. Agric. Syst. 2007, 94, 141–150. [Google Scholar] [CrossRef]
- Soler, C.M.T.; Sentelhas, P.C.; Hoogenboom, G. Application of the CSM-CERES-Maize Model for Planting Date Evaluation and Yield Forecasting for Maize Grown off-Season in a Subtropical Environment. Eur. J. Agron. 2007, 27, 165–177. [Google Scholar] [CrossRef]
- Gungula, D.T.; Kling, J.G.; Togun, A.O. CERES-Maize Predictions of Maize Phenology under Nitrogen-Stressed Conditions in Nigeria. Agron. J. 2003, 95, 892–899. [Google Scholar] [CrossRef]
- Mubeen, M.; Ahmad, A.; Wajid, A.; Khaliq, T.; Hammad, H.M.; Sultana, S.R.; Ahmad, S.; Fahad, S.; Nasim, W. Application of CSM-CERES-Maize Model in Optimizing Irrigated Conditions. Outlook Agric. 2016, 45, 173–184. [Google Scholar] [CrossRef]
- Chisanga, C.B.; Phiri, E.; Shepande, C.; Sichingabula, H. Evaluating CERES-Maize Model Using Planting Dates and Nitrogen Fertilizer in Zambia. J. Agric. Sci. 2015, 7, 1–19. [Google Scholar] [CrossRef] [Green Version]
- Fleskens, L.; Kunert, K.; Maccarthy, D.S.; Adiku, S.G.K.; Freduah, B.S.; Gbefo, F.; Kamara, A.Y. Using CERES-Maize and ENSO as Decision Support Tools to Evaluate Climate-Sensitive Farm Management Practices for Maize Production in the Northern Regions of Ghana. Front. Plant Sci. 2017, 1, 31. [Google Scholar] [CrossRef] [Green Version]
- Ahmad, I.; Ahmad, B.; Boote, K.; Hoogenboom, G. Adaptation Strategies for Maize Production under Climate Change for Semi-Arid Environments. Eur. J. Agron. 2020, 115, 126040. [Google Scholar] [CrossRef]
- Van Rijn, F.; Bulte, E.; Adekunle, A. Social Capital and Agricultural Innovation in Sub-Saharan Africa. Agric. Syst. 2012, 108, 112–122. [Google Scholar] [CrossRef]
- Narayan, D.; Pritchett, L. Cents and Sociability: Household Income and Social Capital in Rural Tanzania. Econ. Dev. Cult. Change 1999, 47, 870–897. [Google Scholar] [CrossRef] [Green Version]
- Centola, D.; Gonzlez-Avella, J.C.; Eguíluz, V.M.; San Miguel, M. Homophily, Cultural Drift, and the Co-Evolution of Cultural Groups. J. Confl. Resolut. 2007, 51, 905–929. [Google Scholar] [CrossRef] [Green Version]
- Tepic, M.; Trienekens, J.H.; Hoste, R.; Omtad, S.W.F. The Influence of Networking and Absorptive Capacity on the Innovativeness of Farmers in the Dutch Pork Sector? Int. Food Agribus. Manag. Rev. 2012, 15, 1–34. [Google Scholar]
- Patt, A.; Suarez, P.; Gwata, C. Effects of Seasonal Climate Forecasts and Participatory Workshops among Subsistence Farmers in Zimbabwe. Proc. Natl. Acad. Sci. USA 2005, 102, 12623–12628. [Google Scholar] [CrossRef] [PubMed] [Green Version]
- Rogers, E. Diffusion of Innovations, 5th ed.; The Free Press: New York, NY, USA, 2003. [Google Scholar]
- Singh Nain, M.; Singh, R.; Mishra, J.R. Social Networking of Innovative Farmers through WhatsApp Messenger for Learning Exchange: A Study of Content Sharing. Indian J. Agric. Sci. 2019, 89, 556–558. [Google Scholar]
- Anuga, S.W.; Gordon, C. Adoption of Climate-Smart Weather Practices among Smallholder Food Crop Farmers in the Techiman Municipal: Implication for Crop Yield. Res. J. Agric. Environ. Manag. 2016, 5, 279–286. [Google Scholar]
- Zongo, B.; Diarra, A.; Barbier, B.; Zorom, M.; Yacouba, H.; Dogot, T. Farmers’ Perception and Willingness to Pay for Climate Information in Burkina Faso. J. Agric. Sci. 2015, 8, 175. [Google Scholar] [CrossRef] [Green Version]
- Perez-Teran, A.; Tiani, A.; Touko-Tchoko, M.; Tchatchou, B. Testing the Influence of Radio Programs on Climate Change Knowledge: A Pilot Experience from the Congo Basin; CIFOR: Bogor, Indonesia, 2015. [Google Scholar]
- Fadare, O.; Akerele, D.; Toritseju, B. Factors Influencing Adoption Decisions of Maize Farmers in Nigeria. Int. J. Food Agric. Econ. 2014, 2, 45–54. [Google Scholar]
- Maoba, S. Farmers’ Perception of Agricultural Extension Service Delivery in Germiston Region, Gauteng Province, South Africa. J. Agric. Ext. Maoba 2016, 44, 167–173. [Google Scholar] [CrossRef]
- Ravi Shankar, K.; Nagasree, K.; Venkateswarlu, B.; Maraty, P. Constraints and Suggestions in Adopting Seasonal Climate Forecasts by Farmers in South India. J. Agric. Educ. Ext. 2011, 17, 153–163. [Google Scholar] [CrossRef]
- Tarhule, A.; Lamb, P.J. Climate Research and Seasonal Forecasting for West Africans. Bull. Am. Meteorol. Soc. 2003, 84, 1741–1759. [Google Scholar] [CrossRef]
- Hansen, J.W.; Mishra, A.; Rao, K.P.C.; Indeje, M.; Ngugi, R.K. Potential Value of GCM-Based Seasonal Rainfall Forecasts for Maize Management in Semi-Arid Kenya. Agric. Syst. 2009, 101, 80–90. [Google Scholar] [CrossRef] [Green Version]
- Cane, M.A.; Eshel, G.; Buckland, R.W. Forecasting Zimbabwean Maize Yield Using Eastern Equatorial Pacific Sea Surface Temperature. Nature 1994, 370, 204–205. [Google Scholar] [CrossRef]
- Bacci, M.; Baoua, Y.O.; Tarchiani, V. Agrometeorological Forecast for Smallholder Farmers: A Powerful Tool for Weather-Informed Crops Management in the Sahel. Sustainability 2020, 12, 3246. [Google Scholar] [CrossRef] [Green Version]
- Omulo, G.; Kumeh, E.M. Farmer-to-Farmer Digital Network as a Strategy to Strengthen Agricultural Performance in Kenya: A Research Note on ‘Wefarm’ Platform. Technol. Forecast. Soc. Change 2020, 158, 120120. [Google Scholar] [CrossRef]
- Vermeulen, S.J.; Aggarwal, P.K.; Ainslie, A.; Angelone, C.; Campbell, B.M.; Challinor, A.J.; Hansen, J.W.; Ingram, J.S.I.; Jarvis, A.; Kristjanson, P.; et al. Options for Support to Agriculture and Food Security under Climate Change. Environ. Sci. Policy 2012, 15, 136–144. [Google Scholar] [CrossRef]


| During Shortage of Rain, Farmer: | During Excess Rain, Farmer: | |||||
|---|---|---|---|---|---|---|
| No change | Earlier | Later | No change | Earlier | Later | |
| Planted maize early or later | 12 | 13 | 75 | 19 | 71 | 10 |
| No | Yes | No | Yes | |||
| Changed seed type | 48 | 52 | 56 | 44 | ||
| No change | Less/ decreased | More/ increased | No change | Less/ decreased | More/ increased | |
| Seed price | 71 | 6 | 23 | 72 | 7 | 21 |
| Used more/less fertilizers | 63 | 10 | 27 | 62 | 3 | 35 |
| Pest problems | 43 | 12 | 45 | 33 | 61 | 6 |
| Used more/less pesticides | 44 | 9 | 47 | 32 | 52 | 16 |
| Tillage frequency | 63 | 15 | 22 | 54 | 22 | 24 |
| Cultivated less/more land | 91 | 5 | 4 | 88 | 6 | 6 |
| Grew fewer/more cash crops | 80 | 20 | 75 | 5 | 20 | |
| Price of maize | 64 | 4 | 32 | 70 | 21 | 9 |
| Stored more/less grains | 55 | 30 | 15 | 59 | 16 | 25 |
| Procured less/more livestock | 95 | 5 | 0 | 93 | 1 | 6 |
| Information Flow | Neighboring Farmer | Other Farmers | Extension Worker | Media (Radio) | Average | |
|---|---|---|---|---|---|---|
| Source of information farmers receive from: | Yes | 41 | 36 | 50 | 34 | 40.2 |
| No | 59 | 64 | 50 | 66 | 59.8 | |
| Level of trust in weather forecast from: | Not at all | 59 | 64 | 50 | 67 | 60.0 |
| Somewhat | 34 | 32 | 24 | 23 | 28.2 | |
| Very much | 7 | 4 | 15 | 6 | 8.0 | |
| Fully | 0 | 0 | 11 | 4 | 3.7 | |
| How often agents act-upon the forecast information from: | Never | 61 | 64 | 52 | 67 | 61.0 |
| Twice a year | 32 | 33 | 40 | 24 | 32.2 | |
| Every month | 7 | 2 | 7 | 5 | 5.2 | |
| Once a week | 0 | 1 | 1 | 4 | 1.5 |
| Farming Activities | Used Amount | ||
|---|---|---|---|
| Seeds used, kg/ha | 4–20 | 20–30 | 30–50 |
| Crop productivity, kg/ha | 2662 | 4286 | 5121 |
| Fertilizer NPS used, kg/ha | 65–100 | 100–200 | 200–270 |
| Crop productivity, kg/ha | 3034 | 4077 | 3980 |
| Herbicides used, L/ha | 0.5–0.9 | 1–2 | 2–3.2 |
| Crop productivity, kg/ha | 3263 | 3346 | 4744 |
| Tillage frequencies | 1–4 | 5–9 | |
| Crop productivity, kg/ha | 4295 | 4013 | |
| Average crop productivity, kg/ha | 3462 | ||
| More Rainfall Condition | Less Rainfall Condition | |||||
|---|---|---|---|---|---|---|
| Farmers’ decision | Plant normal | Plant early | Plant late | Plant normal | Plant early | Plant late |
| FCT normal | 3611 | 4296 | 3285 | 3072 | 3096 | 3900 |
| FCT more | 3883 | 5574 | 3607 | 3432 | 3269 | 4500 |
| FCT less | 3300 | 3800 | 3190 | 3072 | 2845 | 3800 |
| Average | 3598 | 4557 | 3361 | 3192 | 3070 | 4067 |
| Diff. from baseline | 132 | 1091 | −105 | −274 | −396 | 601 |
Publisher’s Note: MDPI stays neutral with regard to jurisdictional claims in published maps and institutional affiliations. |
© 2022 by the authors. Licensee MDPI, Basel, Switzerland. This article is an open access article distributed under the terms and conditions of the Creative Commons Attribution (CC BY) license (https://creativecommons.org/licenses/by/4.0/).
Share and Cite
Musayev, S.; Mellor, J.; Walsh, T.; Anagnostou, E. Application of Agent-Based Modeling in Agricultural Productivity in Rural Area of Bahir Dar, Ethiopia. Forecasting 2022, 4, 349-370. https://0-doi-org.brum.beds.ac.uk/10.3390/forecast4010020
Musayev S, Mellor J, Walsh T, Anagnostou E. Application of Agent-Based Modeling in Agricultural Productivity in Rural Area of Bahir Dar, Ethiopia. Forecasting. 2022; 4(1):349-370. https://0-doi-org.brum.beds.ac.uk/10.3390/forecast4010020
Chicago/Turabian StyleMusayev, Sardorbek, Jonathan Mellor, Tara Walsh, and Emmanouil Anagnostou. 2022. "Application of Agent-Based Modeling in Agricultural Productivity in Rural Area of Bahir Dar, Ethiopia" Forecasting 4, no. 1: 349-370. https://0-doi-org.brum.beds.ac.uk/10.3390/forecast4010020