Article

Assessing the Main Frequencies of Modern and Historical Buildings Using Ambient Noise Recordings: Case Studies in the Historical Cities of Crete (Greece)

by
Margarita Moisidi
1,
Filippos Vallianatos
1,* and
Maria Rosaria Gallipoli
2
1
UNESCO Chair on Solid Earth Physics and Geohazards Risk Reduction, Technological Educational Institute of Crete, Romanou Str, 3 Chalepa, Chania, Crete 73133, Greece
2
Institute of Methodologies for Environmental Analysis—CNR, Tito Scalo, 85050 PZ, Italy
*
Author to whom correspondence should be addressed.
Submission received: 21 June 2018 / Revised: 2 August 2018 / Accepted: 10 August 2018 / Published: 15 August 2018

Abstract

:
Monitoring seismic structural response is an essential issue in earthquake risk assessments and mitigation studies for monumental buildings in order to undertake earthquake disaster management. This study aims at identifying the resonant frequency of soil and modern and historical buildings in three major municipalities of Crete (Heraklion, Chania, and Rethymno) using ambient noise recordings (microtremors) considering the importance of soil–structure interaction to seismic structural response, particularly for historical buildings and monumental structures. In this study, ambient noise recordings have been processed through Horizontal to Vertical Spectral Ratios (H/V) to preliminarily examine the main frequencies and to examine whether the building has its main frequency close to that of the soil in order to identify potential resonance phenomena. Numerous ambient noise recordings were recorded on the soil, in the basement, and at each n-floor of the buildings. The incorporation of local site conditions and soil-building resonance phenomena into the urban planning development of Crete regarding earthquake risk assessments is necessary. In this direction, microtremors can be used as an effective tool to support civil protection preparation and operational decision-making in terms of earthquake disaster, specifically in the area of Crete, which is characterized by high seismic activity and a high cultural monuments capacity.

1. Introduction

Studies of earthquake damage after destructive earthquakes (Mexico City, 1985; Loma Prieta, 1989; Turkey, 1999; Athens, 1999; L’Aquila, 2009; and recently the Nepal earthquake, which occurred in April 2015) reveal the importance of local site effects and soil–structure interaction on earthquake damage distribution. The 2013 EU Civil Protection legislation gives greater emphasis on disaster prevention and preparedness with a particular focus on risk assessments and risk management planning. In this direction, dynamic structural monitoring, integrated tools for earthquake response planning, and situational awareness to support civil protection preparation and operational decision-making in terms of earthquake disaster are of paramount importance, specifically in highly seismic areas where cultural monuments exist. Past and recent examples of destructive earthquakes verified that the evaluation of soil and structure characteristics is a critical issue in the preparedness for and mitigation and management of earthquake disasters, especially in populated and historical regions located in highly seismic environments.
Research outcomes suggest that the nature and complexity of the local site conditions and/or the soil-structure resonance phenomena are capable of increasing structural damage [1,2,3,4,5,6]. It is also well-documented that, during strong motion excitations, various building typologies and structural elements have avoided damage or suffered multi-level damage [7,8]. Moreover, soil–structure interaction is an important issue in seismic hazard assessment studies predominantly for historical buildings and particularly in monuments where the effect of soil conditions on their seismic response should be examined through soil–structure interaction studies [9]. According to [10], one of the most important factors in building damage distribution after an earthquake event is the soil and structure interaction. Resonance evaluation has been used to study the damage pattern caused by earthquake events [11,12,13]. During the L’Aquila earthquake, a building collapsed at a site located close to a strong discontinuity, while buildings located a short distance away suffered little or no damage [4]. A recent example in [6] highlights the importance of local site effects in earthquake damage distribution after the Emilia earthquake, where two identical tall reinforced structure (RC) structures located at a close distance suffered different damage.
Seismic ambient noise recordings have been used as a tool to estimate the seismic dynamic response of buildings, their fundamental period, and possible resonance phenomena between the soil and structures [3,13,14,15]. Moreover, research outcomes presented in [15,16] showed that the vibration period of an existing European building is significantly smaller than the values of the code provisions for design (e.g., EC8). The authors in [17,18] applied the Horizontal to Vertical Spectral Ratio (HVSR) to determine the dynamic characteristics of the Tower of Pisa and to identify vulnerable points of the Roman coliseum. Since this pioneering work of Nakamura [17,18,19,20], the HVSR technique using either microtremor or earthquake data has been applied in several studies to estimate a building’s fundamental frequency of vibration and soil–structure interaction phenomena [4,14,16,21,22,23,24,25,26]. The advantage of microtremors is that they can be used for a preliminary estimation of a building’s vulnerability without the need for structural details (the width of frames, the number of openings, the mass of floors, and the number of columns). Moreover, it is a non-destructive technique and therefore it can be easily applied to a large number of buildings as well as in historical and monumental structures. Several other techniques have been implemented to identify a building’s fundamental frequencies [27].
The purpose of this study is to examine the main frequencies of some important historical buildings in three major municipalities (Chania, Rethymno, and Heraklion) of Crete using ambient noise recordings. Specifically, this study is aimed at identifying the resonant frequency of soil and a structure using ambient noise recordings considering the importance of assessing soil amplification effects occurring at frequencies comparable with those observed for building structures, which may cause a pronounced increase of damage during earthquake motion excitation. This study highlights the necessity of incorporating prone resonating buildings into urban planning for earthquake risk assessments and earthquake disaster management, especially in this highly seismic active region of Crete where a significant cultural capacity is present.

2. Microtremors and Data Set

Microtremors were recorded in the foundation soil and basement and at each n-floor of the studied building constructions using a Lennartz 3D/5sec seismometer connected to a Cityshark II acquisition system. For all in situ ambient noise recordings, the N–S microtremor component corresponds to the longitudinal and the E–W microtremor component corresponds to the transverse direction of the building. The measurements were not recorded synchronously at each floor. In some cases, the seismic sensor was set with a compass either to North and/or parallel to the building’s walls. The guidelines given in [28,29] were followed. Microtremor measurements of 10, 15, 20, and 30 min sampled at 128 Hz and/or 125 Hz were collected. Microtremor processing for HVSR calculations includes: (a) time window selection of the stationary signal window, (b) correcting the selected time windows of each time series for the baseline and for anomalous trends, tapering them with a cosine function to the first and last 5% of the signal, and band bass filtering and smoothing with triangular windows (the horizontal N–S components and E–W components were averaged to derive the horizontal (H) spectrum), and (c) calculating the average HVSR spectra ratio, the HNS/V ratio (Horizontal NS component over the Vertical component) and HEW/V (Horizontal EW component over the Vertical component) ratio (and the standard deviations of the extracted spectral ratios) of the selected N time series window. The horizontal to vertical spectral ratio of the (HVSR) technique as described by [28,30] is based on the horizontal and vertical components of microtremors recorded on the surface of the ground using one single seismological station considering that the vertical component is not amplified by the surficial layers. This methodological approach suggests that the ground’s fundamental frequency can be estimated due to the multi-reflection of the shear horizontal- SH-wave in the surface layers regardless of the degree of the Rayleigh wave effects. The basic methodological assumptions by [28,30] are: (1) the effect of the Rayleigh waves on the horizontal to vertical (H/V) peak frequency of ground seismic motion, (2) the vertical component is not amplified at the fundamental frequency F0, and (3) the horizontal to vertical spectra ratio of a rock site (for a wide frequency range 0.2–20 Hz) is close to unity. A simple diagram describing the HVSR technique is shown in the following Figure 1. However, a block diagram describing the HVSR technique considering noise, data sampling, and processing artifacts is given in [31]. Detailed specifications about a Lennartz 3D/5 sec seismometer connected to a Cityshark II acquisition system can be found in [32].

3. Results

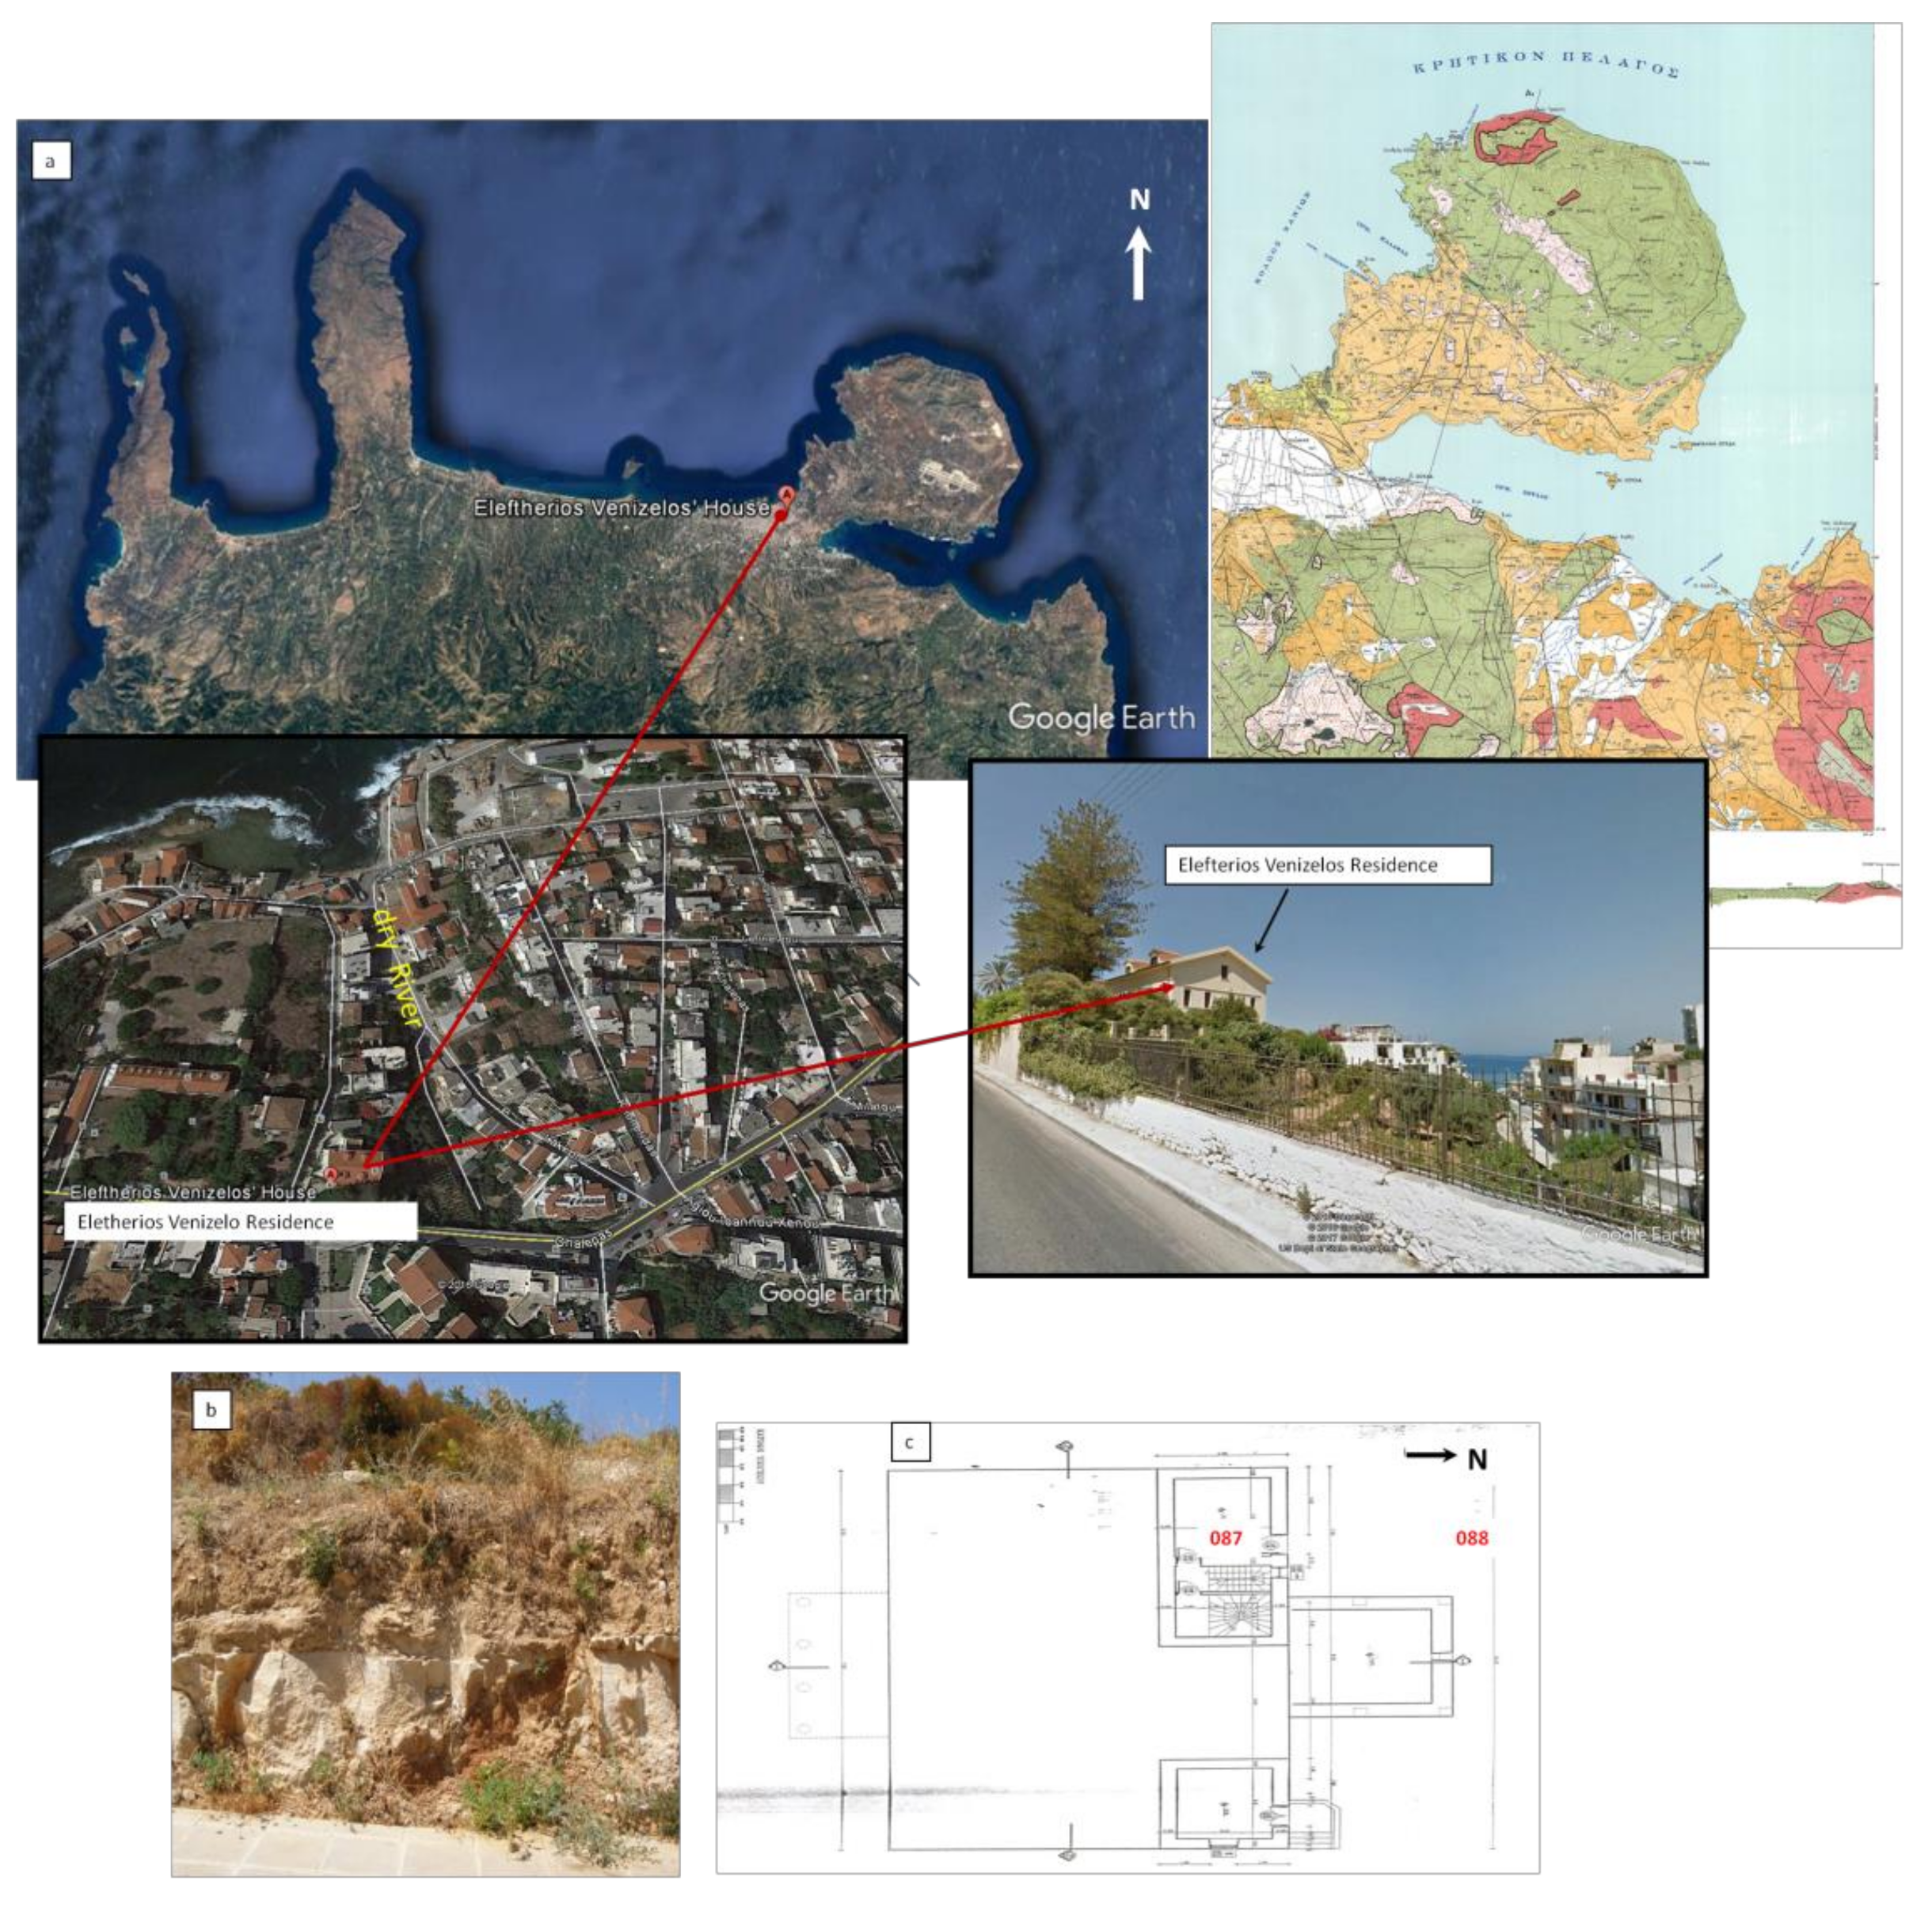
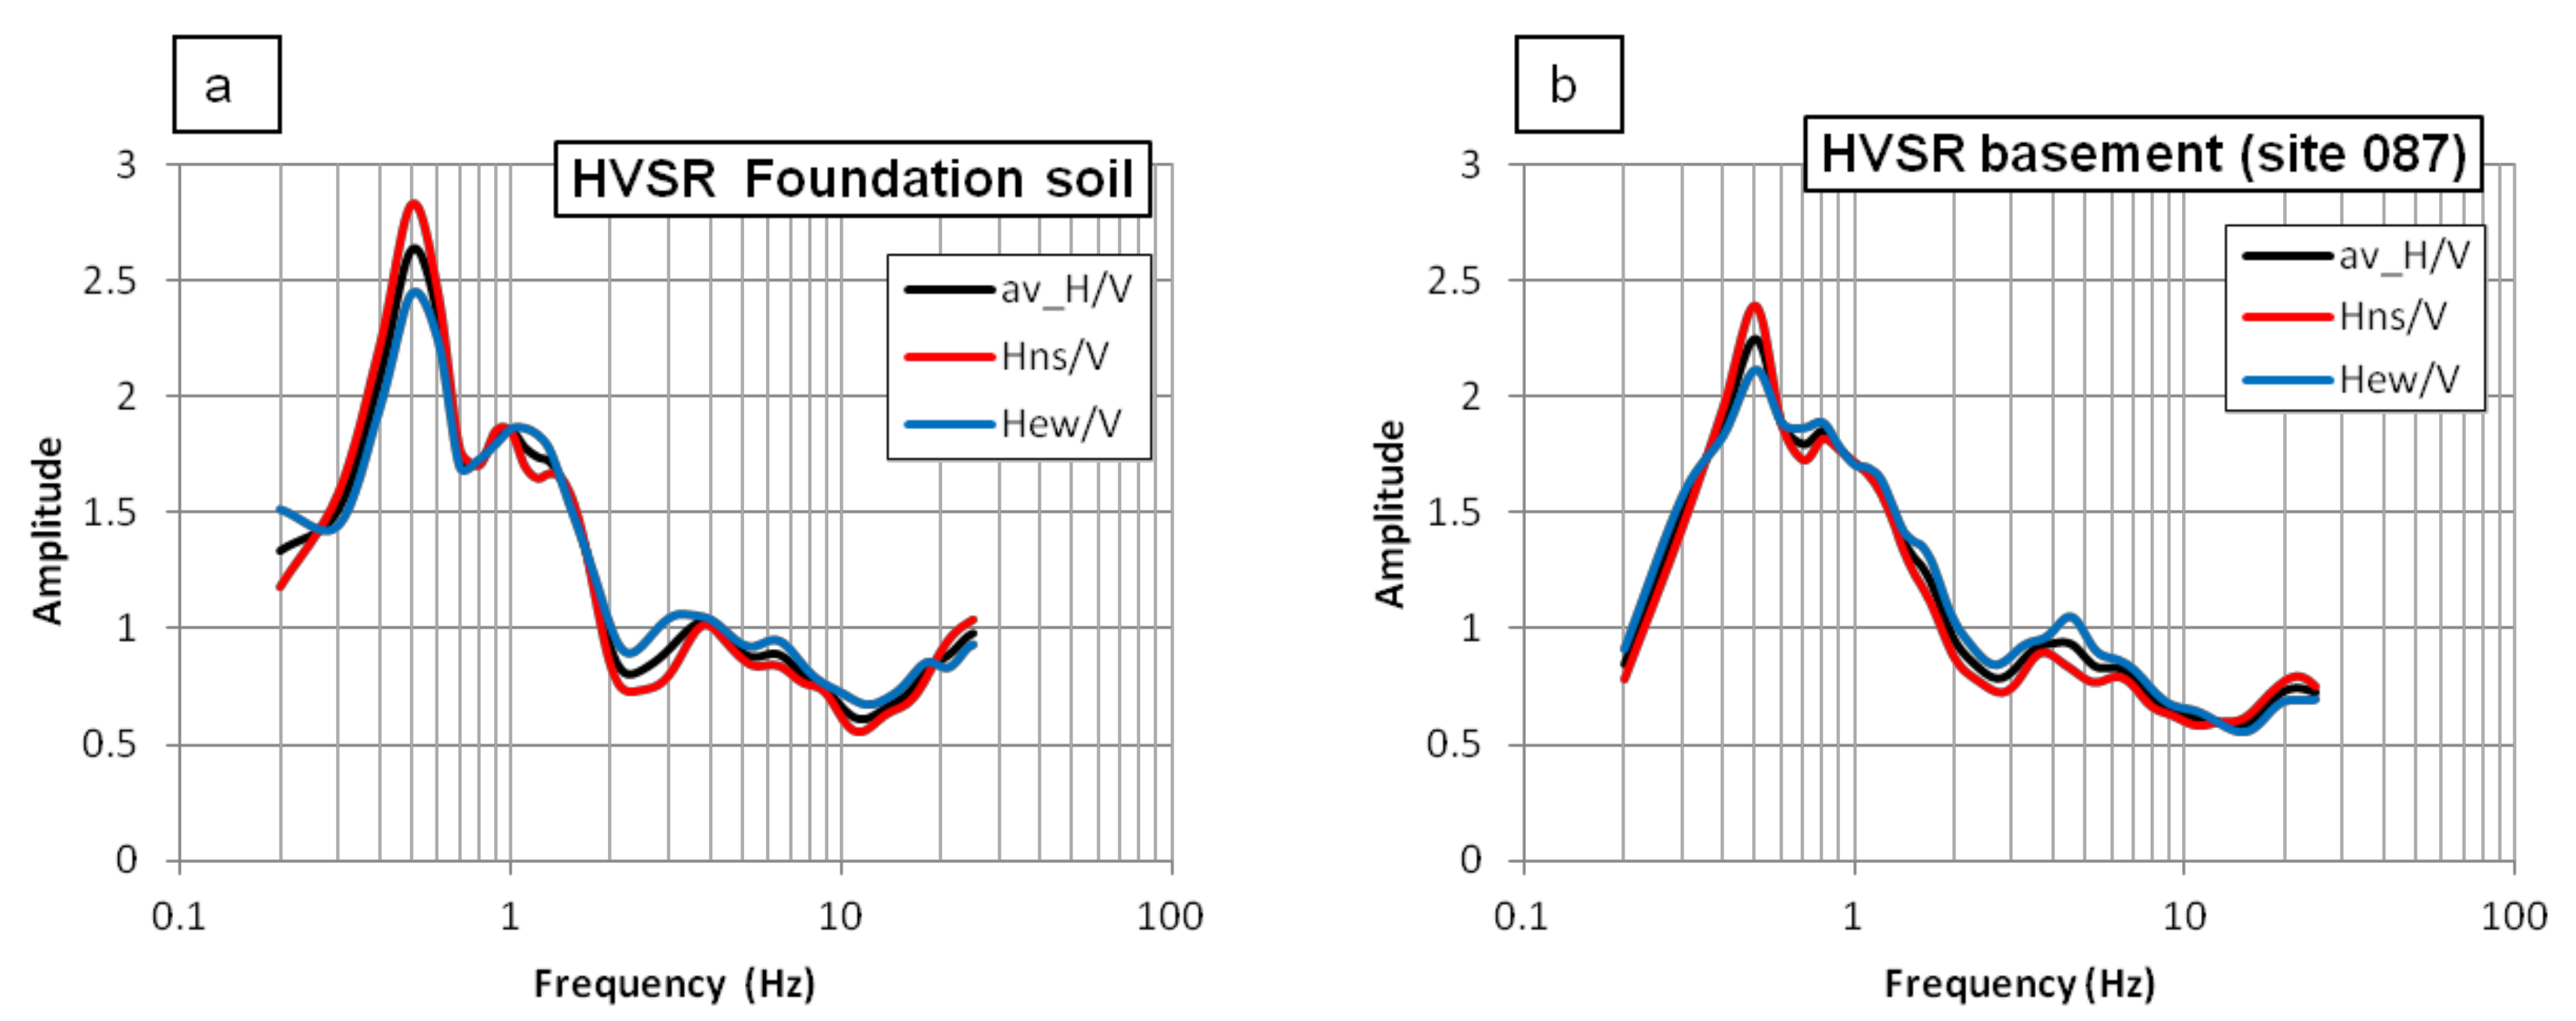
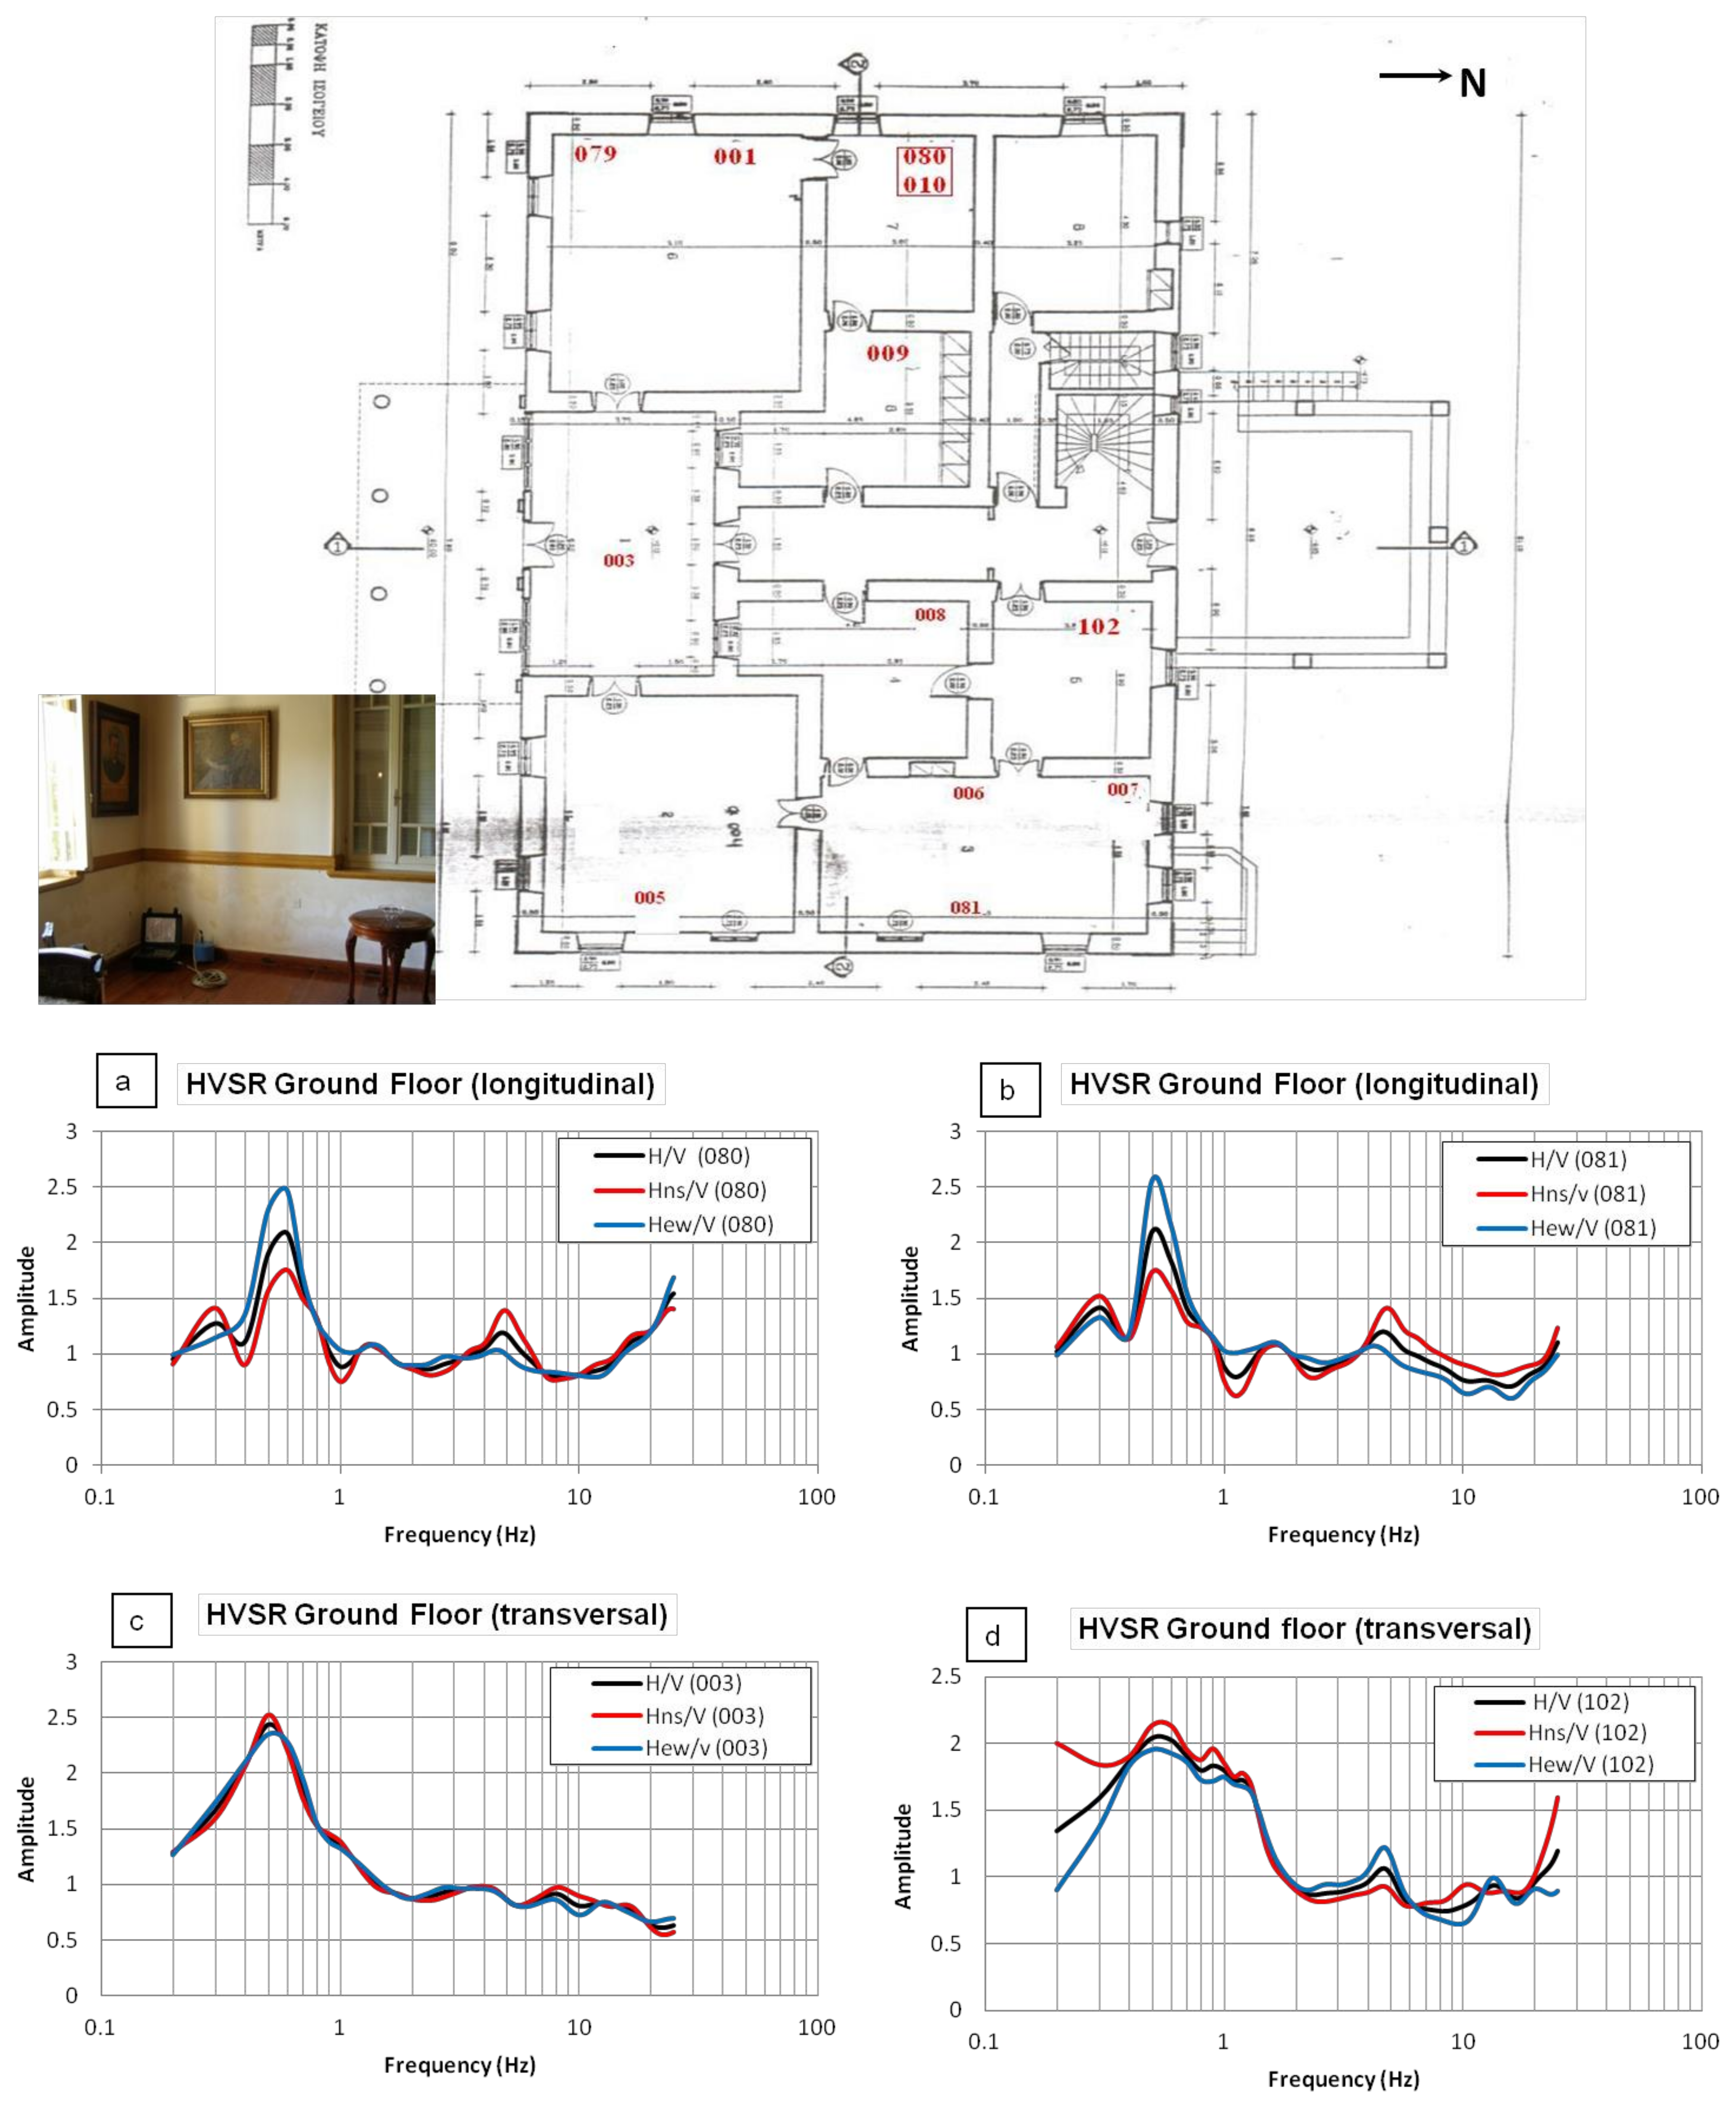
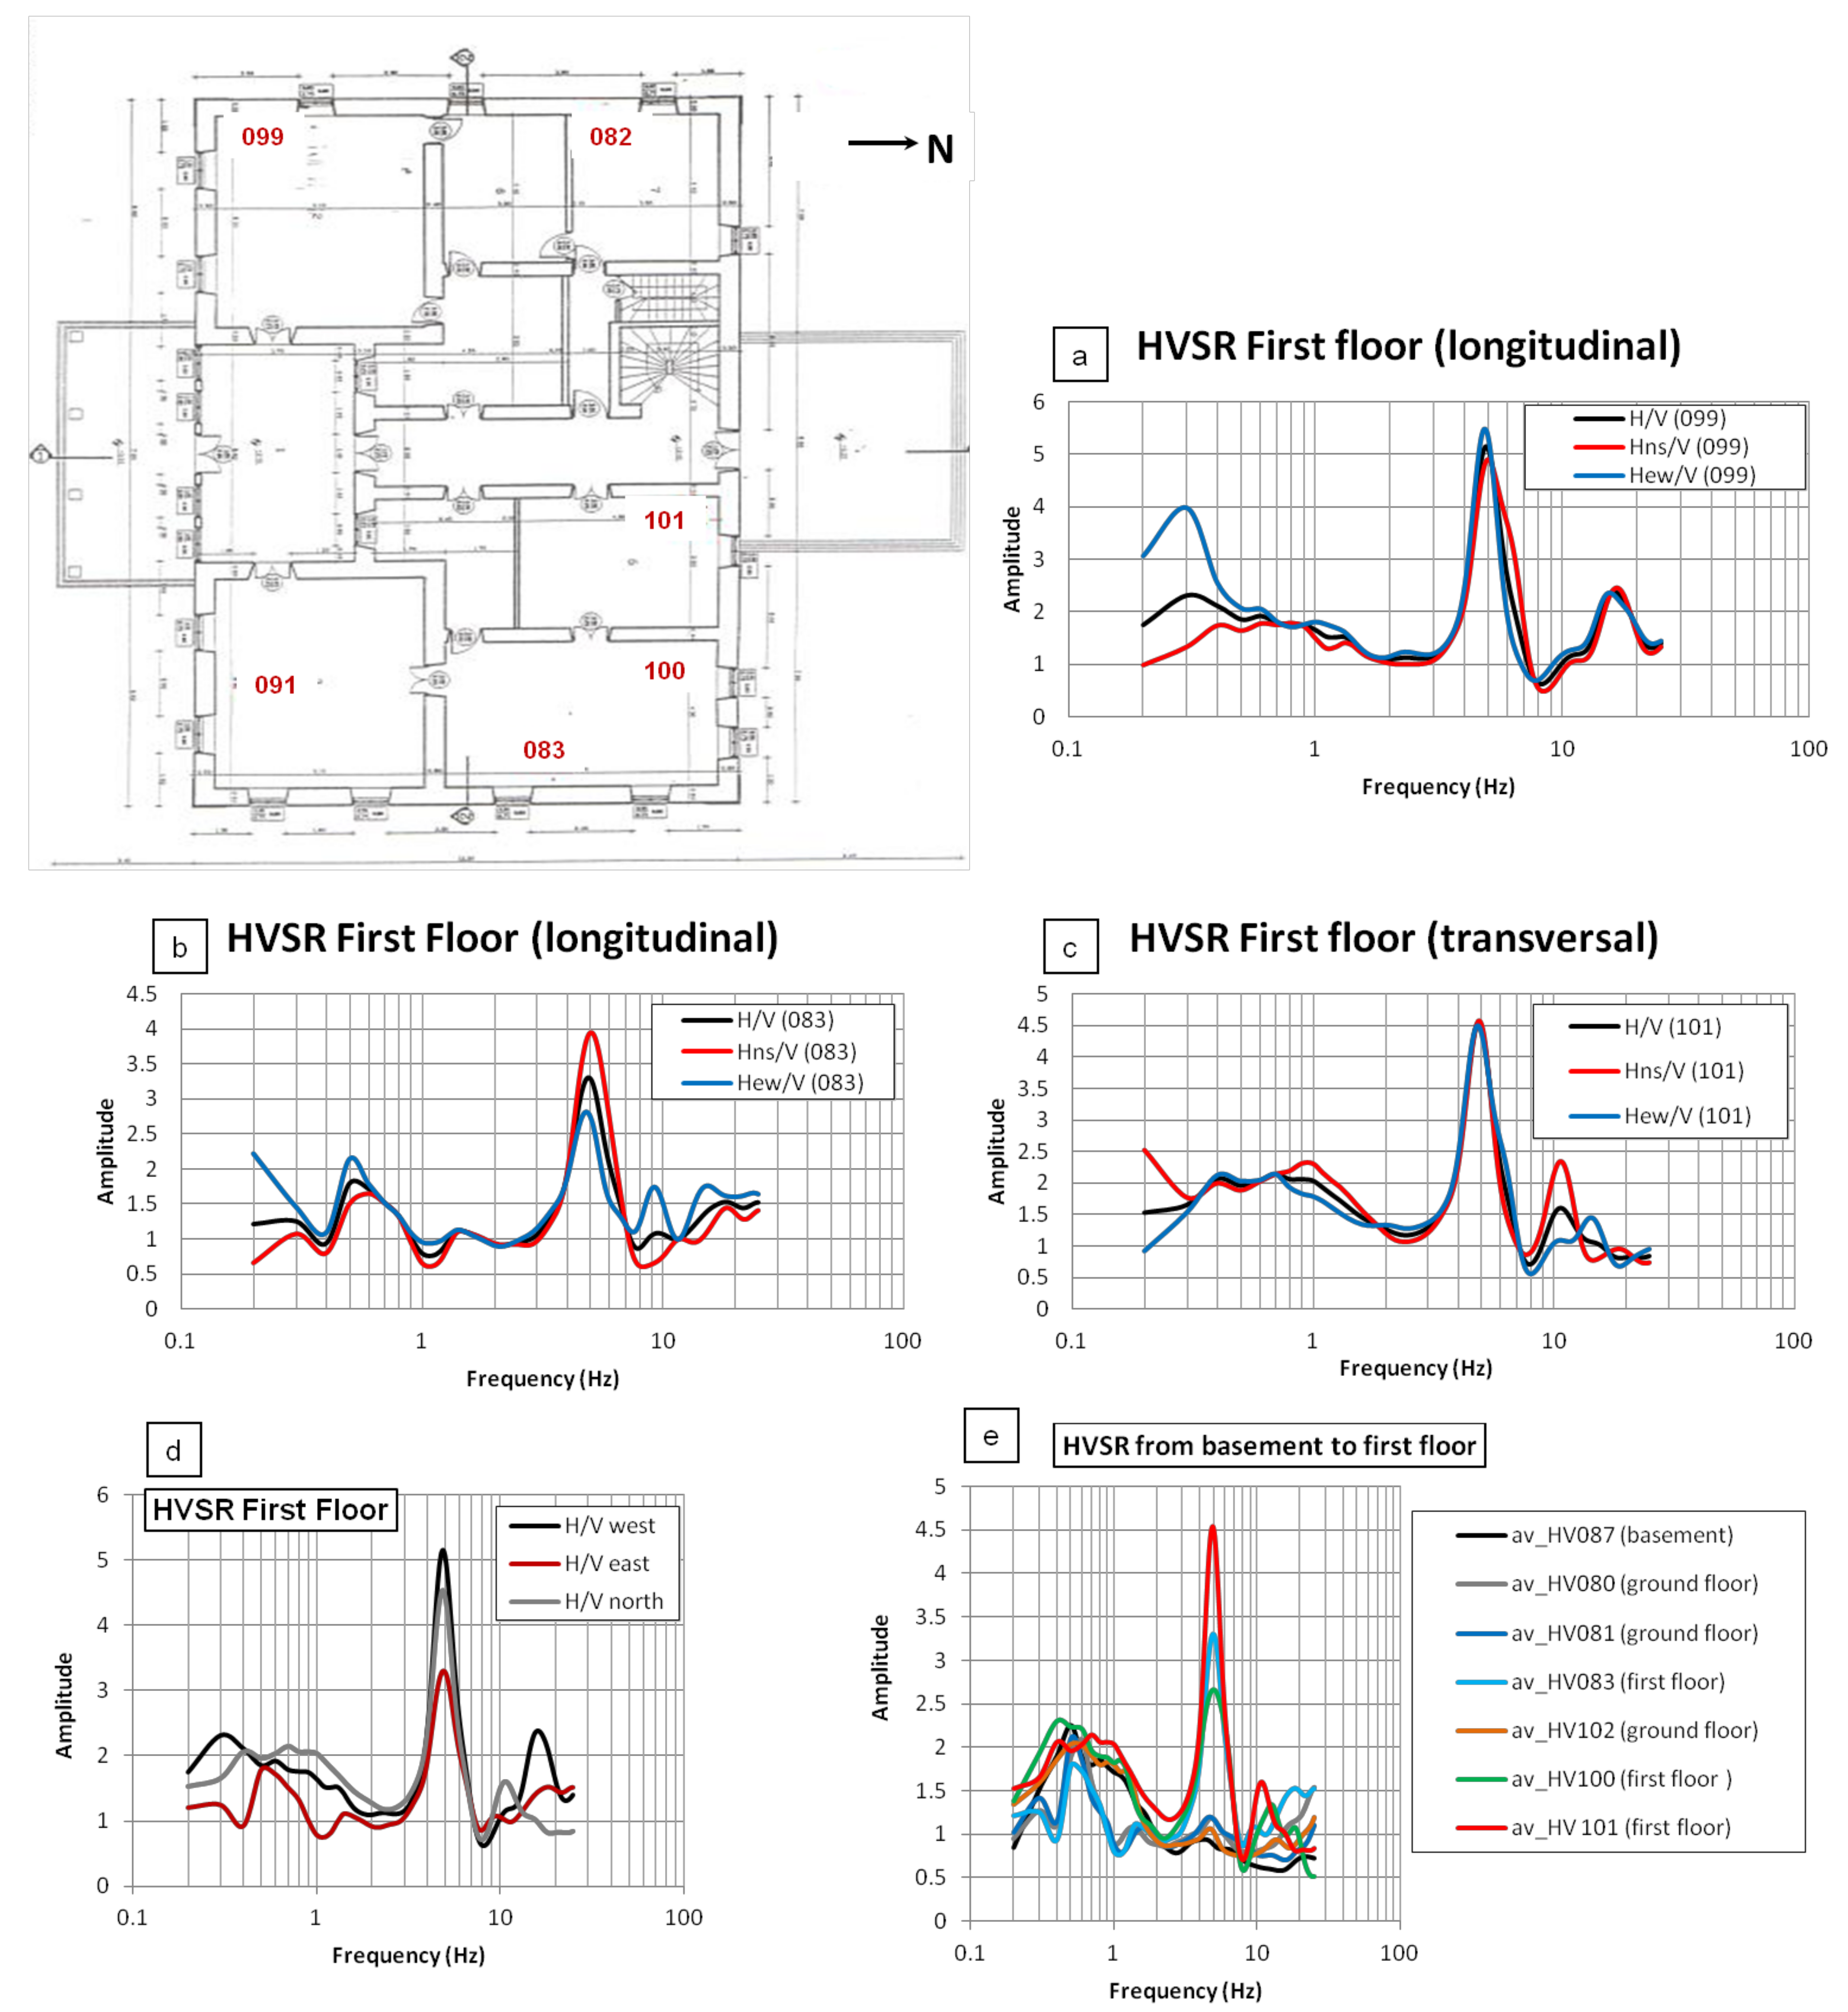
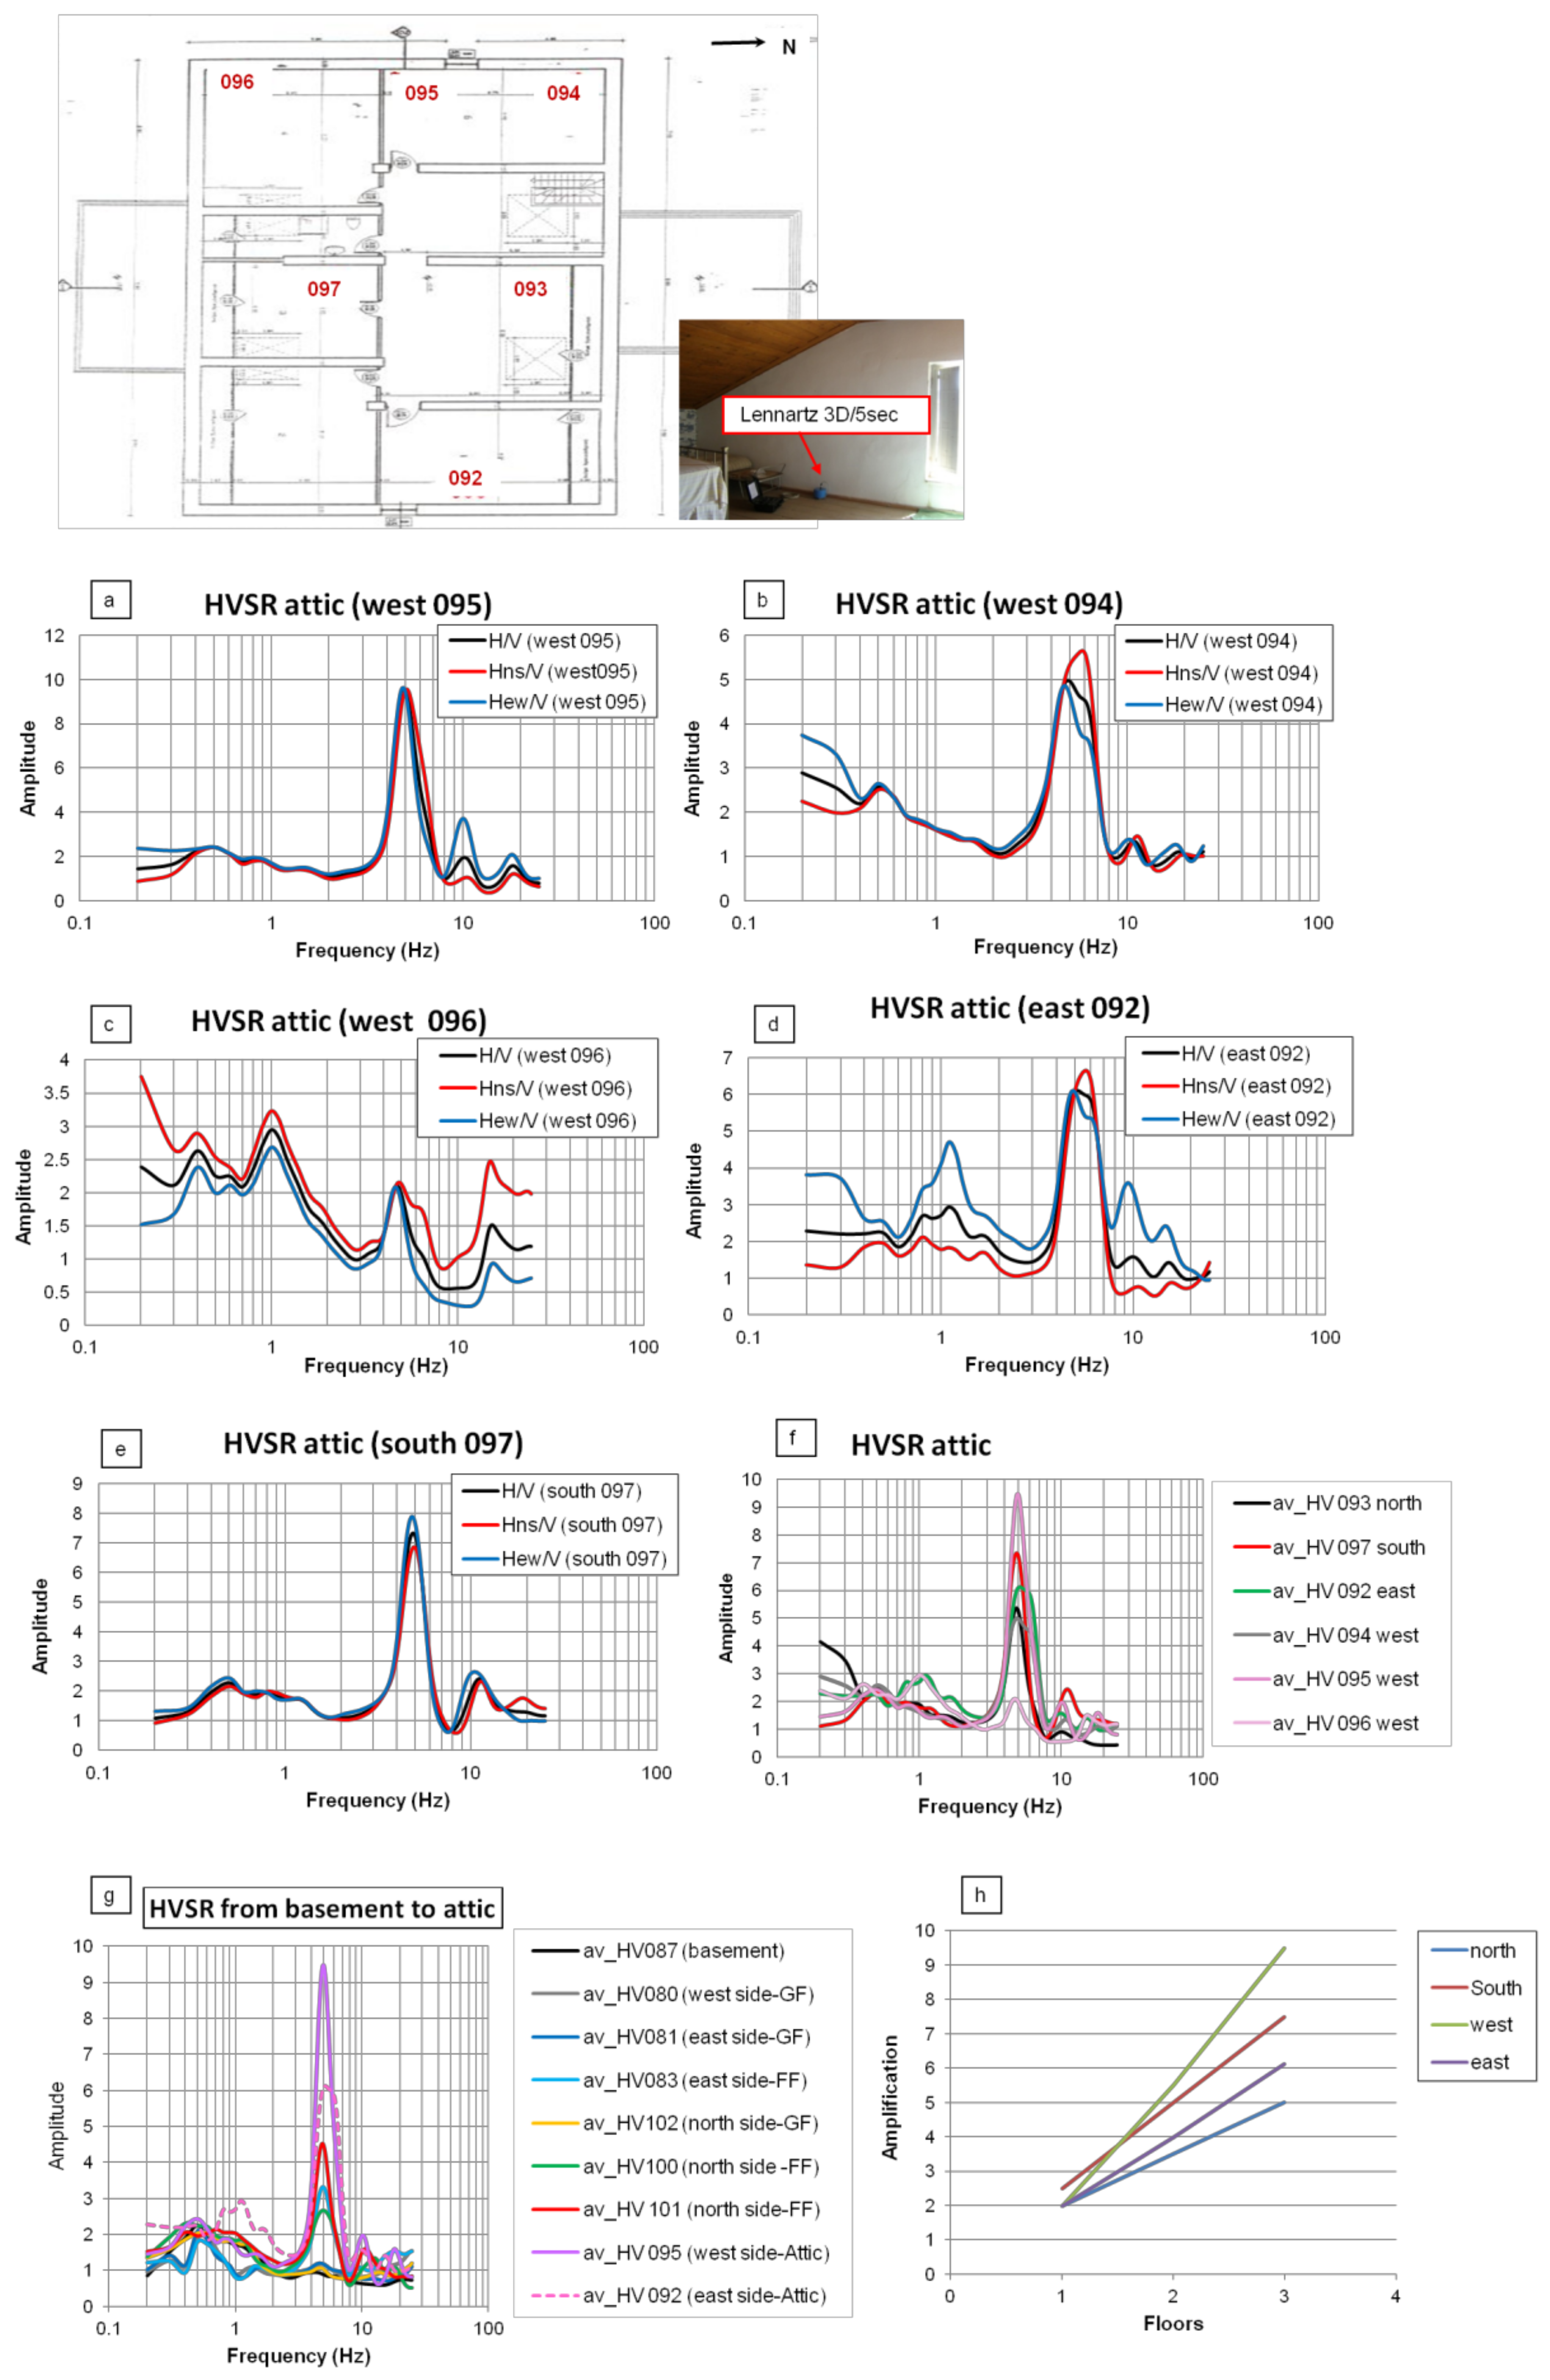
3.1. Case Study: Venizelo’s Residence

Venizelo’s residence is a one-floor masonry building that took its present form in 1927 Venizelos Museum in Chania. Figure 2 shows the site where the building is located. The building consists of a basement, a ground and first floor, and an attic. The measurement points in the basement are indicated in Figure 2b, the H/V spectral ratios on the soil are presented in Figure 3, while the measurement points on the ground and first floors are indicated in Figure 4 and Figure 5, respectively, and the measurement points in the attic are indicated in Figure 6. A set of over 100 time-series recordings of 10–20 min each, sampled at 125 Hz, were acquired. The geological setting is characterized by marly sandstone (loose containing sea fossils (Pliocene) and locally very thick). The geological map (Figure 2a) was provided by the Institute of Geology and Mineral Exploration (IGME, 1971). A field survey close to the building foundation site revealed a geological section from the bottom to the surficial layer characterized by marly limestone, a transitional zone of limestone to marly limestone (the weathered zone), and massive marls and marls in the topmost surficial layer (Figure 2b). The soil frequency has been estimated at 0.5–0.6 Hz with an amplification of 2.5 (Figure 3a). HVSRs of microtremors in the basement and on the ground floor reveal an amplified peak at 0.5–0.6 Hz both in the longitudinal and transversal directions (Figure 3 and Figure 4), while the frequency of vibration of the first floor and attic is estimated at 5 Hz in both directions and at all recording points (Figure 5 and Figure 6). The HVSR amplification of the first floor reached to 4–6, while the HVSR amplification of the attic reached to 9.0. The increase of the amplitude of the frequency at 5 Hz from the basement to the first floor and from the basement to the attic is shown in Figure 5e and Figure 6h, respectively.

3.2. Case Study: Building of the Technical Chamber (Chania)

The building of the Technical Chamber is a masonry structure which was constructed in 1915. Further information on this building was not available. The geological setting of the regime is characterized by marly sandstone (loose containing sea fossils, Pliocene). In total, 40 ambient noise recordings were acquired. The soil frequency was observed at 0.4 Hz; this frequency was also observed in the basement (Figure 7). On the ground floor, the HVSRs reveal two frequencies: the soil frequency (0.4 Hz) and the main building frequency at about 5 Hz. The main building frequency is more evident on the first floor (Figure 7).

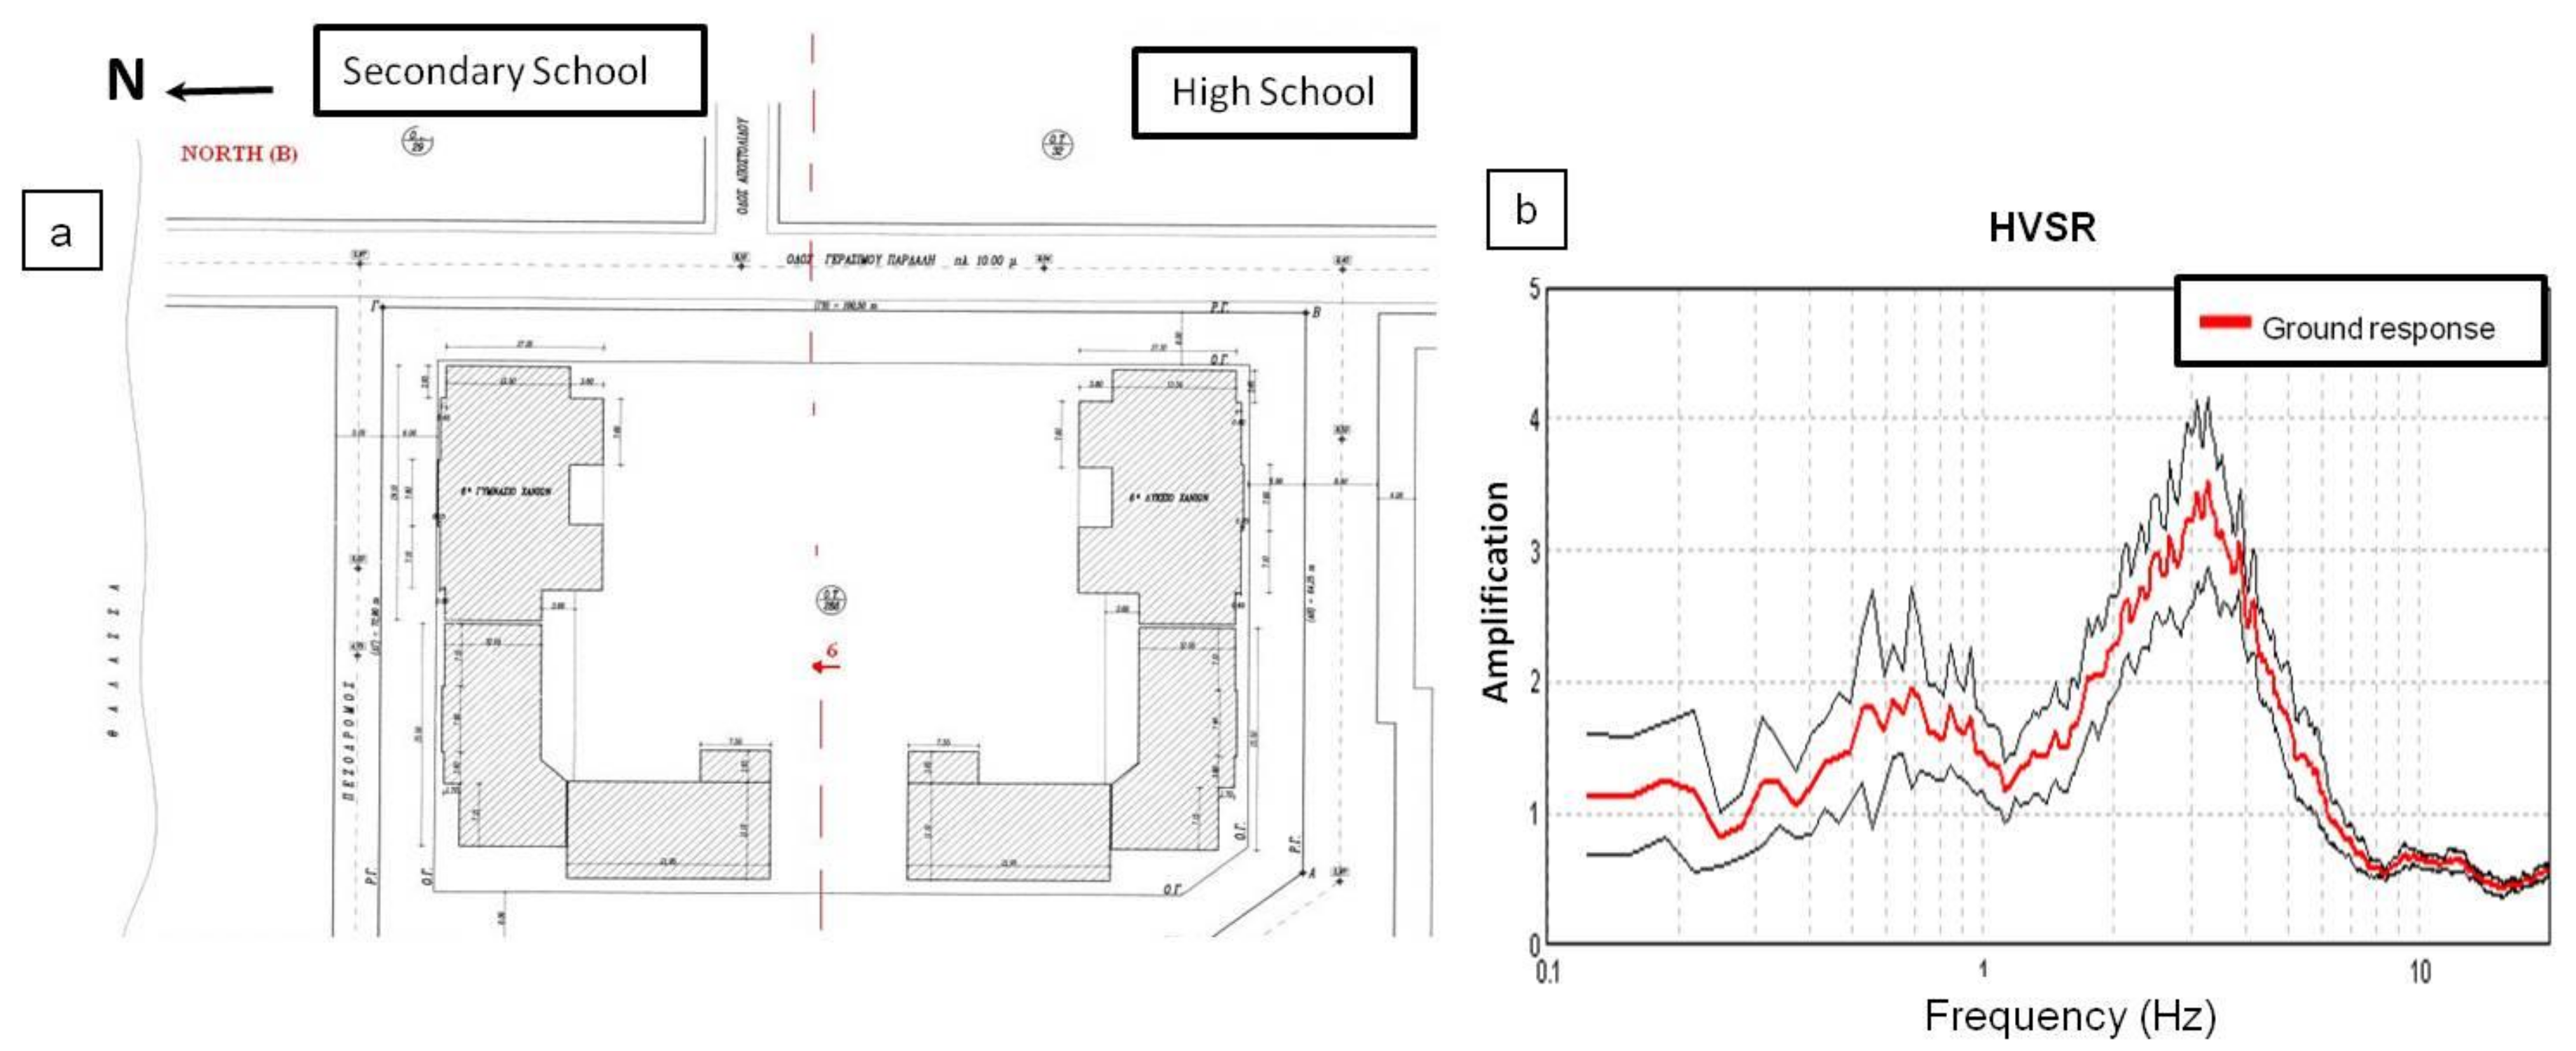
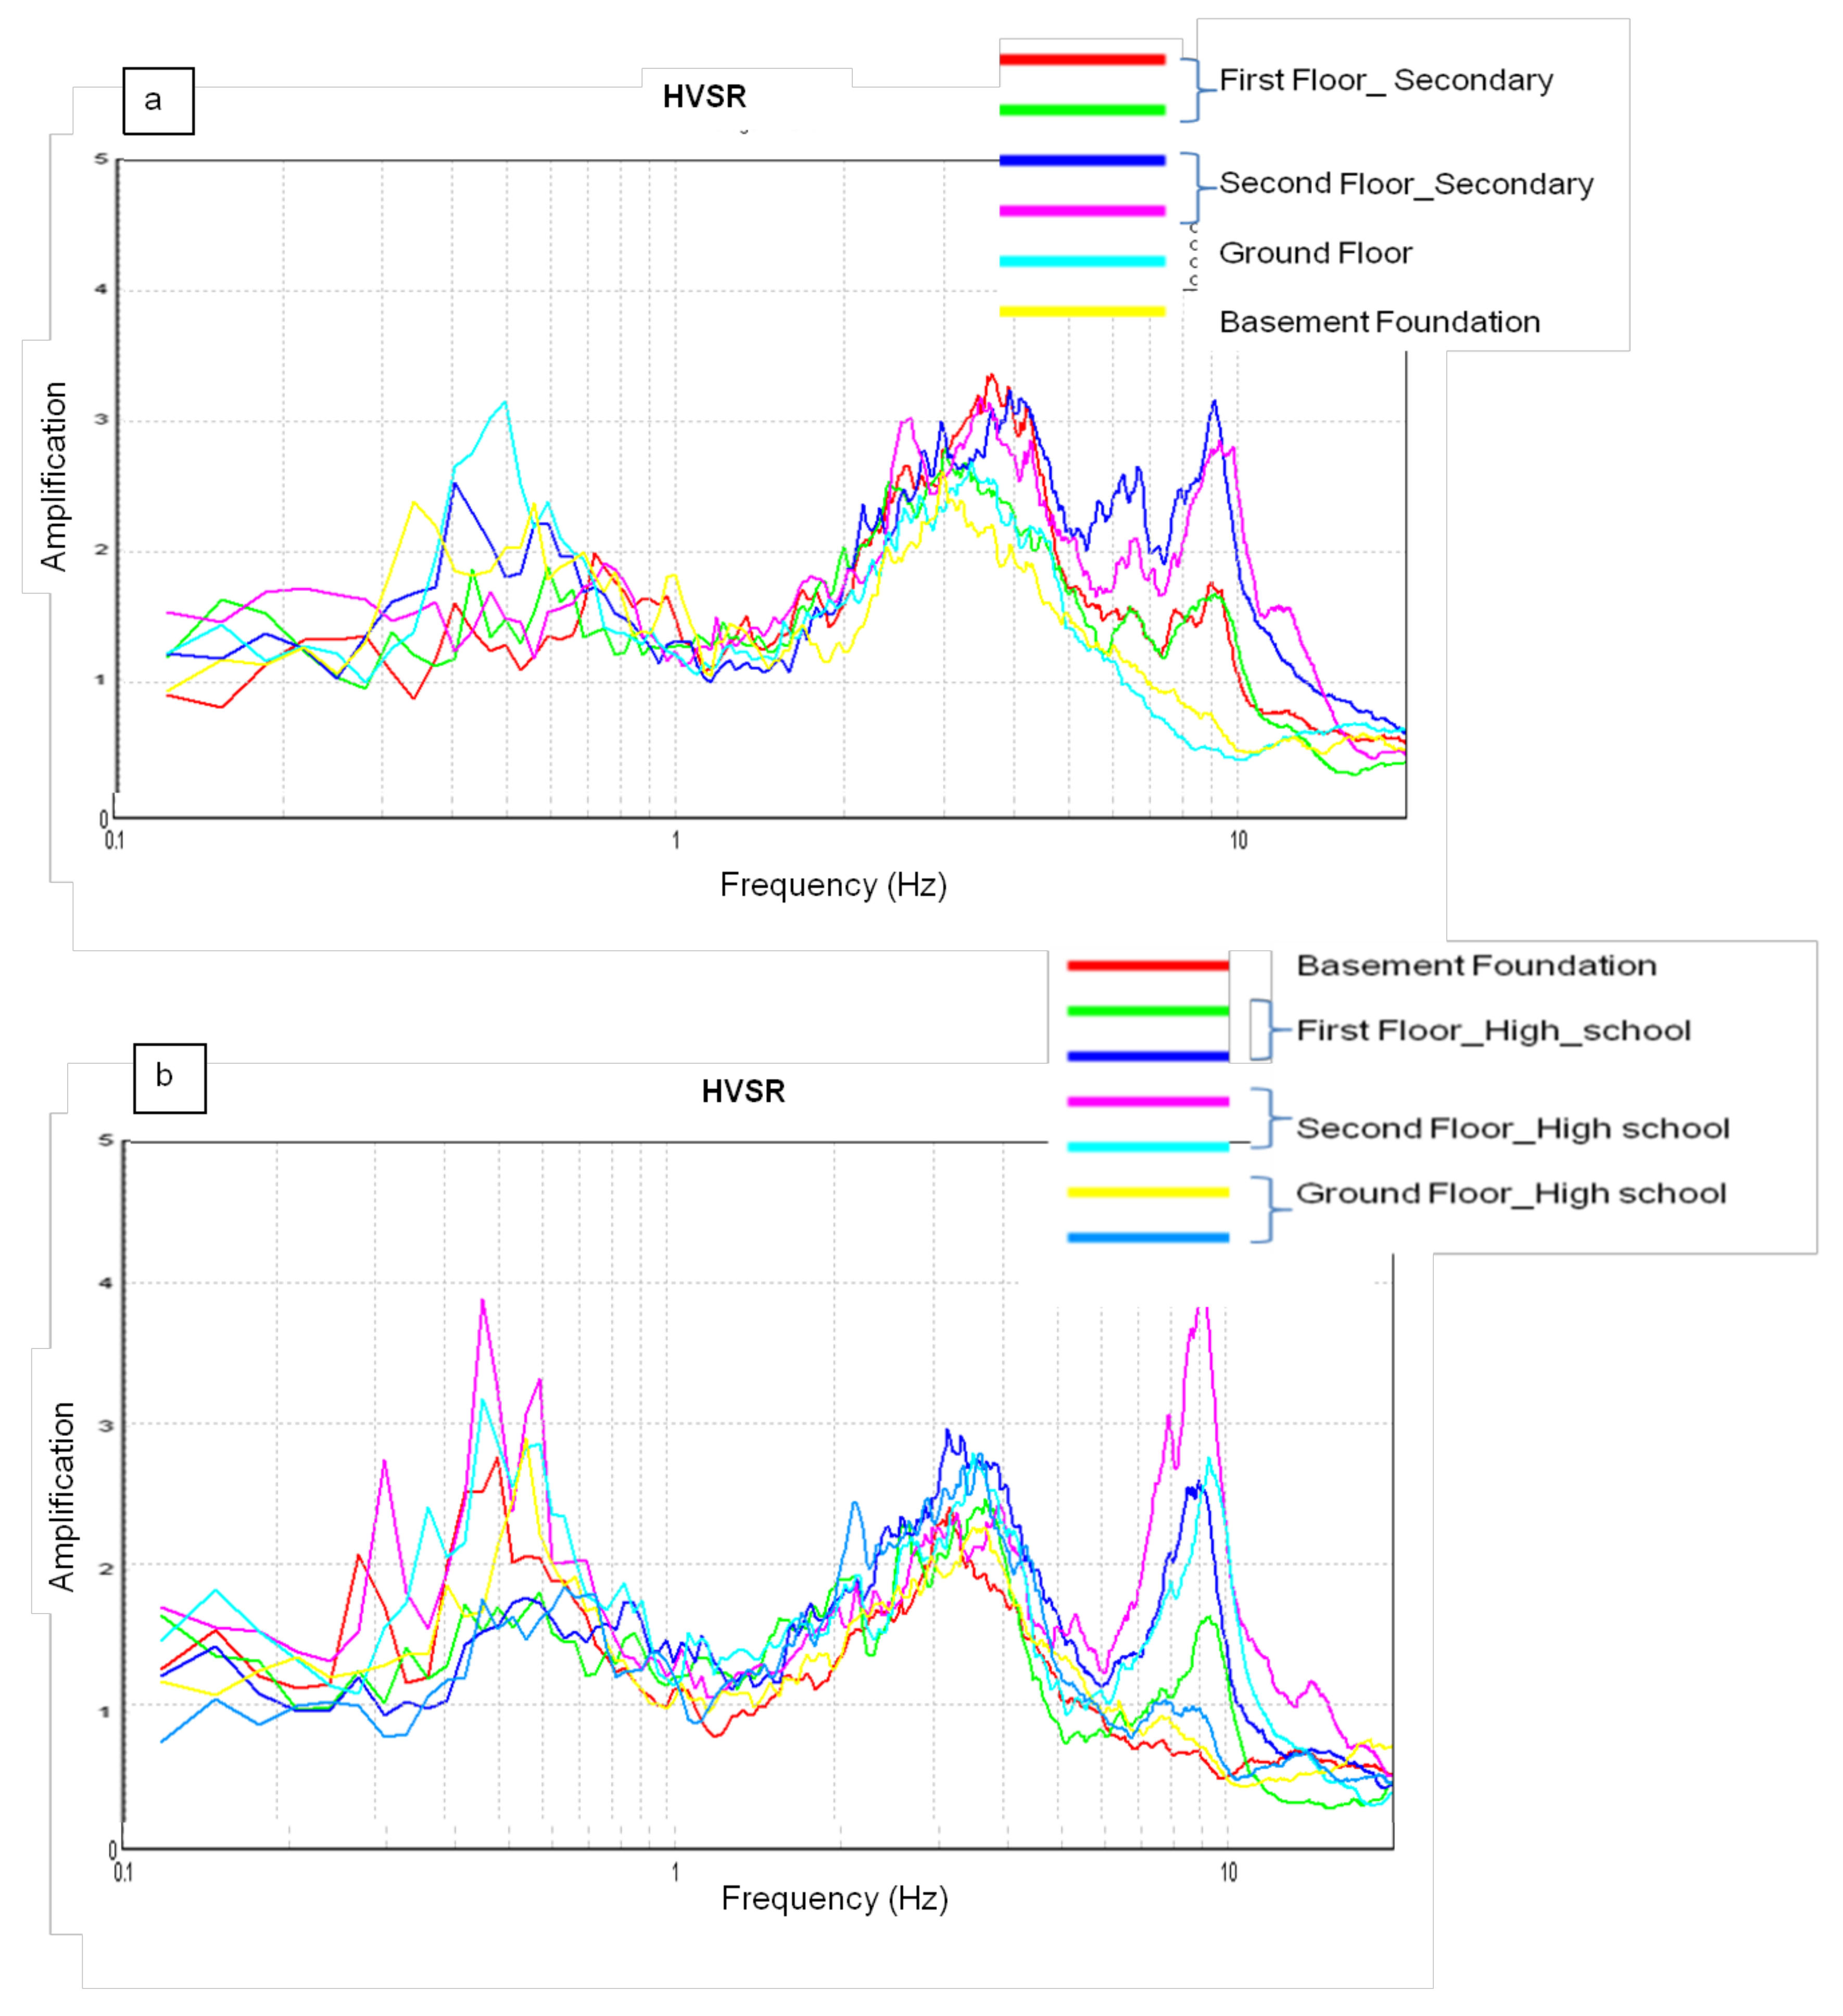
3.3. Case Study: 1st Secondary and High School (Chania) Buildings

This building consists of two similar reinforced concrete buildings, each with an L-shaped design (Figure 8) of two floors, which were reconstructed in 2005. The geological setting is characterized by Holocene alluvial (loose and of small thickness deposits, Quaternary) and marls (often alternating with marly sandstones and platy marly limestones including sea fossils, Miocene). The geological map was provided by the IGME (1971). Using the microtremor measurements recorded, the soil frequency was observed at 3.2 Hz (Figure 8). This soil frequency was present in all HVSRs estimated in the building, and at the first and second floors the main building’s frequency was at about 9 Hz (Figure 9).

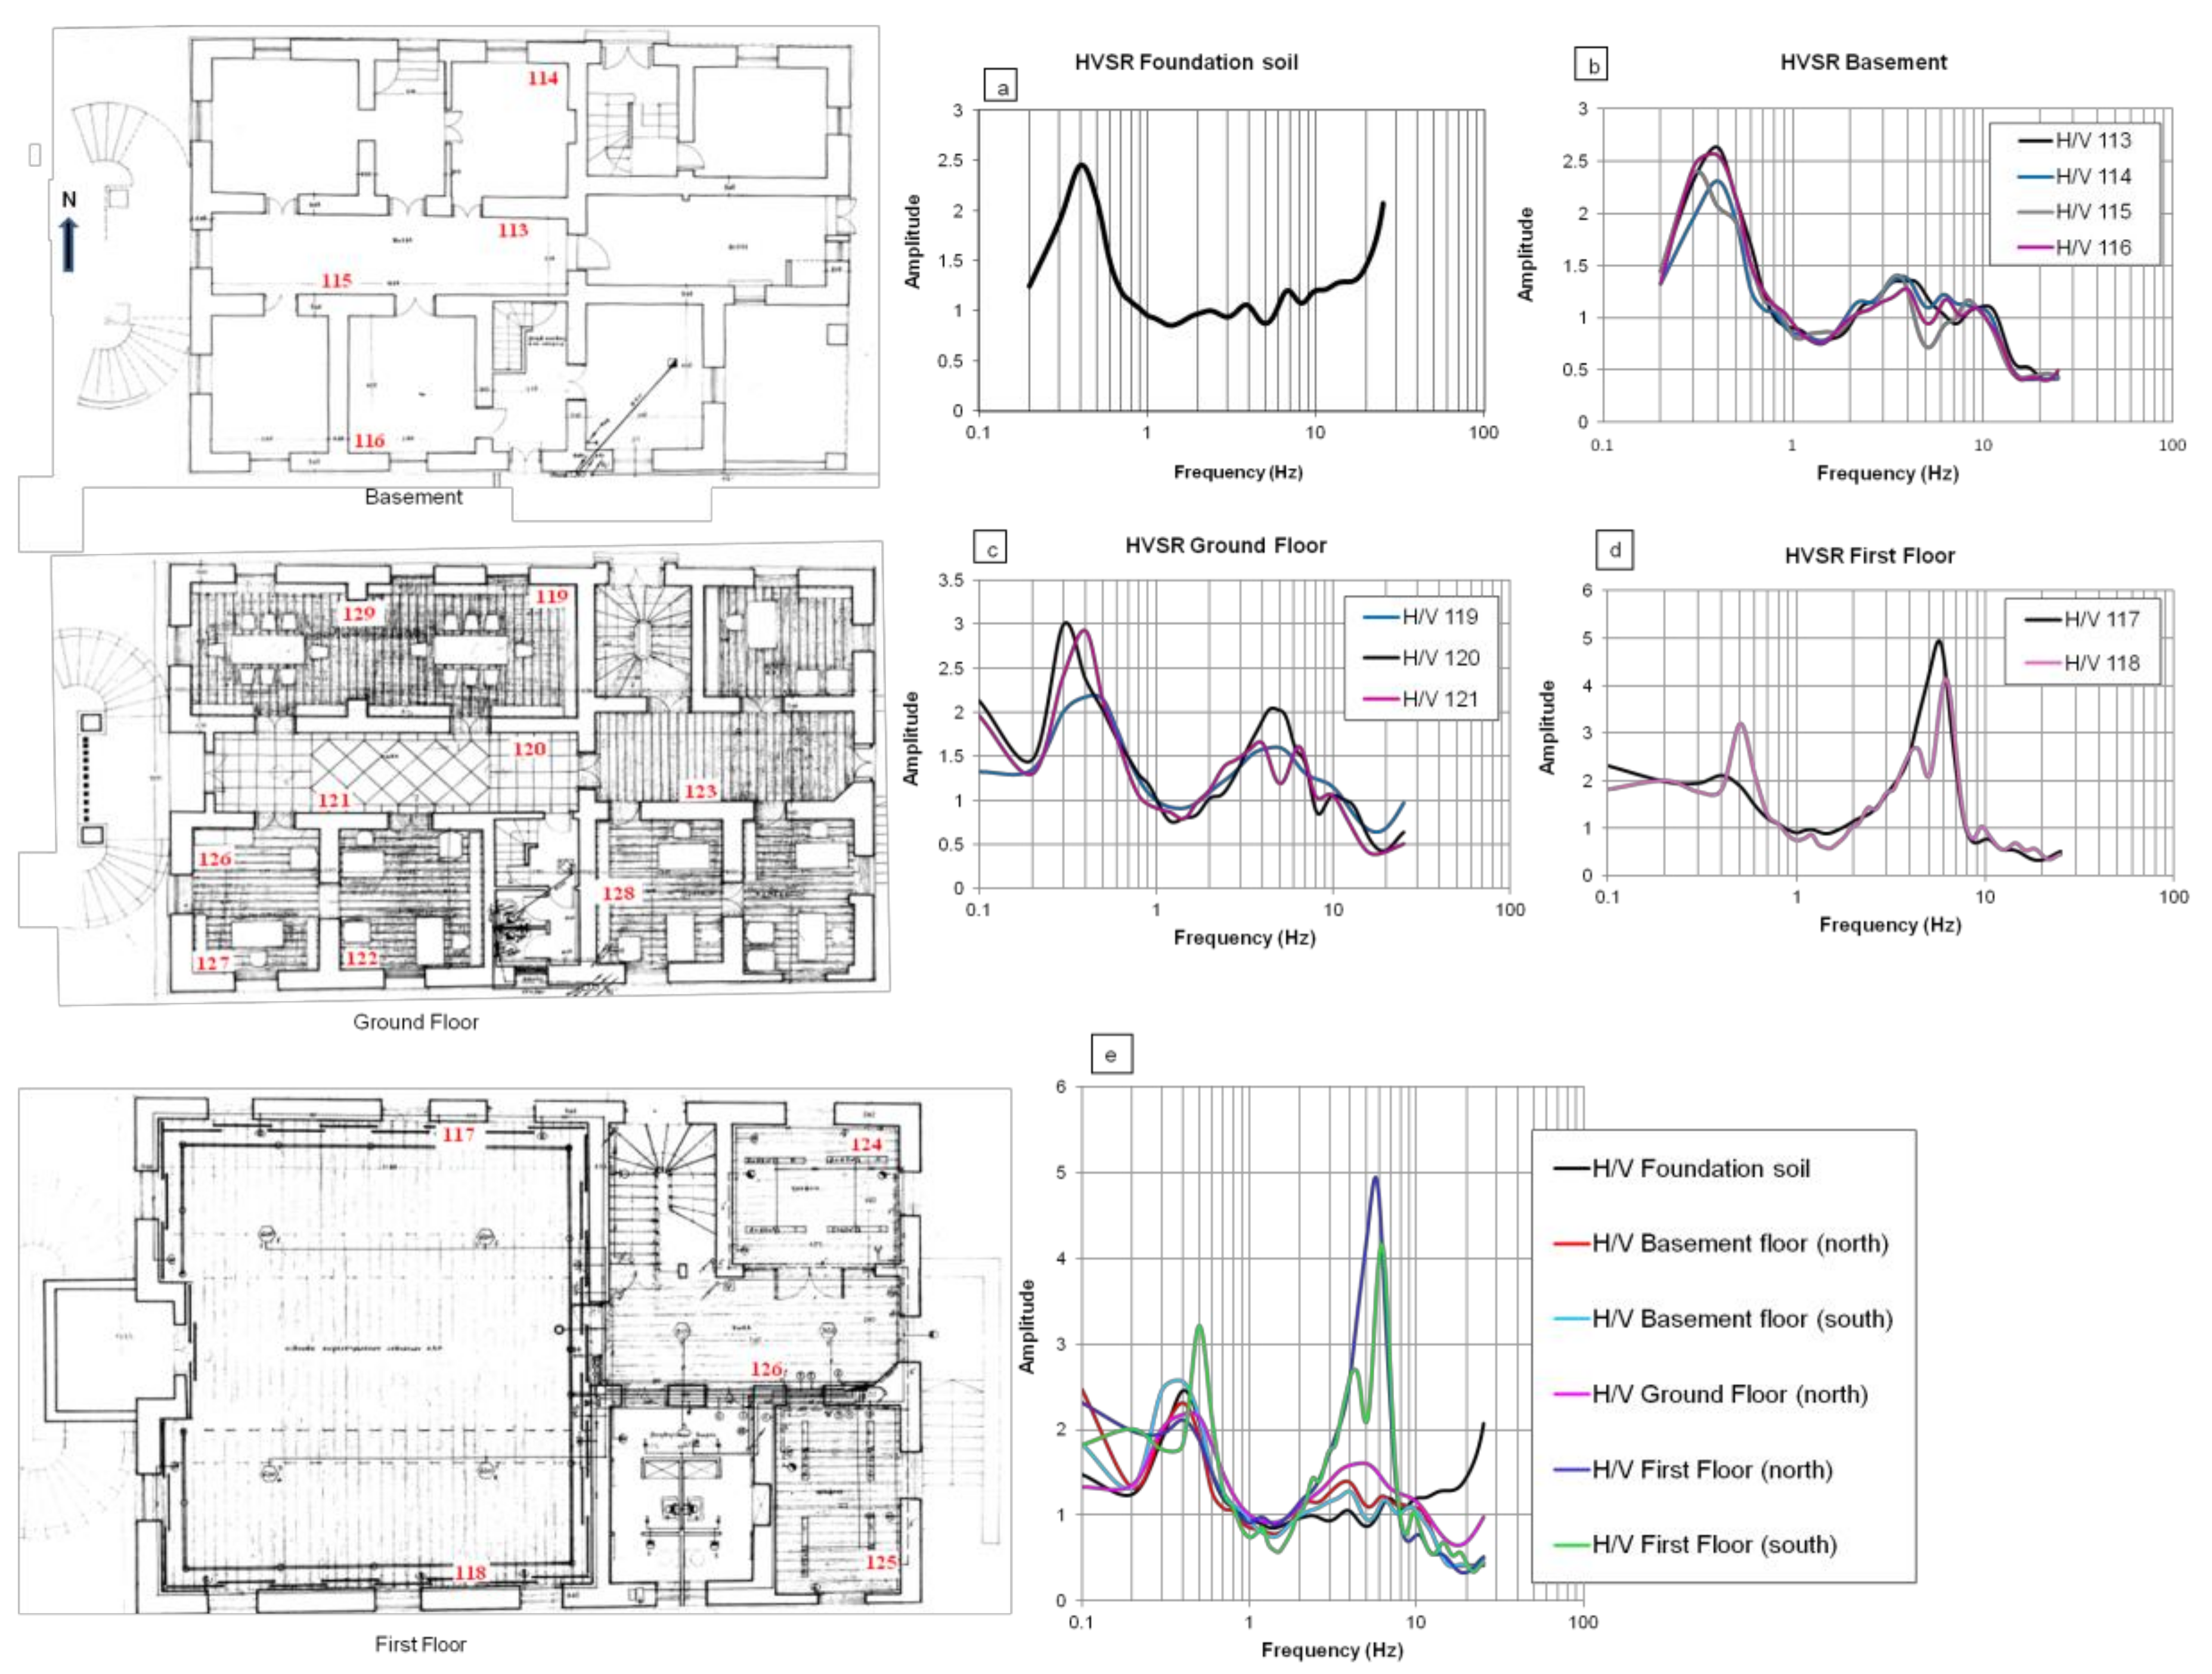
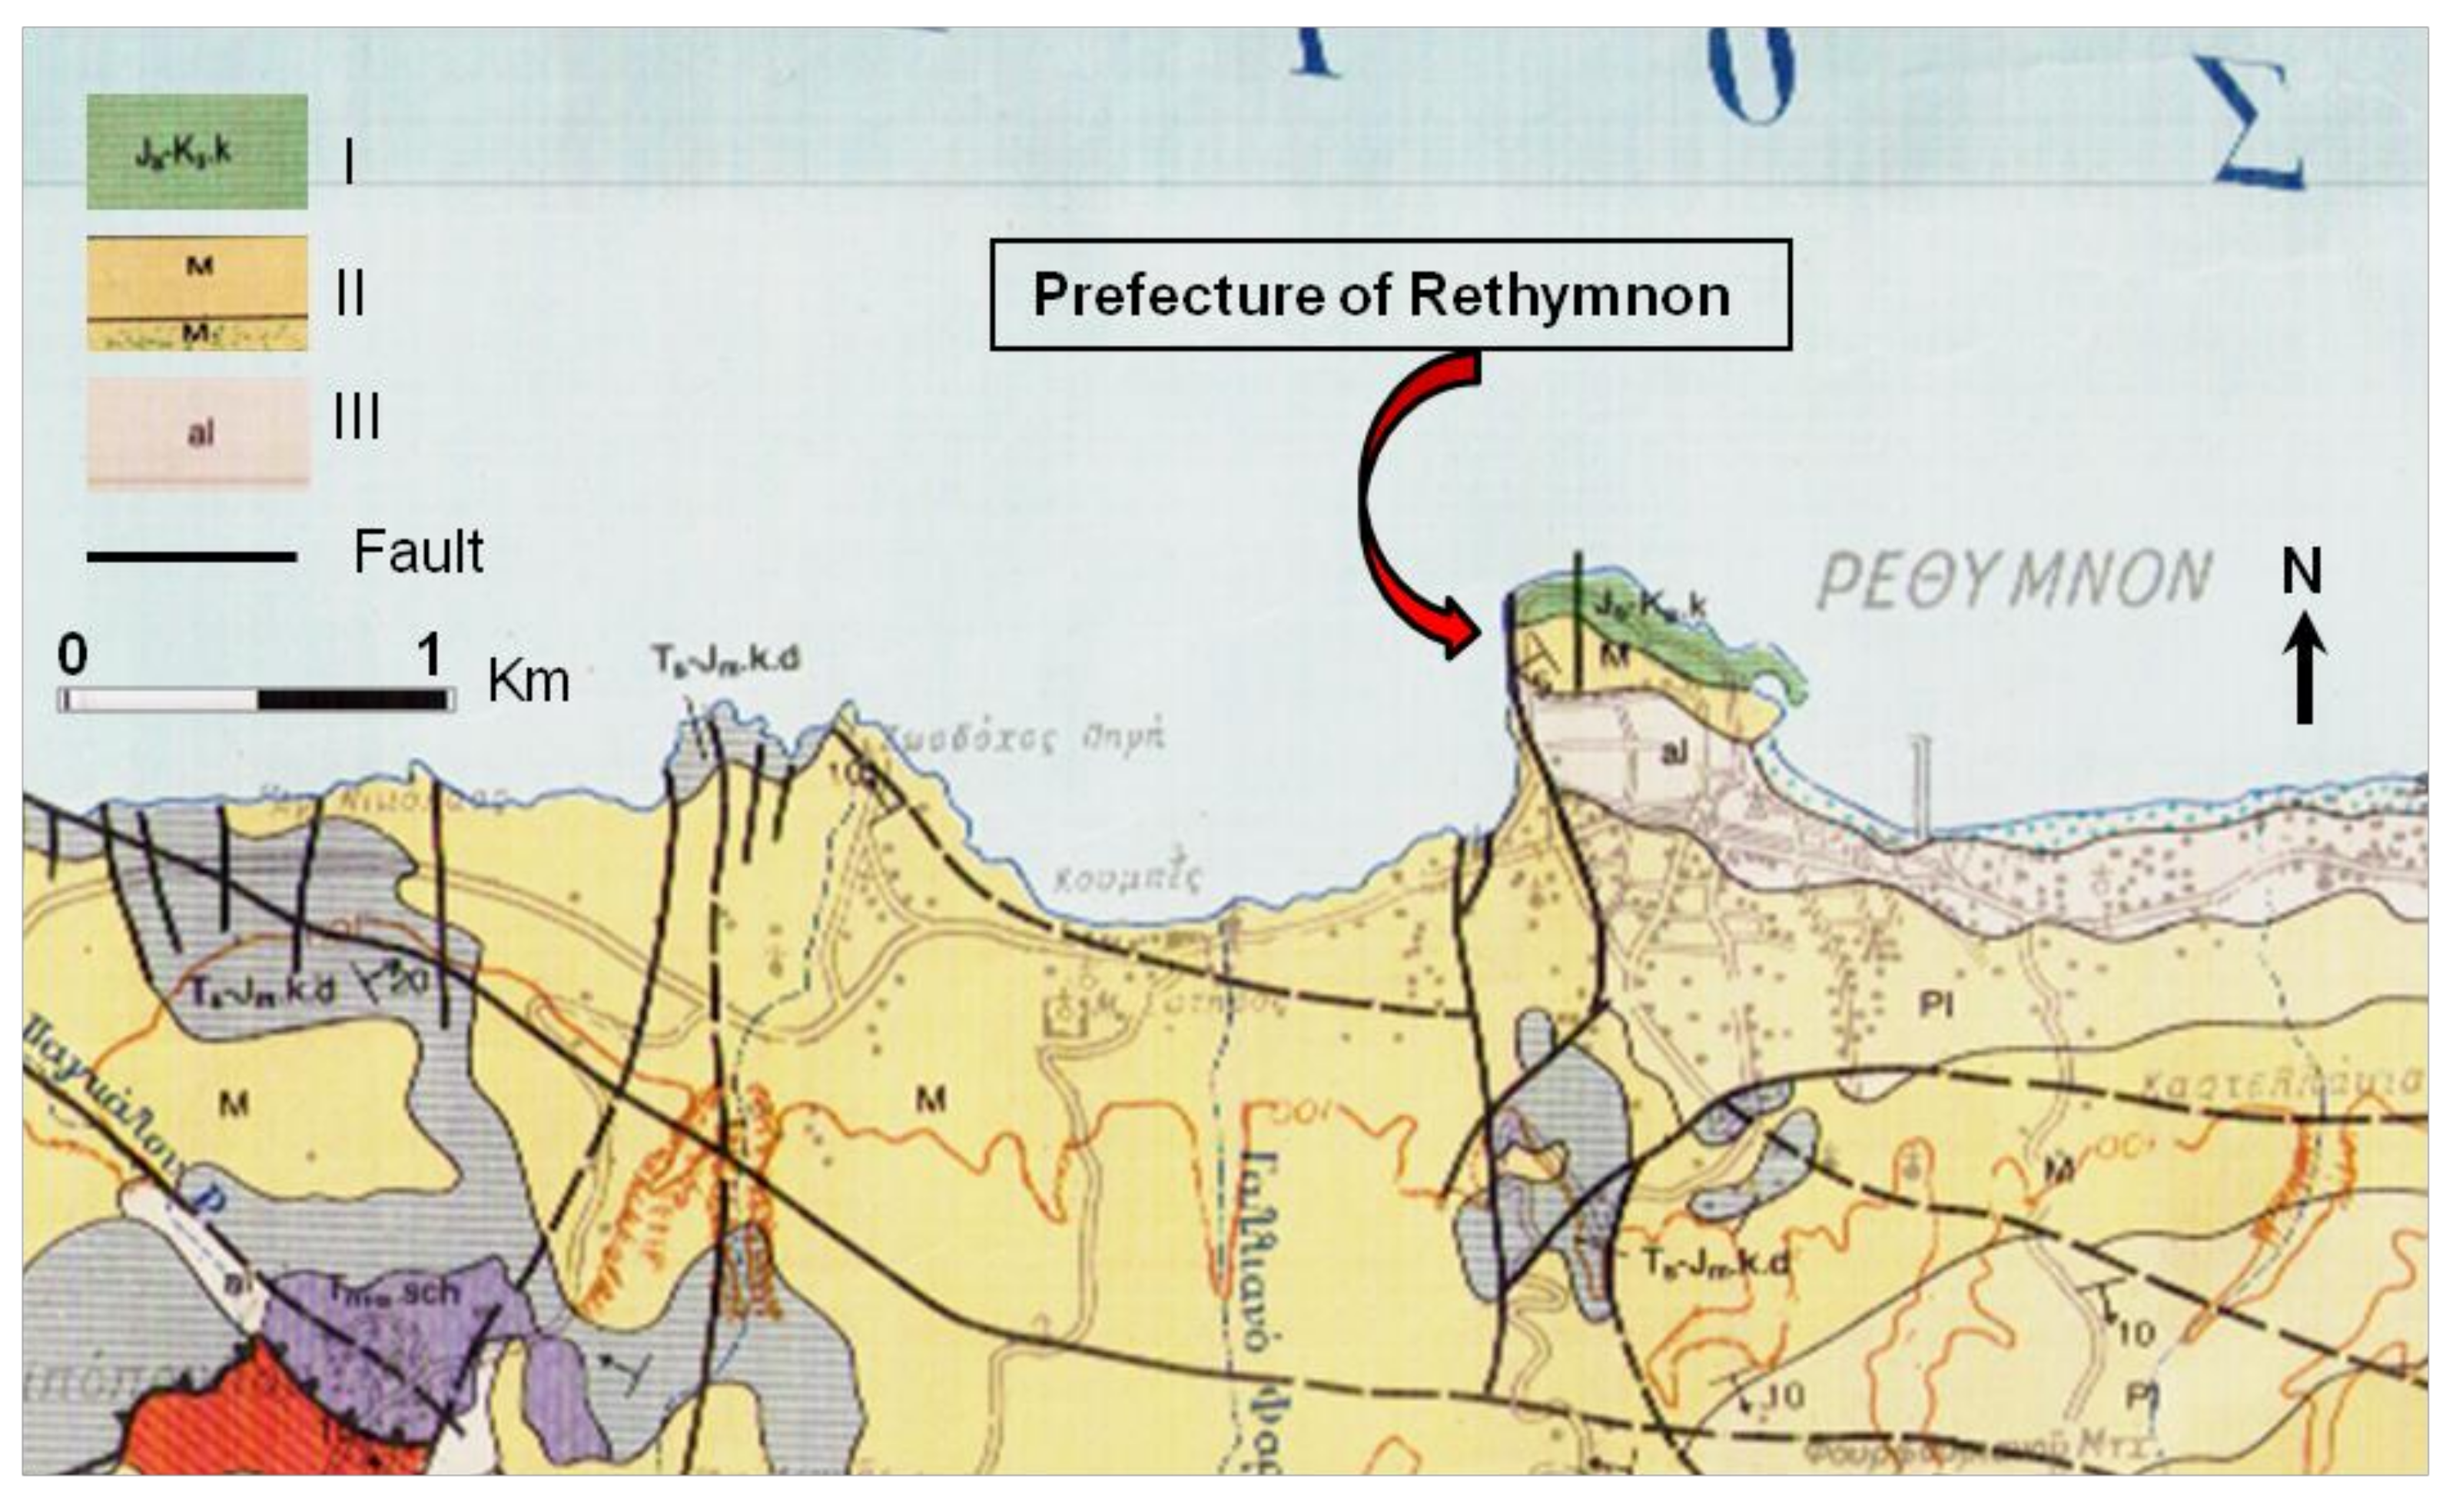
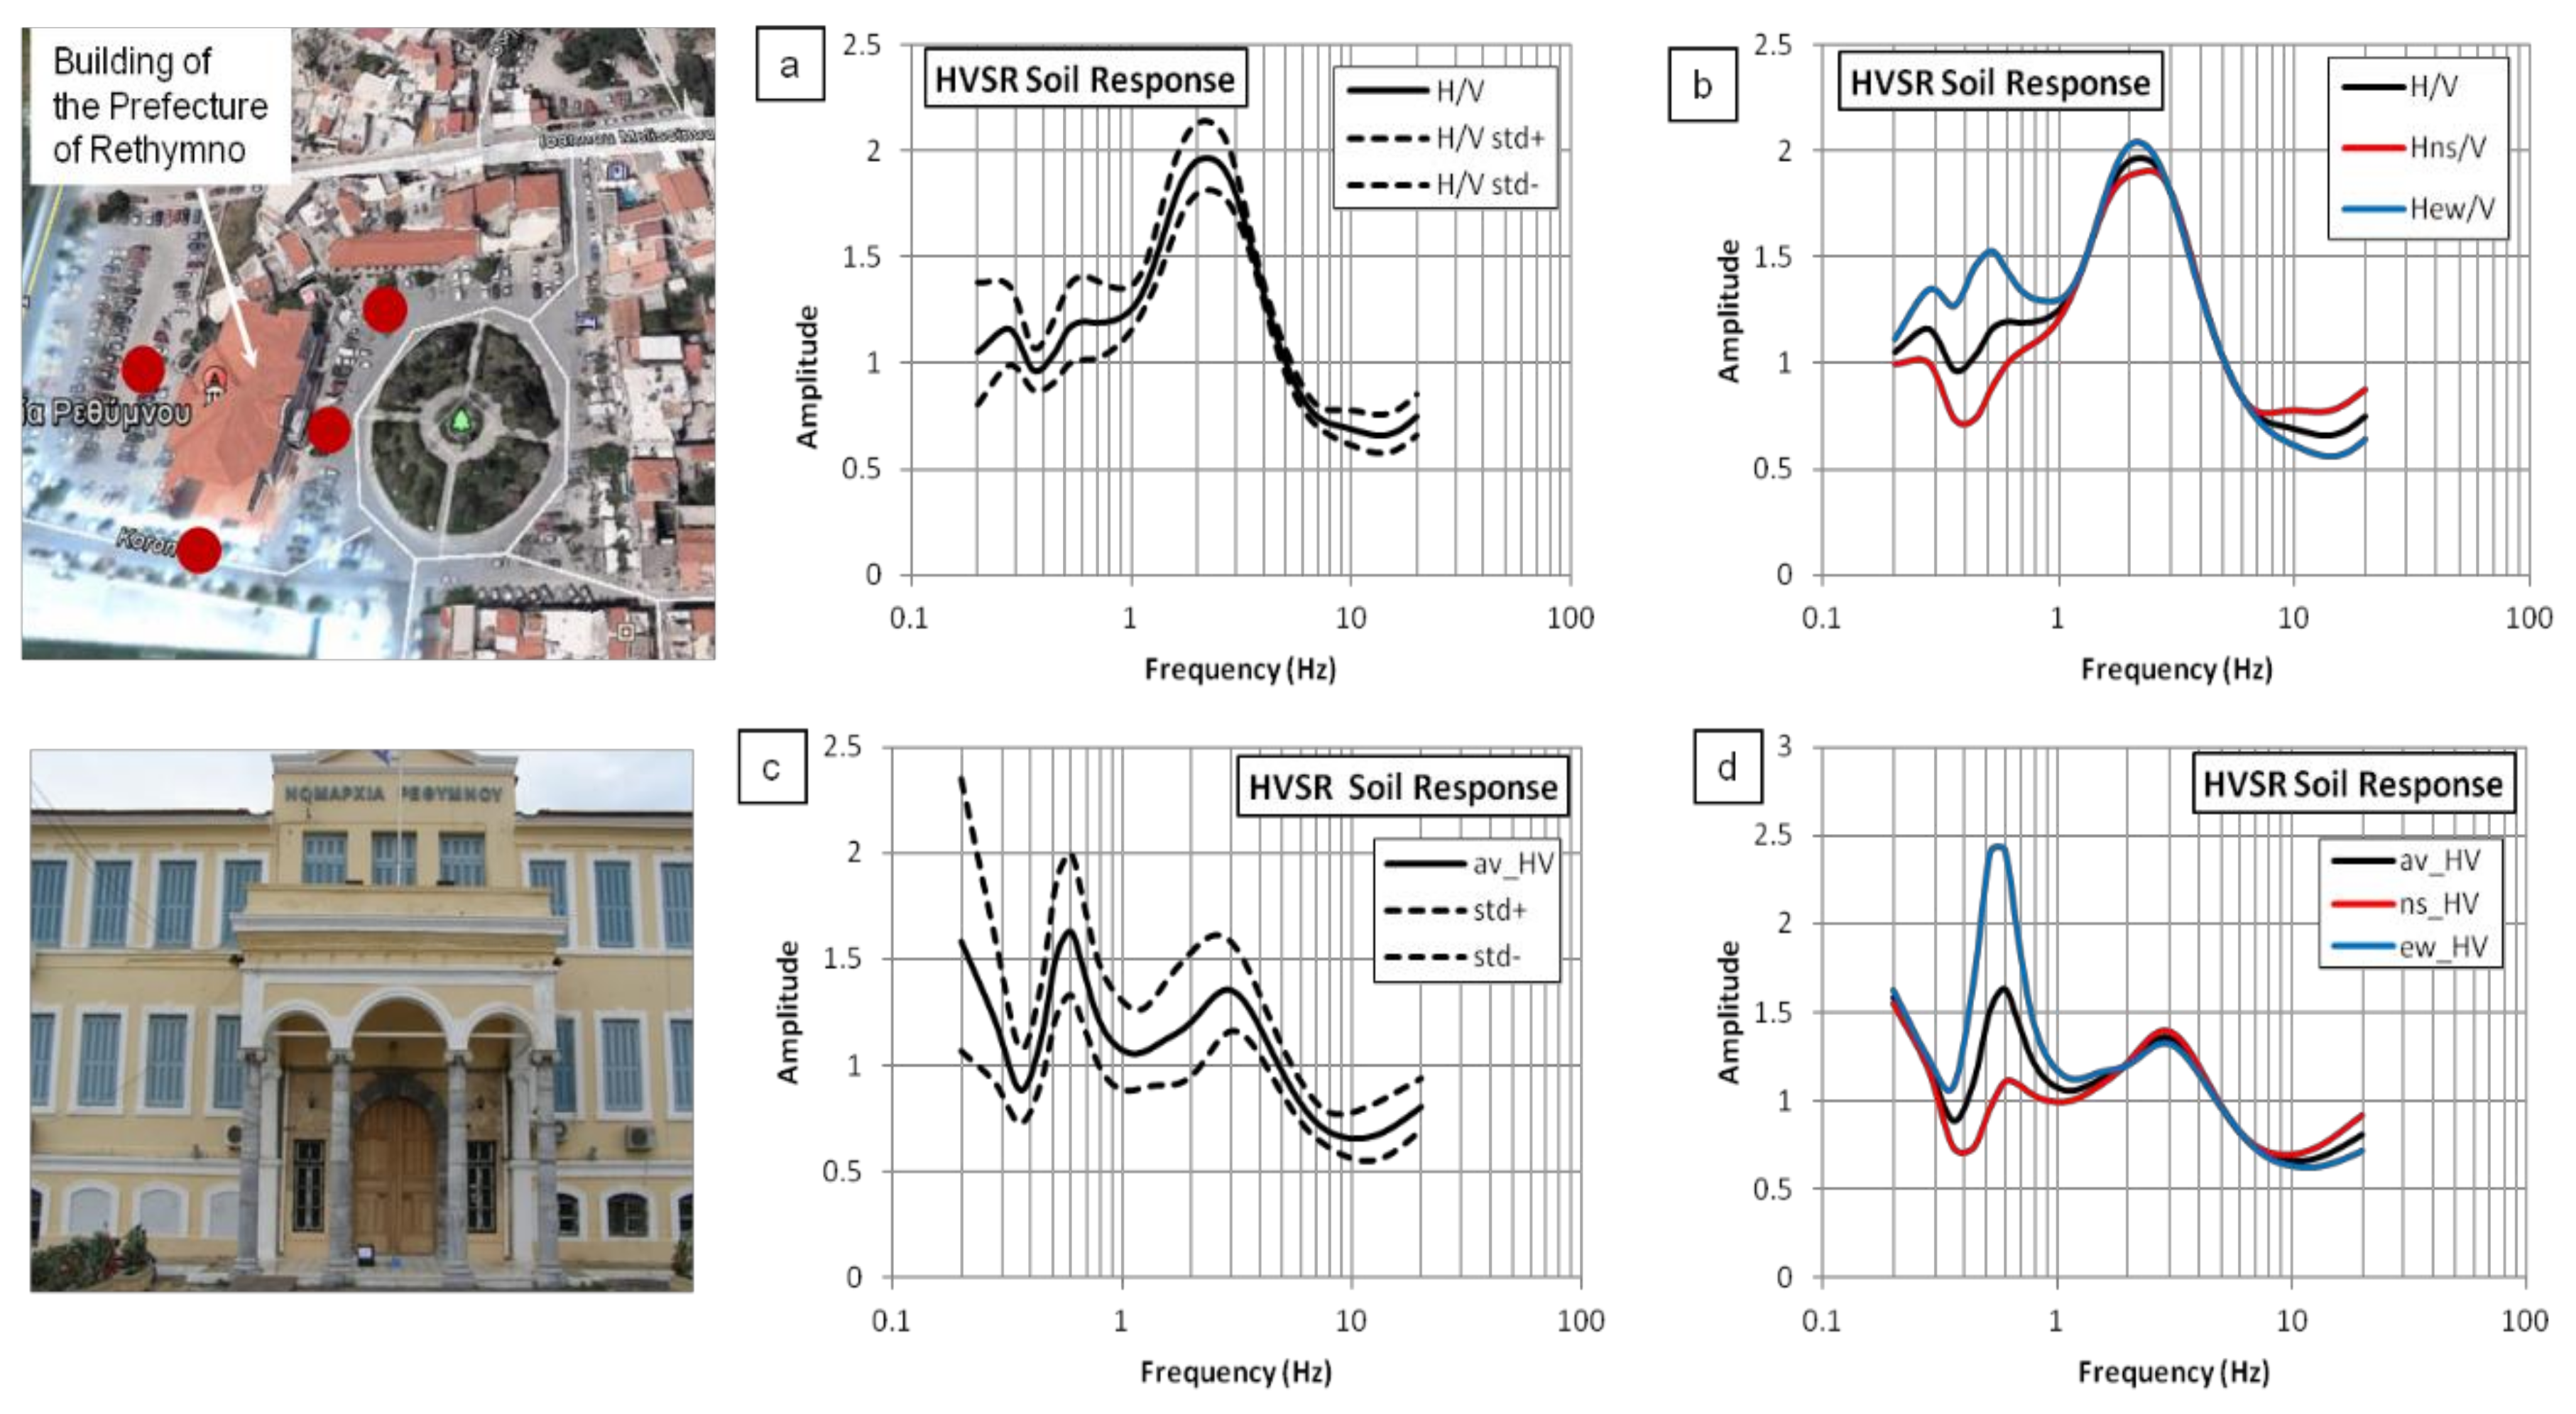
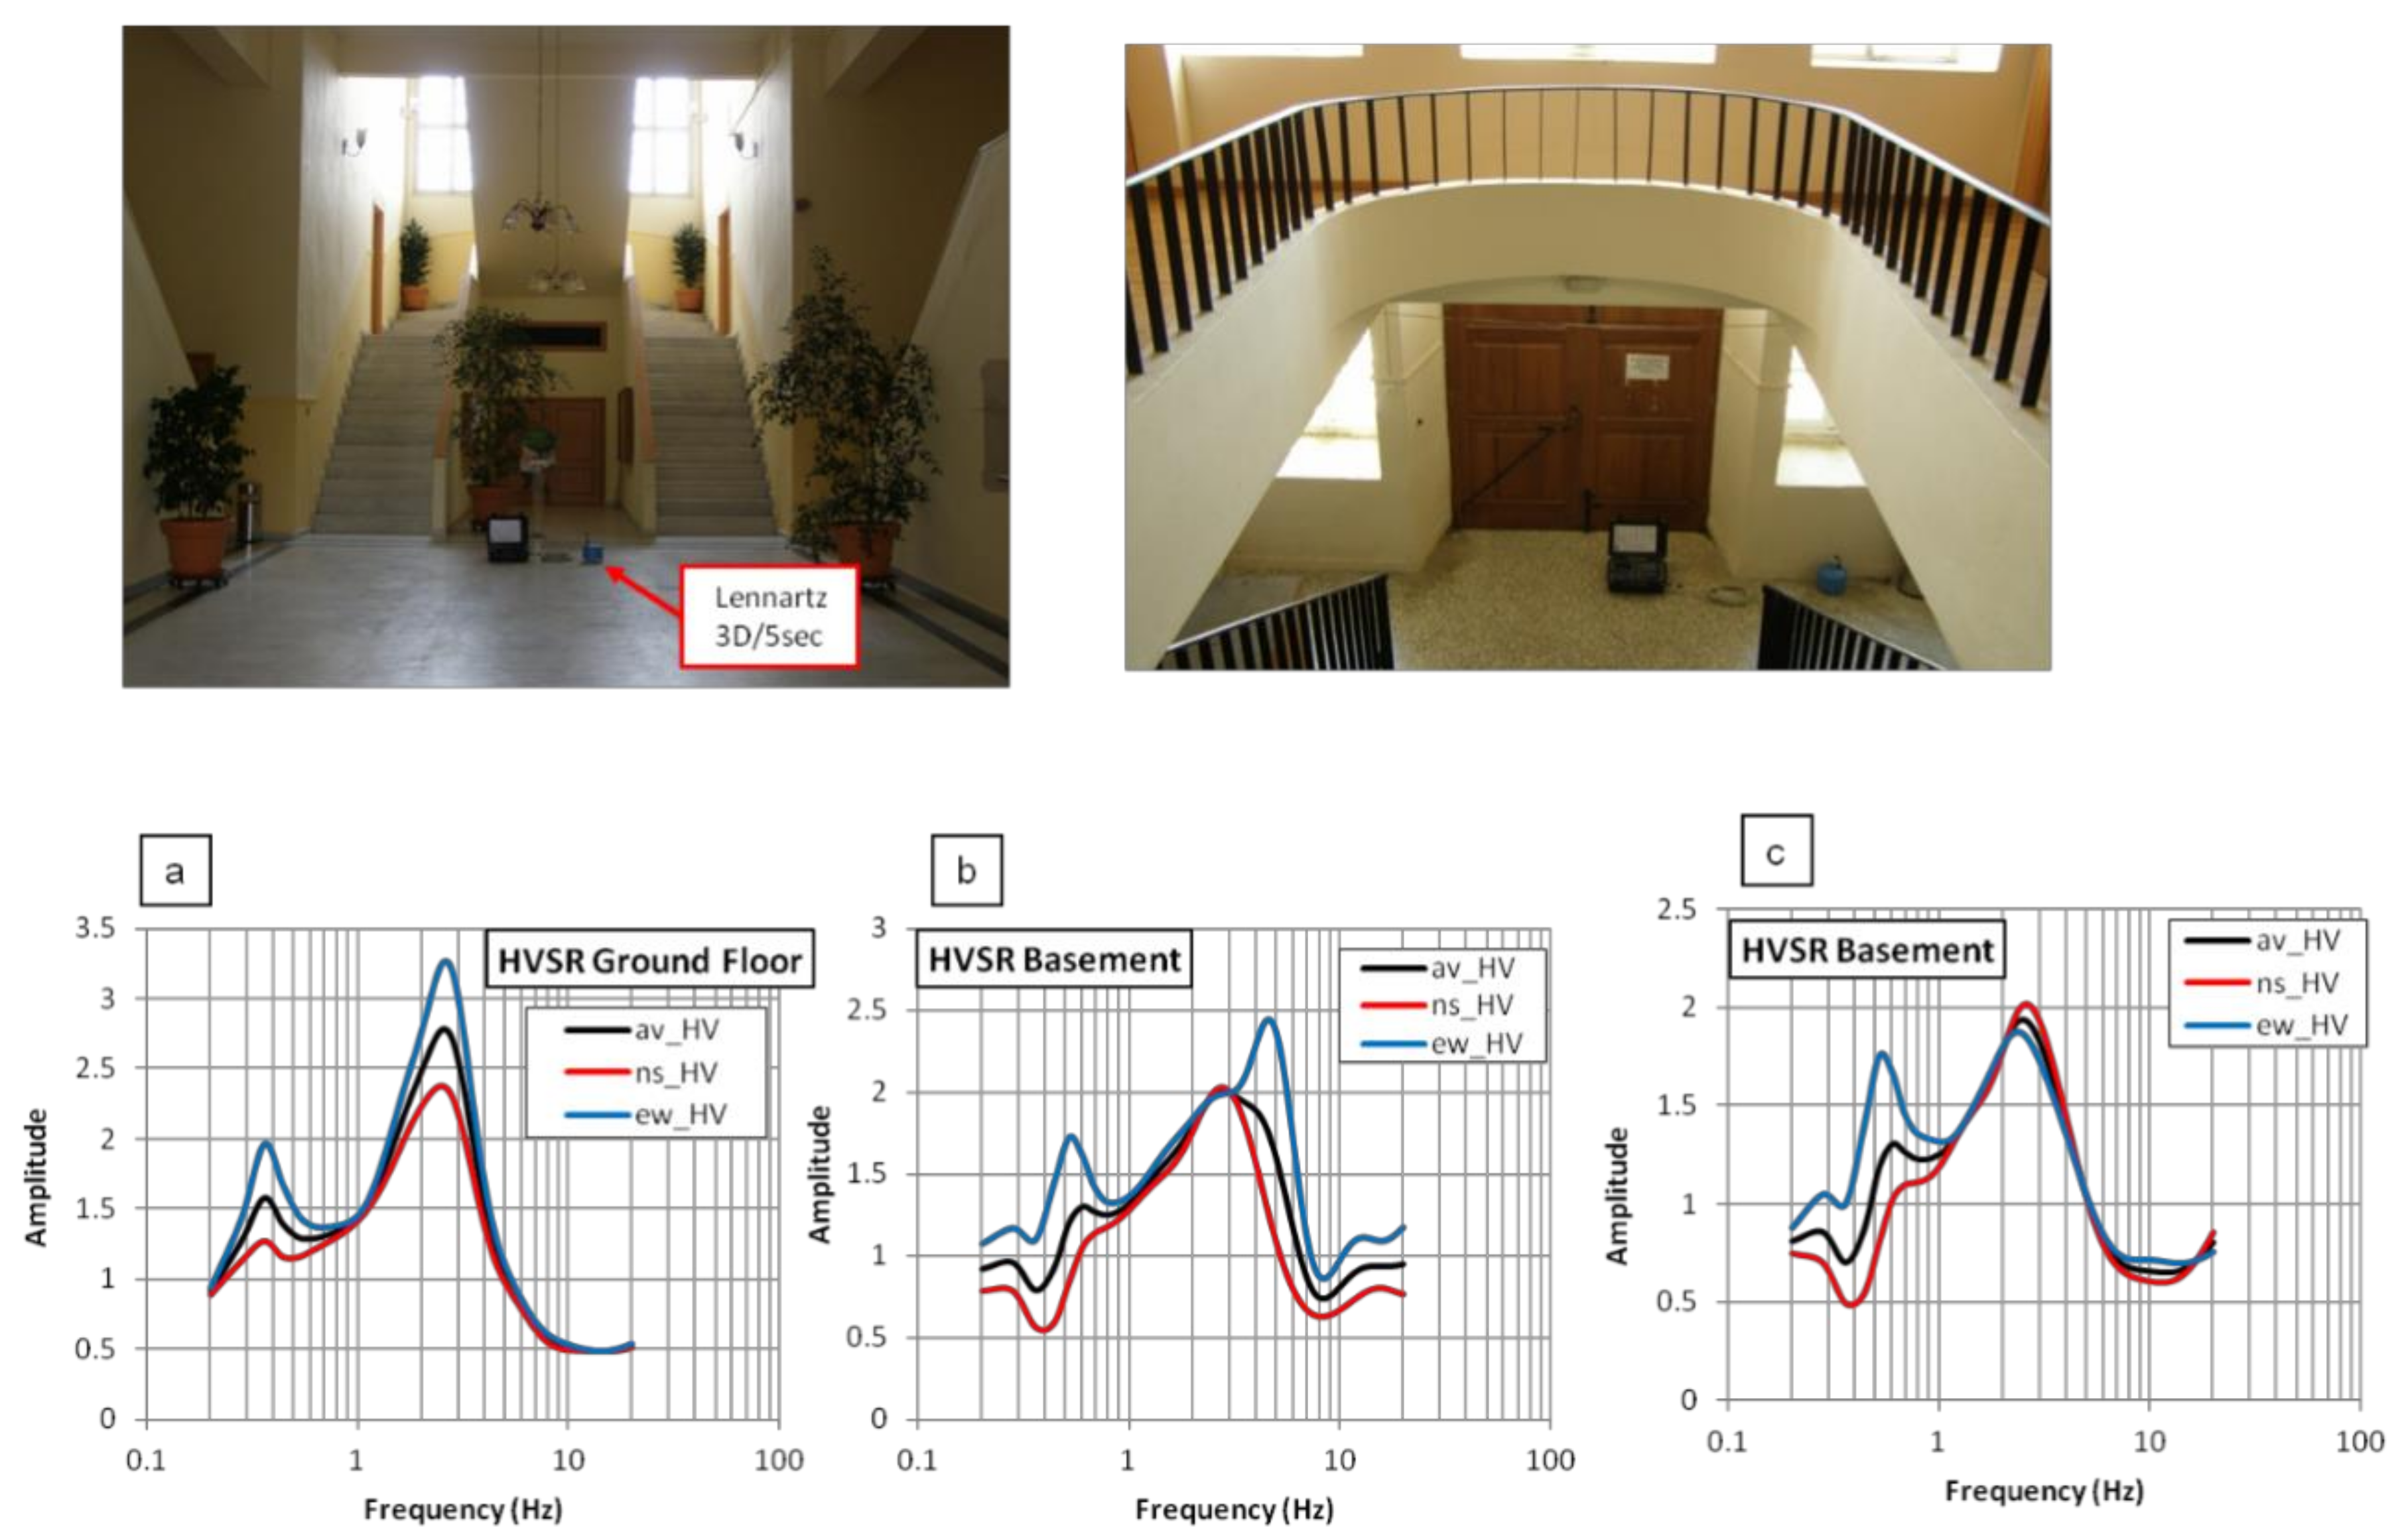
3.4. Case Study: Prefecture’s Building in the City of Rethymno

The historical building of the Prefecture of Rethymno is located northwest of the coast of Rethymno (Figure 10). The site where the building Prefecture of Rethymno is located and the soil spectra characteristics at the recording sites are shown in Figure 11. The geology where the studied buildings are located (Figure 12) is characterized from north to south (IGME, 1988) by: (a) limestones and dolomites that are generally tectonized and relatively karstic (Upper Cretaceous–Upper Jurassic-I, Figure 10), (b) marine deposits (basal conglomerates 2–3 m thick and clayey–marly deposits, sands, locally dispersed limestone gravel, and large pebbles) (III on Figure 10), (c) alluvial deposits (Holocene) of an approximate thickness of 20 m (II on Figure 10), and (d) in the west by well-defined fault zones striking N–S (Figure 10). The building of the Prefecture of Rethymno is a masonry building constructed in 1844–1847. Several recordings were performed on the soil and despite the short spatial distance of the recorded sites, soil HVSR variability is observed (Figure 10): the soil frequency has one clear peak at a frequency of 2.2 Hz (Figure 11a,b), while at close distances two HVSR peaks are present (one peak at 0.5–0.6 Hz and another peak at 3 Hz, Figure 11c,d). The HVSR fundamental frequency of the ground floor, the basement (Figure 12a), and the first floor (Figure 13a) was observed at 2.0–3.0 Hz, while the frequency on the second floor was observed at about 4.0–5.0 Hz (Figure 13b).

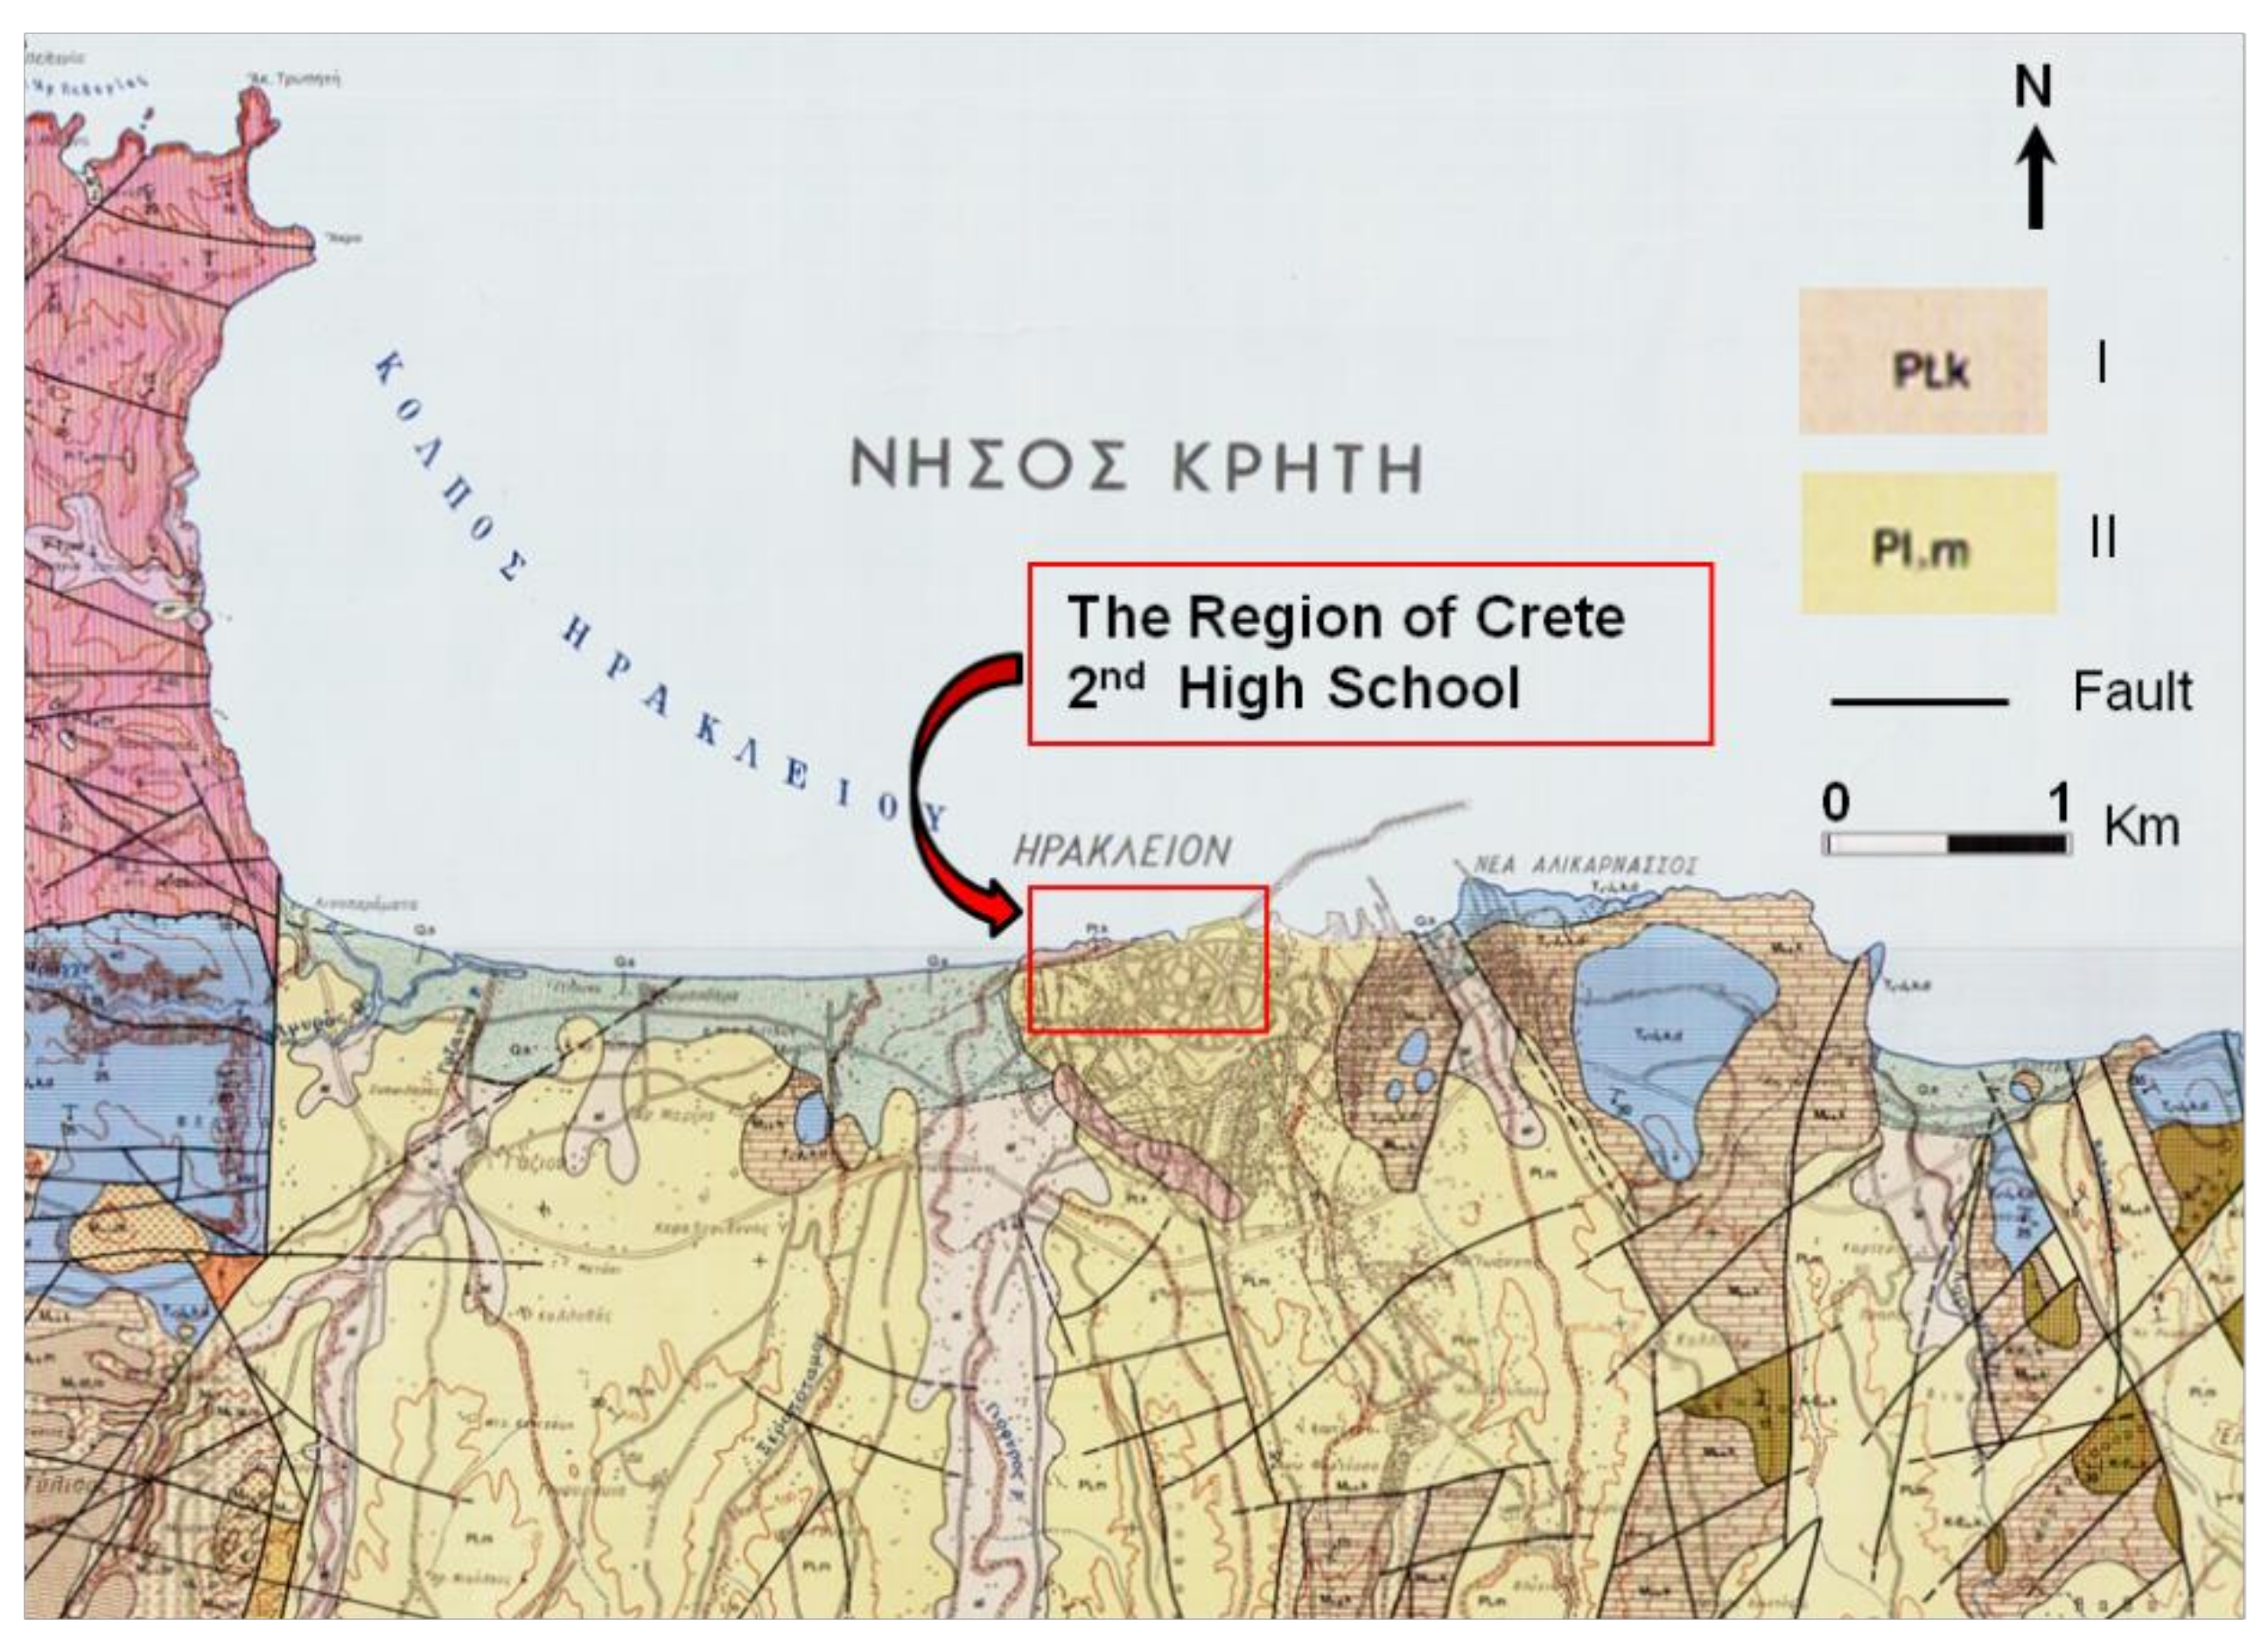
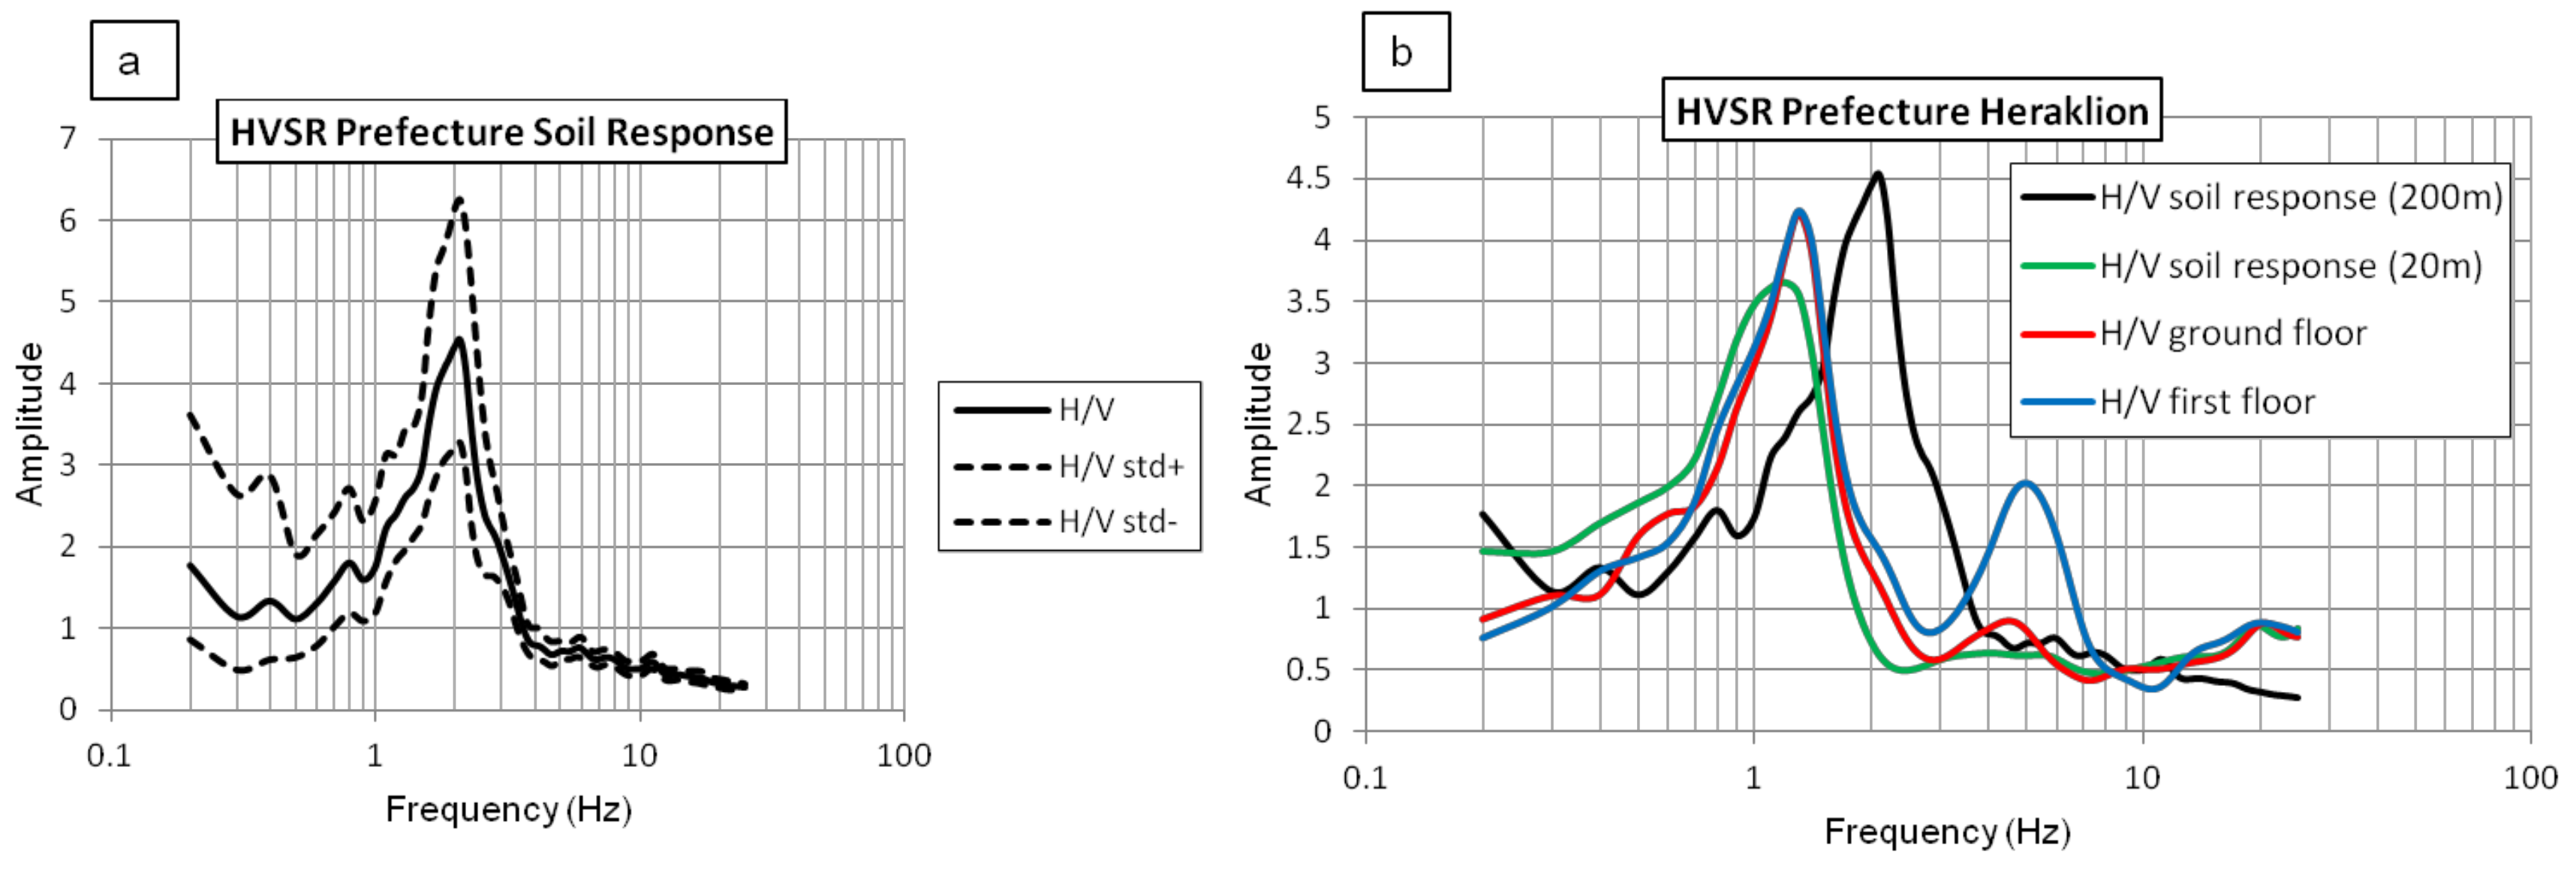
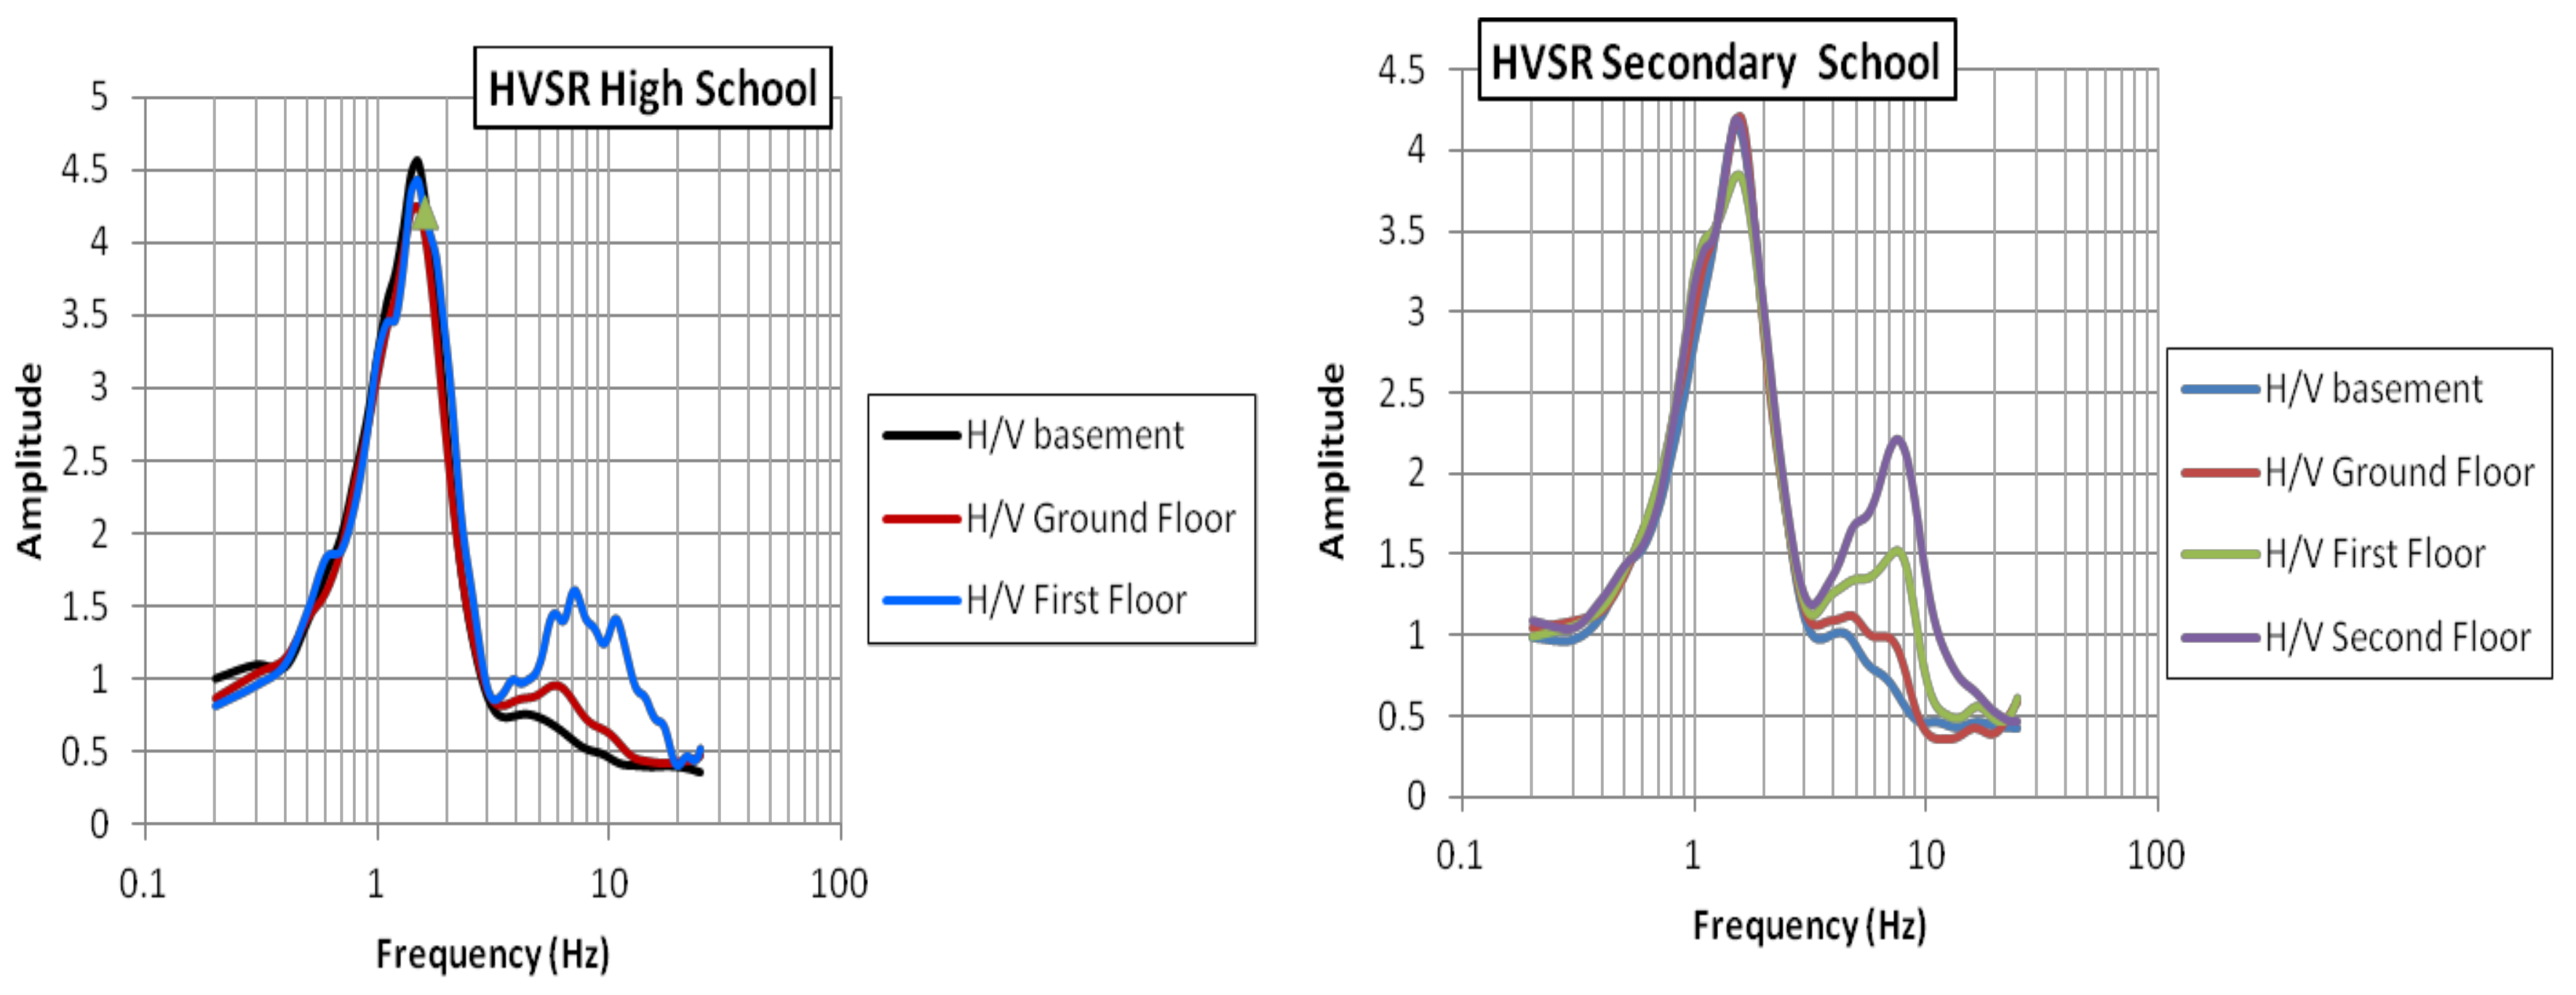
3.5. Case Study: Building of the Region of Crete and of the 2nd Secondary/High School (Heraklion)

The building that hosts the Region of Crete (Heraklion) is a stone masonry structure, which was constructed in 1585 by the Venetians. The geology of the site is characterized by Neogene formations (Lower-Middle Pliocene–Finika Formations). Specifically, the surface geology is characterized by marls, marly limestones, clays of often thin-bedded intercalations, fossiliferous marls, lamellar marls or diatormites, and bioclastic limestones (IGME, 1996). The thickness of the Finika formation is more than 150 m. The base of the formation consists in general of an unsorted “marly breccia” with constituents of homogeneous marls, limestones, and marls of the Agia Varvara greenish clays and preneogene rocks. The studied secondary and high school is located at an area characterized by a surface geology of Iraklion formation which has overly unconformable Finika formations. The Iraklion formation consists of marine, bioclastic, and well-bedded limestones, sandstones, conglomerates, and marls while the thickness of the deposits does not exceed 25 m. The geological setting where the buildings of the Region of Crete and the 2nd Secondary and High school are located is shown in Figure 14. The soil frequency was observed to be 2 Hz (Figure 15) at several distances from the building. The frequency of the ground floor and the first floor of the building of the Region of Crete was observed at 1.3 Hz (Figure 15). The first floor has a second frequency at 5 Hz. The H/V frequency of the basement, the ground floor, and the first floor of the high and secondary school was observed at 1.3–1.5 Hz (Figure 16), and a second peak at about 7 Hz was observed on the first and second floors.

4. Discussion and Conclusions

Ambient noise recordings have been recorded in selected historical and modern buildings in the municipalities of Heraklion, Chania, and Rethymno of Crete. The recorded data have been processed through spectral ratio techniques to assess the fundamental frequencies of the investigated historical structures. The examined historical and modern structures are located at sites characterized by Quaternary Holocene and Pliocene deposits (marls, marly limestones, marly sandstones (locally loose and of varying thickness), a complex setting of Upper Cretaceous limestones, and alluvial and marine deposits) and locally very loose deposits. The historical building of Venizelo’s residence and the historical buildings of the Prefecture of Rethymno are located very close to fault zones striking predominantly N–S and NNW–SSE. South of the two studied structures in Heraklion a fault zone striking predominantly N–S is also evident. The observed H/V frequencies at low frequencies are attributed to Quaternary deposits. The spectral of the ambient noise revealed also differential ground seismic motion at sites in close proximity.
A field survey close to the foundation site of the building of Venizelo’s residence revealed a geological section from the bottom to the surficial layer characterized by marly limestone, a transitional zone of limestone to marly limestone (a weathered zone), massive marls, and marls in the topmost surficial layer. Moreover, the geological map indicates a probable fault striking to the NNW–SSE in the area. The frequencies of the soil, basement, and ground floor were observed at 0.5–0.6 Hz and 5 Hz. The soil frequency at 0.5 Hz is related to soft marl deposits. The frequency of the first floor and of the attic was observed at about 5–6 Hz. The amplification reaches to 10 in the longitudinal sector of the attic, specifically in the west part of the structure. The HVSR amplification at the north, south, east, and west ranges from 2.0 to 10.0. Specifically, the HVSR amplitude in the west side of the attic (096, purple line on Figure 6f) is about twice the amplitude of the east direction (092, green line on Figure 6f). This difference in the amplitude could be related to anisotropy in the building motion. This anisotropy might not be induced by the complex behavior of the structure but by the ground motion itself. This anisotropy could be induced by the large-scale striking to the NNW–SSE fault zone in this case study. However, numerous studies have documented seismic anisotropy effects close to large fault zones [33,34].
Figure 6 shows the sites where microtremors were recorded in the attic. In the west side of the attic, the HVSR amplitudes at sites 096, 095, and 094 were different. The low HVSR amplitude shown in Figure 6c (at site 096) could be observed when the vertical component has large spectral amplitudes in the range of frequencies close to the main frequencies of the horizontal vibration. An outstanding characteristic of Venizelo’s residence (observed in 2007) was the wooden floor (a wood coating), which was locally more weathered and damaged compared to other sites (e.g., 095, 094). At all sites, the instrument was placed close to walls. However, the low amplitude (at about 2) at site 096 in Figure 6c could be related to the vertical component of motion induced by the membrane vibrations of the wooden floor. For building structures, this can happen when “the independent membrane vibrations of the floor can be large” [35].
In the technical Chamber of Chania, the soil frequency was observed at 0.4 Hz; this frequency is present at the basement too. On the ground floor, the HVSRs reveal two frequencies: the frequency due to the soil (0.4 Hz) and the main building’s frequency at about 5 Hz. The H/V fundamental frequencies of the first floor of the technical Chamber of Chania were observed at about 6.0 Hz, while a second frequency was observed at 0.4 Hz–0.5 Hz. Ambient noise recordings in the 1st High School of Chania building revealed that the soil frequency was 3.2 Hz. This soil frequency is present in all HVSRs estimated in the building; on the first and second floors the main building’s frequency is at about 9 Hz.
The ambient noise recorded at close distances in the building of the Prefecture of Rethymno presents spatial variability in the HVSR patterns (some sites present one peak at about 2 Hz and other sites present two amplified peaks at about 0.5 Hz and 3 Hz). The soil’s spatial spectral variability is related to the surface geology characterized by alluvial, limestone (generally tectonized), and marine deposits and N–S fault zones. A noted feature is the N–S striking fault crosscutting the foundation site of the Prefecture of Rethymno. The frequencies of the first floor and second floor were observed at about 2 Hz and 5 Hz, respectively. One HVSR peak was observed at the low frequency of 0.5–0.6 Hz and is related to thin soft alluvial deposits or clayey or marly deposits, and another peak at 2.5 could be related to the effects of a nearby subsurface structure characterized by lateral heterogeneities/irregularities (e.g., a fault zone). The low HVSR amplitude at the frequency of 2.5 Hz could be related to the amplification of the vertical component of motion due to the presence of a nearby vertical fault zone. However, a future field survey including additional ambient measurements and including another geophysical survey (e.g., electrical resistivity tomography) can be conducted on the soil to experimentally identify the fault zones shown on the geological map or to reveal the presence of other faults.
The frequencies on the ground floor and first floor of the building of the Region of Crete in Heraklion were observed at 1.3 Hz. The first floor had a second frequency at 5 Hz. The soil frequency was observed at 1–2 Hz, which was related to the surface geology of marls, marly limestones, and clays, and the soil amplification reaches to 4.5. Faults striking N–S and/or NNW–SSE were observed south of the studied area. The H/V frequency of the basement, the ground floor, and the first floor of the secondary/high school was observed at 1.3–1.5 Hz. Second peaks at about 7 Hz were observed on the first and second floors.
Site effect specifications are important issues for seismic hazard assessments of modern, historical, and monumental structures. In the frame of this study, ambient noise recordings have been recorded in selected historical and modern buildings in the municipalities of Heraklion, Chania, and Rethymno of Crete. The recorded data have been processed through the HVSR technique to assess the main frequencies of building structures and to examine whether the building has its main frequency close to that of the soil in order to identify potential resonance phenomena (considering that one of the most important factors in building damage distribution after an earthquake event is the soil–structure interaction [10]).
In the frame of this study, the observed soil H/V response at low frequencies was attributed to Quaternary deposits. The examined historical structures are located on Quaternary Holocene and Pliocene deposits locally on very loose deposits at sites characterized also by the presence of fault zones striking N–S or NNW–SSE. Considering the active tectonics of the Cretan region and the effect of very soft soil on monumental structures, especially those with heavy mass (as they may undergo excessive deformations after an earthquake event due to soil nonlinearity), further soil–structure interaction studies should follow in Crete to study the effects of soil on the seismic response of monuments given their historical importance.
In order to obtain a reliable estimation of the seismic risk, detailed dynamic analyses describing the effective transmission and dissipation of the energy derived from the ground motion into a building is of necessity in this region. A future survey might include an accelerometric installation at base/top floor to study the response of masonry structures under seismic excitations considering that masonry structures are complex systems that require detailed information (e.g., a fragility analysis). Moreover, the observed variations in the HVSR modal shapes could be also related to the interaction with neighboring buildings, which plays an important role in the dynamic properties of the structure. A future survey could be conducted in the neighboring buildings to check if their resonance frequency lies in this frequency band (the city-site effect). In addition, future work might include Finite Element Modelling of each structure and the derived resonant frequencies could be compared with the extracted HVSR results [36]. However, this preliminary study aimed at identifying resonant frequencies in the ground under and masonry of modern buildings in Crete in order to emphasize the importance of soil–structure interaction studies using non-invasive approaches to the local authority of Crete where a significant cultural capacity is present.
The necessity of incorporating the determination of prone resonating buildings into urban planning for future earthquake risk management planning, including mitigation and hazard reduction, for Crete is highlighted considering several factors, such as the high seismic activity of the area of Crete, the effects of soil condition on damage distribution, the complexity of the geological setting characterized by fault zones striking predominantly N–S or NNW–SSE, and the numerous historical and monumental structures. Microtremor recordings can be considered to be an effective earthquake response management tool to support civil protection preparation and operational decision-making in terms of earthquake disaster risk reduction, specifically in this highly seismic area of Crete where the monuments are part of the world’s cultural heritage.

Author Contributions

M.M., F.V., and M.R.G. designed the survey and the measurements, M.M. performed the experiments, F.V. reviewed the data quality, and M.M. and F.V. wrote the paper.

Acknowledgments

F.V. and M.M. acknowledge partial support of the work by the project ‘‘Seismic response assessments of minarets and important high rise historical and monumental structures in Crete (Greece)’’, CFS-1711 n. 4500329348, UNESCO Regional Bureau for Science and Culture in Europe and Japan Fund in Trust project “International Platform for Reducing Earthquake Disasters”.

Conflicts of Interest

The authors declare no conflict of interest.

References

  1. Yegian, M.K.; Chahramam, V.G.; Gazetas, G. Ground motion and soil response analyses for Leninakan 1988, Armenia earthquake. J. Earthq. Eng. 1994, 20, 330–348. [Google Scholar] [CrossRef]
  2. Gueguen, P.; Bard, P.Y. Soil-structure and soil structure interaction experimental evidences at Volvi test site. J. Earthq. Eng. 2005, 9, 657–693. [Google Scholar] [CrossRef]
  3. Mucciarelli, M.; Gallipoli, M.R. Estimate of frequency and damping for large set of buildings in dense urban areas, First European Conference on Earthquake Engineering and Seismology. In Proceedings of the 13th ECEE & 30th General Assembly of the ESC, Geneva, Switzerland, 3–8 September 2006; p. 211. [Google Scholar]
  4. Mucciarelli, M.; Bianca, M.; Ditommaso, R.; Vona, M.; Gallipoli, M.R.; Giocoli, A.; Piscitelli, S.; Rizzo, E.; Picozzi, M. Peculiar earthquake damage on a reinforced concrete building in San Gregorio (L’Aquila, Italy): Site effects or building defects? Bull. Earthq. Eng. 2011, 9, 825–840. [Google Scholar] [CrossRef]
  5. Pitilakis, K.D.; Fotopoulou, S.D. Vulnerability assessment of buildings exposed to coseismic permanent slope displacements. In Proceedings of the XVI ECSMGE Geotechnical Engineering for Infrastructure and Development, Edinburgh, UK, 13–17 September 2015; pp. 151–173, ISBN 978-0-7277-6067-8. [Google Scholar]
  6. Castellaro, S.; Padrón, L.A.; Mulargia, F. The different response of apparently identical structures: A far-field lesson from the Mirandola 20th May 2012 earthquake. Bull. Earthq. Eng. 2013. [Google Scholar] [CrossRef]
  7. Bournas, D.A.; Negro, P.; Taucer, F.F. Performance of industrial buildings during the Emilia earthquakes in Northern Italy and recommendations for their strengthening. Bull. Earthq. Eng. 2014, 12, 2383–2404. [Google Scholar] [CrossRef] [Green Version]
  8. Gazetas, G.; Zarzouras, O.; Drosos, V.; Anastasopoulos, I. Bridge–Pier Caisson foundations subjected to normal and thrust faulting: Physical experiments versus numerical analysis. Meccanica 2015, 50, 341–354. [Google Scholar] [CrossRef] [Green Version]
  9. Douglas, J.; Seyedi, D.M.; Ulrich, T.; Modaressi, H.; Foerster, E.; Pitilakis, K.; Pitilakis, D.; Karatzetzou, A.; Gazetas, G.; Garini, E.; et al. Evaluation of seismic hazard for the assessment of historical 1 elements at risk: Description ofinput and selection of intensity measures. Bull. Earthq. Eng. 2013. [Google Scholar] [CrossRef] [Green Version]
  10. Chopra, A.K. Dynamics of Structures: Theory and Applications to Earthquake Engineering, 2nd ed.; Pearson Pentice Hall: Upper Saddle River, NJ, USA, 2001. [Google Scholar]
  11. Mucciarelli, M.; Monachesi, G. The Bovec (Slovenia) earthquake, April 1998: A preliminary correlation among damage, ground motion amplification and building frequencies. J. Earthq. Eng. 1999, 3, 317–327. [Google Scholar] [CrossRef]
  12. Parolai, S.; Facke, A.; Richwalski, S.M.; Stempniewski, L. Assessing the vibrational frequencies of the Holweide Hospital in the city of Cologne (Germany) by means of ambient seismic noise analysis and FE modeling. Nat. Hazards 2005, 34, 217–223. [Google Scholar] [CrossRef]
  13. Navarro, M.; Vidal, F.; Feriche, M.; Enomoto, T.; Sanchez, F.J.; Matsuda, I. Expected ground—RC building structures resonance phenomena in Granada city (southern Spain). In Proceedings of the 13th World Conference on Earthquake Engineering, Vancouver, BC, Canada, 1–6 August 2004. Paper No. 3308. [Google Scholar]
  14. Volant, P.; Orbovica, N.; Dunandb, F. Seismic evaluation of existing nuclear facility using ambient vibration test to characterize dynamic behavior of the structure and microtremor measurements to characterize the soil: A case study. Soil Dyn. Earthq. Eng. 2002, 22, 1159–1167. [Google Scholar] [CrossRef]
  15. Gallipoli, M.R.; Mucciarelli, M.; Šket-Motnikar, B.; Zupancic, P.; Gosar, A.; Prevolnik, S.; Herak, M.; Stipcevic, J.; Herak, D.; Milutinovic, Z.; et al. Empirical estimates of dynamic parameters on a large set of European buildings. Bull. Earthq. Eng. 2010, 8, 593–607. [Google Scholar] [CrossRef]
  16. Oliveira, C.S.; Navarro, M. Fundamental periods of vibration of RC buildings in Portugal from in-situ experimental and numerical techniques. Bull. Earthq. Eng. 2010, 8, 609–642. [Google Scholar] [CrossRef]
  17. Nakamura, Y.; Gurler, E.D.; Saita, J. Dynamic Characteristics of Leaning Tower of Pisa Using Microtremor-Preliminary Results. In Proceedings of the 25th JSCE Earthquake Engineering Symposium, Tokyo, Japan, 29–31 July 1999; Volume 2, pp. 921–924. [Google Scholar]
  18. Nakamura, Y.; Gurler, E.D.; Saita, J.; Rovelli, A.; Donati, S. Vulnerability investigation of Roman Colosseum using microtremor. In Proceedings of the World Conference on Earthquake Engineering, Auckland, New Zealand, 30 January–4 February 2000; pp. 1–8. [Google Scholar]
  19. Nakamura, Y. Real Time Information systems for seismic Hazards Mitigation UREDAS, HERAS, PIC. Q. Rep. RTRI 1996, 37, 112–127. [Google Scholar]
  20. Nakamura, Y. Seismic vulnerability Indices for ground and structures Usingmicrotremor. In Proceedings of the World Congress on Railway Research, Florence, Italy, 16–19 November 1997; pp. 1–7. [Google Scholar]
  21. Gallipoli, M.R.; Mucciarelli, M.; Castro, R.R.; Monachesi, G.; Contri, P. Structure, soil-structure responseand effects of damage based on observations of horizontal-to-vertical spectral ratio of microtremors. Soil Dyn. Earthq. Eng. 2004, 24, 487–495. [Google Scholar] [CrossRef]
  22. Gosar, A.; Rošer, J.; Šket-Motnikar, B.; Zupančič, P. Microtremor study of site effects and soil structure resonance in the city of Ljubljana (central Slovenia). Bull. Earthq. Eng. 2009, 8, 571–592. [Google Scholar] [CrossRef]
  23. Liberatore, D.; Mucciarelli, M.; Gallipoli, M.R.; Masini, N. Two Applications of the HVSR Technique to Cultural Heritage and Historical Masonry. Bull. Earthq. Eng. 2009, 5, 325–335. [Google Scholar] [CrossRef]
  24. Moisidi, M. Geological Geophysical and Seismological Investigations for Earthquake Hazards Estimation in Western Crete. Ph.D. Thesis, Brunel University, London, UK, 2009; 842p. [Google Scholar]
  25. Mokhberi, M. Vulnerability evaluation of the urban area using the H/V spectral ratio of microtremors. Int. J. Disaster Risk Reduct. 2015, 13, 369–374. [Google Scholar] [CrossRef]
  26. Moisidi, M. Site—Building resonance response in a complex geological setting: Ground motions recorded in the centre and at a rock fractured outcrop site close to the Basin edge of Paleohora (SW Crete, Greece). Phys. Chem. Earth 2017, 98, 73–89. [Google Scholar] [CrossRef]
  27. Kapustian, N.; Antonovskaya, G.; Agafonov, V.; Neumoin, K.; Safonov, M. Seismic monitoring of linear and rotational oscillations of the multistory buildings in Moscow Geotechnical. Geol. Earthq. Eng. 2013, 24, 353–363. [Google Scholar] [CrossRef]
  28. Nakamura, Y. A Method for Dynamic Characteristics Estimation of Subsurface Using Microtremor on the Ground Surface; Quarterly Report of RTRI; Railway Technical Research Institute: Tokyo, Japan, 1989; Volume 30, pp. 25–30. [Google Scholar]
  29. Guidelines for the Implementation of the H/V Spectral Ratio Technique on Ambient Vibrations–Measurements, Processing and Interpretations. Available online: http://sesamefp5.obs.ujf-grenoble.fr (accessed on 29 December 2016).
  30. Nakamura, Y. Clear identification of fundamental idea of Nakamura’s method for dynamic characteristics estimation of subsurface using microtremor on the ground surface and its applications. In Proceedings of the 12th World Conference on Earthquake Engineering, Auckland, New Zealand, 30 January–4 February 2000. [Google Scholar]
  31. Mucciarelli, M.; Gallipoli, M.R. The HVSR technique from microtremors to strong motion: Empirical and statistical considerations. In Proceedings of the 13th World Conference on Earthquake Engineering, Vancouver, BC, Canada, 1–6 August 2004; p. 45. [Google Scholar]
  32. Chatelain, J.-L.; Guillier, B.; Guéguen, P.; Fréchet, J.; Sarrault, J. Ambient Vibration Recording for Single-Station, Array and Building Studies Made Simple: CityShark II. Int. J. Geosci. 2012, 3, 1168–1175. [Google Scholar] [CrossRef]
  33. Liu, Y.; Zhang, H.; Thurber, C. Shear wave anisotropy in the crust around the San Andreas fault near Parkfield: Spatial and temporal analysis. Geophys. J. Int. 2008, 172, 957–970. [Google Scholar] [CrossRef]
  34. Boness, N.L.; Zoback, M.D. Mapping stress and structurally controlled shear velocity anisotropy in California. Geology 2006, 34, 825–828. [Google Scholar] [CrossRef]
  35. Ditommaso, R.; Parolai, S.; Mucciarelli, M.; Eggert, S.; Sobiesiak, M.; Zschau, J. Monitoring the response and the back-radiated energy of a building subjected to ambient vibration and impulsive action: The Falkenhof Tower (Potsdam, Germany). Bull. Earthq. Eng. 2009, 8, 705–722. [Google Scholar] [CrossRef]
  36. Makhoul, N.; Harb, J. Dynamic properties of Byblos municipality building with soil-structure interaction using geophysical methods. Procedia Eng. 2017, 199, 206–211. [Google Scholar] [CrossRef]
Figure 1. The H/V, horizontal to vertical spectral ratio technique description (see text).
Heritage 01 00012 g001
Figure 2. (a) Location of masonry building of Venizelo’s residence and the geological setting (the geological map has been derived by the Institute of Geology and Mineral Exploration (IGME), 1971) where the masonry building of Venizelo’s residence is located, (b) a geological section revealed from a field survey close to the building foundation, (c) ground plan of the basement foundation of Venizelo’s Residence and the measured points in the basement.
Heritage 01 00012 g002
Figure 3. HVSR spectral characteristics of the (a) soil and the (b) basement foundation. The black lines represent the average H/V, and the red and blue lines represent the Hns/V and Hew/V ratios, respectively (see text).
Heritage 01 00012 g003
Figure 4. (upper) Ground plan of the ground floor of Venizelo’s residence and the sites where microtremor measurements were performed, and (ad) HVSR spectral characteristics at the south, north, east, and west of the ground floor. The black lines represent the average H/V, and the red and blue lines represent the Hns/V and Hew/V ratios, respectively (see text).
Heritage 01 00012 g004
Figure 5. Ground plan of the first floor of Venizelo’s Residence and samples of sites where microtremor measurements were performed. Examples of HVSR spectral characteristics at the north, east, and west of the first floor (ad). Examples of the HVSR from the basement to the first floor (e). The black lines represent the average H/V, and the red and blue lines represent the Hns/V and Hew/V ratios, respectively (see text).
Heritage 01 00012 g005
Figure 6. Ground plan of the attic of Venizelo’s Residence and samples of sites where microtremor measurements were recorded at the south, north, east, and west. Examples of HVSR ambient noise recorded at the south, north, east, and west of the attic (af). The black lines represent the average H/V, and the red and blue lines represent the Hns/V and Hew/V ratios, respectively. Examples of the HVSR from the basement to the attic (g,h), the increase of amplification relative to the height of the building (floors) on all sides (north, south, east, and west) of the structure. The black lines represent the average H/V, and the red and blue lines represent the Hns/V and Hew/V ratios, respectively.
Heritage 01 00012 g006
Figure 7. Building ground plans of the basement, ground floor, and first floor of the Technical Chamber (Chania) and examples of sites where microtremor recordings were acquired. H/V ratios of ambient noise recorded at several sites (a) on the ground soil, (b) at the basement foundation, (c) at the ground floor, and (d) at the first floor. (e) shows the H/V ratios obtained on the soil foundation and at different levels.
Heritage 01 00012 g007
Figure 8. (a) The L-shaped building design of the secondary and high school, (b) HVSR of the foundation soil. The fundamental frequency was observed at 3.2 Hz.
Heritage 01 00012 g008
Figure 9. HVSR estimated at each floor of the secondary school (a) and the high school (b).
Heritage 01 00012 g009
Figure 10. Geological setting of the Prefecture of Rethymno (IGME, 1988).
Heritage 01 00012 g010
Figure 11. The site where the building Prefecture of Rethymno is located and the soil spectra characteristics at the recording sites (red circles). The black lines represent the average H/V, and the red and blue lines represent the Hns/V and Hew/V ratios, respectively.
Heritage 01 00012 g011
Figure 12. Ambient noise recordings and the spectra characteristics of the ground floor (a) and the basement (b,c). The black lines represent the average H/V. The red and blue lines represent the Hns/V and Hew/V ratios, respectively.
Heritage 01 00012 g012
Figure 13. HVSR of the first floor (a) and second floor (b). The black lines represent the average H/V. The red and blue lines represent the Hns/V and Hew/V ratios, respectively.
Heritage 01 00012 g013
Figure 14. Geological setting of the sites where the buildings of the Region of Crete and the 2nd Secondary and High school are located. N–S striking faults were observed south of the studied area (IGME 1996).
Heritage 01 00012 g014
Figure 15. H/V ratios recorded on soil (a,b) at various distances from the building of the Region of Crete (Heraklion) and H/V ratios recorded on the ground and first floors (b). (a) The black lines represent the average H/V ratio and its standard deviation, (b) shows the HVSR at sites located 20 m and 200 m approximately from the studied structure and the spectral ratios of microtremors recorded on the ground floor and the first floor.
Heritage 01 00012 g015
Figure 16. H/V ratios of the 2nd Secondary and High School.
Heritage 01 00012 g016

