Imaging Analysis and Digital Restoration of the Holy Face of Manoppello—Part II


1
Istituto di Cristallografia, Consiglio Nazionale delle Ricerche (IC-CNR), via Amendola 122/O, 70126 Bari, Italy
2
Dipartimento di Elettronica, Informazione e Bioingegneria, Politecnico di Milano, Piazza L. da Vinci, 32, 20133 Milano, Italy
3
Dipartimento di Ingegneria Industriale, via Gradenigo 6/a, Università di Padova, 35131 Padova, Italy
*
Author to whom correspondence should be addressed.
Heritage 2018, 1(2), 349-364; https://0-doi-org.brum.beds.ac.uk/10.3390/heritage1020024
Submission received: 18 October 2018
/
Revised: 3 November 2018
/
Accepted: 15 November 2018
/
Published: 18 November 2018
Abstract
:In this second work on the Holy Face of Manoppello, known also as the Veil, we have performed a spectral analysis of the transmitted image. Its thin linen threads are translucent, presumably because starched, allowing light to pass through them. As a result, the yellowish colour of the ancient linen and starch contribute substantially to the final hues of the Holy Face, especially when the Veil is lit from the backside with grazing light. Spectrophotometry measurements have allowed calculating how the fabric absorbs the various chromatic components. Through these quantitative evaluations, it has been possible to compensate the colours of the transmitted Holy Face image, by subtracting the contribution due to the yellowish coloration of the thin linen threads. Furthermore, the rotational spectrum of the image has been studied after digital restoration. The linear fit of the power spectrum in bi-logarithmic scale with a power law provided a slope parameter . This is a surprising value because it is typical of photographs of human faces, not of portraits of human faces painted by artists, which instead have statistical properties of fractal type, with values of slopes .
1. Introduction
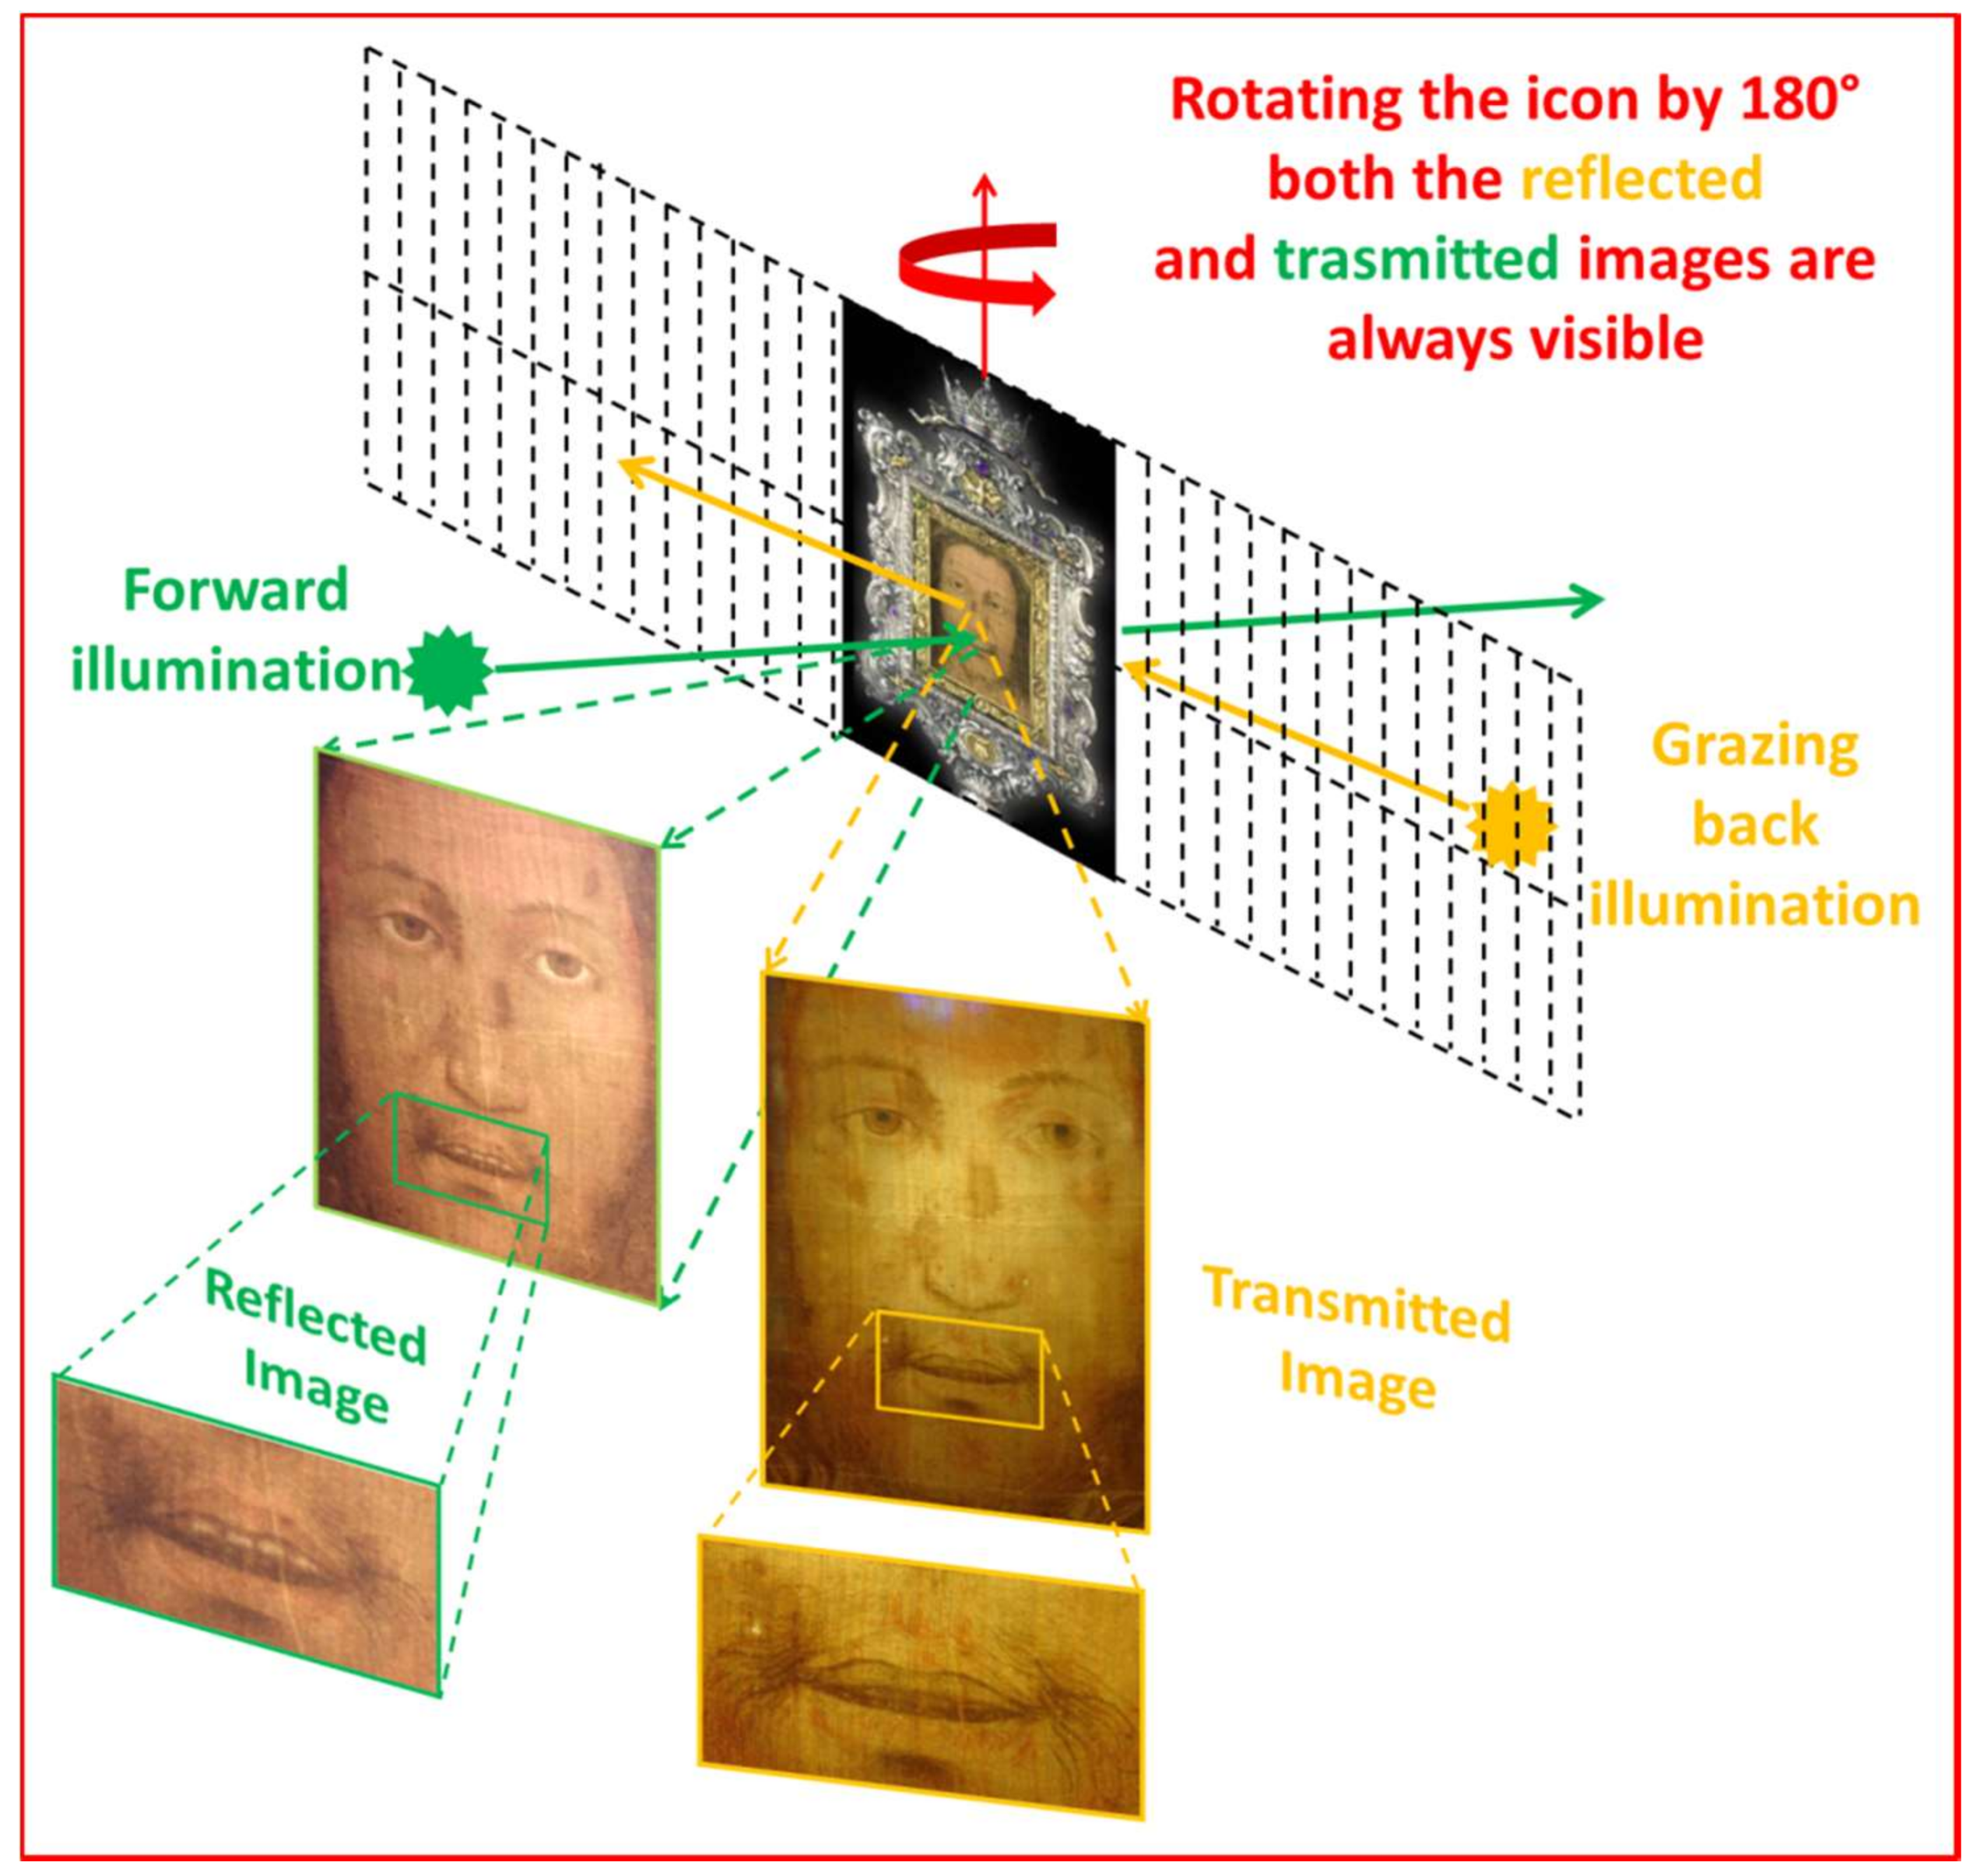
The Holy Face, or Veil of Manoppello, is a rectangular canvas of mm2 of very thin, semi-transparent fabric, on which is depicted the image of a male face, associated in the religious iconography to Jesus Christ. It is a very special icon, subjected to historical and scientific investigations, because the image is visible on both sides of the Veil and changes slightly according to lighting conditions, as shown in Figure 1. When the observer and the light source are on the same side and one looks at the front side of the Veil, the reflection image seen is that shown in the green box in Figure 1. If the observer and the light source are on different sides and the Veil is illuminated by grazing light, the image transmitted by the Veil is the one shown in the yellow box in Figure 1. Similar behaviour occurs if the Veil is rotated by 180°. The image, therefore, is as if it were two-faced because it is visible on both sides, although it shows some small differences such as, for example, the mouth more open and with visible teeth, or more closed with not visible teeth, as evidenced by zooms in Figure 1. The reason for this unusual optical behaviour is due to its texture. In fact, the Veil is a semi-transparent fabric in which about 42% consists of empty space between its thin translucent linen threads [1].
The texture of the Veil, made up of thin threads spaced more than their diameter, predisposes it to deform easily, making the Holy Face markedly asymmetric, with the eyes not at the same distance from the nose-mouth axis and with the horizontal axis across them not perpendicular to the vertical nose-mouth axis [1]. For this reason, in the first part of this work, we have first analysed the icon from an optical point of view, with infrared and ultraviolet light and with an optical microscope. In this way, we have understood the nature of the fabric, consisting of thin linen threads presumably starched because they are translucent. Moreover, we have focused our attention on the reflection image transmitted by the Veil when it is illuminated by grazing light and have corrected the deformation of the Holy Face caused by the distortion of the weft and warp threads [1]. The effective elimination of distortions was assessed by analysing its Fourier Transform (FT). In addition to the main maximum, the FT of the corrected image presents other secondary peaks arranged according to a rectangular symmetry, obviously due to the weft and warp that form rectangular base units (cells) periodically repeated. Through the FT analysis of a painting, it is also possible to have some information about the particular technique used by the author, by analysing the rotational anisotropy of its power spectrum. This study, carried out for the image transmitted by the Veil of Manoppello, corrected from distortions, is one of the topics of this second paper.
Furthermore, the texture of the thin linen threads, probably starched, makes them translucent, allowing light to pass through. This finding causes the yellowish colour of the antique linen to contribute substantially to the final tonality of the image, especially when the Veil is illuminated from the backside with grazing light. Spectrophotometry measurements at varying wavelengths, carried out by the third author [2], made it possible to evaluate how the threads absorb the different chromatic components.
Thanks to these measurements it is now possible to compensate the colours, by calculating the contribution due to the absorption of the smaller light wavelengths and obtain the colours that the Holy Face would show if it were not on a translucent support of yellowish colour but on a chromatically neutral one. The result of this correction shows more natural colours for a human face.
We have also analysed the average rotational power spectrum of the Holy Face image after digital restoration, in a bi-logarithmic scale and compared the slope of the regression line (given by a power law in linear units) with the typical slopes obtained from paintings and photographs of human faces. Surprisingly, the analysis indicates that the Holy Face FT spectrum is much more similar to that of a photograph than of a painting.
After this Introduction, in Section 2, we study some spectral characteristics of the Holy Face image and, for comparison, of two examples of paintings (portraits of human faces). In Section 3 we conduct an optical analysis and correct the colours of the image transmitted by the Veil. In Section 4, we analyse the anatomical details of the face. In Section 5, we analyse the FT power spectrum of the Holy Face image. Section 6 finally draws some conclusions.
2. Spectral Analysis of the Holy Face and Comparison with Some Paintings
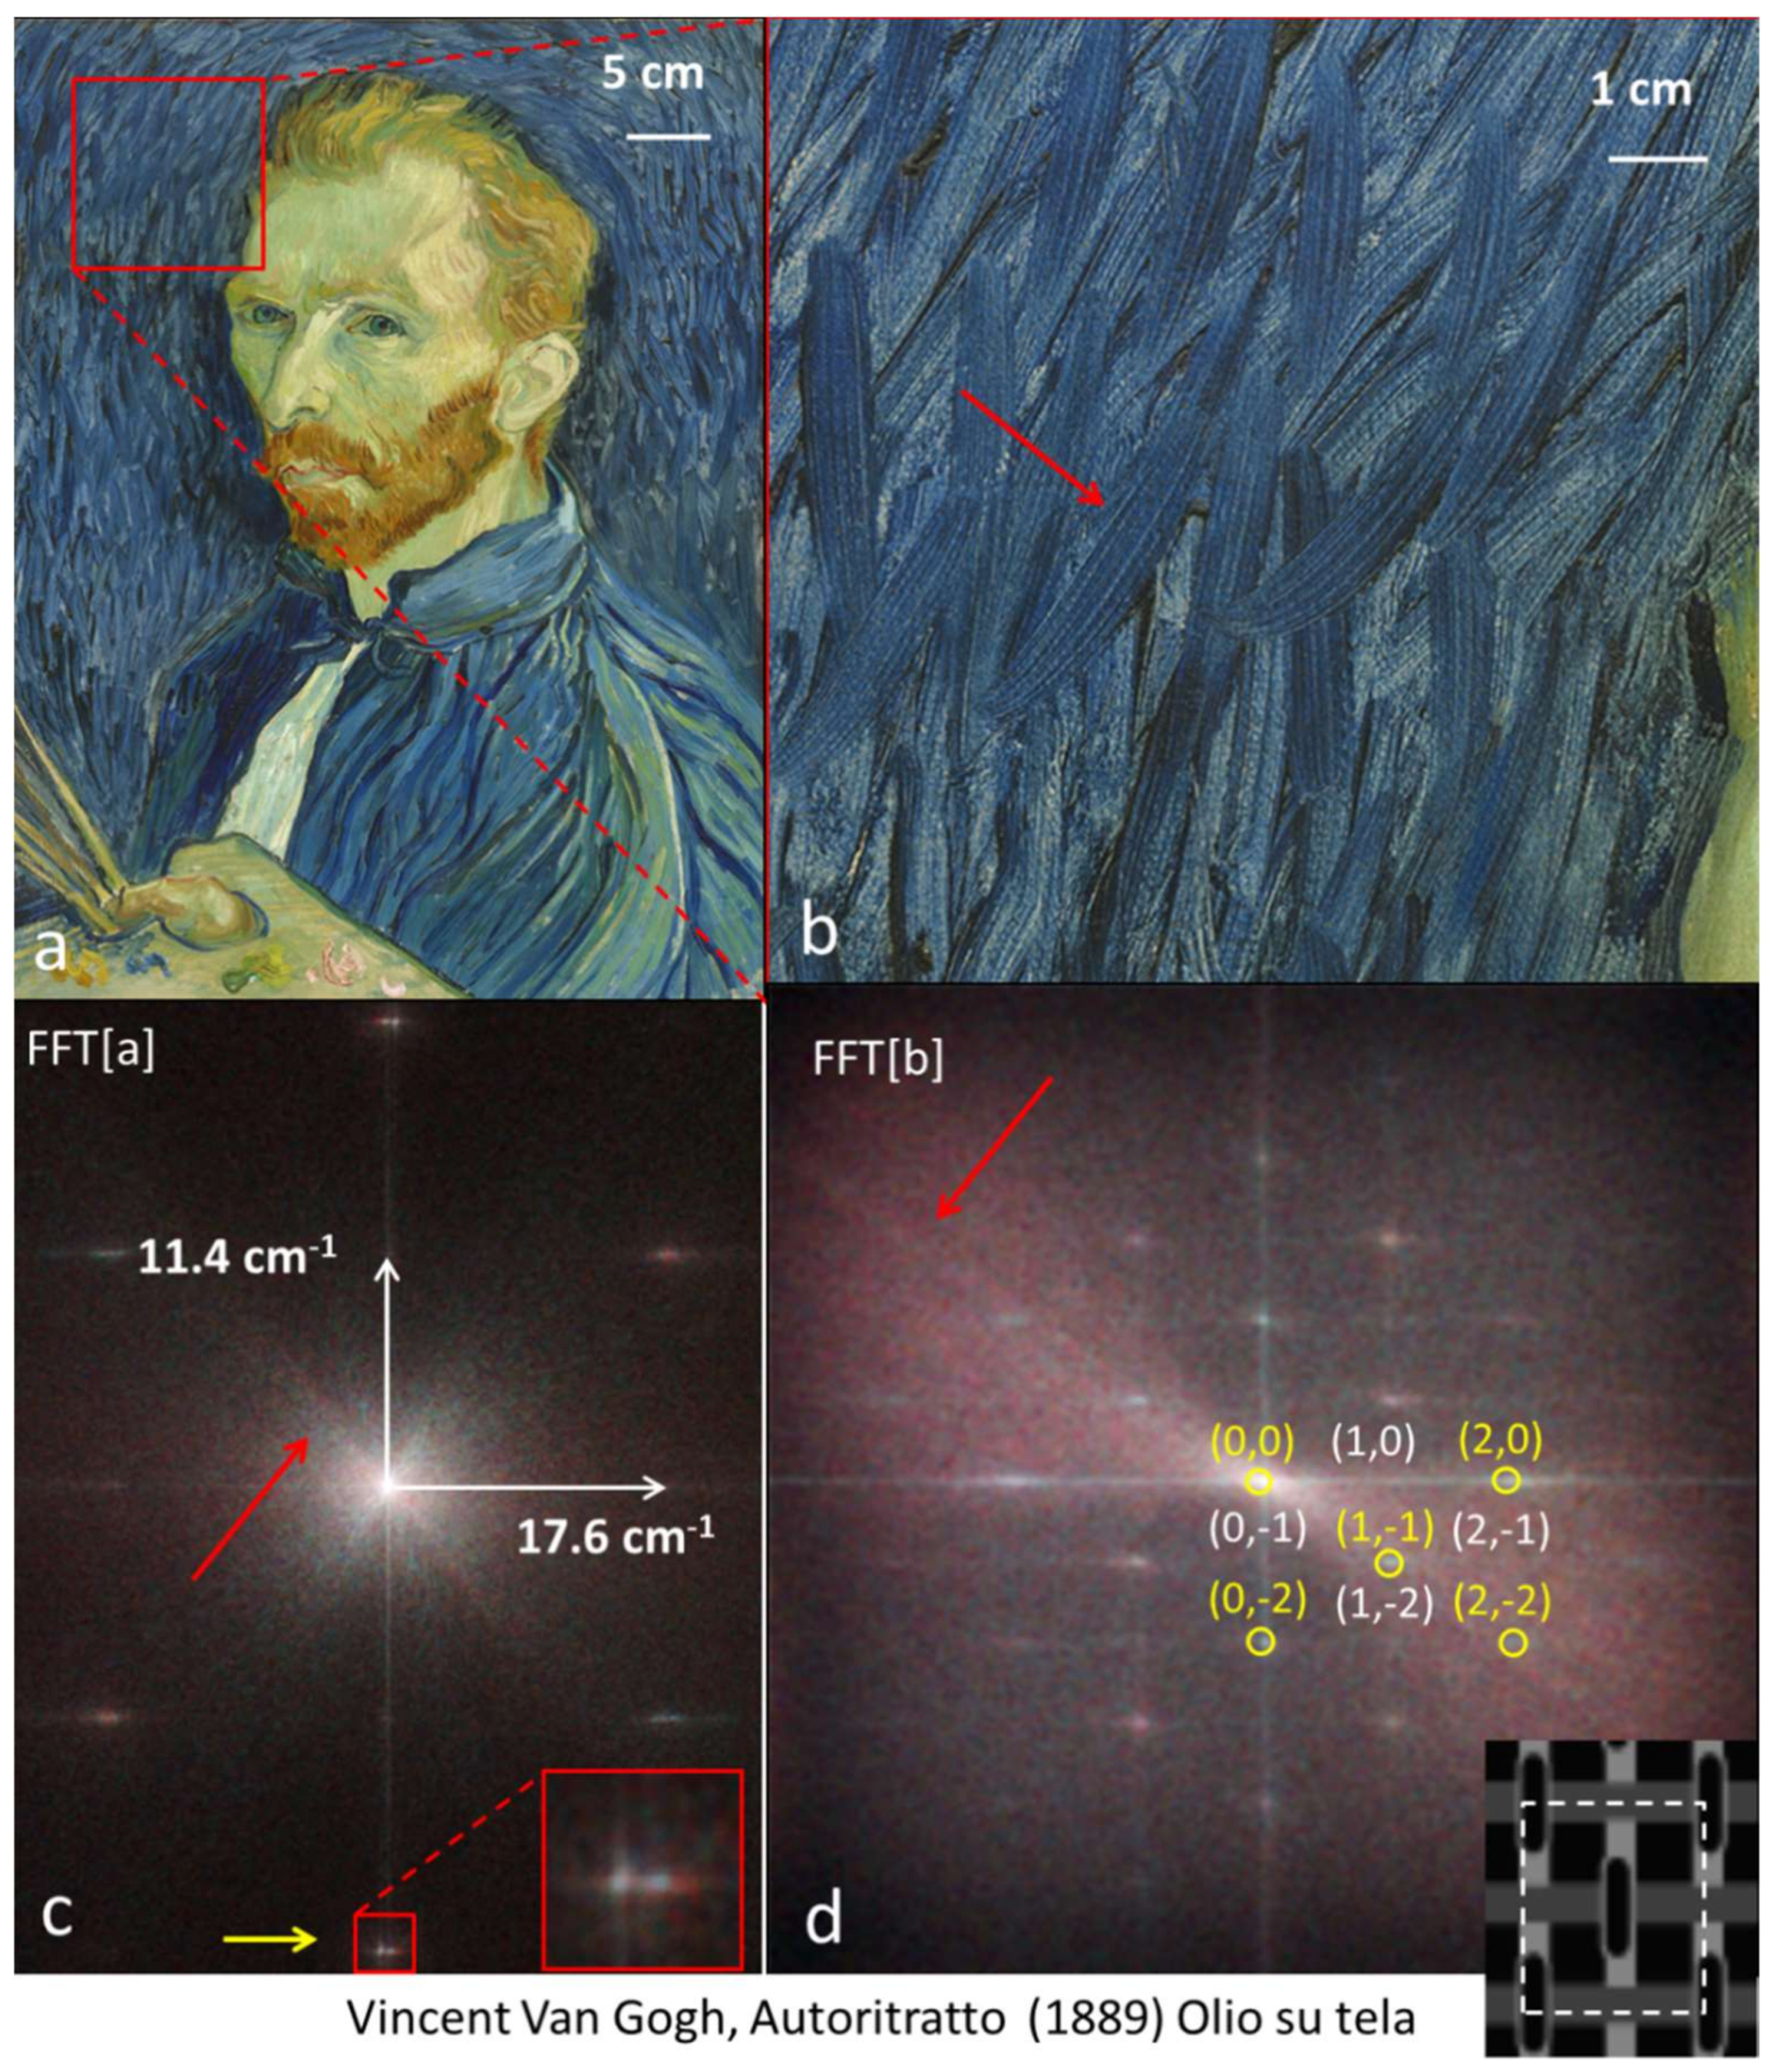
Figure 2a shows a self-portrait by Vincent van Gogh. The painting measures cm2. The image is made up of 4000 × 3068 pixels and is available on the website of the National Gallery of Art [3]. The spatial resolution, therefore, is equal to 0.14 mm/pixel. For comparison, note that the original reflection image transmitted by the Veil of Manoppello, photographed by Paul Badde and analysed in this study, is only a part of the complete one and corresponds to a central area of about cm2 and pixels, with a corresponding resolution of 0.065 mm/pixel. It is this high spatial resolution that allows us to see the periodic structure of the underlying texture, that is, the Veil. In fact, the threads are on average 0.12 mm thick, separated by empty space ranging from 0.18 to 0.25 mm. The spatial resolution of the analysed image therefore describes each rectangle of the texture, generated by the crossing of the warp and weft threads and average size mm2, with approximately pixels. Of these, on average, about 17 correspond to the threads and 12 to the empty space between them. Therefore, every thread, on average, is sampled with 2 pixels and there are 3 pixels in correspondence of the empty space in the vertical direction and 4 in the horizontal direction. Consequently, possible aliasing phenomenon is avoided and the empty space is clearly visible even to the naked eye and contributes significantly to the FT, as shown in our previous study [1].
Figure 2b shows a zoom of Vincent Van Gogh’s self-portrait, corresponding to the red square of Figure 2a. The red arrow in Figure 2b is roughly perpendicular to the average preferred direction with which the colours were spread on the canvas. Figure 2c shows the central part of the FT module of Figure 2a (in the neighbourhood of the main maximum), in logarithmic scale for the spatial frequency amplitudes. The red arrow of Figure 2c shows the beam of straight lines representing the marked rotational anisotropy of the FT around the main maximum and due to the preferential direction used by the artist in rolling out the colours. Figure 2d shows the FT module of Figure 2b, on a logarithmic scale. The red arrow in Figure 2d, perpendicular to the red arrow in Figure 2b, shows, as in Figure 2c, the rotational anisotropic component of the FT due to the preferential direction used by the artist in painting. In yellow, in Figure 2c,d, a peak due to the FT of the weaving of the canvas is highlighted. The red box in Figure 2c shows the magnification around the peak indicated by the yellow arrow. As it can be seen from the zoom in Figure 2c, the peak is split and this splitting indicates the presence of some irregularity in the spatial periodicity of the canvas.
We observe that the FT shown in Figure 2d corresponds only to a portion of the frame, while the FT represented in Figure 2c corresponds to the whole frame, even if only the part around the main maximum is shown. The split of the peak, equal to 12 pixels, implies that the warp of the canvas changes slightly direction—about 1°—in different areas of the painting. Note that the peaks due to the underlying periodicity form a rectangular lattice, as expected. The dimensions in cm−1 of the reticular vectors are shown in Figure 2c. In the FT dual space, the maximum spatial frequencies are equal to the inverse of the semi-dimensions of the image, that is, equal to cm−1 in the vertical direction and to cm−1 in the horizontal. The lattice vectors of the primitive cell in the dual space shown in Figure 2c, having sizes of 11.4 and 17.6 cm−1, are obtained by considering the number of pixels, in the ordinate and abscissa, corresponding to the first secondary peak of the FT. Some of the peaks in Figure 2d were numbered using the crystallographic convention used for periodic lattices, the so-called Miller indices [4], which define the order of the peak with respect to the main maximum, in terms of integer multiples of the lattice vectors shown in Figure 2c. It is noted that the rectangular symmetry of peaks in the FT is body-centred. Indeed, in Figure 2d only the yellow-circled peaks are present while the others are missing. This characteristic can be related to the particular symmetry with which the warp and weft threads intertwined, schematically shown in the lower right-hand panel of Figure 2. In fact, the weaving of the weft and warp threads, in a ratio of 1: 1, allows to identify a centred-body periodic unit cell, having in the centre the same element repeated at its four vertices. This particular symmetry of the weaving causes a destructive interference for peaks characterized by an odd sum of Miller indices and, therefore, they are not visible in the FT modulus.
Let us now consider the Veil of Manoppello. The subtraction of the contribution of weaving from the image of the Veil has been done in the space frequency space (FT). Figure 3 shows the central area of the image transmitted by the Veil when it is illuminated with grazing light: after having corrected the distortions (Figure 3a); after subtracting the contribution of the weaving of the Veil (Figure 3b). From the comparison between Figure 3a,b it is possible to verify, visually, how the subtraction of the periodicity of the underlying Veil weaving does not modify any chromatic component or image detail.
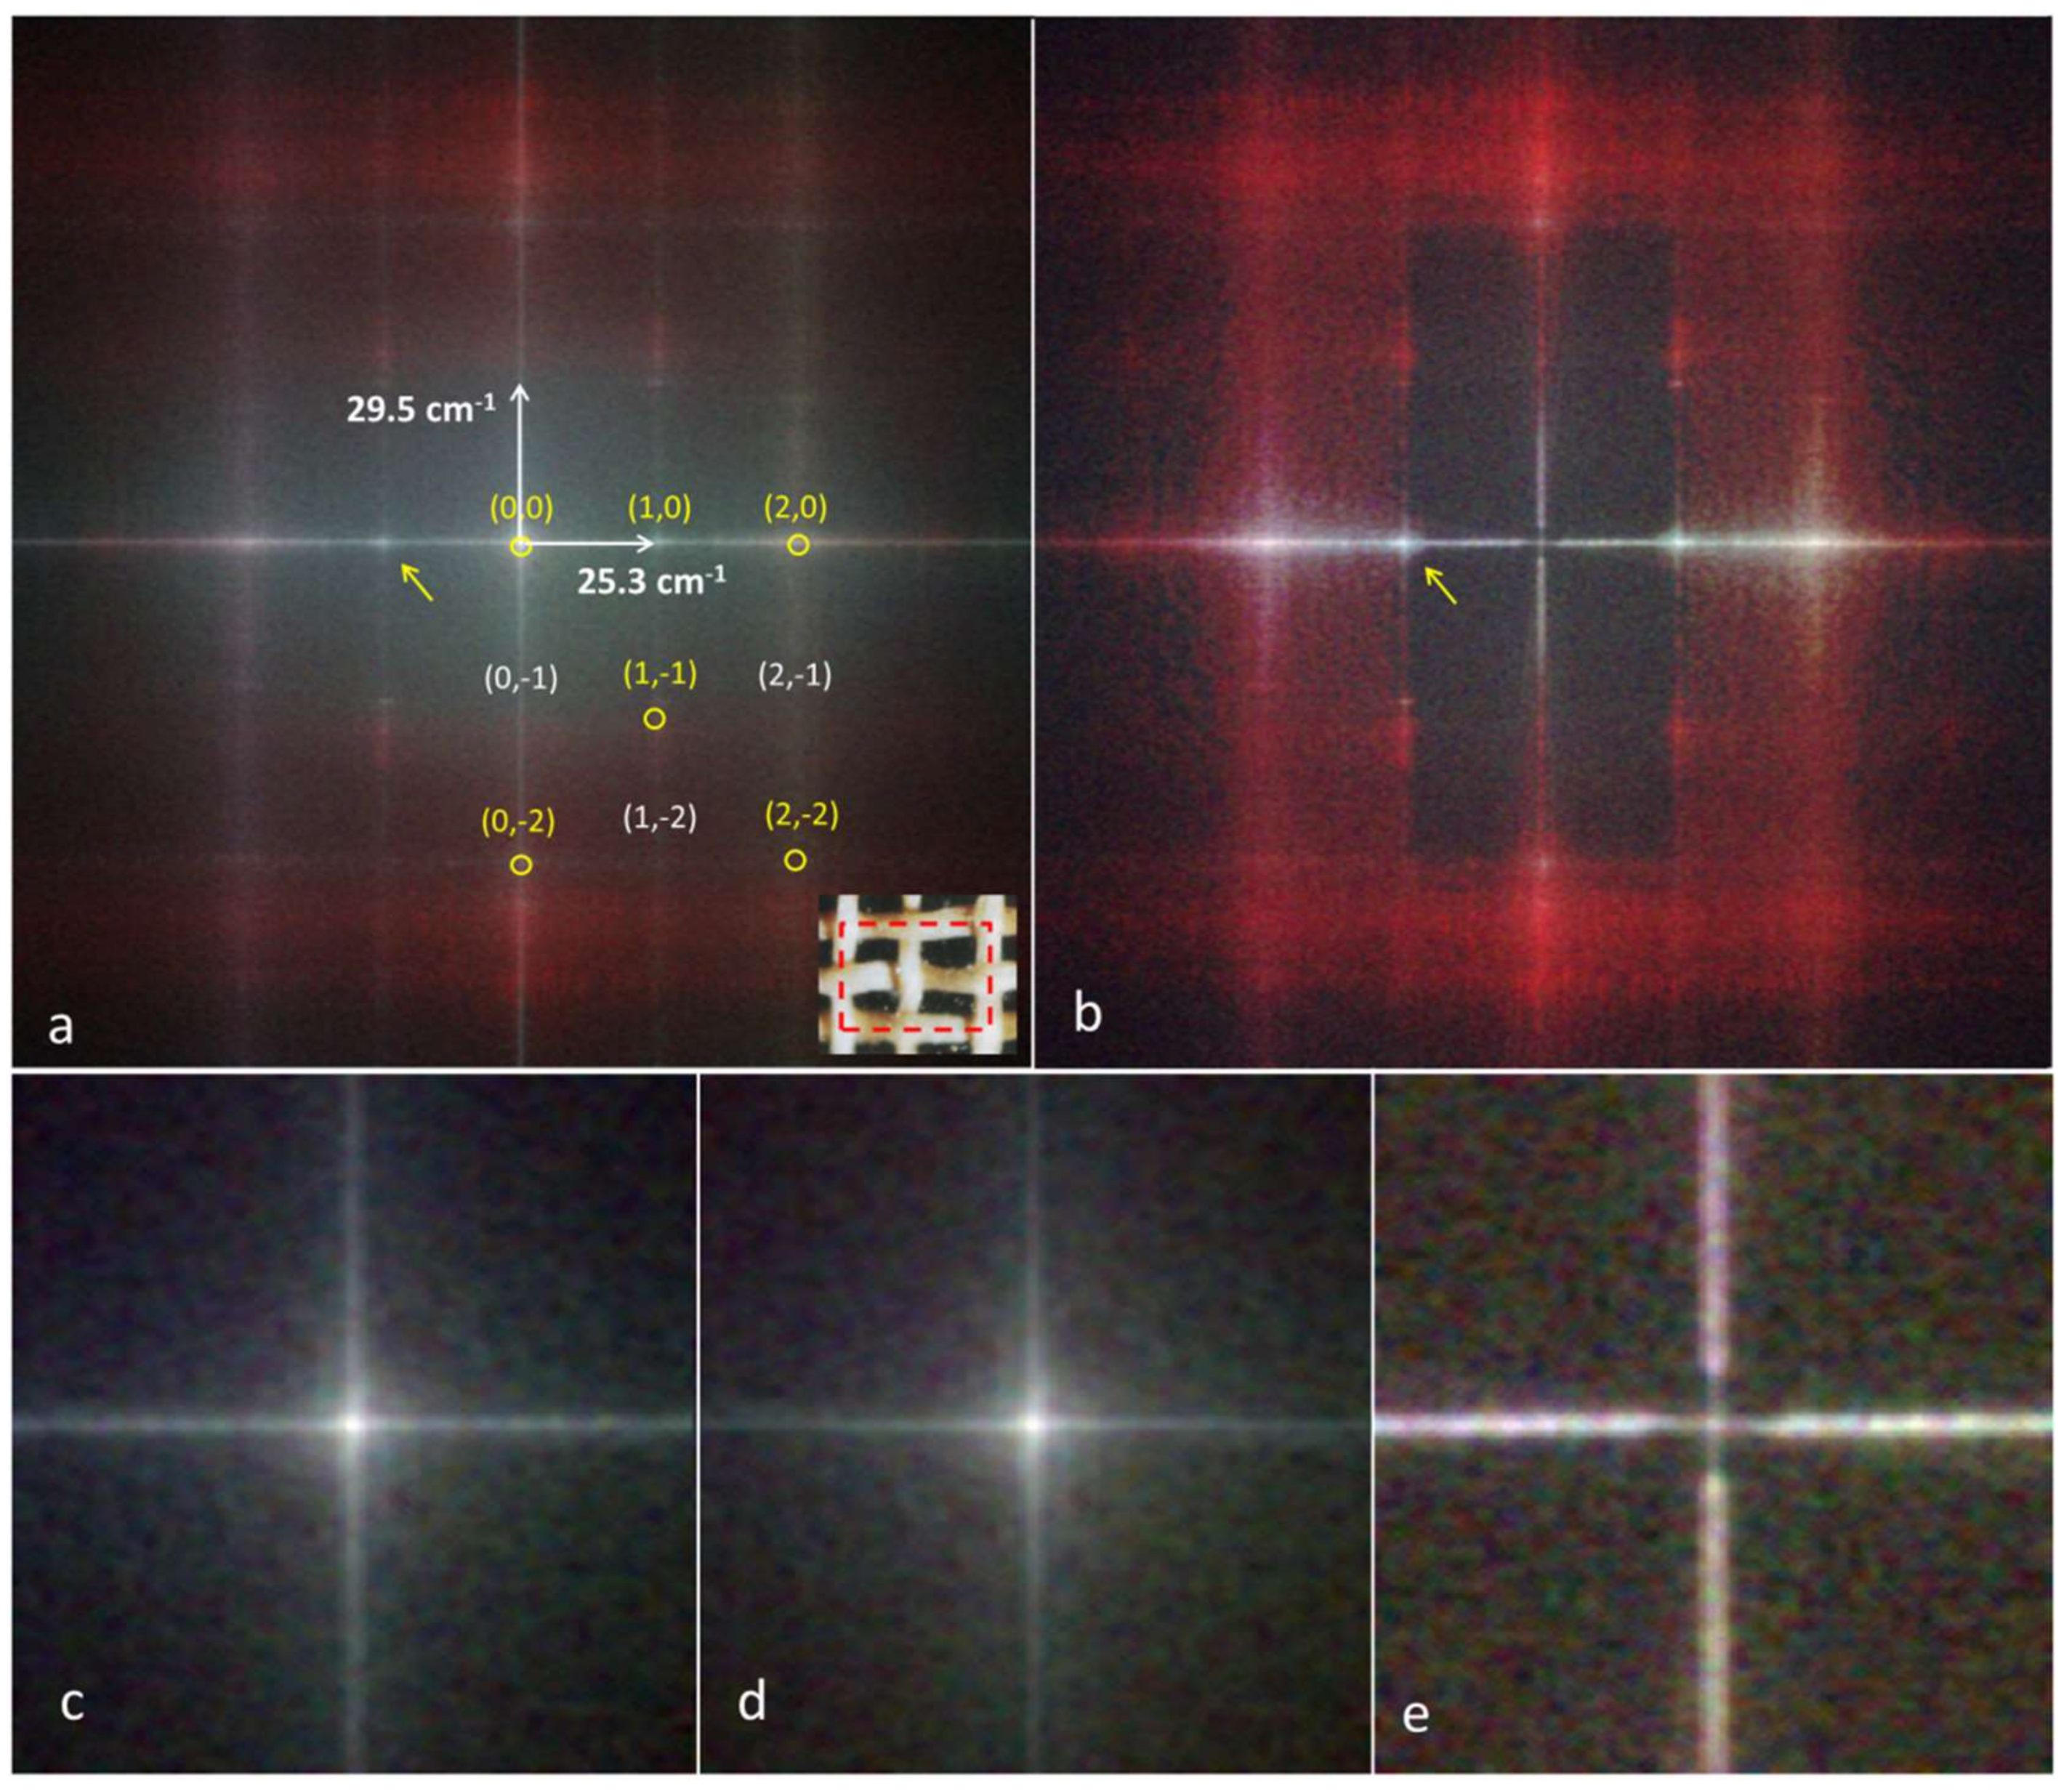
Figure 4a shows the logarithm of the FT of the Holy Face image after the correction of the distortion. In this case the maximum spatial frequencies are cm−1 in the vertical direction and cm−1 in the horizontal direction. Multiplied by the number of pixels, measured in the ordinate and abscissa, corresponding to the secondary peak of the FT closer to the centre of the pattern, we obtain the lengths 29.5 and 25.3 cm−1 of the lattice vectors of the primitive unit cell in the dual space shown in Figure 4a. The contribution subtracted from the FT, due to the periodicity of the texture and to some defects, is shown in Figure 4b. The magnification around the main maximum of the FT is shown in Figure 4c. The magnification around the main maximum of the FT, after the corrections, is shown in Figure 4d; the difference in Figure 4c,d is shown in Figure 4e. The amplitudes of the FT are represented in a logarithmic scale, without subtracting the components at lower spatial frequencies to highlight any rotational anisotropy around the main maximum of the FT which, however, appears to be absent both in Figure 4c, before the subtraction of the contribution due to the weaving and after (Figure 4d). The only anisotropy is given by the cross centred in the origin of the axes, always present when using the Fast Fourier Transform (FFT) algorithm on non-periodic images at the front/back, left/right edges.
At the bottom right of Figure 4a is shown a detail of the periodic unit cell which is roughly repeated in the weaving of the Veil. The image reproduced is taken from a high-resolution photograph. Differently from the results emerged in the analysis of Figure 2, the grid of peaks in the FT spectrum is less defined and does not perfectly respect body-centred rectangular symmetry, as should be for a regular 1:1 texture. Indeed, one of the peaks, with sum of the odd Miller indexes indicated by a yellow arrow both in Figure 4a and in Figure 4b, is present even if it should be forbidden by symmetry. Its presence can be explained by a greater disorder of the vertical threads (warp), compared to the horizontal ones (weft). In many areas of the image, in fact, the space between the warp threads is greater than the thickness of the thread itself. Because of this, the intersection between any two weft and warp threads does not always fall in the middle of the unit cell and, consequently, the perfect periodicity that would have forbidden the peak indicated by the yellow arrows in Figure 4 is only partially satisfied. On the other hand, for the weft threads, the order is greater and they alternate with more regularity, leading to a more periodic spatial arrangement. In addition, from the magnifications around the main peak (Figure 4c,d,f), there is no anisotropy around the main maximum of the FT, in the centre of the figure, as if there were no preferential direction with which the colours are distributed in the image on the Veil.
From the distance of the secondary peaks from the main maximum, that is, from the inverse of the length of the lattice vectors, it is possible to obtain information about the spatial periodicity of the weft and warp: respectively mm and mm. These values, obtained from the position of the peaks in the FT dual space, can be compared with those measured directly in the real space, reported in the first part of the study, equal to and mm. Considering the experimental measurements’ uncertainty, the periodicity values measured in the real and dual spaces are compatible, although the one corresponding to the alternation of horizontal threads - obtainable from a direct analysis in real space by counting the threads in every centimetre of fabric- seems to be slightly underestimated if compared to the more accurate value obtainable from the Fourier analysis (0.31 instead of 0.339).
For another comparison, Figure 5a shows a work by Leonardo da Vinci, known as Ginevra de Benci. It is an oil on panel of cm2. The original image is available from the National Gallery of Art website [5]. Figure 5a shows only the part of the picture corresponding to the face, equal to an area of pixels. Figure 5b shows the area inside the red box of Figure 5a, sufficiently enlarged to highlight details of the paint used and see the presence of cracks. The FT of Figure 5b, shown in Figure 5c, does not highlight any additional peaks due to the weaving of the canvas because the painting is on a wooden panel. At the same time, however, the rotational anisotropy of the FT at the central peak is present, particularly in the vertical direction, certainly due both to the anatomical details displayed and to the technique with which the colours were rolled down. The component of the horizontal movement is dominant, although well hidden by the artist’s ability but still visible in some areas of the image such as, for example, on the upper left eyelids and under the left eyebrow.
The analysis of all paintings of human faces usually shows the rotational anisotropy around the first peak of the FT, as in Leonardo’s painting, despite artist’s mastery. On the contrary, this anisotropy has not been found in the Holy Face of Manoppello, as shown in Figure 4.
Figure 6 shows the difference, in absolute value, between the image of the Holy Face shown in Figure 3a (image with weaving) and that shown in Figure 3b (image without weaving). As it can be clearly seen in Figure 6, what is left after this subtraction is only information concerning the structure of the fabric and some image defects—excessively white or dark pixels—which have been eliminated.
What emerges by an accurate inspection of this figure is that no anatomic detail of the face has been altered by the digital restoration procedure. Consequently, as also evident in Figure 4c,d,e, we have a confirmation that the digital restoration procedure has not altered the main peak of the FT of the Holy Face visible on the Veil of Manoppello. The absence of any rotational anisotropy around the main peak of the FT of the Holy Face could be also related to the particular fabrics over which it is visible. It would have been very interesting to perform similar analyses on portraits realized on fabrics analogous to the Veil of Manoppello. Unfortunately, to our knowledge, there are no other artworks with analogous fabrics and this kind of investigation cannot be made.
3. Optical Analysis and Colour Correction of the Image Transmitted by the Veil of Manoppello
Figure 1 schematically presents the possible configurations of lighting that allow seeing images of the Veil with slightly different anatomical and chromatic characteristics. When the source is beyond the Veil, with respect to the observer, the image acquired depends mainly on the light that has passed through it. Moreover, the light must have a certain grazing angle, to avoid that the beam transmitted through the empty space of the fabric prevents seeing the Holy Face, saturating the observer’s eye with an excessively high intensity. In the configuration we have studied, the one in which the image is transmitted by the Veil and the light is grazing, the light mainly interacts with the lateral surface of the threads and less with their front or back sides, where the possible presence of pigments could be greater. The incident beam, instead, continues almost undisturbed. The light transmitted by the Veil is photographed in a different direction from the incident beam, as shown in Figure 1. If the threads are of linen, as shown in the first part of the study [1], being an ancient fabric, they have undergone the typical process of yellowing, a consequence of the chemical and physical processes of aging. In fact, natural photolytic and chemical processes, which occur very slowly over the centuries, determine the formation of chromophores, through the oxidation of the cellulose polymer chain of the linen molecular structure, which causes the yellowing [6]. The yellowish colour of the ancient linen, when it is illuminated by visible light, is due to the preferential absorption of the higher frequencies (blue), while the lower frequencies, that is, the spectral components of red and green that form yellow, are reflected.
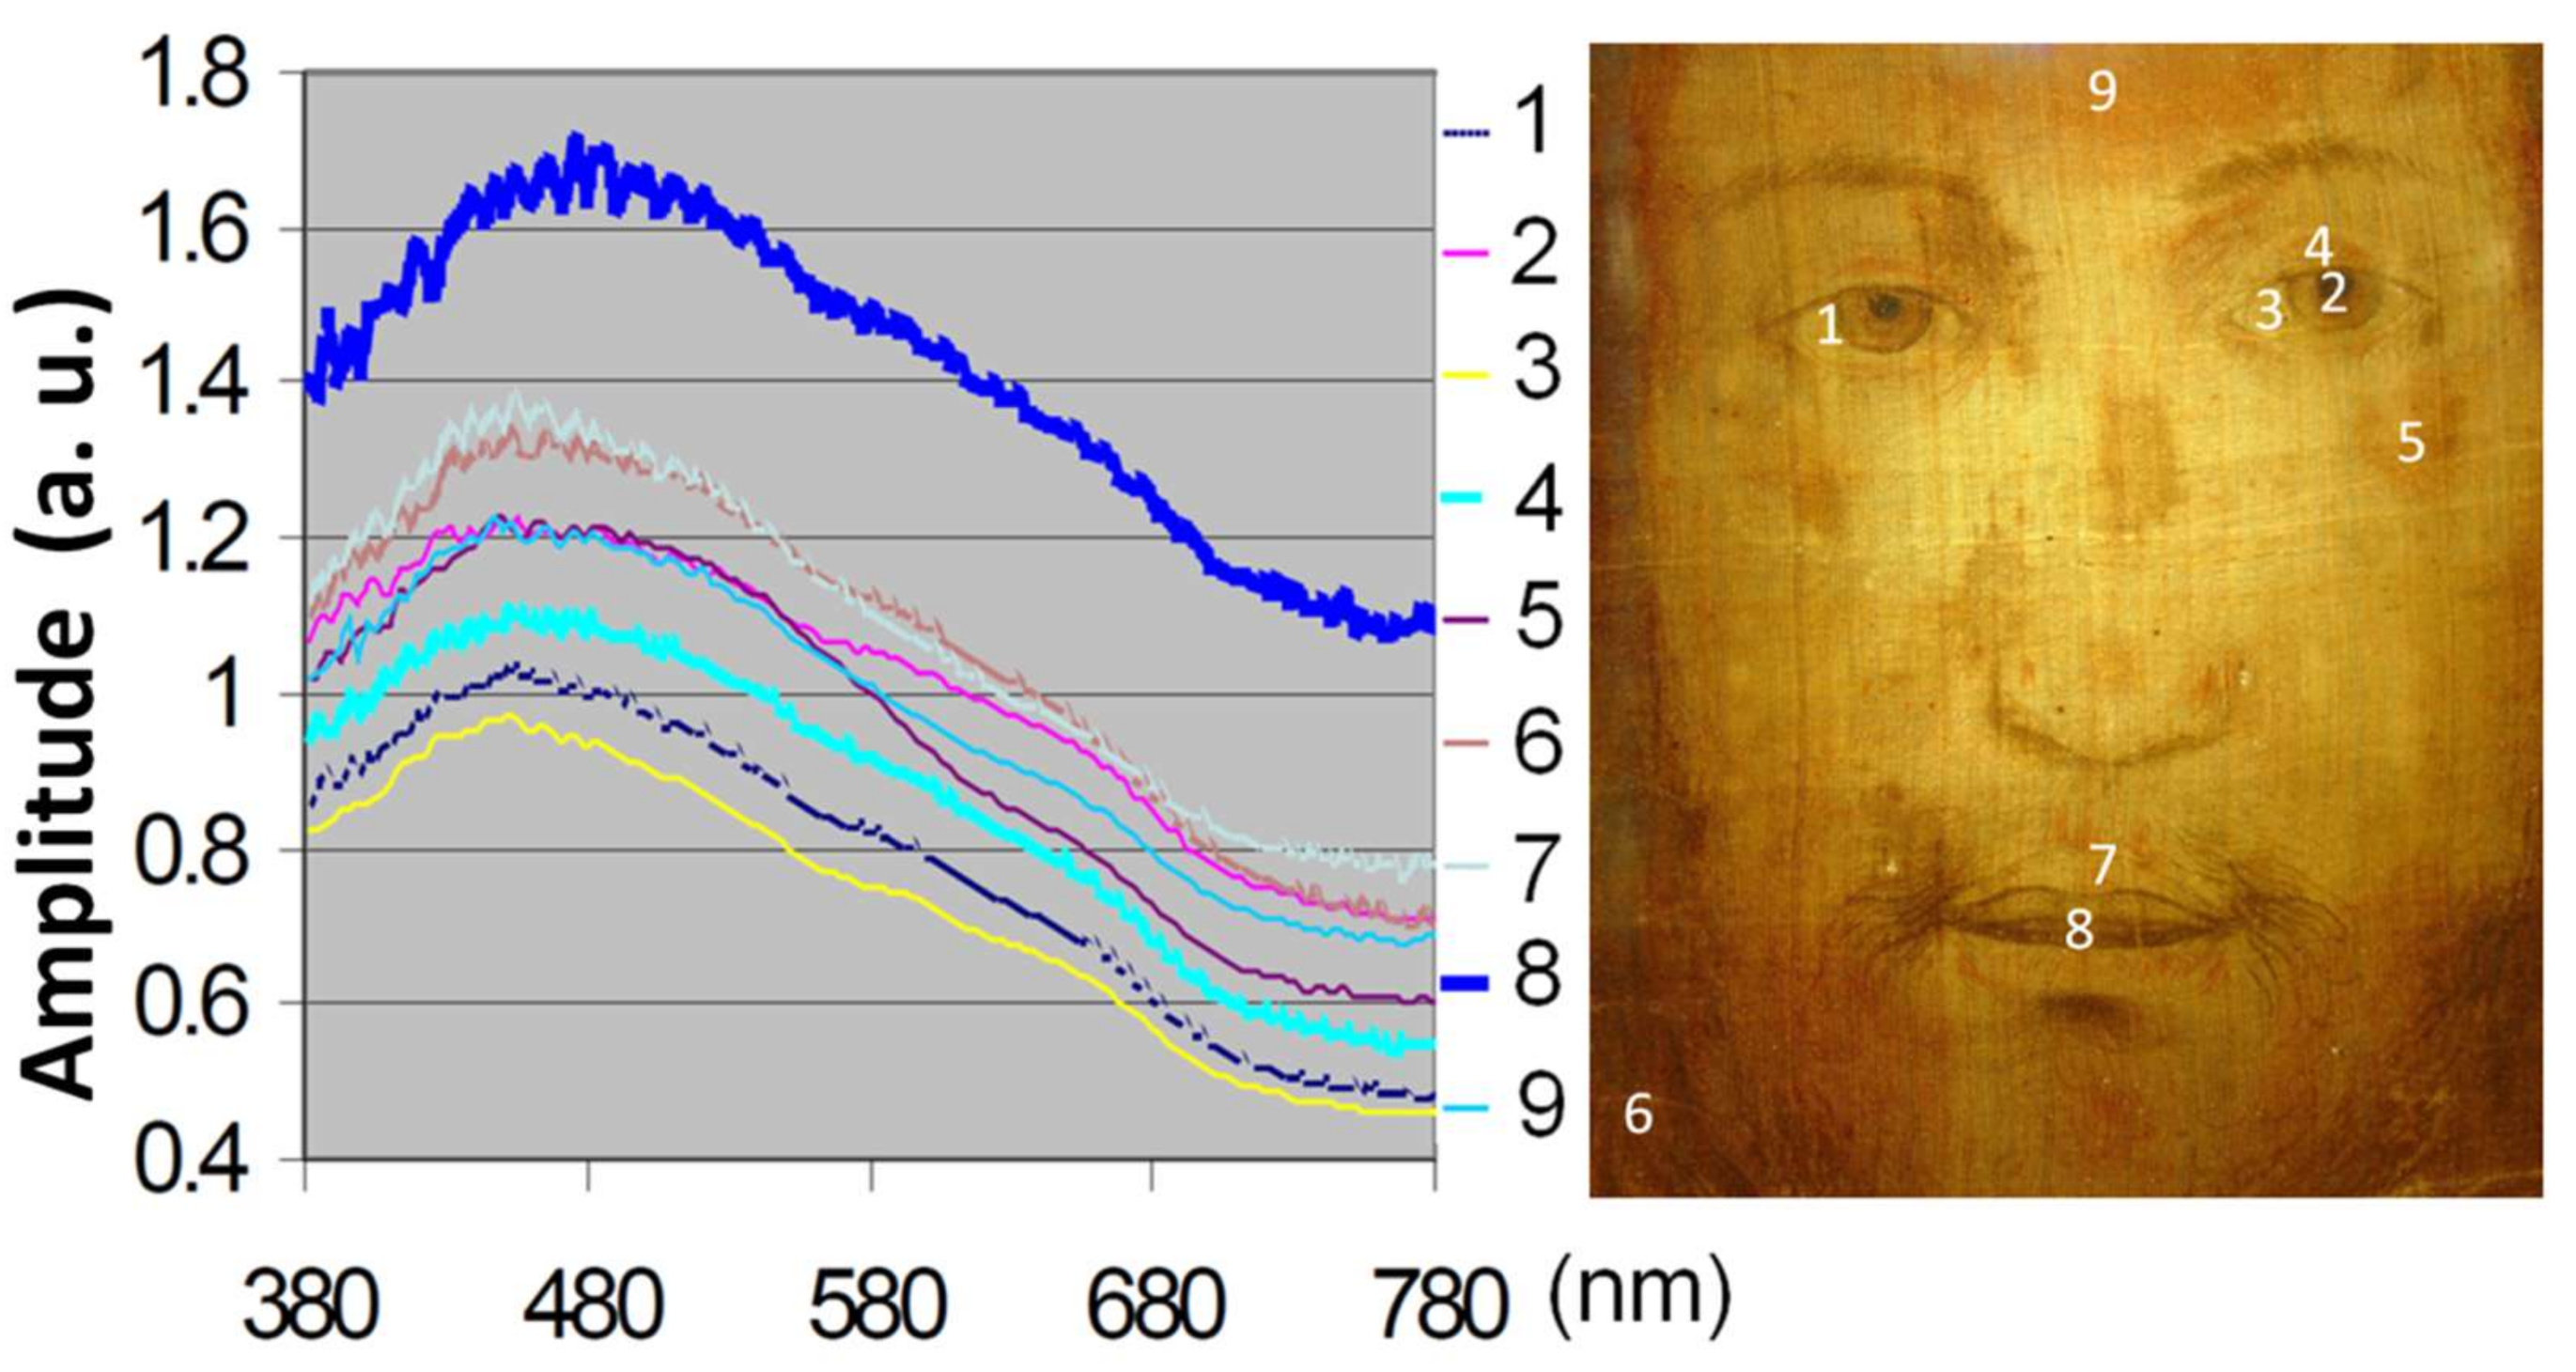
The identification of pigments can be very useful in the study and conservation of polychrome artworks and it is facilitated also by inspection of databases available on-line [7]. Spectrophotometric analysis performed by reflection in some circular areas with a diameter of 2 mm shows only a slight dependence of the reflectance by the measurement point, moving the observational spot in different regions of the image, as shown in Figure 7. Here the complementary of the measured reflectance is shown, to have information about the most absorbed spectral components. The curves, in fact, for all the points of the Veil analysed, regardless of the colours characterizing the analysed areas, show a similar trend as a function of the wavelength, with a maximum between 400 and 500 nm and a minimum around to 780 nm. For this reason, the curves shown in Figure 7 have been drawn with arbitrary ordinate units to avoid superposition. This fact implies that the absorbance of the various areas of the Veil is dominated by a common component, independent of the colour of the area, which can be related to the dominant yellowish colour of the threads. In fact, the characteristic common to all measured spectra is: greater absorbance at smaller wavelengths (the blue is around 450–500 nm); decreasing trend moving towards green (about 550 nm) and even more towards red (about 700 nm). The analysis shows a preferential subtraction of blue at lower wavelength, that is, more absorbed than other spectral components (maximum absorbance between 400 and 500 nm), which can be related to the yellowish colour of the threads. In fact, yellow is obtained by preferentially subtracting blue to white. Consequently, as evident from Figure 3a, the Holy Face visible in transmission is dominated by the yellow component, given the maximum absorbance at low wavelengths in any area of the Veil.
From the quantitative point of view the result of the spectrophotometric analysis shows that green and blue are absorbed, on average, 7 ± 1% and 35 ± 4% more than red, respectively. If 7% of green and 35% of blue are subtracted from white, it is immediately verified that a yellow colour is obtained, very similar to the tonality of Veil fibres enlarged by optical microscope, shown in the first part of the study [1]. In other words, the colour of the underlying threads influences the shades of the whole Holy Face. It is like lighting a white surface with yellow light: the reflected light would be seen yellow, not white. To obtain the true colour of the surface, that is white, it is necessary to take into account the colour of the incident light. It should be underlined that every time an artwork has been realized on a support which has changed colour during the centuries, or just the colours of the painting have suffered alterations, a spectrophotometric analysis and a suitable chromatic compensation could help to restore the original appearance. Indeed, recently, some computational techniques have been proposed to transform the colour changes present in the paintings, caused by aging processes, into compensatory lighting schemes, to project them onto neutral surfaces, to observe the paintings in their original appearance [8]. In the case of the Holy Face of Manoppello, being already a photograph, corrections can be done directly on the image.
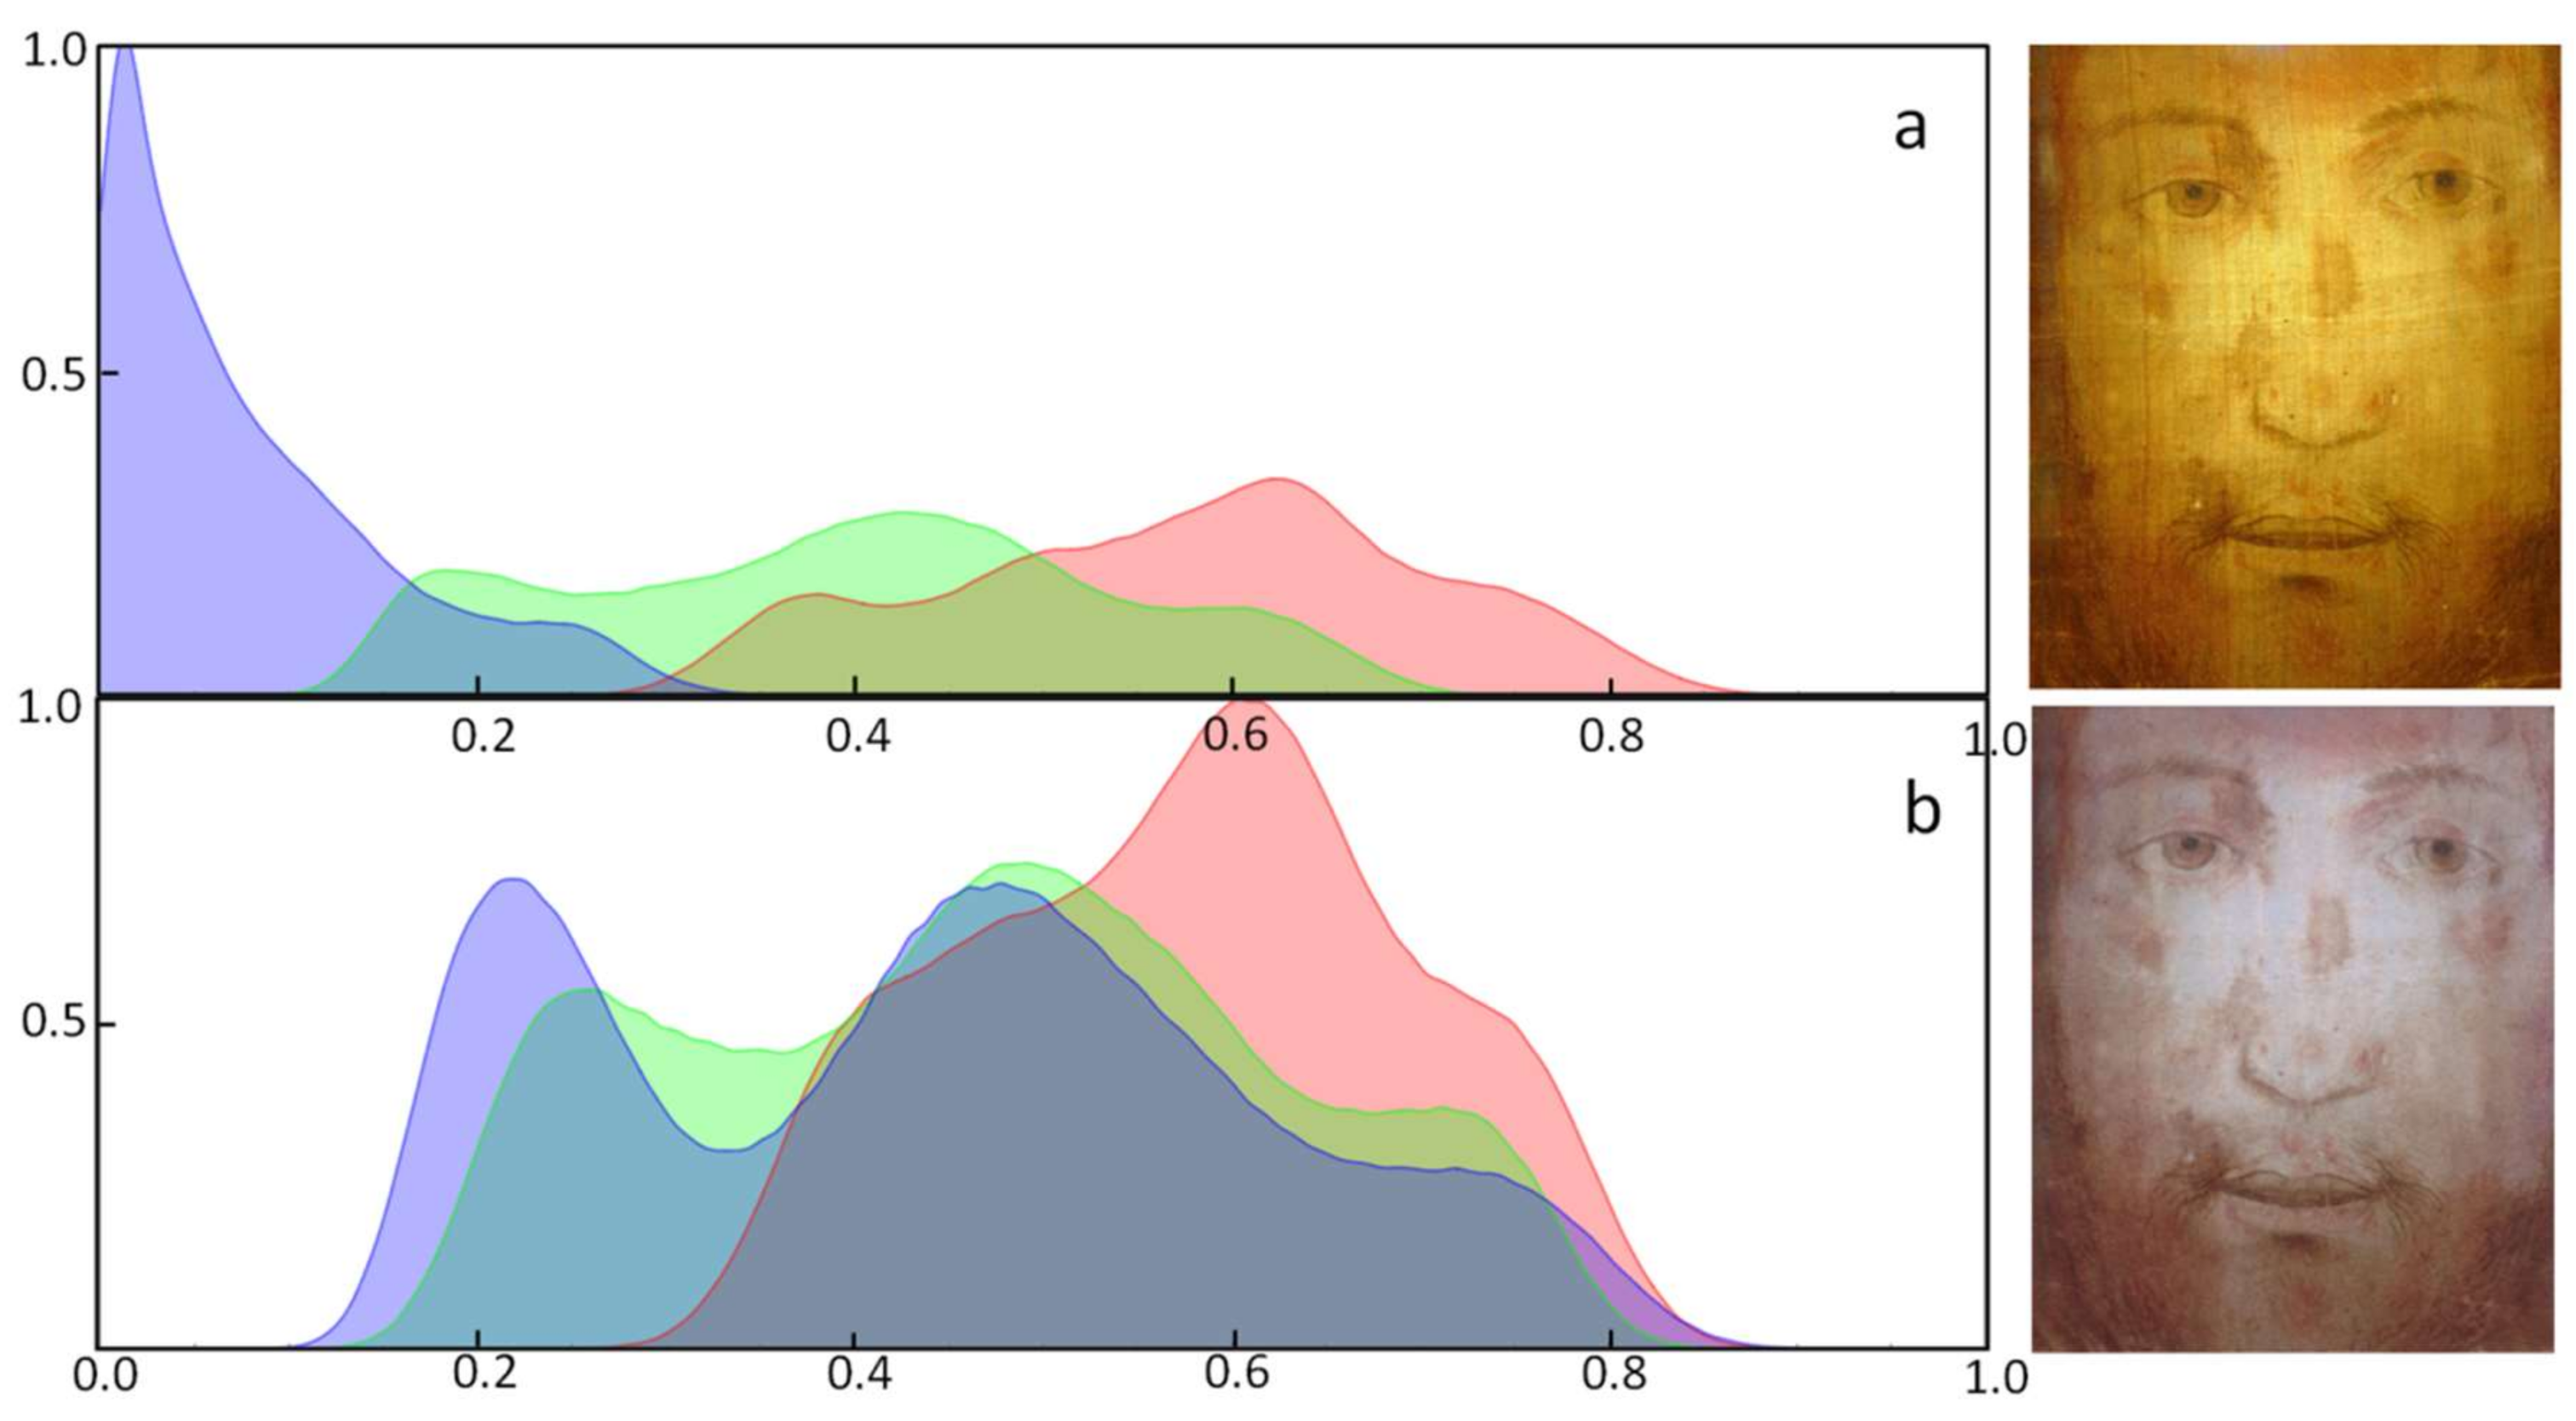
Under the hypothesis that the yellowish colour of the starched linen threads affects the hue of the entire Holy Face visible in transmission, the colours can be partially corrected by adding to each pixel a quantity of green, variable from 0% to 7% and blue, variable from 0% to 35%, with percentages proportional to the total intensity of the pixel of the original image. This procedure increases green and blue colour pixel values of a quantity between 0–7% and 0–35%, respectively. One could repeat this procedure iteratively until the final average colour increments of 7% for green and 35% for blue are obtained. In this way, however, it is possible to compensate only partially the preferential absorption of blue in the light that has interacted with the thin translucent linen fibres. Indeed, this correction procedure cannot restore all the chromatic information because, as shown in histogram of colour components drawn in Figure 8a, the levels of blue are compressed towards very low values. The image behaves as a colour photograph underexposed in the blue component, with an altered symmetry of the distribution of this colour. To compensate this loss of symmetry, at least partially, it is possible to average the blue component of the histogram of the levels with that of a normal (Gaussian) distribution with the same average value. The histogram obtained after the compensation and the balance of the colour level distribution is shown in Figure 8b and the corresponding image is shown in Figure 9.
In an (R, G, B)-image, the values (1, 1, 1) of red, green and blue correspond to white; the values (0, 0, 0) to black. Any other colour assumes intermediate values of the three components between 0 and 1. From Figure 8a, we can see how the blue levels correspond to an underexposed image. From Figure 8b we can see, instead, how the distribution of the red levels has remained essentially unaltered, variable in the 0.4–0.9 range, although there are small variations due to the correction of deformations, defects and the removal of the periodic texture of the Veil. The distribution of green levels has shifted towards a slightly higher average value, from the initial 0.40 (Figure 8a) to the final 0.47 (Figure 8b), an increase equal to 0.07 based on what it has been estimated by the spectrophotometry measurements. The distribution of blue levels, on the other hand, is the one that has undergone the greatest change, from an initial average value of 0.09 to a final average value of 0.44, with an increase of 0.35, as estimated by the spectrophotometry measures. In conclusion, the colour values obtained, after the chromatic restoration, agree with those deducible from the spectrophotometric analysis and the final image obtained is shown in Figure 9. The colours and the Face, that now appear, are more natural.
4. Analysis of Anatomical Details of the Face
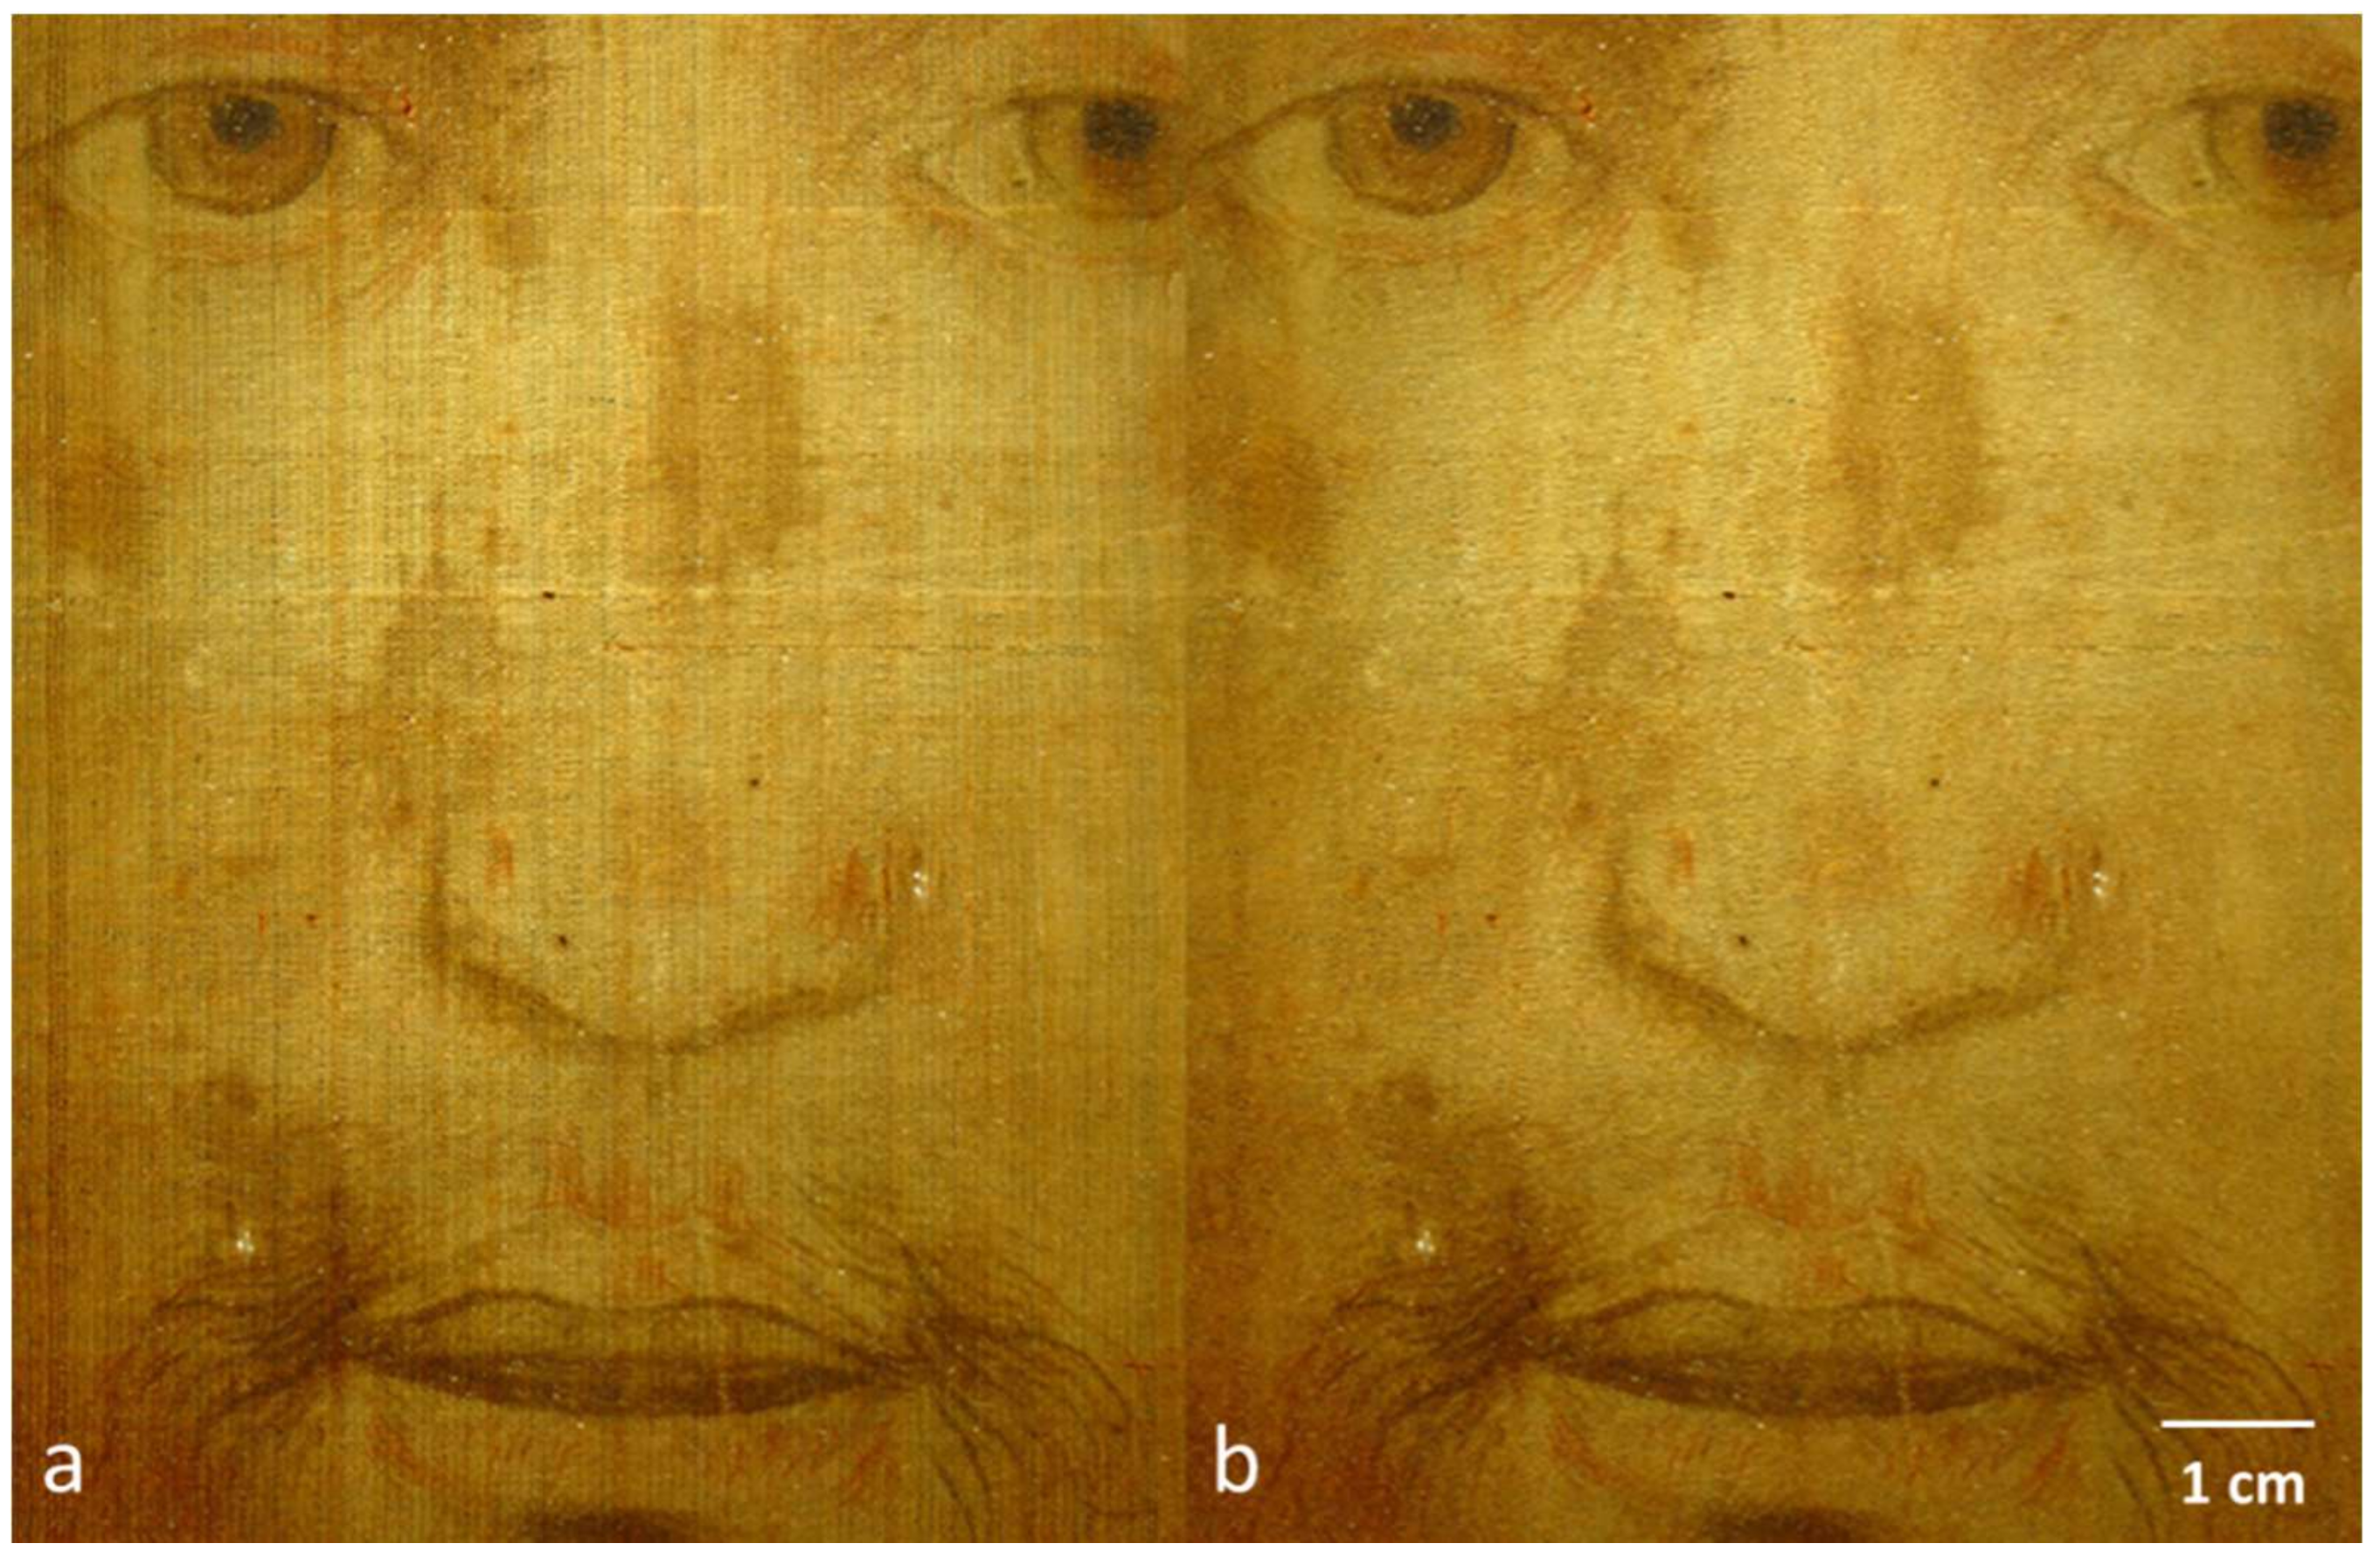
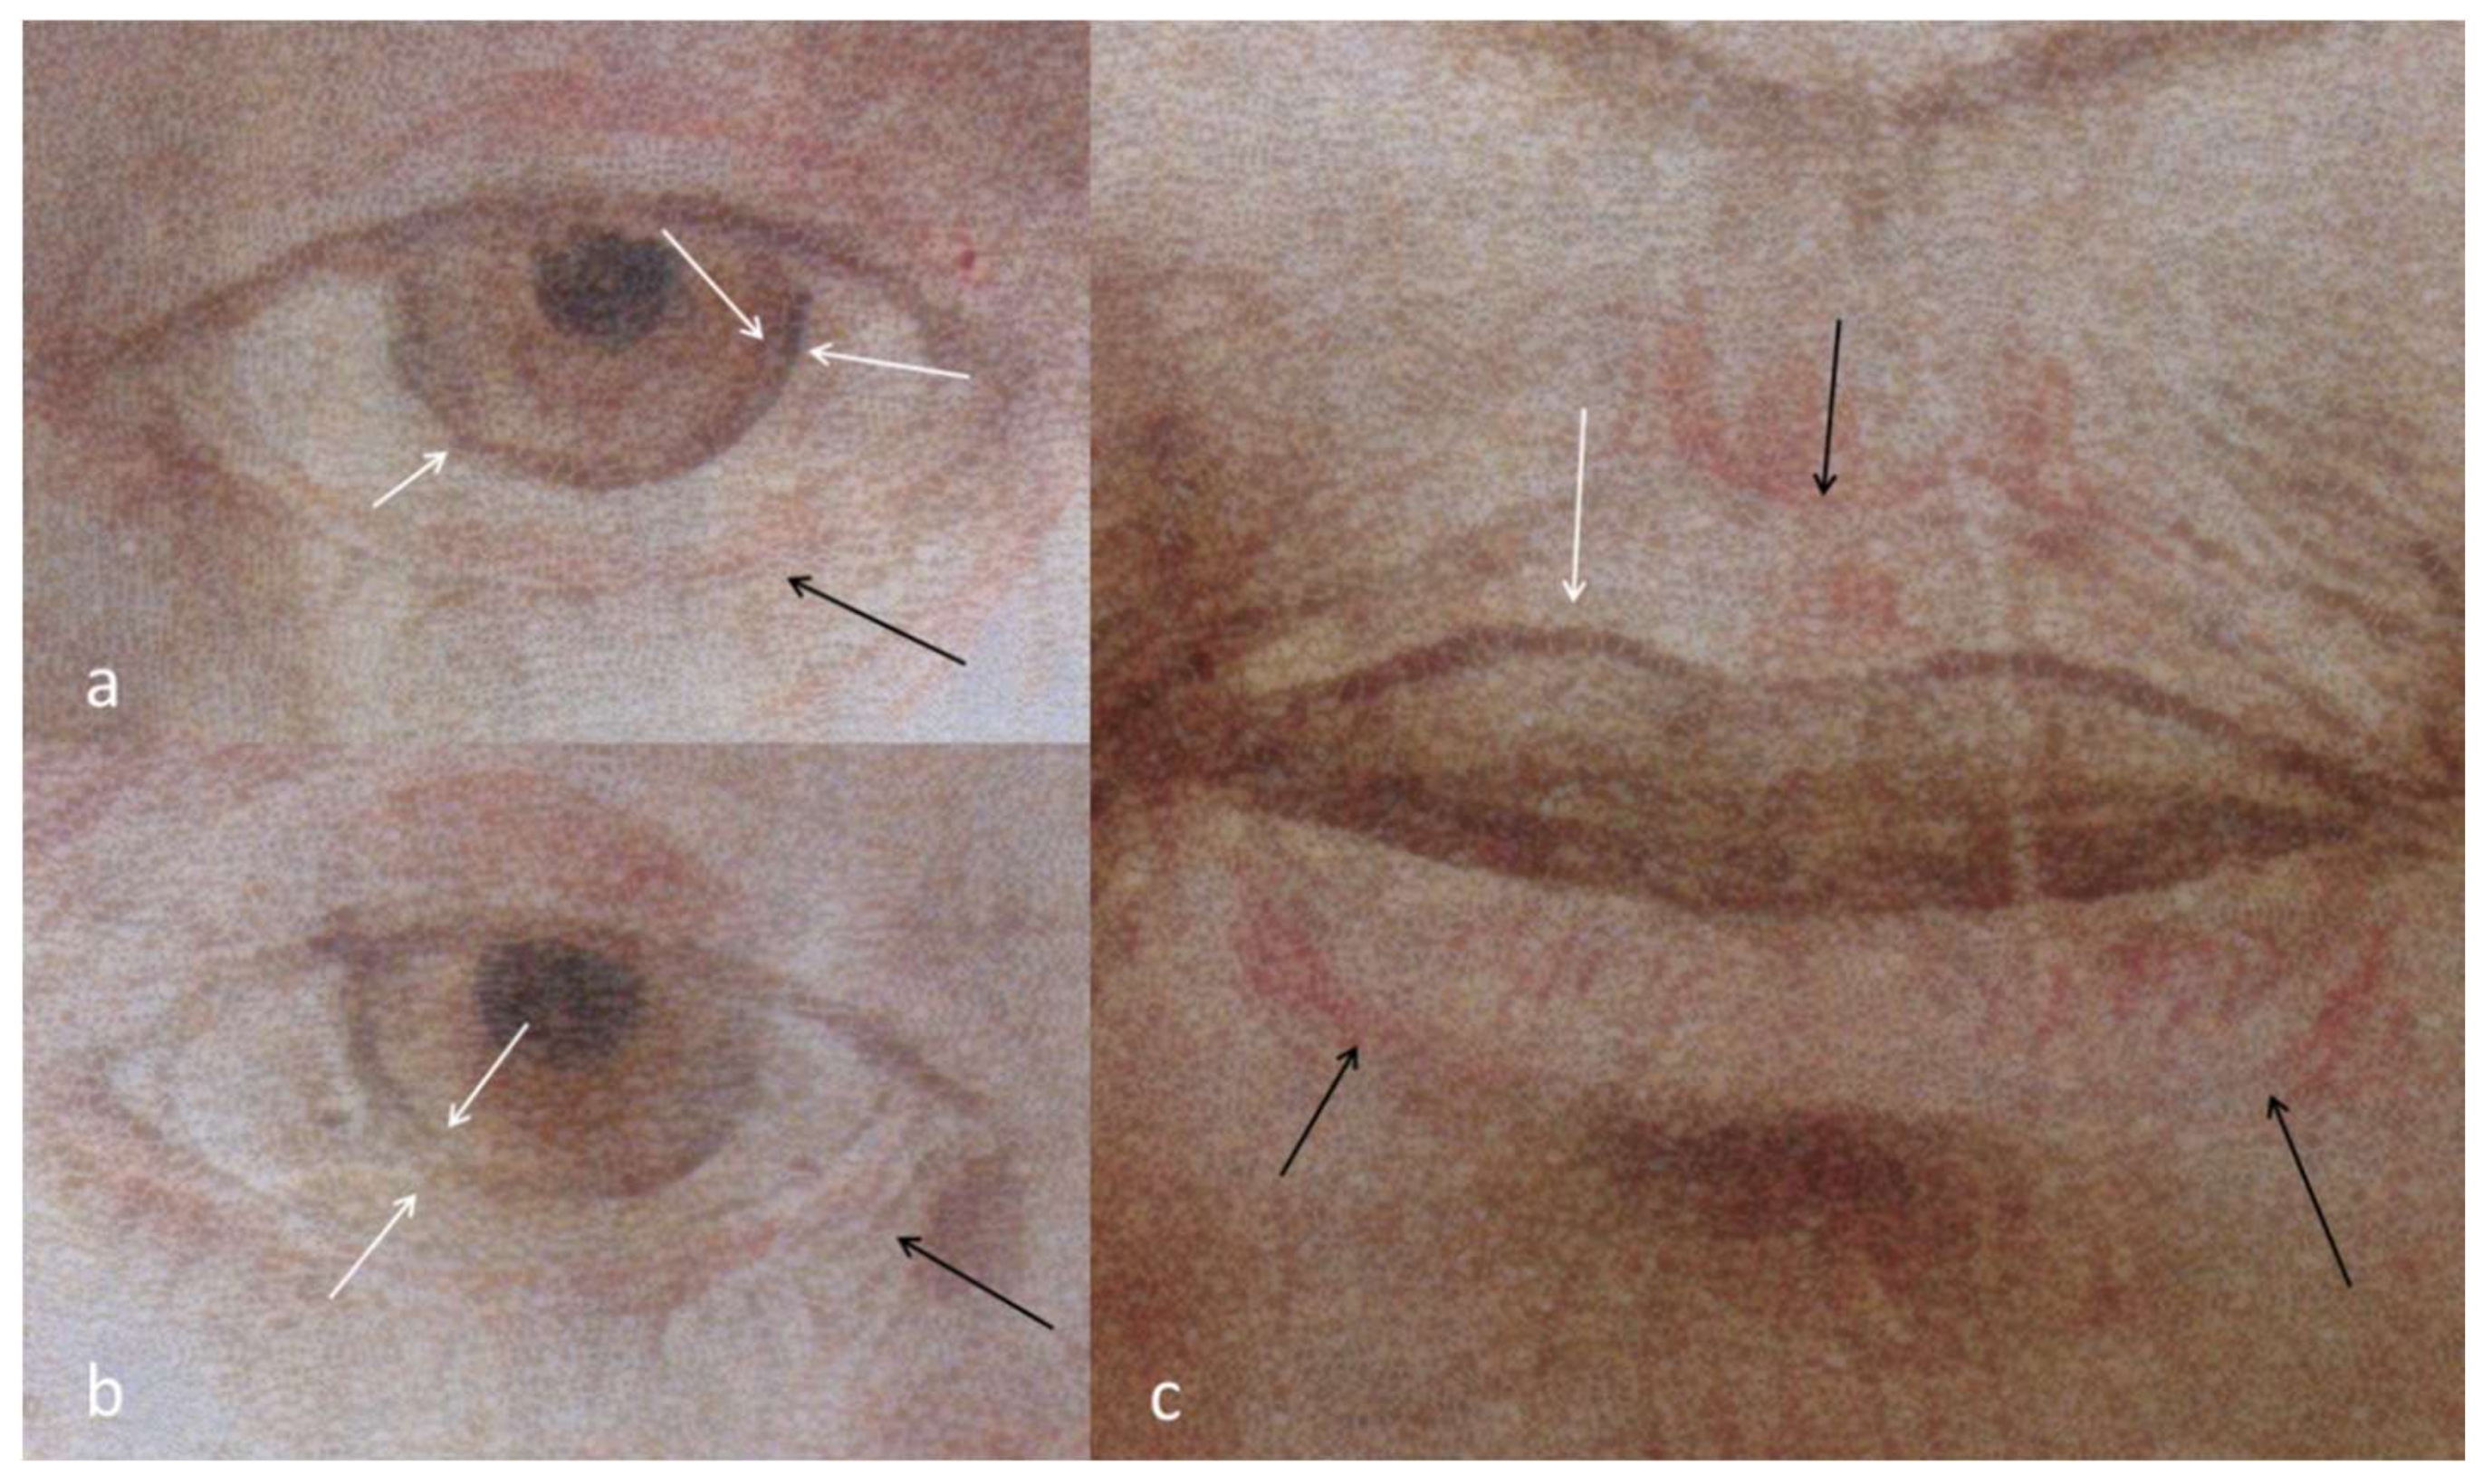
In Figure 10, we have reported some details of Figure 9. From a careful analysis of Figure 10a,b, it seems that the iris contour, the so-called corneal limbo, is double (white arrows in pairs). The colour of the two lines also seems to be different, with the innermost contour of Figure 10a on the brown and the outermost one tending to purple-blue. The profile of the iris also shows broken lines (single white arrow of Figure 10a), unlike what happens in the human eye in which the corneal limbo profile is always curvilinear. The contour of the left pupil is also irregular. On the other hand, the outline of some anatomical parts, such as the terminal part of the eyelids in Figure 10a,b, indicated by the black arrows, is particularly fine. The same applies to some contours of the mouth, shown in Figure 10c by black arrows. Once again, it seems that we were faced with the photograph of a man’s lips, swollen the lower one.
At the same time, however, note how different is the line indicated by the white arrow in Figure 10c, which is very marked, with a thickness similar to that of the stroke of a pencil or a brush. In addition, the part of the lip immediately below this profile is darker than the lower lip and the upper part of the upper lip. Moreover, it contains no traces of red which, instead, is abundantly present both above and below, throughout the remaining region corresponding to the lower and upper lips. All these findings could indicate the presence of touch-ups made by someone on an older icon, the original, characterized by very fine details, so fine to be not well visible on a such thin veil, to induce a pictorial restoration.
The likely presence of some touch-ups can be also deduced from other details, not present in the transmission image analysed by us but reported in the photographs of the whole Holy Face. Indeed, it can be verified that the tuft of hair of the Holy Face, present in the central high part of the Veil, changes as a function of the illuminating conditions.
5. Fractal Analysis through Power Spectrum
It has been shown by several studies that artists create their paintings with statistical properties of fractal type, properties that producing a Fourier power spectrum that decreases with a power law with , where f is the frequency space. This implies that graphic artworks show an invariance of scale, typical of fractals [9,10,11,12,13,14,15]. In fact, by calculating with the method of least squares, the regression line that interpolates the rotational average of the power spectra of portraits of painted human faces, represented in log-log coordinates, we obtain a variable slope between and [15]. On the other hand, in the rotational averages of the power spectra of photographs of human faces ranges from to , depending on whether the background around the face is dark or light [14]. In other words, compared to the portrait painted by an artist, the photograph of the same subject has a lower integral power spectrum, less than 50% of that of the artworks. Moreover, the power spectra of painted natural scenes always show the fractal invariance of scale, with variable around [14,15]. It seems, therefore, that painters make their artworks with similar statistical properties, regardless of whether they paint natural scenes or portraits of human faces. More important for our study of the Veil of Manoppello, the images of portraits of human faces have spectral properties very different from those of the photographs of human faces.
For the present analysis of the power spectra of the images I(x,y), the procedure described in Reference [16] was followed, implemented in the software Wolfram Mathematica. Each image has been resized to pixels by means of a bi-cubic interpolation. Then, the rotational average of the power spectrum PS—i.e., the azimuthally averaged FT square module—is calculated:
Here, u and v are conjugate variable in the FT dual space of the Cartesian variables x and y in the real space. Moreover, denotes the modulus; means change of variables from Cartesian to Polar ones; means average on the azimuth angle ϕ, to obtain the rotational power spectrum PS as a function of the frequency f, conjugate variable in the FT dual space of the radial distance r in the real space. After, with the least squares method, a linear fit to the power spectrum of Equation (1), in log-log scale, has been performed, that is, by applying the power law transformed into the line
For slope estimation, a critical issue in any power spectrum, only a significant and agreed upon frequency range must be used, in this case the frequency range from 10 to 256 cycles per image, to minimize the effect of artefacts that usually occur at lower frequency (less than 10 cycles) or higher (over 256 cycles). The main result of the fit is the slope and the deviation , that is, the error, between the experimental points and those of the power law, calculated as the square root of the sum of the squares of the errors divided by the number of points. The result is shown in Figure 11.
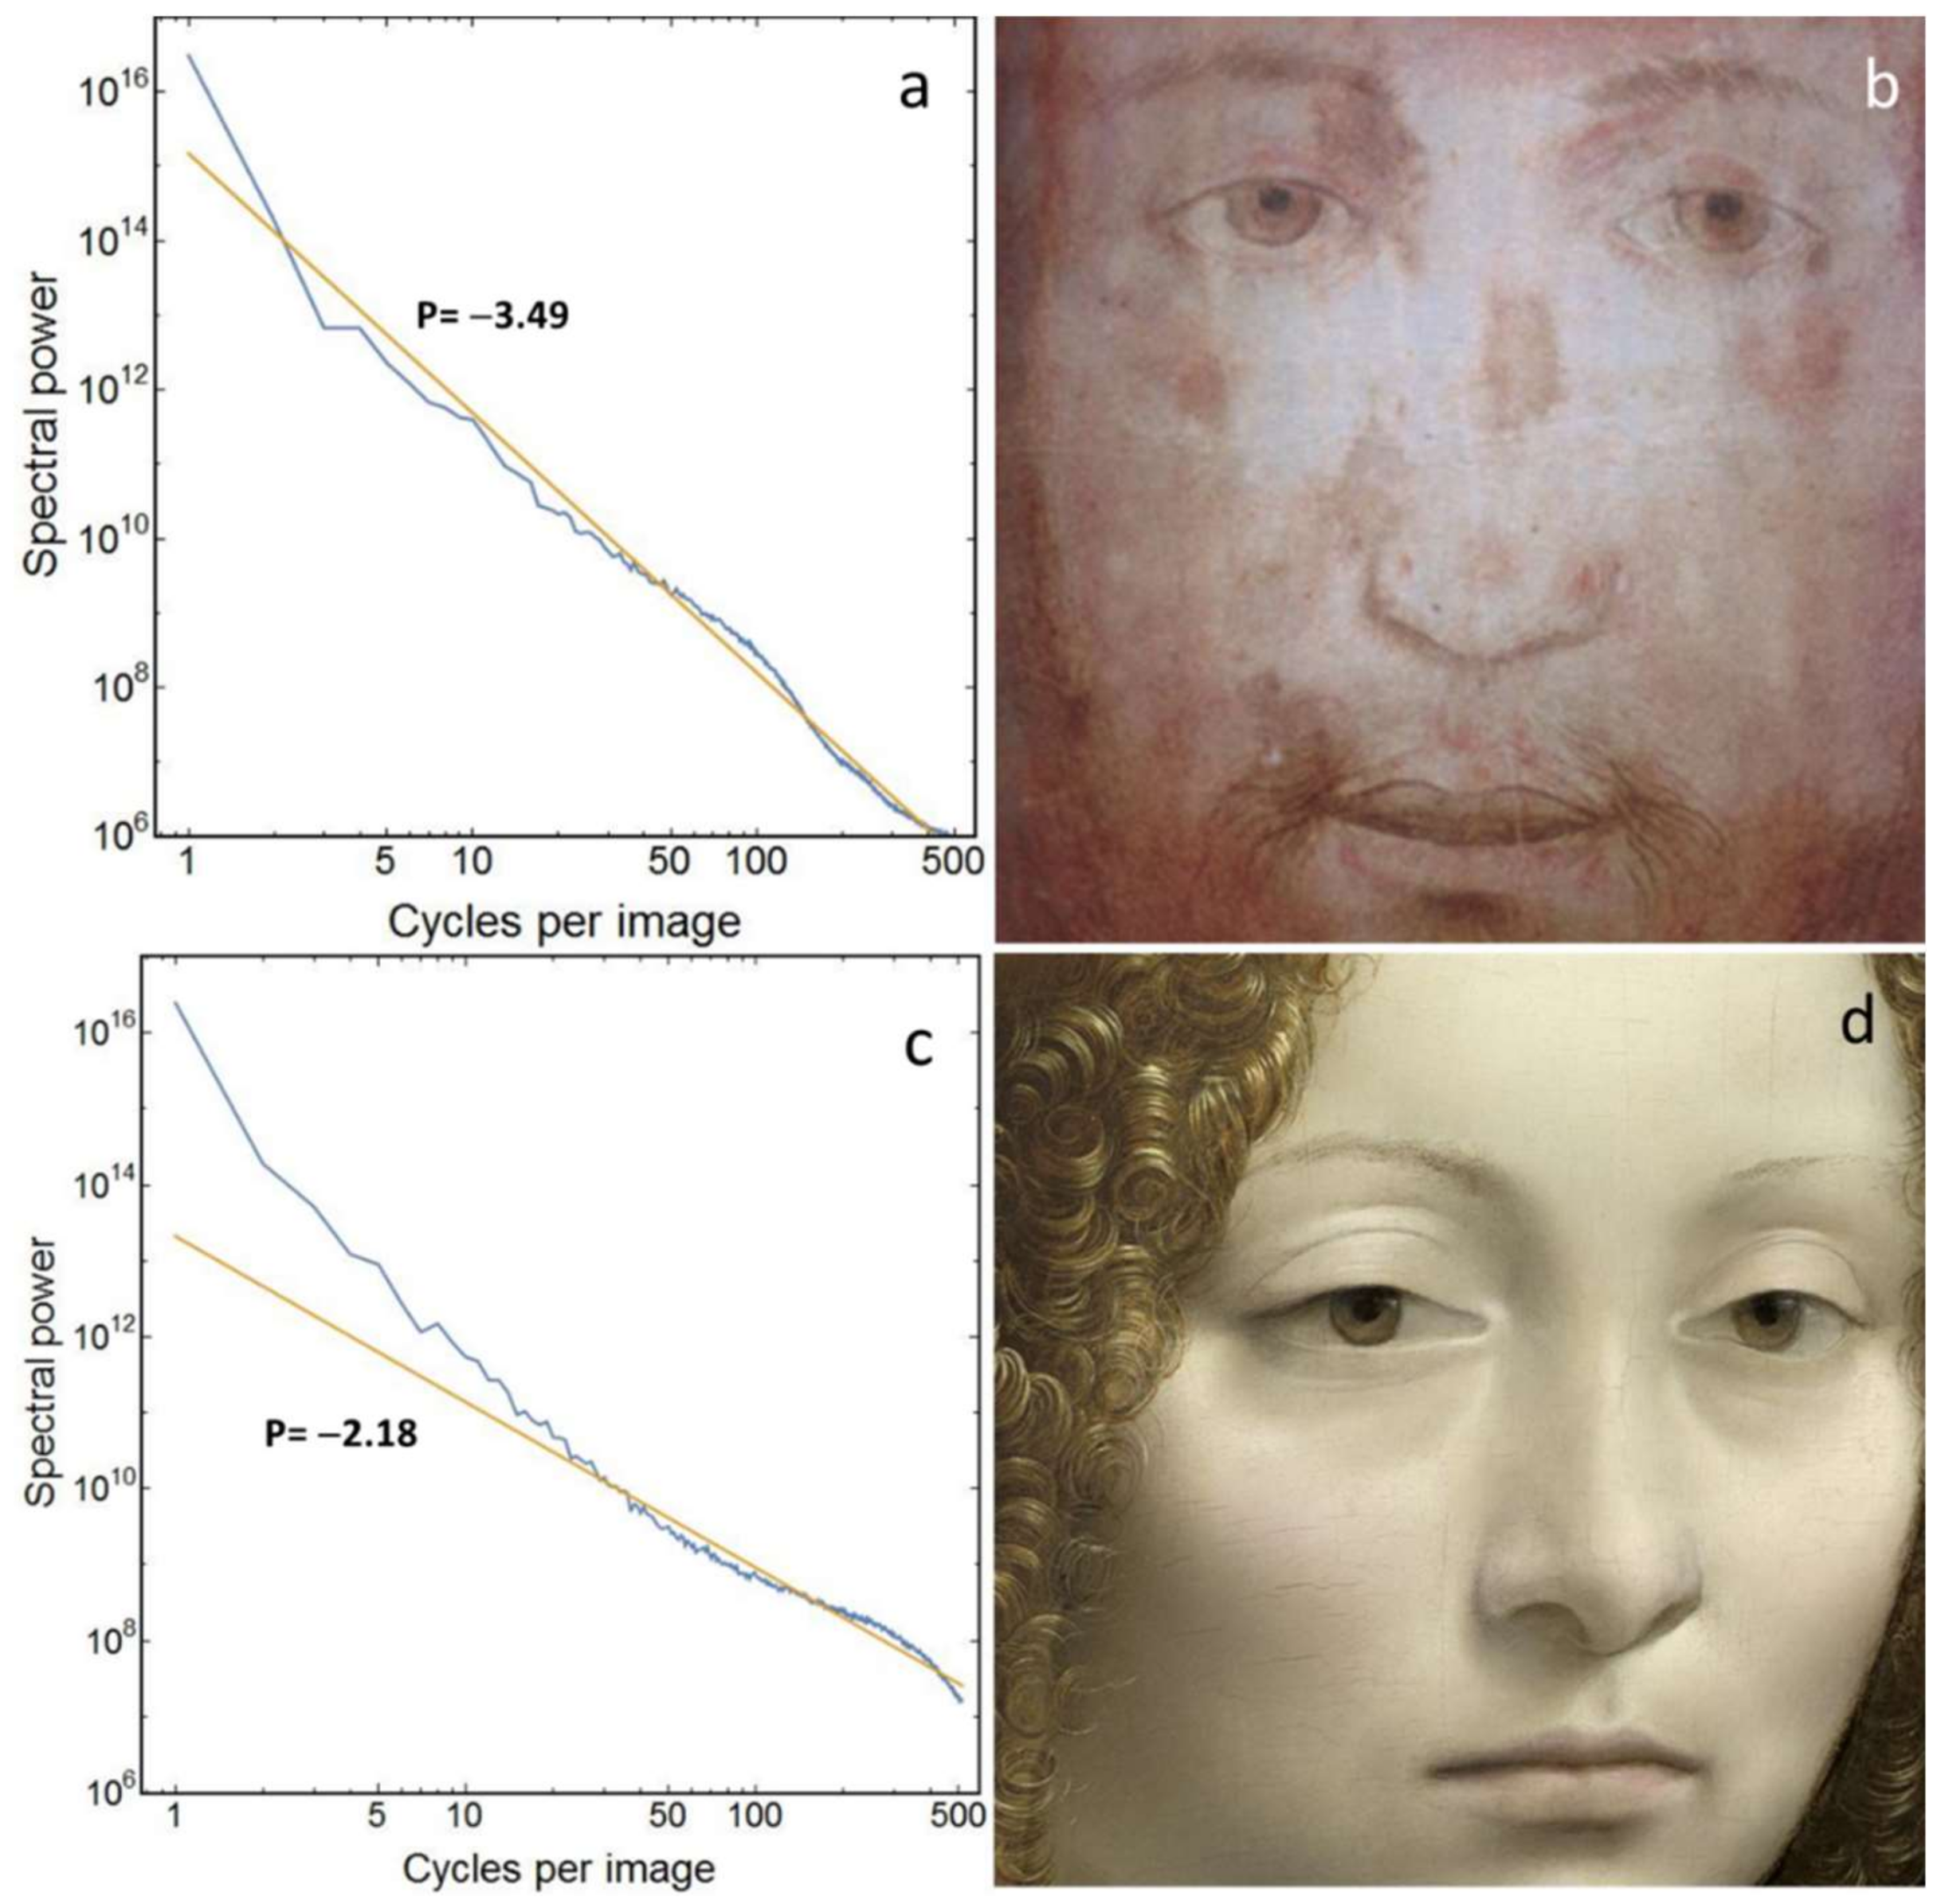
By imposing a 95% confidence level in the estimate, the following values are found for the Holy Face of Manoppello: and . For Leonardo’s artwork, the values are: and . It is important to note that the power spectrum of the Holy Face of Manoppello, very close to a straight line in the Cartesian log-log plane for a large range (as shown in Figure 11a) is fitted by a value that correlates itself very well with those fitted to the spectra of photographs of human faces. Moreover, it deviates very much, beyond any possible statistical fluctuation, from the value fitted to portraits, , obtained on a statistical sample of 306 paintings [14].
In this regard, it should be noted that the aforementioned statistical sample [14] derives from images that were originally in black and white or, at most, in soft colours. On the other hand, if portraits in oil colours are considered, for a sample of 147 artworks [14]. However, the statistical analysis of the deviations for this sample of oil artworks shows that they are very compressed at low values, if compared both with the images of the photographs and the portraits belonging to the statistical sample of 306 works, in which we have . The maximum value of for the sample of 147 oil artworks, in fact, is equal to 0.025. In this regard, note that, unlike the results shown in Figure 11, the oil paintings depicted faces on a fairly broad background, so that the average ratio of the distance between the eyes and the entire image was equal to 15.5% [14]. For comparison, the part of the Manoppello Face of Figure 11b has a ratio of about 50%, while for the part of Leonardo’s painting of Figure 11c this ratio is about 45%. Obviously, the analysis on enlarged dimensions of the faces implies that, at low values of the spatial frequencies in the interval up to 20–30 cycles per image the anatomical details give contribution to the rotational average of the power spectrum quite different by those obtainable by a fractal scale invariance, contributing substantially to increase the values of . Moreover, anatomic details in these enlarged views of faces are better depicted, thus giving an effective contribution to the higher spatial frequencies of the power spectrum. Conversely, views of faces, which occupy only partially the whole portraits, could give only limited contribution at larger spatial frequencies because finer anatomic details would be only poorly displayed. Therefore, such low values of for the 147 oil works considered in Reference [14] could be largely due to the lack of finer anatomic details in representations of faces too small. In fact, as shown by the example of Leonardo, the analysis of the power spectrum of a region completely belonging to the face increases both the values of the slopes, which return to be similar to those typical of fractals and the deviations from the power law’s values. A similar result is obtained with the central area of the face represented in the self-portrait of Van Gogh, also a colour oil painting. With a ratio of the eye distance to the total image size of 47%, and . These findings explain why in the statistical sample of 147 oil portraits [14] the slopes are, in absolute value, systematically much higher than those in which human faces fill almost the entire painting. They also explain why the deviations are systematically much lower, due to the smallness of the painted human faces and, therefore, also of all the anatomical details.
6. Conclusions
The results of the optical measurements carried out on the Holy Face of Manoppello and the particular transparency of the thin threads of the Veil, with thickness of the order of 0.1 mm, have led to the conclusion that it is made of linen, presumably translucent because starched. The colours of the image transmitted by the Veil, as a consequence, is dominated by the contribution of the support, that is, from the yellowish background coming from the fabric, because ancient linen and the starch have just this colour.
A quantitative evaluation of the preferential absorption of the blue chromatic component, with respect to the others, obtained from spectrophotometric measurements, has allowed to restore the colours of the Holy Face, when seen in transmission in back-lighting conditions. The image restored chromatically presents shades more similar to the skin colour of the human face. An accurate analysis of the image seems to show the presence of two different styles: the first almost photographic in the definition of details, the second with visibly marked traits. Moreover, the images obtained under different conditions of observation and illumination show different anatomical details, which could imply that someone has retouched an older icon. Even the analysis with infrared and ultraviolet seems to indicate the possible presence of some adjustments. The image of the most ancient Holy Face would be visible in transmission, while the successive retouching would be more visible in reflection.
The analysis of the rotational average of the power spectrum of the image obtained after a digital restoration—in which the weaving of the Veil, the deformation of the face caused by distortion of the threads and the yellowish background due to the ancient linen have been removed—provided a log-log scale slope, as a function of the spatial frequency, comparable to that found in photographs of human faces. This result should be related to the presence of the almost-photographic style with which some anatomical details—lips, eyes and so forth—appear in the Veil.
Given all the above considerations, to further assess the actual chemical composition and structure of the Veil of Manoppello and to clarify the question of the presence of possible artwork retouches, it would be desirable to perform a new optical characterization of the icon by means of new experimental non-destructive tests. In particular, it would be useful to characterize the spectral behaviour of the Veil also in a transmittance mode [17], to compare the results with those obtained in a reflectance mode and, in this way, to obtain more experimental data to identify possible pigments.
Author Contributions
All authors have contributed to write the paper and discuss the results. L.D.C. performed the spectral analysis and G.F. the spectrophotometric measurements on the Veil.
Funding
This research received no external funding.
Acknowledgments
Conflicts of Interest
The authors declare no conflict of interest.
References
- De Caro, L.; Matricciani, E.; Fanti, G. Imaging analysis and digital restoration of the Holy Face of Manoppello—Part I. Heritage 2018, 1, 289–305. [Google Scholar] [CrossRef]
- Fanti, G. Relazione Tecnica Sulle Indagini Eseguite sul Volto Santo di Manoppello; Technical report; Archive of the Sanctuary of Manoppello: Manoppello, Italy, 2010. [Google Scholar]
- National Gallery of Art, NGA Images, Open Access Image Download for Vincent Van Gogh. Available online: http://images.nga.gov/en/search/do_quick_search.html?q=vincent+van+gogh (accessed on 12 September 2018).
- Miller, W.H. A Treatise on Crystallography; Pitt Press: Cambridge, UK, 1839. [Google Scholar]
- National Gallery of Art, NGA Images, Open Access Image Download. Available online: https://images.nga.gov/en/page/show_home_page.html (accessed on 12 September 2018).
- Mosca Conte, A.; Pulci, O.; Knapik, A.; Bagniuk, J.; Del Sole, R.; Lojewska, J.; Missori, M. Role of Cellulose Oxidation in the Yellowing of Ancient Paper. Phys. Rev. Lett. 2012, 108, 158301–158305. [Google Scholar] [CrossRef] [PubMed]
- Cosentino, A. FORS spectral database of historical pigments in different binders. E-Conserv. J. 2014, 2, 57–68. [Google Scholar] [CrossRef]
- Hech, J. Light repairs art: Optical overlays restore faded masterworks. Opt. Photonics News 2015, 26, 40–47. [Google Scholar] [CrossRef]
- Burton, G.J.; Moorhead, I.R. Color and spatial structure in natural scenes. Appl. Phys. 1987, 26, 157–170. [Google Scholar] [CrossRef] [PubMed]
- Tolhurst, D.J.; Tadmor, Y.; Chao, T. Amplitude spectra of natural images. Ophthal. Physiol. Opt. 1992, 12, 229–232. [Google Scholar] [CrossRef]
- Ruderman, D.L.; Bialek, W. Statistics of natural images- scaling in the woods. Phys. Rev. Lett. 1994, 73, 814–817. [Google Scholar] [CrossRef] [PubMed]
- Ruderman, D.L. Origins of scaling in natural images. Vis. Res. 1997, 37, 3385–3398. [Google Scholar] [CrossRef]
- Simoncelli, E.P.; Olshausen, B.A. Natural image statistics and neural representation. Annu. Rev. Neurosci. 2001, 24, 1193–1216. [Google Scholar] [CrossRef] [PubMed]
- Redies, C.; Hänisch, J.; Blickhan, M.; Denzler, J. Artists portray human faces with the Fourier statistics of complex natural scenes. Network 2007, 18, 235–248. [Google Scholar] [CrossRef] [PubMed]
- Graham, D.J.; Redies, C. Statistical regularities in art: Relations with visual coding and perception. Vis. Res. 2010, 50, 1503–1509. [Google Scholar] [CrossRef] [PubMed]
- Redies, C.; Hasenstein, J.; Denzler, J. Fractal-like image statistics in visual art: Similarity to natural scenes. Spat. Vis. 2007, 21, 137–148. [Google Scholar] [CrossRef] [PubMed]
- Cosentino, A. Transmittance spectroscopy and transmitted multispectral imaging to map covered paints. Conserv. Patrim. 2016, 24, 37–45. [Google Scholar] [CrossRef] [Green Version]
Figure 1.
Image of the Holy Face visible on the Veil of Manoppello depending on the lighting conditions.
Figure 1.
Image of the Holy Face visible on the Veil of Manoppello depending on the lighting conditions.

Figure 2.
(a) Self-portrait of Vincent Van Gogh; (b) magnification of the red box of Figure 2a; (c) central area of the FFT of Figure 2a; (d) FFT of Figure 2b.

Figure 3.
Central area of the Holy Face of Manoppello: (a) after the correction of the distortion; (b) after the subtraction of the information concerning the weaving.
Figure 3.
Central area of the Holy Face of Manoppello: (a) after the correction of the distortion; (b) after the subtraction of the information concerning the weaving.

Figure 4.
(a) Logarithmic form of the FT of the image of the Holy Face of Manoppello after the correction of the distortion; in the lower right-hand panel, detail of the weaving of the Veil; in dashed red, the repeating periodic unit cell. (b) Contribution subtracted from the FT due to the periodicity of the fabric and to some image defects. (c) Magnification around the principal maximum of the FT shown in Figure 4a. (d) Magnification in the neighbourhood of the principal maximum of the FT after the corrections. (e) Difference of patterns shown in Figure 4c,d.

Figure 5.
(a) Detail of the painting by Leonardo da Vinci known as Ginevra de Benci; (b) magnification of the red box of Figure 5a; (c) FFT of Figure 5b.

Figure 6.
Difference (absolute value) between Figure 3a,b. A digital filter was used to reduce image intensity defects (excessively white or dark pixels). What is left after the subtraction is only information concerning the structure of the fabric and some image defects.
Figure 6.
Difference (absolute value) between Figure 3a,b. A digital filter was used to reduce image intensity defects (excessively white or dark pixels). What is left after the subtraction is only information concerning the structure of the fabric and some image defects.

Figure 7.
Spectrophotometric analysis (absorbance), in arbitrary units, of some circular areas with a diameter of 2 mm of the Veil of Manoppello, as a function of the wavelength (in nm): 1 and 3: eyeball (light); 2 pupils; 4: red spot above the eye; 5: red spot between the eye and the temple; 6: hair; 7: upper lip; 8: dark area between the teeth; 9: front. The points of analyses have been also indicated on the RGB image.

Figure 8.
Histogram of the colour levels of the Holy Face of Manoppello: (a) before digital restoration; (b) after colour compensation, distortion correction and texture removal. The ordinate of the histograms is normalized to the maximum value. On the right the corresponding images are shown.
Figure 8.
Histogram of the colour levels of the Holy Face of Manoppello: (a) before digital restoration; (b) after colour compensation, distortion correction and texture removal. The ordinate of the histograms is normalized to the maximum value. On the right the corresponding images are shown.

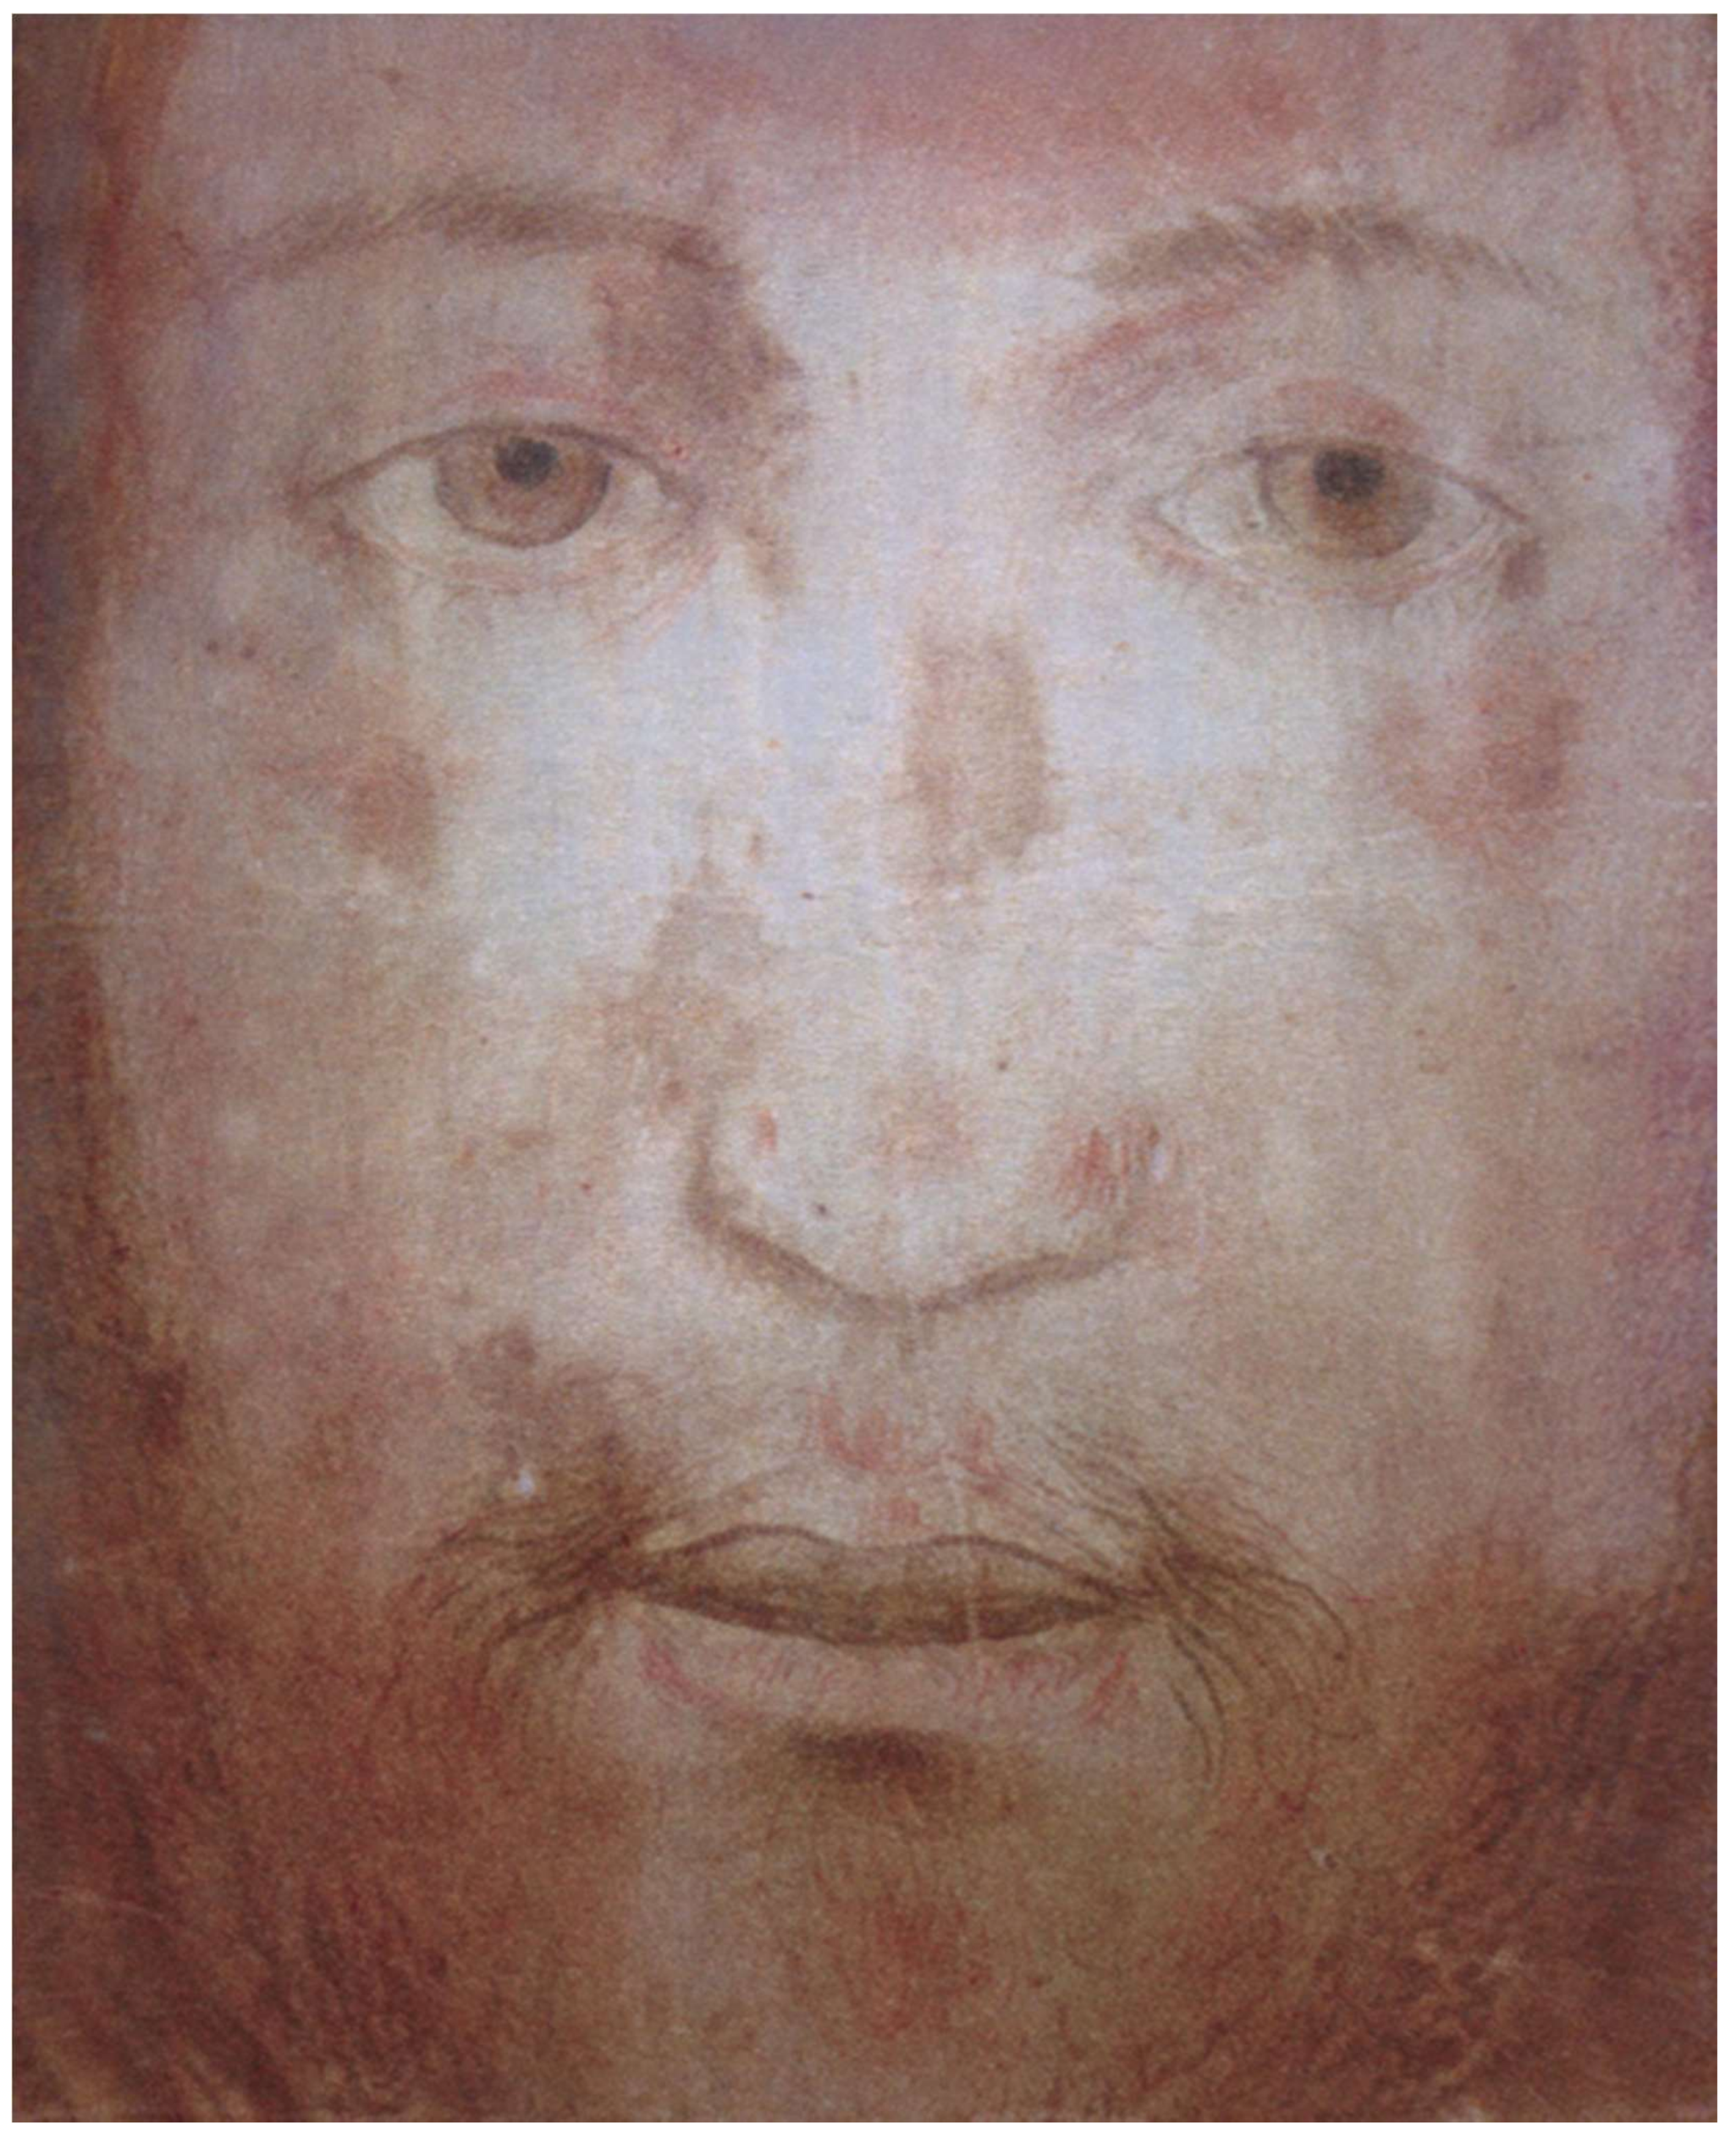
Figure 9.
Image of the Holy Face of Manoppello, transmitted by the Veil illuminated with grazing light, after weaving subtraction, image defect suppression and colour compensation.
Figure 9.
Image of the Holy Face of Manoppello, transmitted by the Veil illuminated with grazing light, after weaving subtraction, image defect suppression and colour compensation.

Figure 10.
(a) Detail of the right eye; (b) detail of the left eye; (c) detail of the mouth of Figure 9.
Figure 10.
(a) Detail of the right eye; (b) detail of the left eye; (c) detail of the mouth of Figure 9.

Figure 11.
Regression line relative to the rotational mean of the power spectrum. P indicates the slope coefficient of the linear fit in log-log coordinates in the range 10–256 cycles per image. (a) Power spectrum of the central part of the Holy Face of Manoppello of Figure 9; (b) detail of the central part of the Face of Manoppello on which the power spectrum has been calculated; (c) power spectrum of the central part of the face represented in Leonardo’s painting; (d) detail of the face considered.

© 2018 by the authors. Licensee MDPI, Basel, Switzerland. This article is an open access article distributed under the terms and conditions of the Creative Commons Attribution (CC BY) license (http://creativecommons.org/licenses/by/4.0/).
Share and Cite
MDPI and ACS Style
De Caro, L.; Matricciani, E.; Fanti, G. Imaging Analysis and Digital Restoration of the Holy Face of Manoppello—Part II. Heritage 2018, 1, 349-364. https://0-doi-org.brum.beds.ac.uk/10.3390/heritage1020024
AMA Style
De Caro L, Matricciani E, Fanti G. Imaging Analysis and Digital Restoration of the Holy Face of Manoppello—Part II. Heritage. 2018; 1(2):349-364. https://0-doi-org.brum.beds.ac.uk/10.3390/heritage1020024
Chicago/Turabian StyleDe Caro, Liberato, Emilio Matricciani, and Giulio Fanti. 2018. "Imaging Analysis and Digital Restoration of the Holy Face of Manoppello—Part II" Heritage 1, no. 2: 349-364. https://0-doi-org.brum.beds.ac.uk/10.3390/heritage1020024