Raman Microspectroscopic Imaging of Binder Remnants in Historical Mortars Reveals Processing Conditions


1
BAM Federal Institute for Materials Research and Testing, Richard-Willstätter-Str. 11, 12489 Berlin, Germany
2
School of Analytical Sciences Adlershof (SALSA), Humboldt-Universität zu Berlin, Unter den Linden 6, 10099 Berlin, Germany
3
Bern University of Applied Sciences, Bern University of the Arts, Conservation-Restoration, Fellerstr. 11, 3027 Bern, Switzerland
*
Author to whom correspondence should be addressed.
†
These authors contributed equally to this work.
Heritage 2019, 2(2), 1662-1683; https://0-doi-org.brum.beds.ac.uk/10.3390/heritage2020102
Submission received: 26 April 2019
/
Revised: 27 May 2019
/
Accepted: 12 June 2019
/
Published: 14 June 2019
(This article belongs to the Special Issue Advances of Analytical Chemistry in Cultural Heritage)
Abstract
:Binder remnants in historical mortars represent a record of the connection between the raw materials that enter the kiln, the process parameters, and the end product of the calcination. Raman microspectroscopy combines high structural sensitivity with micrometre to sub-micrometre spatial resolution and compatibility with conventional thin-sectional samples in an almost unique fashion, making it an interesting complementary extension of the existing methodological arsenal for mortar analysis. Raman spectra are vibrational fingerprints of crystalline and amorphous compounds, and contain marker bands that are specific for minerals and their polymorphic forms. Relative intensities of bands that are related to the same crystalline species change according to crystal orientations, and band shifts can be caused by the incorporation of foreign ions into crystal lattices, as well as stoichiometric changes within solid solution series. Finally, variations in crystallinity affect band widths. These effects are demonstrated based on the analysis of three historical mortar samples: micrometric distribution maps of phases and polymorphs, crystal orientations, and compositional variations of solid solution series of unreacted clinker grains in the Portland cement mortars of two 19th century castings, and the crystallinities of thermal anhydrite clusters in a high-fired medieval gypsum mortar as a measure for the applied burning temperature were successfully acquired.
1. Introduction
Morphology and phase assemblage of unreacted binder grains in the hydrated and/or carbonated binder matrix of historical mortars reflect the composition, comminution, as well as the firing and cooling history (temperature of firing, residence time, kiln atmosphere, etc.) of the kiln raw feed. Thus, detailed analyses of historical mortars are particularly essential in developing a better understanding of the parameters of the historical production of mineral binders, which is a prerequisite for tailoring compatible restoration materials. Microscopically resolved measurements with high structural and chemical specificity are needed to pinpoint and analyse such indicative mineral clusters within the mortar samples. Raman measurements on polished thin sections in the imaging mode, complemented by scanning electron and (polarised) light microscopies, have demonstrated fulfilling the demands for analysis of architectural heritage; the utility of Raman microscopy particularly with regard to the assessment of the original composition of aged mortars and the differentiation of the alteration phases is discussed in Refs. [1,2,3,4,5,6,7,8,9].
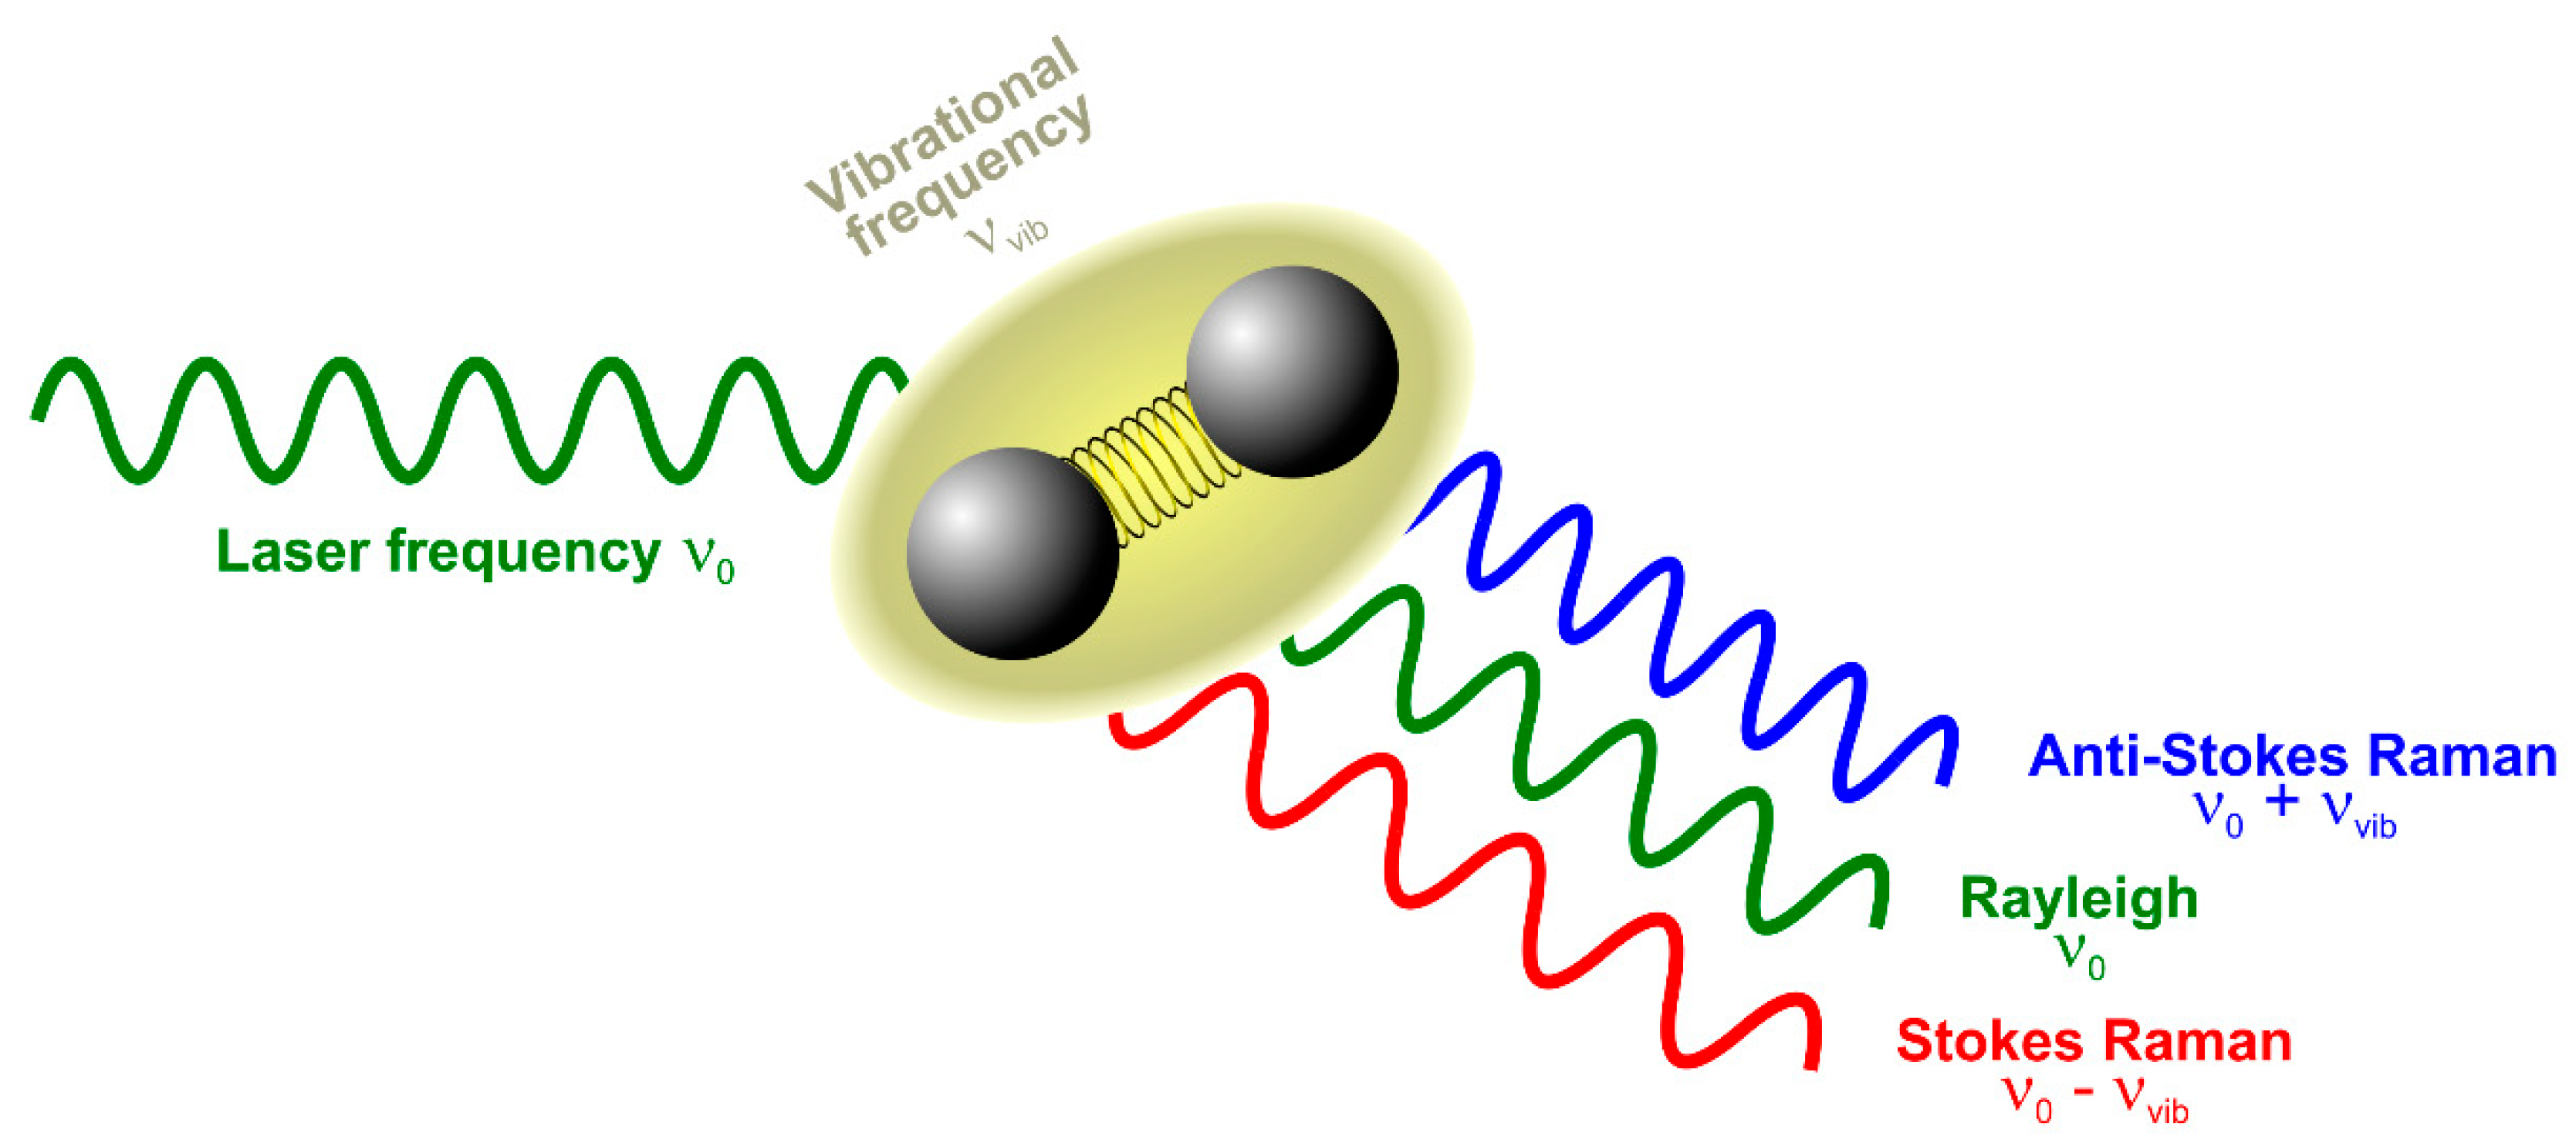
Raman spectroscopy yields structural fingerprints that enable the identification of organic molecules and inorganic phases. Based on inelastic light scattering—also termed Raman scattering—the analytical technique provides peaks (termed bands) that represent Raman-active molecular or crystal-lattice vibrations, which appear at specific vibrational frequencies or wavenumbers (unit cm−1), respectively [10]. The samples are excited by an intense and monochromatic source of electromagnetic radiation, typically a continuous visible laser beam. The light that is scattered by the sample contains photons with frequencies differing from the excitation. This difference is called the Raman shift and it equals the frequency of a molecular or crystal-lattice vibration, which is excited by this process (see Figure 1). Being dependent on symmetry, atomic masses, bond strengths, lengths, and angles, the set of its vibrational frequencies (termed the vibrational spectrum) is highly specific for a certain molecule or crystal. Thus, Raman spectroscopy is related to infrared (IR) spectroscopy in terms of information content [11].
The use of visible light instead of IR radiation is advantageous for several reasons. While, in studies of biological specimen, the weak interference of water bands with analyte spectra is often mentioned, the higher spatial resolution is an important point in microstructural materials investigations [11]. The lateral resolution of a microscope depends on the wavelength of light and the numerical aperture (NA) of the objective lens used [12]. The latter is a measure for the focusing angle, with a high NA or angle, respectively, relating to a small focus spot, and thus high resolution (for a detailed explanation, see the Supplementary Information for Ref. [13]). The focus spot also shrinks if a shorter wavelength of light is employed. Therefore, the lateral resolution of IR microspectroscopy is in the order of several to 10s of µm, while sub-micrometre resolution can be achieved with Raman microscopes that are operated in the range of visible light [11]. Due to this spectral range, both optics and samples that are optimised for classical light microscopy are typically compatible with this microscopic technique. Thus, polished cross sections and thin sections of materials on glass slides can be analysed with Raman microspectroscopy.
This last point we have to discuss in little more detail with respect to typical limitations and drawbacks of Raman (micro)spectroscopy. Raman scattering is typically one of the weakest spectroscopic effects excited by an intense laser beam. If a sample can emit fluorescence radiation, it can easily be orders of magnitude stronger than Raman scattering. Thus, resins containing fluorescent dyes are typically not compatible with this technique. Some embedding media can emit fluorescence, even without purposely added fluorophores, for example, due to material ageing, and even traces of such fluorescing compounds can significantly interfere with Raman spectra due to the weakness of the latter. Furthermore, potentially interfering Raman bands of embedding resins and glues that are employed for attaching cover slips should be taken into account during sample preparation.
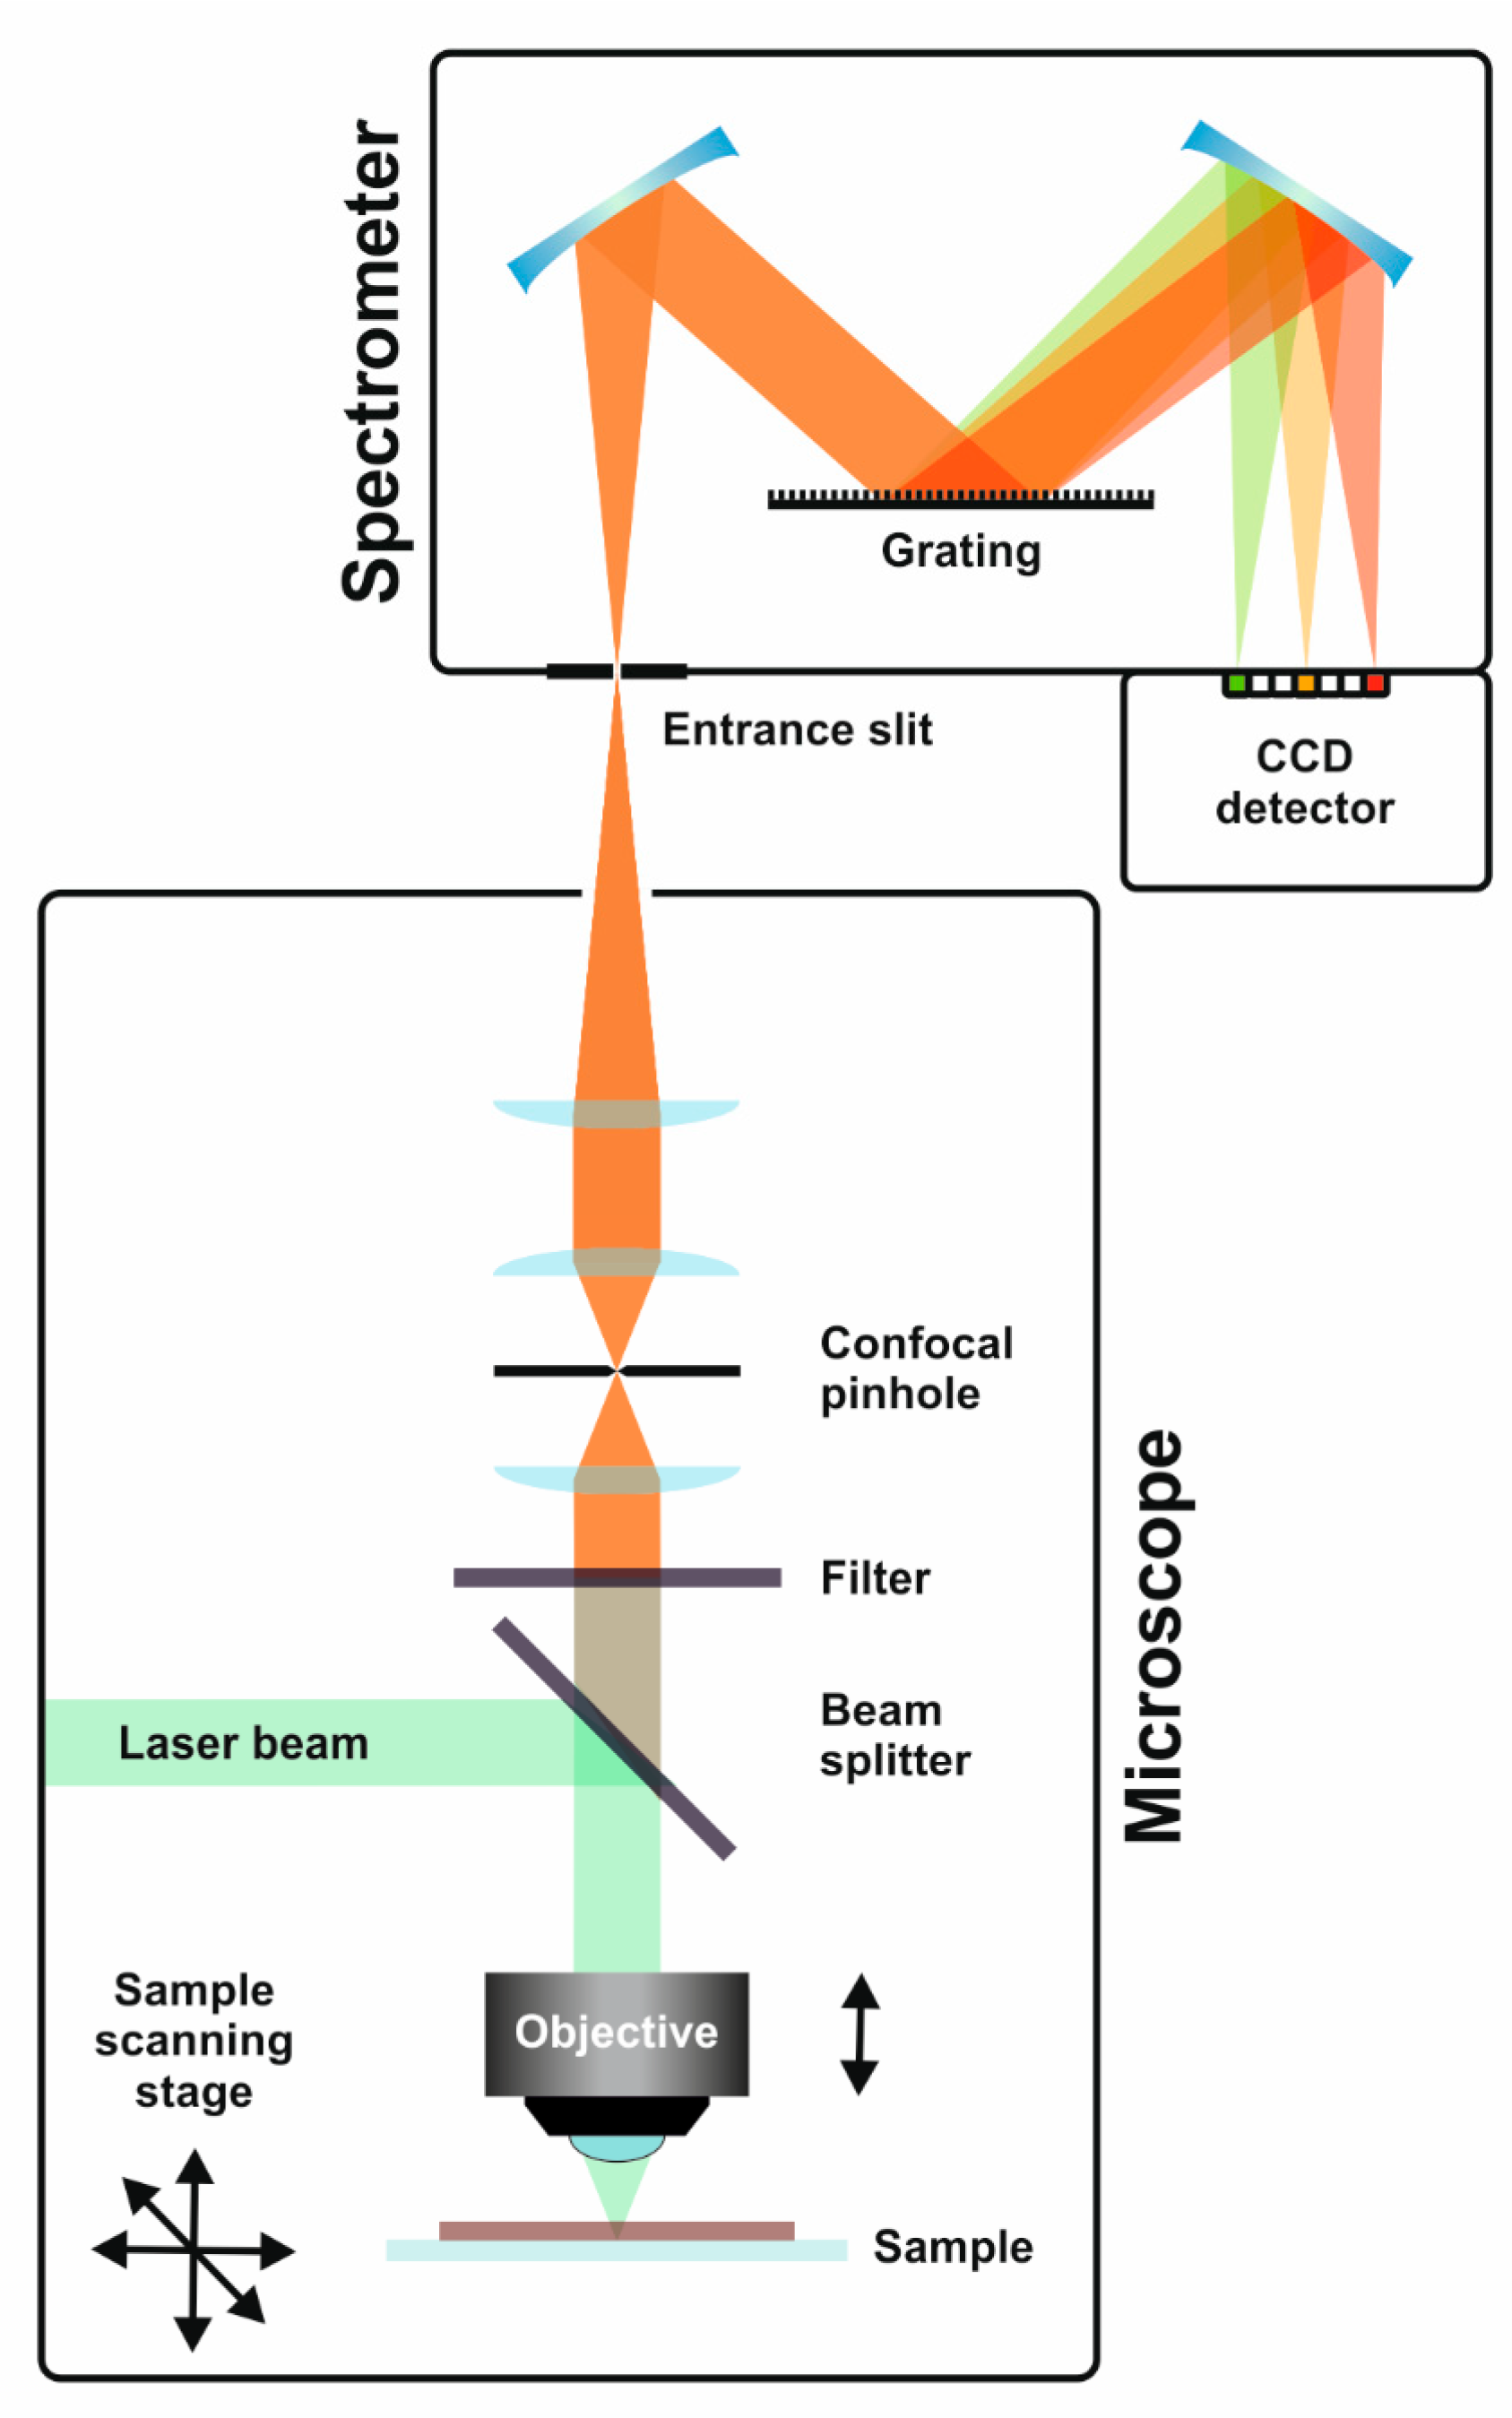
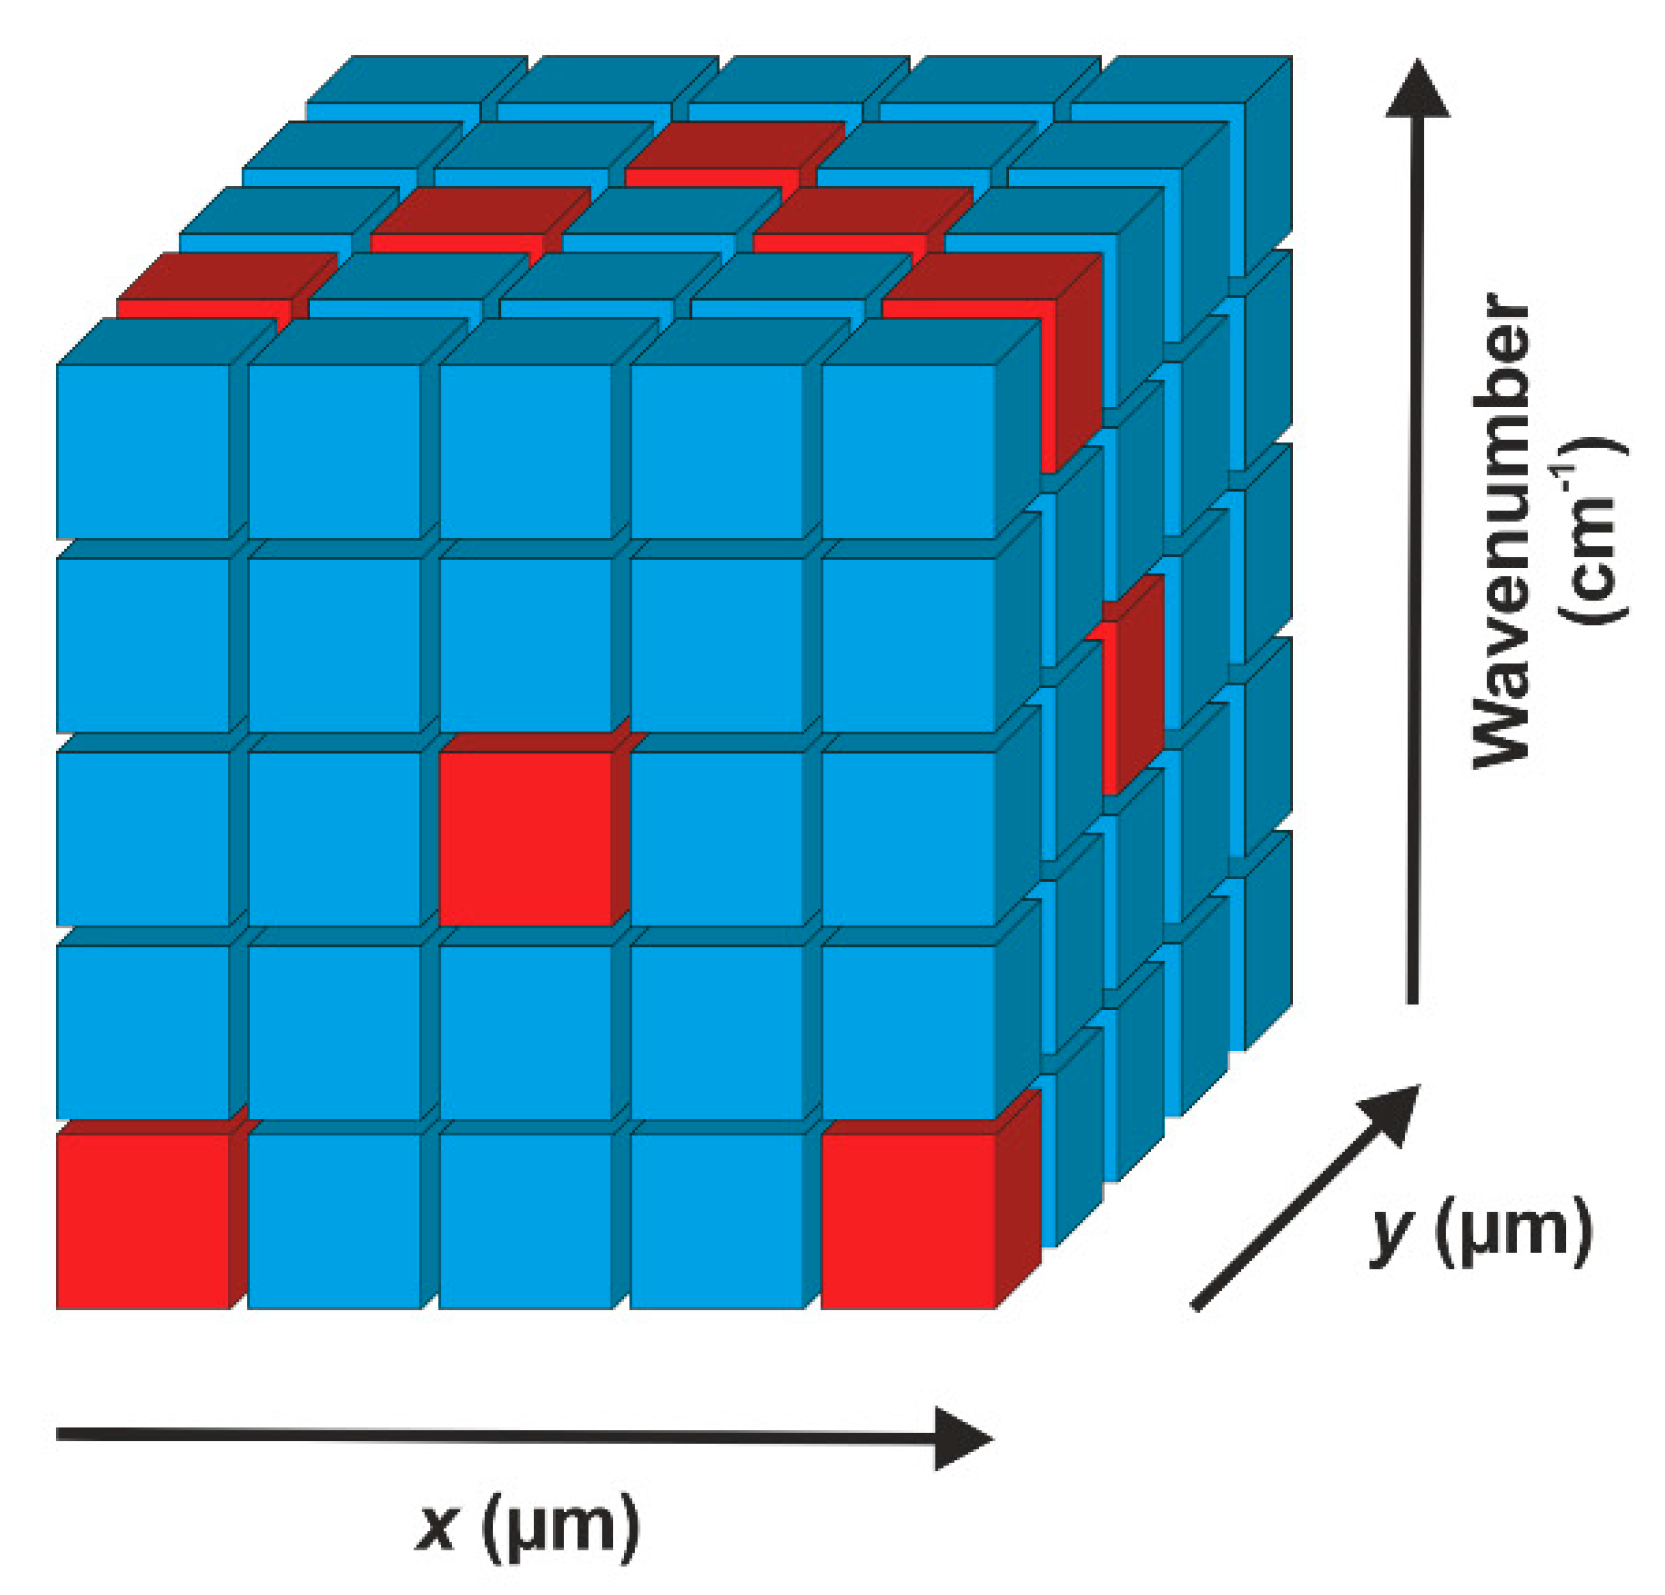
Figure 2 shows a schematic of one possible Raman microscopy set-up. Laser light is focused onto the sample surface by a microscope objective lens, which is also employed for the collection of the backscattered light. Notch or edge filters filter out Raman-shifted photons and they are finally fed into a grating spectrometer enabling the simultaneous detection of the wavenumbers in a selected spectral range by use of a charge-coupled device (CCD) detector. Raman mapping experiments can be realised by step-wise movement of the sample through the laser focus, while acquiring a Raman spectrum in every pixel of an image. The typical parameters to be optimised in such Raman microspectroscopic measurements are the laser wavelength, laser power, focusing element (objective lens), spectrometer grating, the acquisition time, and pixel size and number. All of these parameters have to be carefully selected to reduce interference from fluorescence emission, avoid sample damage, and achieve reasonable experiment times, even for acquiring Raman maps, easily consisting of thousands of spectra. Having performed a correct Raman mapping experiment is only one challenge, as the data evaluation is typically even more demanding. Consisting of x and y coordinates, as well as the wavenumber and intensity axes of each spectrum, the Raman imaging data sets are typically four-dimensional and they need to be transferred into two- or three-dimensional representations of selected spectroscopic features by appropriate data evaluation (see Figure 3) [14].
In this contribution, we demonstrate how the intensities of marker bands (for both, phases and polymorphs), relative band intensities, band shifts, and even changes in band shapes can be evaluated to yield specific material information and contrast for Raman microspectroscopic imaging.
2. Materials and Methods
2.1. Samples
The following observations concern prefabricated concrete elements and a cast lion sculpture, both produced for the industrial exhibition in Zurich (Switzerland) in 1894. The sample of a high-fired gypsum mortar originates from the Carolingian Chapel of the Holy Cross of the Benedictine convent of St. John in Müstair (Switzerland). Both types of mortar were prepared for analysis in a specialised laboratory by embedding in epoxy resin under vacuum and manufacturing polished thin sections (30 µm thickness), which were studied under polarising light microscopes (Leica Microsystems Laborlux that was equipped with ProgRes SpeedXT3 and Zeiss AxioScope.A1 MAT equipped with AxioCam MRc) in transmitted polarised light.
2.2. Raman Microspectroscopy
The Raman spectra and maps were acquired by using a LabRam HR 800 instrument (Horiba Jobin Yvon) coupled to a BX41 microscope (Olympus). For both, excitation and collection of the scattered light, a 50x/NA = 0.75 objective lens was employed. The system is equipped with a diode-pumped solid-state (DPSS) laser that has a wavelength of 532 nm and a 1800 mm−1 grating offering a resolution of the spectra that were acquired with a liquid N2-cooled (−130 °C operating temperature) charge-coupled device (CCD) camera (Symphony CCD, Horiba Jobin Yvon) of approx. 0.47 cm−1 per CCD pixel at 750 cm−1 Raman shift and 0.45 cm−1 at 1100 cm−1. The spectrometer entrance slit was 100 µm wide and the confocal pinhole was in the fully open position (1000 µm). Prior to each Raman mapping experiment, the laser was allowed to stabilise for at least 2 h and the spectrometer was recalibrated against the most prominent mode of silicon at 520.7 cm−1.
The Raman maps (see Section 3.1, Section 3.2, Section 3.3, Section 3.4 and Section 3.5) were acquired under the described conditions with a laser power at the sample of 7.5 mW (full power attenuated to 25% while using a neutral density filter). The spectra of 19th-century Portland cement mortars were centred at 750 cm−1, offering a spectral range of approx. 500 cm−1 to 990 cm−1 in one acquisition, which includes the most prominent modes of the main calcium silicate, aluminoferrite, and aluminate clinker phases. In the measurement of a high-fired medieval gypsum mortar, the spectra that were centred at 1100 cm−1 ranged from approx. 860 cm−1 to 1330 cm−1, covering the most prominent features in the spectra of gypsum and anhydrite. Software-controlled (instrument software LabSpec 6, Horiba Jobin Yvon S.A.S., Longjumeau, France) step-wise movement of the sample stage and the collection of a Raman spectrum in each pixel were used to acquire the maps. The step size was 0.9 µm × 0.9 µm for the cement mortars and 1 µm × 1 µm in the case of the high-fired gypsum mortar. The lateral spatial resolution at 532 nm using a NA of 0.75 is approx. 430 nm (according to the Rayleigh criterion, calculated according to the Supporting Information for Ref. [13]) and the laser spot diameter approx. 700 nm, while the depth resolution with open confocal pinhole is estimated to amount to approx. 22.5 µm (recalculated from experimental values that were obtained with the same instrument using an NA of 0.9 and a laser wavelength of λ0 = 632.8 nm [13] by assuming that the dimension of the point spread function in depth direction is proportional to λ0/(NA²)). In mapping experiments, the individual spectra were acquired within 2 × 2 s, i.e., two accumulations of 2 s acquisition time each, by using the cosmic ray rejection option of the software. Table 1 summarises the mapping parameters.
All of the mapping data were evaluated and converted into three-dimensional images (with the third dimension expressed in false colours) by using own LabView-based software (National Instruments, Austin, TX, USA).
2.3. Scanning Electron Microscopy
Scanning electron micrographs and energy dispersive X-ray (EDX) maps were acquired by employing a table-top environmental scanning electron microscope (ESEM) Jeol JCM-6000 Neoscope.
3. Results and Discussion
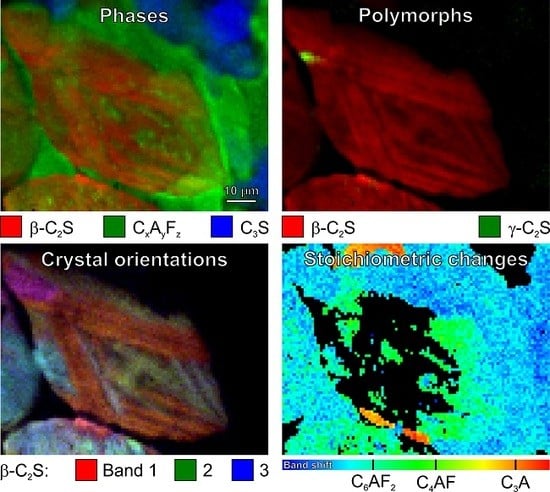
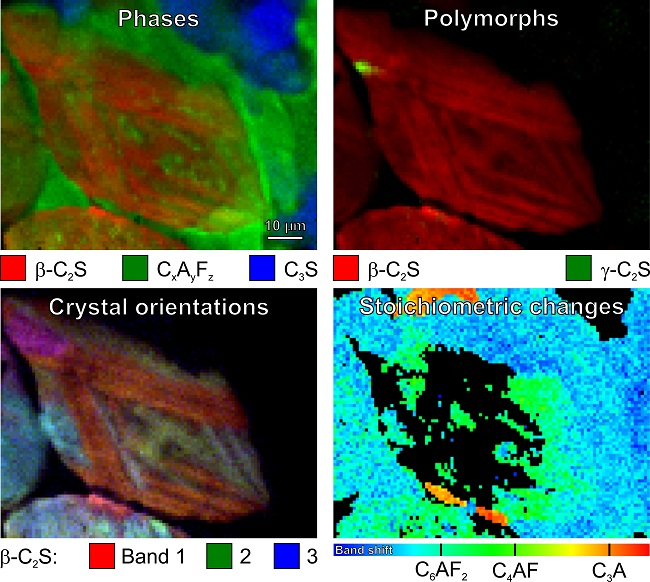
3.1. Intensities of Marker Bands Provide Access to Distributions of Phases in Clinker Remnants in Early Cement Mortars
Light microscopical examination of cement clinker is routinely used to monitor the operating kiln conditions and to evaluate the clinker quality since the pioneer work of Henri Le Chatelier and Alfred Elis Törnebohm in the late 19th century [15,16,17,18,19,20,21]. Beyond that, the phase assemblage and microstructure of unhydrated clinker grains in early cement mortars (see Figure 4) evidence the historical process mastering [22,23,24,25,26,27]. Differences and anomalies in crystal size, morphology, abundance, and distribution when compared to present-day clinker phases are in consequence of (the combination of) factors, like deficient homogenisation of the feedstock, slow heating and slow cooling rate, long residence time, etc., as early highly hydraulic binders were produced in an intermittently operated shaft kiln; the rotary kiln, as patented by Frederick Ransome in 1885, was introduced in continental Europe only at the beginning of the 20th century [22,28].
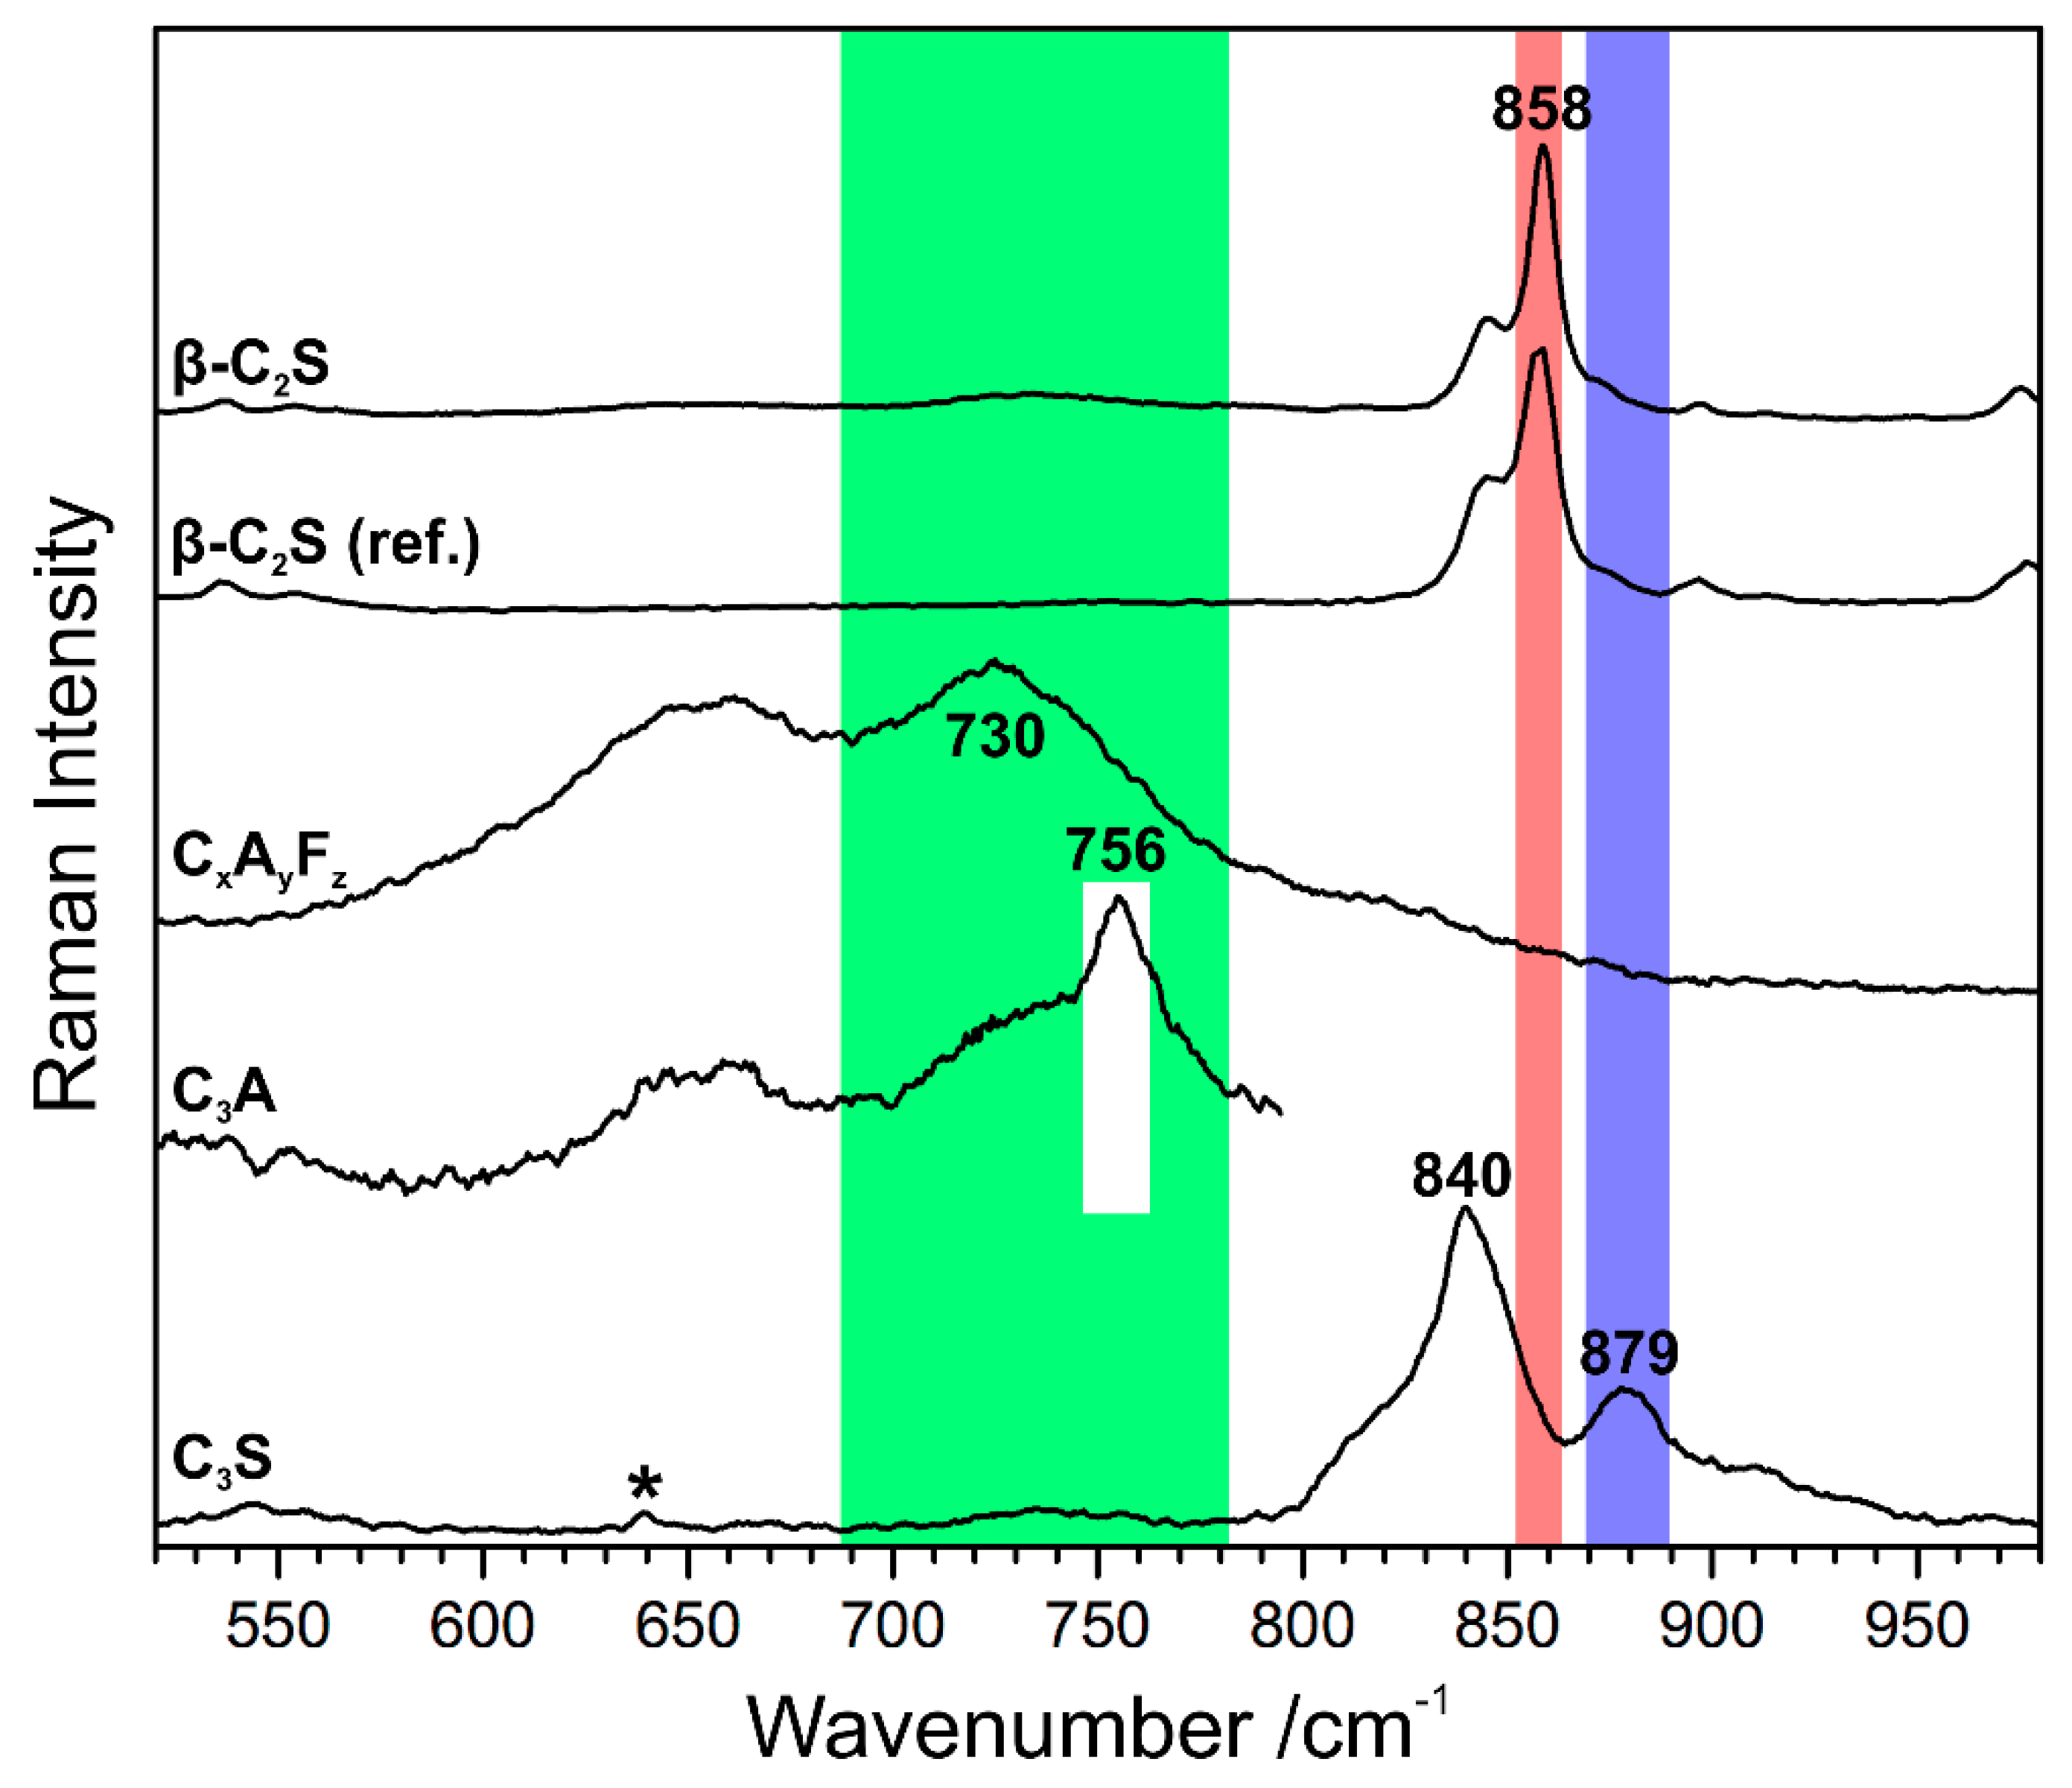
The potential of the complementation of petrographic examination of the binder in early cement mortar samples by Raman microscopy was demonstrated for the first time in 2013 [2]. The Raman imaging studies build on the decennia of previous research on Raman spectra of cement-related compounds [29,30,31,32,33,34,35,36,37,38,39,40,41], which is the main source for gathering reference Raman spectra that are needed to elucidate the chemical identity of crystallites found in Raman mapping experiments. Figure 5 visualises this for the example of beta dicalcium silicate (β-C2S or β-belite, respectively). In this part of the study, cement chemist’s notation is used for convenience, according to which C ≙ CaO, S ≙ SiO2, A ≙ Al2O3, and F ≙ Fe2O3. The reference spectrum in this case was gathered by measuring own synthesised β-C2S with the same instrument, and it agrees well with the literature data [29]. Spectral libraries represent another source of reference data, but so far only some contain the spectroscopic data of inorganic phases, and indeed, they are not specialised to cement clinker compounds. The rruff spectral database is principally employed in the community, being freely accessible at http://rruff.info, which comprises photos, elemental analysis data, Raman spectra, and X-ray diffractograms of natural minerals [42]. Thus, only cement-related phases are included, which have a natural counterpart. In some cases, care has to be taken with spectral library data, because the natural mineral (for example, larnite in the case of β-C2S) crystallises in a different crystal class than the typical clinker phase, thus being characterised by differing spectra and diffractograms (see Section 3.2). The rruff library spectra can be downloaded and—like own reference data—directly matched with the sample data. In accordance with the idea of a fingerprint comparison, several Raman bands in the sample spectrum shown in Figure 5 (labelled ‘β-C2S’) match the wavenumbers that are found in the reference spectrum (‘β-C2S (ref.)’, in this case the spectrum of own synthesised β-C2S [38]). In general, subtle differences between the Raman spectra of synthetic clinker minerals and of the corresponding phases occurring in historical or current commercial cement clinker have to be considered, which are due to the incorporation of foreign ions.
Further phases that are found in clinker remnants of the late 19th century Portland cement mortars under study are tricalcium silicate C3S, tricalcium aluminate C3A, as well as calcium aluminoferrites CxAyFz, which are identified based on comparison with literature data (see Ref. [29] and references cited therein). Tricalcium silicate or impure alite, respectively, crystallises between about 1250 °C and 1450 °C. Three triclinic, three monoclinic, and one rhombohedral form are known, with an increase in symmetry with increasing temperature [43]. The Raman spectrum that is shown in Figure 5 documents the presence of a monoclinic polymorph in a residual clinker grain, thus of a high temperature form most probably stabilised by the dissolved impurities given the slow cooling rate characterising the technological level at the end of the 19th century. (Note that the band at 639 cm−1 marked with an asterisk is assigned to the embedding medium (epoxy resin) used for sample preparation [44,45,46].)
Marker bands for each phase can be identified once all the phases in a Raman map have been identified by comparison with reference spectra. These have to be strong (but not necessarily be the strongest signal in a spectrum) and ideally, they should not interfere with the marker band of other sample constituents. In case of belite, the most intense band at 858 cm−1 was chosen (highlighted red in Figure 5), while for alite, a secondary band at 879 cm−1 was selected (Figure 5, blue), because there was too much overlap between the main alite band and the spectroscopic signature of belite. In the case of the interstitial calcium aluminoferrite phases, the Raman intensity was integrated over a broad range (688 cm−1–783 cm−1), covering the varying compositions within the solid solution CxAyFz causing shifts of its most prominent band. (The evaluation of band shifts for elucidating stoichiometric changes is demonstrated in Section 3.4.) Tricalcium aluminate reveals its most intense Raman bands at 360 cm−1, 508 cm−1, and 756 cm−1 [38]. The latter is seen in some parts of the chosen detail as a sharp band that is superimposed to one of the broad CxAyFz bands. (The information in band shapes is discussed below in Section 3.4 and Section 3.5.) Baseline-corrected intensities of the marker bands yield phase distribution maps, as shown in Figure 6a,b. The well-differentiated matrix is correlated with slow cooling in the clinker manufacture as a coarse structure of aluminate and ferrite indicates annealing or a gradual decline in temperature during the solidification of the melt [15,16,17]. Likewise, the ragged crystals of dicalcium silicate or belite, respectively, with lamellar extensions into the interstitial matrix that are shown in Figure 6a, suggest very slow in-kiln cooling [15,16,17]. This is a typical feature of highly hydraulic binders of the late 19th century, as cement clinker produced batchwise in a shaft kiln is inevitably only discharged after natural cooling to ambient temperature.
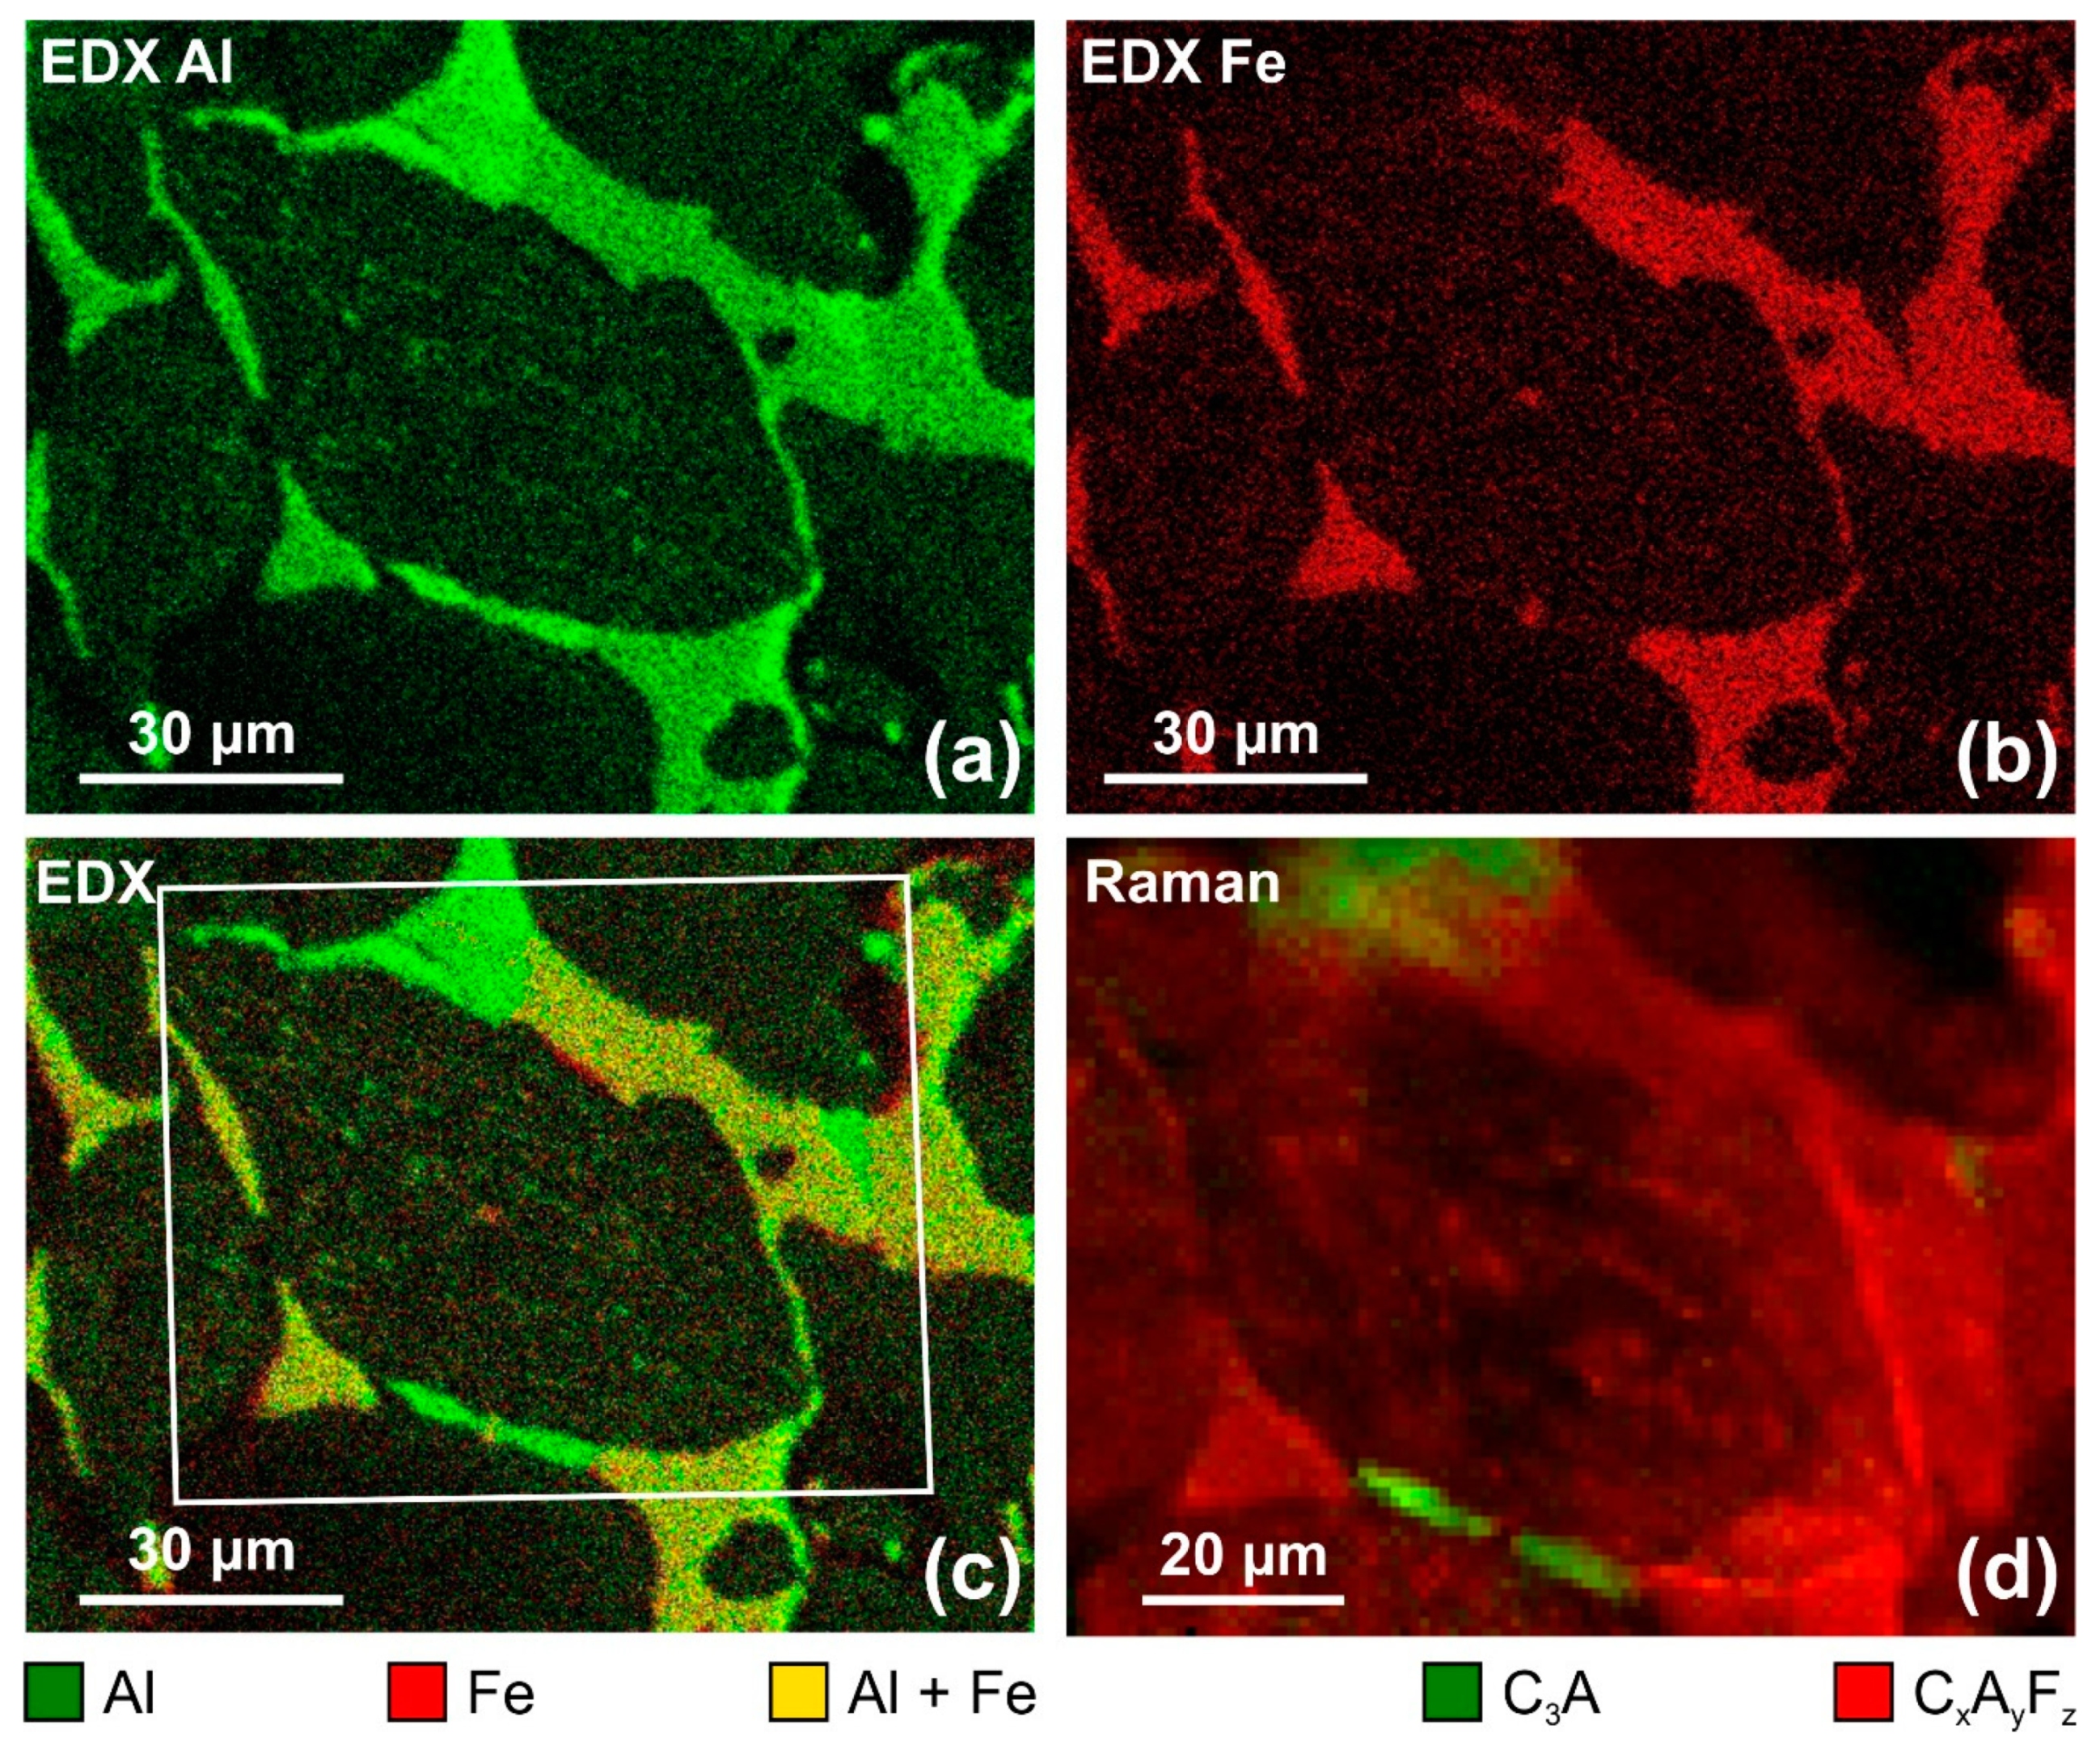
A comparison with scanning electron microscopy–energy dispersive X-ray spectroscopy (SEM–EDX) maps of the same sample excerpt confirms the correct assignment of Raman signatures to calcium aluminoferrite and calcium aluminate phases. Figure 7 reveals the elemental distributions of aluminium (green) and iron (red) in comparison with a Raman map specifically showing the intensity distributions of the marker bands that are assigned to C3A (green) and CxAyFz (red), in which the first corresponds to structures containing Al, while the latter correctly relates to areas emitting EDX signals of both Fe and Al (Figure 7c; yellow, as mixed colour of red and green).
3.2. Raman Spectra Enable the Discrimination of Polymorphs of Cement Clinker Phases
Like C3S, dicalcium silicate occurs in different polymorphs: The five known crystalline forms are designated α, α’, β, and γ, with the α’ polymorph existing in the two very similar forms α’h and α’l [43]. If the cement clinker is slowly cooled from elevated temperatures, the α’l–β phase transition and thus the decrease in crystal symmetry from orthorhombic to monoclinic frequently leads to the formation of polysynthetic twinning. H. Insley proposed a classification of C2S or belite grains in cement clinker that is based on the characteristics of their internal microstructure: Type I belite is defined as rounded grains showing two or more sets of intersecting lamellae (α and β), whereas type II belite forms irregular grains with one set of distinct parallel striations due to the martensitic transformation. The nonlamellar type III belite, which occurs as overgrowth on type I or as individual crystals, characterises the Portland cement clinker produced in a shaft kiln [15,47,48,49]. The Raman map in Figure 6b depicts a cross-hatched belite grain of the type I that consists exclusively of lamellae of the β-phase intergrown with exsolved calcium aluminoferrite solid solution; the former α-phase was completely inverted.
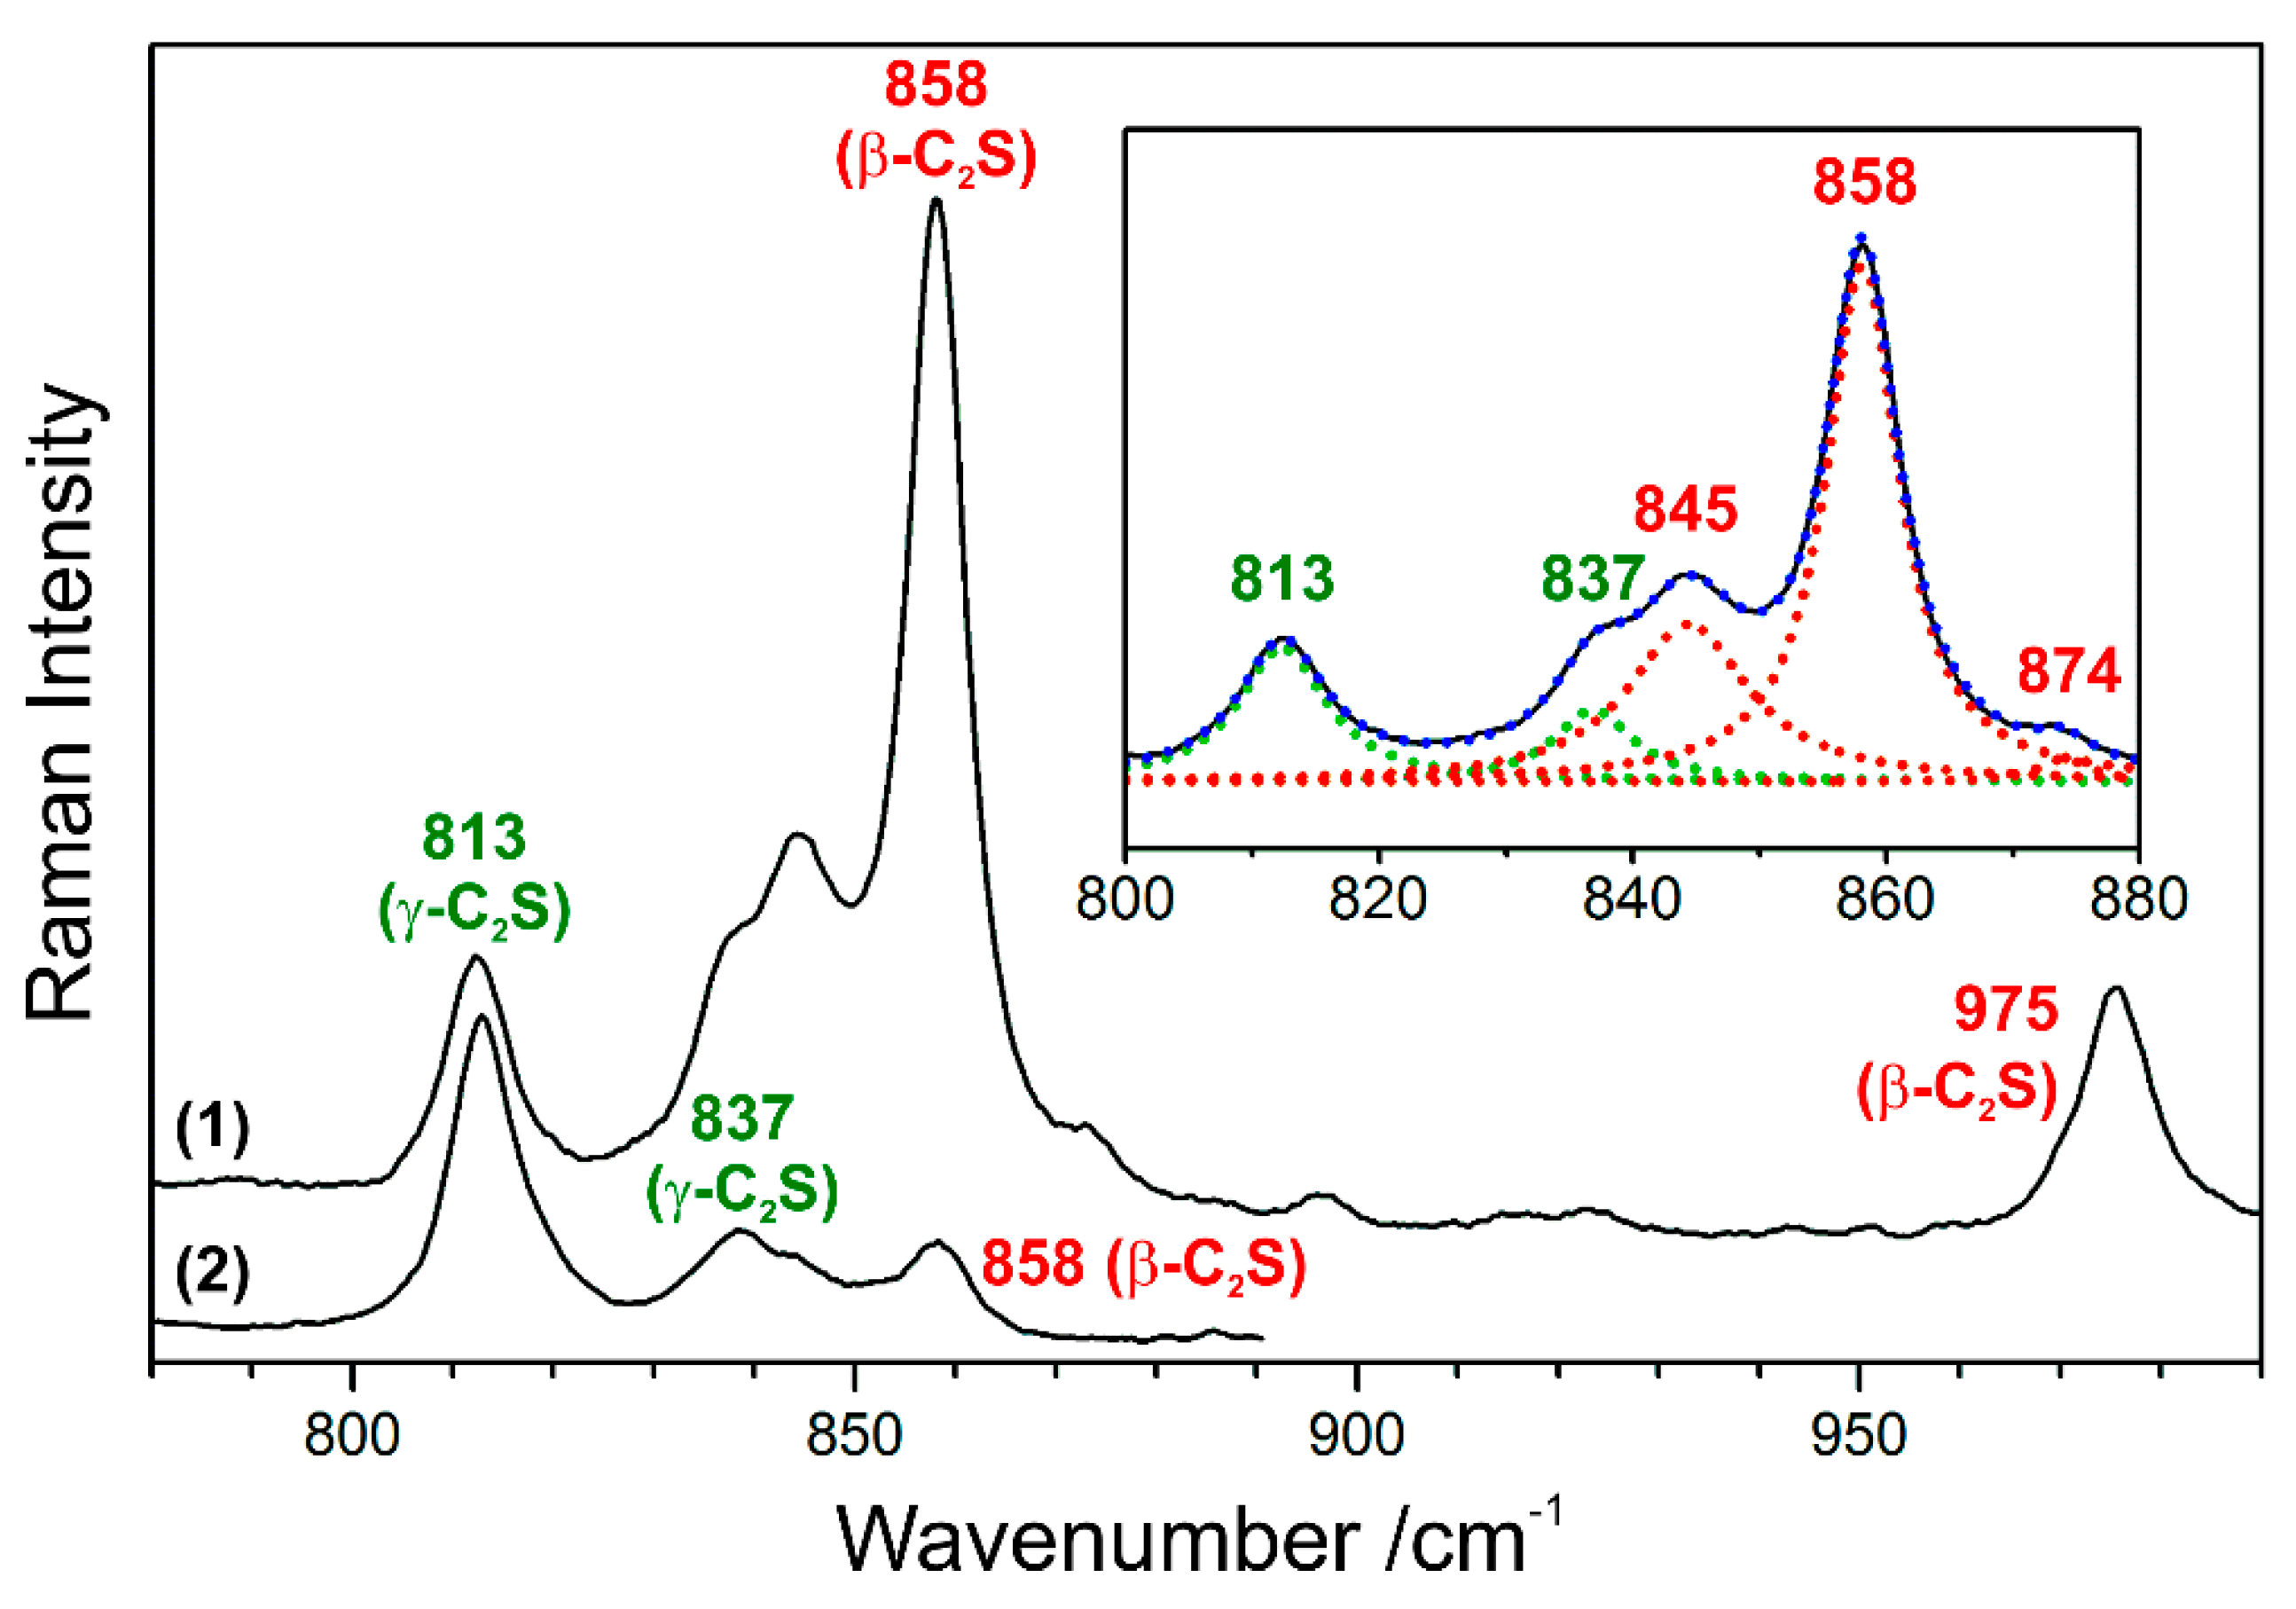
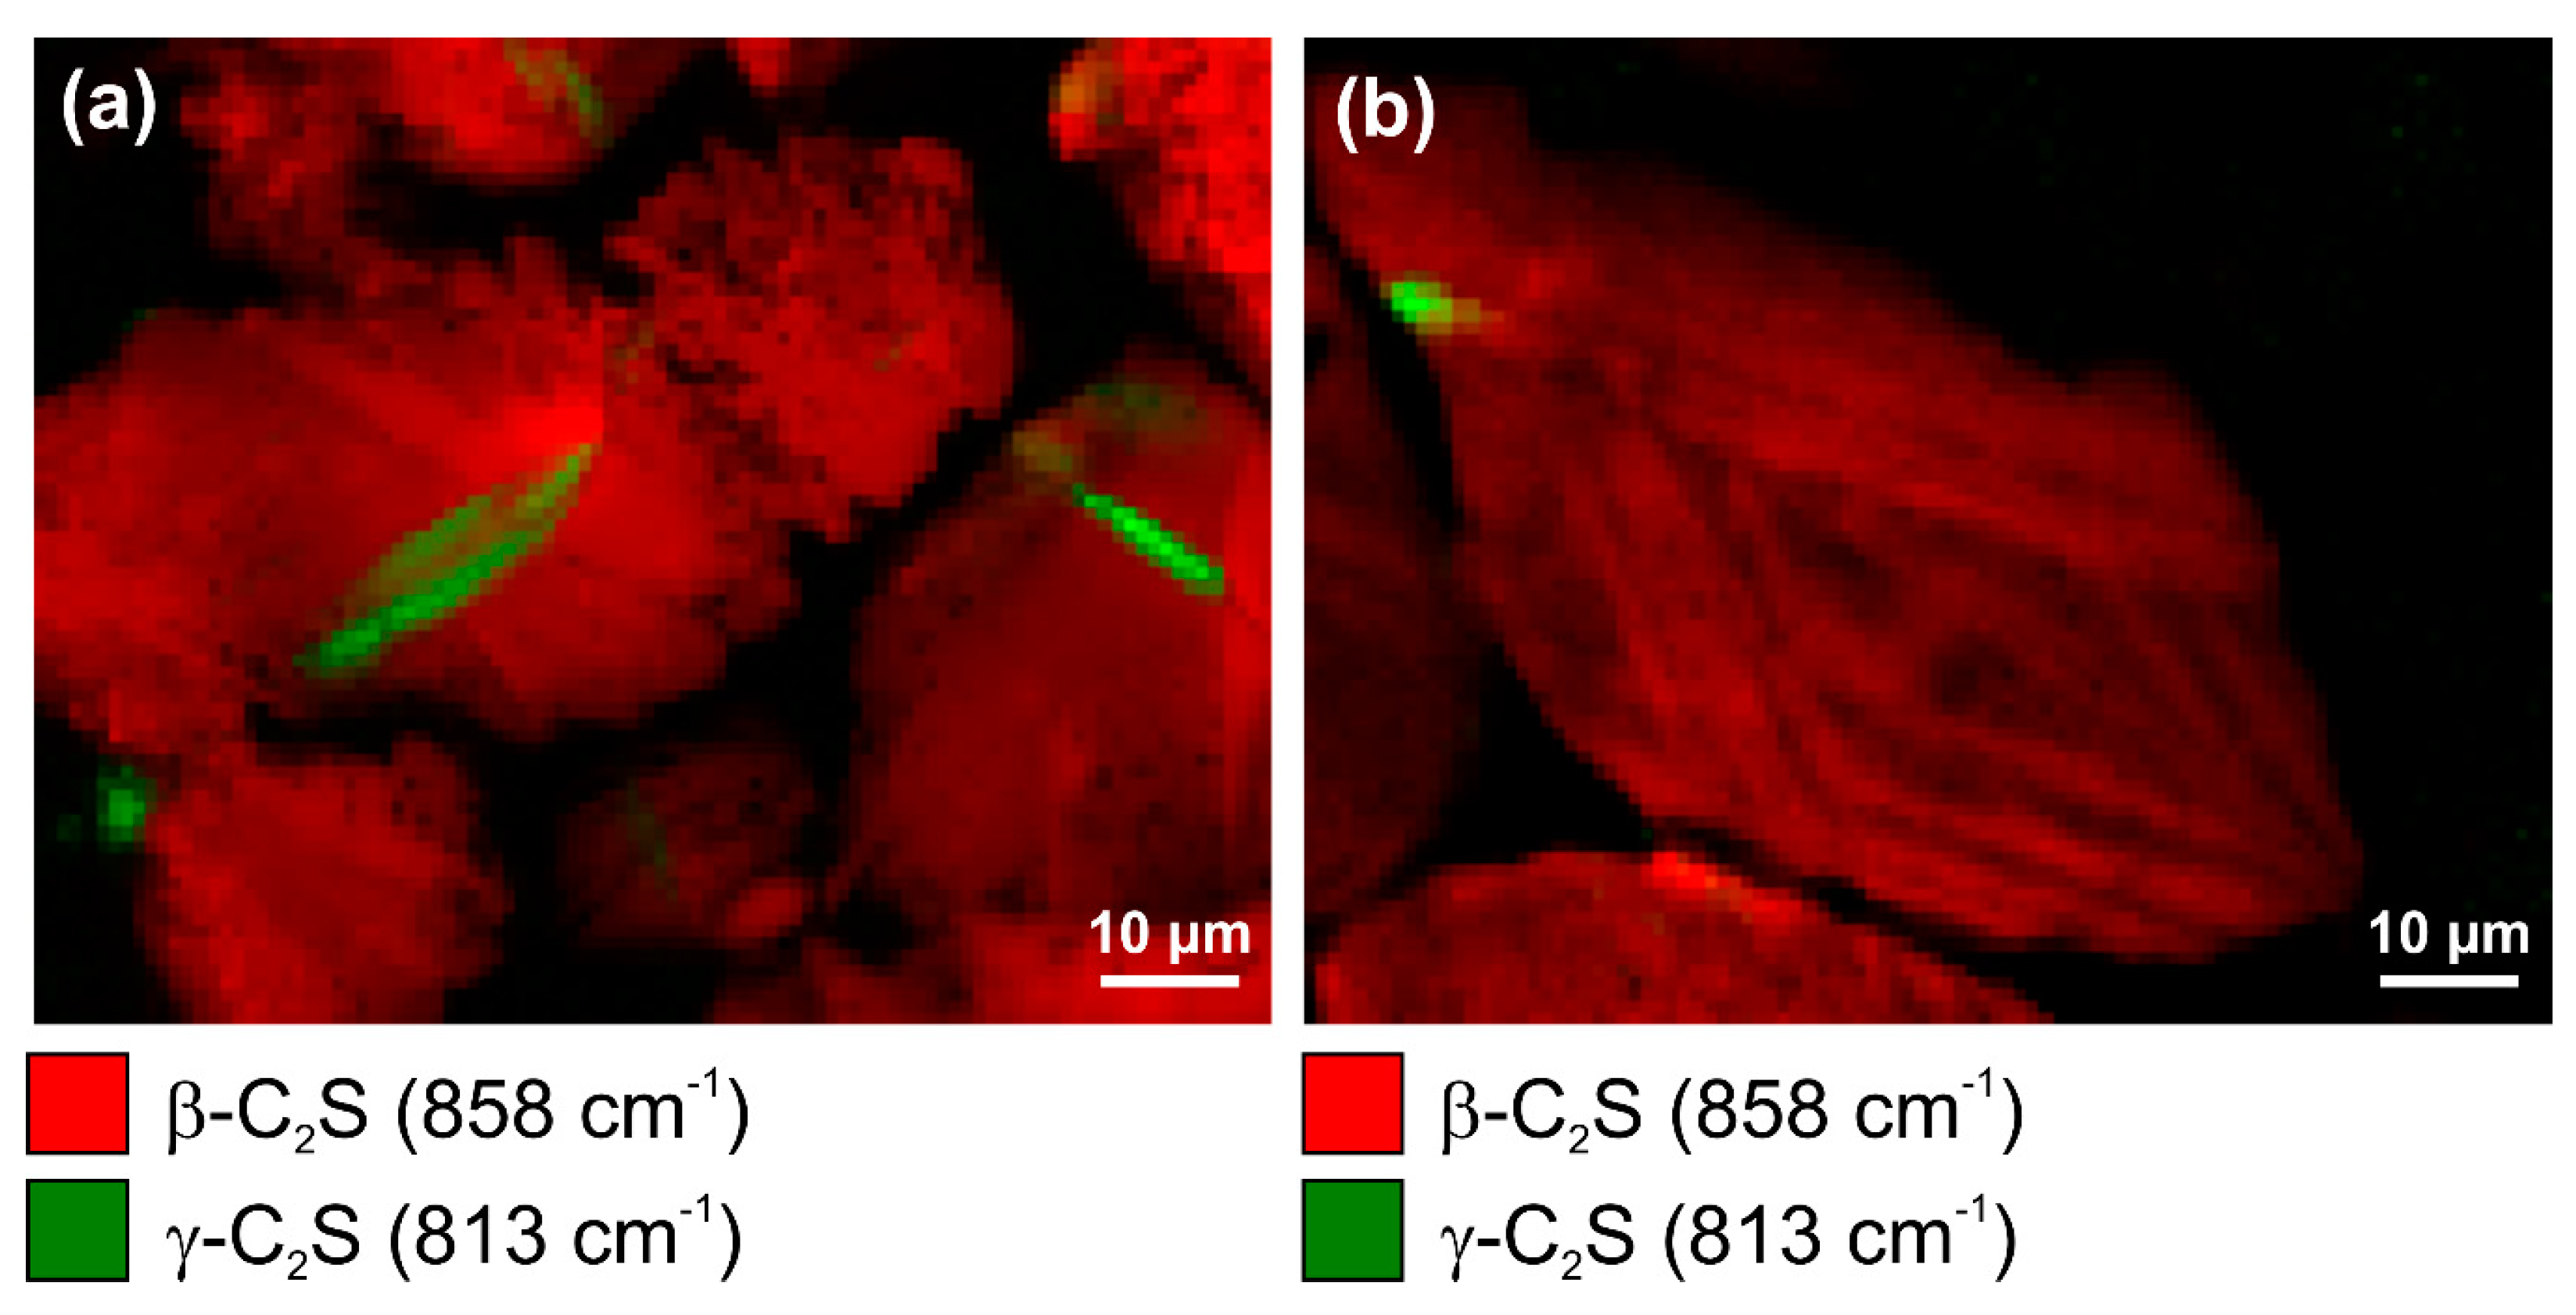
As the processing parameters affect the phase assemblage and microstructure of cement clinker, it is possible to deduce the temperatures of belite formation and cooling rates on the basis of polymorphic phase transitions. In Raman imaging experiments, the γ form of C2S can be clearly distinguished from the β polymorph due to its characteristic Raman spectrum [50]. The main band of γ-C2S at 813 cm−1 is particularly distinct from the spectroscopic signature of β-C2S, and with the high spectral resolution that was employed in this study, the presence of the γ polymorph can be additionally confirmed based on its secondary band at 837 cm−1 typically appearing as a shoulder of the β-C2S band at 845 cm−1 (see Figure 8), while a distinct peak at 837 cm−1 is obtained at a few relatively pure γ-C2S grains. Raman intensity maps of the most prominent bands of both polymorphs reveal their different spatial distributions (Figure 9a,b).
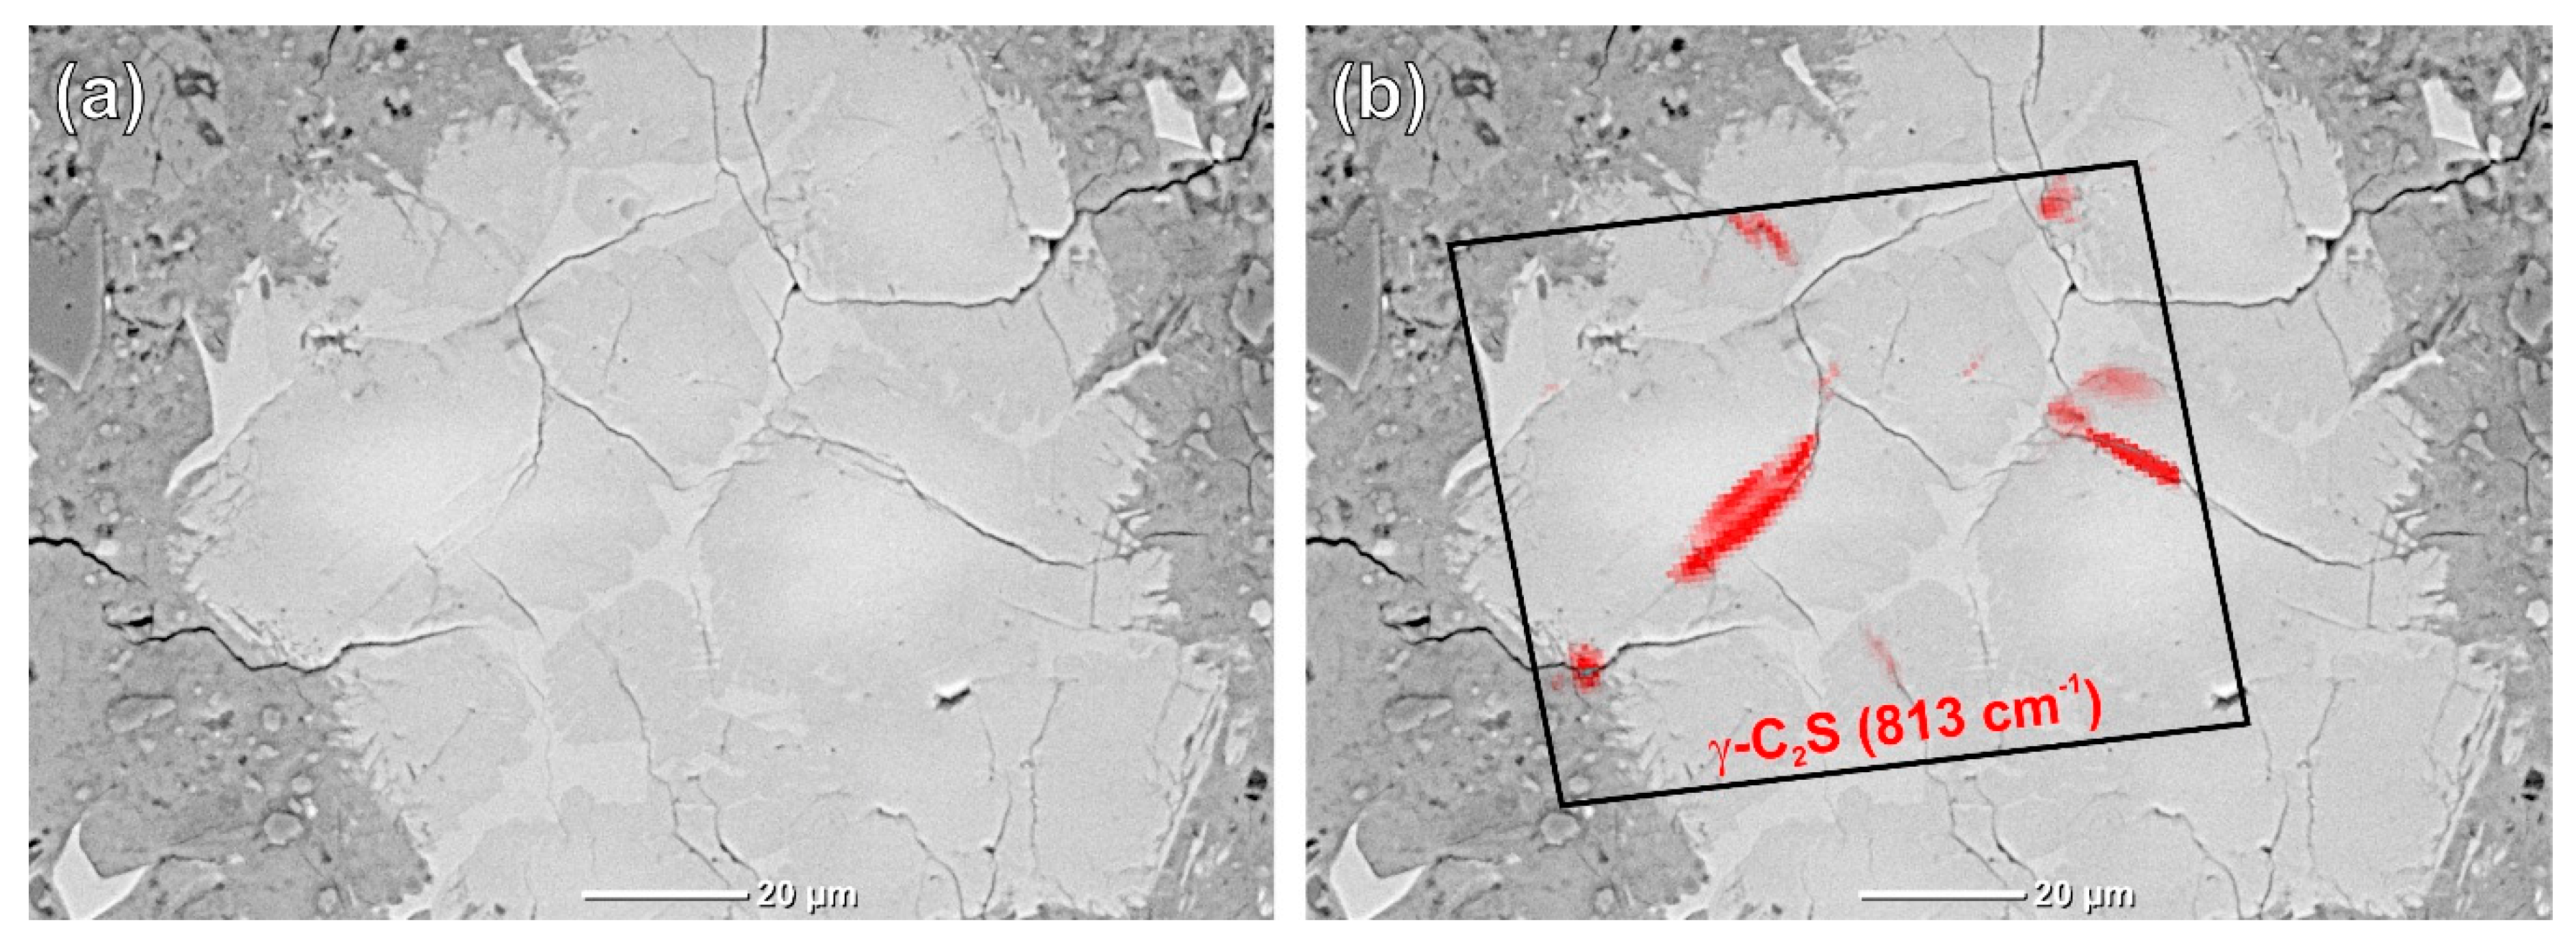
The crystallisation of the γ polymorph at the microstructural level is directly related to the macroscopic (and hydraulic) properties of the resulting clinker, as changes in density due to the transformation of monoclinic β-C2S into orthorhombic γ-C2S during cooling leads to disintegration or ‘dusting’ [43]. The related crack formation is faintly visible in the Raman map in Figure 9a and is confirmed by an overlay of the γ-C2S Raman intensity distribution onto a scanning electron micrograph of the same clinker remnant (Figure 10).
3.3. Changes in Relative Band Intensities Visualise Different Crystal Orientations
We now come to physical material properties after having demonstrated that Raman spectra are characteristically affected by chemical identity and crystal structure of clinker phases. The effect of crystal orientations onto Raman spectra is known since the early years of Raman spectroscopy [51]. Indeed, depending on technical developments, such as the confocal microscope and laser, it took a few decades until the application of this effect with microprobe setups [52], and some more years to realise the first orientation-distribution maps of polycrystalline materials surfaces [53]. A recent study of combined electron backscatter diffraction (EBSD) and Raman microspectroscopic imaging demonstrated the ability of the latter to map the sample surfaces with high pixel numbers and to obtain quantitative orientation data of each individual crystallite [13].
We have to make clear again that the Raman spectrum of a crystalline material consists of several bands representing different vibrational motions and their characteristic frequencies in order to explain the effect. Each vibration has certain symmetry (with respect to the symmetry of the crystal) and main direction relative to the crystal axes. The laser employed for excitation is typically linearly polarised; thus, the excitation also has a certain direction in space. Theoretically, the Raman scattering intensity depends on the dipole moment that is induced in the molecular orbitals of an oscillating specimen and, as a result, on the change of polarisability during the vibrational motion [54]. According to a more practical explanation the resulting light intensity of each band in a spectrum depends of the relative orientations of laser polarisation direction, excited crystal vibration, and polarisation direction of the scattered light, meaning that crystal vibrations having their main motion parallel to the given laser polarisation direction are excited very efficiently, while the same mode is less excited if the crystal orientation direction is changed. Changes in relative band intensities are observed in the case of varying crystal orientations, as each band in the spectrum of a single compound reflects a different vibrational motion.
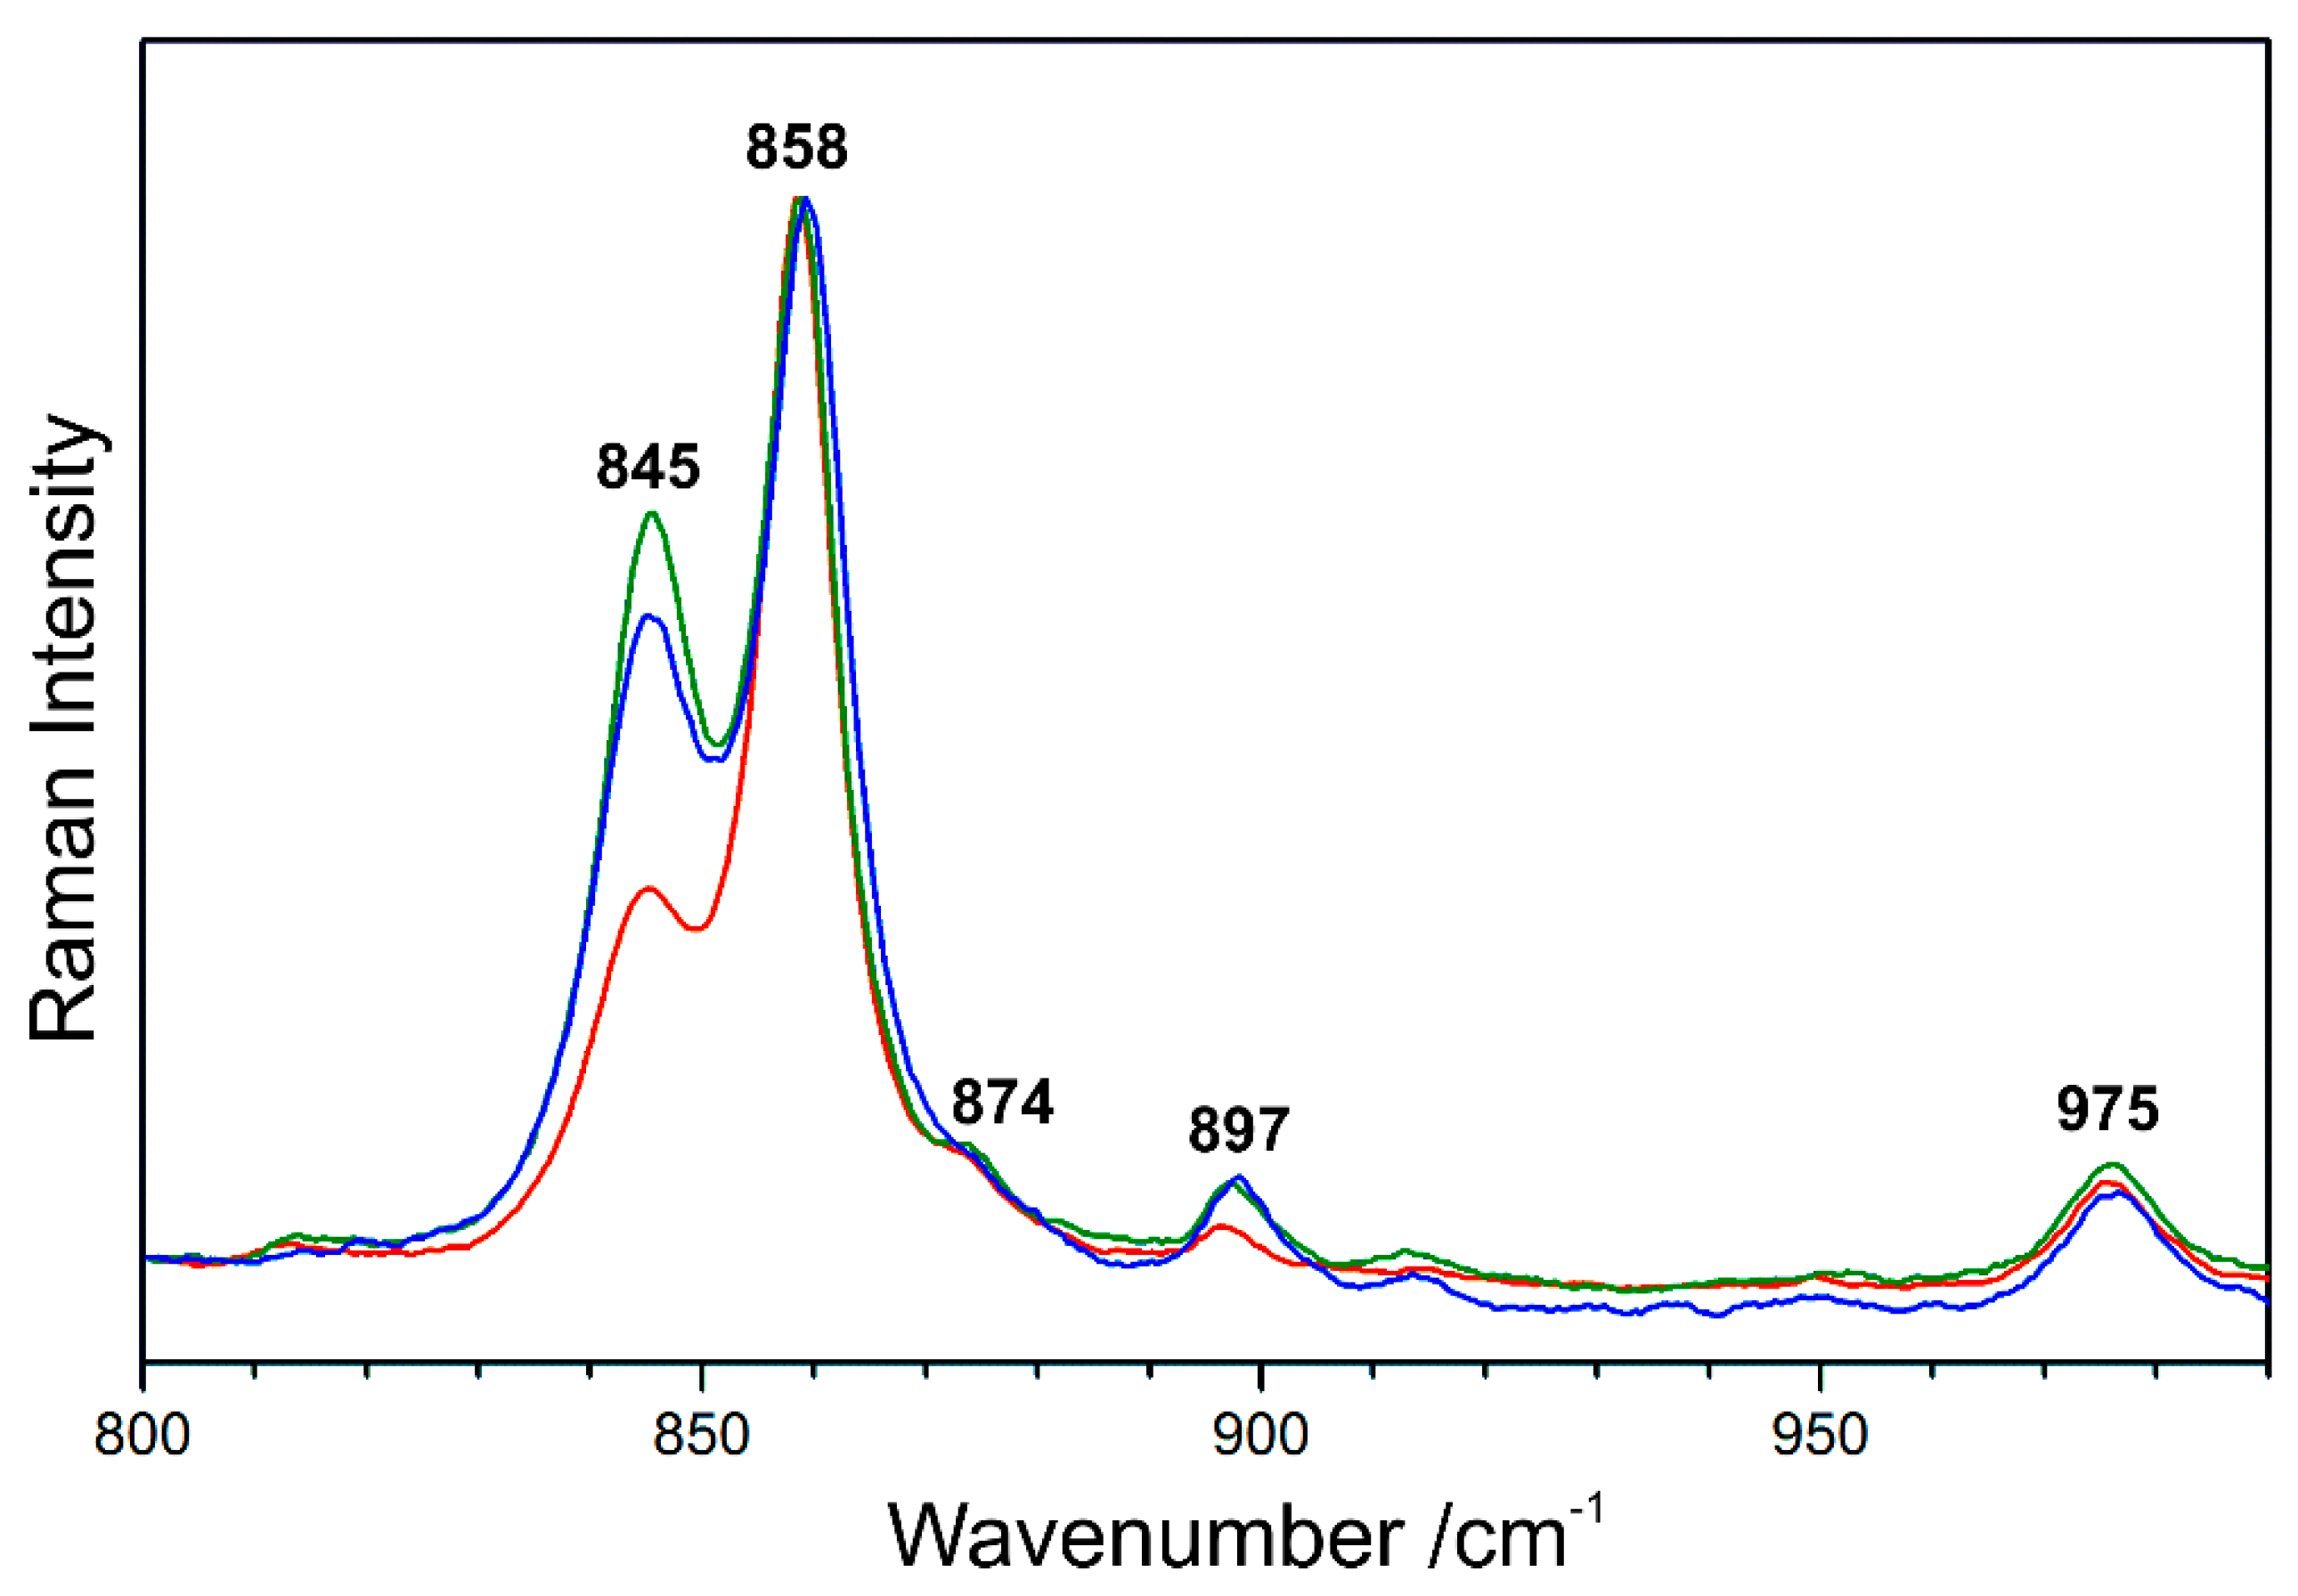
Figure 11 shows the Raman spectra of β-C2S acquired within the mapping analysis of type I belite grains and normalised to the intensity of the most prominent peak. In contrast to the evaluation of marker bands for different phases (Figure 6b) or polymorphs (Figure 9b), the intensities of three bands are analysed here, all of which assigned to the same polymorphic phase, i.e., monoclinic belite or β-C2S, respectively. Because during the mapping experiment the polarisation direction of the laser was kept constant, relative intensities of β-C2S bands only change due to different crystal orientations.
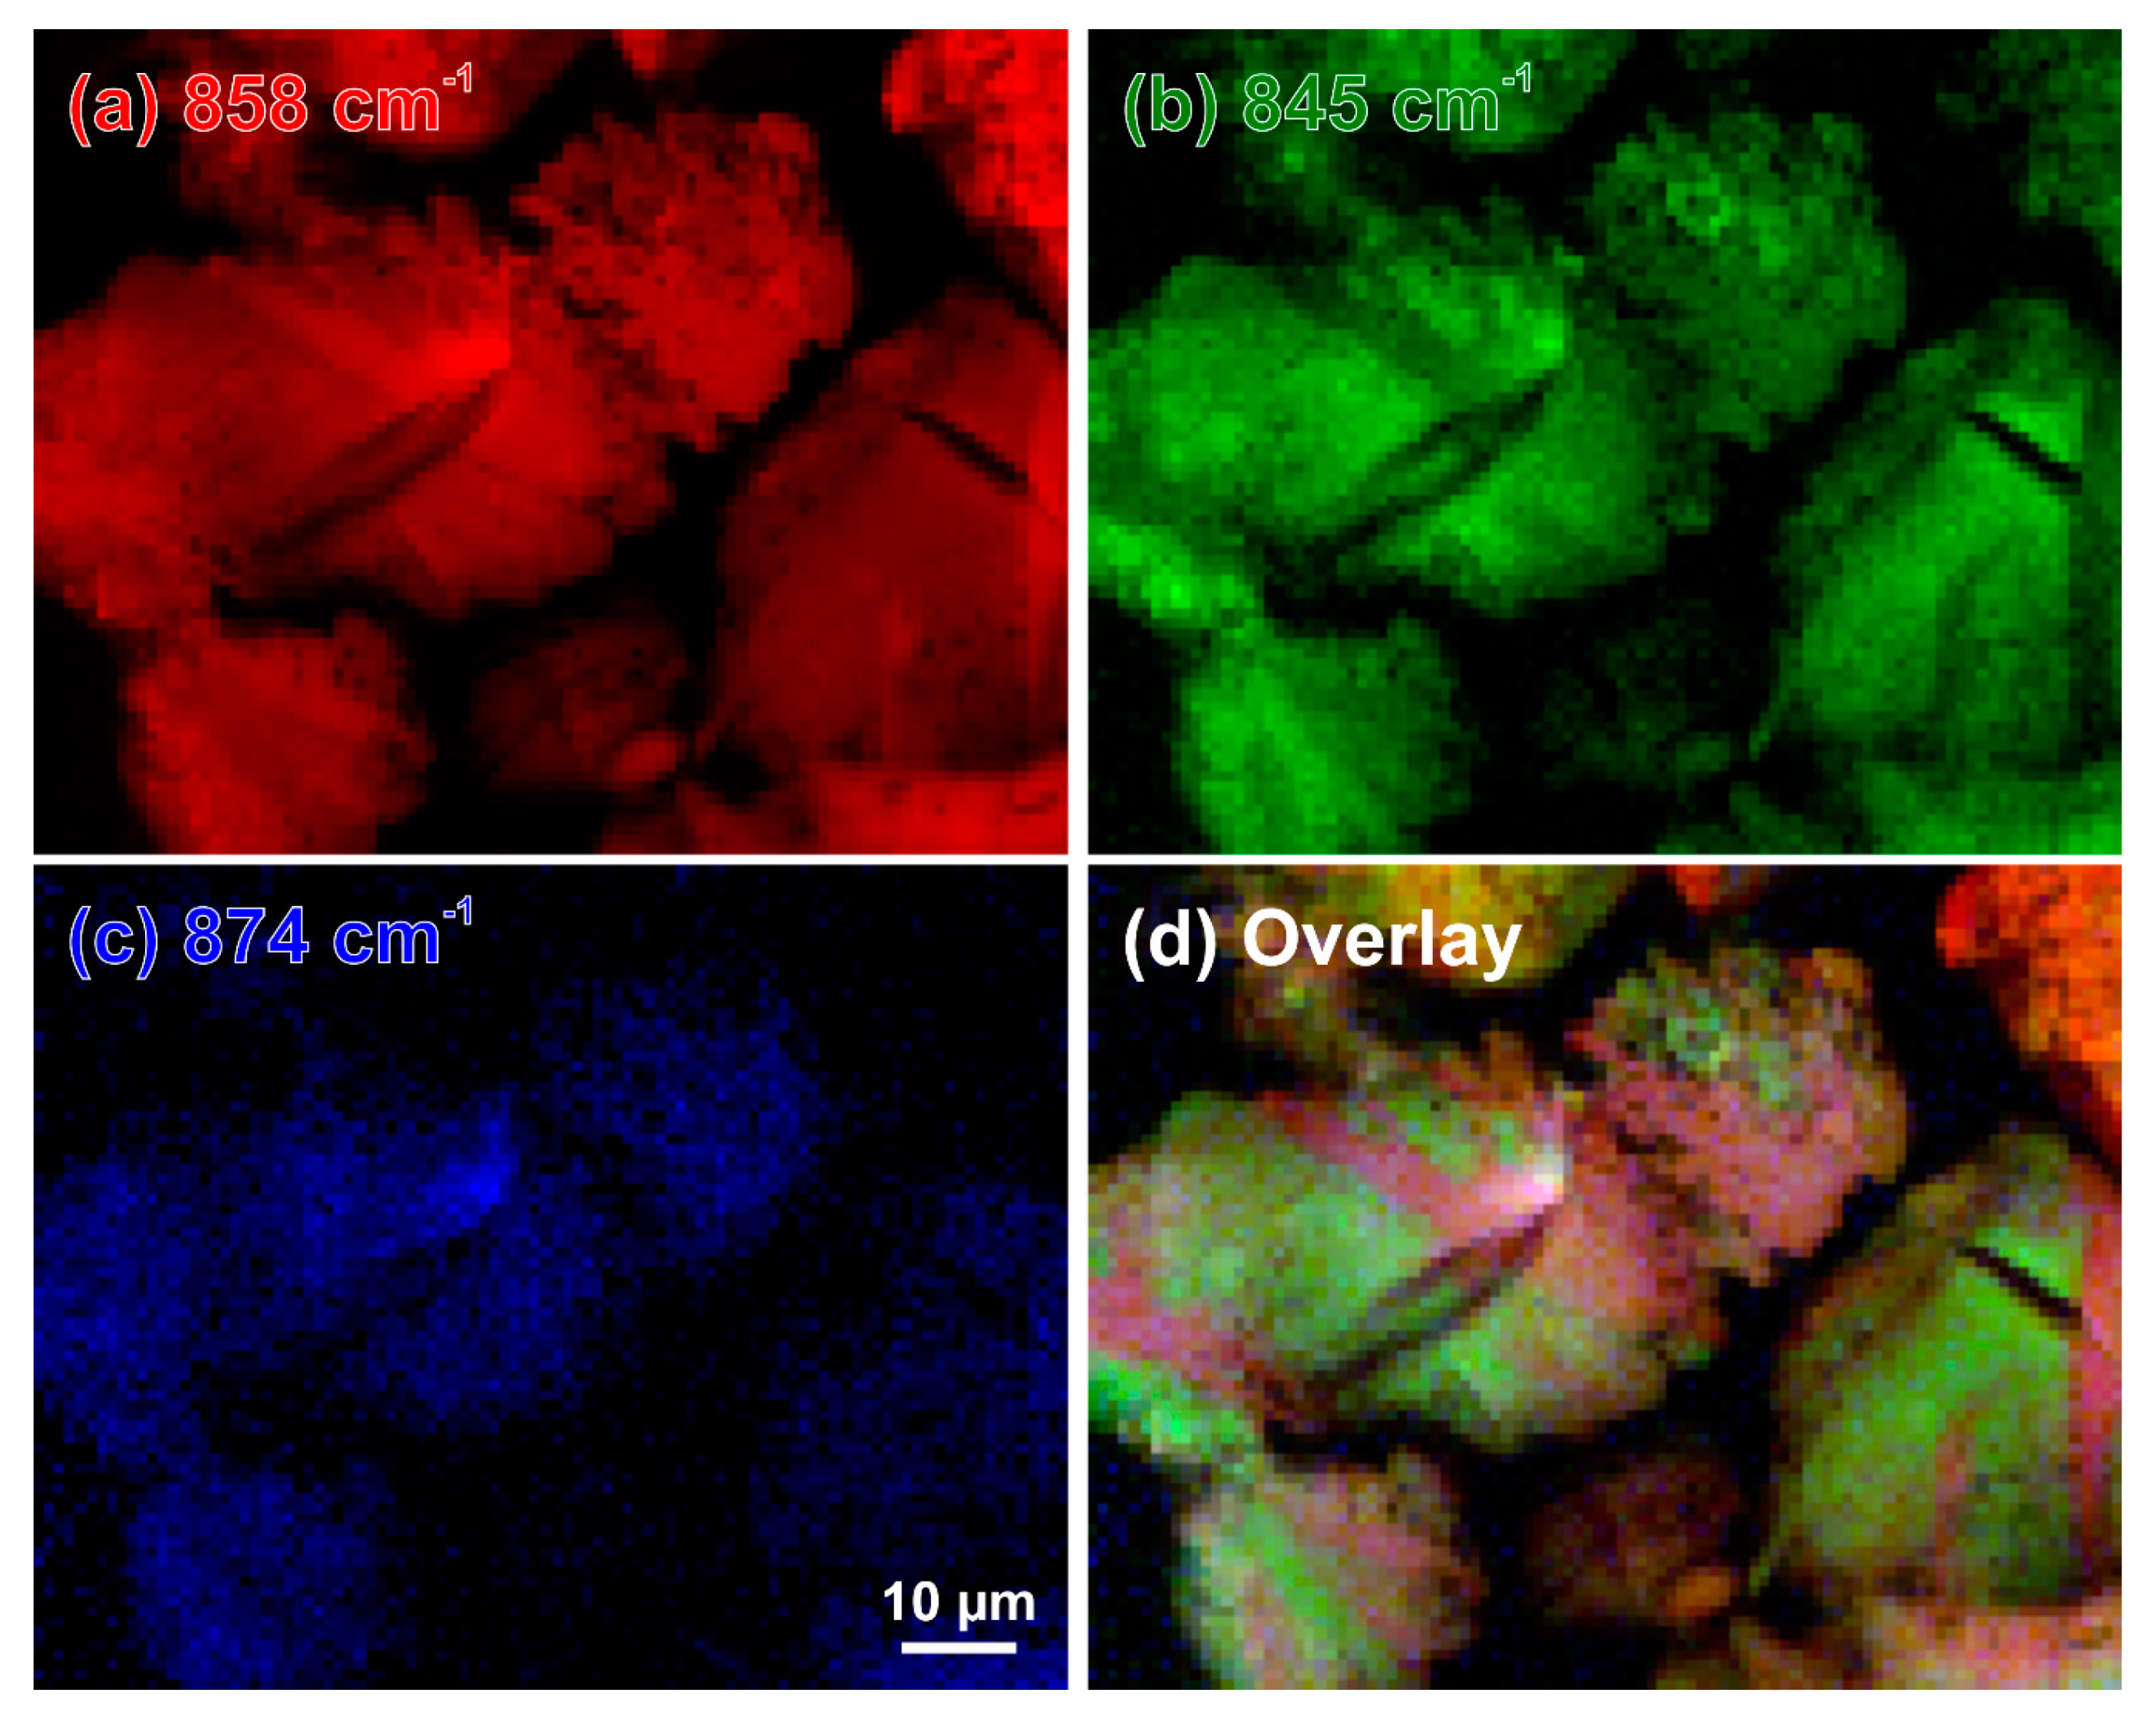
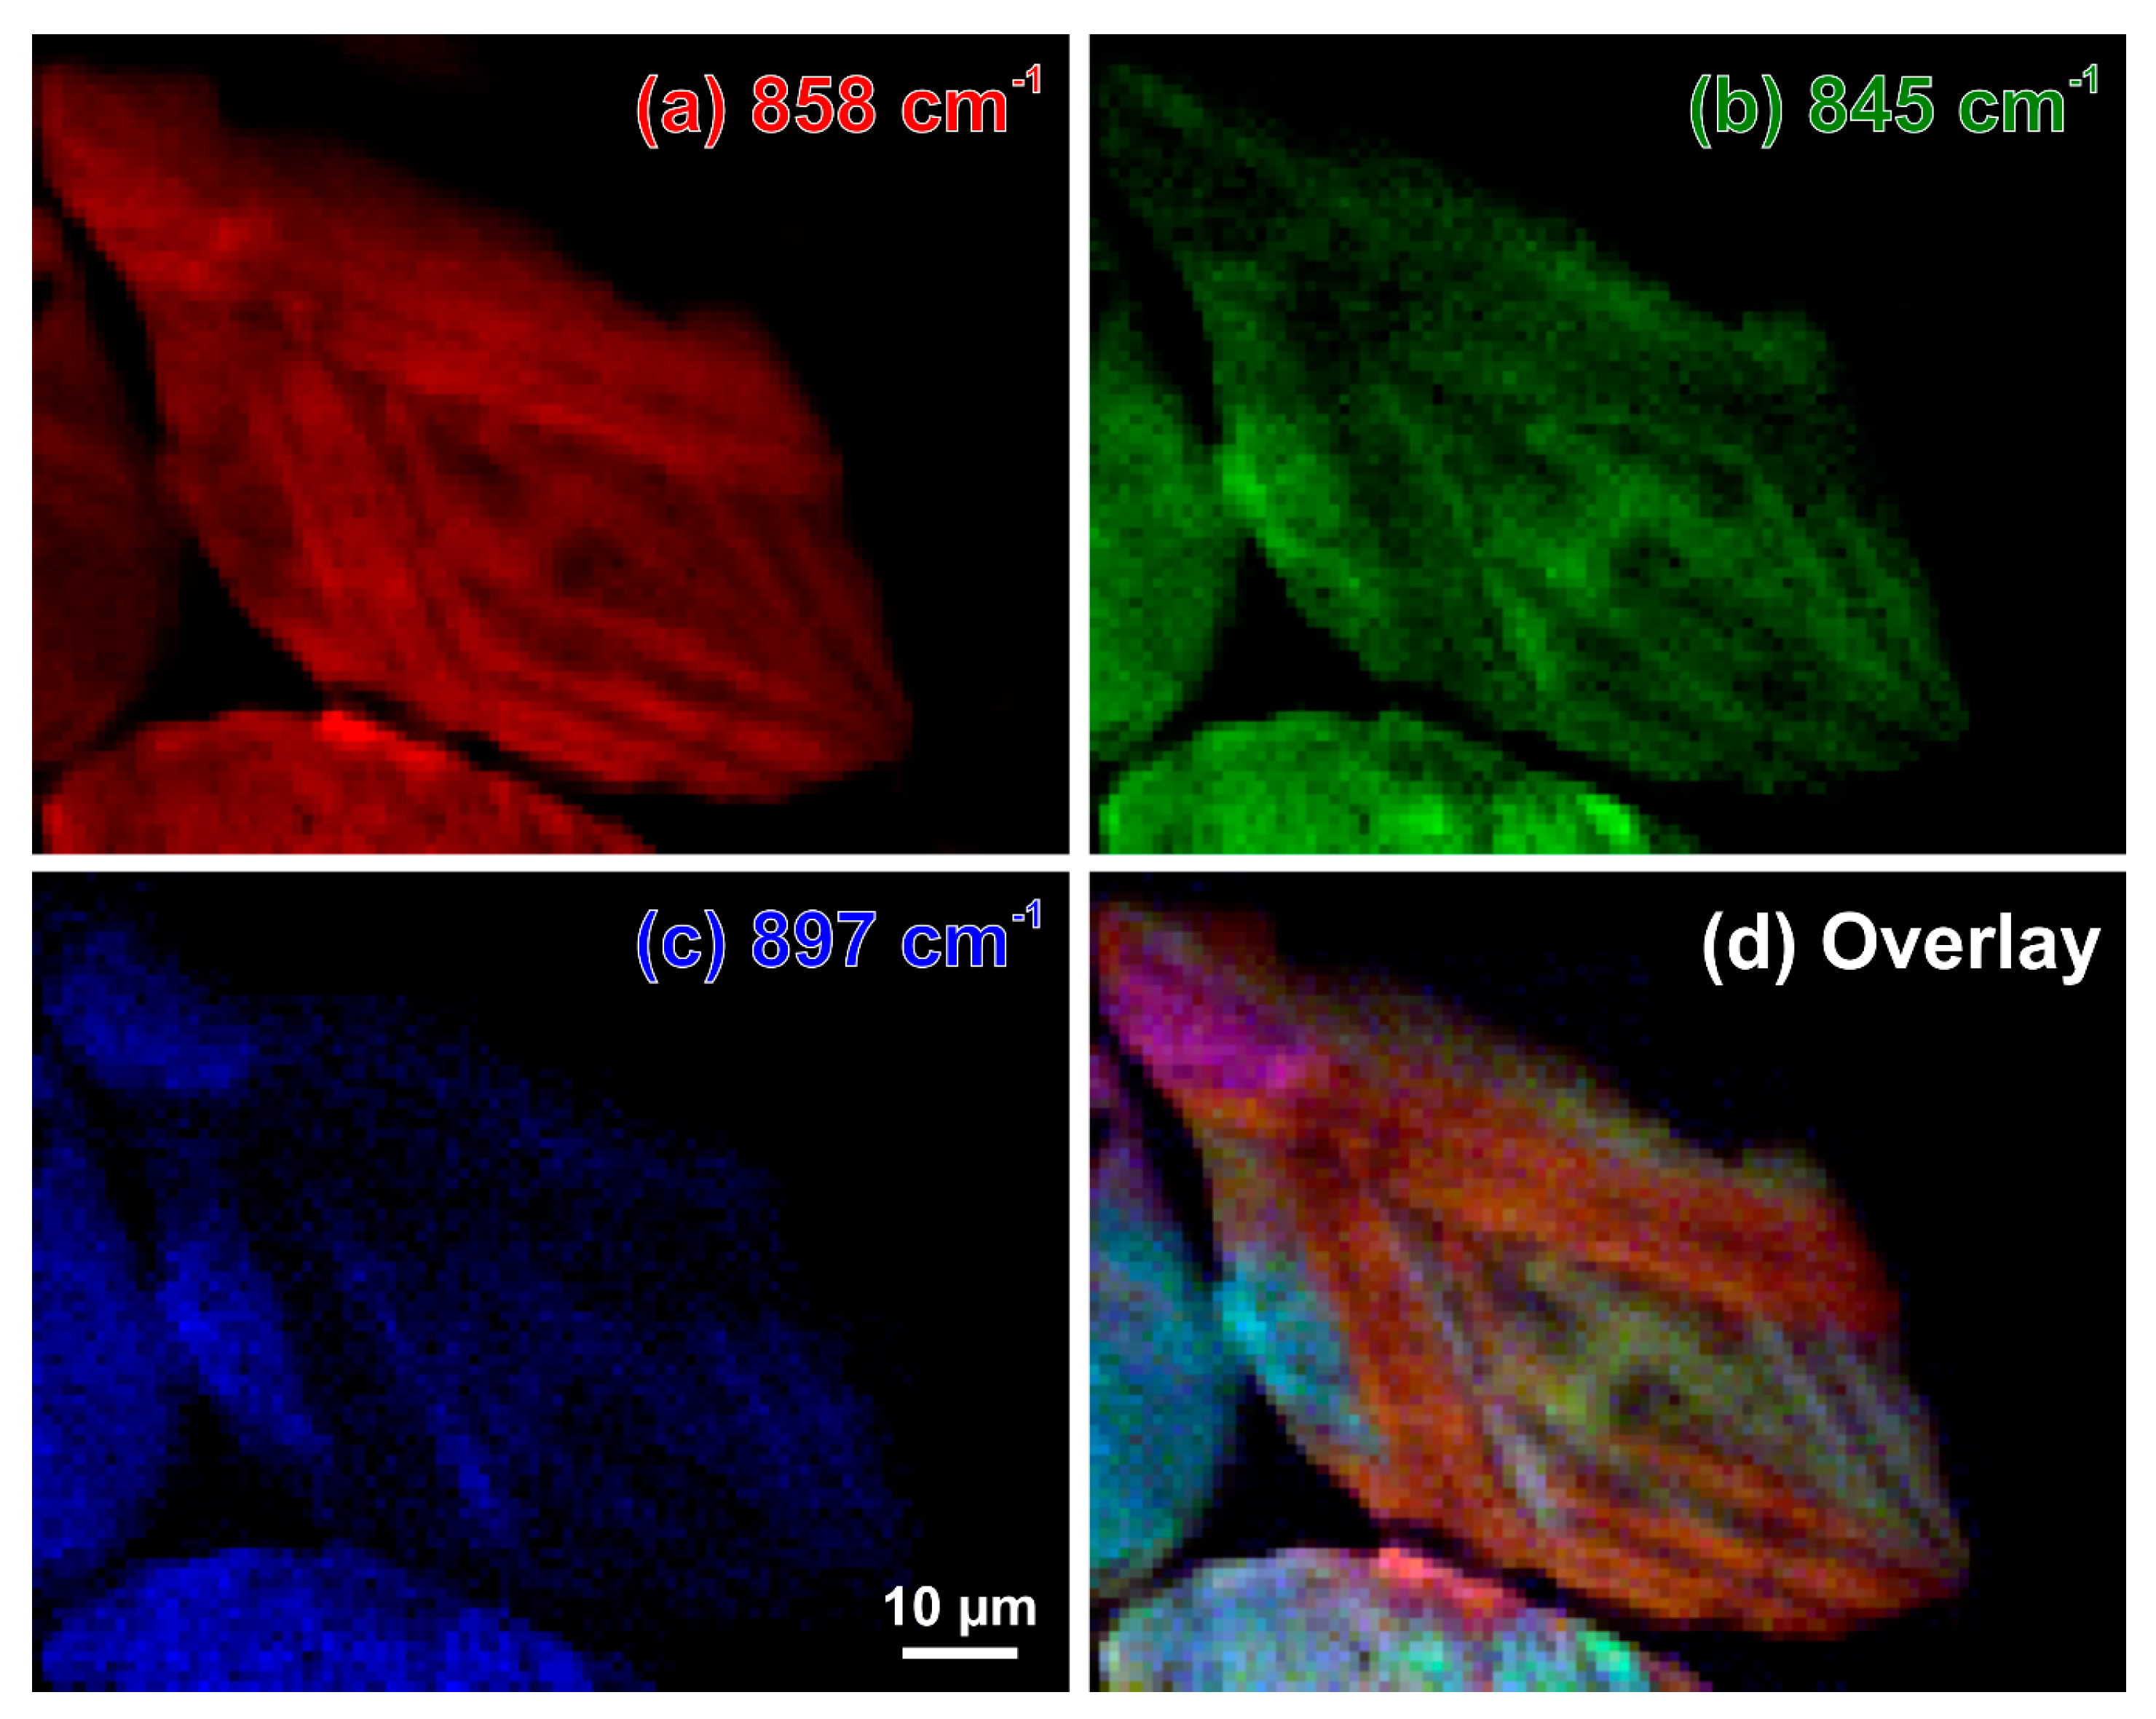
While the images based on intensities of the individual bands (Figure 12a–c and Figure 13a–c) demonstrate the independent behaviour of three β-C2S vibrational modes, the overlays in Figure 12d and Figure 13d provide deep insight into the complex microstructures of the belite grains in these samples of 19th century Portland cement mortars. The overlay contains the mixed colours yellow (red–green), purple (blue–red), and turquoise (green–blue); crystals that appear in the same (mixed) colour have the same orientation. This enables better differentiation of discrete β-C2S crystals, elucidating the microstructural protrusions of β-belite into the calcium aluminoferrite matrix as extensions of crystals having different orientations than the surrounding C2S (Figure 12d, baluster), as well as the striations as composed of cross lamellae arranged in angles of approx. 45° and 135°, respectively, and different layers (Figure 13d, cast lion sculpture).
It seems misleading that, in Figure 13d, the almost horizontal lamella on top and the close to vertical one on the left have almost the same red colour. A closer look exposes this as coincidence. A look at the numbers and, for example, the intensity ratio of the 858-cm−1 and the 975-cm−1 bands reveals small but significant differences between the almost horizontal and vertical lamellae and demonstrates the influence of the β-C2S crystals that are arranged below. As estimated in Section 2.2, the depth resolution of this experiment is approx. 22.5 µm and light absorption in the almost transparent belite grains is not expected to significantly affect it. Thus, the colours in the overlay map are also mixed between the superimposed layers, mostly leading to these seemingly contradictious red colourings.
3.4. Band Shifts Elucidate Stoichiometric Changes and Members of Solid Solution Series
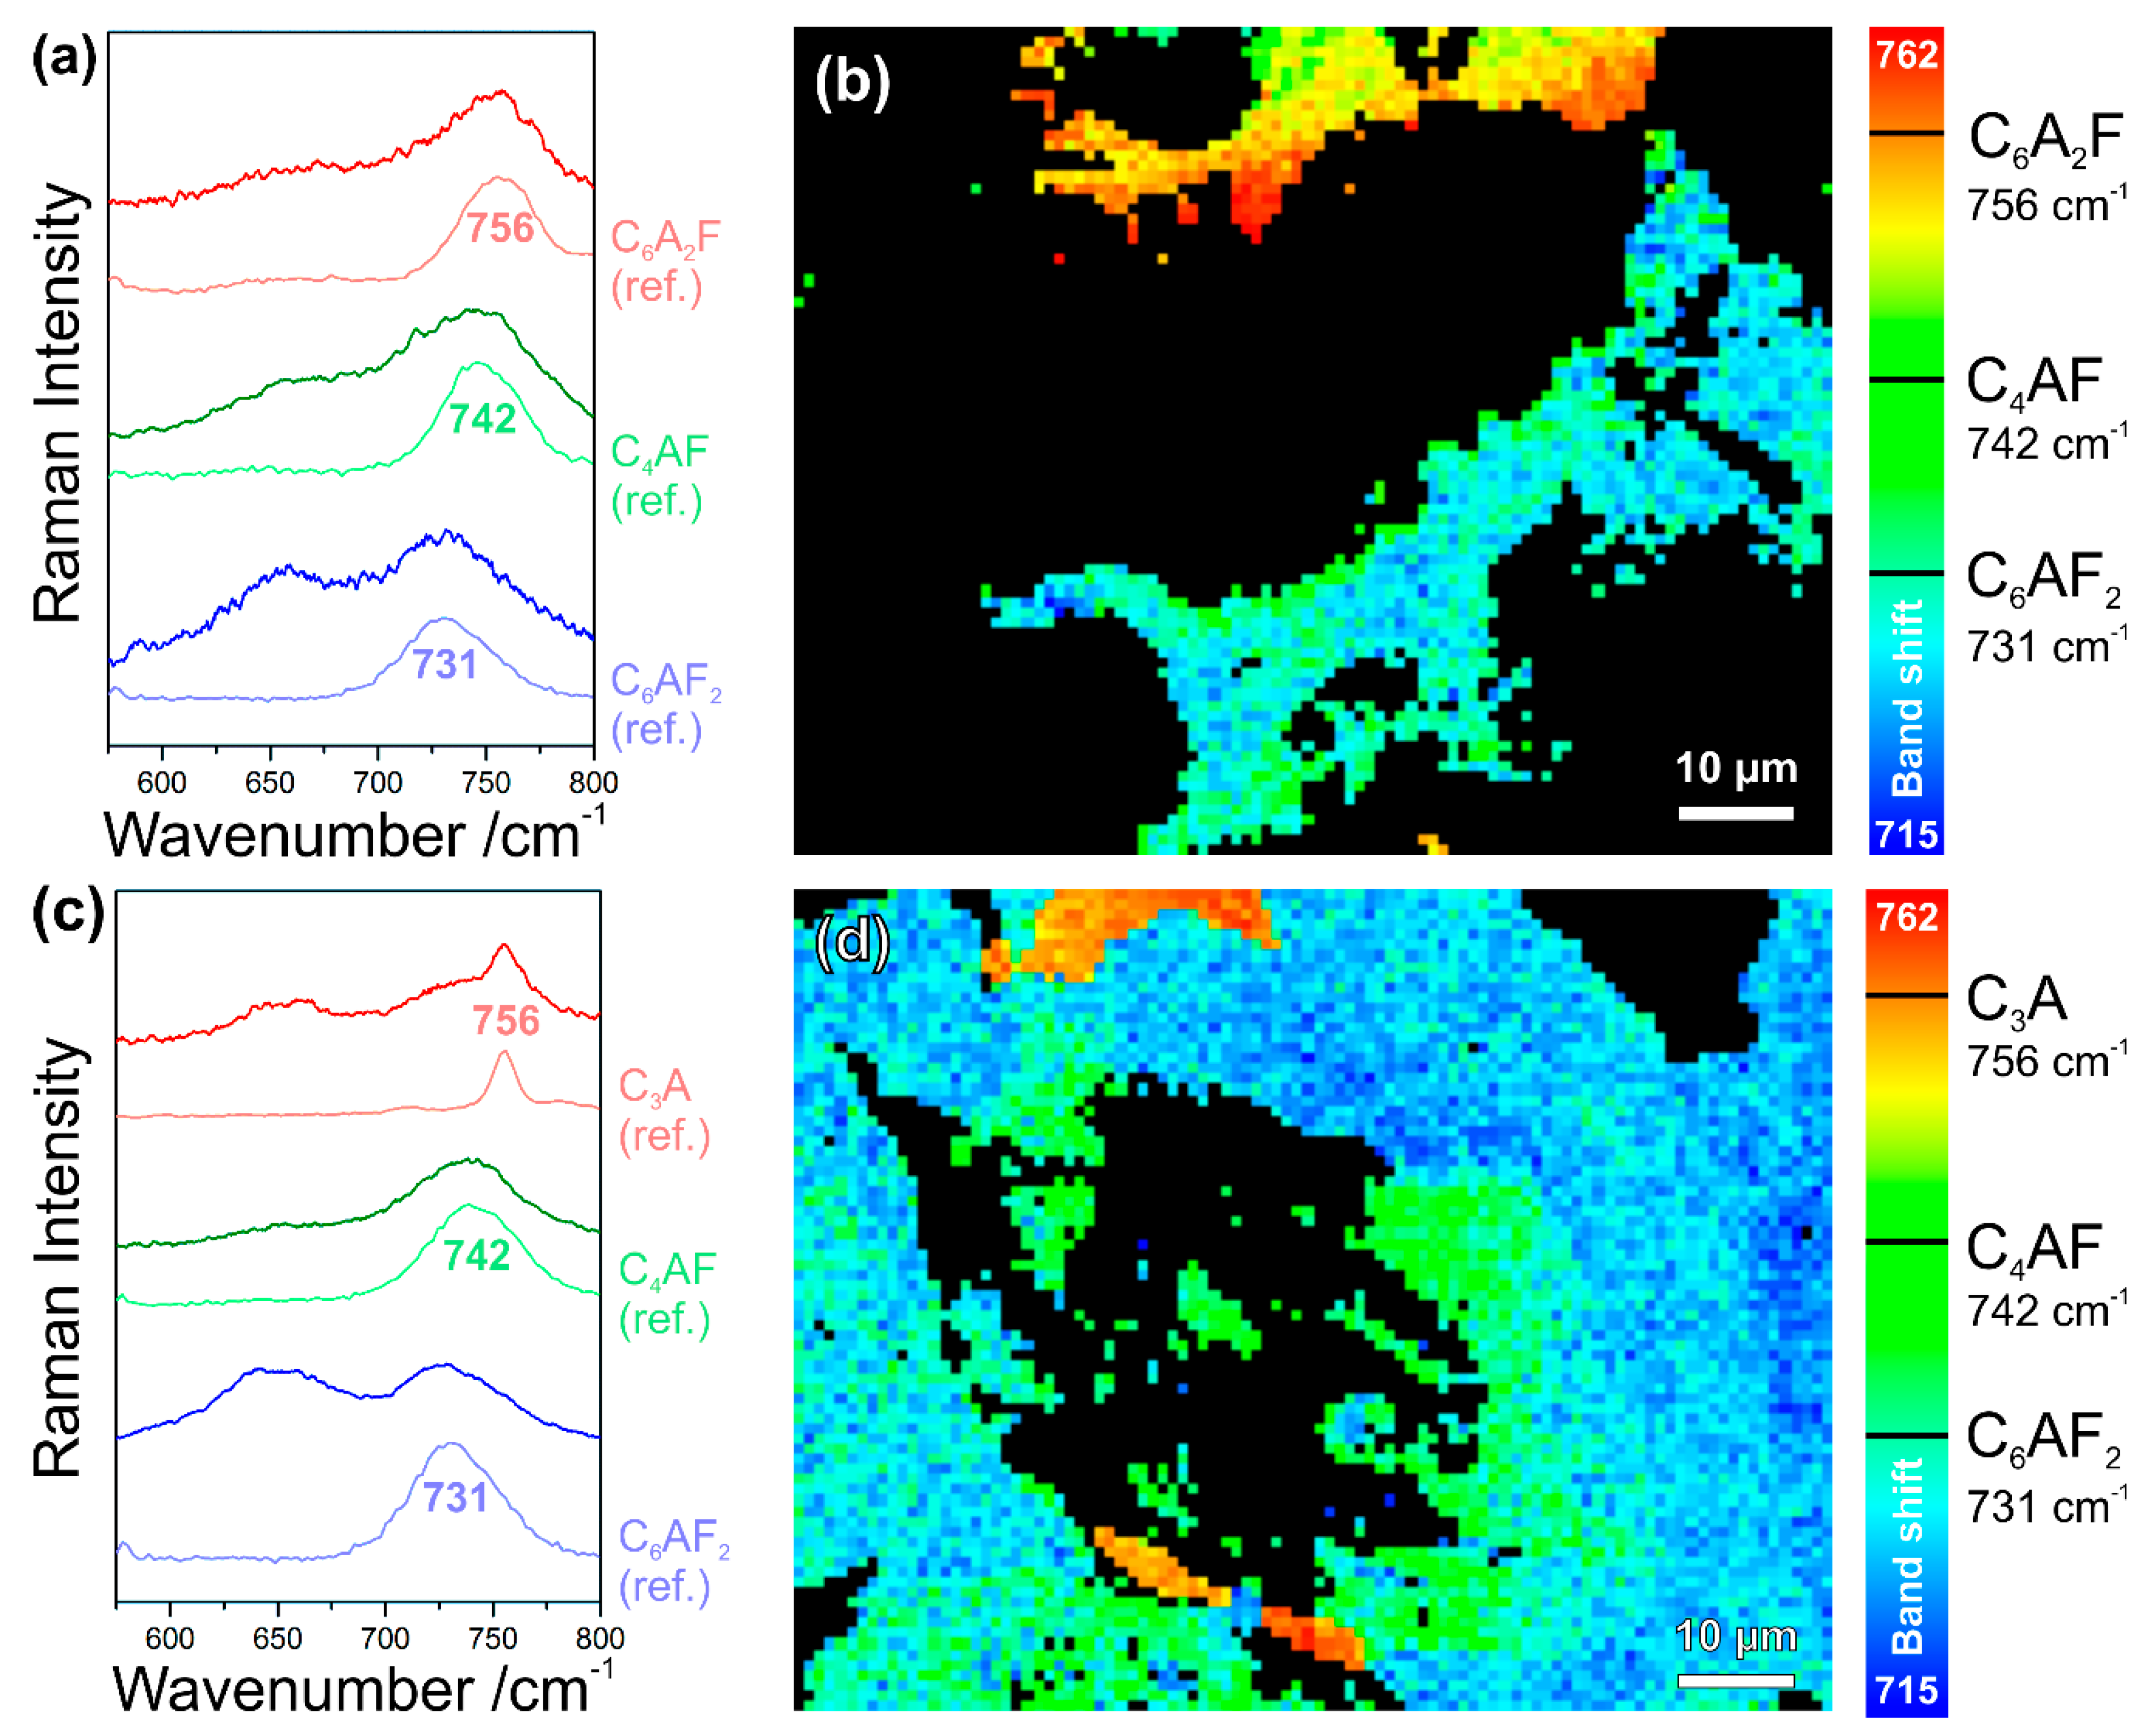
In Figure 6, all the calcium aluminoferrite phases are summarised under the general formula CxAyFz or (CaO)x(Al2O3)y(Fe2O3)z, respectively. In studies that are based on classical petrographic analysis, these interstitial phases are often subsumed as brownmillerite or Ca2AlFeO5, neglecting other members of the solid solution series C4AxF1–x or Ca2(AlxFe1–x)O5, respectively, which are difficult to discriminate by polarised light or electron microscopies. We recently demonstrated, based on pure synthesised phases, that the different stoichiometries of calcium aluminoferrites can be distinguished due to composition-induced shifts of their Raman bands, which are most pronounced in the case of the typically most intense and broad peak in the range of 731 cm−1 (C6AF2) via 742 cm−1 (C4AF) to 756 cm−1 (C6A2F) [37,38]. In simple terms, this can be understood as an effect of the atomic masses that are involved in the crystal vibrations: The replacement of iron with the lighter aluminium leads to an increase of the vibrational frequencies and wavenumbers, respectively. Also distinctive are the low-frequency modes of these phases at 256 cm−1, 310 cm−1 (both C6AF2); 259 cm−1, 314 cm−1 (C4AF); and, 263 cm−1, 318 cm−1 (C6A2F).
The intensities of the different CxAyFz bands cannot be individually evaluated within Raman mapping data comprising different members of this solid solution series due to their gradual shifts and large widths. Additionally, peak fitting failed because of the large width and overlap with neighbouring bands, as, for example, the main belite signature from approx. 840 cm−1 to 880 cm−1 and another broad band at approx. 650 cm−1, which is often found to be associated with interstitial calcium aluminoferrite phases in cement clinkers and whose nature is not yet fully understood [2]. Thus, the only way to visualise different stoichiometries of these phases is to plot the wavenumber positions of the most prominent calcium aluminoferrite bands as a function of the lateral coordinates.
Figure 14a,c show sample spectra as compared with the reference spectra of pure synthesised phases (labelled ‘ref.’), and Figure 14b,d are the results of these band shift plots. Please note that no peak fitting was performed, and thus these Raman band shift maps are composed of wavenumber positions of the highest features in each of the spectral profiles, and thus random fluctuations can be induced by noise superimposed to these broad bands (therefore, having relatively flat peak maxima). Changes in the baseline and the neighbouring overlapping bands might also contribute. These effects are the main reason for fluctuations within the blue colour range in Figure 14b,d, which is mainly assigned to C6AF2, but might also include sub-stoichiometric compositions. In contrast, it is intriguing that the maps contain features having the exact composition of brownmillerite, i.e., C4AF, which are well distinct from surrounding phases by their clearly defined boundaries.
The interstitial matrix in Figure 14b consists of C6AF2 (with some C4AF crystallites) in the bottom half of the map and of C6A2F (also including C4AF) close to the top border, being characterised by a band maximum at 756 cm−1. A close look at the spectra (examples in Figure 14c) from the Raman map in Figure 14d exposes that the band positions at 756 cm−1 in this case should be assigned to tricalcium aluminate or C3A, respectively. Sharing the same wavenumber position of their most prominent bands, C6AF2 and C3A, can be distinguished due to the significantly differing widths of these modes. The confirmation of these assignments is possible based on the appearance of other significant bands in the lower-frequency range, e.g., the secondary C3A modes at 508 cm−1 and 360 cm−1, and Figure 7, as discussed above in Section 3.1, underlines this interpretation. The full widths at half maximum (FWHMs) resulting from Gauss fits of the reference spectra shown in Figure 14a,c are approx. 45 cm−1 for C6AF2 and approx. 12 cm−1 in the case of C3A. This demonstrates that information on material properties might also be included in band shapes, which is the main topic of the following Section 3.5.
From the band shift map in Figure 14d, we not only can deduce that the type I belite grain with multidirectional lamellae is embedded in a matrix that mainly consists of C6AF2. Apparently, the exsolution of impurities from the parent belite following the α–α’ polymorphic phase transformation, the so-called remelting reaction [34,55,56], led to the crystallisation of C4AF on the boundaries of the lamellae during slow cooling. Different interpretations regarding the crystallinity of this solidified exsolved liquid do exist: While several studies assign the relatively broad band at approx. 750 cm−1 to crystalline C4AF [32,34,37,38], a broad band shifted to approx. 730 cm−1 is interpreted as being indicative for amourphous calcium aluminoferrite, as this band was also observed after laser irradiation of crystalline C4AF at elevated power [34]. When looking at the data that are presented here, this band might also be assigned to C6AF2 and might be the result of a segregation reaction, as iron-containing phases can be easily heated and chemically transformed by the action of high laser powers in Raman microspectroscopy setups (see Ref. [37] (p. 11) and references cited therein). Comparison with reference data of crystalline calcium aluminoferrite phases in Figure 14a,c does not show significant increases of band widths of the sample spectra, indicating their crystallisation upon the cooling of the exsolved liquid.
3.5. Band Widths are Measures for Crystallinities and Provide Access to the Thermal History of Medieval Gypsum Mortars
High-fired medieval gypsum mortars comprise not only calcium sulphate phases dehydrated to different degrees, but also primary accessory minerals of the gypsum deposit as well as phases newly formed through pyrometamorphic reactions. The observation of high-temperature, low-pressure mineral transformations, and the correlation of coexisting phases occurring in unhydrated binder relicts preserved in the aged gypsum matrix to the mineralogy of the raw material and the burning regime constitute the only source to the historical technological know-how because of the absence of medieval textbooks.
So far, the anhydrite morphology has been used to roughly estimate the process parameters, as the optical and electron microscopy of modern high-fired gypsum yielded the observation that the proportion of granular anhydrite, considered as hardly soluble, rises with increasing the firing temperatures at the expense of columnar anhydrite, which preferably dissolves and hydrates [57,58,59,60]. Recent studies have demonstrated that Raman microspectroscopy can trace the burning histories of individual anhydrite grains in medieval gypsum mortars by combining high structural sensitivity with spatial resolution in an almost unique fashion. Laboratory-scale burning experiments of gypsum powders have shown that anhydrite II dominates the product mixture in the temperature range from approx. 300 °C to 1180 °C (i.e., the transition temperature to the metastable anhydrite I), and it is the only phase at burning temperatures ≥500 °C. In the range of 400 °C to 900 °C significant narrowing of the anhydrite II Raman bands as well as increase in crystallite sizes, the reduction of crystal stress and strain (in powder X-ray diffraction studies), and the decrease of specific surface area (according to the Brunauer-Emmett-Teller method) were observed. At higher burning temperatures, further but much smaller changes of Raman band widths are determined, which are in the range of the values of natural anhydrite [61,62,63].
The narrowing of Raman bands can be understood as a consequence of the healing of crystal lattice defects and the according increase of crystallinity. Raman band widths (typically expressed as FWHMs) of the most prominent anhydrite II mode at 1017 cm−1 in the room-temperature spectra of burning products follow a decreasing sigmoidal trend in the range of 400 °C to 1100 °C. This trend can be applied as a calibration curve enabling the measurement of burning temperatures, which individual anhydrite crystallites have experienced, with an uncertainty of approx. ±50 K [62,63]. In the polished thin-sectional samples of high-fired medieval gypsum mortars, anhydrite grains can be found by polarised light or electron microscopies, either in remnant clusters of firing products or spread as individual crystallites within the gypsum matrix. Raman maps of selected areas reveal phase compositions and their distributions (according to Section 3.1) along with Raman band width distributions of anhydrite II, which can be evaluated via comparison with reference data from the burning experiments to yield the approximate burning temperatures.
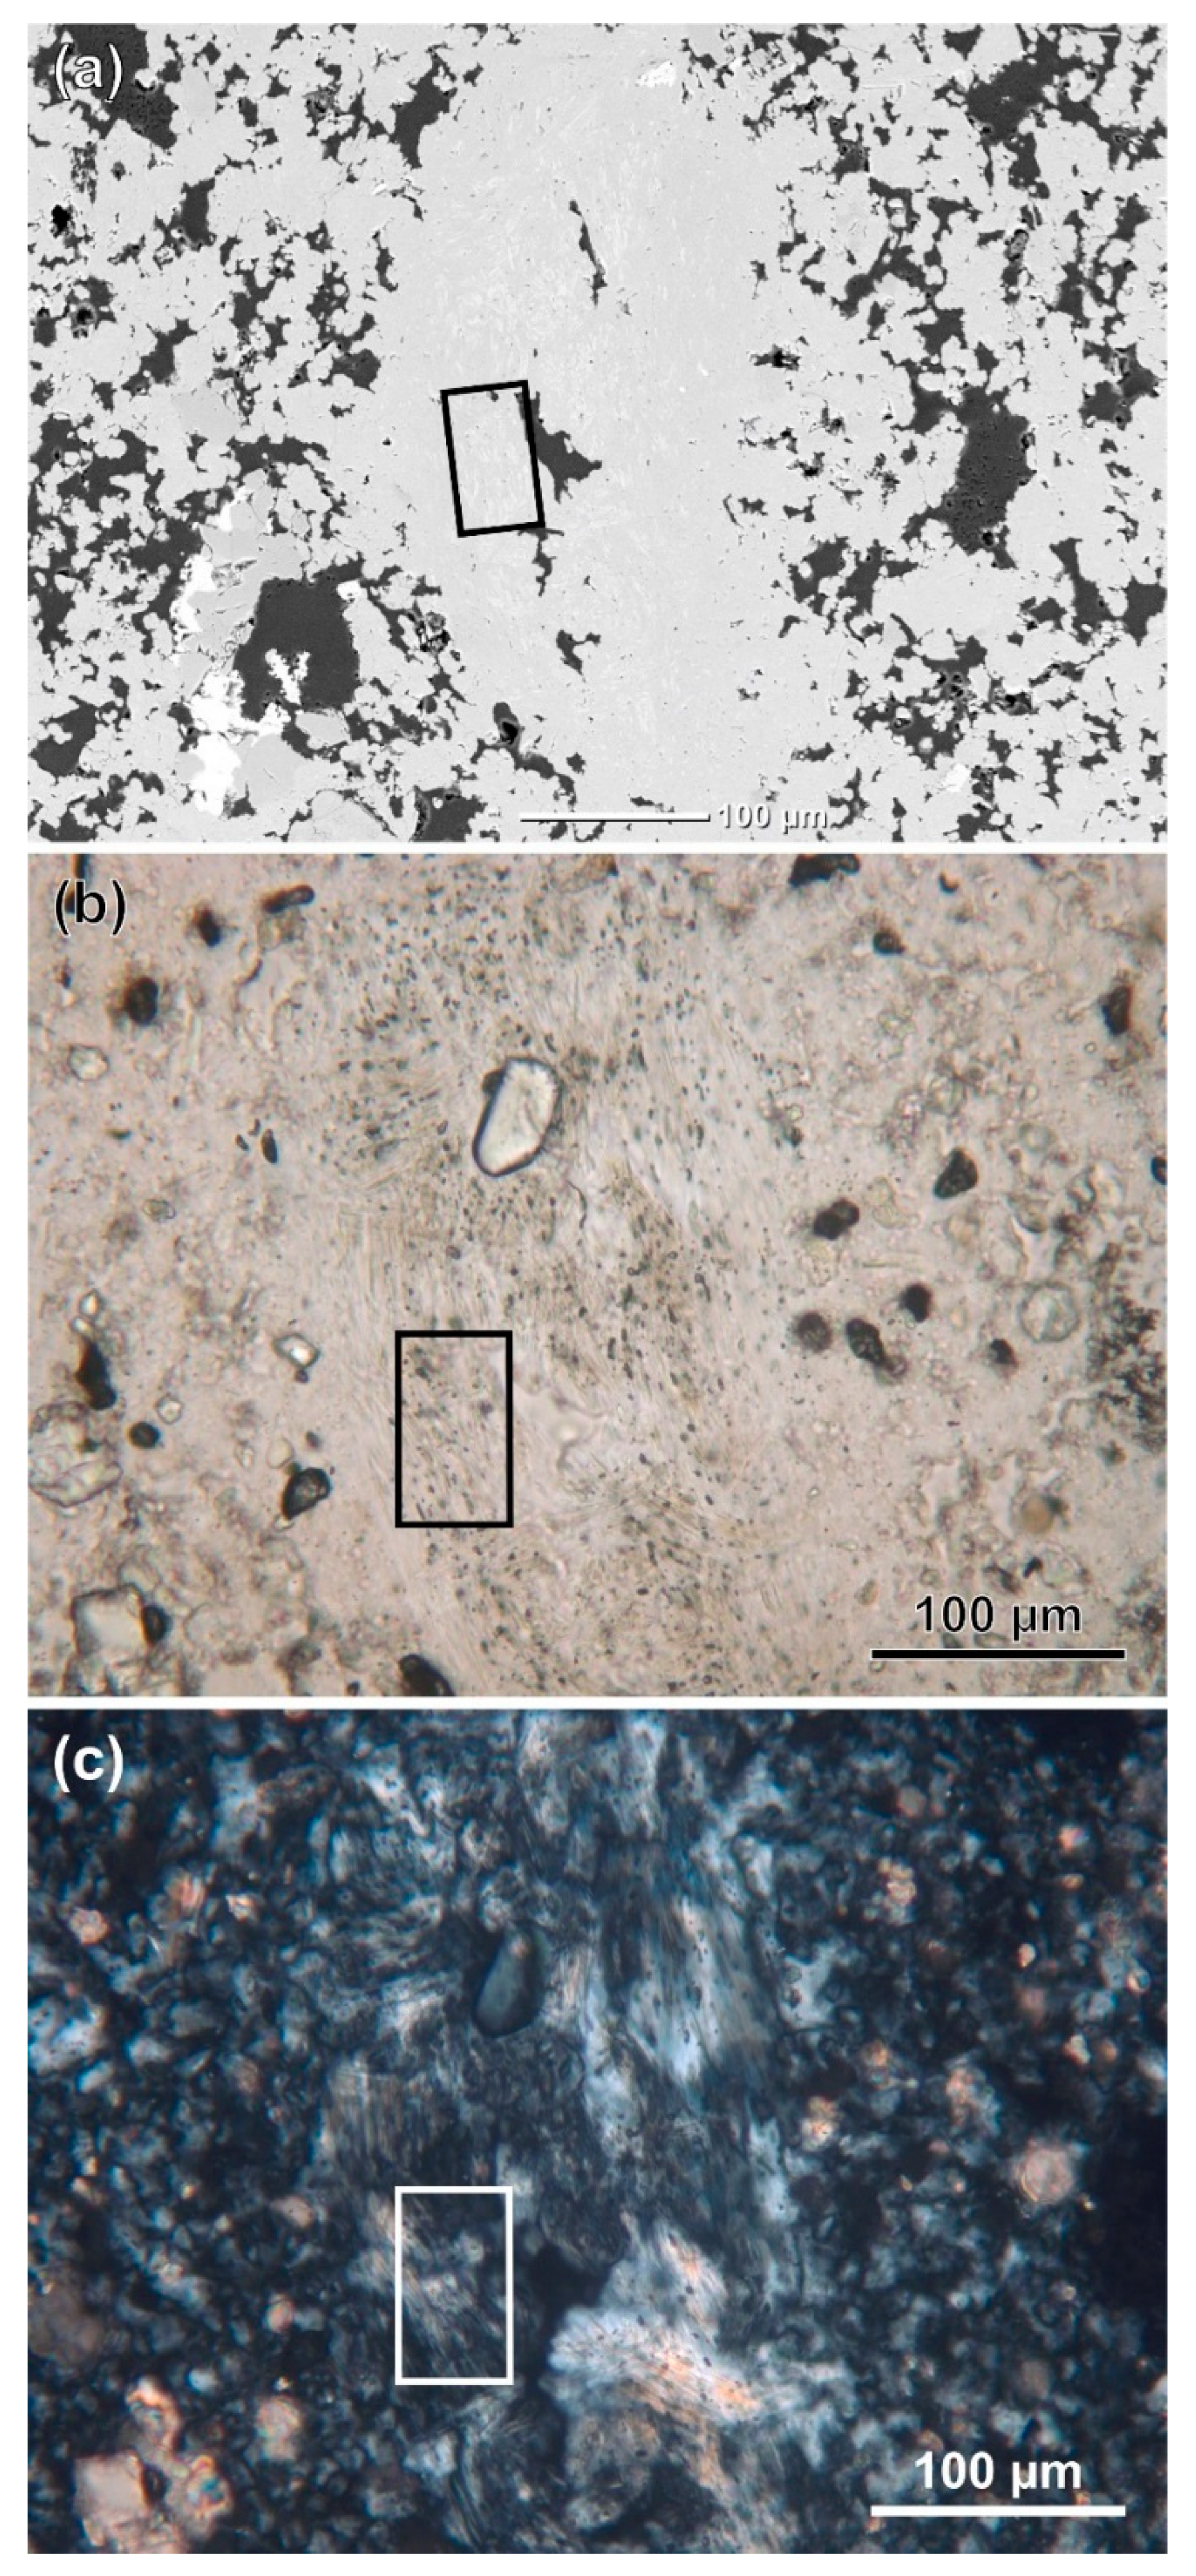
Figure 15 displays the electron and light micrographs of an assemblage of firing products in the hydrated binder matrix of a high-fired medieval gypsum mortar. Experienced scientists can identify such clusters by both techniques. In electron microscopy with backscattered electron (BSE) detection, image contrast depends on the atomic numbers of the involved chemical elements. In the shown example, the black areas represent the organic embedding resin (mainly consisting of the elements C, H, and O), while the brightest features are celestine crystals (SrSO4, containing the high-atomic-number element strontium). Surrounded by gypsum (CaSO4⋅2H2O), anhydrite (CaSO4) grains appear to be slightly brighter due to their higher average atomic number. In polarised light micrographs that are captured with crossed Nicols, anhydrite can be distinguished from gypsum due to different (relief and) birefringence.
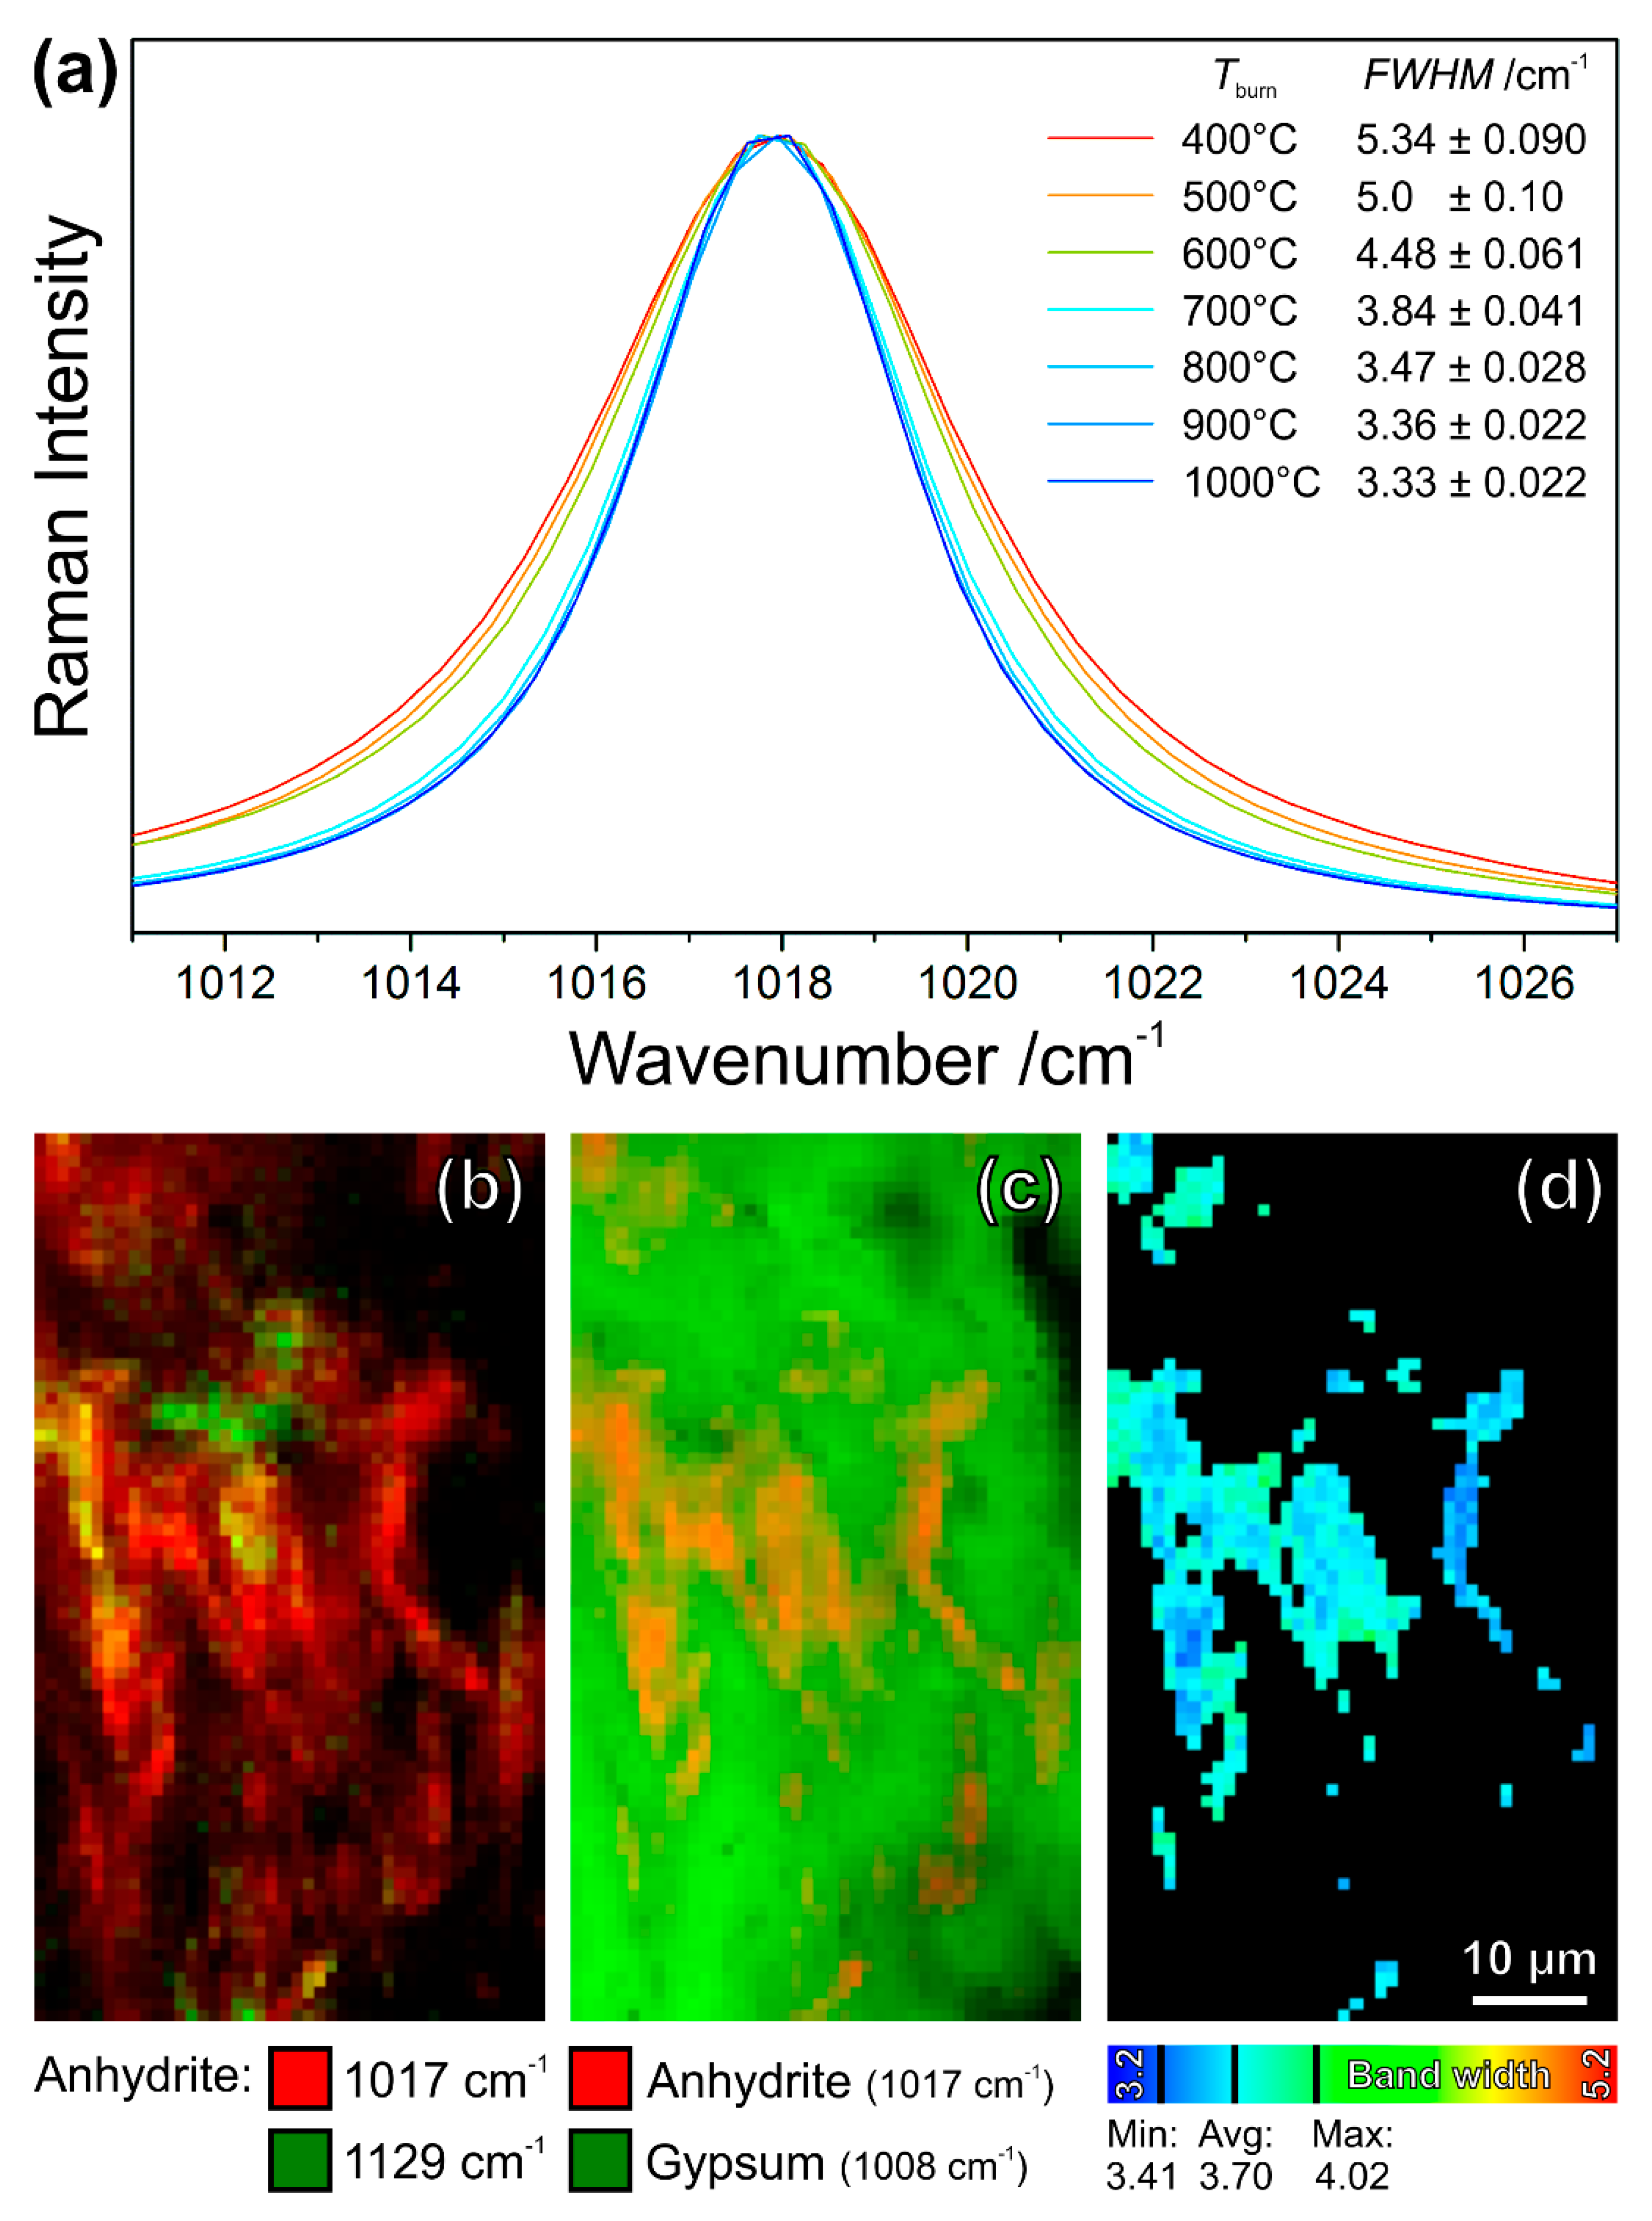
The Raman spectrum of anhydrite II includes bands at 124 cm−1, 133 cm−1, 152 cm−1, 169 cm−1, 233 cm−1, and 269 cm−1, corresponding to vibrational crystal-lattice modes, while the vibrations of the sulphate ion are reflected by bands at 417 cm−1, 500 cm−1, 609 cm−1, 628 cm−1, 676 cm−1, 1000 cm−1, 1017 cm−1, 1110 cm−1, 1129 cm−1, and 1160 cm−1. Figure 16a provides a close look at the most intense Raman band of anhydrite II at 1017 cm−1. The different band shapes that were obtained at room temperature are characteristic of the burning temperatures that were employed during the synthesis of anhydrite from gypsum powder. Band widths, expressed as FWHMs, were determined by fitting Lorentz functions to the peak profiles of 64 individual Raman measurements on different crystallites of each temperature step. The FWHMs that are listed in Figure 16a are the mean values and standard deviations of these 64 measurement values, revealing the described steady decrease in band widths with increasing temperatures [62,63].
Note that the given numbers are exactly valid only for the actual Raman instrument and the measurement parameters (see Section 2.2), including, for example, a laser wavelength of 532 nm, a 100 µm wide spectrometer entrance slit, and a diffraction grating having 1800 lines per millimetre [63]. A detailed description of the analytical method, comprising the measurement parameters and data evaluation, as well as the correction of instrument-related broadening, can be found in Ref. [63]. Further application examples and details of the method are given in Ref. [62].
The shown example of a gypsum–anhydrite cluster (Figure 15) was mapped on an area of 75 µm × 44 µm, with a step size of 1 µm × 1 µm (Figure 16b–d). The resulting spectra only contained the signatures of gypsum (most prominent band at 1008 cm−1) and anhydrite II (1017 cm−1). According to the previous Section 3.1 and Section 3.3, the phase- and orientation-distribution maps were calculated by evaluation of band intensities. In Figure 16b, the intensities of the main anhydrite band at 1017 cm−1 (red pixels) and of a secondary mode of the same phase appearing at 1129 cm−1 (green) are plotted as a function of the mapping coordinates. This Raman map confirms the lath-shaped anhydrite crystals that are also seen in the electron and light micrographs in Figure 15, and the different crystal orientations, resulting in different (mixed) colours, enable a better identification of individual crystallites. The Raman intensity map of the marker bands of gypsum (1008 cm−1, green) and anhydrite II (1017 cm−1, red) in Figure 16c is also in agreement with the microscopic observations.
The Raman band width evaluations were restricted to relatively strong bands, because the weak bands, in some cases, do not yield meaningful results in the peak fitting procedure and their obtained widths are often significantly affected by the neighbouring and partly overlapping gypsum band (see Refs. [62,63] for details). Thus, not all anhydrite crystallites shown in Figure 16b were evaluated by peak fitting. The resulting band widths in Figure 16d range from 3.41 cm−1 to 4.02 cm−1, and their average (n = 545 pixels or spectra, respectively, were evaluated) of 3.70 cm−1 is an FWHM between those that are assigned to 800 °C and 700 °C in Figure 16a (according to Ref. [63] the value determined for 750 °C is 3.63 ± 0.035), which is interpreted in the sense that the examined thermal anhydrite grains experienced calcination temperatures of approx. 750 °C ± 50 K.
4. Conclusions
The potential of Raman microscopy in the analysis of architectural heritage has been demonstrated by imaging unhydrated binder remnants in historical mortars. This approach is a very interesting complementation of the existing tools for petrographic analysis, because Raman microspectroscopic data combine high structural information content with spatial resolution on the micrometre scale, enabling the reconstruction of the process parameters that were applied during the production of mineral binders: The burning temperatures of high-fired medieval gypsum mortars can be determined by measuring the Raman band widths of unhydrated anhydrite grains that are found either in clusters of firing products or spread within the gypsum matrix. Indicators for the slow cooling of 19th-century cements in the batchwise operated shaft kilns, such as morphology, polymorphism, and (sub-)stoichiometric compositions of solid solutions, can be studied and imaged due to the high sensitivity of Raman spectroscopy to chemical and physical material properties.
Author Contributions
Conceptualisation, T.S. and P.D.; methodology, T.S. and P.D.; software, T.S.; formal analysis, T.S.; investigation, T.S. and P.D.; resources, P.D.; data curation, T.S.; writing—original draft preparation, T.S. and P.D.; writing—review and editing, T.S. and P.D.; visualisation, T.S.; project administration, P.D.; funding acquisition, P.D.
Funding
We gratefully acknowledge a scholarship and funding of the equipment by DFG GSC 1013 SALSA.
Acknowledgments
The authors gratefully acknowledge Tobias Hotz (TH-Conservations, Weinfelden, Switzerland) for providing samples from the balustrade of the pavilion in Feldbach and the “Zurileu” in Zurich. We likewise thank Doris Warger and Florian Nick (Doris Warger AG, Frauenfeld, Switzerland) for the sample from stucco elements in the Holy Cross Chapel of the convent of St. John in Müstair.
Conflicts of Interest
The authors declare no conflict of interest. The funders had no role in the design of the study; in the collection, analyses, or interpretation of data; in the writing of the manuscript, or in the decision to publish the results.
References
- Kaszowska, Z.; Malek, K.; Staniszewska-Slezak, E.; Niedzielska, K. Raman scattering or fluorescence emission? Raman spectroscopy study on lime-based building and conservation materials. Spectrochim. Acta A 2016, 169, 7–15. [Google Scholar] [CrossRef] [PubMed]
- Schmid, T.; Dariz, P. Determination and imaging of binder remnants and aggregates in historic artificial stone by Raman microscopy. J. Raman Spectrosc. 2013, 44, 882–891. [Google Scholar] [CrossRef]
- Schmid, T.; Dariz, P. Chemical imaging of historical mortars by Raman microscopy. Constr. Build. Mater. 2016, 114, 506–516. [Google Scholar] [CrossRef]
- Jallad, K.; Santhanam, M.; Cohen, M.; Ben-Amotz, D. Chemical mapping of thaumasite in sulfate-attacked cement mortar using near-infrared Raman imaging microscopy. Cem. Concr. Res. 2001, 31, 953–958. [Google Scholar] [CrossRef]
- Sahu, S.; Exline, D.; Nelson, M. Identification of thaumasite in concrete by Raman chemical imaging. Cem. Concrete Comp. 2002, 24, 347–350. [Google Scholar] [CrossRef]
- García-Florentino, C.; Maguregui, M.; Morillas, H.; Balziskueta, U.; Azcarate, A.; Arana, G.; Madariaga, J. Portable and Raman imaging usefulness to detect decaying on mortars from Punta Begoña Galleries (Getxo, North of Spain). J. Raman Spectrosc. 2016, 47, 1458–1466. [Google Scholar] [CrossRef]
- Irazola, M.; Olivares, M.; Castro, K.; Maguregui, M.; Martínez-Arkarazo, I.; Madariaga, J. In situ Raman spectroscopy analysis combined with Raman and SEM-EDS imaging to assess the conservation state of 16th century wall paintings. J. Raman Spectrosc. 2012, 43, 1676–1684. [Google Scholar] [CrossRef]
- Maguregui, M.; Knuutinen, U.; Trebolazabala, J.; Morillas, H.; Castro, K.; Martínez-Arkarazo, I.; Madariaga, J. Use of in situ and confocal Raman spectroscopy to study the nature and distribution of carotenoids in brown patinas from a deteriorated wall painting in Marcus Lucretius House (Pompeii). Anal. Bioanal. Chem. 2012, 402, 1529–1539. [Google Scholar] [CrossRef]
- Veneranda, M.; Irazola, M.; Pitarch, A.; Olivares, M.; Iturregui, A.; Castro, K.; Madariaga, J. In-situ and laboratory Raman analysis in the field of cultural heritage: The case of a mural painting. J. Raman Spectrosc. 2014, 45, 228–237. [Google Scholar] [CrossRef]
- Raman, C.V.; Krishnan, K.S. A new type of secondary radiation. Nature 1928, 121, 501–502. [Google Scholar] [CrossRef]
- Opilik, L.; Schmid, T.; Zenobi, R. Modern Raman imaging: Vibrational spectroscopy on the micrometer and nanometer scales. Annu. Rev. Anal. Chem. 2013, 6, 379–398. [Google Scholar] [CrossRef] [PubMed]
- Rayleigh, L. Investigations in Optics, with Special Reference to the Spectroscope. Philos. Mag. 1879, 8, 261–274. [Google Scholar] [CrossRef]
- Schmid, T.; Schäfer, N.; Levcenko, S.; Rissom, T.; Abou-Ras, D. Orientation-distribution mapping of polycrystalline materials by Raman microspectroscopy. Sci. Rep. 2015, 5, 18410. [Google Scholar] [CrossRef] [PubMed]
- Schmid, T.; Schäfer, N.; Abou-Ras, D. Raman microspectroscopy provides access to compositional and microstructural details of polycrystalline materials. Spectrosc. Eur. 2016, 28, 16–20. [Google Scholar]
- Campbell, D. Microscopical Examination and Interpretation of Portland Cement and Clinker, 2nd ed.; Portland Cement Association: Skokie, IL, USA, 1999. [Google Scholar]
- Gille, F.; Dreizler, I.; Grade, K.; Krämer, H.; Woermann, E. Mikroskopie des Zementklinkers: Bilderatlas; Beton-Verlag: Düsseldorf, Germany, 1965. [Google Scholar]
- Hofmänner, F. Portlandzement-Klinker. Kleine Gefügekunde; Holderbank: Heerbrugg, Switzerland, 1973. [Google Scholar]
- Stutzman, P. Microscopy of clinker and hydraulic cements. Rev. Mineral. Geochem. 2012, 74, 101–146. [Google Scholar] [CrossRef]
- Du Toit, P.; Caragacean, L. Benefits of microscopy for raw material preparation and clinker processing. In Proceedings of the 15th Euroseminar on Microscopy Applied to Building Materials, Delft, The Netherlands, 17–19 June 2015; Çopuroglu, O., Ed.; Delft University of Technology: Delft, The Netherlands, 2015; pp. 25–32. [Google Scholar]
- French, W. Concrete petrography: A review. Q. J. Eng. Geol. 1991, 24, 17–48. [Google Scholar] [CrossRef]
- Poole, A.; Sims, I. Concrete Petrography: A Handbook of Investigative Techniques, 2nd ed.; Taylor & Francis Group: London, UK, 2016. [Google Scholar]
- Blezard, R. Technical aspects of Victorian cement. Chem. Ind. 1981, 17, 630–636. [Google Scholar]
- Pintér, F.; Gosselin, C. Material characteristics of prefabricated concrete elements from a late 19th century church in lower Austria. In Proceedings of the 15th Euroseminar on Microscopy Applied to Building Materials, Delft, The Netherlands, 17–19 June 2015; Çopuroglu, O., Ed.; Delft University of Technology: Delft, The Netherlands, 2015; pp. 131–138. [Google Scholar]
- Pintér, F.; Gosselin, C. The origin, composition and early age hydration mechanisms of Austrian natural Portland cement. Cem. Concr. Res. 2018, 110, 1–12. [Google Scholar] [CrossRef]
- Ando, Y.; Hirono, S.; Sawaki, D.; Katayama, T. Microscopy to evaluate the properties of cement and alterations in historic mortar/concrete of old Nobiru Port project, Northeast Japan. In Proceedings of the 36th Conference on Cement Microscopy, Milan, Italy, 13–17 April 2014; International Cement Microscopy Association: Montgomery, AL, USA, 2014; pp. 212–233. [Google Scholar]
- Katayama, T.; Ando, Y.; Hirono, S.; Sawaki, D. Relicts of unhydrated cement clinker in a historic concrete from the 19th century—Microscopy with EDS analysis of old training dyke at Yokohama Port, Japan. In Proceedings of the 36th Conference on Cement Microscopy, Milan, Italy, 13–17 April 2014; International Cement Microscopy Association: Montgomery, AL, USA, 2014; pp. 432–458. [Google Scholar]
- Katayama, T.; Sakai, K. Petrography of 100-year-old concrete from Otaru Port, Japan. In Proceedings of the 2nd International Conference on Concrete under Severe Conditions, Tromsø, Norway, 21–24 June 1998; Gjørv, O., Sakai, K., Banthia, N., Eds.; E & FN Spon: London, UK, 1998; pp. 250–261. [Google Scholar]
- Francis, A. The Cement Industry 1796–1914: A History; David & Charles: Newton Abbot, UK, 1997. [Google Scholar]
- Black, L. Raman spectroscopy of cementitious materials. Spectrosc. Prop. Inorg. Organomet. Compd. 2009, 40, 72–127. [Google Scholar]
- Black, L.; Brooker, A. SEM-SCA: Combined SEM-Raman spectrometer for analysis of OPC clinker. Adv. Appl. Ceram. 2007, 6, 327–334. [Google Scholar] [CrossRef]
- Potgieter-Vermaak, S.; Potgieter, J.H.; Van Grieken, R. The application of Raman spectroscopy to investigate and characterize cement, Part I: A review. Cem. Concr. Res. 2006, 36, 656–670. [Google Scholar] [CrossRef]
- Conjeaud, M.; Boyer, H. Some possibilities of Raman microprobe in cement chemistry. Cem. Concr. Res. 1980, 10, 61–70. [Google Scholar] [CrossRef]
- Handke, M. Vibrational spectra, force constants, and Si-O bond character in calcium silicate crystal structure. Appl. Spectrosc. 1986, 40, 871–877. [Google Scholar] [CrossRef]
- Fukuda, K.; Takeda, A.; Yamaguchi, A.; Hashimoto, S. Characterization of liquid exsolved by remelting reaction of belite. J. Am. Ceram. Soc. 2001, 84, 1155–1160. [Google Scholar] [CrossRef]
- Fujimori, H.; Komatsu, H.; Ioku, K.; Goto, S.; Watanabe, T. Vibrational spectra of Ca3SiO5: Ultraviolet Laser Raman Spectroscopy at high temperatures. J. Am. Ceram. Soc. 2005, 88, 1995–1998. [Google Scholar] [CrossRef]
- Ibáñez, J.; Artús, L.; Cuscó, R.; López, Á.; Menéndez, E.; Andrade, M. Hydration and carbonation of monoclinic C2S and C3S studied by Raman spectroscopy. J. Raman Spectrosc. 2007, 38, 61–67. [Google Scholar] [CrossRef]
- Dariz, P.; Schmid, T. Ferruginous phases in 19th century lime and cement mortars: A Raman microspectroscopic study. Mater. Charact. 2017, 129, 9–17. [Google Scholar] [CrossRef]
- Dariz, P.; Neubauer, J.; Götz-Neunhoeffer, F.; Schmid, T. Calcium aluminates in clinker remnants as marker phases for various types of 19th-century cement studied by Raman microspectroscopy. Eur. J. Mineral. 2016, 28, 907–914. [Google Scholar] [CrossRef]
- Torréns-Martín, D.; Fernández-Carrasco, L.; Martínez-Ramírez, S.; Ibáñez, J.; Artús, L.; Matschei, T. Raman spectroscopy of anhydrous and hydrated calcium aluminates and sulfoaluminates. J. Am. Ceram. Soc. 2013, 96, 3589–3595. [Google Scholar] [CrossRef]
- Torréns-Martín, D.; Fernández-Carrasco, L.; Martínez-Ramírez, S. Hydration of calcium aluminates and calcium sulfoaluminate studied by Raman spectroscopy. Cem. Concrete Res. 2013, 47, 43–50. [Google Scholar] [CrossRef]
- Higl, J.; Köhler, M.; Lindén, M. Confocal Raman microscopy as a non-destructive tool to study microstructure of hydrating cementitious materials. Cem. Concrete Res. 2016, 88, 136–143. [Google Scholar] [CrossRef]
- Lafuente, B.; Downs, R.T.; Yang, H.; Stone, N. The power of databases: The RRUFF project. In Highlights in Mineralogical Crystallography; Armbruster, T., Danisi, R.M., Eds.; W. De Gruyter: Berlin, Germany, 2015; pp. 1–30. [Google Scholar]
- Hewlett, P. Lea’s Chemistry of Cement and Concrete, 4th ed.; Butterworth Heinemann: Oxford, UK, 2004. [Google Scholar]
- Casanova, E.; Pelé-Meziani, C.; Guilminot, É.; Mevellec, J.-Y.; Riquier-Bouclet, C.; Vinçotte, A.; Lemoine, G. The use of vibrational spectroscopy techniques as a tool for the discrimination and identification of the natural and synthetic organic compounds used in conservation. Anal. Methods 2016, 8, 8514–8527. [Google Scholar] [CrossRef]
- Tennent, N.; Caen, J.; Courtney, P.; Lozano Diz, E. In-situ Raman spectroscopic characterisation of polymers used in past conservation treatments. e-Preserv. Sci. 2009, 6, 107–111. [Google Scholar]
- Schmid, T.; Jungnickel, R.; Neuhaus, B.; Riedel, J.; Kneipp, J.; Lüter, C. Raman spectroscopy as a tool for the collection management of microscope slides. Zool. Anz. 2016, 265, 178–190. [Google Scholar] [CrossRef] [Green Version]
- Insley, H. Structural characteristics of some constituents of Portland cement clinker. J. Res. Natl. Bur. Stand. 1936, 17, 353–361. [Google Scholar] [CrossRef]
- Fukuda, K.; Maki, I. Orientation of β-Ca2SiO4 solid solution lamellae formed in the host α-phase. Cem. Concrete Res. 1989, 19, 913–918. [Google Scholar] [CrossRef]
- Fukuda, K.; Maki, I.; Ito, S. Transformation-induced microtextures in belites. In Proceedings of the 10th International Congress on the Chemistry of Cement, Gothenburg, Sweden, 2–6 June 1997; Justnes, H., Ed.; Amarkai AB and Congrex Göteborg AB: Gothenburg, Sweden, 1997; pp. 1–52. [Google Scholar]
- Remy, C.; Reynard, B.; Madon, M. Raman spectroscopic investigations of dicalcium silicate: Polymorphs and high-temperature phase transformations. J. Am. Ceram. Soc. 1997, 80, 413–423. [Google Scholar] [CrossRef]
- Bhagavantam, S. Effect of crystal orientation on the Raman spectrum of calcite. Proc. Ind. Acad. Soc. A 1940, 11, 62–71. [Google Scholar] [CrossRef]
- Hopkins, J.B.; Farrow, L.A. Raman microprobe determination of local crystal orientation. J. Appl. Phys. 1986, 59, 1103–1110. [Google Scholar] [CrossRef]
- Hayward, I.P.; Baldwin, K.J.; Hunter, D.M.; Batchelder, D.N.; Pitt, G.D. Direct imaging and confocal mapping of diamond films using luminescence and Raman scattering. Diam. Rel. Mater. 1995, 4, 617–621. [Google Scholar] [CrossRef]
- Loudon, R. The Raman effect in crystals. Adv. Phys. 1964, 13, 423–482. [Google Scholar] [CrossRef]
- Fukuda, K.; Maki, I.; Ito, S. Phase stability study on the remelting reaction in Ca2SiO4 solid solutions. J. Am. Ceram. Soc. 1995, 78, 3387–3389. [Google Scholar] [CrossRef]
- Fukuda, K.; Wakamatsu, N.; Ito, S.; Yoshida, H. Acceleration of early hydration in belite-rich cement by remelting reaction. J. Ceram. Soc. Jpn. 1999, 107, 901–906. [Google Scholar] [CrossRef]
- Schlütter, F.; Kaiser, W.; Juling, H. High fired gypsum mortar for screeds, terrazzo and masonry repair on historic monuments. Production, properties and sample applications. In Proceedings of the 2nd Historic Mortars Conference HMC2010 and RILEM TC 203-RHM Final Workshop, Prague, Czech Republic, 22–24 September 2010; Válek, J., Groot, C., Hughes, J., Eds.; RILEM Publications SARL: Bagneux, France, 2010; pp. 1169–1180. [Google Scholar]
- Schlütter, F. Mittelalterlicher Hochbrandgips. In 800 Jahre Kunststein—Vom Imitat Zum Kunstgut; für Denkmalpflege, B.L., Archäologisches Landesmuseum, A., Eds.; Wernersche Verlagsgesellschaft mbH: Worms, Germany, 2012; pp. 27–39. [Google Scholar]
- Schlütter, F.; Jakubek, M.; Juling, H. Charakterisierung und Eigenschaften historischer Gipsmörtel aus unterschiedlichen Epochen und Anwendungsgebieten. In Gips als Baugrund, Mörtel und Dekorationsmaterial; Institut für Steinkonservierung e.V., IFS: Mainz, Germany, 2012; pp. 49–59. [Google Scholar]
- Lenz, R.; Sobott, R. Beobachtungen zu Gefügen historischer Gipsmörtel. In Gipsmörtel im Historischen Mauerwerk und an Fassaden; Auras, M., Zier, H.-W., Eds.; WTA Publications: Munich, Germany, 2008; pp. 23–34. [Google Scholar]
- Dariz, P.; Jakob, C.; Ectors, D.; Neubauer, J.; Schmid, T. Measuring the burning temperatures of anhydrite micrograins in a high-fired medieval gypsum mortar. ChemistrySelect 2017, 2, 9153–9156. [Google Scholar] [CrossRef]
- Dariz, P.; Schmid, T. Phase composition and burning history of medieval high-fired gypsum mortars studied by Raman microspectroscopy. Mater. Charact. 2019, 151, 292–301. [Google Scholar] [CrossRef]
- Schmid, T.; Jungnickel, R.; Dariz, P. Raman band widths of anhydrite II reveal the burning history of high-fired medieval gypsum mortars. J. Raman Spectrosc. 2019, in press. [Google Scholar] [CrossRef]
Figure 1.
Basic concept of elastic (Rayleigh) and inelastic (Raman) scattering of light by molecules or crystals. A monochromatic laser beam with frequency ν0 excites a characteristic vibration of a chemical compound having the frequency νvib. The light can be either Rayleigh scattered resulting in light of the same frequency ν0 or Raman scattered yielding either Stokes (ν0 − νvib) or Anti-Stokes shifted (ν0 + νvib) photons.

Figure 2.
Schematic of an upright Raman microscope. The Raman-scattered light collected and filtered by a microscope objective and edge/notch filter, respectively, is coupled into a grating spectrometer. Typically, without scanning of the spectrometer grating, the individual wavenumbers of a spectrum are simultaneously detected by a charge-coupled device (CCD) camera. Raman maps are acquired by raster-scanning of the sample through the laser focus and detection of a spectrum in every pixel.

Figure 3.
Data cube typically yielded by a Raman microspectroscopic imaging experiment. On each x and y coordinate of a two-dimensional area, a Raman spectrum consisting of wavenumbers and intensities (here shown as different colours) is acquired. The simplest possibility to analyse the data is the evaluation of Raman intensities at a selected wavenumber (e.g., resembling a marker band of a certain compound), here represented by horizontal slices of the cube. For example, the colours on the top face reveal the intensity distribution at the highest wavenumber in each acquired spectrum.

Figure 4.
Polarised light micrographs of Portland cement clinker remnants in the binder matrix of samples from a prefabricated baluster (a,b) and a cast lion sculpture (c,d), both manufactured for the industrial exhibition in Zurich (Switzerland) in 1894. Rectangles highlight the areas on which the Raman maps discussed in Section 3.1, Section 3.2, Section 3.3 and Section 3.4 were acquired.

Figure 5.
Spectra from the Raman map of a binder remnant in the cement stone of a cast lion sculpture (Zurich, Switzerland, 1894) with marker bands for beta dicalcium silicate (β-C2S, red), calcium aluminoferrite solid solution series (CxAyFz, green), tricalcium aluminate (C3A, white), and tricalcium silicate (C3S, blue). The same colour coding applies to the Raman intensity maps in Figure 6. The β-C2S spectrum from the sample is compared with a reference spectrum (labelled ‘ref.’) [42]. The asterisk marks a band related to the organic embedding medium.

Figure 6.
Raman intensity maps revealing the distributions of clinker phases in binder remnants found in the cement stone of a baluster (a) and a cast lion sculpture (b), both produced for the industrial exhibition in Zurich (Switzerland) in 1894.
Figure 6.
Raman intensity maps revealing the distributions of clinker phases in binder remnants found in the cement stone of a baluster (a) and a cast lion sculpture (b), both produced for the industrial exhibition in Zurich (Switzerland) in 1894.

Figure 7.
Comparison of scanning electron microscopy–energy dispersive X-ray spectroscopy (SEM–EDX) maps showing the elementary distributions of aluminium (a), iron (b) and an overlay of both (c) with the according Raman map of C3A and CxAyFz confirming the correct assignments of Raman spectra to calcium aluminate (without Fe) and calcium aluminoferrite (with Fe) phases. The data contained in (d) is a subset of the map shown in Figure 6b.

Figure 8.
Raman spectra of C2S, which include spectral signatures of both, the β (labelled red) and γ polymorph (green) of this clinker phase. The inset reveals a deconvolution of spectrum (1) into five Lorentzian peak profiles, while trace (2) shows the exception of a spectrum of relatively pure γ-C2S.

Figure 9.
Raman intensity maps showing the distributions of two different polymorphic forms of dicalcium silicate based on their characteristic marker bands in Portland cement clinker remnants found in the binder matrix of a prefabricated concrete element (a) and a cast lion sculpture (b).
Figure 9.
Raman intensity maps showing the distributions of two different polymorphic forms of dicalcium silicate based on their characteristic marker bands in Portland cement clinker remnants found in the binder matrix of a prefabricated concrete element (a) and a cast lion sculpture (b).

Figure 10.
Scanning electron micrograph acquired by employing backscattered electron (BSE) detection without (a) and with superimposed Raman distribution map of γ-C2S (b) demonstrating the effect of conversion from the β into the γ polymorph onto crack formation.
Figure 10.
Scanning electron micrograph acquired by employing backscattered electron (BSE) detection without (a) and with superimposed Raman distribution map of γ-C2S (b) demonstrating the effect of conversion from the β into the γ polymorph onto crack formation.

Figure 11.
Spectra from the Raman map of the Portland cement mortar of a cast lion sculpture (Zurich, Switzerland, 1894) showing the effect of different crystal orientations onto the relative intensities of the five labelled bands of β-C2S.
Figure 11.
Spectra from the Raman map of the Portland cement mortar of a cast lion sculpture (Zurich, Switzerland, 1894) showing the effect of different crystal orientations onto the relative intensities of the five labelled bands of β-C2S.

Figure 12.
Raman intensity maps of the β-C2S bands at 858 cm−1 (a), 845 cm−1 (b), 874 cm−1 (c), and an overlay of these intensities plotted in red, green, and blue, respectively (d). This relative intensity map reveals different crystal orientations in a binder remnant in the matrix of a prefabricated concrete element (Zurich, Switzerland, 1894).

Figure 13.
Raman intensity maps of the β-C2S bands at 858 cm−1 (a), 845 cm−1 (b), 874 cm−1 (c), and an overlay of these intensities plotted in red, green, and blue, respectively (d). This relative intensity map reveals different crystal orientations in a residual cement clinker grain in the binder matrix of a cast lion sculpture (Zurich, Switzerland, 1894).

Figure 14.
Raman band shift maps revealing the wavenumbers of the peak maxima within a range of 715 cm−1 to 762 cm−1 enabling the discrimination of individual members of the calcium aluminoferrite solid solution series in binder remnants in the cement stone of a baluster (a,b) and a cast lion sculpture (c,d). In the latter example, the relatively sharp band at 756 cm−1 is assigned to C3A instead of C6A2F, which is confirmed by Figure 7.

Figure 15.
High-fired gypsum mortar originating from the Chapel of the Holy Cross of the Benedictine convent of St. John in Müstair (Switzerland): scanning-electron (a) and polarised light micrographs acquired with parallel (b) and crossed Nicols (c). The rectangles highlight the area corresponding to the Raman map presented in Figure 16.

Figure 16.
The shapes of the most prominent band at 1017 cm−1 in the Raman spectra of anhydrite II burnt from gypsum powder at different temperatures reveal a correlation between their full widths at half maximum (FWHMs) and the calcination temperatures (a). Raman maps of a remnant binder aggregate in a high-fired medieval gypsum mortar give access to the burning history: relative intensities of two anhydrite modes (b) reveal different crystal orientations, the intensities of marker bands provide the distributions of anhydrite and gypsum (c), and finally the band width distribution map of the anhydrite II mode at 1017 cm−1 relates to a burning temperature of approx. 750 °C ± 50 K (d).


Table 1.
Measurement parameters of the Raman mapping experiments.
| Sample | Figures | Pixel Number | Area | Time |
|---|---|---|---|---|
| Baluster 1 | 6a, 9a, 10b, 12, 14a–b | 80 × 100 = 8000 | 72 µm × 90 µm | 8 h 53 min |
| Lion 1 | 5, 6b, 7d, 8, 9b, 11, 13, 14c–d | 80 × 100 = 8000 | 72 µm × 90 µm | 8 h 53 min |
| Chapel of the Holy Cross 2 | 16b–d | 75 × 44 = 3300 | 75 µm × 44 µm | 3 h 40 min |
1 19th-century cement mortar, 2 high-fired medieval gypsum mortar.
© 2019 by the authors. Licensee MDPI, Basel, Switzerland. This article is an open access article distributed under the terms and conditions of the Creative Commons Attribution (CC BY) license (http://creativecommons.org/licenses/by/4.0/).
Share and Cite
MDPI and ACS Style
Schmid, T.; Dariz, P. Raman Microspectroscopic Imaging of Binder Remnants in Historical Mortars Reveals Processing Conditions. Heritage 2019, 2, 1662-1683. https://0-doi-org.brum.beds.ac.uk/10.3390/heritage2020102
AMA Style
Schmid T, Dariz P. Raman Microspectroscopic Imaging of Binder Remnants in Historical Mortars Reveals Processing Conditions. Heritage. 2019; 2(2):1662-1683. https://0-doi-org.brum.beds.ac.uk/10.3390/heritage2020102
Chicago/Turabian StyleSchmid, Thomas, and Petra Dariz. 2019. "Raman Microspectroscopic Imaging of Binder Remnants in Historical Mortars Reveals Processing Conditions" Heritage 2, no. 2: 1662-1683. https://0-doi-org.brum.beds.ac.uk/10.3390/heritage2020102