Chemical and Mechanical Differences between Historic and Modern Scots Pine Wood

1
School of Chemistry, Glasgow University, Glasgow G12 8QQ, Scotland, UK
2
School of Energy, Geoscience, Infrastructure and Society, Heriot Watt University, Edinburgh EH14 4AS, Scotland, UK
*
Author to whom correspondence should be addressed.
†
Present address: North Somerset Council, Town Hall, Walliscote Grove Road, Weston-super-Mare, BS23 1UJ.
Heritage 2020, 3(1), 116-127; https://0-doi-org.brum.beds.ac.uk/10.3390/heritage3010007
Submission received: 21 January 2020
/
Revised: 13 February 2020
/
Accepted: 22 February 2020
/
Published: 24 February 2020
Abstract
:Timber is one of the most common historic building materials, but relatively little is known about how it ages in situ. Here we investigate historic and modern Scots pine to determine any chemical or mechanical differences between them. Fourier-transform infrared (FTIR) microscopy was used to investigate differences in the chemical composition of Scots pine (Pinus sylvestris L.) timber, comparing small samples from historic beams about 500 years old with modern timber. The hemicellulosic acetyl content was reduced by about half in the historic samples, uniformly across the thickness of the beams. A chemical mechanism was therefore suggested for the loss of acetyl groups, as has been observed in paper. In paper, deacetylation and the resulting release of acetic acid are accompanied by loss of strength. Mechanical testing of the historic timber was difficult because the available length of the samples along the grain was only 20 mm. After developing a miniaturized compression test developed for the purpose, it was shown that the relative stiffness of the historic Scots pine samples was reduced by about half compared to modern material.
1. Introduction
Timber has been a major building material for millennia. Historically it has been used in a number of ways including structural building support, cladding, ceilings, floorboards, window frames, doors, and many others. In preserving historic and traditional buildings, a balance needs to be struck between meeting the conservation principle of retaining as much of the original building fabric as possible [1] and maintaining a sound building that is safe to use.
Timber is subject to decay over long time scales through chemical degradation and biological attack. Degraded timbers often need to be replaced with modern equivalents. Some timbers survive remarkably well over time, but the mechanical and chemical properties of these timbers are not well understood [2]. This can lead to some cases where historic and modern timbers co-exist in a building, often in physical contact with each other. Whilst there are methods in place to assess timber structures at the macro-scale [3], little is understood about how timber that shows little outward signs of decay may have aged over time at a molecular level.
It is often assumed that wood does not change significantly in its structure or properties when kept under dry conditions and protected from biological decay, as is usually the case in the structure of historic buildings that are still inhabited or open to the public. However, the ageing of timber in such conditions has not been widely studied [2]. This is in contrast to ageing of archaeological wood, for example in waterlogged environments (e.g., [4]).
Other biological materials, particularly paper derived from wood, are known to be susceptible to long-term chemical changes [5]. In this case, acetyl esters are very slowly removed from the hemicellulose polymers of paper by chemical hydrolysis, producing acetic acid which, if it remains in the paper, contributes to the degradation of cellulose and to the ensuing loss of strength [6,7]. Acetic acid, being somewhat volatile, is also released into the atmosphere [7], and in a confined space it can do further damage [8]. These observations suggest that the acetyl esters present in wood might be broken down chemically to release acetic acid by similar slow acting chemical means. The corrosion of metal objects in wooden museum cases [9] would be consistent with that idea.
Historic building conservation is increasingly reliant on a strong evidence base, utilizing heritage science applications to allow for a better-informed decision-making process [10,11]. A key aspect of this is improving the knowledge base of how materials behave over long time scales. There is conflicting evidence on whether the mechanical strength and stiffness of wood are reduced over long time periods [2,12]. This information would be of value to heritage professionals such as conservation architects, heritage scientists, and structural engineers assessing the safety of historic buildings open to the public. Unfortunately, the mechanical testing procedures that are ratified for use in wood and incorporated in building regulations such as those of the UK (British Standards Institution, 1957) require samples of much greater dimensions than can normally be made available from historic structures [10].
There has been progress in developing micromechanical and acoustic methods for small-scale evaluations of the mechanical properties of wood [13,14,15], therefore testing methods compatible with the small dimensions often available for historic timber samples (e.g., 10 mm along the grain) should in principle be achievable. However, one issue with such tests is that the length:width ratio needed is high. With the length of the sample restricted by the size of sample taken, the width of the sample will need to be extremely small; of a similar scale to a single annual ring [14]. Intra-ring variability cannot therefore be avoided, and a direct comparison with macro-scale methods such as the industry standard is not feasible; the best that is likely to be possible is relative estimates.
In a previous paper [16] we described the use of polarized Fourier-transform infrared (FTIR) microscopy [17,18] to monitor chemical changes in historic Scots pine wood, in which the sapwood was affected by fungal and insect decay. This leads to the objective of this current study; is the heartwood of pine, which shows no signs of insect or fungal degradation, altered with age, and if so, in what way?
2. Materials and Methods
2.1. Historic and Modern Wood Samples
Five 15th and 16th century samples of Scots pine (Pinus sylvestris L.) were obtained from the ends of beams supporting painted ceilings in the following three Scottish buildings. The Abbey Strand Sanctuary in Edinburgh dates to the late 15th/early 16th century [19]. The Bay Horse Inn in Dysart, Fife dates to 1583. Its painted ceilings have been dated using dendrochronological analysis to the 16th century [20]. Carnock House is located near Airth, Stirlingshire. Its painted ceiling has been dated using dendrochronological analysis to 1588–1589 [21]. A total of six Scots pine beams from these buildings were examined, following confirmation of species identity and dendrochronological dating. Samples from all six beams were analyzed via compression testing, and five were able to be sectioned for FTIR. Many, but not all of these historic samples had visible signs of insect pest damage (larval holes) restricted to the sapwood that was located mainly at the corners of the beams. Fungal degradation was previously shown [16] by FTIR and density measurement to be present in the sapwood but not the heartwood of these samples.
Modern Scots pine samples for comparison by FTIR were derived from a large sample set characterized in detail by Auty and coworkers [16,22]. The dimensions of these modern samples (densitometry strips) were unsuitable for compression testing, for which modern Scots pine material was obtained commercially, originating from Forestry Commission plantations in Northeast Scotland. Eight samples of modern Scots pine, derived from two trees, were utilized for development of the compression testing method.
2.2. FTIR Microscopy
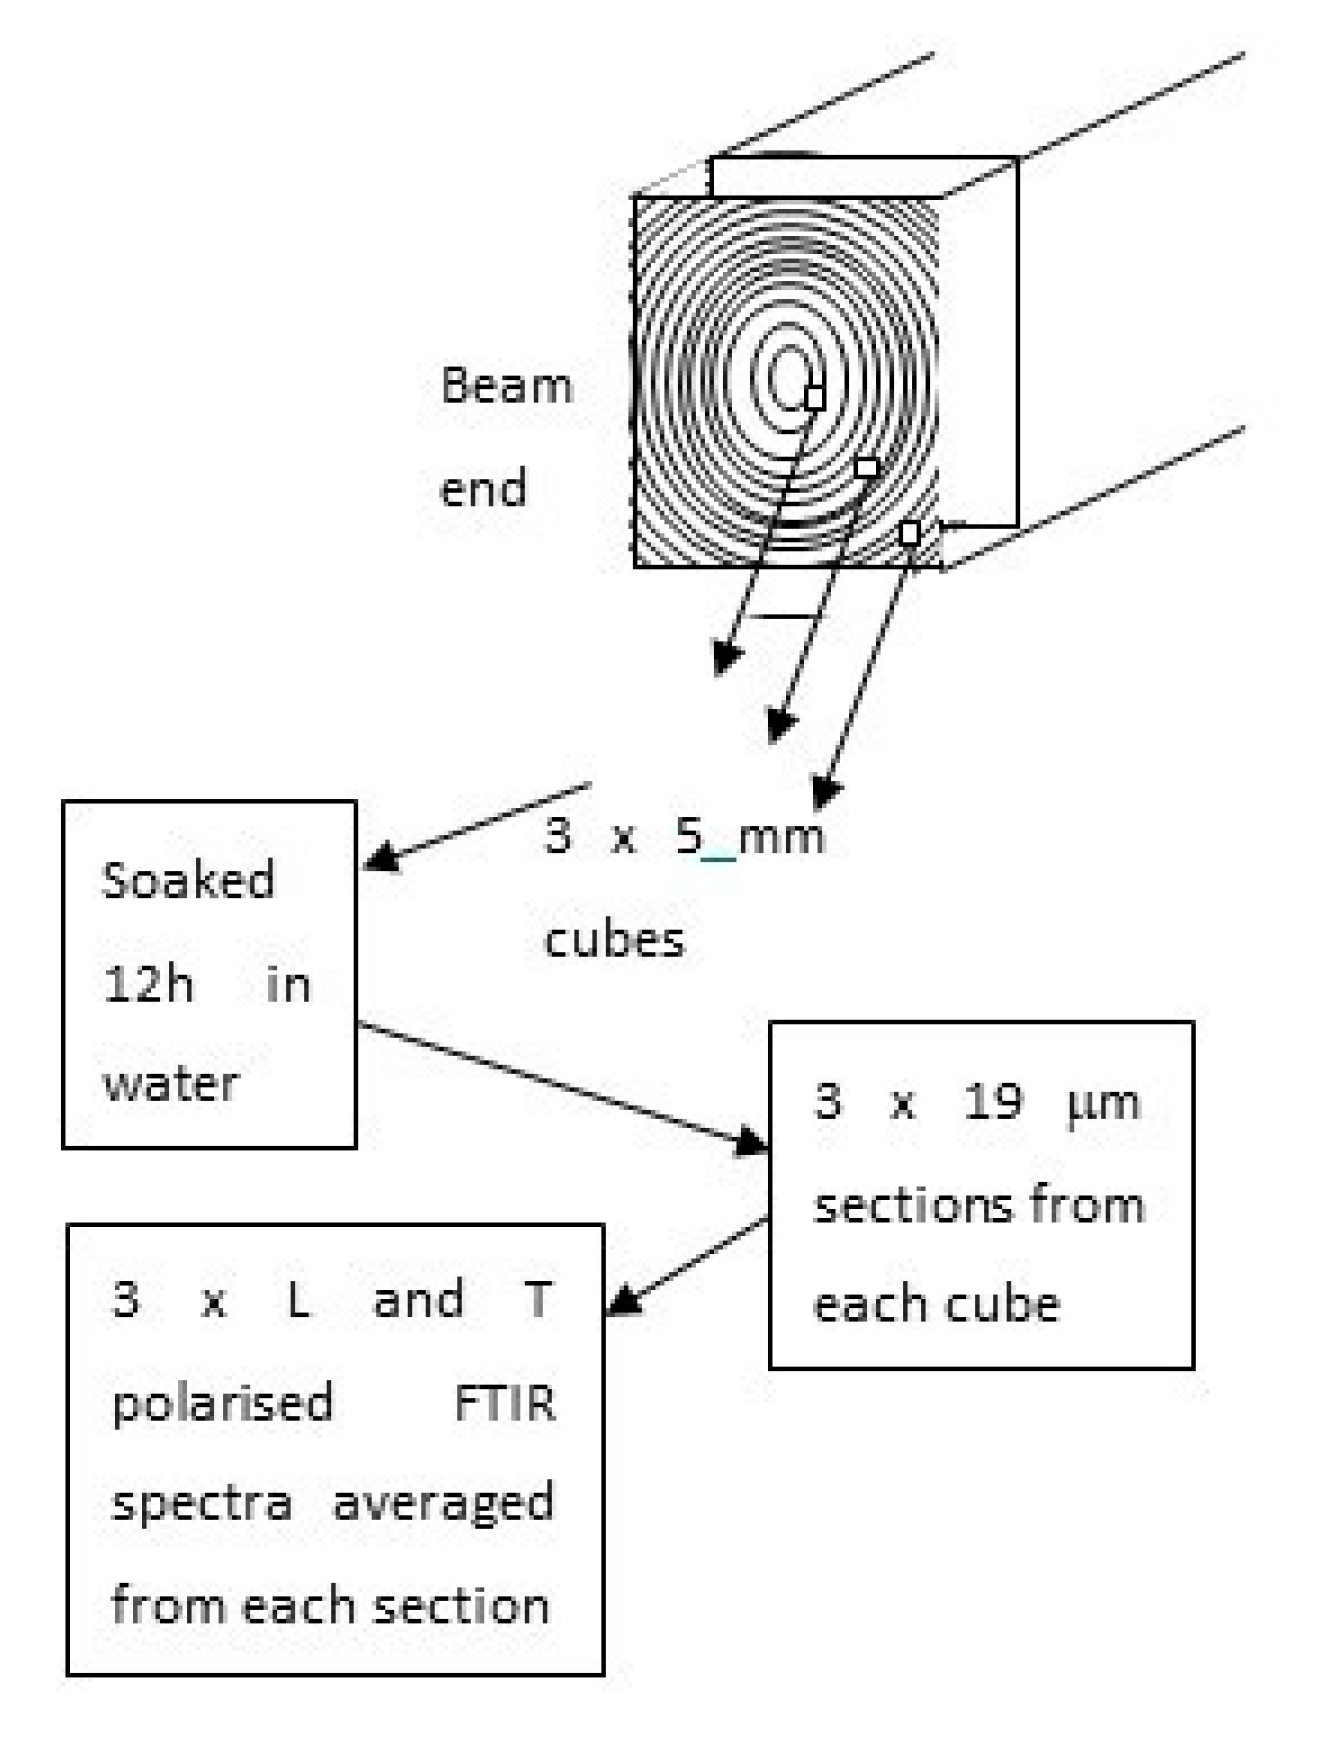
Cubes 5 mm in each dimension were cut in radial series from the pith area of each historic pine beam to the sapwood edge. Three cubes from each beam were selected for FTIR located as close as possible to the pith (inner heartwood) in the sapwood, and midway between the pith and sapwood edge (outer heartwood). The cubes were soaked for 12 h in water to soften the wood. Axial-tangential sections 19 µm thick were then cut using a Leica RM2255 microtome with a steel blade [23] (Figure 1). FTIR spectra were recorded in transmission from 100 µm square fields of the thin sections on a Nicolet Nexxus spectrometer with a Nicolet Continuum microscope attachment fitted with a ZnSe infrared polarizer, as described by Leonardon et al. [24] and Hudson-McAulay et al. [16].
Comparative tests with other forms of vibrational spectroscopy gave inferior spectra with respect to spatial resolution (diffuse reflectance) or baseline stability (Raman and specular reflectance FTIR; data not shown), while Attenuated Total Reflectance FTIR (ATR-FTIR) gave very similar spectra but with poorer reproducibility in the polarized mode required for measuring microfibril angle [15]. The spectra were exported as .csv files into Microsoft Excel and were baseline corrected as described by Altaner et al. [17]. Three replicate spectra in each polarization direction were recorded from each of three sections cut from each cube. Longitudinally and transversely polarized spectra were averaged.
2.3. Compression Testing of Stiffness
Mechanical testing of wood samples is conventionally carried out by 3- or 4-point bending trials on ‘small clear’ samples 300 mm in length (British Standards Institution, 1957; e.g., Auty & Achim, [25]) which has limitations [26,27]. In this investigation, as is commonly the case in studies of historic timber, there was no prospect of obtaining samples as large as this [12]. The maximum length available in the grain direction was 20 mm. The development of miniaturized mechanical testing methods was therefore essential. A miniature tensile testing procedure developed previously for 50 mm samples [18] tended to underestimate the tensile modulus. Attempts to miniaturize a 3-point bending test were unsuccessful for pine samples on this scale, due to end effects (results not shown). A compression test was therefore developed and optimized.
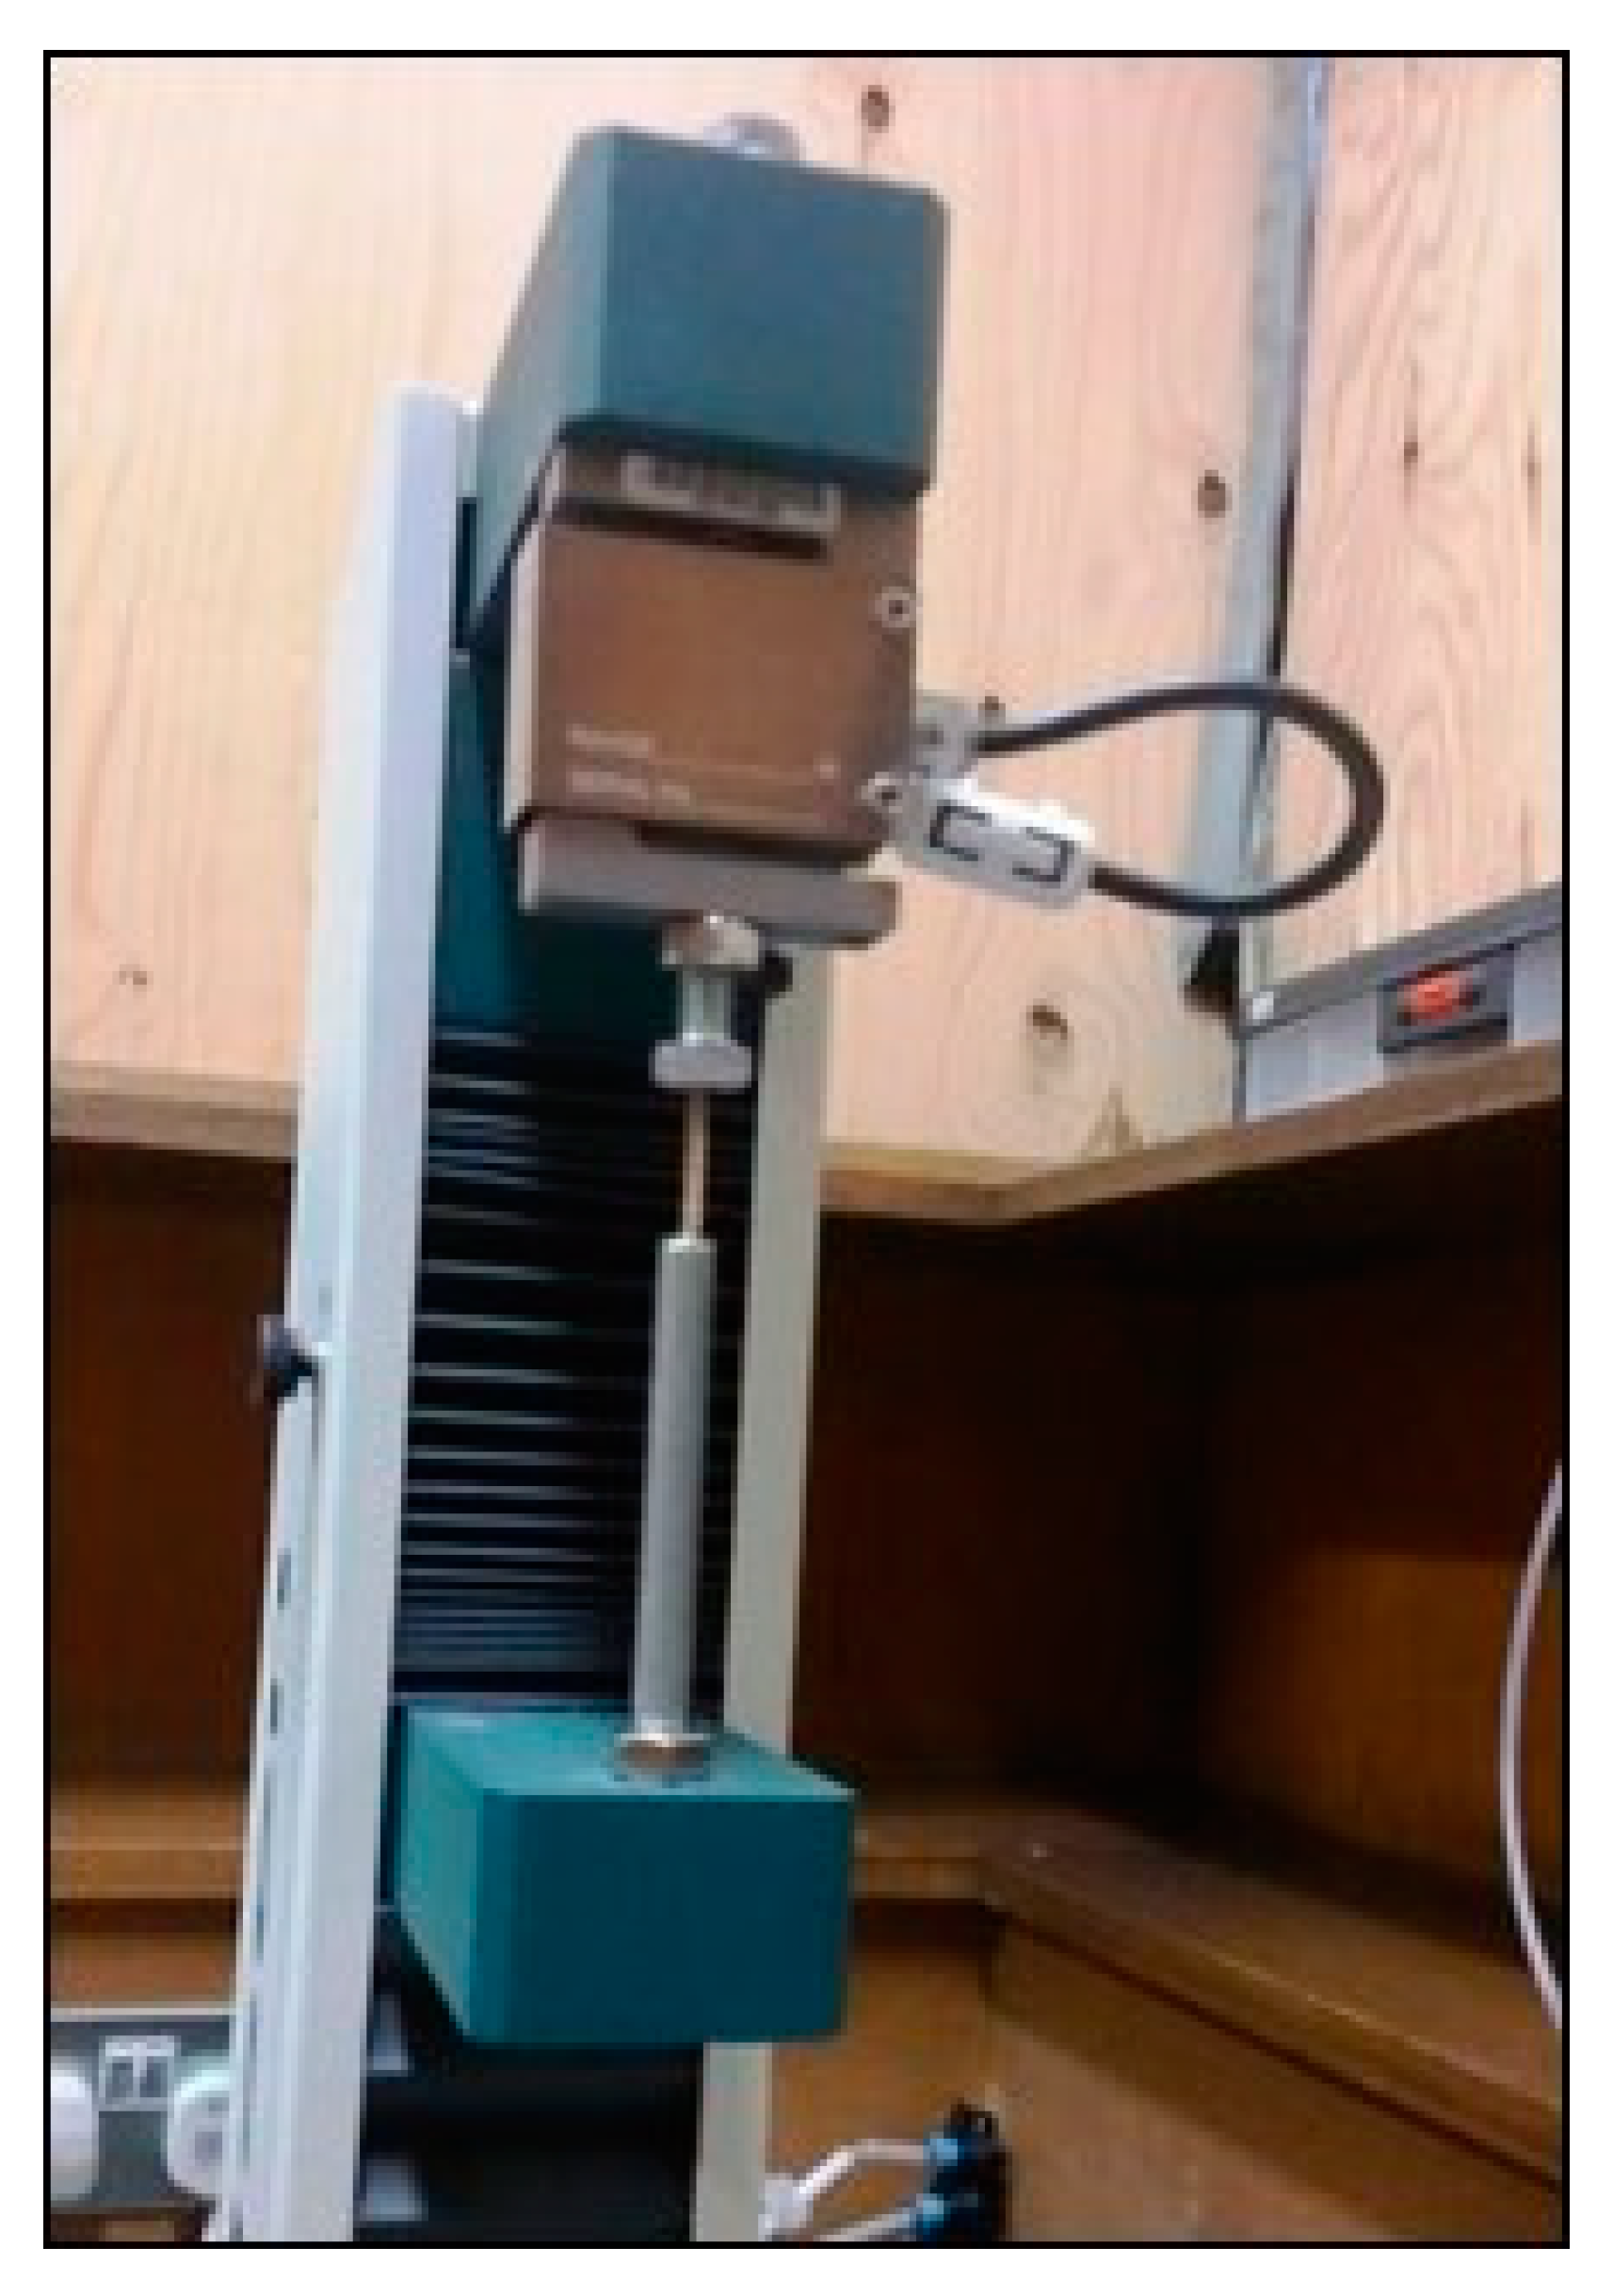
Samples measuring 20 mm along the grain × 2 mm × 2 mm were cut from modern and historic Scots pine and were reinforced at the ends by coating with epoxy resin (Araldite epoxy resin at a hardener to resin ratio of 1:1). Ring width and density of the samples are discussed in [16]. In short, for heartwood there is little difference in density between modern and historic samples. However, historic samples displayed narrower ring-widths than samples taken from modern plantation-grown Scots pine. Four samples from each historic beam were prepared for compression testing, located in the heartwood as close as possible to the pith, in the sapwood, and at two equally spaced intervals (inner heartwood and outer heartwood) between the pith and sapwood edge. The ends were then sanded smooth, square, and precisely parallel to one another in a custom-built jig, to eliminate local deformation in contact with the probes of the tensile testing machine. If this was not done, end effects reduced the apparent compression modulus. Compressive load-deformation curves were recorded on a Tinius Olsen H1KS tensile testing machine with a 250N load cell (Tinius Olsen 6 Perrywood Business Park, Honeycrock Lane, Salford, Surrey RH1 5DZ, England) and custom flat-ended steel probes at a constant speed of 1 mm per minute (Figure 2).
The compression modulus of elasticity (MOE) was calculated using the following equation:
where S is the slope in N/mm averaged for the linear portion of the load-deformation plot, H is the height of the sample, W is the width of the sample and D is the depth of the sample [28].
MOE = S × H/ (W × D)
Machine deflection was measured by substituting a steel rod of similar dimensions to the sample and was used to correct the sample deflection at each load value prior to calculation of the sample compression modulus as described above.
The key step in optimization of the procedure proved to be the reinforcement and flattening of the ends of the sample. When this step was omitted, end effects reduced the apparent compression modulus in an inverse proportion to the sample length between 20 mm, the maximum available for the historic samples, and 80 mm (Table 1). When the ends of 20 mm samples were reinforced and flattened, the compression modulus increased to a level comparable with the 80 mm samples, and with average values of the longitudinal modulus (8000–8500 MPa) measured [25] on a large set of standard small clear small clear samples of modern Scots pine.
Due to the impracticability of making a direct experimental comparison with standard methods applied to historic timber, the recorded moduli are best regarded as a relative measure of stiffness, and the variability introduced by different ratios of earlywood to late wood in samples comparable in size to the ring width meant that moderately large numbers of samples had to be averaged.
3. Results
3.1. FTIR
3.1.1. Spectral Assignment
Absorption bands in FTIR spectra are conventionally assigned to functional groups. More usefully, in lignocellulose studies there is considerable experience [29] in assigning selected absorption bands to structural features of specific polymers, and in validating these assignments by wet chemistry or synthesis (e.g., [30,31,32]. Assignments relevant to the present study include the 1732 cm−1 C=O stretching band, the 1240 cm−1 C-O stretching band, and the 1372 cm−1 C-CH3 stretching band, all assignable to acetyl groups on hemicellulosic glucomannans [33,34,35]. In softwoods acetyl substitution is restricted to the glucomannans [36].
These assignments for the 1732 cm−1 and 1240 cm−1 bands were confirmed by longitudinal/transverse dichroic ratios equal to 0.90 and 0.87, respectively. This slight transverse polarization is consistent with the axial glucomannan chain alignment and the transverse orientation, with respect to the chain, of the transition moment for these acetyl vibrational modes [36]. Also relevant are the non-polarized 1510 cm−1 aromatic ring stretching modes, commonly assigned to lignin, and the longitudinally polarized (dichroic ratio 1.37) C-O-C stretching mode at 810 cm−1, assigned to glucomannan [37]. Quantification from these assigned bands, directly or in loading spectra from multivariate analysis, has been validated against wet chemistry or mixtures of known composition [31,34,38].
Interference from the extractives fraction of the wood might be anticipated. The samples were not pre-extracted in organic solvents, although water-soluble extractives were removed during preparation of the thin sections for FTIR. Resin esters may interfere with the C=O and C-O stretching bands assigned to acetyl groups [39,40] but are associated with much stronger C-H stretching bands at 2850 cm−1 and 2930 cm−1 [40], which were hardly discernable in the spectra collected here (Figure 3). Interference with acetyl estimation was therefore considered negligible. However, interference at 1510 cm−1 from phenolic extractives could not be discounted. In Scots pine stilbenes, lignans and flavonoids comprise up to 1% of the heartwood dry matter, with a lower percentage in sapwood [38], compared with 25%–30% lignin. Although some of these phenolic materials may have been removed during sample preparation, a small contribution to the 1510 cm−1 band is therefore expected and this band is more accurately assigned to total phenolics rather than lignin.
3.1.2. FTIR Difference Spectra
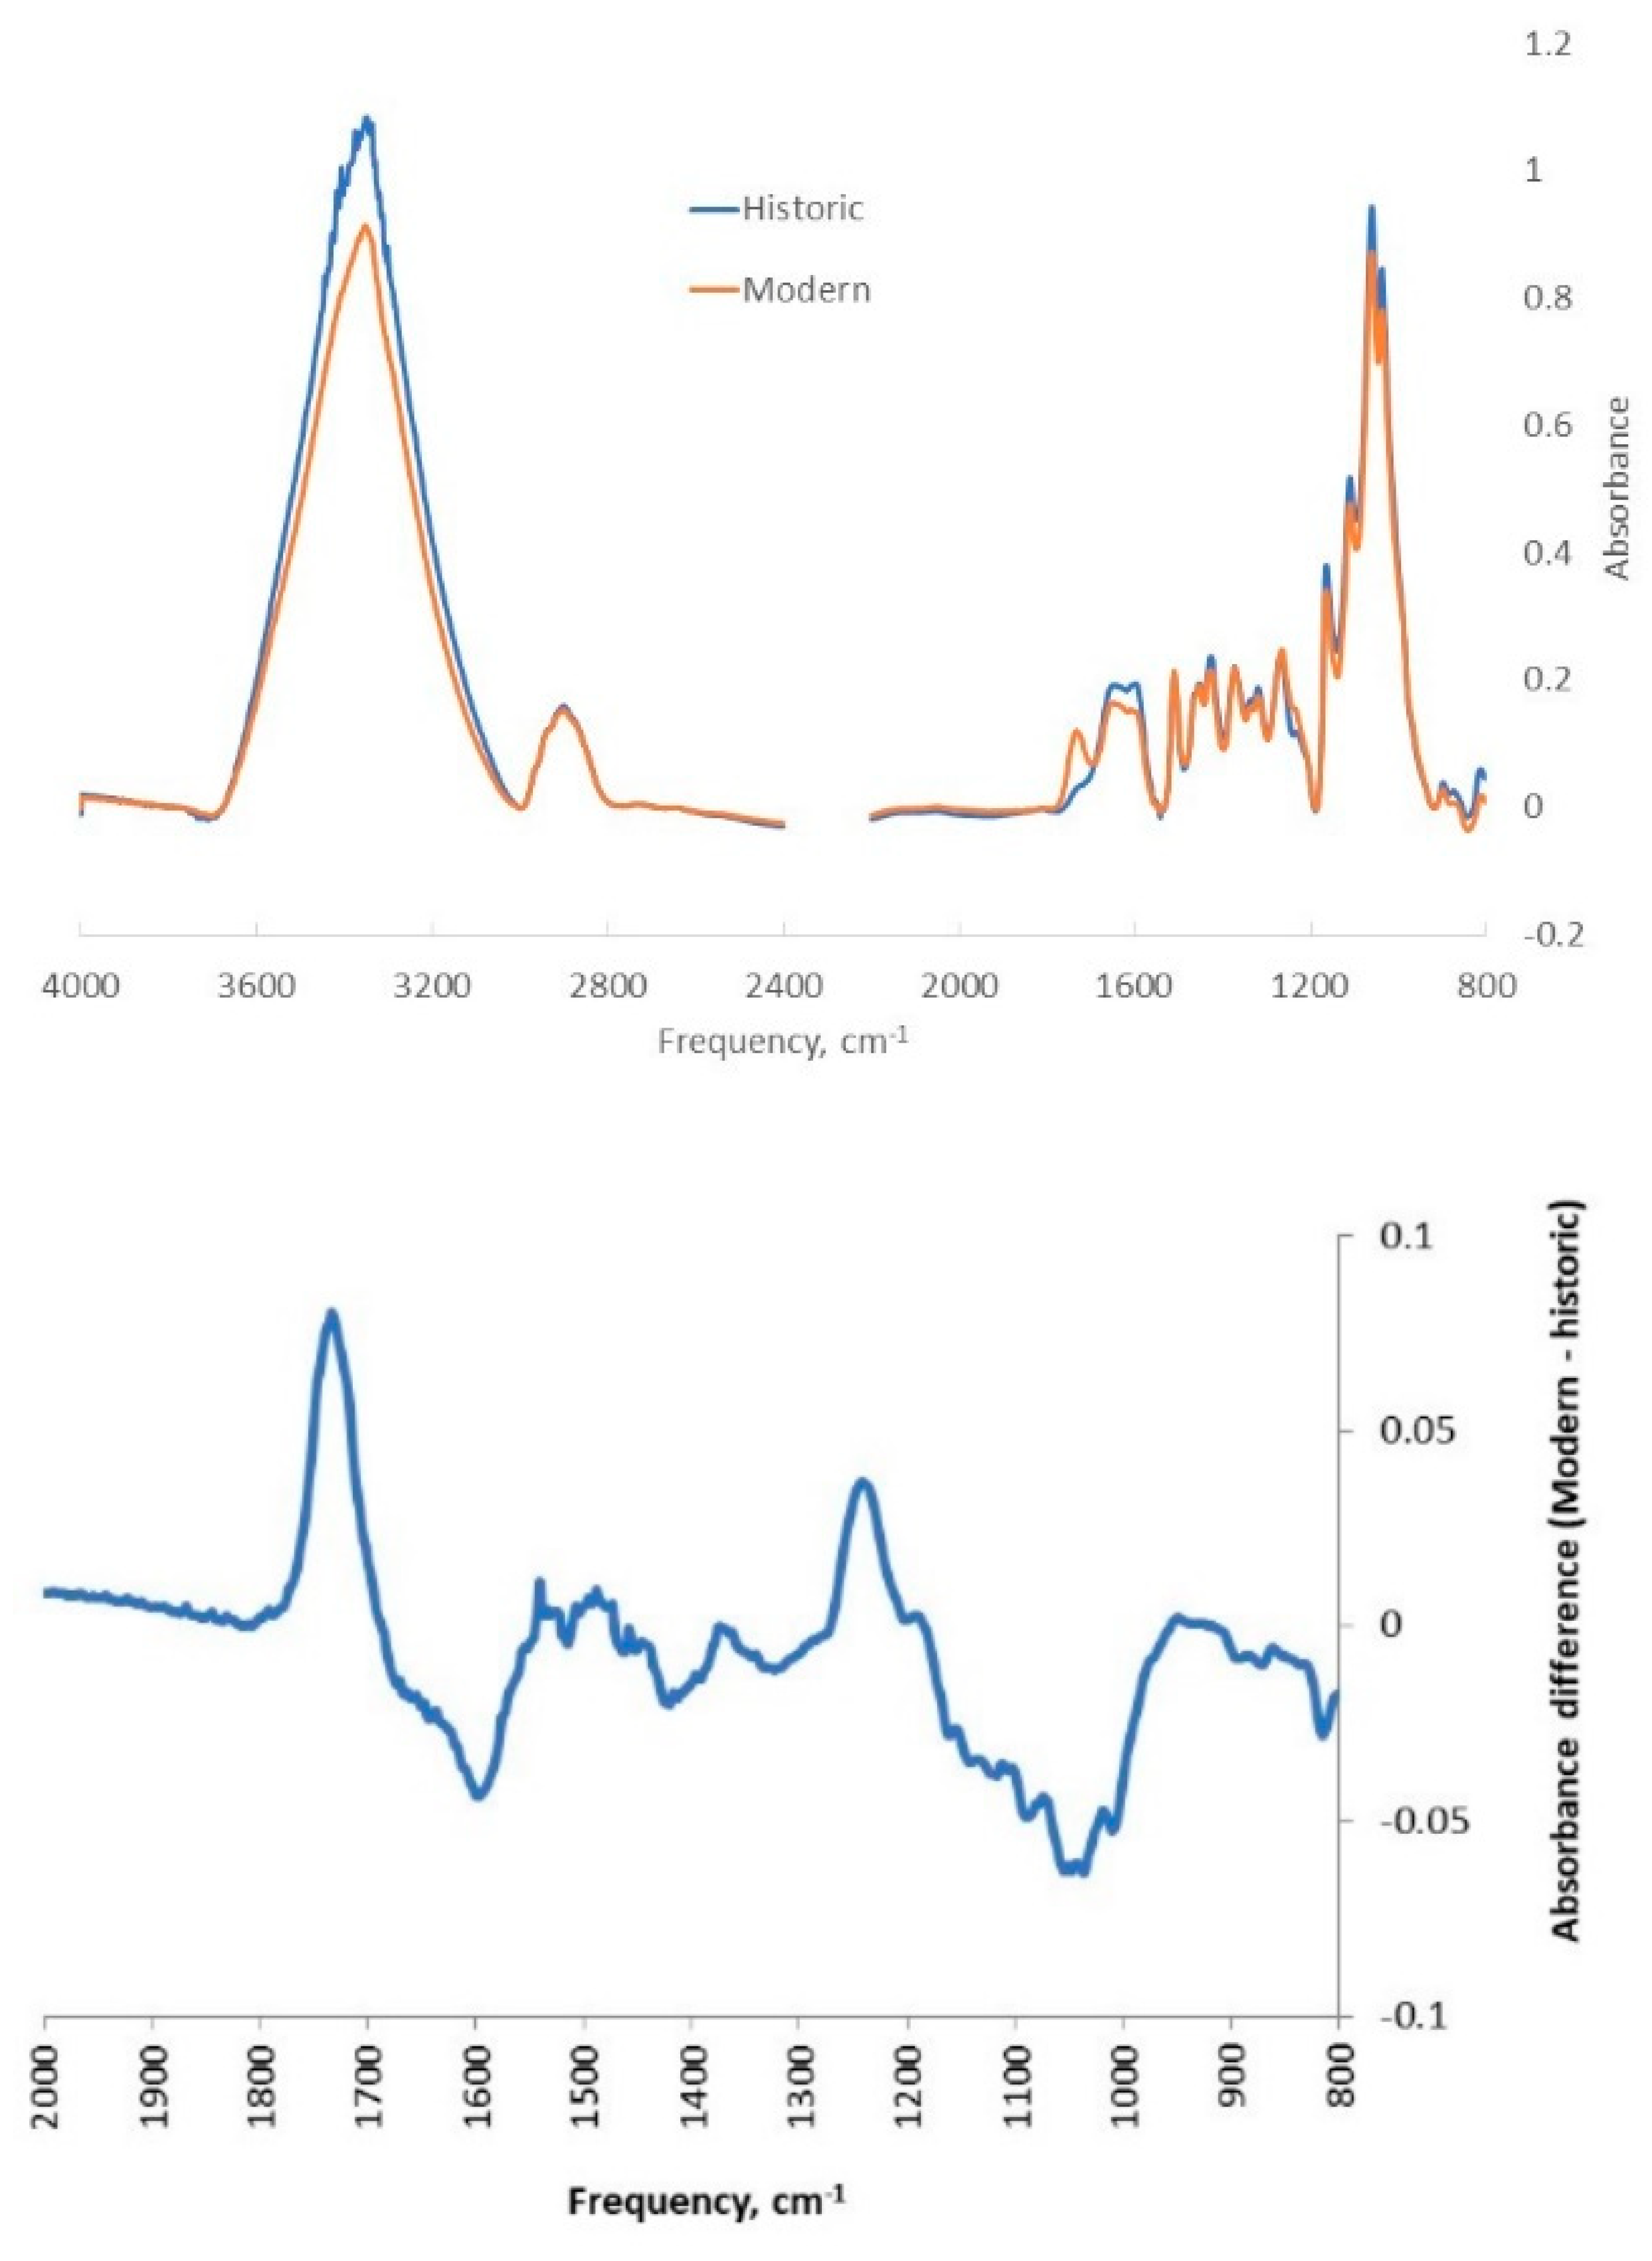
Reduced intensity of the 1732 cm−1, 1240 cm−1, and 1372 cm−1 bands assignable principally to hemicellulosic acetyl groups [33,34,35] is visible in the spectra from the historic samples (Figure 3A). Clear positive peaks at 1733 cm−1 and at 1240 cm−1 [34,35] for all anatomical regions represented in the pine beams confirm that acetyl esters had been lost from the historic samples (Figure 3B).
It might be asked whether the acetyl ester groups had been removed from the hemicellulose polymers or whether the hemicellulose polymers themselves had been destroyed. There are small peaks assigned to stretching of the glycosidic linkage in the hemicellulose polymer chains at 810 cm−1 and 860 cm−1 [36] (Figure 3A). A small positive peak at 860 cm−1 in the difference spectrum, for the sapwood only (Figure 3B), would be consistent with loss of hemicellulose polymer mass due to fungal degradation.
The relative lignin content of wood is sometimes found to increase on attack by brown rot fungi, due to loss of carbohydrate polymers [41]. The difference spectra were quite complex (Figure 3B) but no clear positive peak was evident around the sharp 1510 cm−1 peak assigned to aromatic ring stretching modes, including those of lignin [35]. Negative intensity in the 1560–1660 cm−1 region of the difference spectra may be attributed to altered water content in the historic samples [35], however, since it was not possible to achieve tight control of equilibrium moisture content in these experiments the difference is not necessarily meaningful. Irregular negative intensity in the 1000–1200 cm−1 region of the difference spectra is probably due to saturation and baseline artefacts, as this high-intensity spectral region was slightly saturated in some of the spectra and had variable baselines.
3.2. Acetyl Content
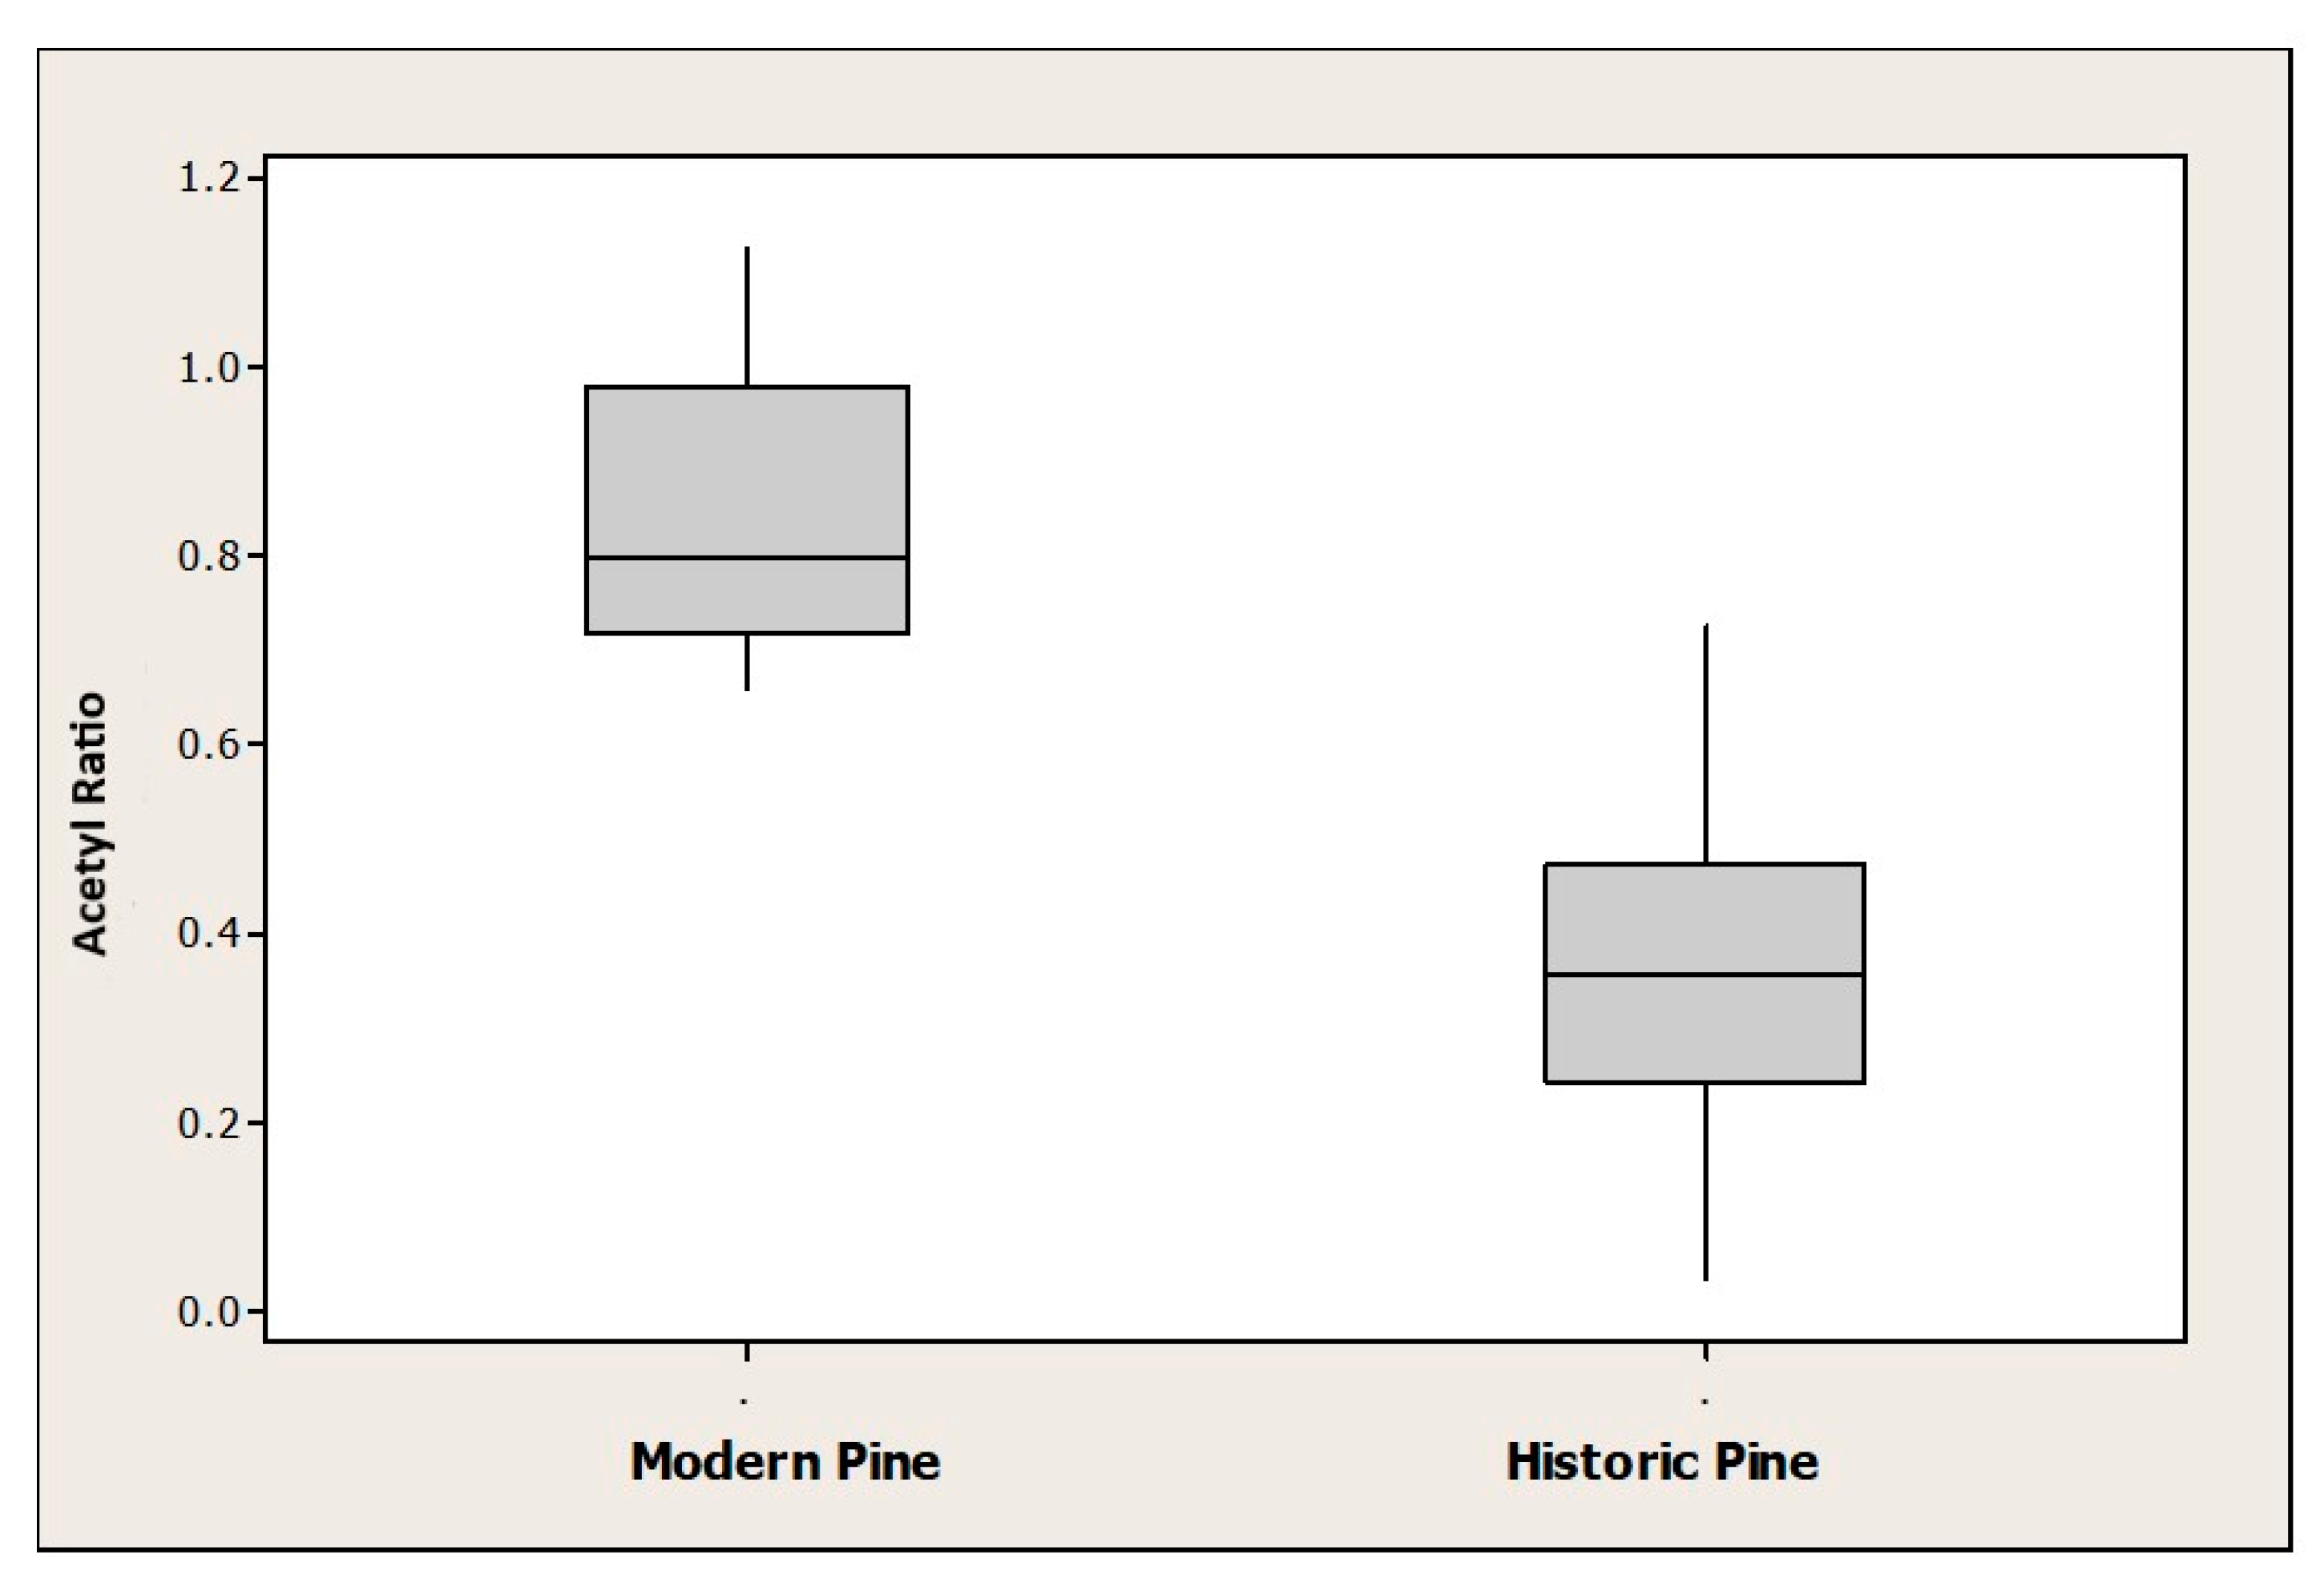
The mean intensity of the 1732 cm−1 acetyl C=O stretching peak was integrated over the range 1724–1727 cm−1 and normalized against the integrated intensity of the 1186–1586 cm−1 region, which contains contributions from all the polymers represented in the wood cell walls. This acetyl relative peak intensity was calculated for the inner and outer heartwood and the sapwood of the historic samples, based on a total of approximately 90 spectra from each anatomical location. The relative acetyl content was on average reduced by approximately half (one-way ANOVA, p < 0.001; Figure 4) in the historic samples compared to the modern samples. Acetyl peak intensity of historic Scots pine samples from the inner heartwood, outer heartwood, and sapwood regions, relative to the mean intensity in the 1186–1586 cm−1 spectral region, were analyzed. The ANOVA showed that there was no significant difference depending on anatomical region (p > 0.05).
3.3. Lignin Content
The mean intensity of the 1510 cm−1 aromatic ring stretching peak from lignin and other phenolics was integrated over the range 1504–1513 cm−1 and normalized as for the acetyl peak. There was no significant difference in total phenolic content between the historic and modern wood samples (Figure 5) nor between anatomical regions (data not shown). Mean lignin peak intensity of historic and modern Scots pine samples, from the 1510 cm−1 peak in the FTIR spectra, relative to the mean intensity in the 1186–1586 cm−1 spectral region, were analyzed. A one-way ANOVA showed that the effect of sample age was not significant (p > 0.05).
3.4. Compression Testing for Stiffness
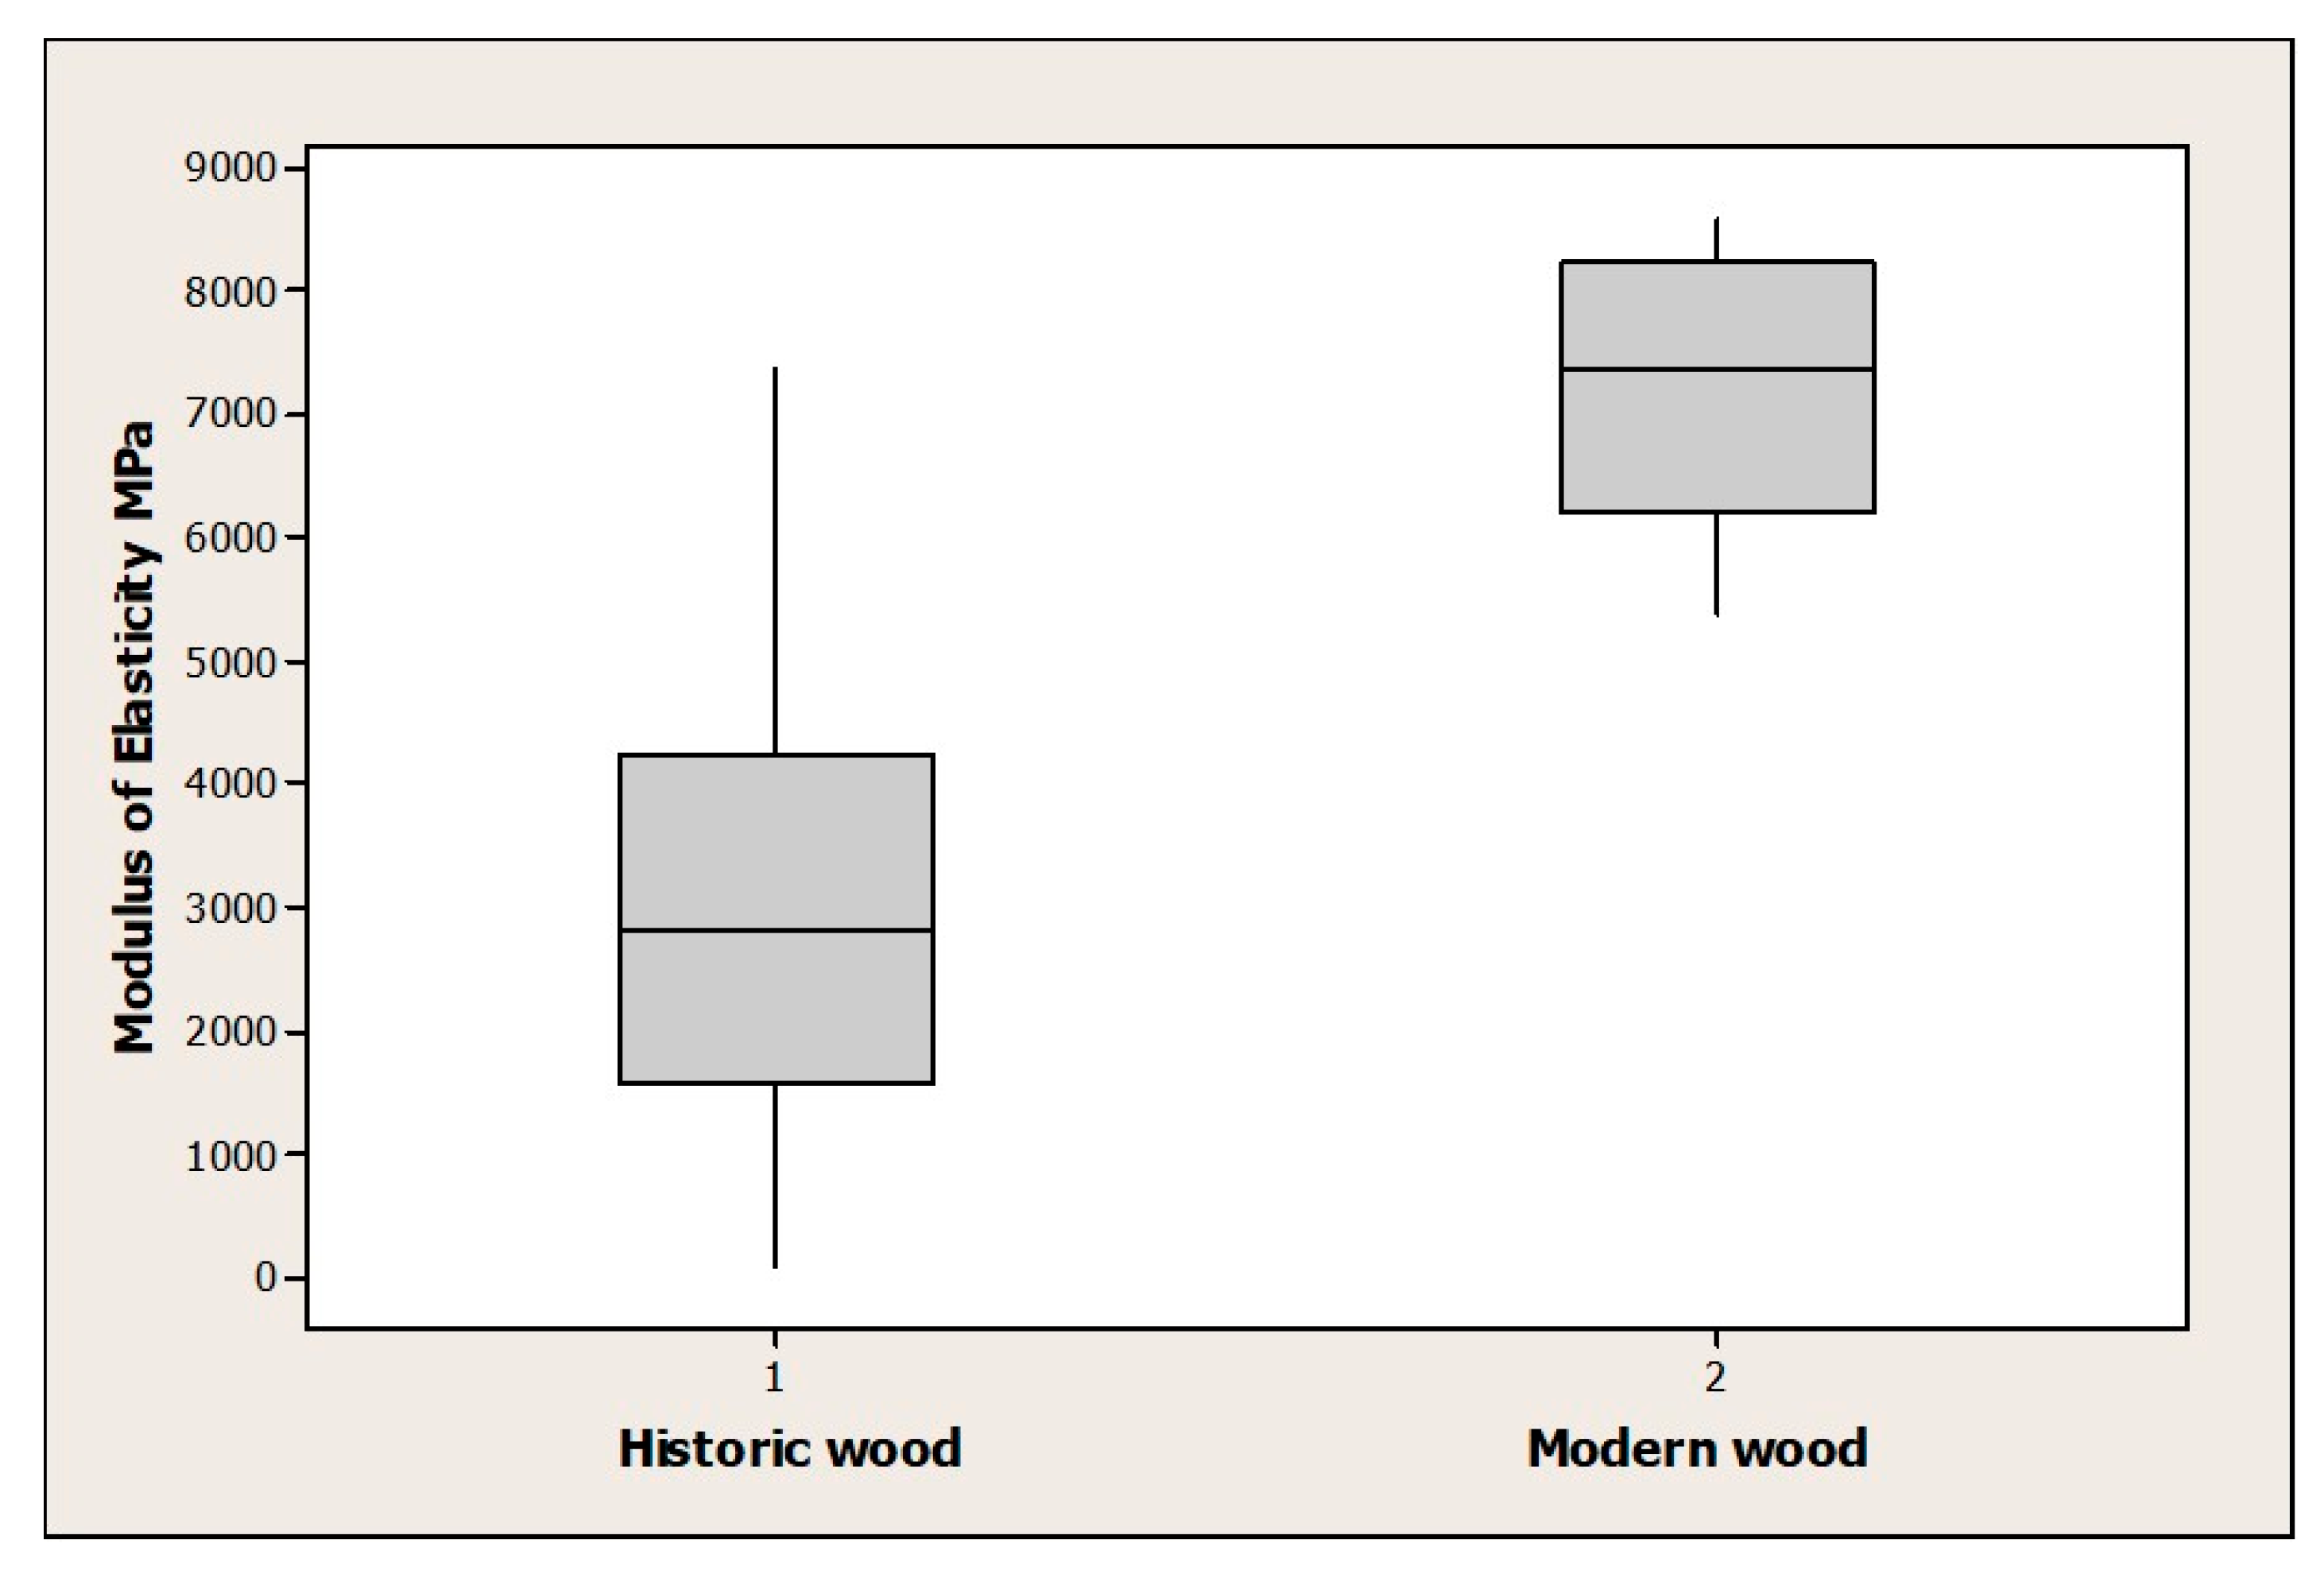
After a considerable amount of method development, the miniaturized method for measuring the elastic modulus of modern Scots pine wood gave mean values in approximately the accepted range for commercial timber (Figure 6). The relative compressive elastic modulus for the 15th and 16th century Scots pine heartwood samples was much more variable, with some samples being as stiff as modern material and others greatly reduced in stiffness. The average relative stiffness of the historic Scots pine heartwood (Figure 6) was 2991 MPa (n = 24, SD 1748 MPa) less than half of typical values of 8000–8500 MPa for modern material [22,25]. The relative stiffness of the historic samples increased from the center of the tree to the outer, mature heartwood (one-way ANOVA, p < 0.05; Figure 5), a pattern of variation that is normal in Scots pine due to the decreasing microfibril angle with maturity [22]. The sapwood, with visible pest infestation, was further reduced in relative stiffness (Figure 5).
4. Discussion
In terms of timber, there has been an increasing interest in non-destructive and micro-destructive techniques that allow for material characterization without the need to compromise the integrity of the building fabric [42,43]. Here we present analysis of historic timbers where small-scale destructive analysis was able to be conducted.
FTIR microscopy was shown to be an efficient and specific method for measuring the relative chemical composition of historic pine wood and was particularly effective for measuring acetyl groups. The loss of acetyl esters from pine hemicellulose between historic dates and the present may be attributed to slow chemical hydrolysis [7], possibly autocatalytic due to the acidity of the acetic acid released. There was no evidence that the hemicellulose polymers themselves were lost over time from the heartwood. Large losses of carbohydrate polymers would have been expected to leave an elevated relative lignin content [41], but no increase in total aromatic content was observed. The implied release of acetic acid by ageing pine wood confirms the observation that metal objects may be liable to corrosion when displayed in wooden museum cases [9].
The release of acetic acid has been suggested to be involved in the loss of strength that is observed over long periods of time in paper [7,44]. The lack of satisfactory methods for directly testing the mechanical properties of very small historic wood samples has been an obstacle to investigations of this issue. Once a mechanical testing procedure capable of dealing with samples only 20 mm long had been developed, it became possible to show that a considerable loss of relative stiffness had accompanied deacetylation during the ageing process. It was not demonstrated that either deacetylation or hydrolysis by acetic acid release was the cause of the diminished mechanical performance; this mechanism is possible, but oxidative degradation of cellulose [5,44] or long-term loading under fluctuating moisture conditions [2] might be an alternative cause. While breaking strength—which is not accessible from compression testing—is perhaps a more obvious cause for concern [12], material stiffness is an essential component in any structural engineer’s calculation of the structural integrity of a building. Using standard stiffness data appropriate to modern timber may not be adequate. It should be pointed out that these conclusions are specific to Scots pine, although they may well apply to other softwoods. Parallel experiments on oak [45] showed a similar loss of acetyl groups but no loss of stiffness with age.
5. Conclusions
Polarized FTIR microscopy can be used to measure the acetyl content of the heartwood of Scots pine. Measurements by this method showed that approximately half the acetyl ester groups in the heartwood had been lost during a period of around 500 years by Scots pine wood, apparently by chemical means. Using a miniaturized method of compression testing, it was shown that the Scots pine samples had lost over half of their longitudinal stiffness over the same period.
Author Contributions
Conceptualization, C.J.K. and M.C.J.; methodology, K.H.-M. and M.C.J.; software, K.H.-M. and M.C.J.; validation, K.H.-M. and M.C.J.; formal analysis, K.H.-M.; investigation, K.H.-M.; resources, C.J.K. and M.C.J.; data curation, K.H.-M.; writing—original draft preparation, K.H.-M. and M.C.J.; writing—review and editing, C.J.K.; visualization, K.H.-M. and M.C.J.; supervision, C.J.K. and M.C.J.; project administration, C.J.K. and M.C.J.; funding acquisition, C.J.K. and M.C.J. All authors have read and agreed to the published version of the manuscript.”
Funding
This research was funded by Historic Scotland.
Acknowledgments
The authors thank Historic Scotland for funding this work and for providing access to the historic wood material. Anne Crone (AOC Archaeology) is thanked for her inputs the dendrochronology sections of the paper and Karin de Borst for access to a microtome.
Conflicts of Interest
The authors declare no conflict of interest.
References
- Forster, A.M. Building conservation philosophy for masonry repair: part 2—“principles”. Struct. Surv. 2010, 28, 165–188. [Google Scholar] [CrossRef]
- Kranitz, K.; Sonderegger, W.; Bues, C.-T.; Niemz, P. Effects of aging on wood: a literature review. Wood Sci. Technol. 2015, 50, 7–22. [Google Scholar] [CrossRef]
- Riggio, M.; D’Ayala, D.; Parisi, M.A.; Tardini, C. Assessment of heritage timber structures: Review of standards, guidelines and procedures. J. Cult. Herit. 2018, 31, 220–235. [Google Scholar] [CrossRef]
- Lindfors, E.-L.; Lindström, M.; Iversen, T. Polysaccharide degradation in waterlogged oak wood from the ancient warship Vasa. Holzforschung 2008, 62, 57–63. [Google Scholar] [CrossRef]
- Lichtblau, D.; Strlic, M.; Trafela, T.; Kolář, J.; Anders, M. Determination of mechanical properties of historical paper based on NIR spectroscopy and chemometrics – a new instrument. Appl. Phys. A 2008, 92, 191–195. [Google Scholar] [CrossRef] [Green Version]
- Menart, E.; De Bruin, G.; Strlic, M. Effects of NO2 and acetic acid on the stability of historic paper. Cellulose 2014, 21, 3701–3713. [Google Scholar] [CrossRef] [Green Version]
- Tetreault, J.; Dupont, A.-L.; Bégin, P.; Paris, S. The impact of volatile compounds released by paper on cellulose degradation in ambient hygrothermal conditions. Polym. Degrad. Stab. 2013, 98, 1827–1837. [Google Scholar] [CrossRef] [Green Version]
- Becker, M.; Meyer, F.; Jeong, M.-J.; Ahn, K.; Henniges, U.; Potthast, A. The museum in a test tube – Adding a third dimension to the evaluation of the impact of volatile organic acids on paper. Polym. Degrad. Stab. 2016, 130, 109–117. [Google Scholar] [CrossRef]
- Gibson, L.; Watt, C. Acetic and formic acids emitted from wood samples and their effect on selected materials in museum environments. Corros. Sci. 2010, 52, 172–178. [Google Scholar] [CrossRef] [Green Version]
- Kennedy, C. The Role of Heritage Science in Conservation Philosophy and Practice. Hist. Environ. Policy Pract. 2015, 6, 214–228. [Google Scholar] [CrossRef]
- Douglas-Jones, R.; Hughes, J.; Jones, S.; Yarrow, T. Science, value and material decay in the conservation of historic environments. J. Cult. Herit. 2016, 21, 823–833. [Google Scholar] [CrossRef]
- Sonderegger, W.; Kranitz, K.; Bues, C.-T.; Niemz, P. Aging effects on physical and mechanical properties of spruce, fir and oak wood. J. Cult. Herit. 2015, 16, 883–889. [Google Scholar] [CrossRef]
- Chen, Y.; Guo, W. Nondestructive Evaluation and Reliability Analysis for Determining the Mechanical Properties of Old Wood of Ancient Timber Structure. BioResources 2017, 12. [Google Scholar] [CrossRef] [Green Version]
- Eder, M.; Jungnikl, K.; Burgert, I. A close-up view of wood structure and properties across a growth ring of Norway spruce (Picea abies [L] Karst.). Trees 2008, 23, 79–84. [Google Scholar] [CrossRef] [Green Version]
- Chauhan, S.; Sethy, A. Differences in dynamic modulus of elasticity determined by three vibration mthods and their relationship with static modulus of elasticity. Maderas-Cienc. Tecnol. 2016, 18, 373–382. [Google Scholar]
- Hudson-McAulay, K.; Auty, D.; Jarvis, M.C. FTIR Measurement of Cellulose Microfibril Angle in Historic Scots Pine Wood and Its Use to Detect Fungal Decay. Stud. Conserv. 2017, 63, 375–382. [Google Scholar] [CrossRef]
- Altaner, C.M.; Thomas, L.; Fernandes, A.N.; Jarvis, M.C. How Cellulose Stretches: Synergism between Covalent and Hydrogen Bonding. Biomacromolecules 2014, 15, 791–798. [Google Scholar] [CrossRef] [Green Version]
- Fackler, K.; Schwanninger, M. How spectroscopy and microspectroscopy of degraded wood contribute to understand fungal wood decay. Appl. Microbiol. Biotechnol. 2012, 96, 587–599. [Google Scholar] [CrossRef] [Green Version]
- Canmore. Edinburgh, Abbey Strand, Abbey Sanctuary. Available online: https://canmore.org.uk/site/52248/edinburgh-abbey-strand-abbey-sanctuary (accessed on 20 January 2020).
- Canmore. Dysart, Panhall, 1 Pan Ha’, Bay House. Available online: http://canmore.org.uk/site/53989/dysart-panhall-1-pan-ha-bay-house (accessed on 20 January 2020).
- Crone, A. Carnock House, Stirling; Dendrochronological Analysis of the Painted Oak Beams; AOC Archaeology Group: Edinburgh, UK, 2011. [Google Scholar]
- Auty, D.; Gardiner, B.; Achim, A.; Moore, J.; Cameron, A.D. Models for predicting microfibril angle variation in Scots pine. Ann. For. Sci. 2012, 70, 209–218. [Google Scholar] [CrossRef] [Green Version]
- Faix, O.; Boettcher, J.H.; Bertelt, E. Using FTIR spectroscopy and FTIR microscopy for the examination of wood and wood tissue. Luebeck DL Tentat. 1992, 1575, 428–430. [Google Scholar] [CrossRef]
- Leonardon, M.; Altaner, C.M.; Vihermaa, L.; Jarvis, M.C. Wood shrinkage: influence of anatomy, cell wall architecture, chemical composition and cambial age. Holz als Roh- und Werkst. 2009, 68, 87–94. [Google Scholar] [CrossRef]
- Auty, D.; Achim, A. The relationship between standing tree acoustic assessment and timber quality in Scots pine and the practical implications for assessing timber quality from naturally regenerated stands. Forestry 2008, 81, 475–487. [Google Scholar] [CrossRef] [Green Version]
- Brancheriau, L.; Baillères, H.; Guitard, D. Comparison between modulus of elasticity values calculated using 3 and 4 point bending tests on wooden samples. Wood Sci. Technol. 2002, 36, 367–383. [Google Scholar] [CrossRef]
- Nocetti, M.; Brancheriau, L.; Bacher, M.; Brunetti, M.; Crivellaro, A. Relationship between local and global modulus of elasticity in bending and its consequence on structural timber grading. Holz als Roh- und Werkst. 2013, 71, 297–308. [Google Scholar] [CrossRef]
- Lourenço, P.B.; Feio, A.; Machado, J. Chestnut wood in compression perpendicular to the grain: Non-destructive correlations for test results in new and old wood. Constr. Build. Mater. 2007, 21, 1617–1627. [Google Scholar] [CrossRef] [Green Version]
- Kacurã¡kovã¡, M. Developments in mid-infrared FT-IR spectroscopy of selected carbohydrates. Carbohydr. Polym. 2001, 44, 291–303. [Google Scholar] [CrossRef]
- Nuopponen, M.H.; Birch, G.M.; Sykes, R.J.; Lee, S.J.; Stewart, D. Estimation of Wood Density and Chemical Composition by Means of Diffuse Reflectance Mid-Infrared Fourier Transform (DRIFT-MIR) Spectroscopy. J. Agric. Food Chem. 2006, 54, 34–40. [Google Scholar] [CrossRef]
- Åkerholm, M.; Salmén, L. Interactions between wood polymers studied by dynamic FT-IR spectroscopy. Polymer 2001, 42, 963–969. [Google Scholar] [CrossRef]
- Pizzo, B.; Pecoraro, E.; Alves, A.; Macchioni, N.; Rodrigues, J. Quantitative evaluation by attenuated total reflectance infrared (ATR-FTIR) spectroscopy of the chemical composition of decayed wood preserved in waterlogged conditions. Talanta 2015, 131, 14–20. [Google Scholar] [CrossRef]
- Windeisen, E.; Strobel, C.; Wegener, G. Chemische Charakterisierung von thermisch belastetem Holz: Bestimmung des Acetylgruppengehalts und FTIR-Spektroskopie. Holz als Roh- und Werkst. 2003, 61, 471–472. [Google Scholar] [CrossRef]
- Xu, C.; Leppänen, A.-S.; Eklund, P.C.; Holmlund, P.; Sjöholm, R.; Sundberg, K.; Willför, S. Acetylation and characterization of spruce (Picea abies) galactoglucomannans. Carbohydr. Res. 2010, 345, 810–816. [Google Scholar] [CrossRef] [PubMed]
- Simonović, J.; Stevanic, J.; Djikanović, D.; Salmen, L.; Radotić, K. Anisotropy of cell wall polymers in branches of hardwood and softwood: a polarized FTIR study. Cellulose 2011, 18, 1433–1440. [Google Scholar] [CrossRef]
- Holmbom, B. Isolation and characterisation of water soluble polysaccharides from Norway spruce and Scots pine. Wood Sci. Technol. 2004, 38, 173–179. [Google Scholar] [CrossRef]
- Stevanic, J.S.; Salmén, L. Orientation of the wood polymers in the cell wall of spruce wood fibres. Holzforschung 2009, 63, 497–503. [Google Scholar] [CrossRef]
- Nuopponen, M. FT-IR and UV Raman spectroscopic studies on thermal modification of Scots pine wood and its extractable compounds. Ph.D. Thesis, Helsinki University of Technology, Helsinki, Finland, 2005. [Google Scholar]
- Mattos, B.; Lourençon, T.V.; Gatto, D.A.; Serrano, L.; Labidi, J. Chemical characterization of wood and extractives of fast-growing Schizolobium parahyba and Pinus taeda. Wood Mater. Sci. Eng. 2014, 11, 1–8. [Google Scholar] [CrossRef]
- Caron-Decloquement, A. Extractives from Sitka spruce. Ph.D. Thesis, University of Glasgow, Glasgow, UK, 2008. [Google Scholar]
- Arantes, V.; Goodell, B. Current Understanding of Brown-Rot Fungal Biodegradation Mechanisms: A Review. In ACS Symposium Series; American Chemical Society (ACS): Washington, DC, USA, 2014; Volume 1158, pp. 3–21. [Google Scholar] [CrossRef]
- Kandemir-Yücel, A.; Tavukçuoğlu, A.; Caner-Saltik, E.; Caner-Saltık, E. In situ assessment of structural timber elements of a historic building by infrared thermography and ultrasonic velocity. Infrared Phys. Technol. 2007, 49, 243–248. [Google Scholar] [CrossRef]
- Altunişik, A.C.; Kalkan, E.; Okur, F.; Ozgan, K.; Karahasan, O.; Bostanci, A. Non-destructive modal parameter identification of historical timber bridges using ambient vibration tests after restoration. Measurement 2019, 146, 411–424. [Google Scholar] [CrossRef]
- Henniges, U.; Schwanninger, M.; Potthast, A. Non-destructive determination of cellulose functional groups and molecular weight in pulp hand sheets and historic papers by NIR-PLS-R. Carbohydr. Polym. 2009, 76, 374–380. [Google Scholar] [CrossRef]
- Hudson-McAulay, K. The Structural and Mechanical Integrity of Historic Wood. Ph.D. Thesis, University of Glasgow, Glasgow, UK, 2016. [Google Scholar]
Figure 1.
Scheme of cutting sections and measuring FTIR spectra.

Figure 2.
Compressive testing apparatus, recording the deformation curve of a historic sample of pine. This allows the calculation of the modulus of elasticity of the sample to be calculated.
Figure 2.
Compressive testing apparatus, recording the deformation curve of a historic sample of pine. This allows the calculation of the modulus of elasticity of the sample to be calculated.

Figure 3.
(a—top): Fourier-transform infrared (FTIR) spectra of modern Scots pine wood and the average spectra recorded from all radial positions in five 15th and 16th century Scots pine samples. (b—bottom): difference spectra (modern–historic) after normalization.
Figure 3.
(a—top): Fourier-transform infrared (FTIR) spectra of modern Scots pine wood and the average spectra recorded from all radial positions in five 15th and 16th century Scots pine samples. (b—bottom): difference spectra (modern–historic) after normalization.

Figure 4.
Mean acetyl peak intensity of historic and modern Scots pine samples, from the 1726 cm−1 peak in the FTIR spectra, relative to the mean intensity in the 1186–1586 cm−1 spectral region. For each category the top and bottom of the box represent the first and third quartiles of the data and the band inside is the median (second quartile of the data). The ‘whisker’ lines extending upward and downward from the box indicate the upper and lower quartiles and the asterisks represent outliers. One-way ANOVA (n = 50 for historic pine, 18 for modern pine) gave p < 0.001.

Figure 5.
Radial variation in the mean compression modulus of historic Scots pine timber. Samples were taken from analysis adjacent to the pith, in two parts equally spaced between the pith and the sapwood, and one from the sapwood. A one-way ANOVA (n = 6) gave p = 0.026. The Fisher least significant difference was 1800 MPa.

Figure 6.
Mean compression modulus of modern and historic Scots pine timber.


Table 1.
Method development for compression testing: Influence of sample length demonstrating end effects, prevented by reinforcement, and flattening of the ends.
Table 1.
Method development for compression testing: Influence of sample length demonstrating end effects, prevented by reinforcement, and flattening of the ends.
| Sample Length mm | n | Mean Modulus MPa | SD |
|---|---|---|---|
| 80 | 4 | 11804 | 1563 |
| 40 | 8 | 7604 | 3464 |
| 20 | 16 | 5170 | 3275 |
| 10 | 32 | 4266 | 2579 |
| 20 mm reinforced | 16 | 10185 | 5200 |
© 2020 by the authors. Licensee MDPI, Basel, Switzerland. This article is an open access article distributed under the terms and conditions of the Creative Commons Attribution (CC BY) license (http://creativecommons.org/licenses/by/4.0/).
Share and Cite
MDPI and ACS Style
Hudson-McAulay, K.; Kennedy, C.J.; Jarvis, M.C. Chemical and Mechanical Differences between Historic and Modern Scots Pine Wood. Heritage 2020, 3, 116-127. https://0-doi-org.brum.beds.ac.uk/10.3390/heritage3010007
AMA Style
Hudson-McAulay K, Kennedy CJ, Jarvis MC. Chemical and Mechanical Differences between Historic and Modern Scots Pine Wood. Heritage. 2020; 3(1):116-127. https://0-doi-org.brum.beds.ac.uk/10.3390/heritage3010007
Chicago/Turabian StyleHudson-McAulay, Kate, Craig J. Kennedy, and Michael C. Jarvis. 2020. "Chemical and Mechanical Differences between Historic and Modern Scots Pine Wood" Heritage 3, no. 1: 116-127. https://0-doi-org.brum.beds.ac.uk/10.3390/heritage3010007