Assessing the Utility of Open-Access Bathymetric Data for Shipwreck Detection in the United States


1
Department of Anthropology, The Pennsylvania State University, University Park, PA 16802, USA
2
Ecology Intercollege Graduate Program, The Pennsylvania State University, University Park, PA 16802, USA
*
Author to whom correspondence should be addressed.
†
These authors contributed equally to this work.
Heritage 2020, 3(2), 364-383; https://0-doi-org.brum.beds.ac.uk/10.3390/heritage3020022
Submission received: 1 April 2020
/
Revised: 21 May 2020
/
Accepted: 22 May 2020
/
Published: 24 May 2020
(This article belongs to the Section Underwater Heritage)
Abstract
:Investigation of submerged cultural heritage is an important area of archeological focus. However, the expense of acquiring the necessary data to conduct studies of underwater landscapes is often prohibitive to many researchers. Within the United States, highly resolved bathymetric data are openly available from governmental agencies, and yet little to no marine archaeological exploration has occurred using this information. Here, we investigate the archaeological utility of freely available bathymetric datasets from the National Oceanic and Atmospheric Administration (NOAA) in the United States. These datasets have not previously been utilized for archaeological publications, and include swath bathymetric and topographic LiDAR data, which are widely used by marine archaeologists. We present three case studies from Long Island, New York, coastal Massachusetts (on the Eastern coast of North America), and New Orleans (on the Gulf Coast of North America) to demonstrate the potential of this open-access information for locating shipwreck sites. Results indicate that shipwrecks at varying levels of preservation can be identified at depths up to 160 m, and that even in extremely turbid waters, bathymetric LiDAR can detect some wreckage. Following this assessment, we develop an automated shipwreck detection procedure using an inverse depression analysis. Our results are promising for automated detection methods in marine archaeology research. We argue that archaeologists in the United States should take advantage of these freely available data, as it is possible that these bathymetric data can be used for detection and conservation of cultural and environmental resources even without large funding acquisitions.
1. Introduction
Much of human history is dominated by coastal living arrangements and connections to maritime environments [1,2,3,4]. While there is an abundant underwater cultural record [5], the vast majority of this heritage is at risk and unprotected [6,7,8,9,10,11,12,13]. Studies around the world have demonstrated that an abundance of archaeological deposits lie submerged beneath present day sea levels [1,14,15,16,17] including shipwrecks [10,11,12,18,19]. In North America alone, the Eastern coastline contains a rich maritime history [20,21]. The application of remote sensing technology has capabilities to detect objects submerged at shallow and deeper depths near the coast, even in extremely turbid and high-energy waters.
The archaeological utility of high-resolution bathymetric sensors has been well established [10,11,12,22,23,24,25,26]. For example, Warren et al. [27] use high-resolution swath bathymetry data to locate an aircraft carrier sunk by the Germans in WWII. Plets et al. [11] use multibeam bathymetry data to survey a large section of seafloor on Ireland’s northern coast. They demonstrate how shipwrecks can be identified but note that resolution of the data limited detection of smaller, less well-preserved wrecks. In the United States, researchers have used bathymetric data to locate the USS Independence, a WWII aircraft carrier used to test the effectiveness of atomic weapons [24]. Other research has demonstrated the utility of multibeam sonar for detecting shallow wrecks from the American Civil War (1861–1865) and WWII [28]. Additionally, researchers in the United States documented shipwrecks using photogrammetry for inclusion in the National Register of Historical Places (NRHP) [29]. In many European countries (e.g., Ireland, Norway, the U.K., etc.), open-access bathymetry data have been highly impactful to the marine archaeological community [25,30,31]. Unlike many nations in Europe, however, the use of open-access bathymetric data has been slower to make its way into archaeology in the United States (e.g., [32]).
Detecting archaeological features from image data is often accomplished using depth/elevation profiles [11,22,33,34,35,36,37,38]. Bathymetric data produce depth measurements for seafloors, which can help to characterize seabed morphology [39]. One limitation of the use of bathymetric datasets is their cost. To acquire large-scale bathymetric data by ship can range in the tens-of-thousands of dollars for some commercial contracts [40,41]. While smaller datasets (i.e., single-beam scans of targeted areas) are more affordable, some data require commercial operations. Furthermore, data acquisition in shallow waters is often more expensive and time consuming than deeper environments [41]. The availability of open-access data from the United States government makes conducting important underwater research possible for a greater number of scholars. Despite the availability of these data in the United States, little to no archaeological case studies have been published using such information. While governmental agencies have produced reports detailing the capabilities of bathymetric data for recording submerged archaeological sites, the data generated are not always made publicly available.
Here, we assess freely available bathymetric datasets from the United States Geologic Service (USGS) and the National Oceanic and Atmospheric Administration (NOAA) for archaeological prospection. These data are available for most of the eastern and western seaboards of the contiguous United States, Alaska and Hawaii, and several U.S. territories. Because of the abundance of shipwrecks and maritime history along the eastern coastline of the U.S. (see the Atlantic OCS Shipwreck Database [32]; also see [20]), we specifically target areas with high densities of known shipwrecks to investigate the capabilities of these datasets. This will also provide an assessment of the abilities of the aerial components of these data (i.e., LiDAR) in extremely turbid environments that are prone to damaging tropical storms and dynamic seabed motion.
In what follows, we briefly review bathymetric remote sensing technology and its applications in archaeological research. While archaeologists have conducted similar studies elsewhere (e.g., [11,19,26]), the specific datasets used here have not been evaluated for archaeological purposes. As such, we begin by evaluating its utility for detecting shipwreck sites using three case studies from Long Island, New York, Boston, Massachusetts, and New Orleans, Louisiana. We then evaluate the data’s ability to support automatic object detection using a small part of Long Island as a study region. Because machine learning approaches require high-resolution data [42,43], the capacity for automated archaeological analysis further demonstrates the potential of this open-access dataset. Finally, we discuss the implications of these case studies for maritime archaeology in the United States, specifically in terms of desk-based analyses of large bathymetric datasets.
2. Materials and Methods
Most technology applied for bathymetric mapping utilizes active remote sensing devices (i.e., sonar, radar, LiDAR, etc.). One example of active remote sensing is light and radar [44], or light detection and ranging (LiDAR), which has been revolutionary in archaeological research since its introduction in the early 2000s [34,36,45,46,47,48,49,50,51,52]. LiDAR is an active remote sensing system that emits electromagnetic pulses (i.e., light) and records each light pulse’s return time to calculate distance. By measuring the return times of multiple light pulses simultaneously, LiDAR data can record topographic changes on ground surfaces, even in densely vegetated areas [53]. The faster the return time, the higher the elevation of a given point, as there is a smaller distance between the aerial sensor and the point on the ground.
2.1. Bathymetric LiDAR
While LiDAR technology has resulted in an increased level of discovery and insight into past land-use practices, fewer studies have utilized LiDAR for scanning submerged areas [23,54]. Typical “near-infrared” LiDAR systems contain wavelengths between 1064 and 1550 nm and are most often used for terrestrial surface mapping [55]. These wavelengths can penetrate vegetative canopies but are unable to penetrate the water column. For bathymetric purposes, a “green” LiDAR system with wavelengths of approximately 532 nm are used because these pulses can penetrate the water column [55]. Until recently, however, most green LiDAR systems produced too few pulses to record meaningful archaeological information [54], as the spacing between each pulse would result in an average resolution of several meters across [56], which is too coarse for detecting many small to moderate archaeological deposits. Recent improvements in these systems have resulted in the ability of green LiDAR to record higher-resolution data that can provide meaningful information for archaeologists [18,23,54,57].
Unlike terrestrial LiDAR, bathymetric LiDAR does not have to contend with vegetative cover. To aid in interpretation, raw LiDAR points are usually converted into different formats, including digital surface models (DSMs) or digital elevation models (DEMs), where vegetation, buildings, and other features are filtered out, and digital terrain models (DTMs), where all LiDAR points are included. DEMs, DSMs, and DTMs are all created using interpolation, whereby point data are converted into a continuous raster showing elevation changes throughout an area. Other datasets are usually created from these DEMs to highlight more specific topographic characteristics, including hillshade models (which emphasize smaller topographic changes using an artificial light source), slope maps, and various other visualization methods [58,59,60,61].
Research has shown that new bathymetric LiDAR sensors can map features as deep as 50 m, but water turbulence and visibility issues can limit the effectiveness of laser penetration [57]. When water conditions are most ideal, however, researchers have demonstrated the utility of this technology for archaeology [18,23]. For example, Tian-Yuan Shih et al. [18] document shipwreck sites in the South China Sea using bathymetric LiDAR. This area contains high levels of visibility and low turbidity, making it an ideal spot to apply bathymetric LiDAR. In a similar set of environmental conditions, Doneus et al. [23] map the remains of an ancient Roman villa that is submerged in the Adriatic. Clearly, these systems have great potential, but because of the historically poor abilities of LiDAR systems to perform in turbid water conditions, few applications have been made in other parts of the world.
2.2. Acoustic Bathymetry Systems
For studying deeper archaeological materials, the use of different sensors including acoustic imaging, SONAR, swath systems and optical imaging are usually required [9,19,39,62,63,64]. Multibeam echo sounders have been applied for archaeological research by many researchers [11,22,27,65,66,67]. Multibeam systems are a type of swath bathymetry, whereby depth measurements of seafloors cover greater areas than single-beam sensors by acquiring multiple simultaneous measurements and have increased precision and resolution [39,63,68].
Archaeologists have shown that multibeam systems can detect archaeological sites at great depths (≥300 m; e.g., [27]) and in a variety of environments, but often require resolutions of less than 2 m to detect smaller objects [67]. Nonetheless, for the detection of shipwrecks and other large-scale deposits, this technology has proven effective [10,11,26]. The use of these and similar methods for underwater investigation is widespread among archaeologists, as are methods of analyzing these datasets [11,12,64].
Here, we analyze free bathymetric datasets from the NOAA to identify shipwrecks in three locations along the Northeast and Gulf coasts of the United States. Because these datasets are often extraordinarily expensive to generate [40,41], the availability of open-access data is worth exploring for archaeological applications (as has been done elsewhere [12,69,70]). The datasets analyzed here combine bathymetric LiDAR with single and multibeam echosounders. We illustrate how these data can be useful for archaeologists even in shallow and dynamic water and seafloor conditions, documenting the depths at which shipwrecks can be located and the level of preservation required for positive identification. Furthermore, we implement an automated shipwreck detection method that shows great promise for archaeology using these data.
2.3. The Dataset: Open-Access Bathymetric Information from the NOAA
Within the United States, geospatial and remote sensing data are often provided freely by government agencies. LiDAR is one such technology that is made public by the NOAA and other governmental agencies, and has proven useful for archaeological purposes in the United States [34,71]. The NOAA’s bathymetric and elevation datasets (some of which have been used for archaeological purposes recently [e.g., [71]), come in spatial resolutions ranging from 1 to 10 m and are free to download. In addition to aerial LiDAR for topographic mapping (near-infrared LiDAR), the NOAA also provides access to bathymetric datasets, including bathymetric (green) LiDAR, and topobathymetric information generated by single and multibeam acoustic systems. Nonetheless, there have been no published archaeological studies making use of these bathymetric data.
To assess the utility of the NOAA’s bathymetry data for locating cultural heritage, we downloaded a topobathymetric DSM (TBDSM) created by the USGS Coastal Navigation Elevation Database (CoNED) Project in 2016, available from the NOAA (https://coast.noaa.gov/digitalcoast/data/jalbtcx.html, also see https://coast.noaa.gov/dataviewer/#/). This dataset represents a collection of the highest-resolution bathymetric datasets collected over the past several decades and has a spatial resolution of 1 m. Datasets incorporated into this TBDSM include topographic and bathymetric LiDAR at 1 m resolution and hydrographic sounding (acoustic) data, including single and multibeam sonar (see [72]). These data were assessed for accuracy using 25,000 control points generated separately by the NOAA (see [72]). The creation of the final dataset utilized kriging interpolation to integrate the topographic and bathymetric datasets into a single product. For more details on the data and its specifications, see [72].
For the Long Island and Massachusetts study regions, the root mean square error of the data ranges from 15 to 20 cm. This dataset is available for most of the Eastern Seaboard of the United States. The downloaded files were prepared in GeoTIFF format using Nearest Neighbor interpolation, and we imported these files into ArcMap 10.7.1 [73] for analysis. These TBDSMs have a spatial resolution of 1 m and an average vertical accuracy of 15 cm. For the Mississippi Delta, the 2016 CoNED dataset was unavailable, and so we used the 2014 CoNED TBDSM. This dataset has a lower spatial resolution (3 m) but was created in the same manner as the 2016 data. The root mean square error of the data ranges from 6 to 23.5 cm.
To assess these TBDSMs, we create hillshade maps to enhance our identification capacity using an azimuth angle of 315°, an altitude angle of 45°, and a z-factor of 1 [58,74]. Then, we use the NOAA’s Automated Wreck and Obstruction Information System (AWOIS) database to confirm the presence of shipwrecks (available at https://nauticalcharts.noaa.gov/data/wrecks-and-obstructions.html). The database contains GPS coordinates (and their degree of precision) for each record, which range from low to high, as well as descriptive information about each feature. These descriptions range in their thoroughness, with some containing the date of submergence, preservation, and additional historical details. We focus our efforts primarily on identifying shipwrecks with medium to high coordinate precision.
3. Results
We selected three locations representing different water conditions to assess the abilities of the NOAA’s data for archaeological prospection. These areas were chosen based on water conditions and their long historical records of known shipwreck sites (see Atlantic OCS Shipwreck Database [32]).
3.1. Case Study 1: Long Island, New York
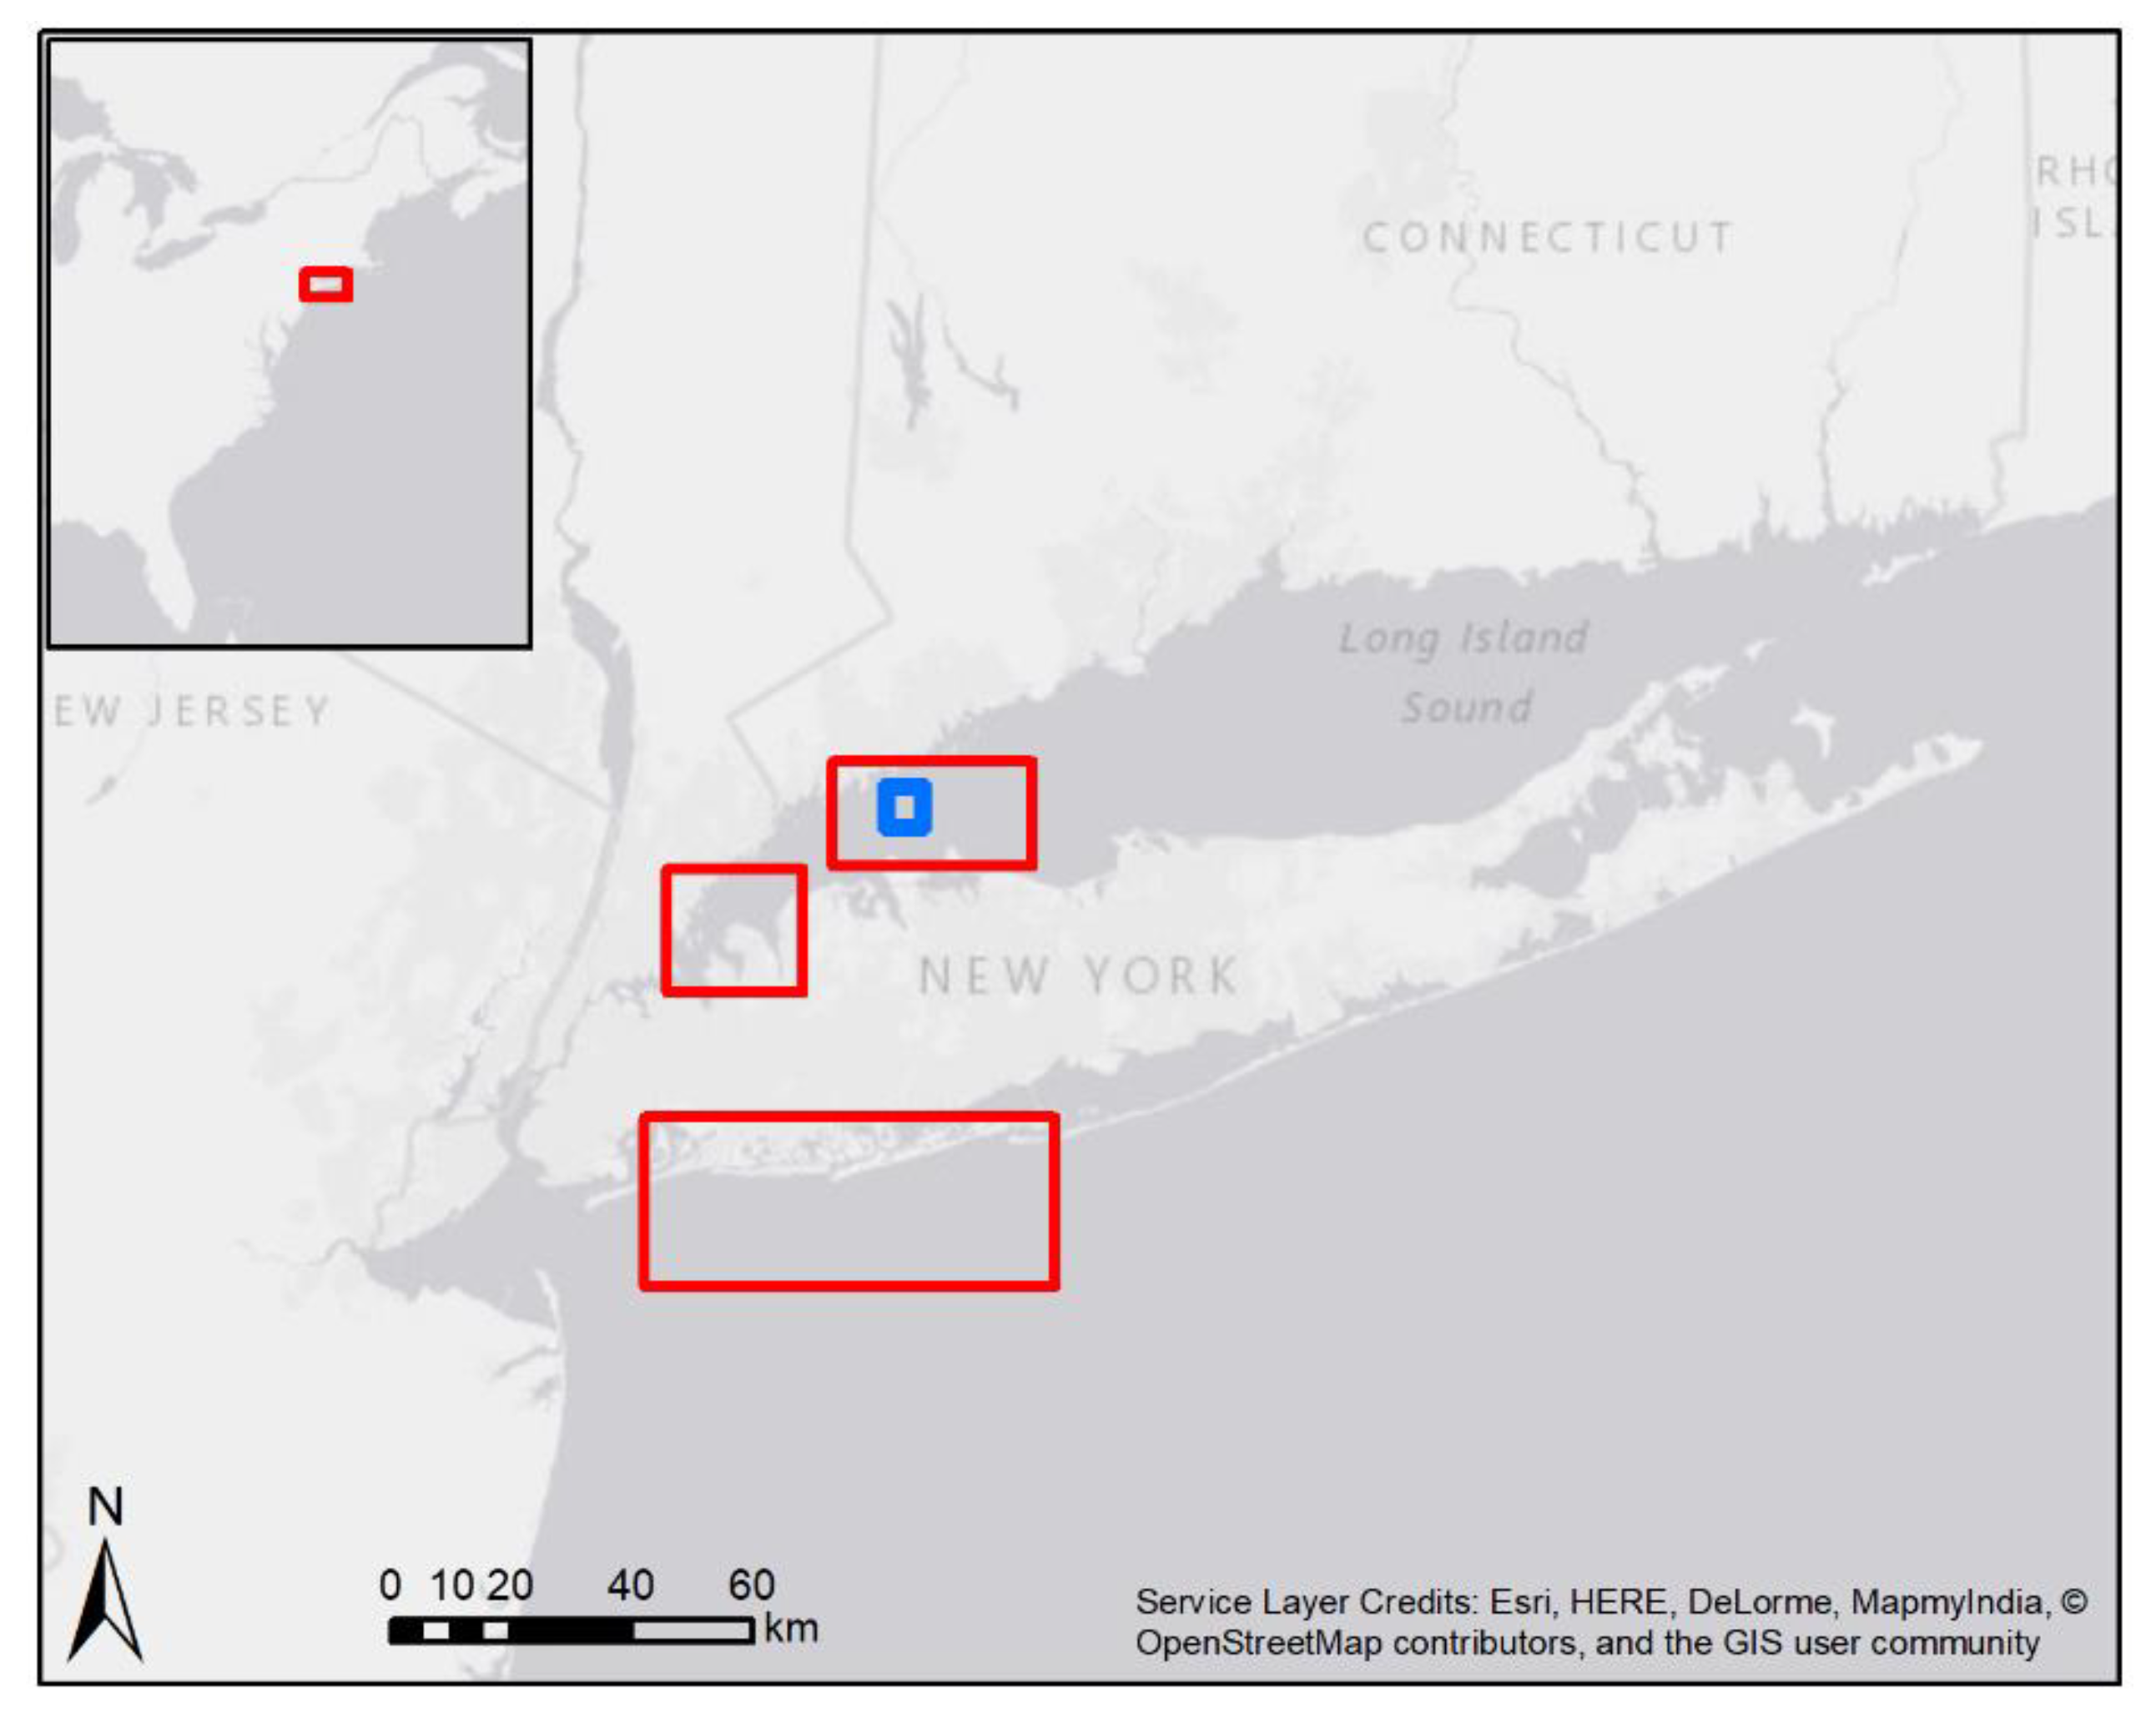
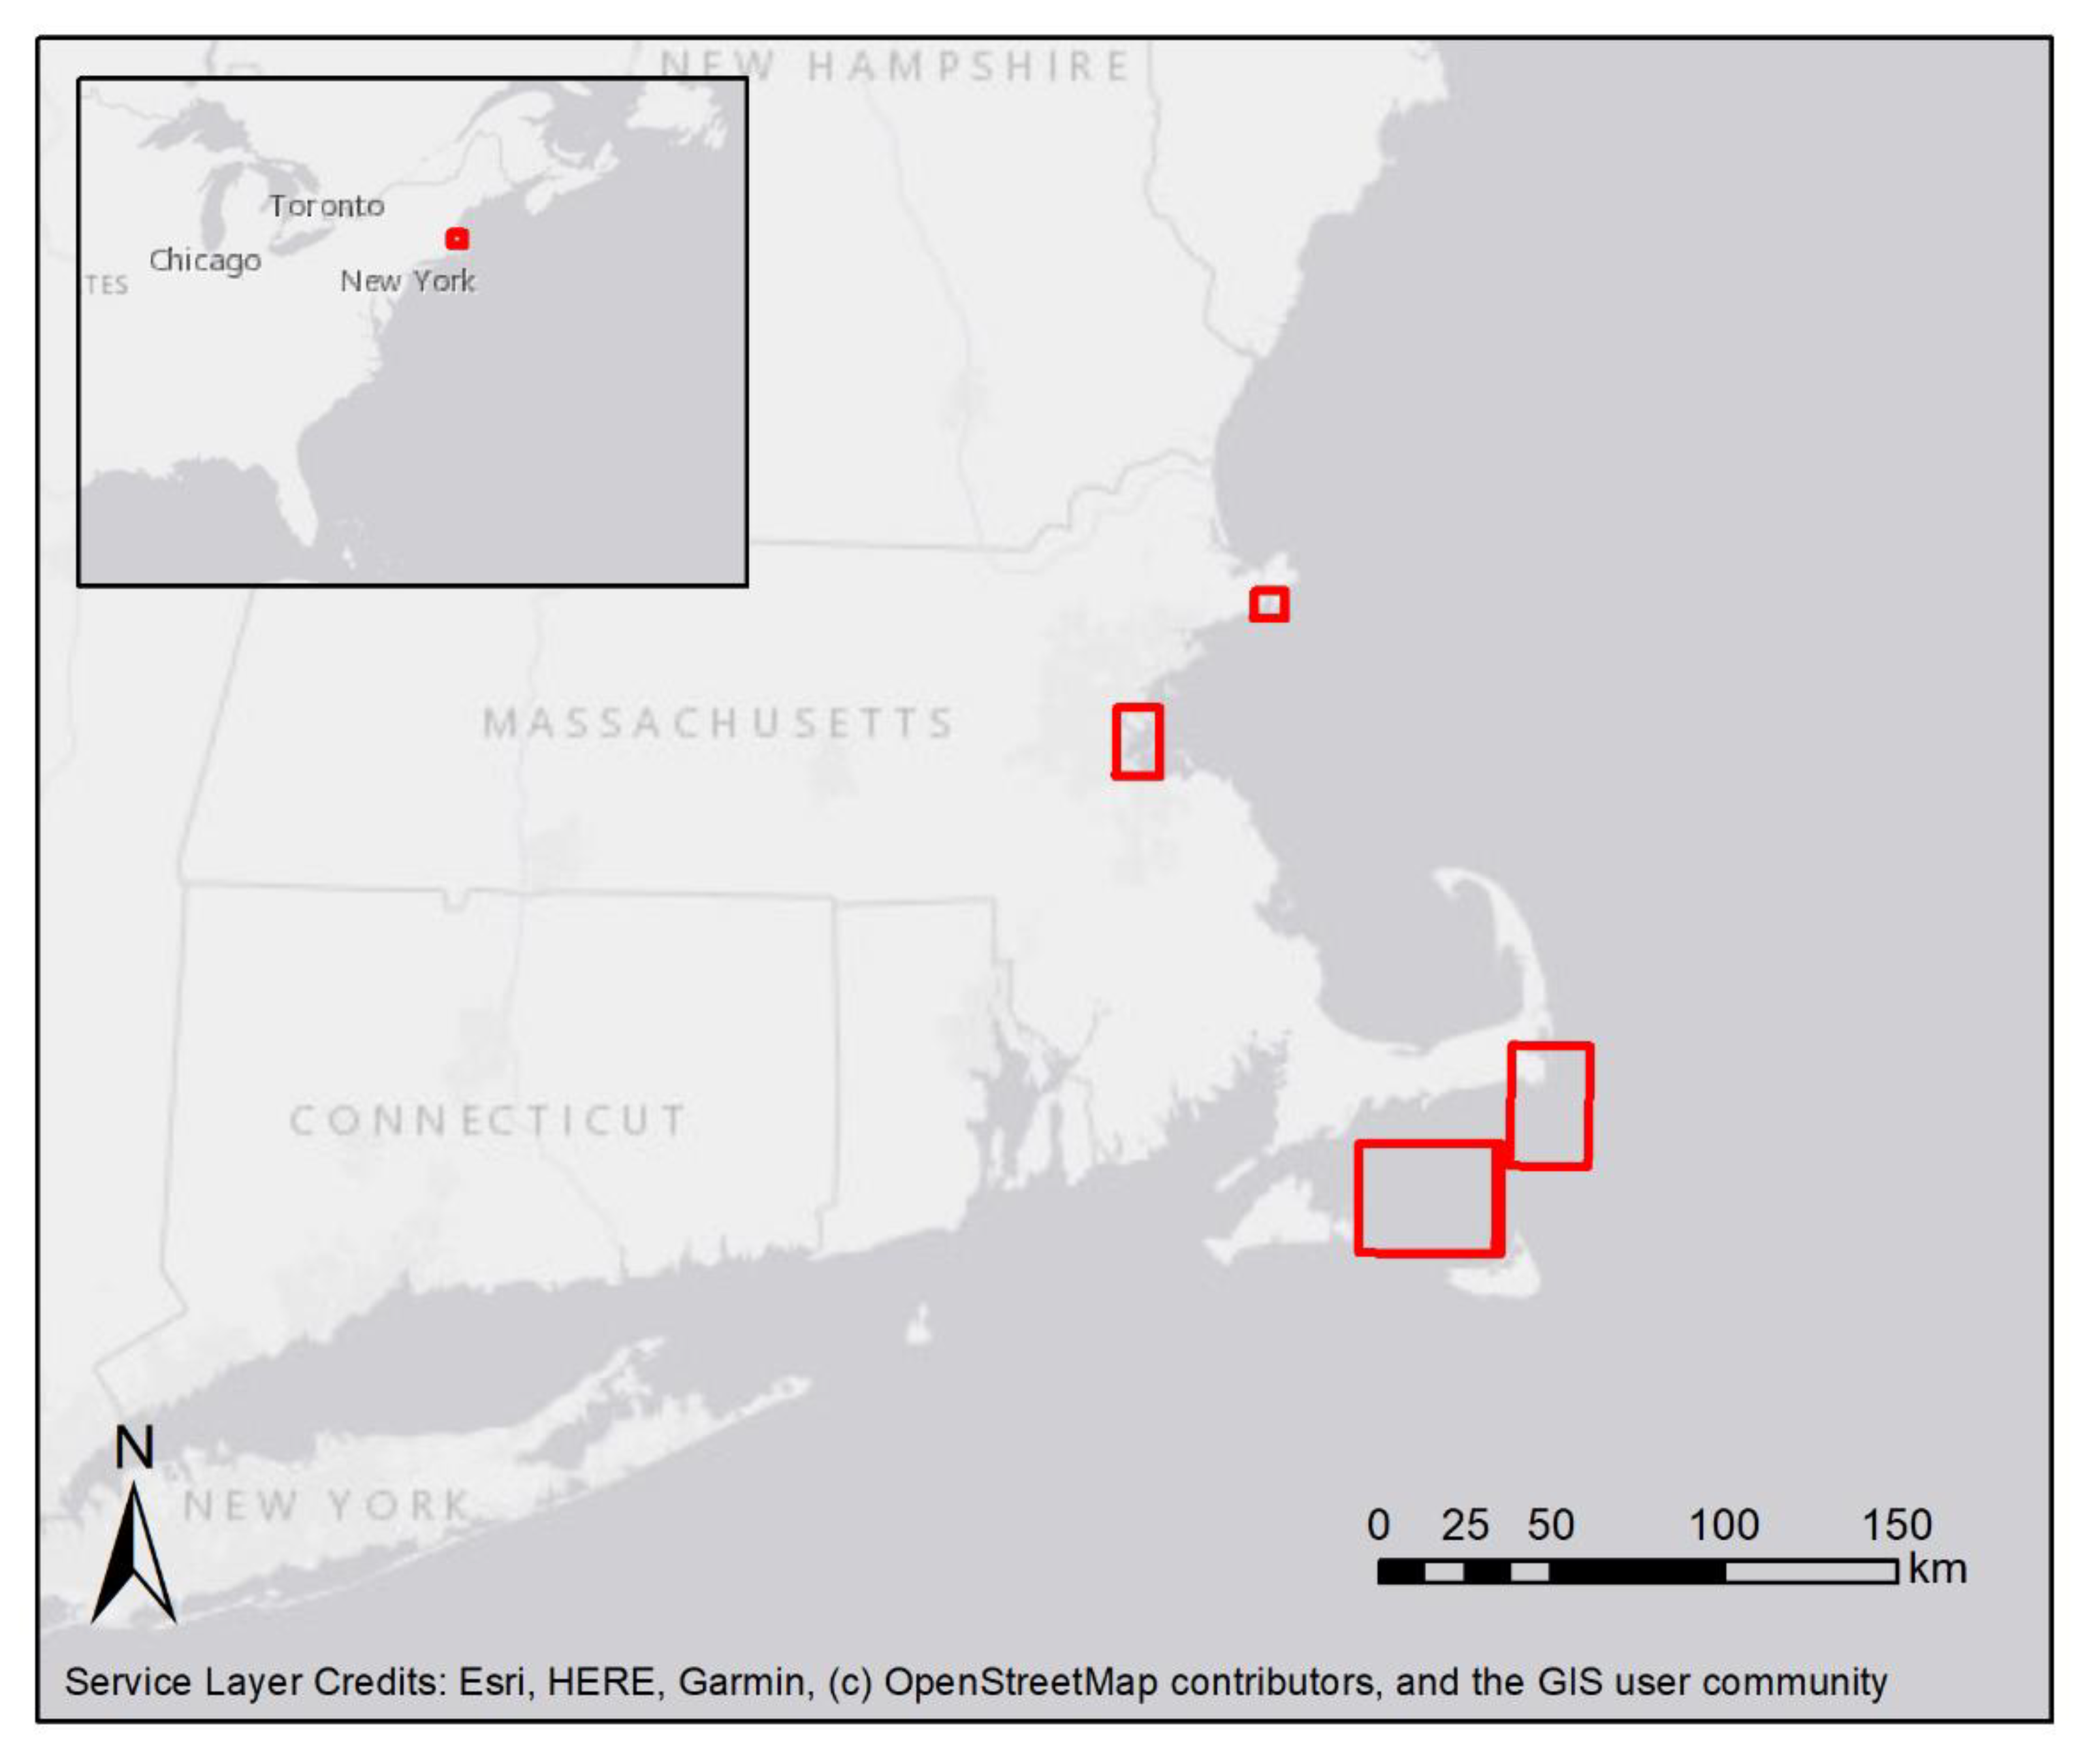
The coasts of New Jersey and Long Island, New York (Figure 1), hold hundreds of shipwrecks spanning hundreds of years [20,75]. One of the challenges to studying these features, however, is the frequency of tropical storms that move objects along the seafloor. For visual confirmation, the low visibility and high turbidity in the area also challenge investigations. On average, visibility in Long Island’s waters ranges from 0 to 3 m [76]. As such, the area represents an extreme case study to assess the limits of these free bathymetric data’s capabilities to detect anthropogenic materials.
Using known locations of shipwrecks from the NOAA’s national database of maritime hazards, we plot the locations of shipwrecks along parts of the southern coast of Long Island, New York (Figure 1). Then, we attempt to identify these features in the data by manually evaluating elevation profiles and patterns that matched various site descriptions.
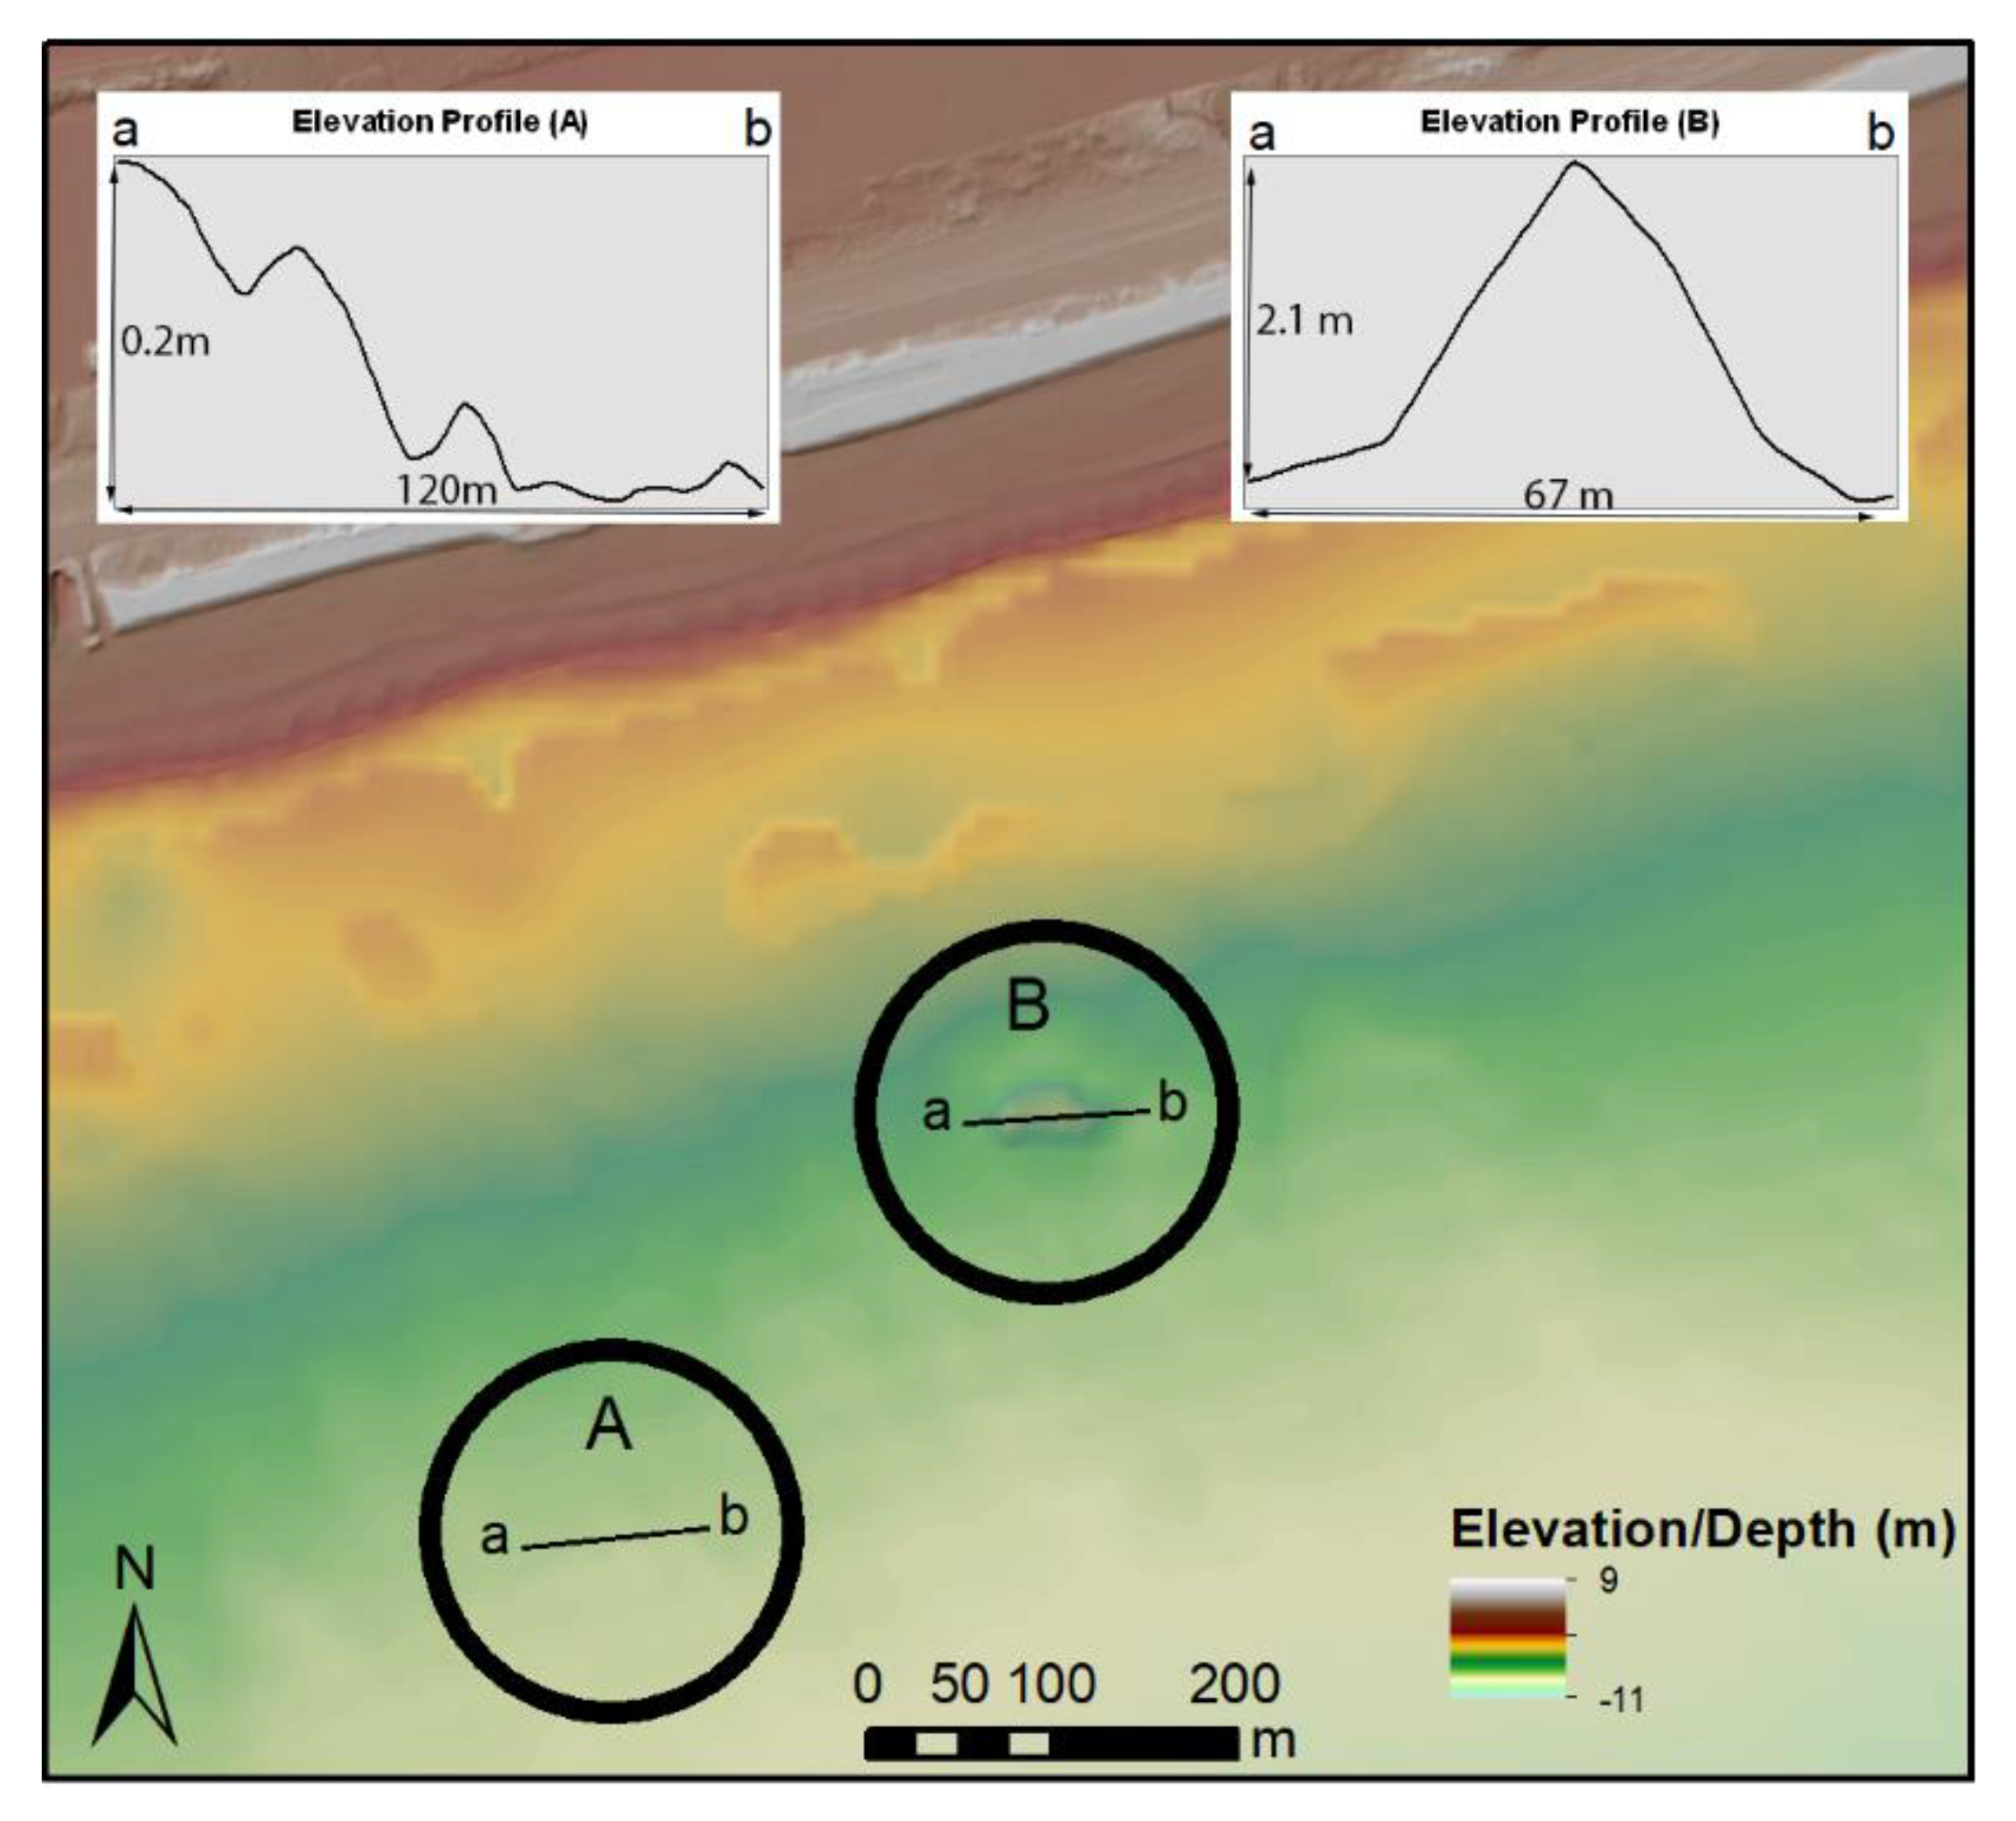
Manual identification was based on several specific characteristics: shape, elevation profile, and size of the anomaly. Features identified as shipwrecks need to have an ellipsoidal to rectangular shape (in the presence of a well-preserved feature), an elevation profile displaying a vertical rise of at least 0.5–1 m, a sloping angle of >35°, and a width of at least 5 m, and the overall size of the feature had to be at least 10 m2. We derived these values after careful investigation of known shipwreck data in our study regions. We also took additional information into consideration when available from the NOAA’s database. For example, if we knew the preservation to be poor, or knew the type of boat/ship, we could alter our expectations accordingly regarding size and profile.
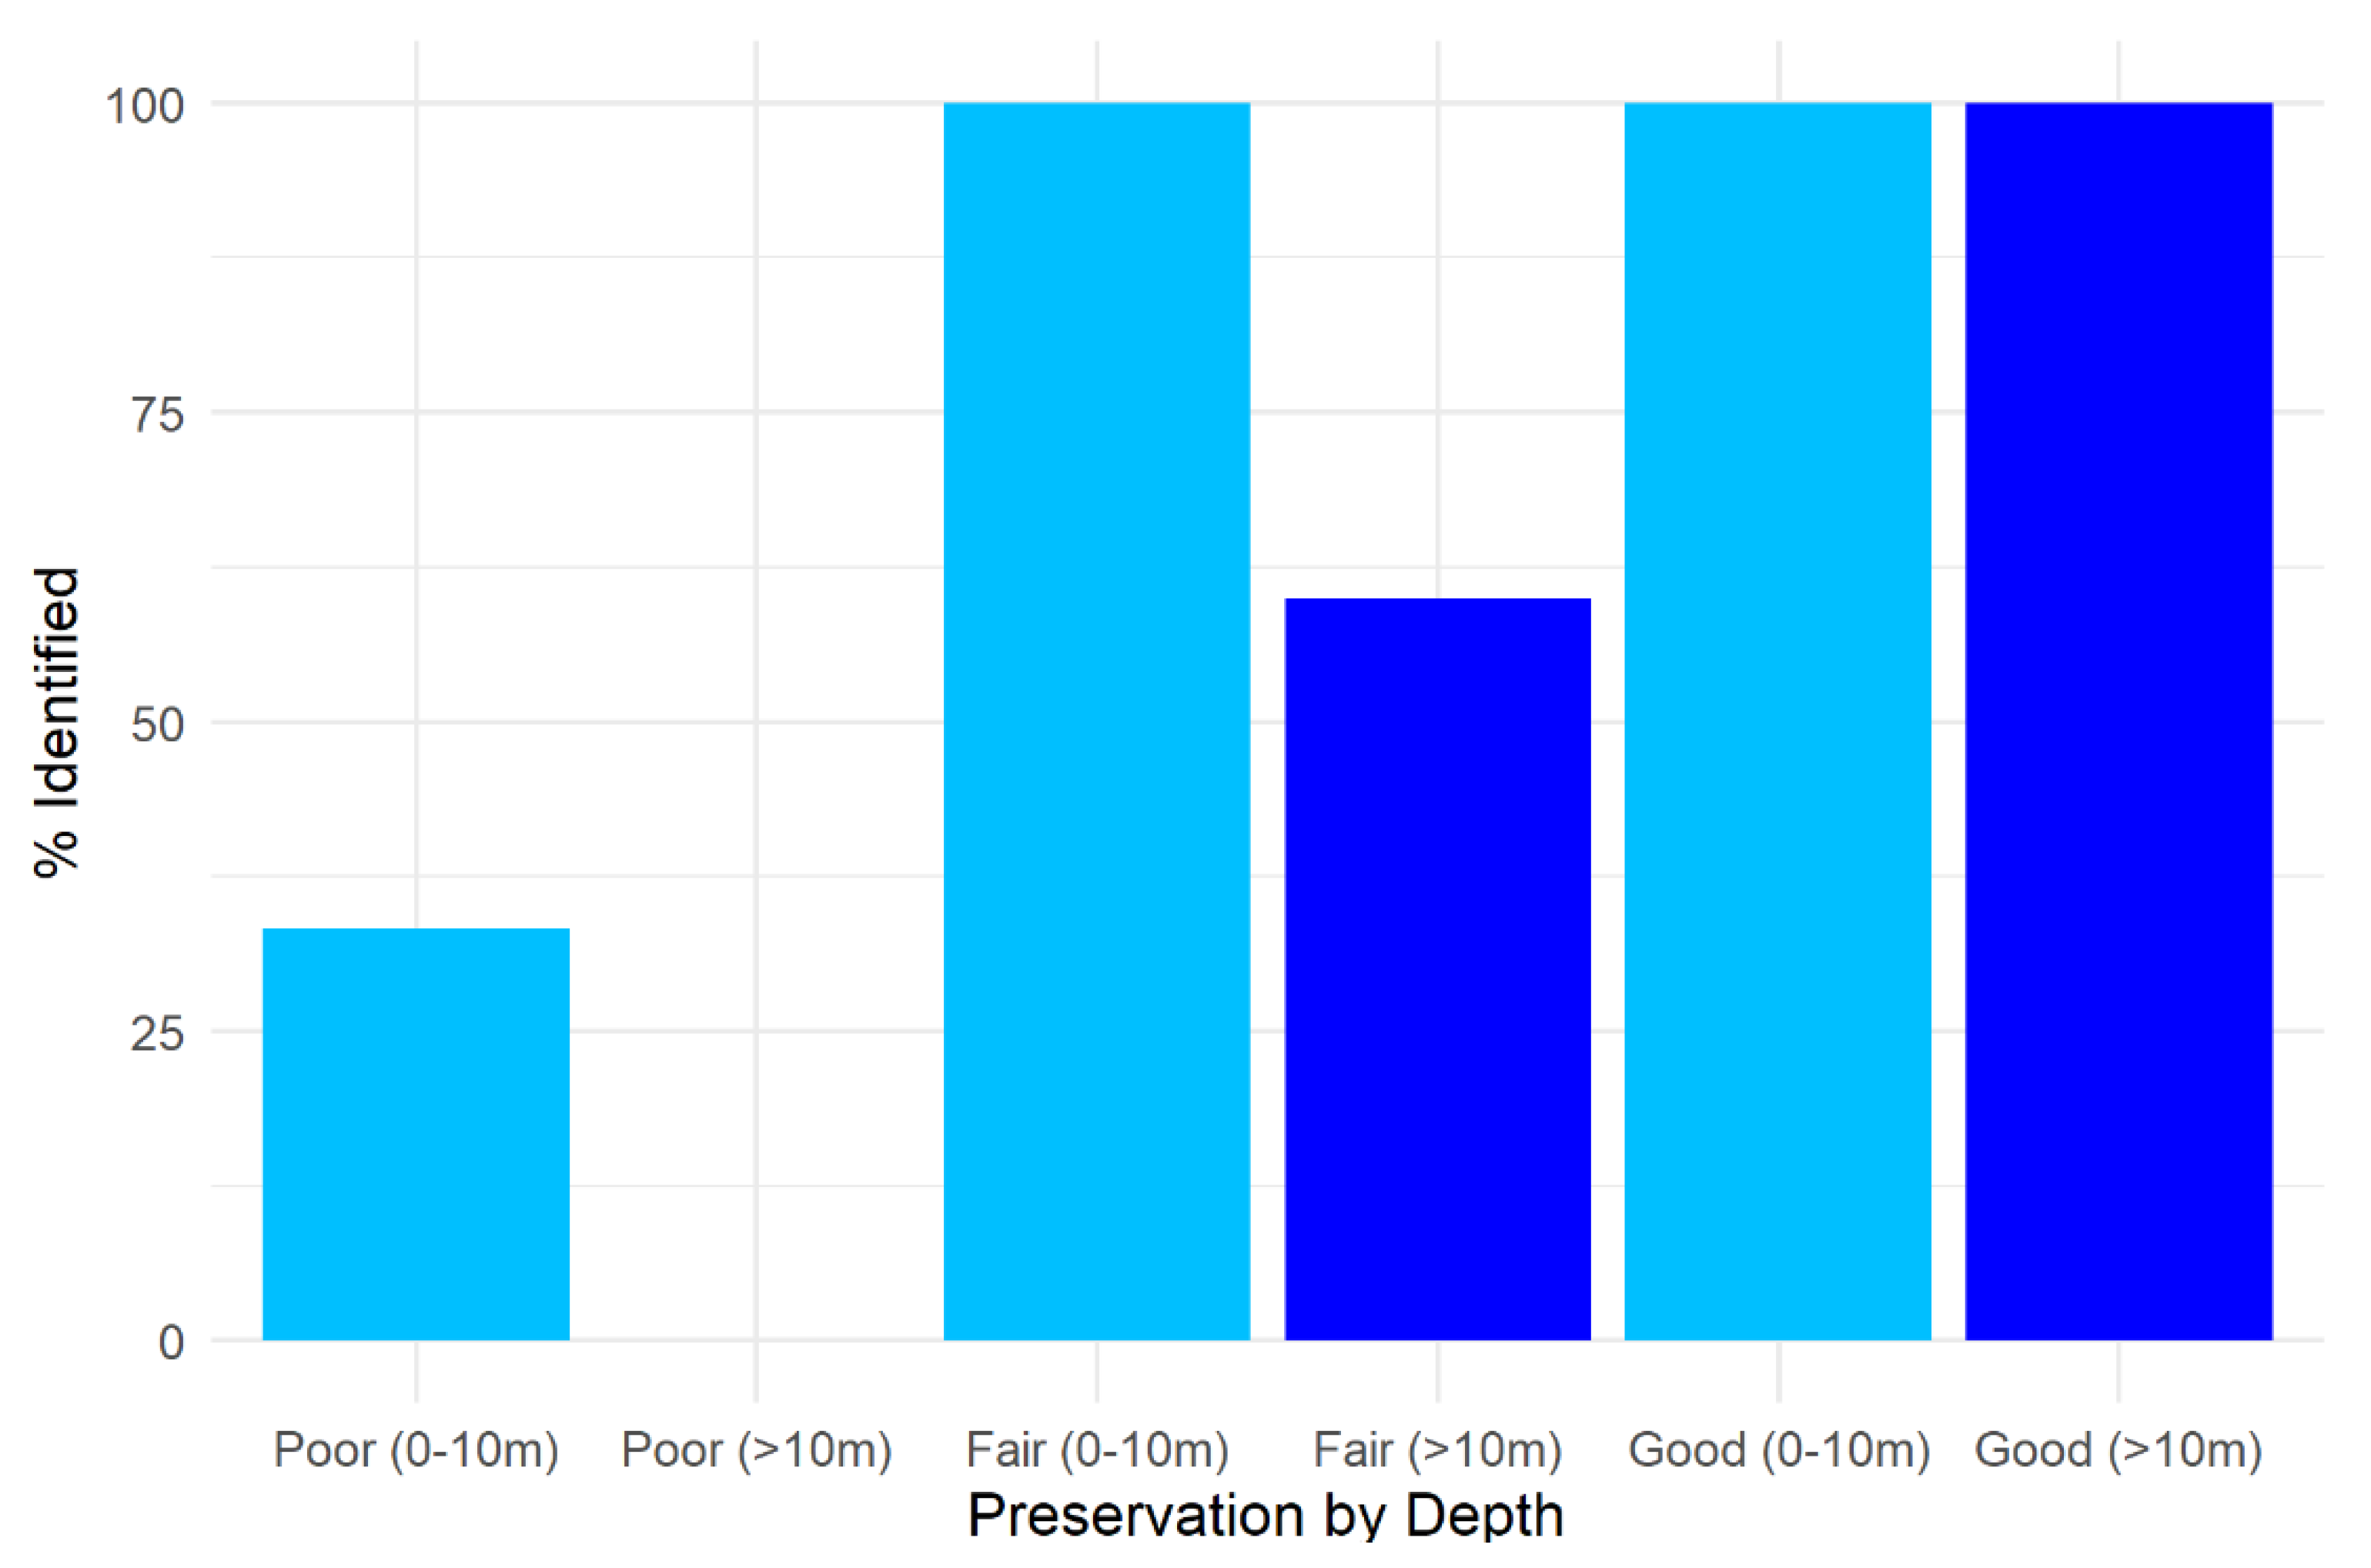
Within the chosen study region, there were dozens to hundreds of wreck sites. Here, we attempted to identify wrecks in as many places within each study area as possible, and which contained accurate GPS information. Assessed sites range in both their depth and level of preservation, providing a good baseline for the bathymetric data’s capabilities for detecting cultural materials (Figure 2; Supplemental File).
Figure 3, for example, illustrates the capacity to manually detect shipwrecks in bathymetric data, particularly those that are relatively well preserved. However, wrecks with poor preservation (i.e., little to no structural remains) are difficult (and sometimes impossible) to detect, even in shallower waters. Results indicate that the data available from the NOAA can detect anomalies as deep as 160 m (the deepest point of this study area), but are less capable of detecting wreckage scatter (i.e., poorly preserved features) regardless of depth.
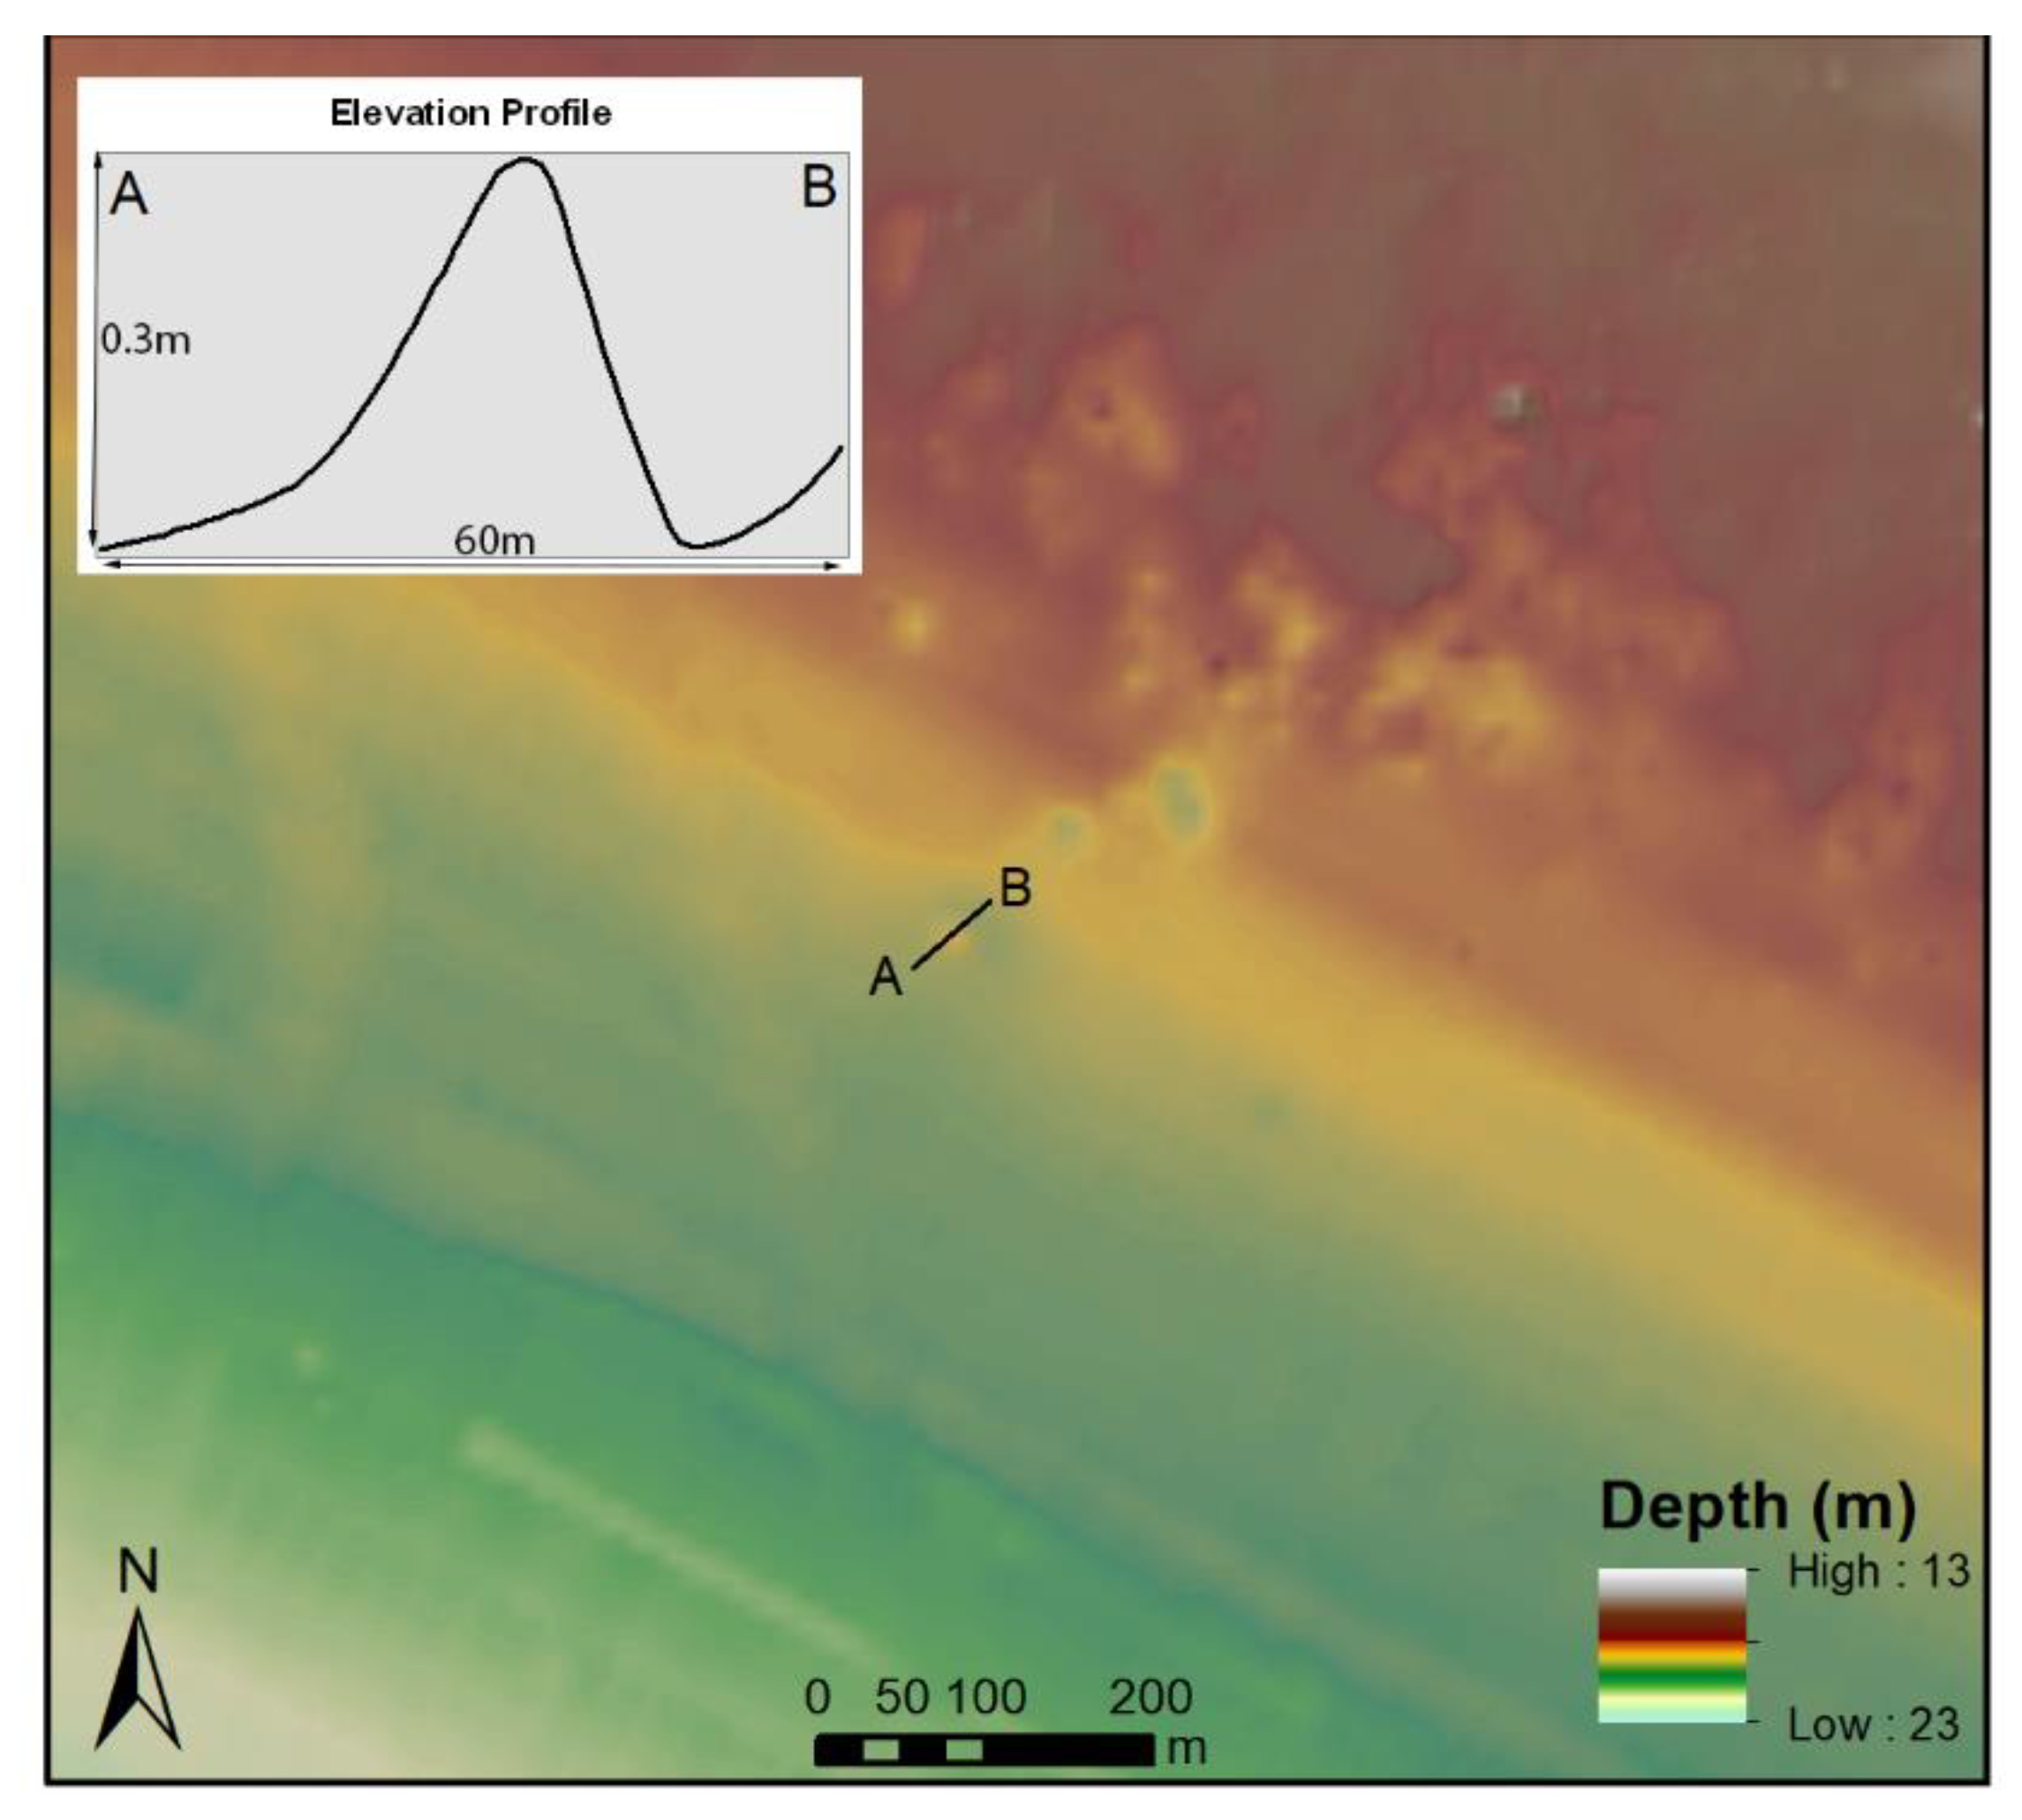
Nonetheless, shallower wrecks appear to be easily visualized and monitored using the NOAA’s datasets (Figure 4). The abundance of wrecks in the American Northeast that are submerged just offshore in shallow waters is tremendous [51], and as such, open-access bathymetric datasets offer one potential means by which to identify these maritime sites at no economic cost (Figure 5).
3.2. Case Study 2: The Massachusetts Coast
Our second case study comes from Massachusetts (Figure 6), which is also located within the Northeast United States. Water clarity in the Boston Harbor is usually under 6 m, averaging approximately 2.5 m [77].
The shipwreck database for this area did not contain much information pertaining to the preservation of different features. As such, it was not possible to determine with any certainty the degree to which preservation affected the ability to detect different shipwrecks in the bathymetry dataset for this area. Nonetheless, for those with data available, it was clear that well-preserved shipwrecks were almost always identifiable in the TBDSM, while those with less pronounced features (or which were located on sloped terrain) were less easily identifiable (see Supplemental File). The coast off Cape Cod between Chatham and Provincetown is referred to as an “ocean graveyard” by the National Park Service [78], as the shifting, hidden sandbars and dangerous storms have sunk thousands of ships. These same shifting sands have buried many wrecks and rendered their identification especially difficult.
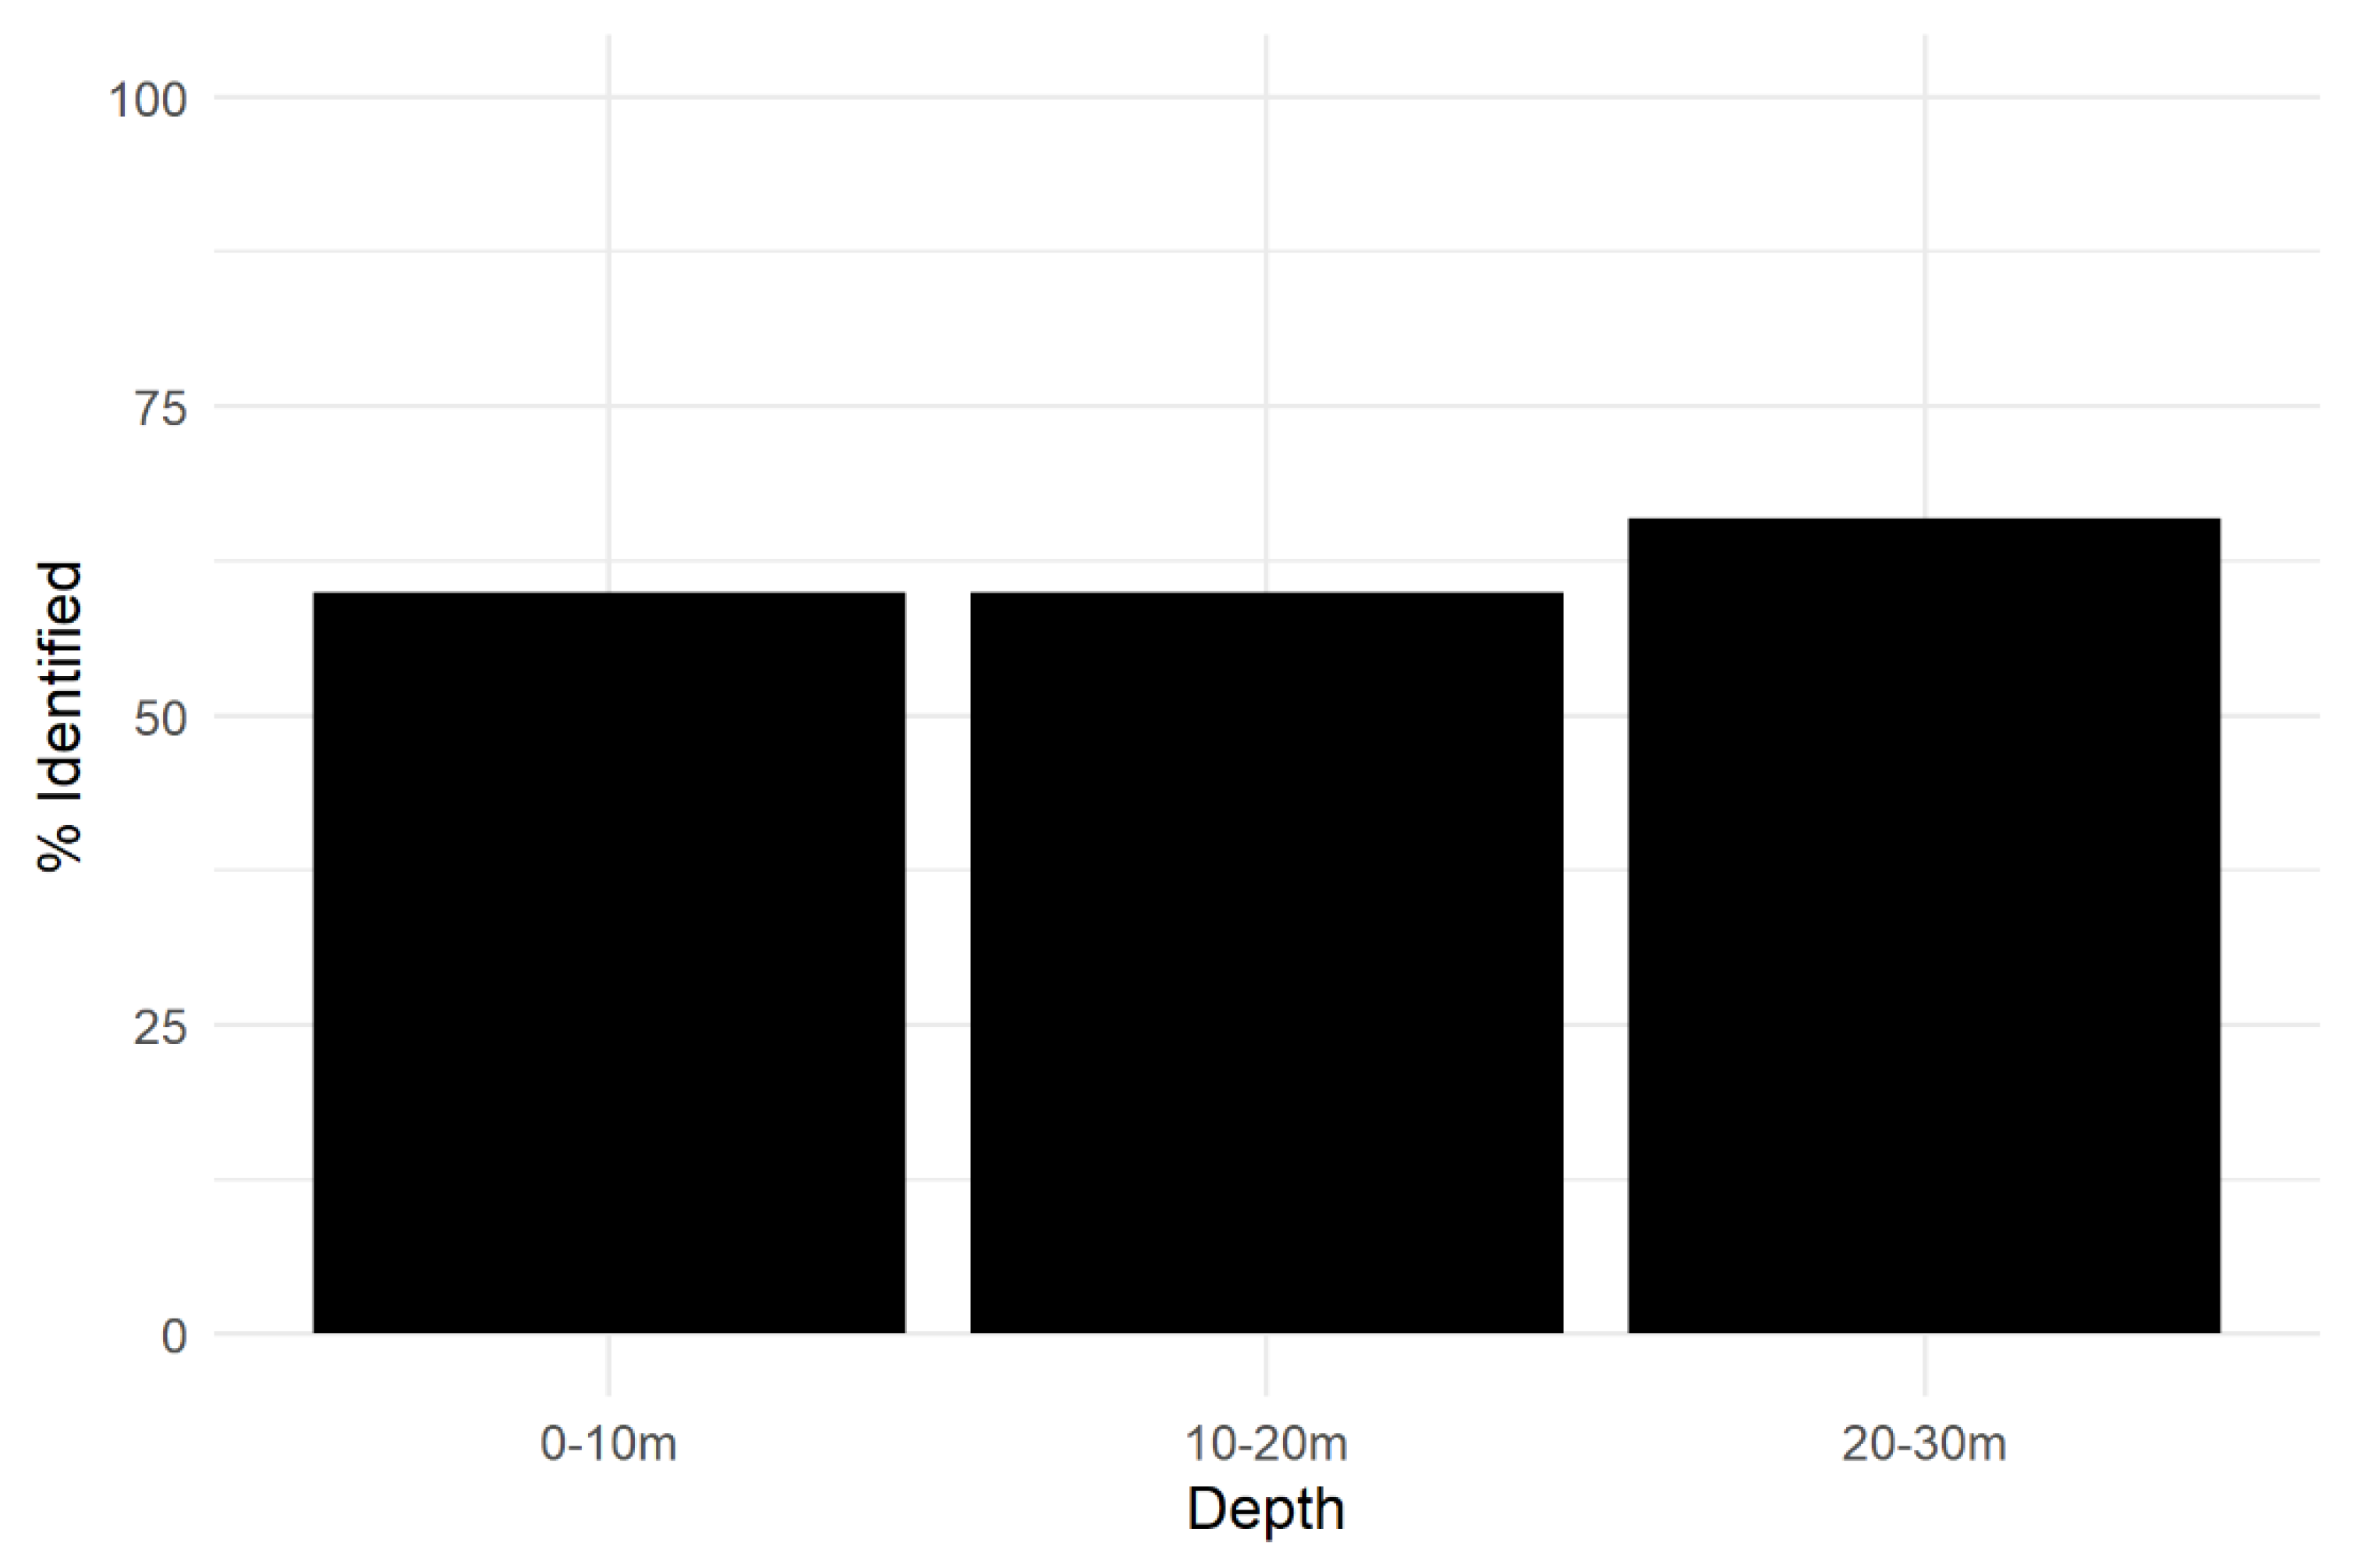
A total of 50 shipwrecks were investigated in the TBDSM. Much like the Long Island case study, some shipwrecks were detected at depths exceeding 25 m (Figure 7). Bathymetric LiDAR from the Boston Harbor area also shows that shallow deposits (<4 m) were detectable, despite high turbidity and low visibility conditions (Supplemental File).
While a dearth of available information about shipwreck preservation in this region makes evaluating the data’s ability to discern poorly preserved features impossible, a few things are clear. First, shipwrecks (and potential shipwreck anomalies) were identifiable at depths up to 30 m. The deepest point in this study area is 34 m, indicating that the data work well for locating shipwreck sites. Second, wreckage located along sloped terrain is more difficult than flat terrain. Third, bathymetric LiDAR, specifically, can detect some well-preserved shipwrecks, despite the poor water quality and frequently shifting seabed. Thus, even in some of the worst conditions (in terms of visibility and stability), the NOAA datasets (including the CoNED TBDSM and bathymetric LiDAR) are still useful for archaeological investigations of shallow to moderate depths.
3.3. Case Study 3: Mississippi Delta (New Orleans, Louisiana)
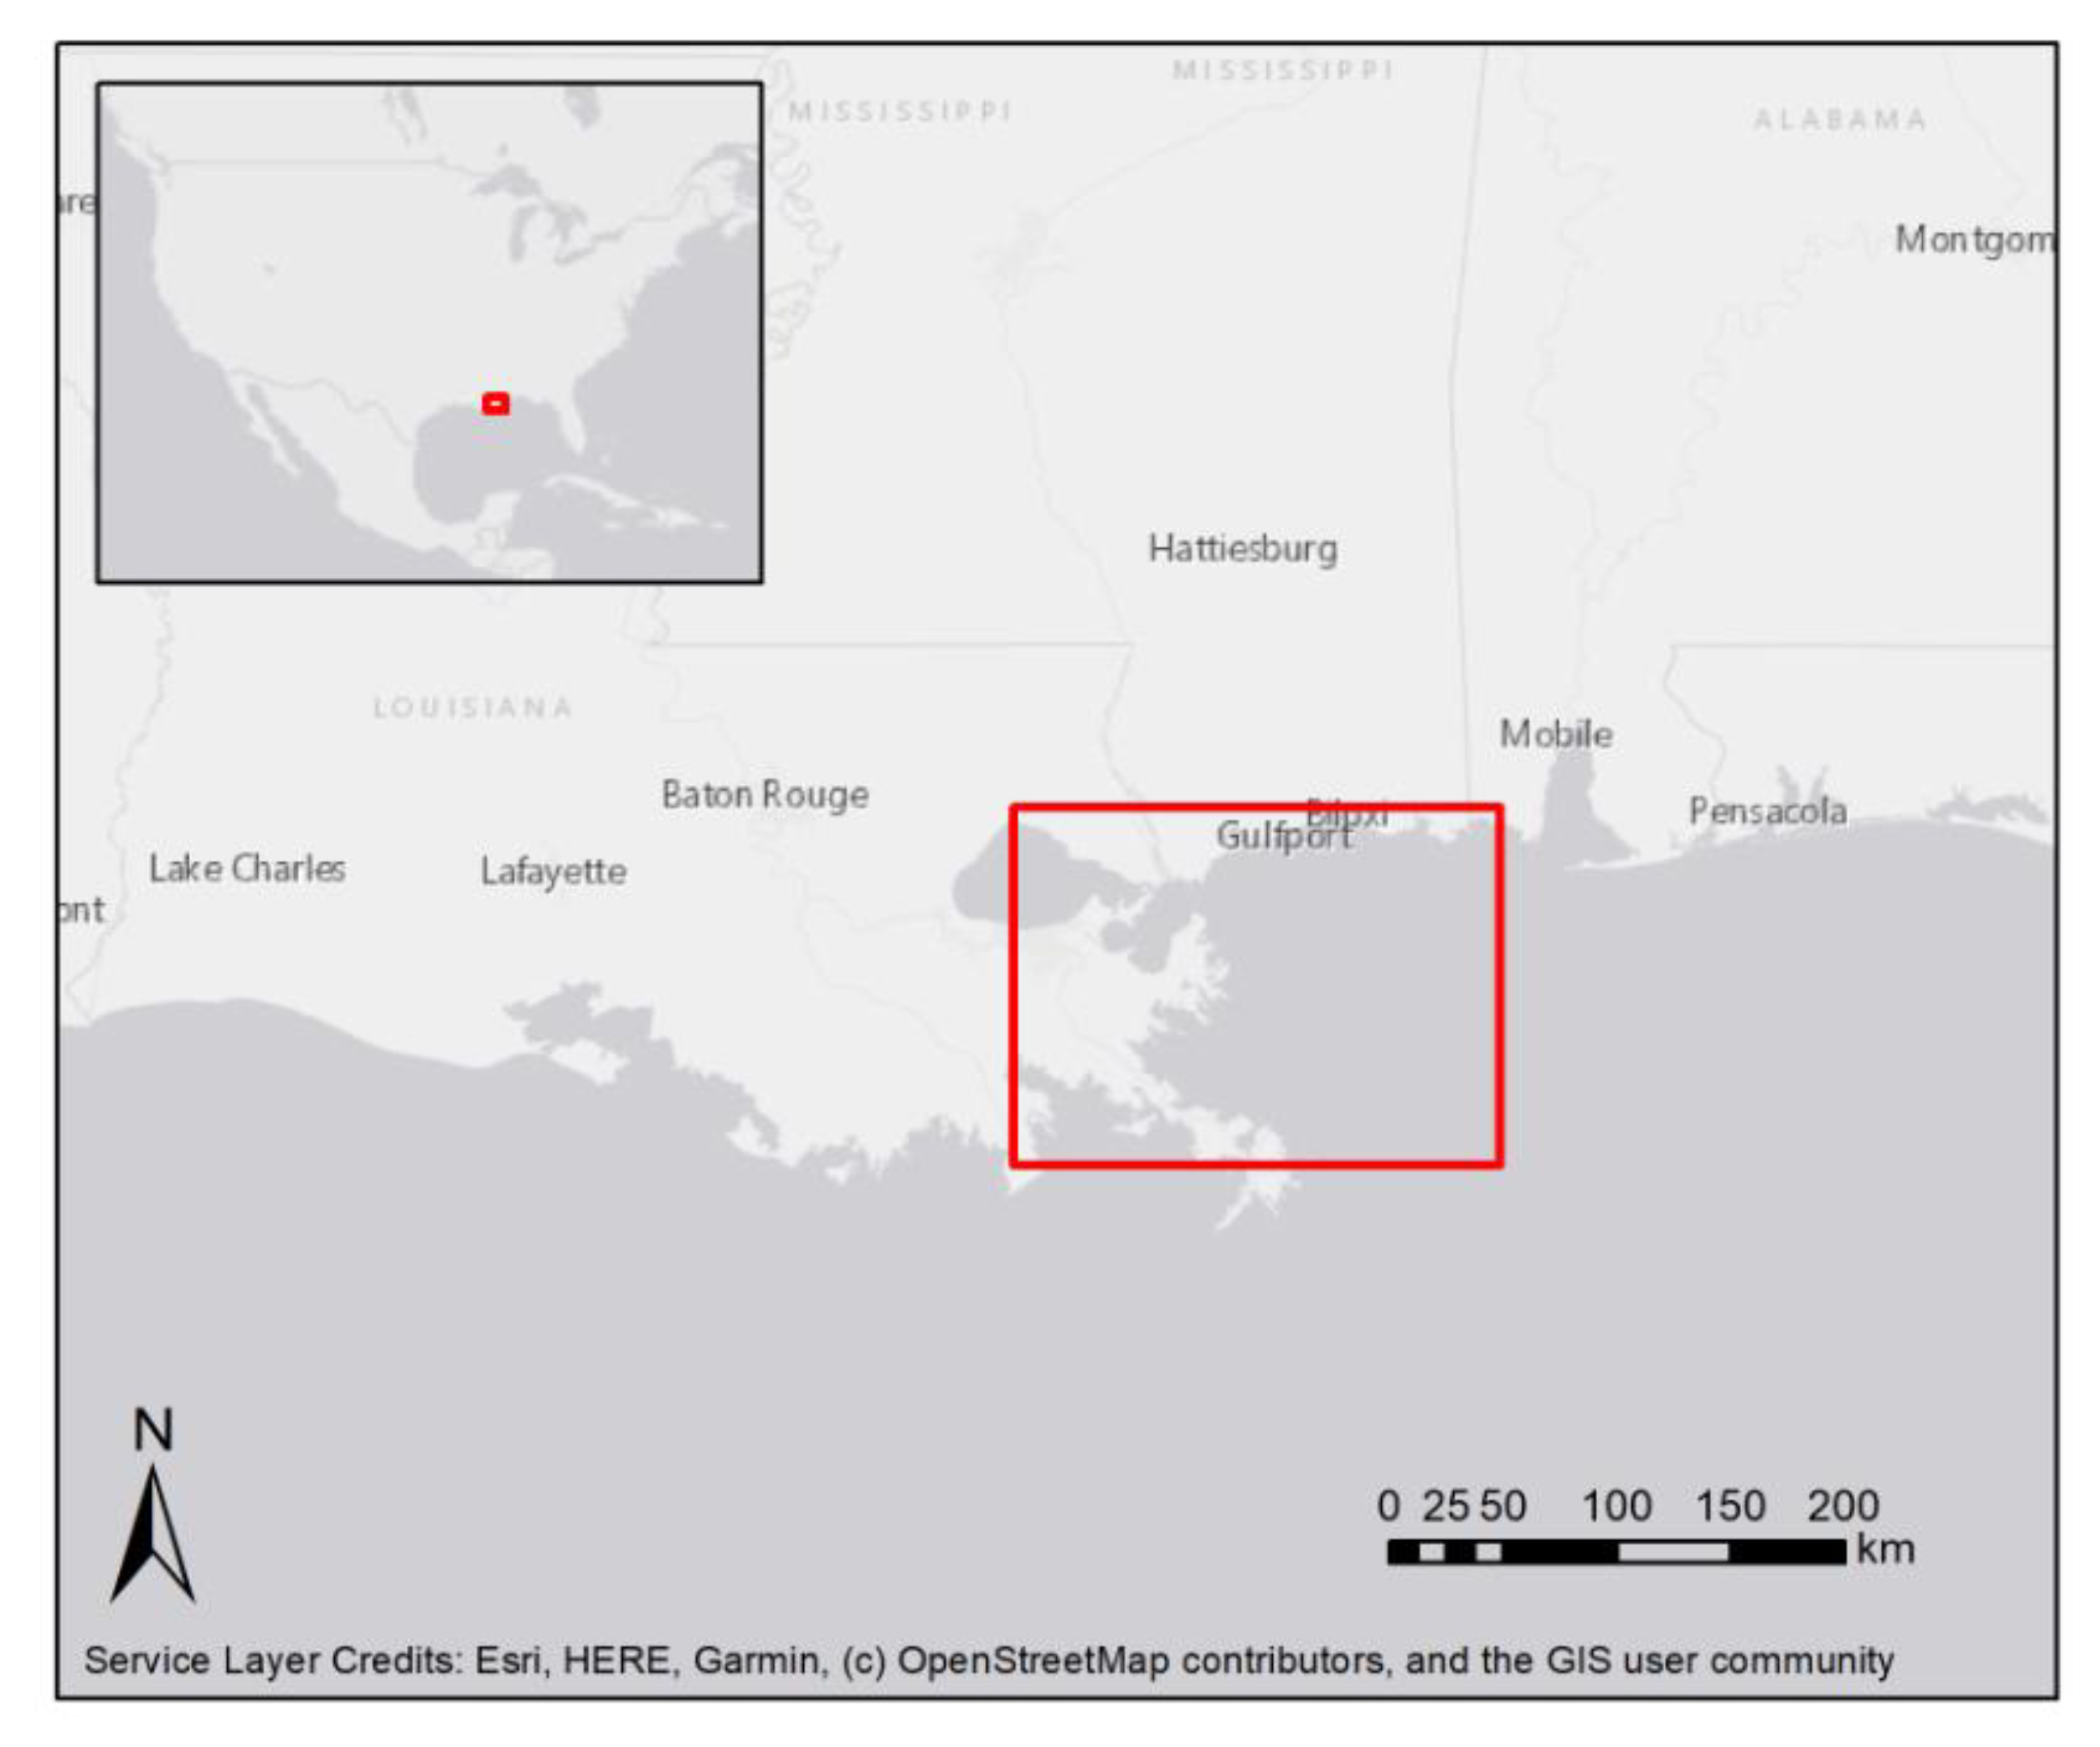
Within the Mississippi Delta, the waterways around New Orleans contains a multitude of known anthropogenic features, including shipwrecks dating back to the 1500s [20] (Figure 8). The average water clarity in this area is <1 m [79]. Additionally, the area is frequented by tropical storms and hurricanes that disturb sunken features. The water is also extremely shallow, providing a good assessment of the ability of bathymetric LiDAR to identify shipwrecks in turbid conditions.
A total of 49 shipwrecks were investigated in the 2014 CoNED TBDSM using the NOAA’s Maritime Hazards database (see Supplemental File). Twenty-six of these are submerged in less than 3.5 m of water and represent locations where data were collected using bathymetric LiDAR instruments. We determined this based on a review of the datasets incorporated into the TBDSM and their geographic boundaries. Half of these (n = 13) are visible in the bathymetric dataset, suggesting that approximately half of all shipwrecks present in less than 4 m of water may be visible in bathymetric LiDAR despite low visibility conditions.
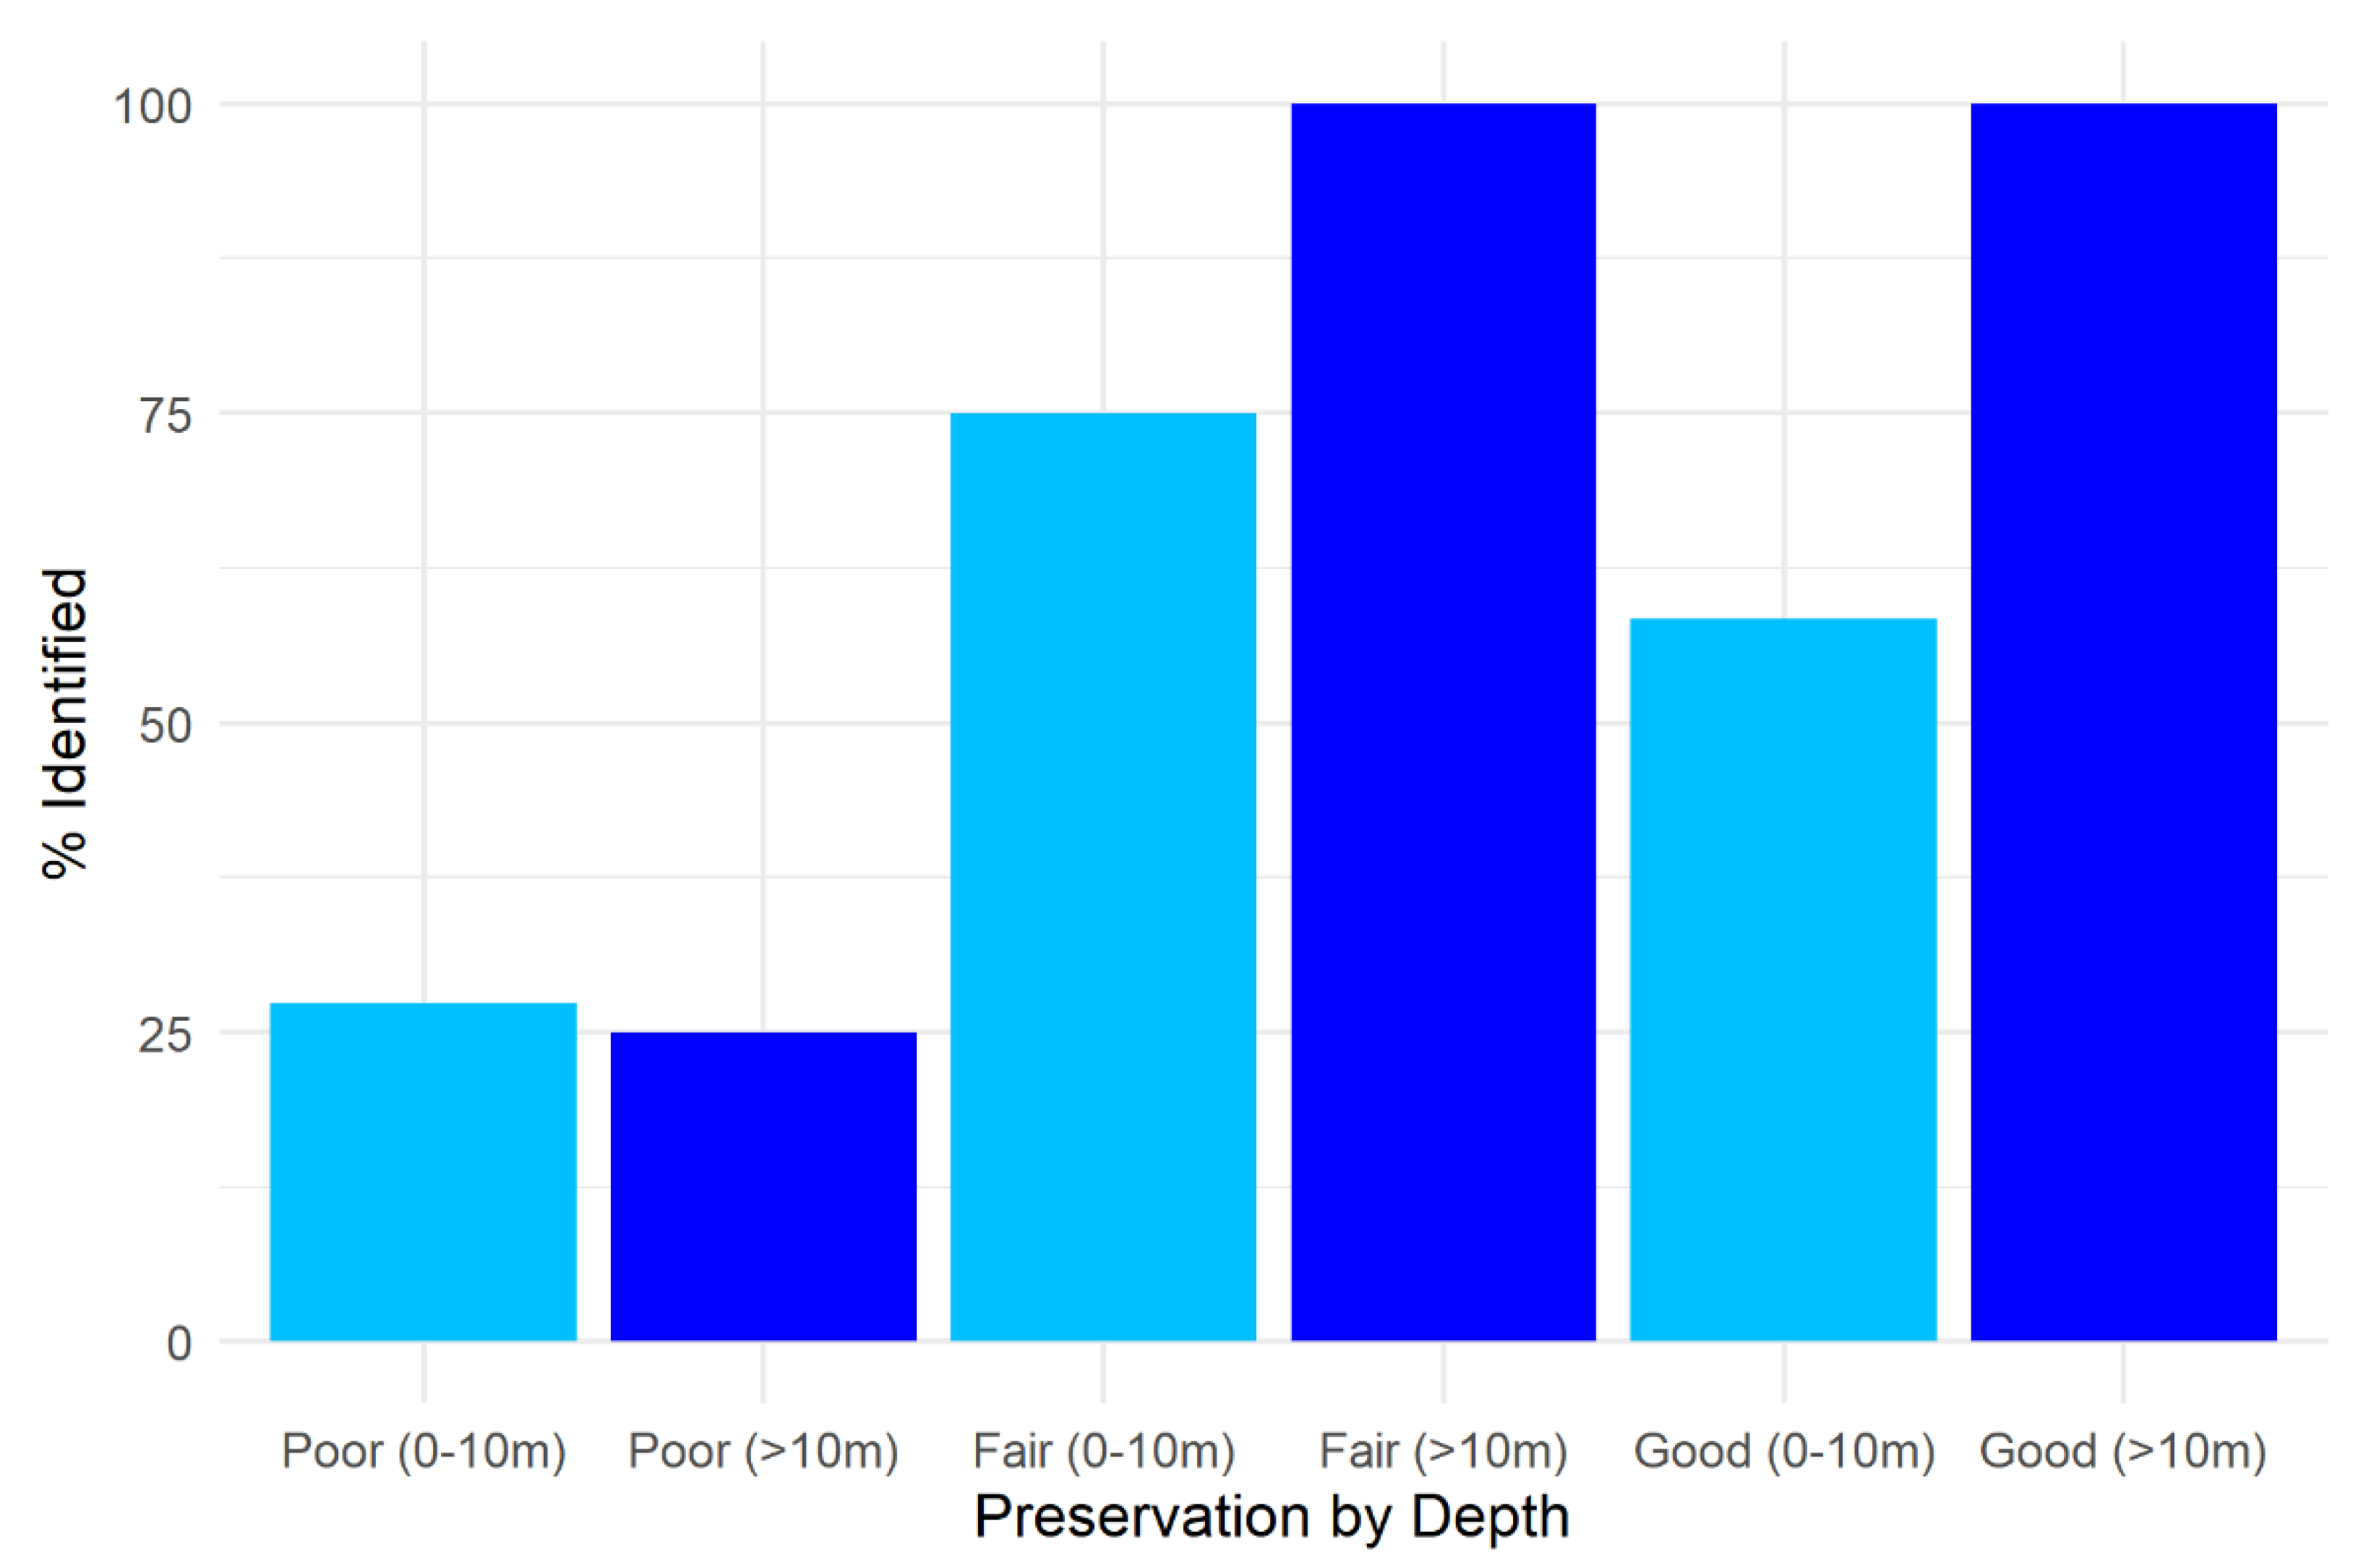
Similarly to the Long Island and Massachusetts case studies, bathymetric LiDAR can identify well-preserved shipwrecks in shallow depths despite low visibility, and poorly preserved features can also be detected, but less consistently (Figure 9). The CoNED TBDSM, as a whole, can identify wrecks at depths of 28 m at varying levels of preservation, but the best preservation is most consistently identified at all depths. The deepest part of the New Orleans study area is 30 m, indicating that the data perform well for feature detection. The reliability of detections is also less than the Long Island case study, and this is likely, in part, due to lower spatial resolution of the data (3 m vs. 1 m). Nonetheless, the datasets available from NOAA have utility for detecting potential anthropogenic anomalies submerged at moderate to shallow depths.
3.4. Prospects for Automated Detection
Recent developments in automated image analysis have repeatedly demonstrated the benefits of such approaches for documenting archaeological sites and other objects around the world [43,80,81,82]. However, many of these methods require high-resolution datasets to be effective [42,43]. To assess the capacity for the NOAA datasets to be used for automated object detection, which would increase the utility of this information for archaeologists, remote sensing scientists, and environmental scientists, we test a small section (20 km2) of the Long Island case study using an inverse depression analysis (IDA; [34,36]). The method works by creating an “inverse DSM”, whereby topographic rises (signifying anthropogenic features like mounds, or in our case shipwrecks) become sinks, and thereby identifiable by topographic depression algorithms [34]. The formula for creating an inverse DSM is seen in the Equation (1), below:
where DSMI = the inverse DSM, X = the DSM raster being inverted, ZMAX = the maximum elevation value, and ZMIN = the minimum elevation value.
DSMI = ((X − ZMAX)*(−1)) + ZMIN
For the IDA, we use a contour-tree algorithm for detecting sinkholes developed by Wu et al. [83,84]. The method operates in a similar way to human interpretation, in that the computer looks for a sets of nested vertical contours where elevation increases as one looks further from the center (i.e., the algorithm identifies low points and looks for subsequently higher areas around that point to identify a topographic “sink”) [83]. The method is more computationally efficient than many other depression algorithms (for example [85]), and was chosen on the basis of computational and time efficiency [83].
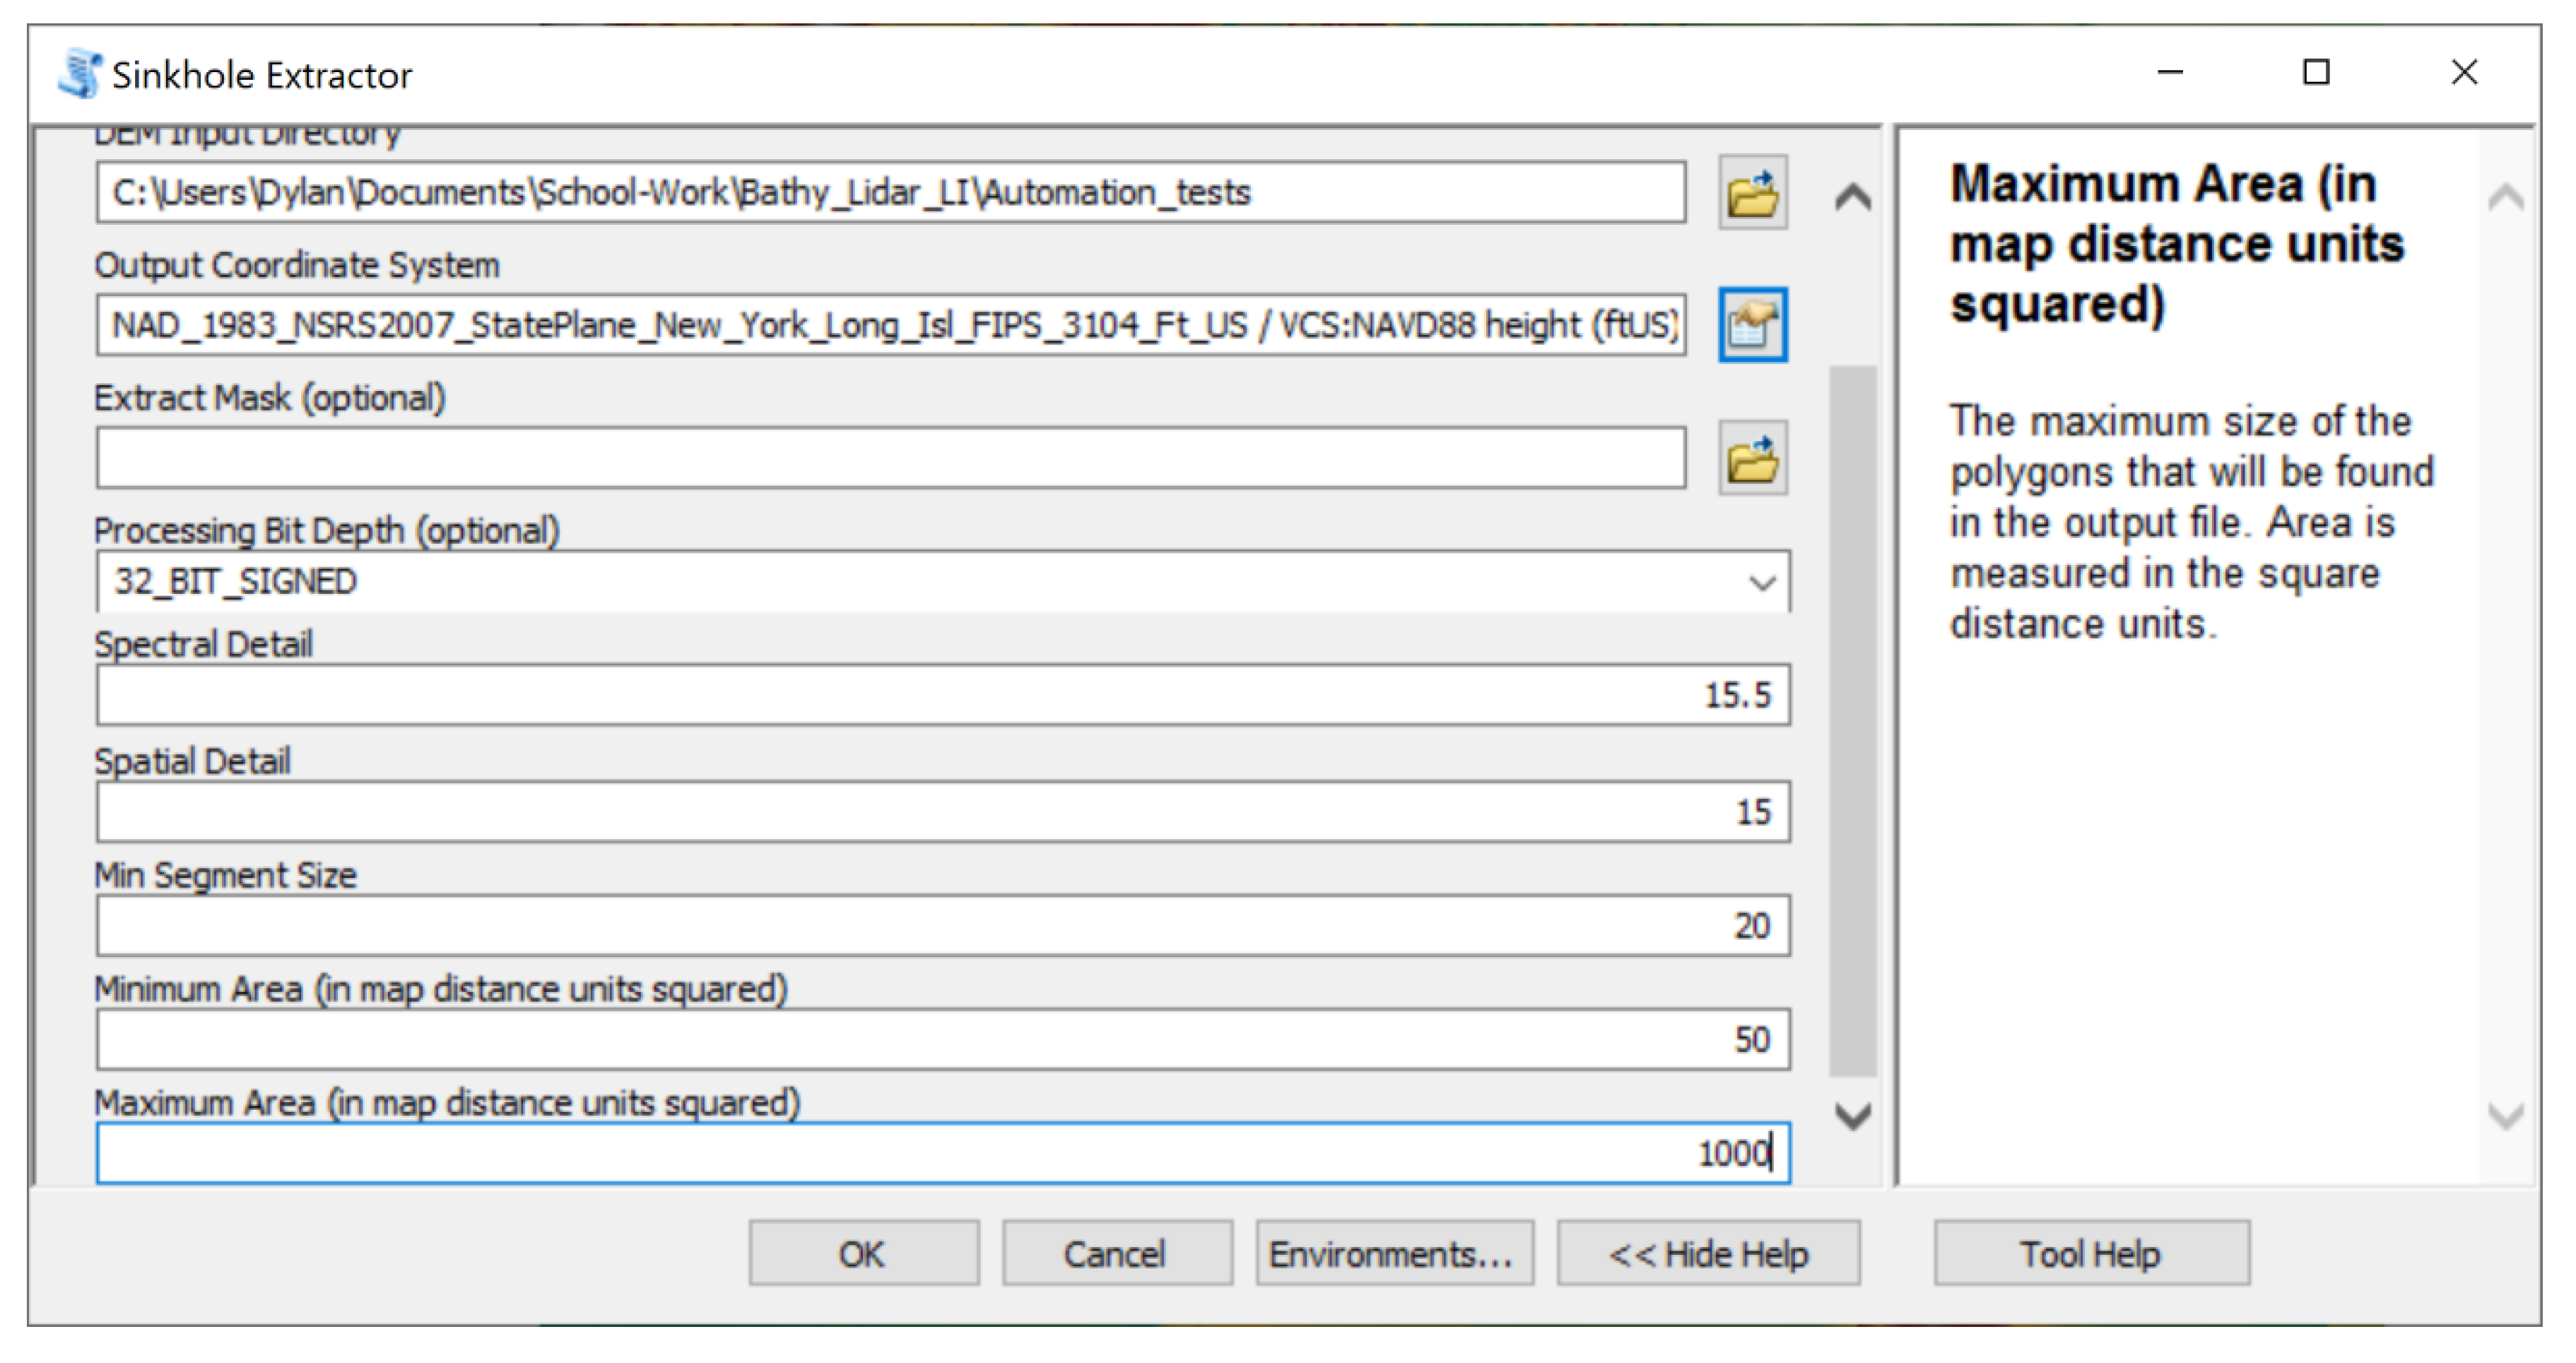
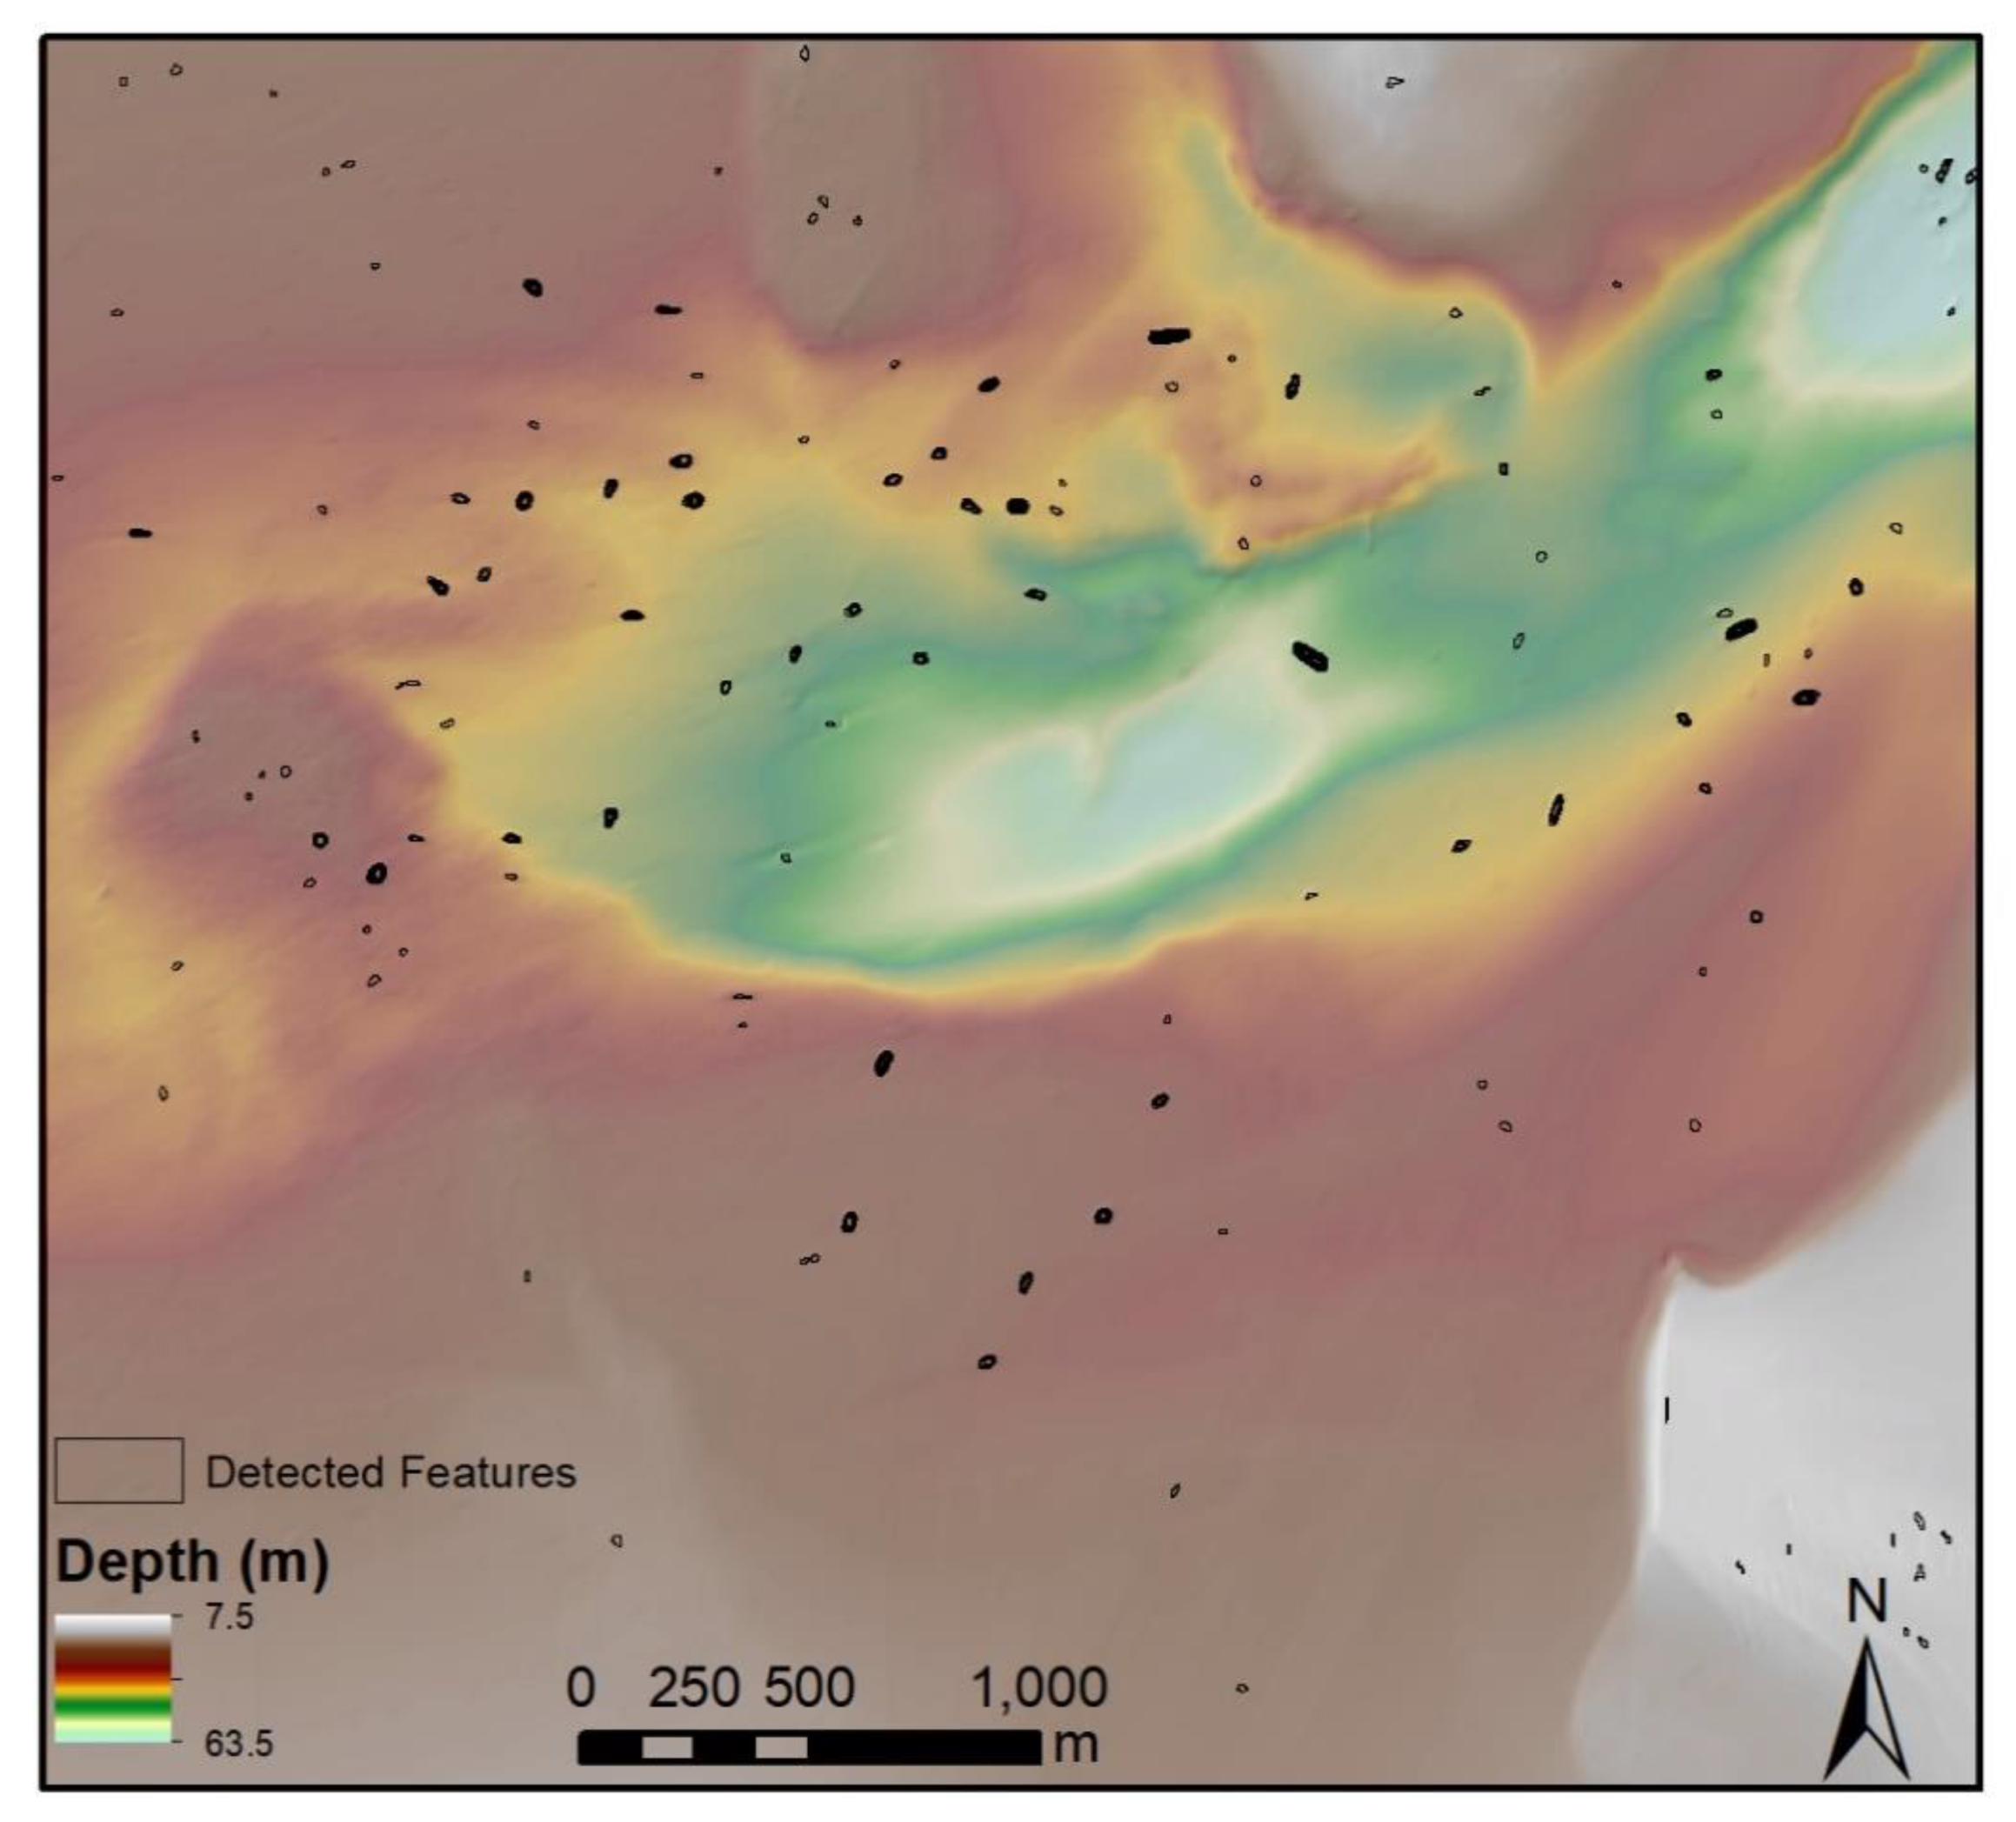
To use this algorithm for shipwreck detection, we first create an “inverse DSM” (following [34]) to turn bathymetric rises (i.e., shipwrecks) into sinks. We then run the algorithm via an ArcGIS toolbox developed by Wu et al. [84] (Sinkhole Extraction Analyst) using the parameters indicated in Figure 10. The procedure took 3 min and 7 s to run on a computer with an Intel(R) Core(TM) i7-4510U CPU @ 2.00GHz processor and 8 GB of RAM. Then, we filter the resulting objects to exclude any results with an area of >4000 m. This filtering threshold was based on trial and error. This procedure resulted in a total of 297 objects (Figure 11).
To evaluate the accuracy of this method, we analyze wreck locations from the NOAA database that were within the tested area and recorded true and false positives accordingly (Table 1). We checked a total of 150 wreck sites and find that the IDA identified 107. Of the 43 false negatives, wreck conditions were either unknown or poor, and manual evaluation of these areas only identified 10 of these features. Thus, it appears that these negative results are either the result of poor preservation or a data quality issue (although the latter is less likely due to the depths at which wrecks are recorded with higher and lower preservation levels).
Within the AWOIS database, a number of the 150 evaluated shipwreck locations noted that debris and other smaller wrecks (which were unrecorded in the database) were located nearby. There were several instances (n = 10) where wreckage was detected by the algorithm nearby other recorded shipwreck sites, suggesting that IDA may have identified other known features that were not recorded in the database. It is also possible that wreckage has moved over time from storm surges, given the mobile nature of sands in these regions (e.g., [20,78]), and that the “undetected” features are actually in a different location than originally recorded. Alternatively, these features could have been recorded in the AWOIS database but the GPS coordinates were incorrect due to low precision, or may be false-positive detections, altogether. The inability to currently ground verify these detections, however, makes these merely hypotheses requiring further evaluation.
While the IDA method detailed above is not perfect, it demonstrates that this open-access dataset is of high enough quality for researchers to conduct automated analyses with reasonable accuracy. It also provides a reproducible method for automated evaluation of bathymetric data for marine archaeologists, generally. Use of such methods can result in rapid assessment of seafloors by archaeologists, as this method is systematic and saves time compared to manual analyses of large datasets. Between the three authors, we evaluated 150 potential shipwreck sites over the span of ~10 h of analysis. Meanwhile, the IDA was conducted in just over 3 min and subsequent confirmation of detected objects required ~2 h. Such machine automation procedures have the potential to improve maritime archaeological investigations by expediting the rate of discovery while minimizing errors associated with manual evaluation and the time-consuming nature of analyzing entire datasets by hand.
4. Discussion
The results demonstrate that bathymetric datasets offered through the NOAA and the USGS provide ample opportunities for cultural heritage research. While not all of the identified features are archaeological or historically important, we know that several identified wrecks sank at the turn of the 20th century and others were constructed in the 19th century but sank later in the mid-20th century [75]. Furthermore, several identified wrecks (e.g., Chester A. Poling, Dixie Sword, Pendelton [see Supplemental File]) are listed in the Massachusetts Board of Underwater Archaeological Resources (BUAR). As noted earlier, the datasets used contain a mix of LiDAR and non-LiDAR sources. Thus, we also looked at available bathymetric LiDAR datasets through the NOAA to gauge the abilities of these sensors individually. We use the same general criteria for identification, including elevation profile (>0.5 m, >35° slope) and width (>5 m). Shape was also considered, where most wrecks are ellipsoidal to rectangular. Scattered wreckage would appear differently (due to erosion and breakdown of original structures) and thus the presence of several smaller elevation changes of at least 0.5 m within a 10 m space was also used as a criterion for positive detection.
Using bathymetric LiDAR datasets generated by the NOAA in 2014 for a section of the Long Island and Mississippi Delta case studies, we found that materials could only be detected which were located in up to 3–4 m of water. However, the LiDAR can detect poorly preserved features at these depths (Figure 12). The visibility in this region is extremely poor, so in less turbid conditions (as has been demonstrated elsewhere, e.g., [54]), this technology has the potential to record even subtle changes in marine topography.
The ability of researchers in the United States to freely access bathymetric datasets presents numerous opportunities for nautical and maritime archaeological investigations. The availability of topobathymetric datasets and a shipwreck database from the NOAA provides the potential for evaluating the patterns of shipwreck loss over time, which can aid in identifying older and/or poorly preserved features [10,86,87]. In the Southeast U.S., for example, many pre-European-contact Native American sites are likely submerged offshore and in the mouths of rivers [88]. Given the discovery of several large mound and shell ring complexes in partially submerged areas (see [89]), the use of these bathymetric data can aid in the discovery of significant archaeological sites in coastal parts of North America if they remain upstanding and exposed on the seabed (Figure 13).
This study also illustrates that automated analyses can be conducted using this dataset. Using IDA, we demonstrate how potential anthropogenic anomalies can be systematically identified in large bathymetric datasets. Because the method is reproducible, the procedure can be used in any location and researchers will derive the same results. This helps to limit interobserver error and other implicit biases in object detection procedures that occur within manual identification [43,90,91]. Especially considering the vastness of submerged areas around the world, a time-effective, reproducible method is important for underwater archaeological landscape investigations. Future applications of these data should therefore contribute to this advancement in machine learning and automated analysis to increase the discovery rate of disappearing archaeological heritage. It is important to record submerged cultural heritage before it is lost to erosion and other depositional processes, and automated analyses help to expedite this process.
It is also apparent from our automated analysis that additional characteristics apart from size and elevation profile are needed to detect all shipwrecks within a given region. Shape information can be considered, looking at the rectangularity and circularity of an identified anomaly, textural differences between the feature and its surrounding contexts, and a myriad of other characteristics. In the identification of terrestrial archaeological features, a wide range of different thresholds have been considered (see [43]).
The availability of open-access, high-quality topobathymetric information also opens doors for additional training opportunities for students in the analysis and interpretation of submerged anthropogenic environments. This can also increase the amount of underwater archaeological research conducted, as access to essential data is now within reach of a far greater number of scholars and institutions who may be otherwise unable to afford these data. Furthermore, future work can assess the freely available datasets in comparison with more intensive underwater surveys to establish a more definitive baseline of the preservation necessary to detect features.
The importance of publicly available remote sensing datasets extends beyond NOAA and the United States. There are many other countries where such datasets exist (see e.g., global data from the NOAA (https://maps.ngdc.noaa.gov/viewers/bathymetry/), U.K. (https://www.admiralty.co.uk/digital-services/data-solutions/admiralty-marine-data-portal), France (https://data.shom.fr/), global data from GEBCO (https://www.gebco.net/), etc.), and archaeologists should attempt to utilize these data, as there is great potential for discovery at little to no cost. Even in areas where data exist, but at lower resolutions, archaeologists should attempt to utilize these data to pinpoint locations for further analysis, as there is still a lot of information that can be acquired by such datasets [92]. Indeed, many researchers are taking advantage of such datasets in other parts of the world (e.g., INFOMAR (Ireland, https://www.infomar.ie/), MAREANO (Norway, https://www.mareano.no/en), MAREMAP (UK, http://www.maremap.ac.uk/index.html)). However, while agencies and companies in other parts of the world have developed such open-access data for archaeological purposes, the NOAA’s open-access data have not been as actively applied to cultural heritage research. With its potential for such research avenues demonstrated here, we hope that North American marine archaeologists will take advantage of these data, especially for more advanced analysis methods like machine learning [92,93].
5. Conclusions
We demonstrate how freely available bathymetric datasets from the NOAA are of use for archaeologists to manually and automatically record shipwrecks in both shallow and moderate depths. In analyzing bathymetric LiDAR, specifically, the highly turbid and dynamic maritime environments of our case studies suggest that analyses of these data in other regions with more optimal conditions will likely have even greater potential for archaeological research. In addition to the prospection of new archaeological deposits, these bathymetric datasets from the NOAA can also be used for preservation and monitoring of cultural heritage. Because such data are extraordinarily expensive, the free availability of this information is significant, as it can open research opportunities to scholars who would otherwise lack the funding necessary to acquire these datasets.
As more data become available from the NOAA and other governmental institutions, researchers may be able to develop time-series information to trace the effects of tropical storms and other natural processes on the preservation of archaeological materials. Beyond archaeology, this type of monitoring can assist environmental scientists monitoring reef systems, as many wreck sites contribute as artificial ecosystems and natural reefs are also visible in these data.
Supplementary Materials
The following are available online at https://0-www-mdpi-com.brum.beds.ac.uk/2571-9408/3/2/22/s1, Supplemental_Tables.xlsx: Identified Shipwreck Locations.
Author Contributions
Conceptualization, D.S.D.; methodology, D.S.D., D.C.B., and A.C.W.; formal analysis, D.S.D., D.C.B., and A.C.W.; writing—original draft preparation, D.S.D.; writing—review and editing, D.S.D., D.C.B., and A.C.W.; All authors have read and agreed to the published version of the manuscript.
Funding
D.S.D. was supported by the National Aeronautics and Space Administration under Grant No. NNX15AK06H issued through the Pennsylvania Space Grant Consortium.
Acknowledgments
We wish to thank the anonymous reviewers for their extremely helpful feedback on earlier versions of this manuscript.
Conflicts of Interest
The authors declare no conflict of interest.
References
- Bailey, G.; Flemming, N.C. Archaeology of the continental shelf: Marine resources, submerged landscapes and underwater archaeology. Quat. Sci. Rev. 2008, 27, 2153–2165. [Google Scholar] [CrossRef] [Green Version]
- McCoy, M.D. The Race to Document Archaeological Sites Ahead of Rising Sea Levels: Recent Applications of Geospatial Technologies in the Archaeology of Polynesia. Sustainability 2018, 10, 185. [Google Scholar] [CrossRef] [Green Version]
- Thompson, V.D.; Turck, J.A. Adaptive Cycles of Coastal Hunter-Gatherers. Am. Antiq. 2009, 74, 255–278. [Google Scholar] [CrossRef]
- Ward, I.; Smyth, D.; Veth, P.; McDonald, J.; McNeair, S. Recognition and value of submerged prehistoric landscape resources in Australia. Ocean Coast. Manag. 2018, 160, 167–174. [Google Scholar] [CrossRef]
- Flemming, N.C. The Role of the Submerged Prehistoric Landscape in Ground-Truthing Models of Human Dispersal During the Last Half Million Years. In 3D Recording and Interpretation for Maritime Archaeology; Springer Science and Business Media LLC: Berlin, Germany, 2017; Volume 20, pp. 269–283. [Google Scholar]
- Erlandson, J. As the world warms: Rising seas, coastal archaeology, and the erosion of maritime history. J. Coast. Conserv. 2010, 16, 137–142. [Google Scholar] [CrossRef]
- Hilton, M.; Walter, R.; Greig, K.; Konlechner, T. Burial, erosion, and transformation of archaeological landscapes. Prog. Phys. Geogr. Earth Environ. 2018, 42, 607–627. [Google Scholar] [CrossRef]
- Reimann, L.; Vafeidis, A.T.; Brown, S.; Hinkel, J.; Tol, R.S. Mediterranean UNESCO World Heritage at risk from coastal flooding and erosion due to sea-level rise. Nat. Commun. 2018, 9, 4161. [Google Scholar] [CrossRef] [Green Version]
- Menna, F.; Agrafiotis, P.; Georgopoulos, A. State of the art and applications in archaeological underwater 3D recording and mapping. J. Cult. Herit. 2018, 33, 231–248. [Google Scholar] [CrossRef]
- Quinn, R.; Boland, D. The role of time-lapse bathymetric surveys in assessing morphological change at shipwreck sites. J. Archaeol. Sci. 2010, 37, 2938–2946. [Google Scholar] [CrossRef]
- Plets, R.; Quinn, R.; Forsythe, W.; Westley, K.; Bell, T.; Benetti, S.; McGrath, F.; Robinson, R. Using Multibeam Echo-Sounder Data to Identify Shipwreck Sites: Archaeological assessment of the Joint Irish Bathymetric Survey data. Int. J. Naut. Archaeol. 2011, 40, 87–98. [Google Scholar] [CrossRef]
- Westley, K.; Plets, R.; Quinn, R.; Mcgonigle, C.; Sacchetti, F.; Dale, M.; McNeary, R.; Clements, A. Optimising protocols for high-definition imaging of historic shipwrecks using multibeam echosounder. Archaeol. Anthropol. Sci. 2019, 11, 3629–3645. [Google Scholar] [CrossRef]
- Fernández-Montblanc, T.; Izquierdo, A.; Quinn, R.; Bethencourt, M. Waves and wrecks: A computational fluid dynamic study in an underwater archaeological site. Ocean Eng. 2018, 163, 232–250. [Google Scholar] [CrossRef]
- Bailey, G.N.; Harff, J.; Sakellariou, D. (Eds.) Under the Sea: Archaeology and Palaeolandscapes of the Continental Shelf; Coastal Research Library, Springer International Publishing: Cham, Switzerland, 2017; Volume 20, ISBN 978-3-319-53158-8. [Google Scholar]
- Flemming, N.C. Survival of submerged Lithic and Bronze Age artifact sites: A review of case histories. In Quaternary Coastlines and Marine Archaeology: Towards the Prehistory of Land Bridges and Continental Shelves; Masters, P.M., Flemming, N.C., Eds.; Academic Press: London, UK, 1983; pp. 135–174. [Google Scholar]
- Lodolo, E.; Ben-Avraham, Z. A submerged monolith in the Sicilian Channel (central Mediterranean Sea): Evidence for Mesolithic human activity. J. Archaeol. Sci. Rep. 2015, 3, 398–407. [Google Scholar] [CrossRef]
- Sturt, F.; Flemming, N.; Carabias, D.; Jöns, H.; Adams, J. The next frontiers in research on submerged prehistoric sites and landscapes on the continental shelf. Proc. Geol. Assoc. 2018, 129, 654–683. [Google Scholar] [CrossRef] [Green Version]
- Shih, P.T.-Y.; Chen, Y.-H.; Chen, J.-C. Historic Shipwreck Study in Dongsha Atoll with Bathymetric LiDAR. Archaeol. Prospect. 2013, 21, 139–146. [Google Scholar] [CrossRef]
- Bingham, B.; Foley, B.; Singh, H.; Camilli, R.; Delaporta, K.; Eustice, R.M.; Mallios, A.; Mindell, D.; Roman, C.; Sakellariou, D. Robotic tools for deep water archaeology: Surveying an ancient shipwreck with an autonomous underwater vehicle. J. Field Robot. 2010, 27, 702–717. [Google Scholar] [CrossRef] [Green Version]
- Marx, R.F. Shipwrecks in the Americas; Dover: New York, NY, USA, 1987. [Google Scholar]
- Anderson, D.G.; Bissett, T.G.; Yerka, S.J.; Wells, J.J.; Kansa, E.C.; Kansa, E.; Myers, K.N.; DeMuth, R.C.; White, D.A. Sea-level rise and archaeological site destruction: An example from the southeastern United States using DINAA (Digital Index of North American Archaeology). PLoS ONE 2017, 12, e0188142. [Google Scholar] [CrossRef] [Green Version]
- Passaro, S.; Barra, M.; Saggiomo, R.; Di Giacomo, S.; Leotta, A.; Uhlen, H.; Mazzola, S. Multi-resolution morpho-bathymetric survey results at the Pozzuoli–Baia underwater archaeological site (Naples, Italy). J. Archaeol. Sci. 2013, 40, 1268–1278. [Google Scholar] [CrossRef]
- Doneus, M.; Doneus, N.; Briese, C.; Pregesbauer, M.; Mandlburger, G.; Verhoeven, G. Airborne laser bathymetry–detecting and recording submerged archaeological sites from the air. J. Archaeol. Sci. 2013, 40, 2136–2151. [Google Scholar] [CrossRef]
- Delgado, J.P.; Symons, L.C.; Elliott, K.; Cantelas, F.; Schwemmer, R.V. Assessment of the Deep Sea Wreck USS Independence. Front. Mar. Sci. 2016, 3, 62. [Google Scholar] [CrossRef] [Green Version]
- Farr, R.H.; Momber, G.; Satchell, J.; Flemming, N.C. Paleolandscapes of the Celtic Sea and the Channel/La Manche. In Submerged Landscapes of the European Continental Shelf; Wiley: Hoboken, NJ, USA, 2017; Volume 18, pp. 211–239. [Google Scholar]
- Bates, C.R.; Lawrence, M.; Dean, M.; Robertson, P. Geophysical Methods for Wreck-Site Monitoring: The Rapid Archaeological Site Surveying and Evaluation (RASSE) programme. Int. J. Naut. Archaeol. 2010, 40, 404–416. [Google Scholar] [CrossRef]
- Warren, D.; Church, R.A.; Davey, R. Discovering HMS Ark Royal. Hydro Int. 2004, 8, 26–29. [Google Scholar]
- Wood, D.A.; Taylor, J.C.; Hoyt, J.; Casserley, T.R.; Ebert, E.; Paxton, A. Utilizing Multibeam Sonar Water Column Data to Interpret Fish Populations and Structure Over Shallow-Water Historic Wrecks. In Proceedings of the AGU Fall Meeting Abstracts, Washington, DC, USA, 10–14 December 2018; p. OS33D-1924. [Google Scholar]
- Hoffman, W.; Hoyt, J.; Sassorossi, W. North Carolina Collaborative Archaeological Survey: Wilmington East and West Wind Energy Areas; Bureau of Ocean Energy Management, National Oceanic and Atmospheric Administration: Sterling, VA, USA, 2020; p. 56.
- Judge, M.T.; McGrath, F.; Cullen, S.; Verbruggen, K. INFOMAR, Ireland’s National Seabed Mapping Programme; Sharing Valuable Insights. In Proceedings of the AGU Fall Meeting Abstracts, New Orleans, LA, USA, 11–15 December 2017. [Google Scholar]
- Garcia, E.G. Bottom Trawling and Scallop Dredging in the Arctic: Impacts of Fishing on Non-Target Species, Vulnerable Habitats and Cultural Heritage; Nordic Council of Ministers: Copenhagen, Denmark, 2007. [Google Scholar]
- International, I.; Research, D.G.; Research, S.A. Inventory and Analysis of Coastal and Submerged Archaeological Site Occurrence on the Pacific Outer Continental Shelf; U.S. Department of the Interior Bureau of Ocean Energy Management: San Diego, CA, USA, 2013; p. 366.
- Guyot, A.; Lennon, M.; Thomas, N.; Gueguen, S.; Petit, T.; Lorho, T.; Cassen, S.; Hubert-Moy, L. Airborne Hyperspectral Imaging for Submerged Archaeological Mapping in Shallow Water Environments. Remote Sens. 2019, 11, 2237. [Google Scholar] [CrossRef] [Green Version]
- Davis, D.S.; Lipo, C.P.; Sanger, M.C. A comparison of automated object extraction methods for mound and shell-ring identification in coastal South Carolina. J. Archaeol. Sci. Rep. 2019, 23, 166–177. [Google Scholar] [CrossRef]
- Cuenca, E.C. An approach to the automatic surveying of prehistoric barrows through LiDAR. Quat. Int. 2017, 435, 135–145. [Google Scholar] [CrossRef]
- Freeland, T.; Heung, B.; Burley, D.V.; Clark, G.J.; Knudby, A. Automated feature extraction for prospection and analysis of monumental earthworks from aerial LiDAR in the Kingdom of Tonga. J. Archaeol. Sci. 2016, 69, 64–74. [Google Scholar] [CrossRef]
- Guyot, A.; Hubert-Moy, L.; Lorho, T. Detecting Neolithic Burial Mounds from LiDAR-Derived Elevation Data Using a Multi-Scale Approach and Machine Learning Techniques. Remote Sens. 2018, 10, 225. [Google Scholar] [CrossRef] [Green Version]
- Trier, O.D.; Zortea, M.; Tonning, C. Automatic detection of mound structures in airborne laser scanning data. J. Archaeol. Sci. Rep. 2015, 2, 69–79. [Google Scholar] [CrossRef]
- Plets, R.; Dix, J.; Bates, R. Marine Geophysics Data Acquisition, Processing and Interpretation; English Heritage: Swindon, UK, 2013. [Google Scholar]
- Heyman, W.D.; Ecochard, J.-L.B.; Biasi, F.B. Low-Cost Bathymetric Mapping for Tropical Marine Conservation—A Focus on Reef Fish Spawning Aggregation Sites. Mar. Geod. 2007, 30, 37–50. [Google Scholar] [CrossRef]
- Kachelriess, D.; Wegmann, M.; Gollock, M.; Pettorelli, N. The application of remote sensing for marine protected area management. Ecol. Indic. 2014, 36, 169–177. [Google Scholar] [CrossRef]
- Beck, A.; Philip, G.; Abdulkarim, M.; Donoghue, D.N.M. Evaluation of Corona and Ikonos high resolution satellite imagery for archaeological prospection in western Syria. Antiquity 2007, 81, 161–175. [Google Scholar] [CrossRef] [Green Version]
- Davis, D.S. Object-based image analysis: A review of developments and future directions of automated feature detection in landscape archaeology. Archaeol. Prospect. 2018, 26, 155–163. [Google Scholar] [CrossRef]
- Goyer, G.G.; Watson, R. The Laser and its Application to Meteorology. Bull. Am. Meteorol. Soc. 1963, 44, 564–570. [Google Scholar] [CrossRef] [Green Version]
- Chase, A.F.; Chase, D.Z.; Fisher, C.T.; Leisz, S.J.; Weishampel, J.F. Geospatial revolution and remote sensing LiDAR in Mesoamerican archaeology. Proc. Natl. Acad. Sci. USA 2012, 109, 12916–12921. [Google Scholar] [CrossRef] [Green Version]
- Evans, D.; Fletcher, R.J.; Pottier, C.; Chevance, J.-B.; Soutif, D.; Tan, B.S.; Im, S.; Ea, D.; Tin, T.; Kim, S.; et al. Uncovering archaeological landscapes at Angkor using lidar. Proc. Natl. Acad. Sci. USA 2013, 110, 12595–12600. [Google Scholar] [CrossRef] [Green Version]
- Inomata, T.; Pinzón, F.; Ranchos, J.L.; Haraguchi, T.; Nasu, H.; Fernandez-Diaz, J.C.; Aoyama, K.; Yonenobu, H. Archaeological Application of Airborne LiDAR with Object-Based Vegetation Classification and Visualization Techniques at the Lowland Maya Site of Ceibal, Guatemala. Remote Sens. 2017, 9, 563. [Google Scholar] [CrossRef] [Green Version]
- Johnson, K.; Ouimet, W.B. Rediscovering the lost archaeological landscape of southern New England using airborne light detection and ranging (LiDAR). J. Archaeol. Sci. 2014, 43, 9–20. [Google Scholar] [CrossRef]
- Krasinski, K.; Wygal, B.T.; Wells, J.; Martin, R.L.; Seager-Boss, F. Detecting Late Holocene cultural landscape modifications using LiDAR imagery in the Boreal Forest, Susitna Valley, Southcentral Alaska. J. Field Archaeol. 2016, 41, 1–16. [Google Scholar] [CrossRef]
- Witharana, C.; Ouimet, W.B.; Johnson, K. Using LiDAR and GEOBIA for automated extraction of eighteenth–late nineteenth century relict charcoal hearths in southern New England. GISci. Remote Sens. 2018, 55, 183–204. [Google Scholar] [CrossRef]
- Shell, C.; Roughley, C. Exploring the Loughcrew landscape: A new airborne approach. Archaeol. Irel. 2004, 18, 22–25. [Google Scholar]
- Bewley, R.; Crutchley, S.; Shell, C. New light on an ancient landscape: Lidar survey in the Stonehenge World Heritage Site. Antiquity 2005, 79, 636–647. [Google Scholar] [CrossRef]
- Jensen, J.R. Remote Sensing of the Environment: An Earth Resource Perspective, 2nd ed.; Pearson Prentice Hall: Upper Saddle River, NJ, USA, 2007. [Google Scholar]
- Doneus, M.; Miholjek, I.; Mandlburger, G.; Doneus, N.; Verhoeven, G.; Briese, C.; Pregesbauer, M. Airborne Laser Bathymetry for Documentation of Submerged Archaeological Sites in Shallow Water. ISPRS Int. Arch. Photogramm. Remote Sens. Spat. Inf. Sci. 2015, 99–107. [Google Scholar] [CrossRef] [Green Version]
- Luo, L.; Wang, X.; Guo, H.; Lasaponara, R.; Zong, X.; Masini, N.; Wang, G.; Shi, P.; Khatteli, H.; Chen, F.; et al. Airborne and spaceborne remote sensing for archaeological and cultural heritage applications: A review of the century (1907–2017). Remote Sens. Environ. 2019, 232, 111280. [Google Scholar] [CrossRef]
- Cunningham, A.G.; Lillycrop, W.J.; Guenther, G.C.; Brooks, M.W. Shallow Water Laser Bathymetry: Accomplishments and Applications; US Army Corps of Engineers Mobile United States: Brighton, MD, USA, 1998.
- Lobb, M.A. Developing Terrestrial Laser Scanning of Threatened Coastal Archaeology with Special Reference to Intertidal Structures. Ph.D. Thesis, University of Southampton, Southampton, UK, 2016. [Google Scholar]
- Devereux, B.; Amable, G.; Crow, P. Visualisation of LiDAR terrain models for archaeological feature detection. Antiquity 2008, 82, 470–479. [Google Scholar] [CrossRef]
- Doneus, M. Openness as Visualization Technique for Interpretative Mapping of Airborne Lidar Derived Digital Terrain Models. Remote Sens. 2013, 5, 6427–6442. [Google Scholar] [CrossRef] [Green Version]
- Fujii, N.; Saito, K.; Chiba, T.; Sata, I.; Yoshinaga, T.; Tasaki, K. The new three-dimensional visualization method of heritage sites by lidar data. ISPRS Int. Arch. Photogramm. Remote. Sens. Spat. Inf. Sci. 2012, XXXIX, 87–92. [Google Scholar] [CrossRef] [Green Version]
- Chase, A.S.Z.; Chase, D.Z.; Chase, A.F. LiDAR for Archaeological Research and the Study of Historical Landscapes. In Trends in Spatial Analysis and Modelling; Springer Science and Business Media LLC: Berlin, Germany, 2017; Volume 16, pp. 89–100. [Google Scholar]
- Singh, H.; Adams, J.; Mindell, D.; Foley, B. Imaging Underwater for Archaeology. J. Field Archaeol. 2000, 27, 319–328. [Google Scholar] [CrossRef]
- Church, R.A.; Warren, D.J. Sound Methods: The Necessity of High-resolution Geophysical Data for Planning Deepwater Archaeological Projects. Int. J. Hist. Archaeol. 2008, 12, 103–119. [Google Scholar] [CrossRef]
- McCarthy, J.; Benjamin, J.; Winton, T.; Van Duivenvoorde, W. The Rise of 3D in Maritime Archaeology. In 3D Recording and Interpretation for Maritime Archaeology; Springer Science and Business Media LLC: Berlin, Germany, 2019; Volume 31, pp. 1–10. [Google Scholar]
- Kelley, J.T.; Belknap, D.F.; Claesson, S. Drowned coastal deposits with associated archaeological remains from a sea-level “slowstand”: Northwestern Gulf of Maine, USA. Geology 2010, 38, 695–698. [Google Scholar] [CrossRef] [Green Version]
- Somma, R.; Iuliano, S.; Matano, F.; Molisso, F.; Passaro, S.; Sacchi, M.; Troise, C.; De Natale, G. High-resolution morpho-bathymetry of Pozzuoli Bay, southern Italy. J. Maps 2015, 12, 1–9. [Google Scholar] [CrossRef]
- Westley, K.; Bell, T.; Renouf, M.A.P.; Tarasov, L. Impact Assessment of Current and Future Sea-Level Change on Coastal Archaeological Resources—Illustrated Examples rom Northern Newfoundland. J. Isl. Coast. Archaeol. 2011, 6, 351–374. [Google Scholar] [CrossRef]
- Trabant, P. Applied high resolution geophysical methods: Offshore geoengineering hazards. Geophys. J. 1986, 86, 214–215. [Google Scholar]
- Moore, F.; Kelleher, C.; Brady, K.; McKeon, C.; Lawlor, I. RMS Lusitania: The Story of a Wreck; Department of the Culture, Heritage & the Gaeltacht, Department Communications, Climate Action and Environment and Stationery Office Dublin Ireland: Dublin, Ireland, 2019.
- Pelgas, P.; Wirtz, B. French experience using sub-bottom profiler combined with sonar multi-beam as a preventive archaeological diagnostic before dredging. Archaeol. Pol. 2015, 53, 336–340. [Google Scholar]
- Davis, D.S.; Sanger, M.; Lipo, C.P. Automated mound detection using lidar and object-based image analysis in Beaufort County, South Carolina. Southeast. Archaeol. 2018, 38, 23–37. [Google Scholar] [CrossRef]
- Danielson, J.J.; Poppenga, S.K.; Brock, J.C.; Evans, G.A.; Tyler, D.J.; Gesch, D.B.; Thatcher, C.A.; Barras, J.A. Topobathymetric Elevation Model Development using a New Methodology: Coastal National Elevation Database. J. Coast. Res. 2016, 76, 75–89. [Google Scholar] [CrossRef] [Green Version]
- ESRI. ArcGIS; Environmental Systems Research Institute, Inc.: Redlands, CA, USA, 2019. [Google Scholar]
- Palmer, R. Interpreting Aerial Images. In Interpreting Archaeological Topography: 3D Data, Visualisation and Observation; Opitz, R.S., Cowley, D.C., Eds.; Oxbow Books: Oxford, UK, 2013; pp. 76–87. ISBN 978-1-78297-110-8. [Google Scholar]
- Sheard, B. Lost Voyages: Two Centuries of Shipwrecks in the Approaches to New York; Aqua Quest Publications: New York, NY, USA, 1998. [Google Scholar]
- Water Clarity Long Island Sound Study. Available online: http://longislandsoundstudy.net/ecosystem-target-indicators/water-clarity/ (accessed on 18 September 2019).
- Massachusetts Water Resources Authority MWRA’s Harbor, Beaches and River Monitoring Data. Available online: http://www.mwra.state.ma.us/harbor/html/wq_data.htm (accessed on 18 March 2020).
- Wellfleet, M.A. 99 M.S.R.; Us, M. 02667 P.-3421 C. Shipwrecks-Cape Cod National Seashore (U.S. National Park Service). Available online: https://www.nps.gov/caco/learn/historyculture/shipwrecks.htm (accessed on 27 March 2020).
- Weekly Data Report. Lake Pontchartrain Basin Found; Lake Pontchartrain Basin Foundation. Available online: https://saveourlake.org/lpbf-programs/water-quality/weekly-data-report/ (accessed on 18 March 2020).
- Lambers, K. Airborne and Spaceborne Remote Sensing and Digital Image Analysis in Archaeology; Springer Science and Business Media LLC: Berlin, Germany, 2017; pp. 109–122. [Google Scholar]
- Traviglia, A.; Torsello, A. Landscape Pattern Detection in Archaeological Remote Sensing. Geoscience 2017, 7, 128. [Google Scholar] [CrossRef] [Green Version]
- Der Vaart, W.V.-V.; Lambers, K. Learning to Look at LiDAR: The Use of R-CNN in the Automated Detection of Archaeological Objects in LiDAR Data from the Netherlands. J. Comput. Appl. Archaeol. 2019, 2, 31–40. [Google Scholar] [CrossRef] [Green Version]
- Wu, Q.; Liu, H.; Wang, S.; Yu, B.; Beck, R.; Hinkel, K. A localized contour tree method for deriving geometric and topological properties of complex surface depressions based on high-resolution topographical data. Int. J. Geogr. Inf. Sci. 2015, 29, 1–20. [Google Scholar] [CrossRef]
- Wu, Q.; Deng, C.; Chen, Z. Automated delineation of karst sinkholes from LiDAR-derived digital elevation models. Geomorphology 2016, 266, 1–10. [Google Scholar] [CrossRef]
- Lindsay, J.; Creed, I.F. Distinguishing actual and artefact depressions in digital elevation data. Comput. Geosci. 2006, 32, 1192–1204. [Google Scholar] [CrossRef]
- Magnini, L.; Bettineschi, C. Theory and practice for an object-based approach in archaeological remote sensing. J. Archaeol. Sci. 2019, 107, 10–22. [Google Scholar] [CrossRef]
- Fernández-Montblanc, T.; Quinn, R.; Izquierdo, A.; Bethencourt, M. Evolution of a Shallow Water Wave-Dominated Shipwreck Site: Fougueux (1805), Gulf of Cadiz. Geoarchaeology 2016, 31, 487–505. [Google Scholar] [CrossRef]
- Turck, J.A.; Thompson, V.D. Revisiting the resilience of Late Archaic hunter-gatherers along the Georgia coast. J. Anthropol. Archaeol. 2016, 43, 39–55. [Google Scholar] [CrossRef] [Green Version]
- Russo, M. Archaic Shell Rings of the Southeast U.S.: National Historic Landmarks Historic Context; Southeast Archeological Center, National Park Service: Tallahassee, FL, USA, 2006.
- Hawkins, A.; Stewart, S.; Banning, E. Interobserver bias in enumerated data from archaeological survey. J. Archaeol. Sci. 2003, 30, 1503–1512. [Google Scholar] [CrossRef]
- Proietti, M.; Pickston, A.; Graffitti, F.; Barrow, P.; Kundys, D.; Branciard, C.; Ringbauer, M.; Fedrizzi, A. Experimental test of local observer independence. Sci. Adv. 2019, 5, eaaw9832. [Google Scholar] [CrossRef] [Green Version]
- Davis, D.S.; Douglass, K. Aerial and Spaceborne Remote Sensing in African Archaeology: A Review of Current Research and Potential Future Avenues. Afr. Archaeol. Rev. 2020, 37, 9–24. [Google Scholar] [CrossRef]
- Davis, D.S. Geographic Disparity in Machine Intelligence Approaches for Archaeological Remote Sensing Research. Remote Sens. 2020, 12, 921. [Google Scholar] [CrossRef] [Green Version]
Figure 1.
Long Island, New York. Red boxes show locations of studied area around Long Island. Blue box shows extent of automated detection analysis (discussed below).
Figure 1.
Long Island, New York. Red boxes show locations of studied area around Long Island. Blue box shows extent of automated detection analysis (discussed below).

Figure 2.
Shows the percentage of wrecks visible in TBDSM within the Long Island study area based on depth and overall preservation. Fair preservation is equally identified in both shallow (light blue bars) and deeper waters (dark blue bars), while poorly preserved wrecks are not well identified at any depth, but shallow features are sometimes detected. Wrecks with unknown preservation were not included in this graph.

Figure 3.
Shows the locations of two shipwreck sites in a TBDSM-hillshade overlay for Long Island. (A) is located along a slope and is poorly preserved, making identification difficult. While there is some bathymetric difference in the depth profile, identification is not definitive. (B) is well preserved and not located along a slope and is easily detected.

Figure 4.
Shows another identified shipwreck located in ~15 m of water off the coast of Long Island, New York. The anomaly is easily visualized in the TBDSM-hillshade map and in the elevation profile.
Figure 4.
Shows another identified shipwreck located in ~15 m of water off the coast of Long Island, New York. The anomaly is easily visualized in the TBDSM-hillshade map and in the elevation profile.

Figure 5.
This map illustrates the sheer number of shipwrecks present off the coast of Long Island, New York, and the ability of the NOAA’s freely available bathymetric datasets for detecting these features. Some wreck locations are indicated by arrows, but there are far more within this image than there are arrows. The data (especially when overlaid with a hillshade map) can detect shallow wrecks (as previous figures have shown) as well as much deeper features.

Figure 6.
This map shows the study region along the Massachusetts coast. Sections of the Boston Harbor, Nantucket Sound, Gloucester Harbor, and Monomoy Island were used as case studies.
Figure 6.
This map shows the study region along the Massachusetts coast. Sections of the Boston Harbor, Nantucket Sound, Gloucester Harbor, and Monomoy Island were used as case studies.

Figure 7.
Shows the percentage of wrecks identified in the Massachusetts study area based on depth. The deeper the shipwreck, the more likely it is to be detected.
Figure 7.
Shows the percentage of wrecks identified in the Massachusetts study area based on depth. The deeper the shipwreck, the more likely it is to be detected.

Figure 8.
Study region (red box) within the Mississippi Delta containing a number of known shipwreck sites.
Figure 8.
Study region (red box) within the Mississippi Delta containing a number of known shipwreck sites.

Figure 9.
Percentage of shipwrecks identified within the Mississippi Delta study region by depth and preservation. Shallow wrecks are represented by light blue bars. Deeper wrecks are represented by dark blue bars. Specific wreck information included in Supplemental File. Results are nearly identical to those in the Long Island case study.

Figure 10.
Chosen parameters for inverse depression analysis using the sinkhole extractor tool in the Sinkhole Extraction Analyst Toolbox [83,84].

Figure 11.
Results from automated inverse depression analysis (IDA) procedure.

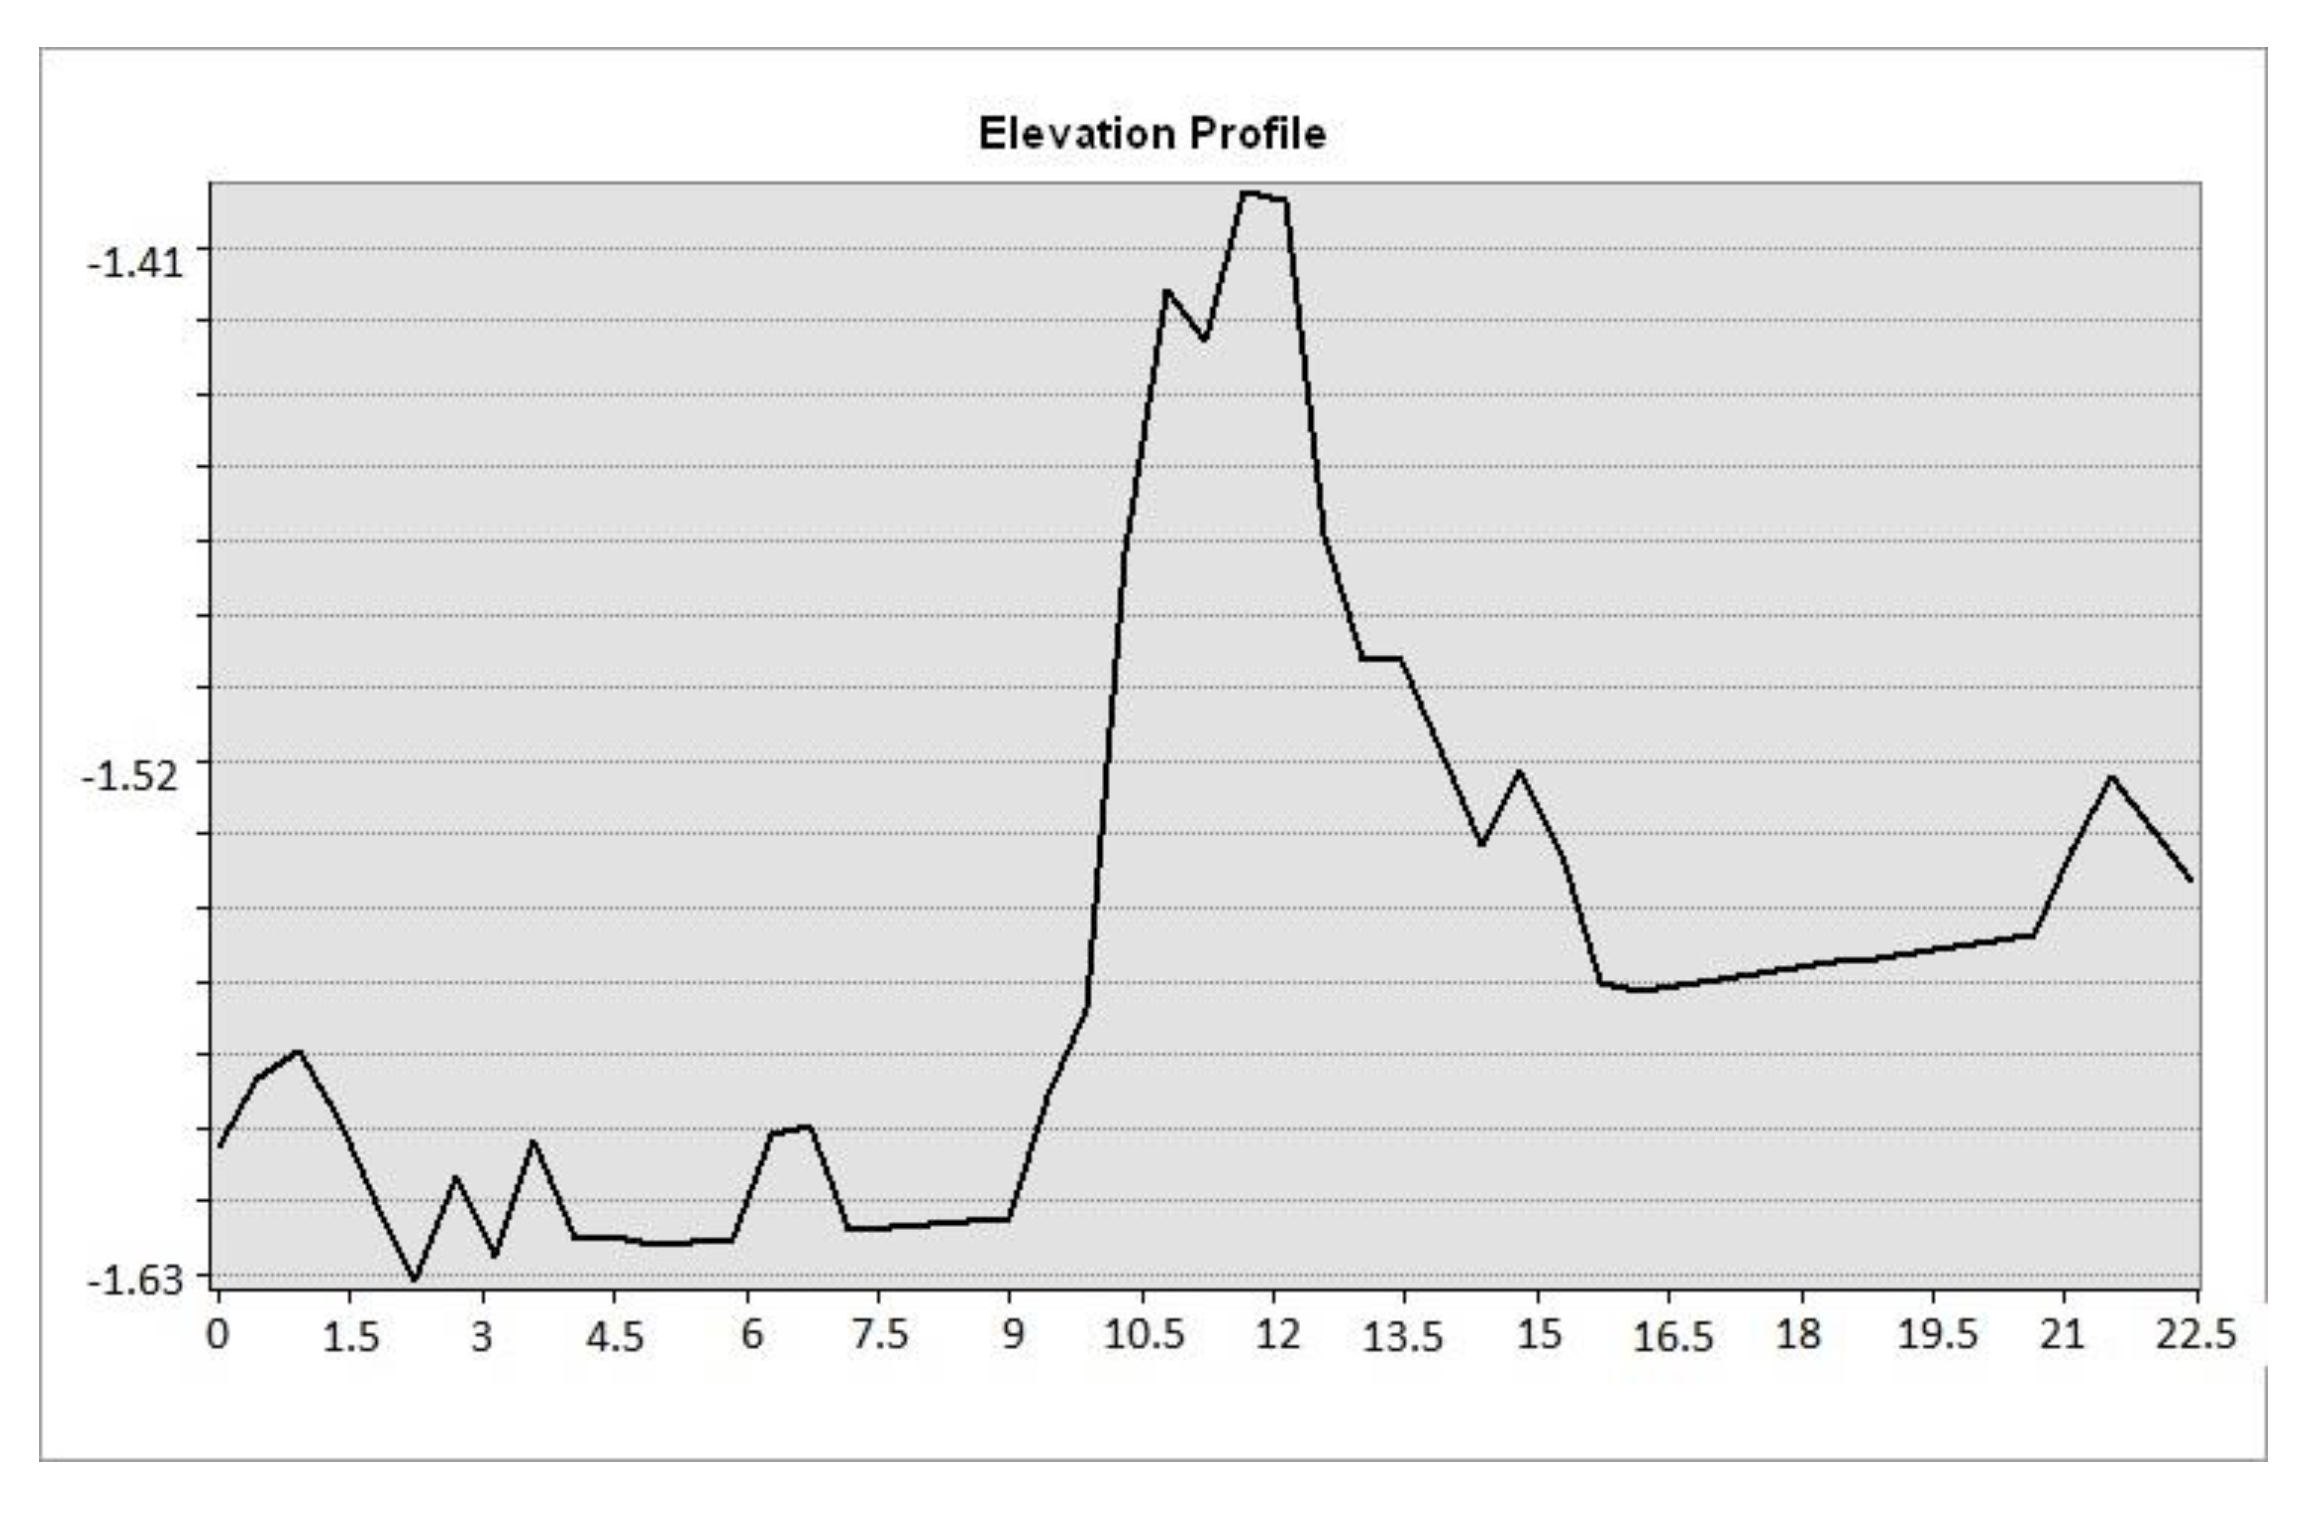
Figure 12.
Identification of shipwreck scatter (AWOIS record 6719) in a bathymetric LiDAR dataset. The wreck is mostly debris but contains enough relief to be identified. All measurements are reported in meters.
Figure 12.
Identification of shipwreck scatter (AWOIS record 6719) in a bathymetric LiDAR dataset. The wreck is mostly debris but contains enough relief to be identified. All measurements are reported in meters.

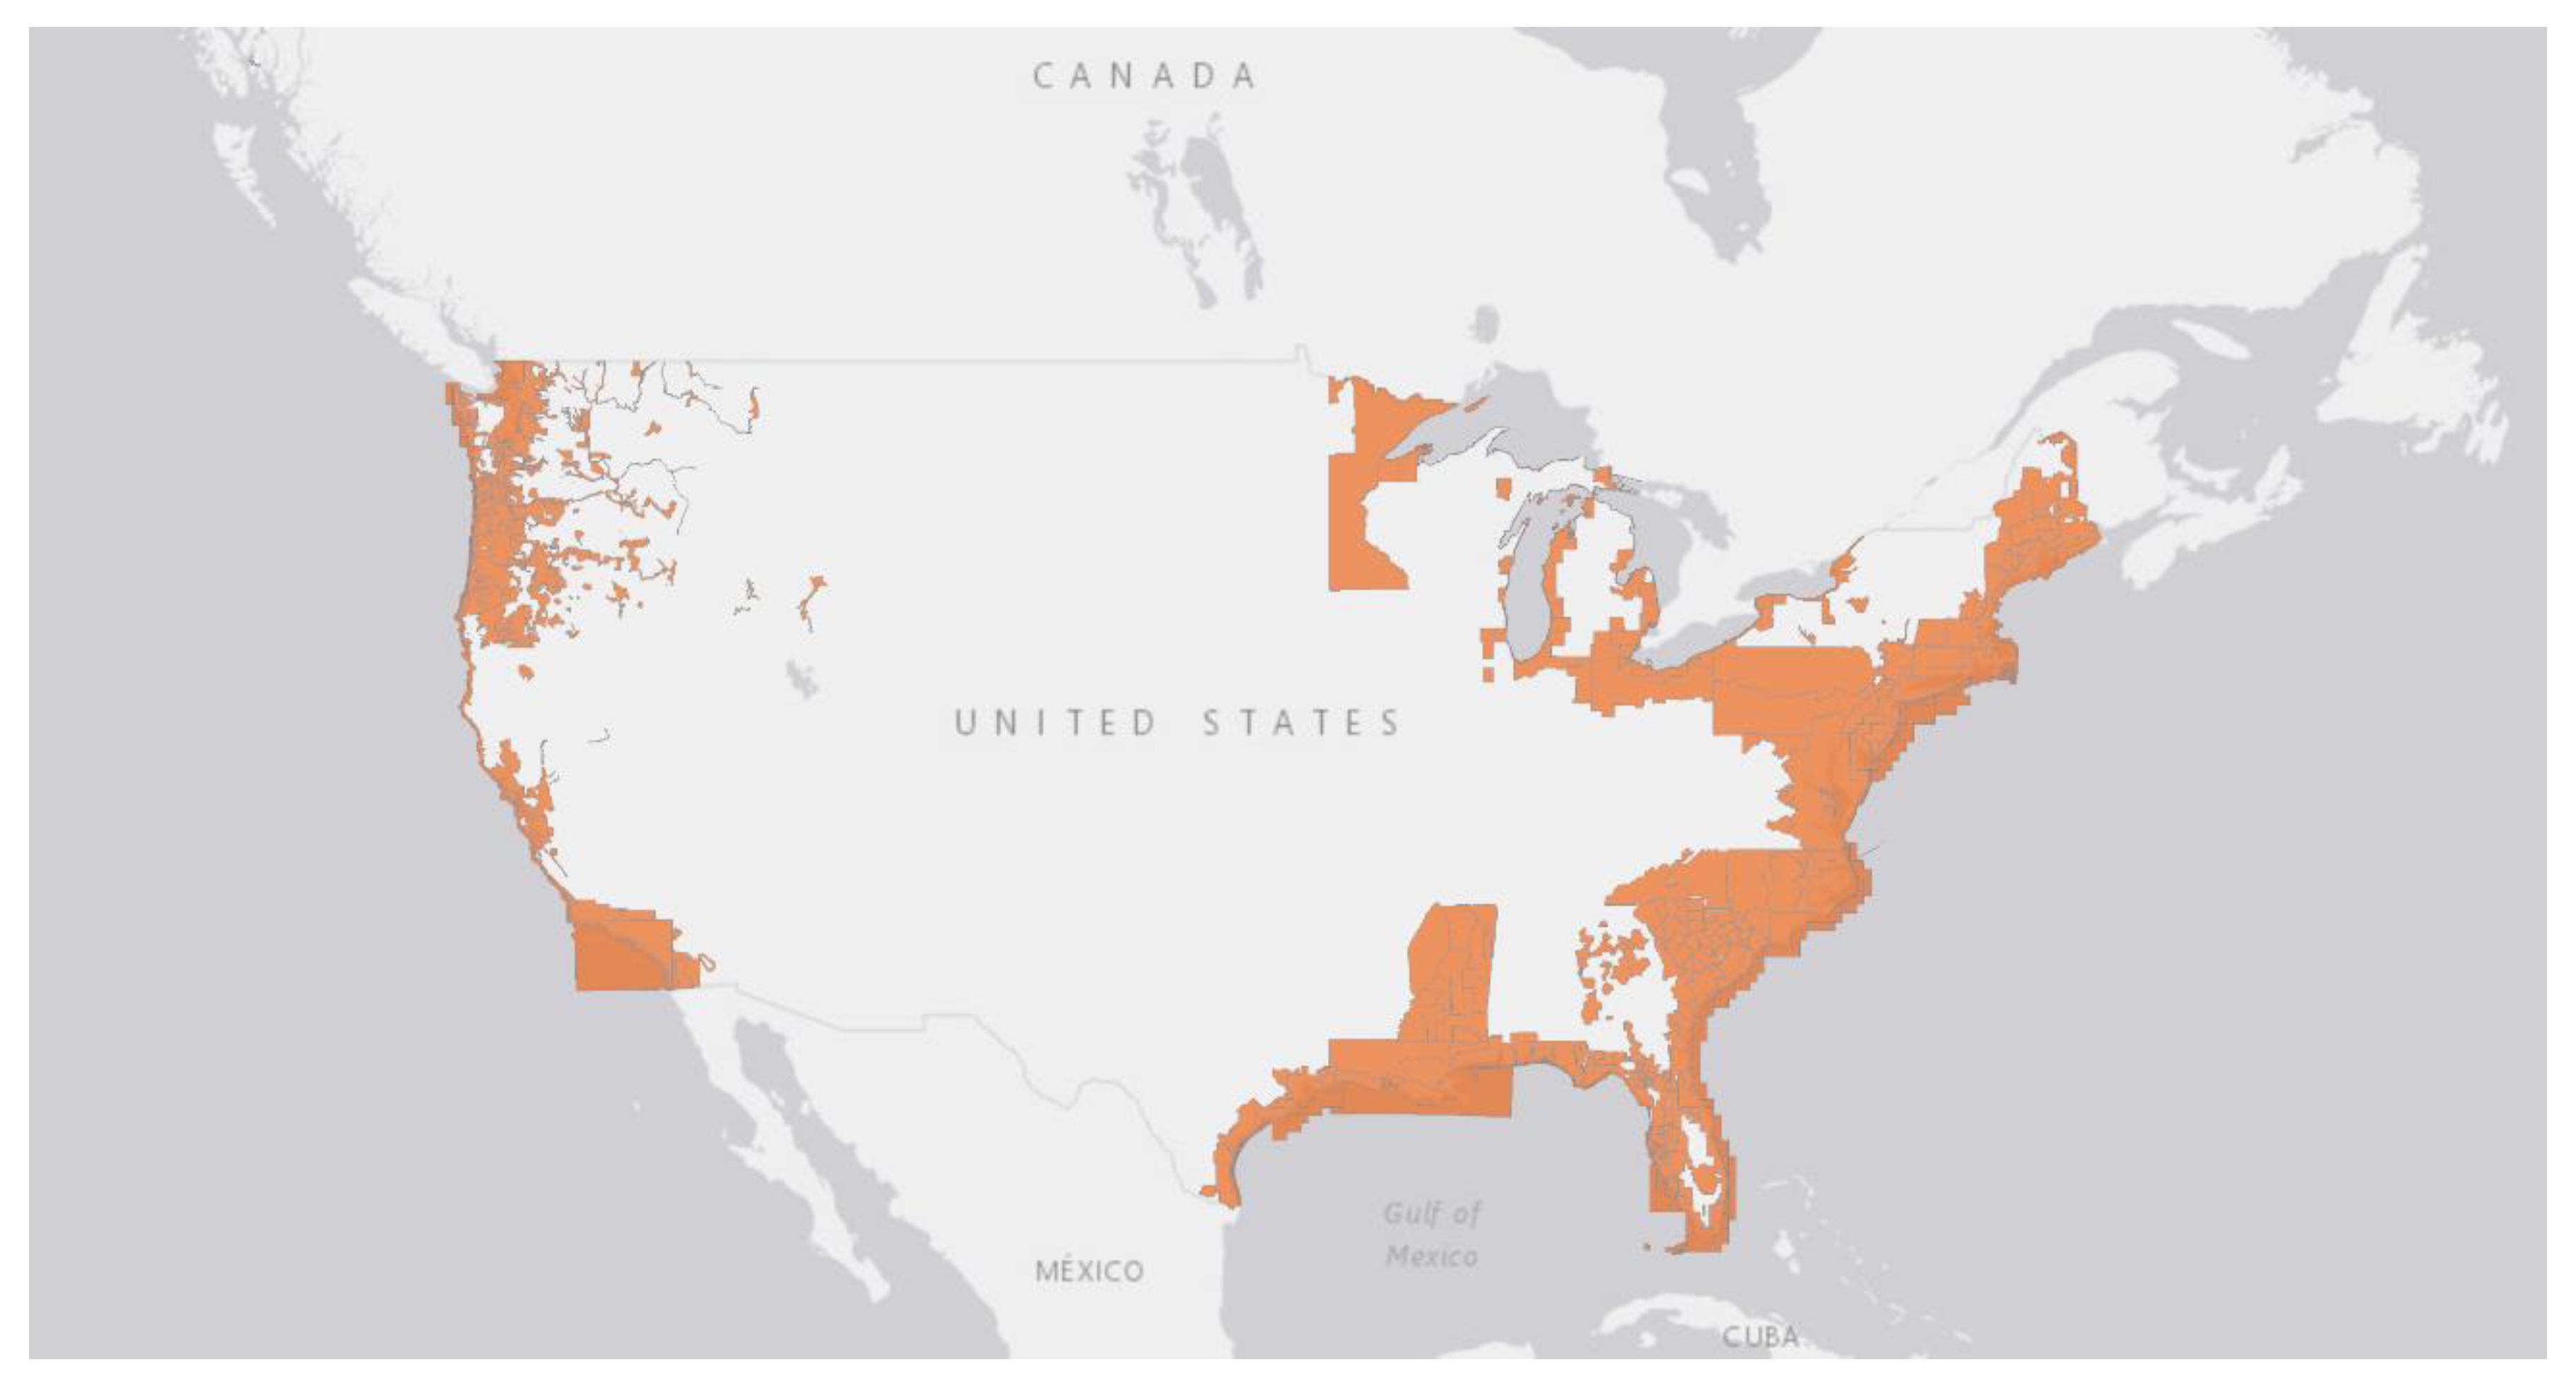
Figure 13.
A screenshot of the NOAA Data Access website. This shows the total available data coverage through the NOAA of the contiguous United States. Datasets (which include topographic and bathymetric information) can be utilized by archaeologists working on both the East and West Coasts and around the Great Lakes region. Data are also available for Alaska, Hawaii and U.S. territories.


Table 1.
Accuracy assessment of IDA analysis in the Long Island study area.
| Accuracy Metric | Result |
|---|---|
| True Positive Rate | 71.33% |
| False Negative Rate | 28.67% |
| Potential New Identifications: True positive rate X (total detections—reidentified sites) | 135 |
© 2020 by the authors. Licensee MDPI, Basel, Switzerland. This article is an open access article distributed under the terms and conditions of the Creative Commons Attribution (CC BY) license (http://creativecommons.org/licenses/by/4.0/).
Share and Cite
MDPI and ACS Style
Davis, D.S.; Buffa, D.C.; Wrobleski, A.C. Assessing the Utility of Open-Access Bathymetric Data for Shipwreck Detection in the United States. Heritage 2020, 3, 364-383. https://0-doi-org.brum.beds.ac.uk/10.3390/heritage3020022
AMA Style
Davis DS, Buffa DC, Wrobleski AC. Assessing the Utility of Open-Access Bathymetric Data for Shipwreck Detection in the United States. Heritage. 2020; 3(2):364-383. https://0-doi-org.brum.beds.ac.uk/10.3390/heritage3020022
Chicago/Turabian StyleDavis, Dylan S., Danielle C. Buffa, and Amy C. Wrobleski. 2020. "Assessing the Utility of Open-Access Bathymetric Data for Shipwreck Detection in the United States" Heritage 3, no. 2: 364-383. https://0-doi-org.brum.beds.ac.uk/10.3390/heritage3020022