Small Multispectral UAV Sensor and Its Image Fusion Capability in Cultural Heritage Applications

School of Spatial Planning and Development (Eng.), Aristotle University of Thessaloniki, GR-54124 Thessaloniki, Greece
*
Author to whom correspondence should be addressed.
Heritage 2020, 3(4), 1046-1062; https://0-doi-org.brum.beds.ac.uk/10.3390/heritage3040057
Submission received: 5 August 2020
/
Revised: 22 September 2020
/
Accepted: 22 September 2020
/
Published: 24 September 2020
Abstract
:For many decades the multispectral images of the earth’s surface and its objects were taken from multispectral sensors placed on satellites. In recent years, the technological evolution produced similar sensors (much smaller in size and weight) which can be placed on Unmanned Aerial Vehicles (UAVs), thereby allowing the collection of higher spatial resolution multispectral images. In this paper, Parrot’s small Multispectral (MS) camera Sequoia+ is used, and its images are evaluated at two archaeological sites, on the Byzantine wall (ground application) of Thessaloniki city (Greece) and on a mosaic floor (aerial application) at the archaeological site of Dion (Greece). The camera receives RGB and MS images simultaneously, a fact which does not allow image fusion to be performed, as in the standard utilization procedure of Panchromatic (PAN) and MS image of satellite passive systems. In this direction, that is, utilizing the image fusion processes of satellite PAN and MS images, this paper demonstrates that with proper digital processing the images (RGB and MS) of small MS cameras can lead to a fused image with a high spatial resolution, which retains a large percentage of the spectral information of the original MS image. The high percentage of spectral fidelity of the fused images makes it possible to perform high-precision digital measurements in archaeological sites such as the accurate digital separation of the objects, area measurements and retrieval of information not so visible with common RGB sensors via the MS and RGB data of small MS sensors.
1. Introduction
Remote sensing is the using of spectral information in order to identify and document metrically and thematically the objects on the earth’s surface by employing automated procedures. The sensors that are used record parts of the electromagnetic spectrum, such as the entire visible range (producing Panchromatic images—PAN images) or parts of the visible range or spectral parts outside the visible range (producing, e.g., Multispectral images—MS images). Corresponding sensors, which are found on satellites, are now being produced in smaller dimensions, the so-called small multispectral (MS) cameras, which can be used on ground or aerially (using, e.g., Unmanned Aerial Vehicle—UAV). The images taken by the sensors have different spatial resolutions, e.g., a PAN image has a much better spatial resolution than an MS image. The utilization of images allows the classification of the image, ensuring the distinction (thematic information) and measurement (metric information) of different objects on the earth’s surface. Notably, image fusion preceded the making of the classifications. The methods and techniques of image fusion result in fused images with high spatial resolutions, which preserve part of the spectral information of the original lower spatial resolution data [1,2,3,4,5,6,7,8].
Satellite imagery companies supply, e.g., MS images with a spatial resolution four times lower than PAN images (e.g., Ikonos-2 at nadir 1 m PAN image and 4 m MS image, WorldView-4 at nadir 0.31 m PAN image and 1.24 m MS image). Until now, many image fusions have been performed with a 1/4 ratio of spatial resolution [9,10,11]. Additionally, by using images from different companies, image fusions with smaller (e.g., 1/3) or larger (1/60) ratios of spatial resolution have been performed (e.g., Spot 10 m PAN image with Landsat ΤΜ 30 m MS image or WorldView-2 0.5 m PAN image with Landsat-8 30 m MS image) [12,13,14]. Apart from the above, although the number of bibliographical references is small, image fusions of aerial photography with satellite images have been carried out [15,16,17].
Until now there were no bibliographical references for the implementation of image fusion for the data of a small multispectral (MS) camera, which can be used in ground and aerial (e.g., UAV usage) applications, by utilizing image fusion procedures of satellite PAN and MS images. Perhaps this is the case, because no corresponding small system [18,19,20,21,22,23,24,25,26] is equipped simultaneously with PAN and, e.g., MS sensors. This is the main subject of this paper. The aim is, on the one hand, to investigate the capability of performing image fusion with the small MS camera’s images, by following the corresponding image fusion procedures of the images of passive satellite systems and, on the other hand, to investigate if the produced products are better (fused image and classification: enhancement of the spatial and thematic information) than the products from processing the original MS images. The aim is not to apply a variety of image fusion methods on the images of a small MS camera and to present the method that produces the best outputs (e.g., classification).
The different levels at which image fusion can be done are the signal level, pixel level, feature level and at decision level [27,28,29]. Image fusion methodologies are mainly based on pixel-level techniques [6,30,31,32,33,34,35].
The evaluation of fused image is based on a qualitative-visual analysis and quantitative-statistical analysis. This is a mandatory procedure before, e.g., image classification. The qualitative-visual analysis is subjective and is directly related to the experience of the fused image creator (e.g., are more details recognized in the image or are colors, contrasts preserved?) [7,36]. The quantitative-statistical analysis is objective and is based on spectral analysis or/and on the evaluation of images’ spatial improvement. The main and most commonly used method is the correlation coefficient (CC) between the original bands of the MS image and the corresponding bands of the fused image. The correlation coefficient values range from −1 to +1. Usually, the values between the corresponding bands of the two images (MS and fused image) must be from +0.9 to +1, so that the fused image can be used for, e.g., the successful classification of earth’s surface coverings and objects. Other methods of quantitative-statistical analysis are, e.g., the per-pixel deviation (PD) and root-mean-square-error (RMSE) [7,37,38,39,40]. The calculating methods of fused image spatial improvement are the high pass correlation coefficient (HCC) and the edge detection method [31,36,38,41,42].
Classification techniques are distinguished in pixel-based techniques (e.g., the unsupervised and the supervised classification), in sub-pixel-based techniques (e.g., the fuzzy classification, regression modeling) and object-based techniques (such as image segmentation and object-based image analysis techniques). There are also spatio-contextual classification techniques (such as the texture extraction) [43,44,45,46,47].
In this paper, a small multispectral (MS) camera for the acquisition of remote sensing images will be used (RGB image and MS image: green, red, red edge, Near Infrared—NIR), the Parrot’s Sequoia+ (which does not have a PAN sensor), in ground and aerial (UAV usage) archaeological applications so as to study the capability of image fusions by following the methodologies and techniques used in satellite images. It should be noted that this camera is used in agricultural and forestry applications (the study and distinction of crops and forest vegetation).
2. Study Areas
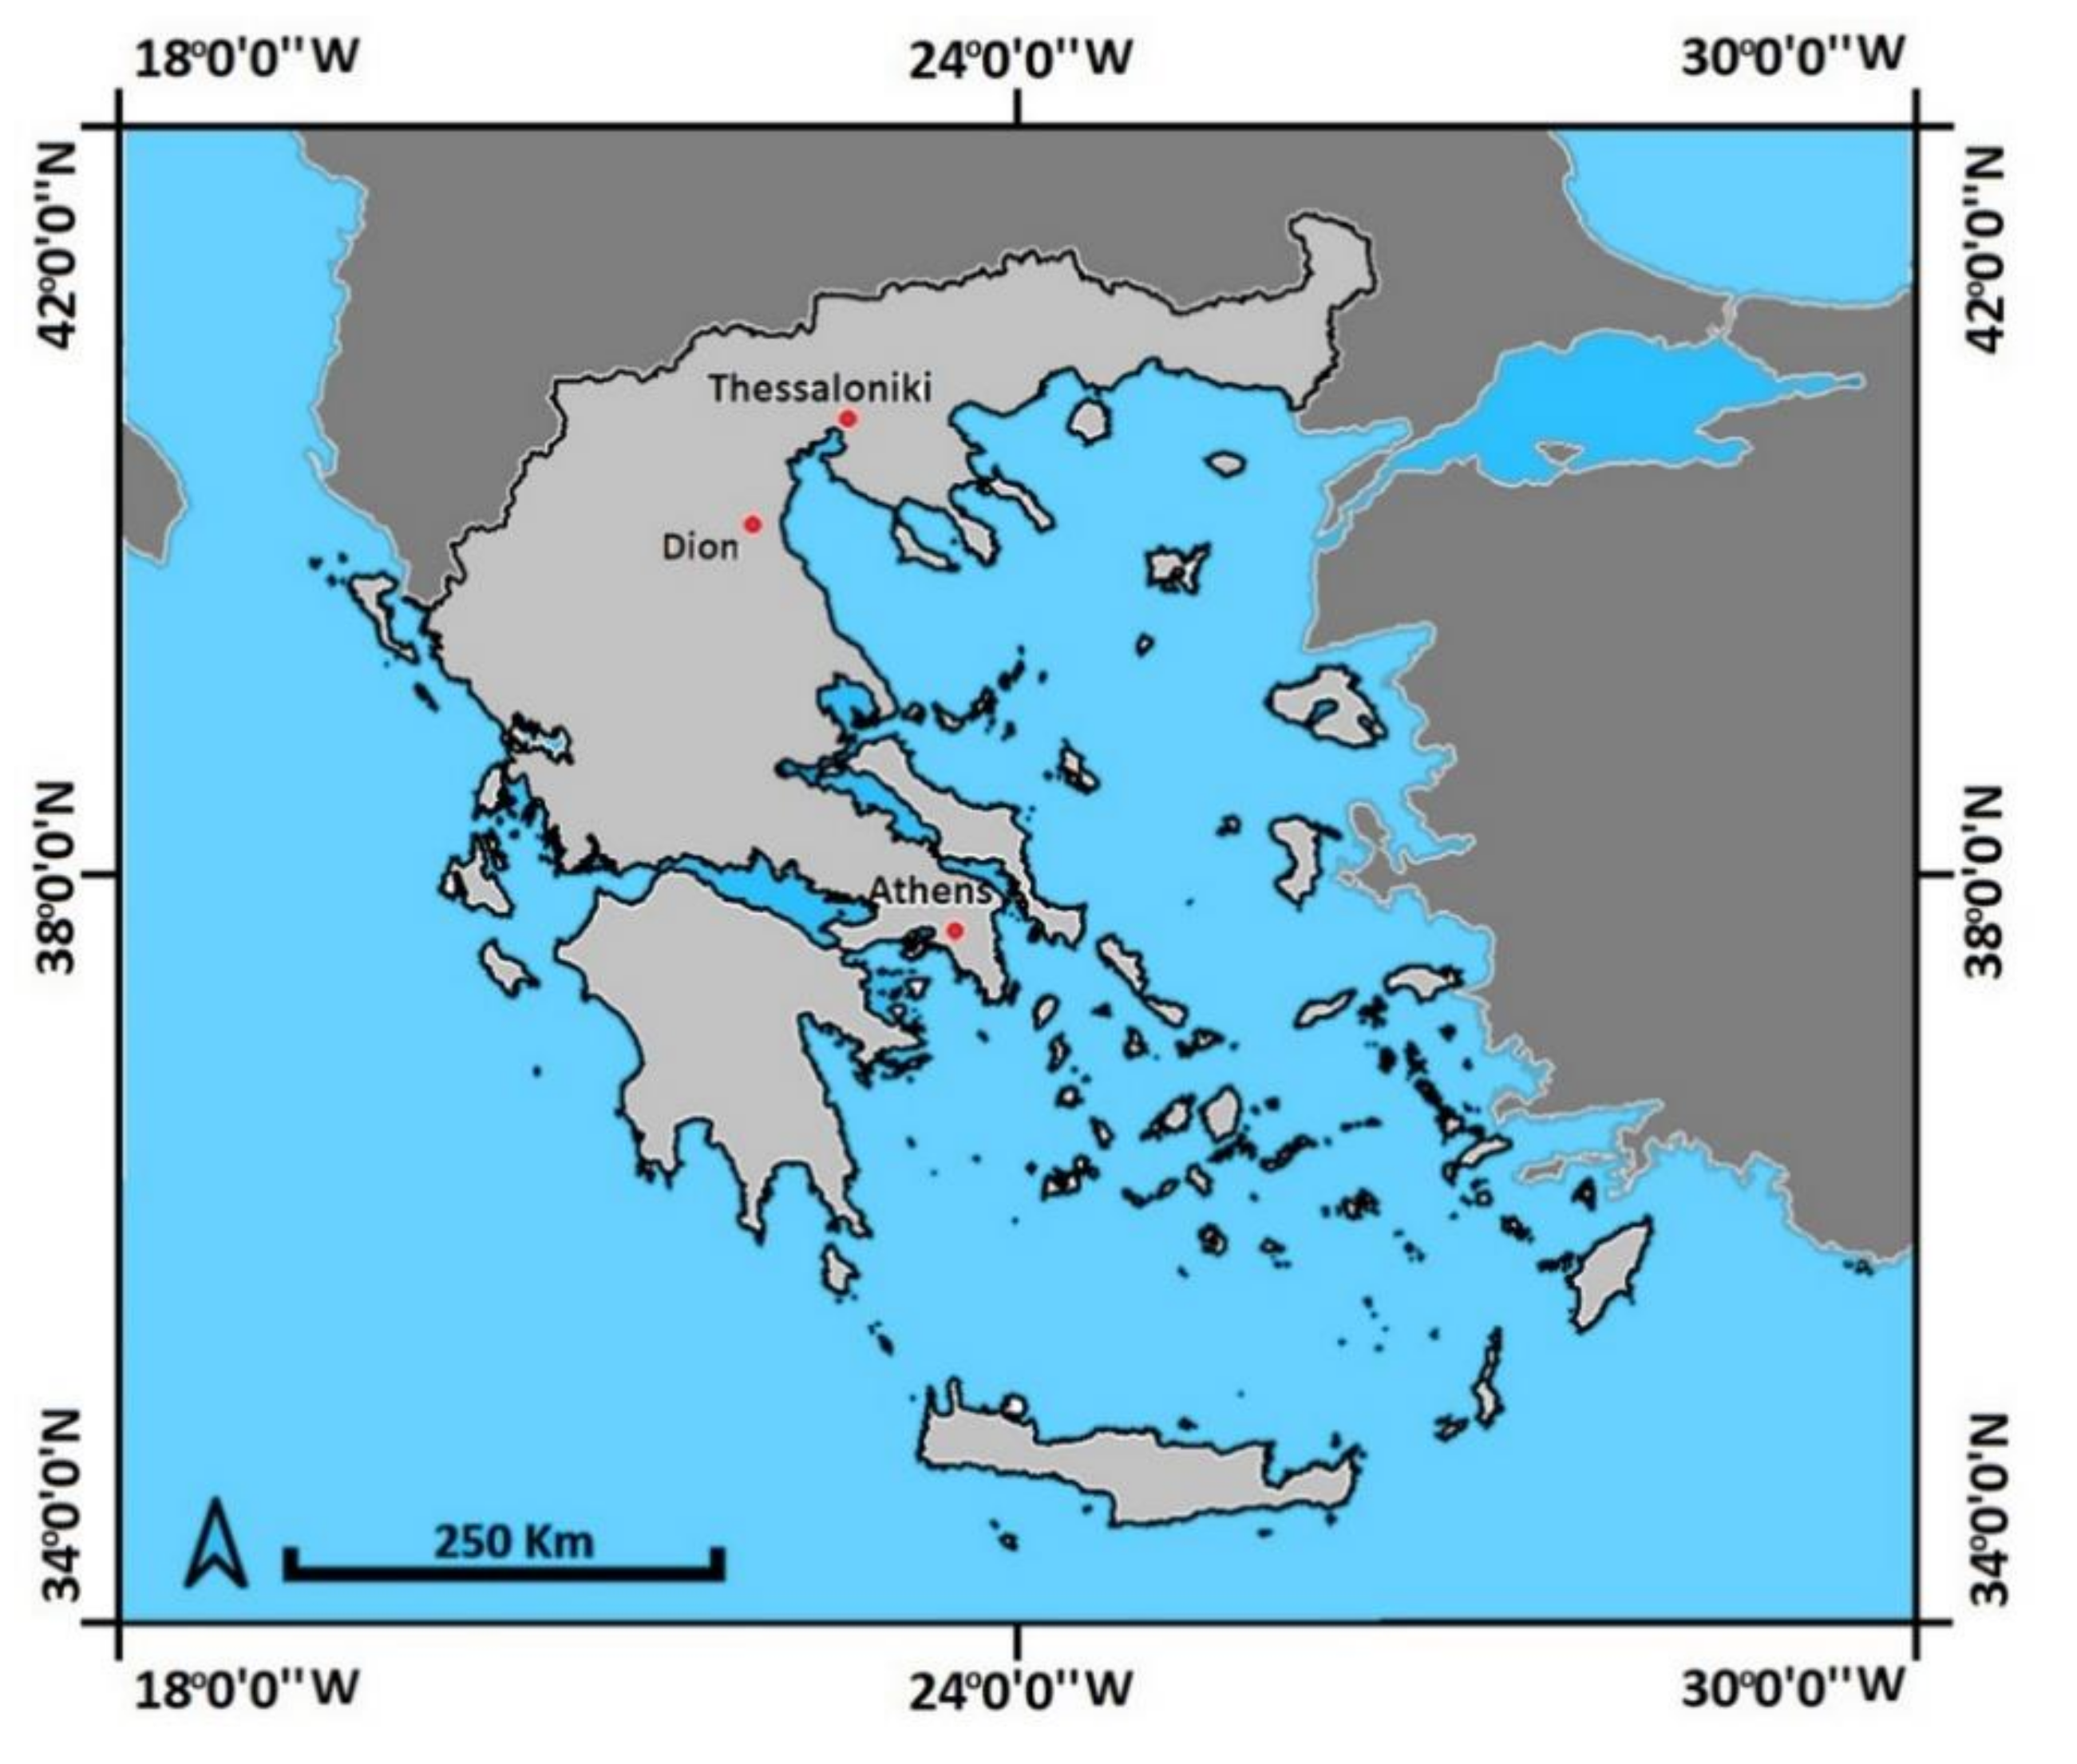
Thessaloniki (Figure 1) is the second largest city in Greece in terms of area and population after Athens. It was founded in 316/5 BC by Macedonian general Kassandros, who gave it the name of his wife and half-sister of Alexander the Great, Thessaloniki. The city was essentially created from the relocation and union of smaller nearby ancient settlements. The fortification of the city was probably created at the time of its creation. In the third century AD, additional fortifications were built to reinforce the city from raids. At the end of the fourth century a second wall was erected outside the former with triangular protrusions. Smaller reinforcements were made until the 13th century AD. For many centuries, the wall surrounded the city, including the seaside walls in the southwestern side of the Gulf of Thermaicos, which do not exist today. On the west and east wall, triangular protrusions appear, while at the higher points rectangular towers exist. Their construction includes repeated rows of bricks and rocks decorated with Christian (crosses) and ancient Greek symbols (sun representations, rhombuses). The Byzantine walls preserved in Constantinople (the capital of Byzantium) are similar in style. The existing visible wall was built from the end of the fourth to the middle of the fifth century AD, and its total length is about 4 km (km), but its original perimeter was 8 km and its height was 10 to 12 m (m). It has been officially designated a UNESCO world cultural heritage site [48].
The total area covered by the archaeological site of Dion is 6.07 km2. The archaeological site (Figure 1) consists of a fortified town of 1.46 km2 which is surrounded by places of worship and public infrastructures, such as theaters and baths. The city is believed to have been inhabited from the Classical to the Early Christian years. Excavations have revealed private residences, public buildings, shops and many workshops in the form of building blocks, defined by a system of vertically intersecting road axes (Hippodomus system). The ancient city of Dion was built in the second century BC on flat terrain and located 1.5 km from the sea. The city was connected with the sea through a floating river that does not exist today [49].
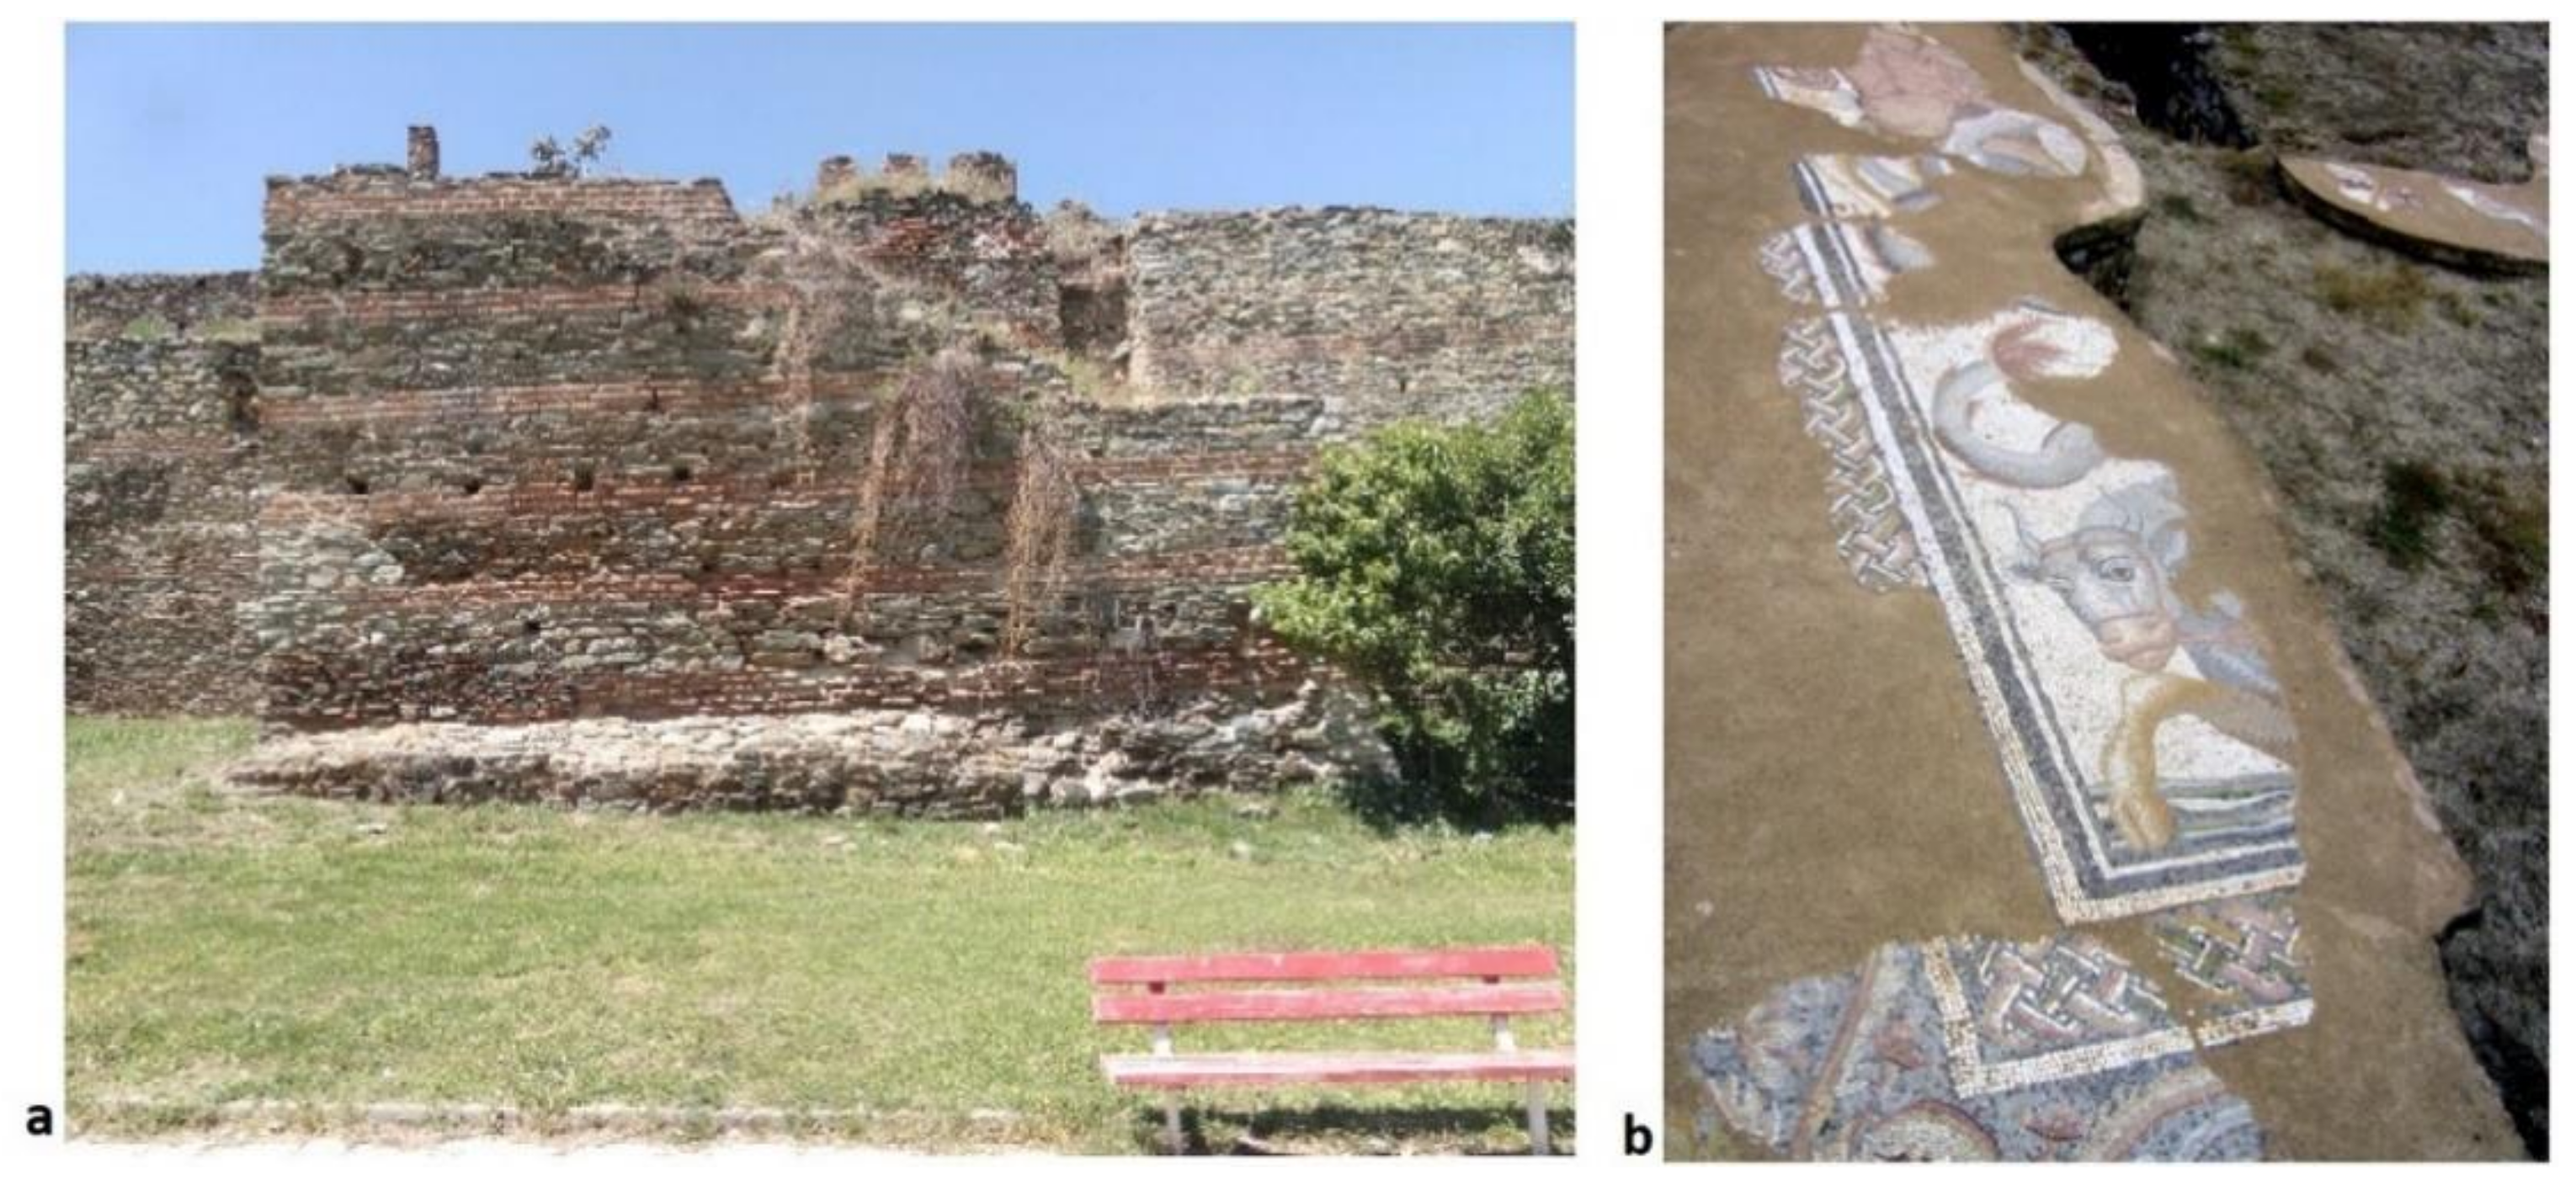
The mosaic floors located on the north part of the complex of ‘‘Great Thermes’’ in Dion are also of particular interest [50]. A typical example is the mosaic from the time of the Severans, which is located on the floor of the baths (frigidarium). This mosaic depicts a marine bull (subject of study in this paper) with an expressive head, a Nereid seated on a hybrid’s tail in her green robe, and a Triton’s torso. As far as its composition is concerned, pink tones dominate the marine forms [51,52].
In the context of the present research on the metric and thematic documentation of cultural monuments with the small MS camera, a ground capture at a random location of the wall (Figure 2a) of Thessaloniki city and control points measurements with a topographic instrument were performed. In the archaeological site of Dion (Figure 2b), aerial capture (UAV usage) on a mosaic at the ‘‘Great Thermes’’ with the small MS camera and control points measurements with a topographic instrument were performed.
3. Equipment
The Topcon OS-105 geodetic station was used to measure the control points on the wall and the mosaic floor. The distance measurement accuracy with prism is ±2 mm + 2 ppm m.s.e and without prism is ±3 mm + 2 ppm m.s.e (−200 m) [53].
Parrot’s small MS camera Sequoia+ (Table 1, [54,55]) was used for ground and aerial images of the ancient wall and mosaic, respectively.
Sequoia+ allows the recording and separation of the spectral information of the depicted objects. It was chosen due to its small size and weight, which allow its installation on UAVs. The small camera Sequoia+ can be used effectively in archaeological applications and in general in studies related to cultural heritage. Multispectral data of the Sequoia camera have been utilized in archaeology, such as in the discovery of archaeological findings in cultivated areas [25,56]. Moreover, some researchers combine Sequoia’s multispectral data with data from other types of sensors such as RGB, thermal and hyperspectral sensors [57,58,59].
A UAV was used to capture the aerial image of the mosaic floor. The coordinate movement of the UAV is realized through six propellers. The drone is able to fly completely automated or controlled manually via remote control. The UAV’s body consists of a central axis which houses the batteries, electronic boards, avionics processors, two cameras (digital DSLR camera and small MS camera) and sensors (Inertial Measurement Unit—IMU, GPS, gyroscope, accelerometer and barometer). An important part for the effective operation of the UAV is the ground station through which the flight plan is programmed. The digital camera (DSLR Canon 1200D, with CMOS sensor 22.3 mm × 14.9 mm, 18 MP, Canon lens EF-S 17–85 mm f/4–5.6 IS USM, focal length 17–85 mm and diaphragm opening range 4–5.6) and the Parrot’s small MS camera Sequoia+ were placed on the gimbal in a way that allowed them to rotate vertically by 180 degrees (±90 degrees from nadir). The UAV uses the autopilot Wookong M of DJI, which incorporates a controller, an IMU, and a GPS. Its horizontal accuracy is approximately ±2 m, its vertical accuracy reaches ±0.5 m, and the angle measurement accuracy (IMU) in the three axes (X, Y, Z) ranges from approximately 1ο to 2ο (according to the specifications of the autopilot). The lifting capacity of the UAV is 2.5 kg, and the flight time ranges between 10 and 15 min [60].
All of the following remote sensing image processes were performed in Erdas Imagine© software (Hexagon Geospatial, Madison, AL, USA).
4. Methodology and Data Collection
In this paper, two remote sensing image processes of the small MS camera are performed—a ground scene in the case of walls and an aerial scene in the case of a mosaic.
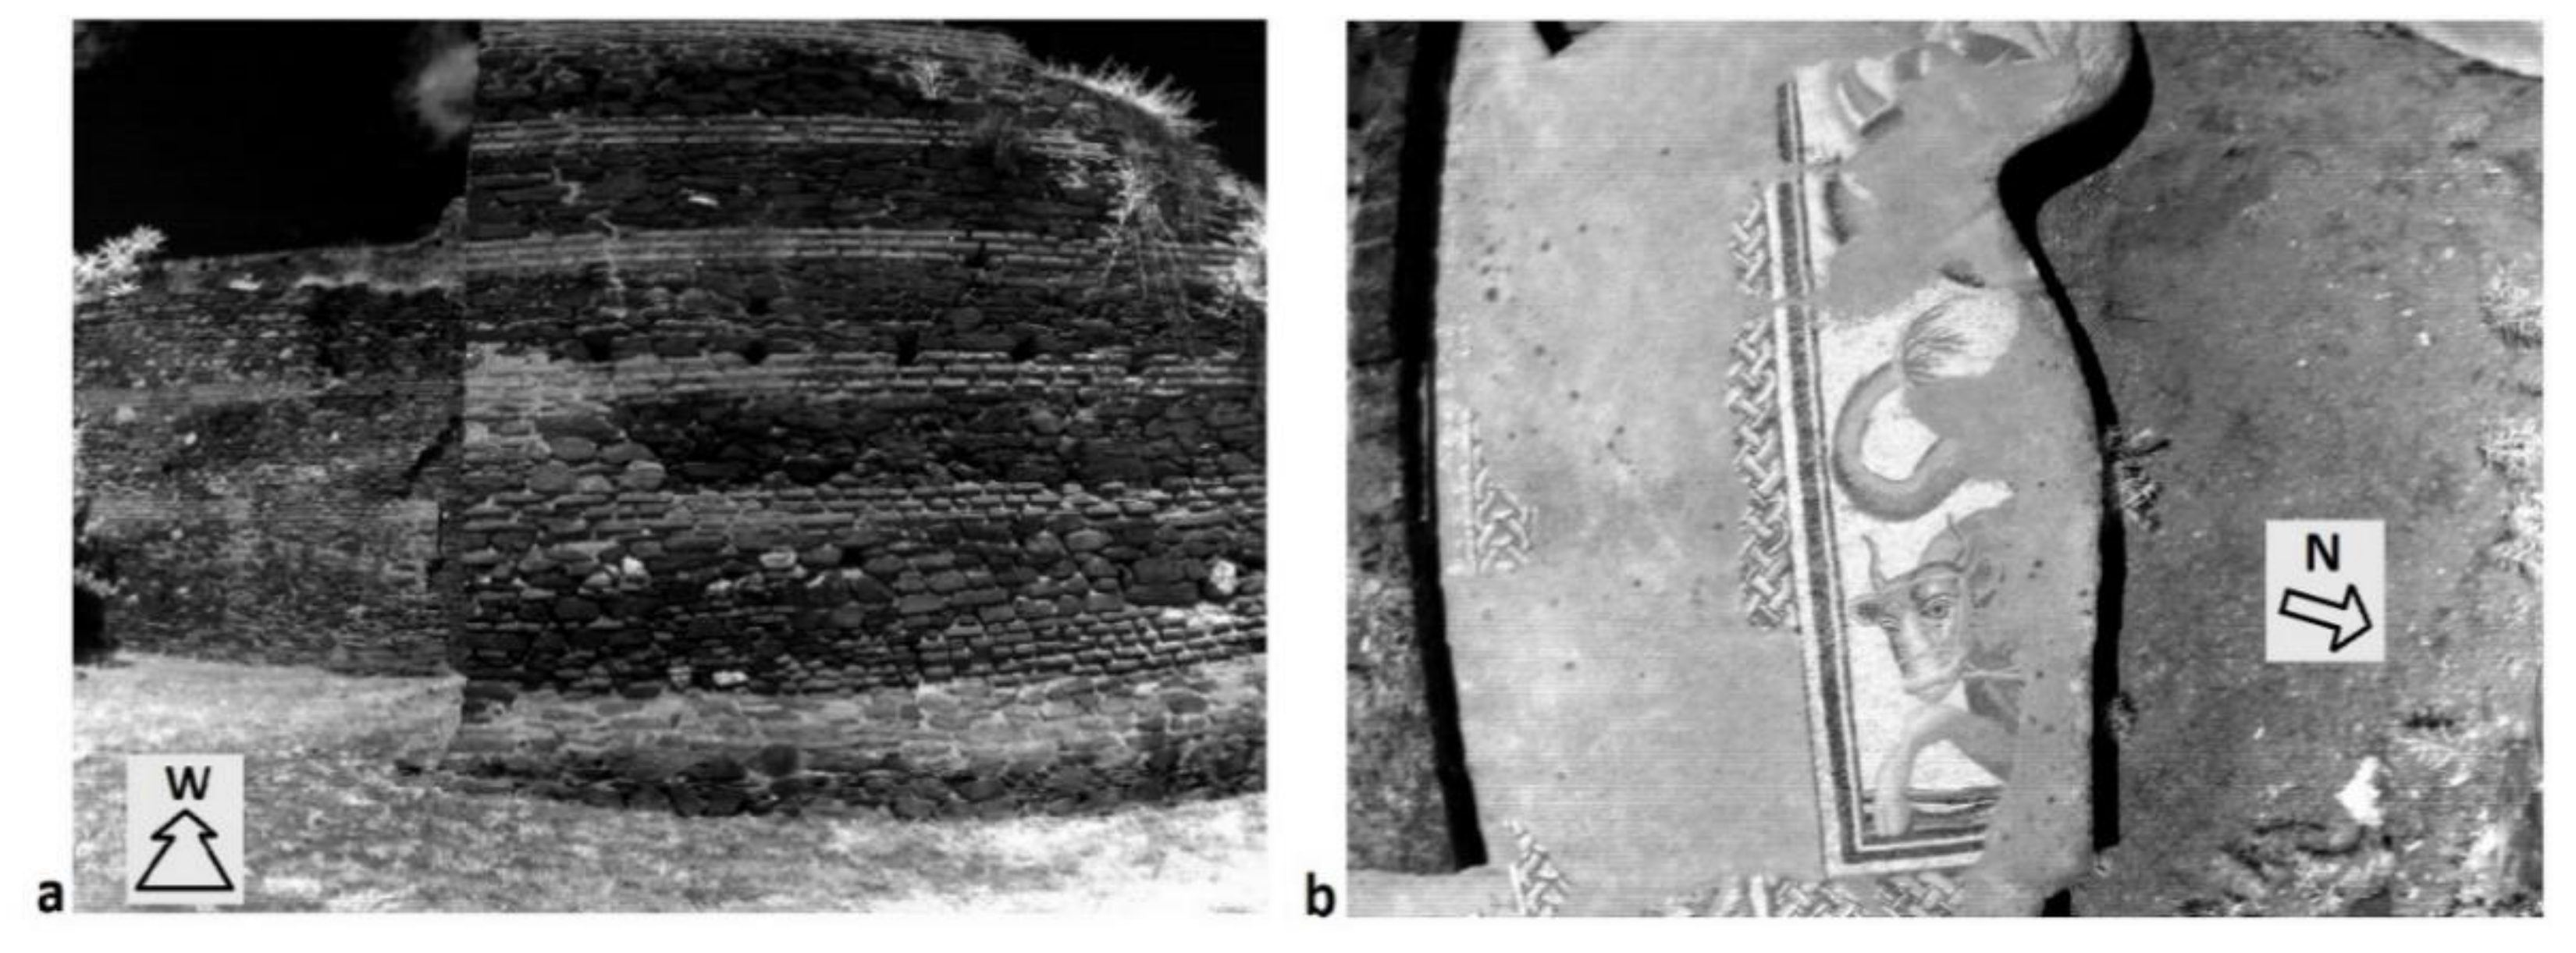
At a randomly selected wall location (Figure 1 and Figure 2a), a ground image capture was performed (one image, Figure 3a) with the small MS camera (Figure 4: Step 1) at a distance of approximately 8 m. The bas-relief on the wall is imperceptible, so no stereoscopic image coverage is required. In the case of the mosaic (Figure 1 and Figure 2b), there is no bas-relief, and the aerial capture was taken from a height of about 4 m (one image, Figure 3b). In both case studies (wall and mosaic), Control Points (CPs) were measured with a surveying instrument in an independent coordinate system (Figure 4: Step 2).
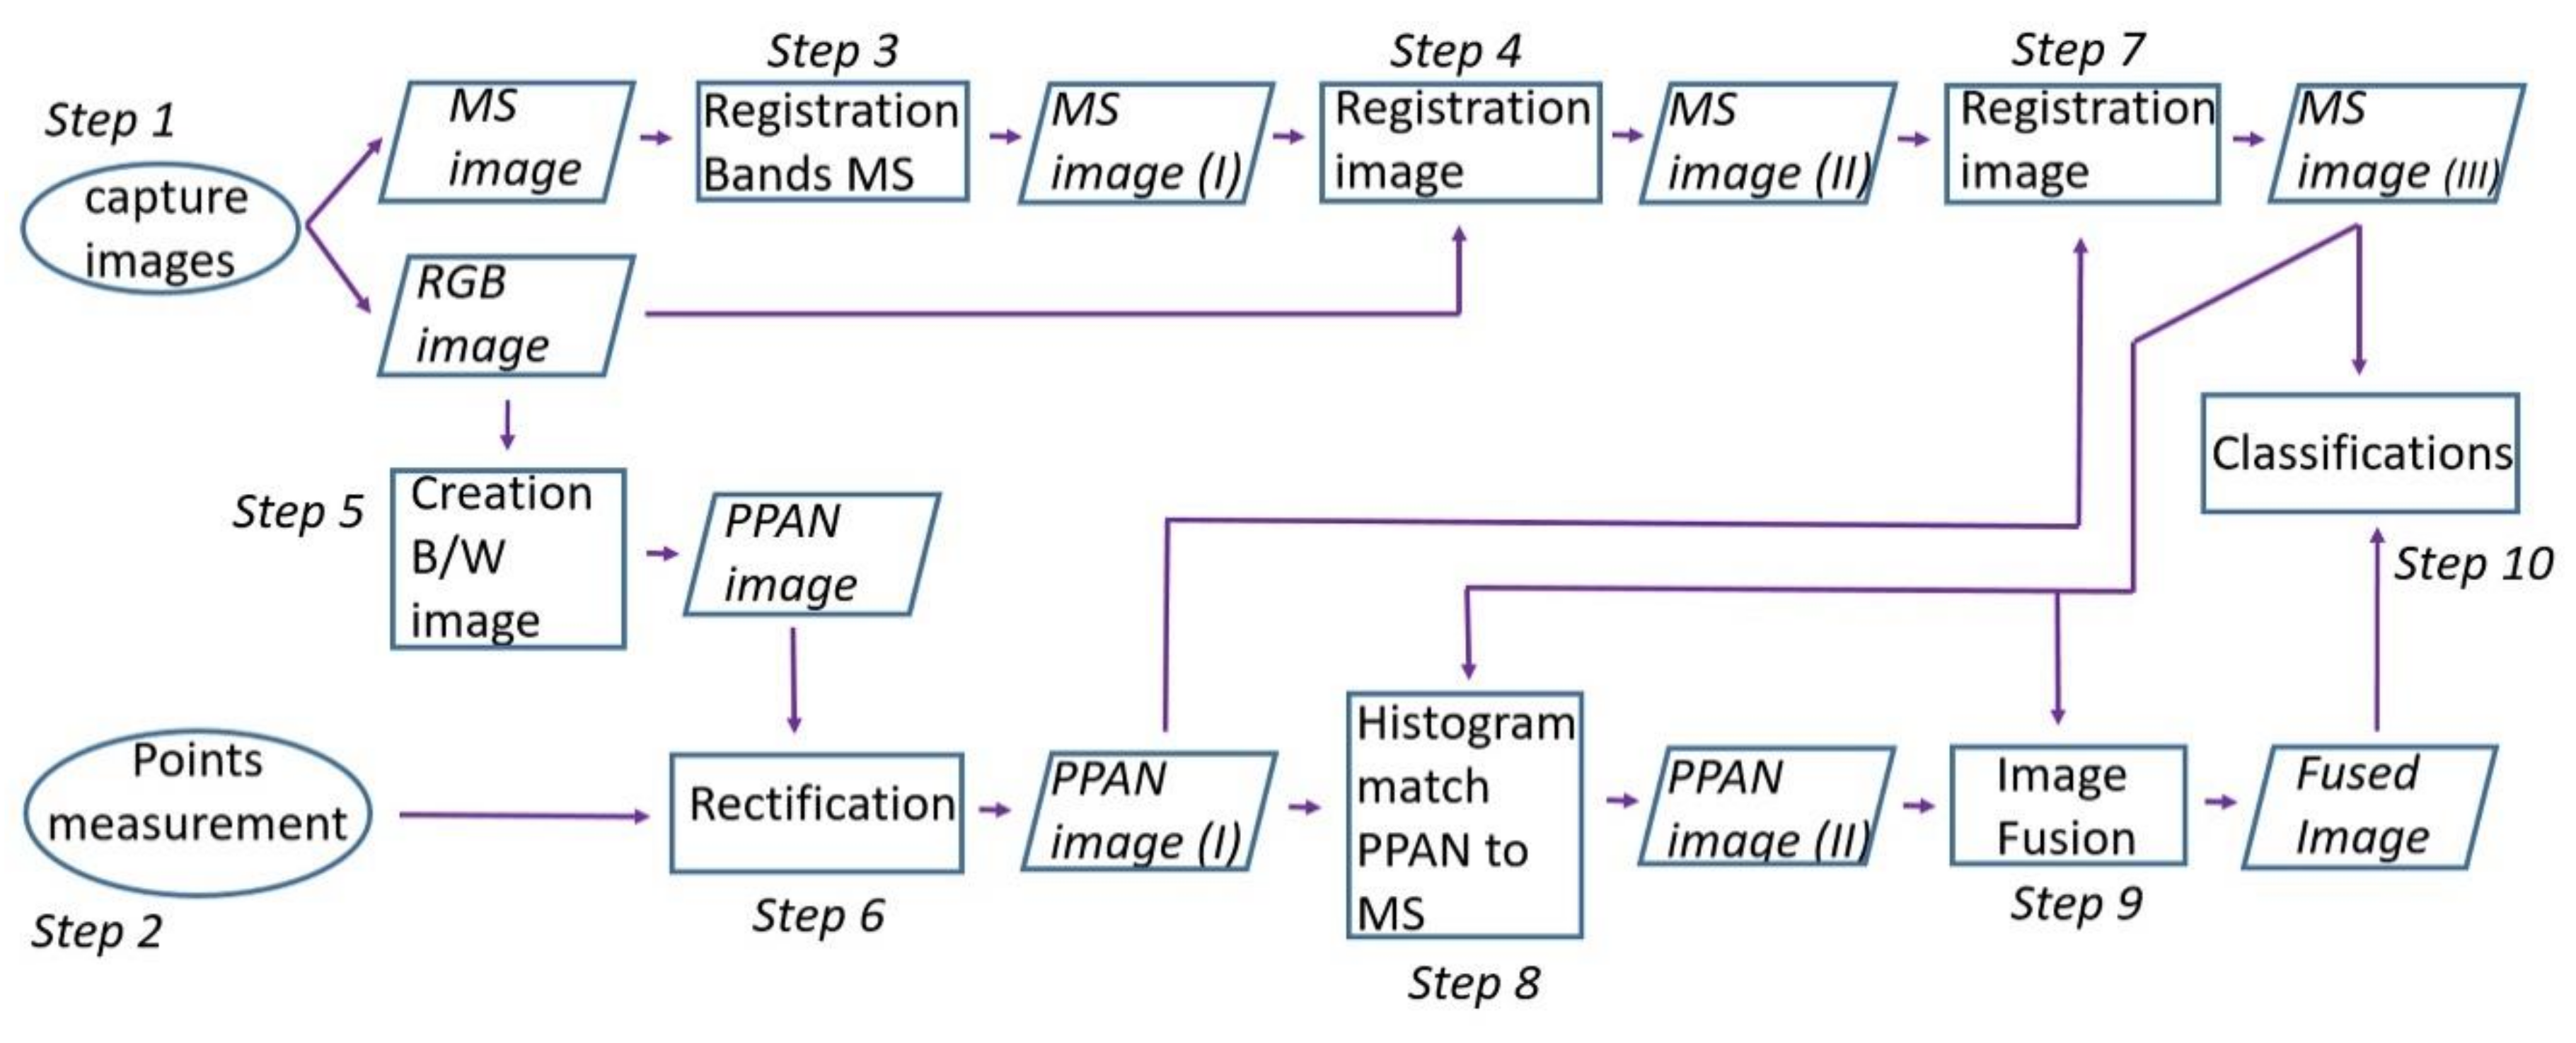
The following methodology (Figure 4) is about the processing of images of a scene, either of the ground image of the wall or the aerial image of the mosaic.
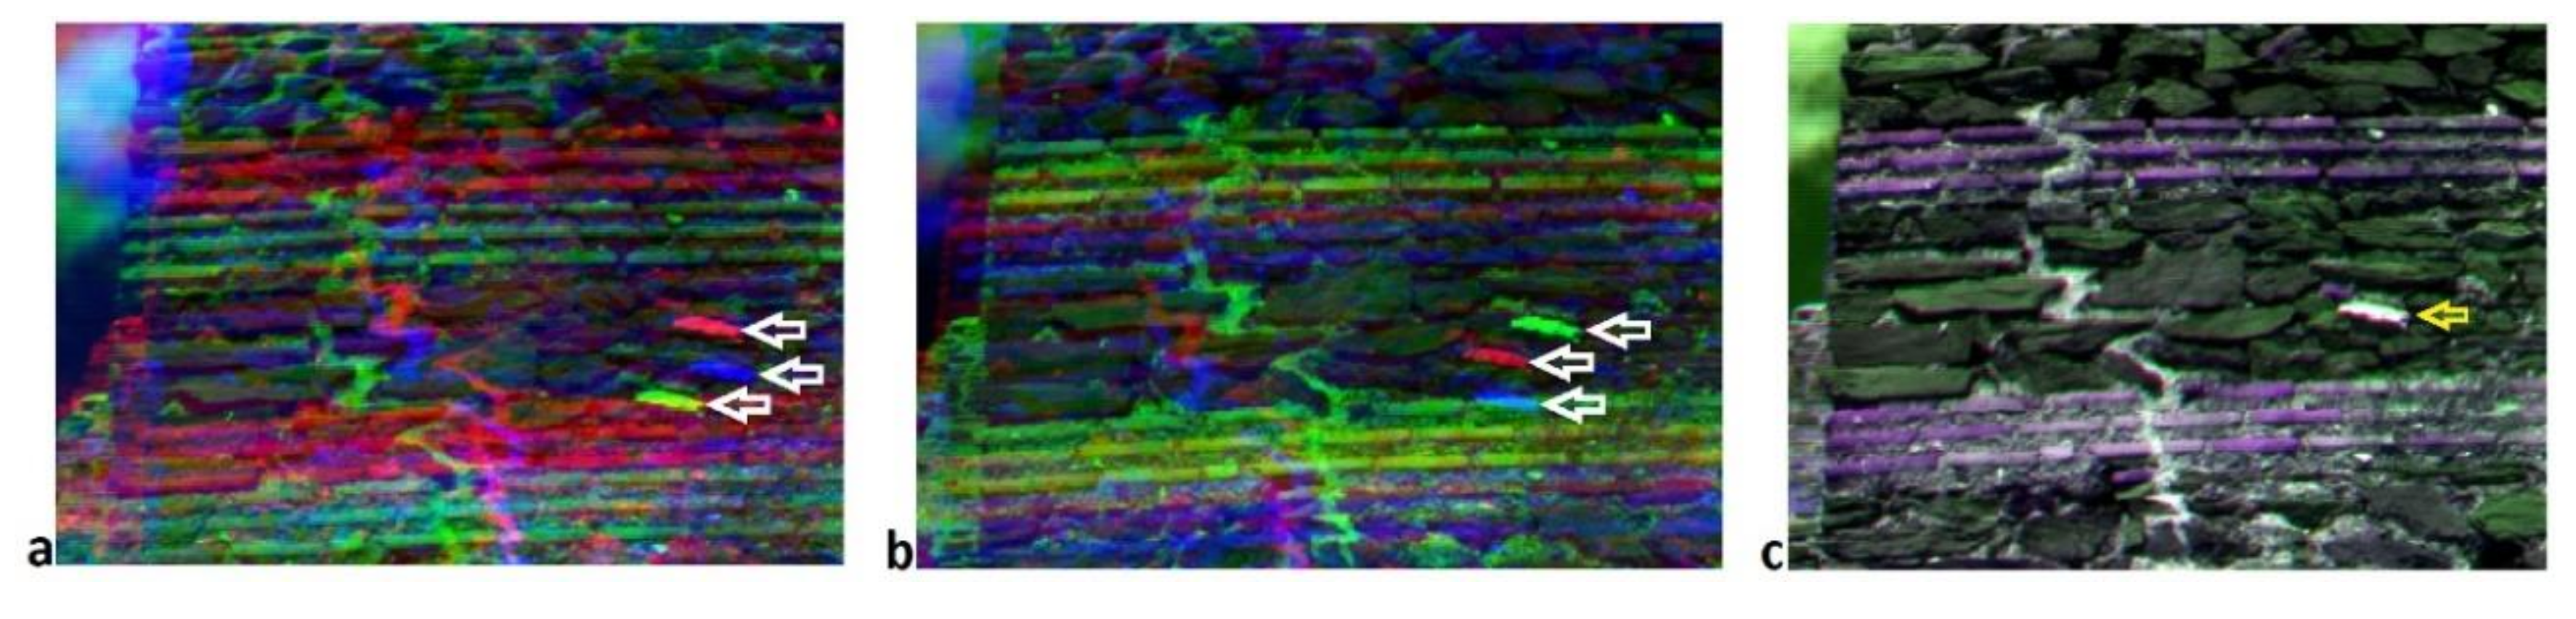
Discrete MS bands are recorded through a multilens structure by the majority of small MS cameras. Band misregistration errors result in differences in mounting positions and viewing angles among lenses (Figure 5a,b). Several image transform methods have been developed for dealing with the band co-registration of various types of small MS cameras to obtain band co-registered MS imagery for remote sensing applications [18]. In this paper, a common ‘‘image-to-image registration’’ process was performed (Figure 4: Step 3) with a first (1st) degree polynomial transformation. Specifically, the NIR image was used as the reference image and the other bands of the MS image (green, red, red edge) were adapted to this image, utilizing a sufficient number of corresponding points [18,61]. Subsequently, after the spatial matching between the MS image bands was restored, a new MS image was created (Figure 5c, Figure 4 product: MS image (I)), which also features four bands (green, red, red edge, NIR). The following step is the “registration” (Figure 4) of the new MS image in the RGB image (Step 4) in order to eliminate the lens distortion of the MS image bands (Figure 6), utilizing a sufficient number of corresponding points and applying a third (3rd) degree polynomial transformation (product: MS image (II)).
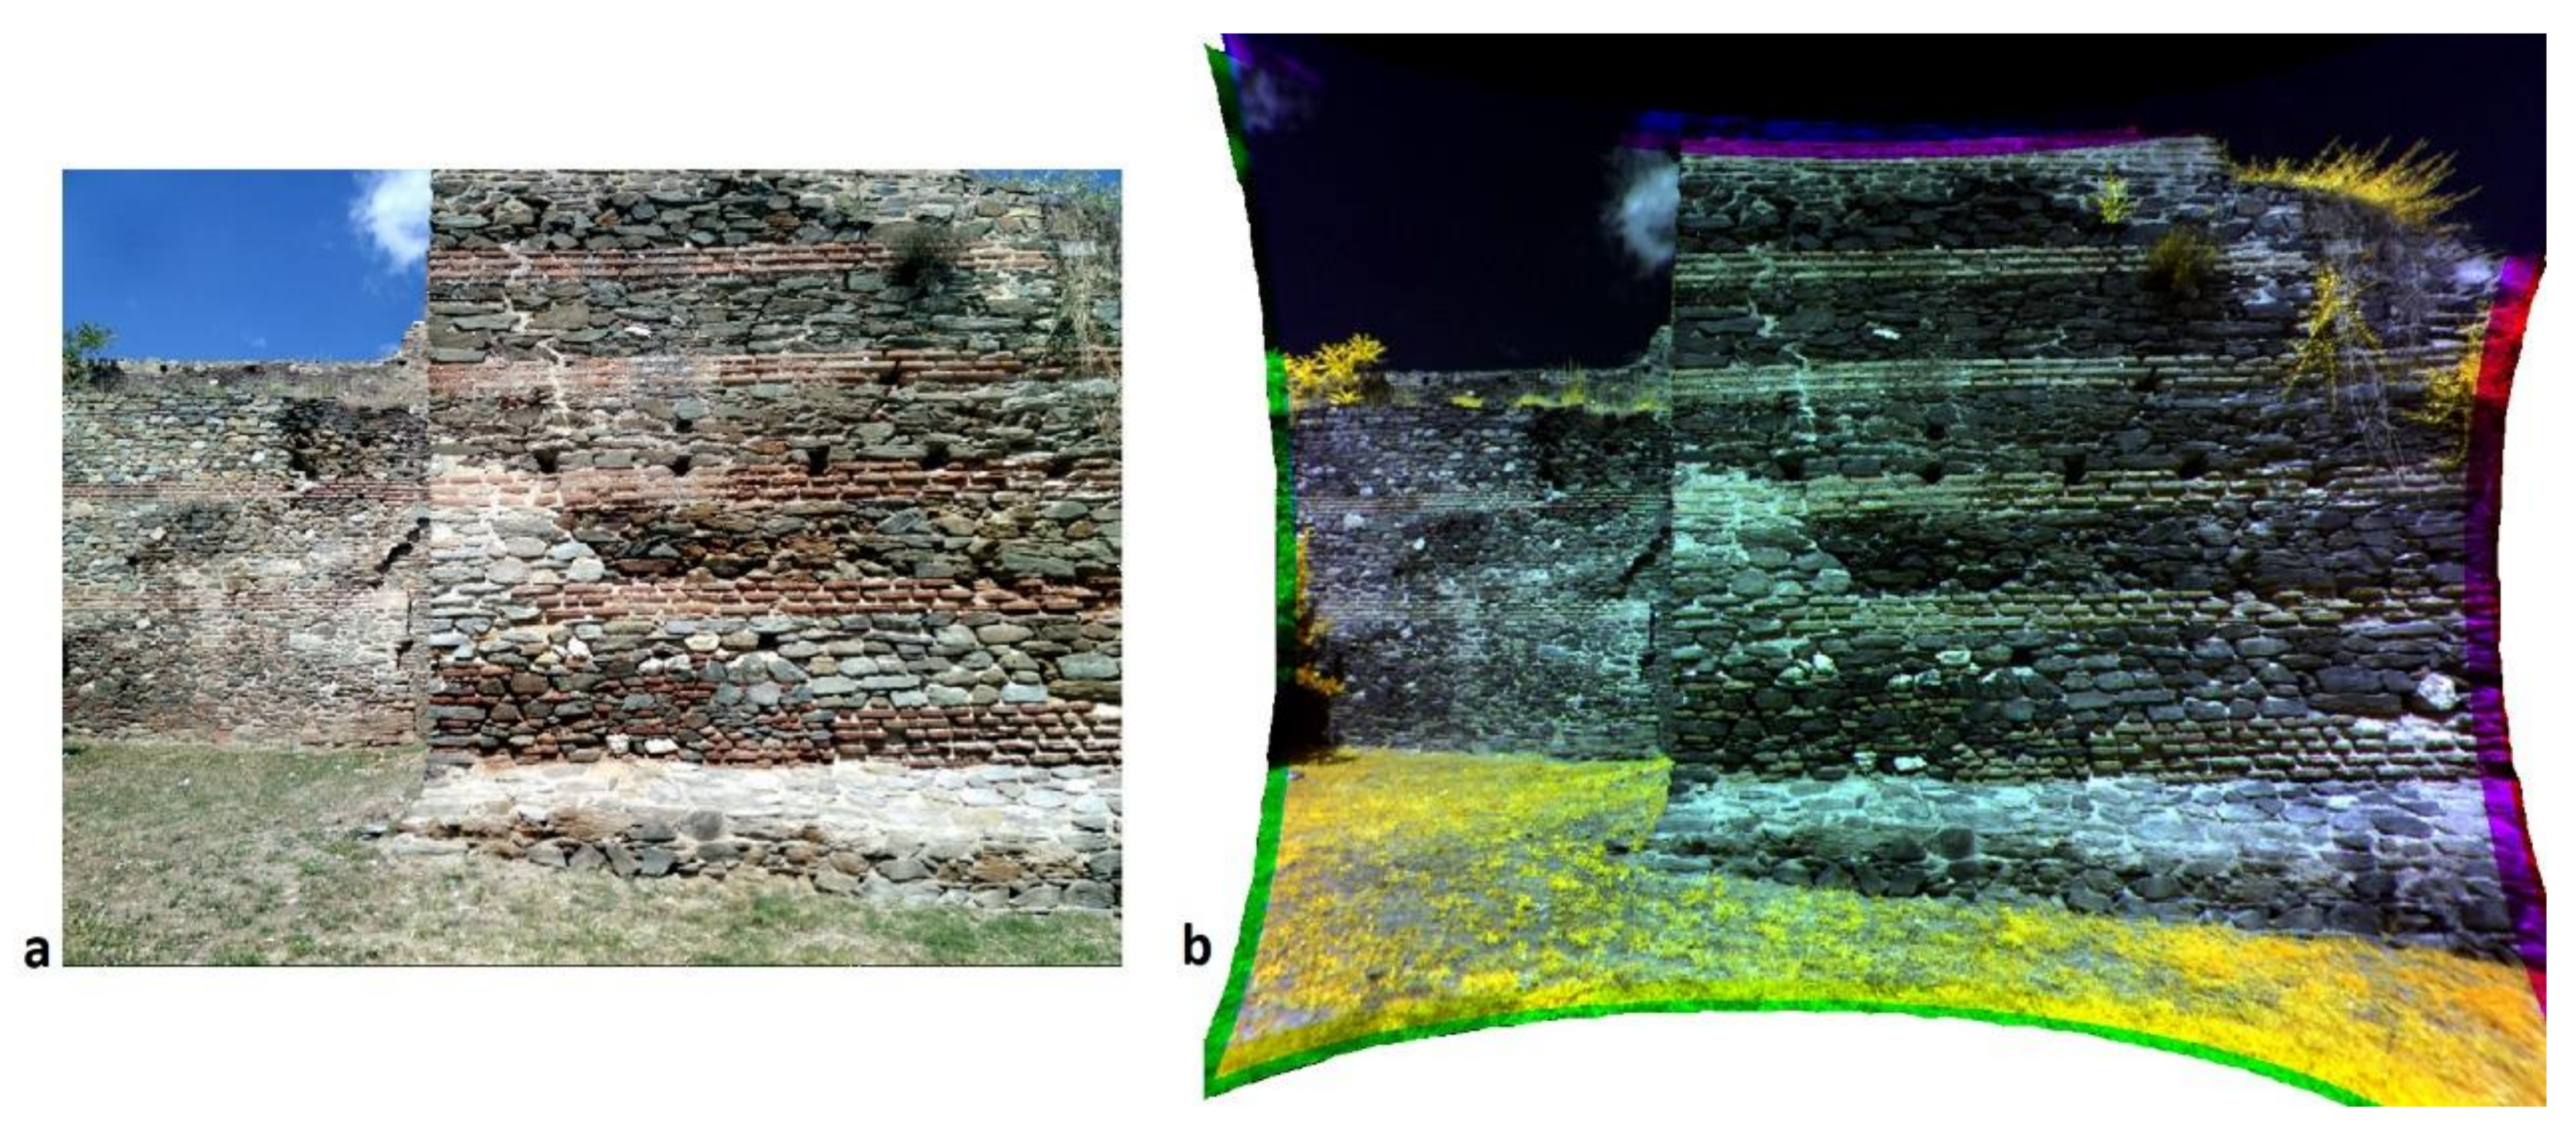
Sequoia+ does not include a PAN sensor. Following the satellite image processing procedures (where the satellites are equipped with a PAN sensor and utilize it in image fusion realization), the RGB image of the small MS was transformed into a Pseudo-Panchromatic (PPAN) image [62,63] (Step 5). The transformation resulted in a black and white (B/W) image (product: PPAN image) where the intensity value of each pixel is the average value of the corresponding pixels’ intensities of the R, G and B bands. Then (Step 6), the PPAN image was rectified using CPs. Finally, the geometrically corrected PPAN image (product: PPAN image (I)) was used as a reference image (‘‘image-to-image registration’’) for the rectification of the MS image from lens distortions and bands association errors (Step 7), utilizing a sufficient number of corresponding points (product: MS image (III)) [18,61].
Before the creation of the fused image, the histogram of the geometrically corrected PPAN image was adjusted to the histogram (Step 8) of the geometrically corrected MS image (product: PPAN image (II)). Then (Step 9) the fused image was created (derivative: fused image) using the PCA technique. The correlation table of the original geometrically corrected MS image (free of lens distortions and bands association errors) with the fused image revealed the retention rate of the original spectral information (which should be > 90%, i.e., >+0.9) [64,65,66]. Besides, as it has been supported by Ranchin et al. (2003), any synthetic image B*h should be as identical as possible to the image Bh that the corresponding sensor would observe with the highest resolution h, if existent [65]. In this case the limit is related to the degree of accuracy, which for our study areas is shown in the correlation tables. Finally (Step 10), for both the MS image and fused image, supervised classifications were performed (maximum likelihood) (products: classifications) and their accuracies were determined.
5. Results and Discussion
A first stage in the documentation of our cultural heritage (e.g., an ancient statue or an ancient settlement) is its measuring (dimensions) and thematic (kinds of materials/different objects) documentation. To this end, a variety of geoinformatic instruments/sensors have been used, such as, e.g., the laser scanner, the digital camera (terrestrial image and aerial photography: photogrammetry), the multispectral or hyperspectral sensor (e.g., satellite image: remote sensing). However, no instrument/sensor can be used in all applications, either because the spatial resolution of an instrument/sensor cannot meet the requirements of a research (e.g., the spatial resolution of satellite images is inferior to the spatial resolution of an aerial photography), or because digital object separation is required (e.g., digital automated separation can be carried out more accurately in a multispectral image than in a visual aerial photography). On the other hand, different sensor platforms of, e.g., satellites, airplanes, and UAVs, were used in the field of photogrammetry and remote sensing. Additionally, in this case, no platform can be used in all applications. For example, the satellite offers images which cover areas of countless square kilometers, an aircraft captures images of several square kilometers and a UAV captures images of either a few square kilometers or tens or hundreds of square meters. Additionally, an inaccessible area (e.g., a narrow canyon with rock formations) can be reached by a UAV, while this cannot be accomplished by an aircraft.
The appearance of small MS cameras opens up new fields of research in the sector of cultural heritage, as their dependence on large (e.g., glider) or small platforms (e.g., UAV) allows, apart from the thematic automated digital documentation of the objects, for their measurement with high spatial resolution due to the low flight height. This is achieved in parallel with the use of modern and user-friendly specialized and focused UAV image processing software (e.g., Pix4D, Switzerland, and Agisoft Metashape, Russia).
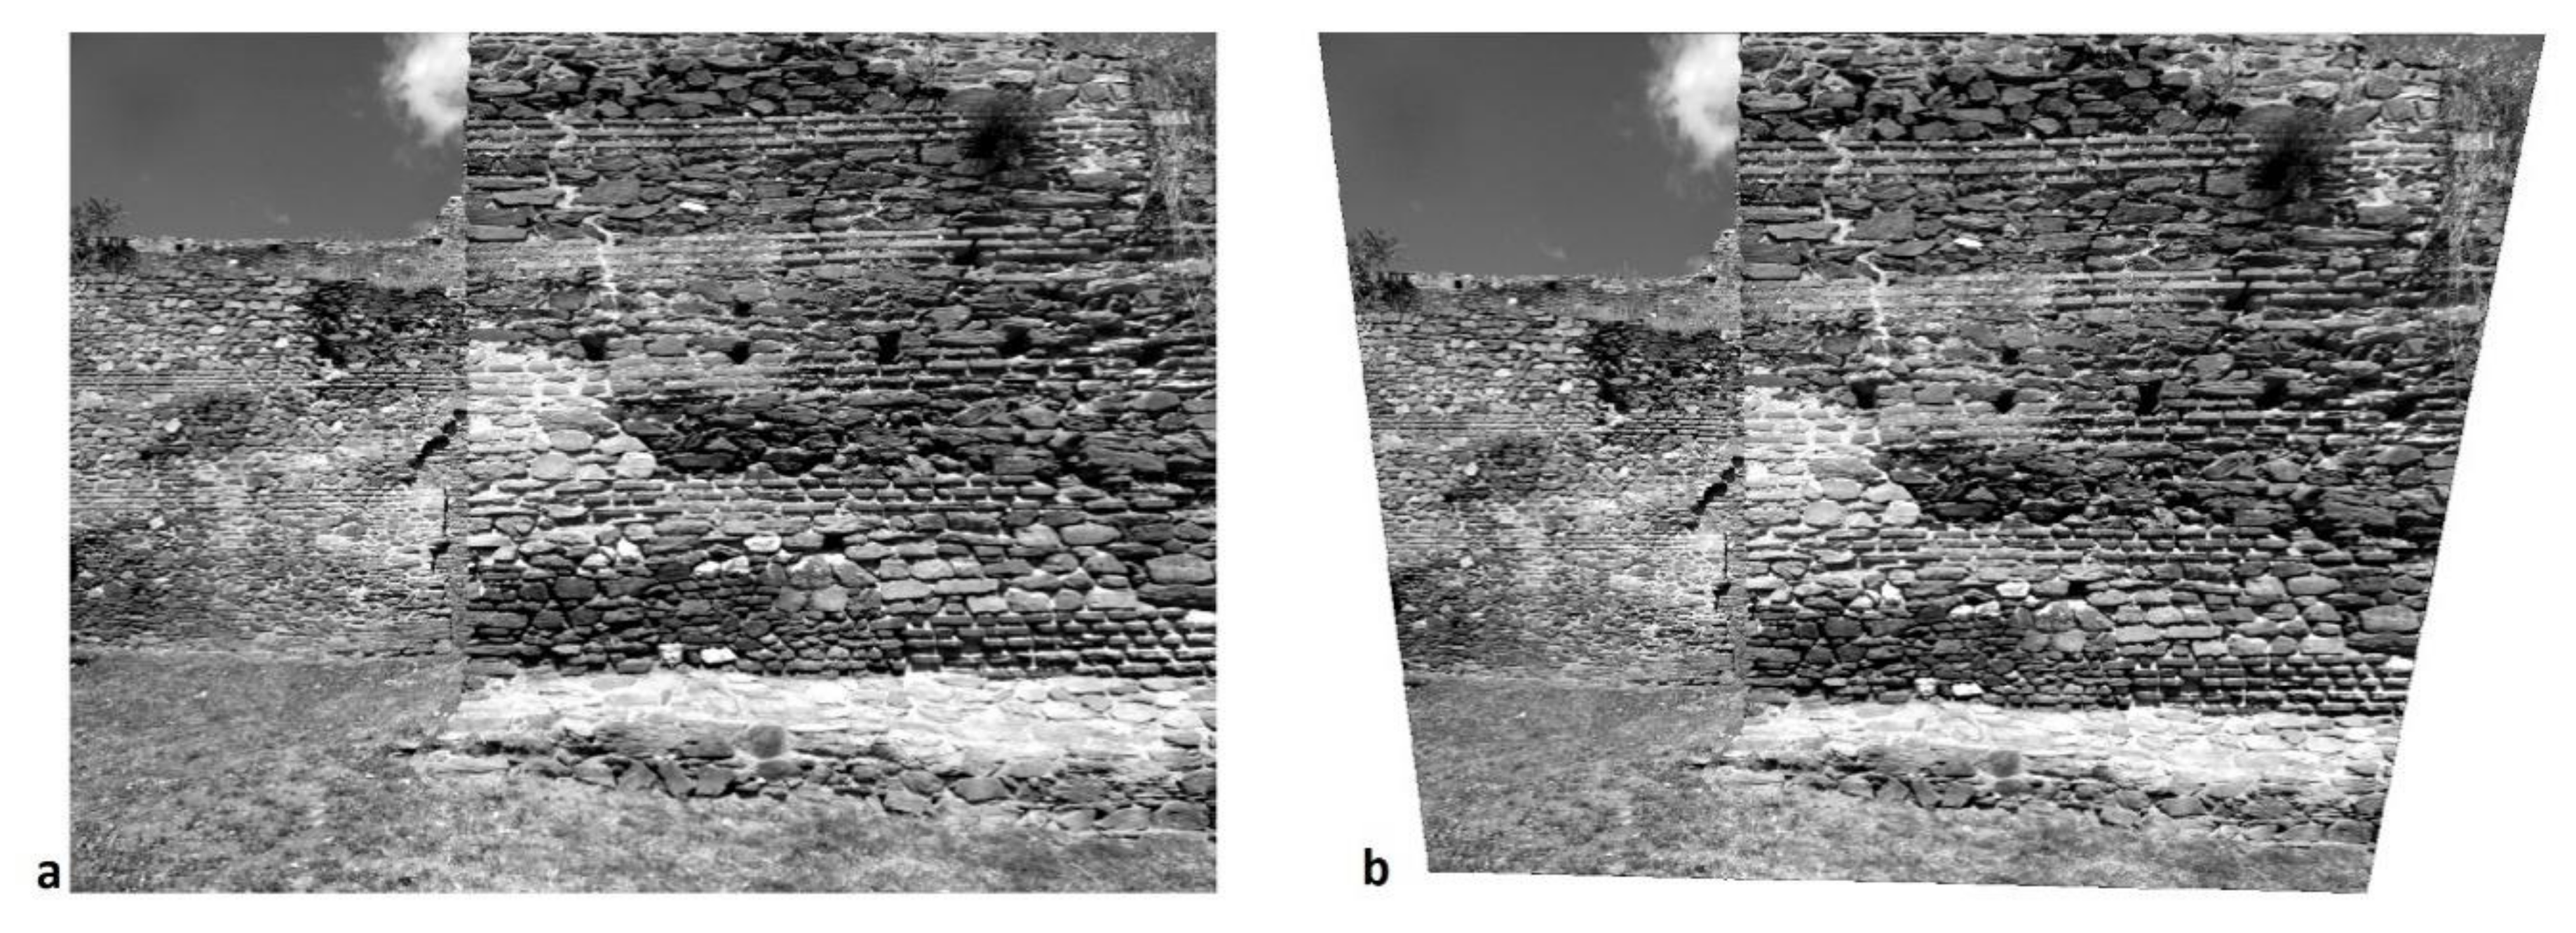
In the case of the wall and the mosaic, 16 corresponding points were used to associate each MS image band with the NIR band. Correlation accuracies were better than 0.004 pixels at both positions. In order to “register” the MS image bands in the corresponding RGB image, 16 tie points were used at both sites. The correlation accuracy was better than 0.013 pixels in the case of the wall and 0.090 pixels in the case of the mosaic. The rectification of the PPAN image of the wall was based on 22 CPs and the calculation accuracy of the unknown parameters of the rectification was 0.183 pixels, while the accuracy (RMSE) of the rectification was 5 pixels or 0.010 m (using eight check points). Correspondingly, in the case of the mosaic, 18 CPs were used and the calculation accuracy of the unknown parameters of the rectification was 0.086 pixels, while the accuracy (RMSE) of the rectification was 4 pixels or 0.004 m (using seven check points). The pixel size in the generated geometrically corrected PPAN image of the wall is 0.002 m (Figure 7b) and 0.001 m of the mosaic.
For the ‘‘register’’ of the free from lens distortion and correlation errors of the MS image bands with the corresponding geometrically corrected PPAN image, 22 corresponding points were utilized. The calculation accuracy of the unknown parameters of the rectification was 0.091 pixels (RMSE accuracy of the rectification was 3 pixels or 0.024 m, using eight check points), while the pixel size of the generated geometrically corrected MS image of the wall is 0.008 m. Correspondingly, in the case of the mosaic, 18 corresponding points were evaluated, the calculation accuracy of the unknown parameters of the rectification was 0.064 pixels (RMSE accuracy of the rectification was 2.5 pixels or 0.010 m, using seven check points), while the pixel size of the generated geometrically corrected MS image of the mosaic is 0.004 m.
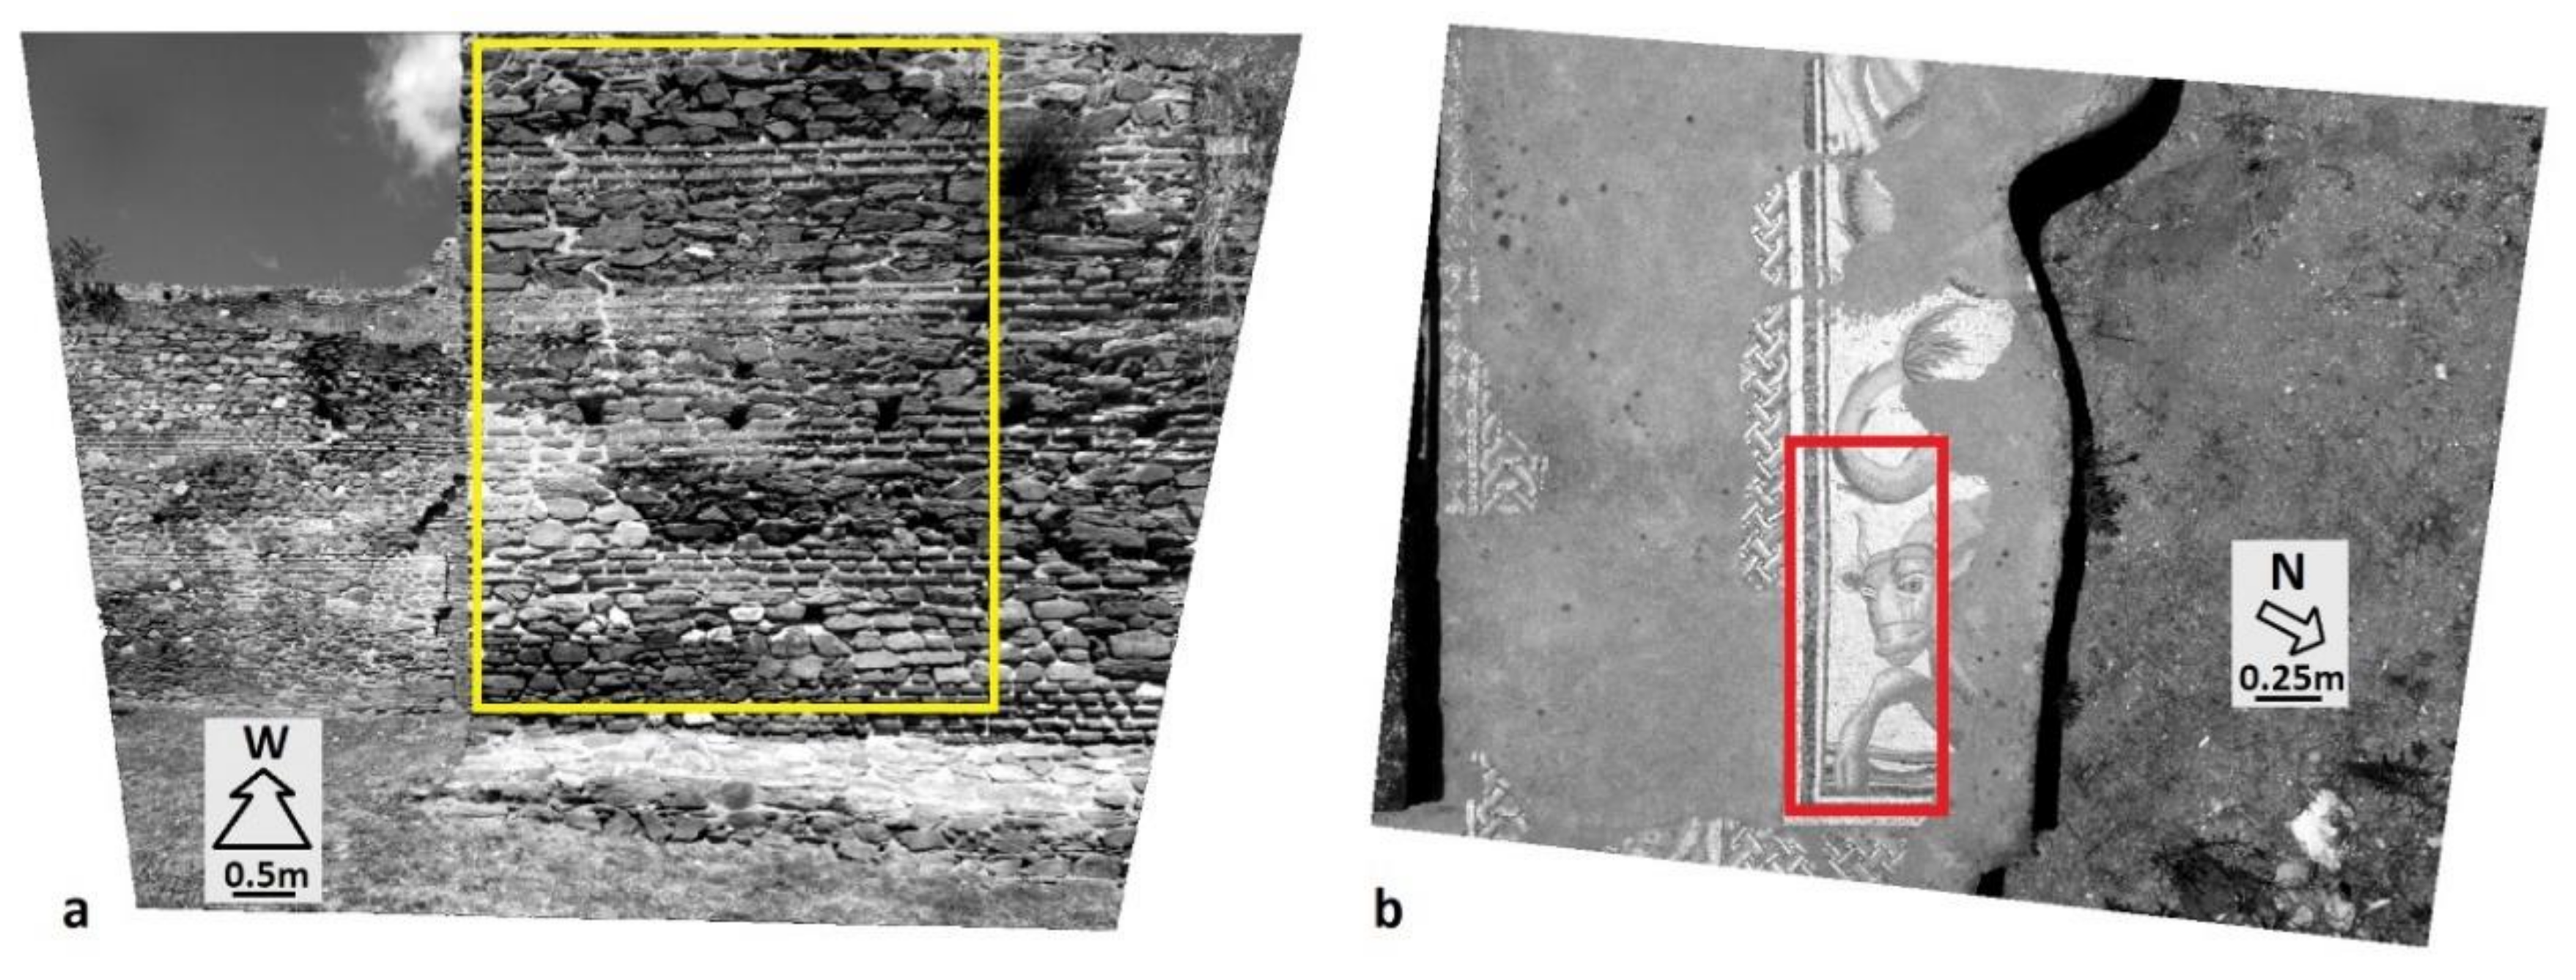
Representative sections of the wall and the mosaic (Figure 8) were selected (in both cases) for the creation and evaluation of the fused images. Another two techniques, besides the PCA method, have also been used (multiplacative and Brovey Transform) [6,62,67,68,69,70,71], which did not give better results in the retention of spectral information, and therefore are not analyzed in this paper. The spatial resolution of the generated fused image of the wall is 0.002 m (spatial resolution of the corresponding geometrically corrected PPAN image) and of the mosaic 0.001 m (spatial resolution of the corresponding geometrically corrected PPAN image).
The correlation tables reveal that the spectral information from the MS images to the corresponding fused images are transferred almost marginally (~90%, bold and italics on Table 2 and Table 3). The aspect that will be studied afterwards is whether this percentage is capable of leading to better accuracy classifications of fused images than those realized in MS images.
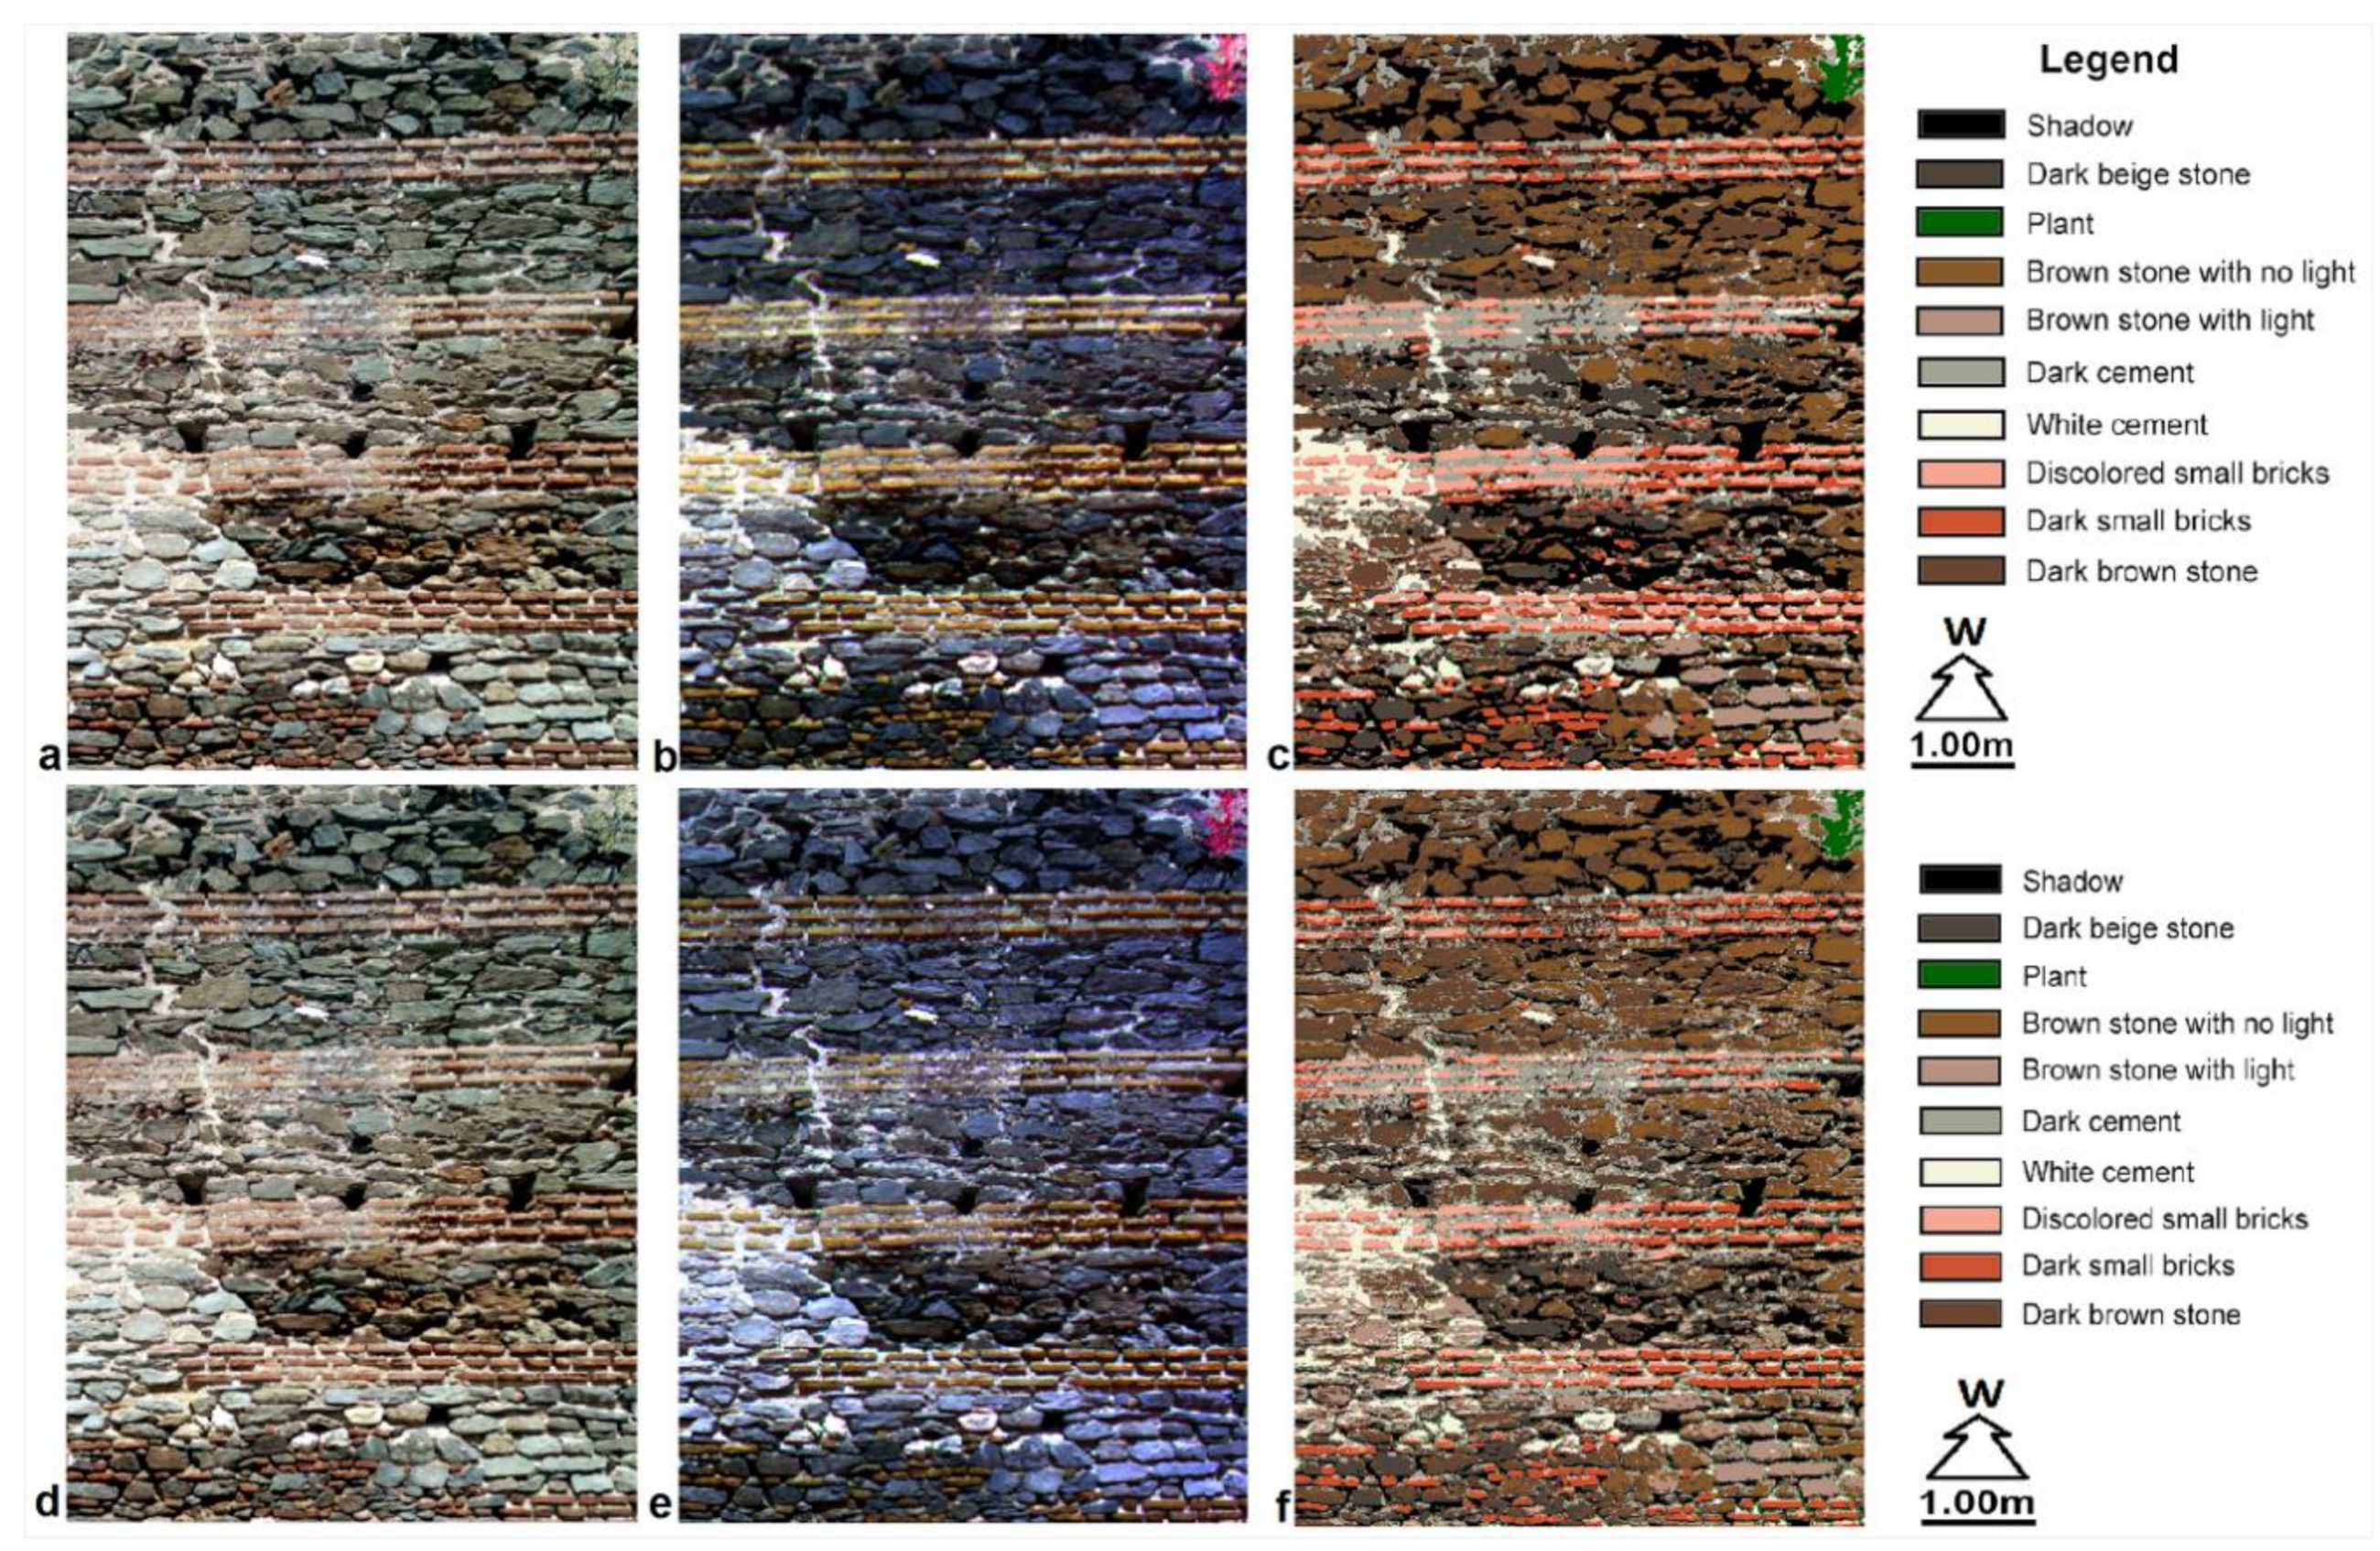
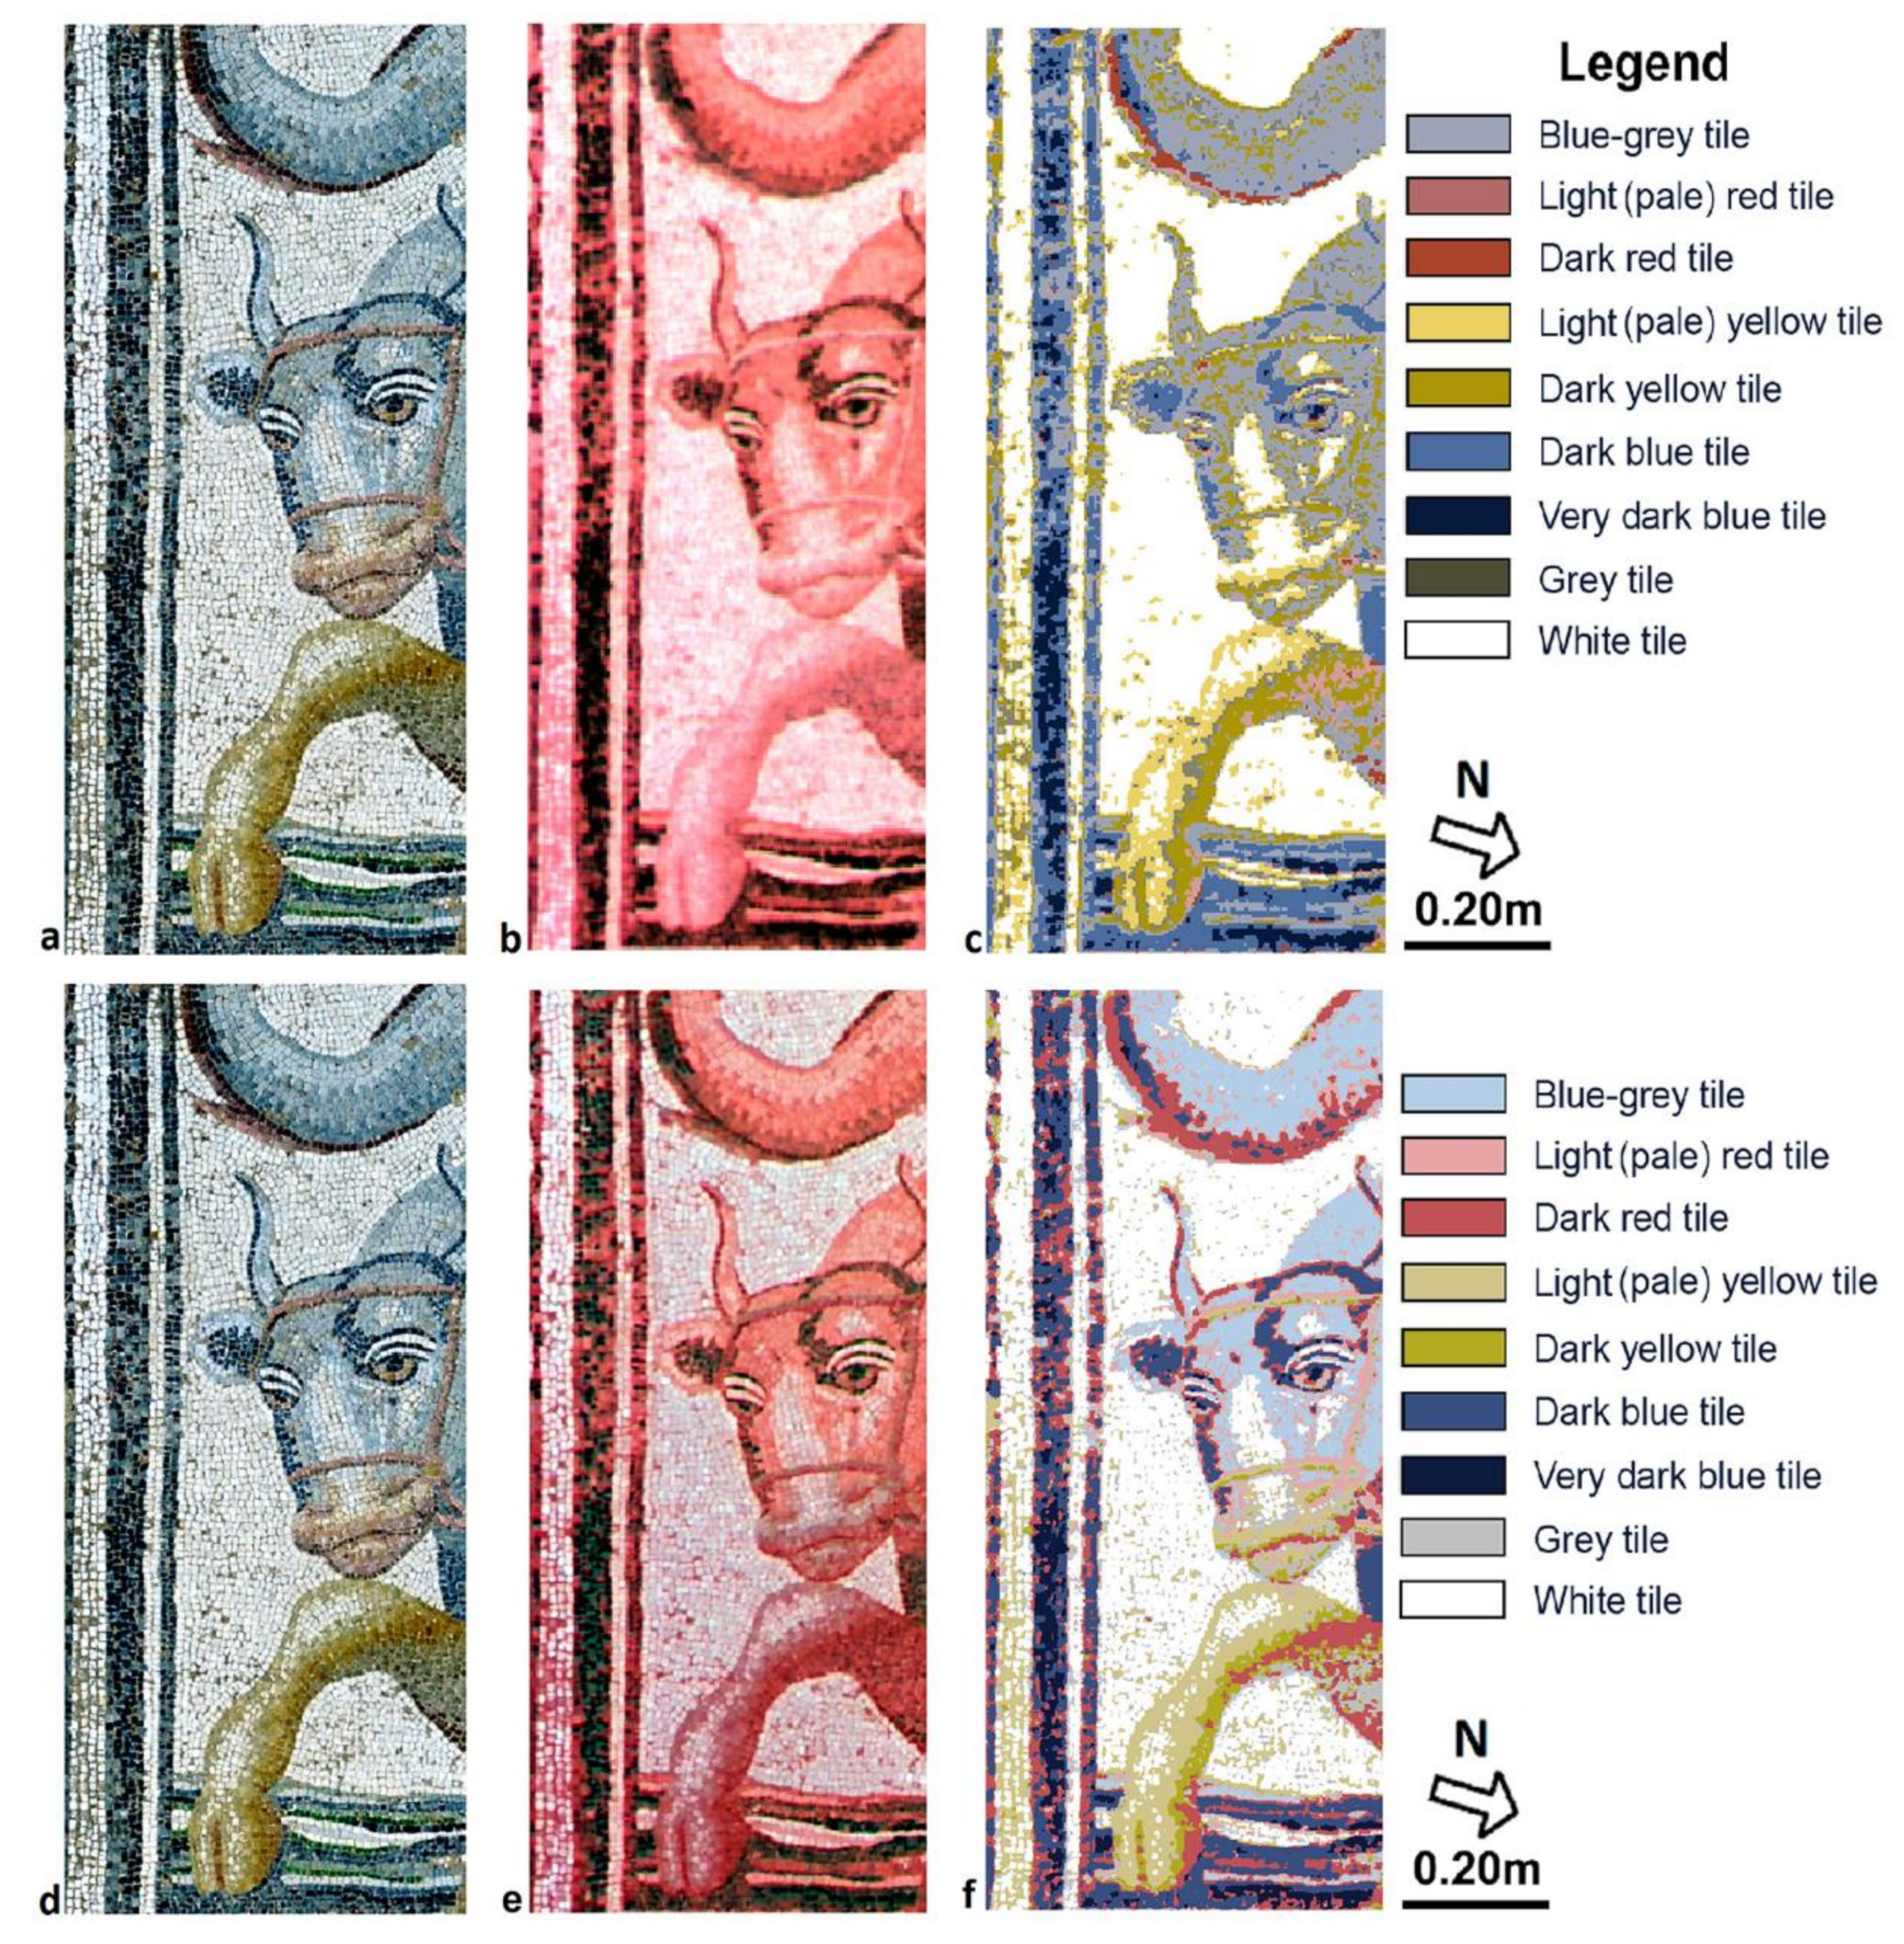
For the classification of the MS image and fused image (Figure 9 and Figure 10), 10 rows were selected, respectively, for the wall (Table 4), and 9 rows were selected, respectively, for the mosaic (Table 5). The classification accuracies (Table 4 and Table 5) reveal that the results are much better when using fused images. Specifically, the overall classification accuracy of the wall’s MS image reaches 81% (Table 4) and the overall Kappa statistics are 0.7927, while in the fused image of the wall the overall classification accuracy is 88% and the overall Kappa statistics are 0.8667. Correspondingly, the overall classification accuracy of the mosaic’s MS image reaches 69.60% (Table 5) and the overall Kappa statistics are 0.6836, while in the fused image of the mosaic the overall classification accuracy is 87.80% and the overall Kappa statistics are 0.8433. In addition, object identification is significantly much better in fused images (Figure 9b,e and Figure 10b,e comparison). Finally, the areas of each attribute identified in the images can be calculated (Table 6 and Table 7).
In addition to the above, in scope of comparing the fused with the MS images, the widespread ERGAS index (Erreur Relative Globale Adimensionnelle de Synthese or Relative Adimensional Global Error in Synthesis) was calculated. It was proposed by Wald (2002) and is capable of measuring the spectral difference between two images [40,72]. The Equation (1) of ERGAS is given as:
where h and l denote the spatial resolutions of the high-resolution (fused image) and the low-resolution image (MS), respectively. N corresponds to the number of spectral bands and k is the index of each band. RMSE (Bk) denotes the root-mean-square error for the k-band between the fused and the MS image. Μk denotes the mean of the k-band in the reference image.
The ERGAS index was applied to MS and fused images to detect any spectral differences between them. At first, random pixels (number of pixels: n) were selected at the same coordinates in each pair of images, from which values were obtained for each spectral band (Pi for MS and Oi for fused image). Afterwards, for these pixels, the root-mean-square error (RMSE) was calculated for each spectral band, according to the Equation (2):
Finally, the ERGAS index for all spectral bands was calculated according to the Equation (1). In the case of the wall, the result of the ERGAS index is equal to 1.93, while in the case of the mosaic it is equal to 0.95. These results prove that both fused images, as products, are of good quality as the total ERGAS error is small (ERGAS < 3). Moreover, the smaller the ERGAS error, the better the spectral quality of the image under study [40].
A very interesting issue for discussion is the PPAN image creation. In this paper, the authors choose the pixels intensity value of the PPAN image to be extracted from the mean intensities of the corresponding pixels of the R, G and B bands of the RGB image. Apparently, the PPAN image is not spectrally identical to the PAN image of a sensor that is sensitive to the visible area of the spectrum. Until now, transformation techniques of RGB images into B/W images have been developed based on the optimum visual perception of B/W images by the human [73,74,75,76] and not on the spectral approach of real PAN images. What the authors will attempt in the near future is to study whether the change of the weights in the bands intensity values (currently 1/3 for each band) when transforming the image from RGB to PPAN will allow the creation of better fused images and as a result will lead to better classification accuracies. This, in combination with the spectral identity of the image’s objects, is also of particular interest to study.
6. Conclusions
Small MS cameras and UAVs are widely used today in the scientific field of metric and thematic documentation of our cultural heritage. At the same time as UAVs evolve and improve, new compact sensors are being evolved and developed which, due to their small weight, can be placed on these platforms. As a result, their products (e.g., images) are tested and evaluated, on the one hand, for their ability to metrically and thematically document the objects, and on the other hand, for leading to the development of new methodologies and procedures. Through the two examples—the ground and aerial capture of different structures and objects, which are analyzed in the present paper—it is proved that the RGB image obtained by the small MS camera can be used, on the one hand, to improve the spatial resolution of MS images (which are taken simultaneously with the RGB image), and on the other hand, to reach more accurate classifications due to the utilization of the produced fused image. Specifically, in the case of the wall, the spatial resolution of the MS image improved from 0.008 to 0.002 m in the fused image, while the classification accuracy of 81% in the MS image reached 88% in the fused image. Correspondingly, in the case of the mosaic in Dion, the spatial resolution of the MS image improved from 0.004 to 0.001 m in the fused image, while the classification accuracy of 69.6% in the MS image reached 87.8% in the fused image. Through this methodology, a better metric and thematic documentation of the characteristics of our cultural heritage structures and objects is ensured, compared to that achieved by utilizing the original images of the small MS camera.
Author Contributions
Conceptualization, Supervision, D.K.; Data curation, Formal analysis, Investigation, Methodology, Validation, Visualization, Writing, D.K. and A.K. All authors have read and agreed to the published version of the manuscript.
Funding
This research received no external funding.
Conflicts of Interest
The authors declare no conflict of interest.
References
- Panda, C.B. Remote Sensing. Principles and Applications in Remote Sensing, 1st ed.; Viva Books: New Delhi, India, 1995; pp. 234–267. [Google Scholar]
- Schowengerdt, R.A. Remote Sensing: Models and Methods for Image Processing, 2nd ed.; FL Academic: Orlando, FL, USA, 1997. [Google Scholar]
- Bethune, S.; Muller, F.; Donnay, P.J. Fusion of multi-spectral and panchromatic images by local mean and variance matching filtering techniques. In Proceedings of the Second International Conference en Fusion of Earth Data, Nice, France, 28–30 January 1998; SEE/URISCA: Nice, France, 1998; pp. 31–36. [Google Scholar]
- Wald, L. Some terms of reference in data fusion. IEEE Trans. Geosci. Remote Sens. 1999, 37, 1190–1193. [Google Scholar] [CrossRef] [Green Version]
- Gonzalez, R.; Woods, R. Digital Image Processing, 2nd ed.; Prentice Hall: Upper Saddle River, NJ, USA, 2002. [Google Scholar]
- Choodarathnakara, L.A.; Ashok Kumar, T.; Koliwad, S.; Patil, G.C. Assessment of different fusion methods applied to remote sensing imagery. Int. J. Comput. Sci. Inf. Technol. 2012, 3, 5447–5453. [Google Scholar]
- Fonseca, L.; Namikawa, L.; Castejon, E.; Carvalho, L.; Pinho, C.; Pagamisse, A. Image Fusion for Remote Sensing Applications. In Image Fusion and Its Applications; Zheng, Y., Ed.; IntechOpen Rijeka: Rijeka, Croatia, 2011; pp. 153–178. [Google Scholar]
- Shi, W.; Zhu, C.; Tian, Y.; Nichol, J. Wavelet-based image fusion and quality assessment. Int. J. Appl. Earth Obs. Geoinf. 2005, 6, 241–251. [Google Scholar] [CrossRef]
- Zhang, H.K.; Huang, B. A new look at image fusion methods from a Bayesian perspective. Remote Sens. 2015, 7, 6828–6861. [Google Scholar] [CrossRef] [Green Version]
- Helmy, A.K.; El-Tawel, G.S. An integrated scheme to improve pan-sharpening visual quality of satellite images. Egypt. Inform. J. 2015, 16, 121–131. [Google Scholar] [CrossRef]
- Jelének, J.; Kopacˇková, V.; Koucká, L.; Mišurec, J. Testing a modified PCA-based sharpening approach for image fusion. Remote Sens. 2016, 8, 794. [Google Scholar] [CrossRef] [Green Version]
- Chavez, P.S.; Sides, S.C.; Anderson, J.A. Comparison of three different methods to merge multiresolution and multispectral data: Landsat TM and SPOT Panchromatic. Photogramm. Eng. Remote Sens. 1991, 57, 295–303. [Google Scholar]
- Fryskowska, A.; Wojtkowska, M.; Delis, P.; Grochala, A. Some Aspects of Satellite Imagery Integration from EROS B and LANDSAT 8. In Proceedings of the International Archives of the Photogrammetry, Remote Sensing and Spatial Information Sciences, Prague, Czech Republic, 12–19 July 2016; pp. 647–652. [Google Scholar]
- Kyo Seo, D.; Hyun Kim, Y.; Dam Eo, Y.; Hee Lee, M.; Yong Park, W. Fusion of SAR and multispectral images using random forest regression for change detection. ISPRS Int. J. Geo Inf. 2018, 7, 1–21. [Google Scholar]
- Erdogan, M.; Maras, H.H.; Yilmaz, A.; Özerbil, T.Ö. Resolution merge of 1:35.000 scale aerial photographs with Landsat 7 ETM imagery. In Proceedings of the International Archives of the Photogrammetry, Remote Sensing and Spatial Information Sciences, Beijing, China, 13–16 August 2008; International Society for Photogrammetry and Remote Sensing: Hannover, Germany, 2008; Volume XXXVII, Part B7; pp. 1281–1286. [Google Scholar]
- Stabile, M.; Odeh, I.; McBratney, A. Fusion of high-resolution aerial orthophoto with Landsat TM image for improved object-based land-use classification. In Proceedings of the 30th Asian Conference on Remote Sensing 2009 (ACRS 2009), Beijing, China, 18–23 October 2009; pp. 114–119. [Google Scholar]
- Siok, K.; Jenerowicz, A.; Woroszkiewicz, M. Enhancement of spectral quality of archival aerial photographs using satellite imagery for detection of land cover. J. Appl. Remote Sens. 2017, 11, 036001. [Google Scholar] [CrossRef]
- Jhan, J.P.; Rau, J.Y.; Norbert Haala, N. Robust and adaptive band-to-band image transform of UAS miniature multi-lens multispectral camera. ISPRS J. Photogramm. Remote Sens. 2018, 137, 47–60. [Google Scholar] [CrossRef]
- Nebiker, S.; Lack, N.; Abächerli, M.; Läderach, S. Light-weight multispectral UAV sensors and their capabilities for predicting grain yield and detecting plant diseases. In Proceedings of the International Archives of the Photogrammetry, Remote Sensing and Spatial Information Sciences, Prague, Czech Republic, 12–19 July 2016; XXIII ISPRS Congress; International Society for Photogrammetry and Remote Sensing: Hannover, Germany, 2016; Volume XLI-B1, pp. 963–970. [Google Scholar]
- Zeng, C.; King, J.D.; Richardson, M.; Shan, B. Fusion of multispectral imagery and spectrometer data in UAV remote sensing. Remote Sens. 2017, 9, 696. [Google Scholar] [CrossRef] [Green Version]
- Adão, T.; Hruška, J.; Pádua, L.; Bessa, J.; Peres, E.; Morais, R.; João Sousa, J. Hyperspectral imaging: A review on UAV-Based sensors, data processing and applications for agriculture and forestry. Remote Sens. 2017, 9, 1110. [Google Scholar] [CrossRef] [Green Version]
- Moriarty, C.; Cowley, D.C.; Wade, T.; Nichol, C. Deploying multispectral remote sensing for multitemporal analysis of archaeological crop stress at Ravenshall, Fife, Scotland. Archaeol. Prospect. 2018, 6, 1–14. [Google Scholar] [CrossRef]
- Koucká, L.; Kopačková, V.; Fárová, K.; Gojda, M. UAV mapping of an archaeological site using RGB and NIR high-resolution data. Proceedings 2018, 2, 5164. [Google Scholar] [CrossRef] [Green Version]
- Geipel, J.; Link, J.; Wirwahn, A.J.; Claupein, W. A programmable aerial multispectral camera system for in-season crop biomass and nitrogen content estimation. Agriculture 2016, 6, 4. [Google Scholar] [CrossRef] [Green Version]
- Cowley, C.D.; Moriarty, C.; Geddes, G.; Brown, L.G.; Wade, T.; Nichol, J.C. UAVs in context: Archaeological airborne recording in a national body of survey and record. Drones 2018, 2, 2. [Google Scholar] [CrossRef] [Green Version]
- Montes de Oca, A.; Arreola, L.; Flores, A.; Sanchez, J.; Flores, G. Low-cost multispectral imaging system for crop monitoring. In Proceedings of the ICUAS’18: The 2018 International Conference on Unmanned Aircraft Systems, At Dallas, TX, USA, 12–15 June 2018; pp. 443–451. [Google Scholar]
- Pohl, C.; Van Genderen, J.L. Multisensor image fusion in remote sensing: Concepts, methods and applications. Int. J. Remote Sens. 1998, 19, 823–854. [Google Scholar] [CrossRef] [Green Version]
- Jiang, D.; Zhuang, D.; Huang, Y.; Fu, J. Advances in multi-sensor data fusion: Algorithms and applications. Sensors 2009, 9, 7771–7784. [Google Scholar]
- Jiang, D.; Zhuang, D.; Huang, Y.; Fu, J. Survey of Multispectral Image Fusion Techniques in Remote Sensing Applications. In Image Fusion and Its Applications; Zheng, Y., Ed.; InTech open: Rijeka, Croatia, 2011; pp. 1–22. [Google Scholar]
- Pohl, C. Tools and methods for fusion of images of different spatial resolution. In Proceedings of the International Archives of Photogrammetry and Remote Sensing, Valladolid, Spain, 3–4 June 1999; (Part 7-4-3 W6); International Society for Photogrammetry and Remote Sensing: Hannover, Germany, 1999; Volume 32, pp. 1–5. [Google Scholar]
- Klonus, S.; Ehlers, M. Performance of evaluation methods in image fusion. In Proceedings of the 12th International Conference on Information Fusion, Seattle, Washington, WA, USA, 6–9 July 2009; pp. 1409–1416. [Google Scholar]
- Zhang, Y. Understanding Image Fusion. Photogramm. Eng. Remote Sens. 2004, 70, 657–661. [Google Scholar]
- Aiazzi, B.; Baronti, S.; Selva, M. Improving component substitution pansharpening through multivariate regression of MS + Pan data. IEEE Trans. Geosci. Remote Sens. 2007, 45, 3230–3239. [Google Scholar] [CrossRef]
- Zhou, Y. Principal Component Analysis Based Image Fusion Routine with Application to Stamping Split Detection. Ph.D. Thesis, Clemson University, Clemson, SC, USA, 2010. [Google Scholar]
- Grochala, A.; Kedzierski, M. A method of panchromatic image modification for satellite imagery data fusion. Remote Sens. 2017, 9, 639. [Google Scholar] [CrossRef] [Green Version]
- Ehlers, M. Multi-image fusion in Remote Sensing: Spatial enhancement vs. spectral characteristics preservation. In Advances in Visual Computing; ISVC 2008; Lecture Notes in Computer Science: Berlin/Heidelberg, Germany; Bebis, G., Boyle, R., Parvin, B., Koracin, D., Remagnino, P., Porikli, F., Peters, J., Klosowski, J., Arns, L., Chun, K.Y., Eds.; Springer: Berlin/Heidelberg, Germany, 2008; pp. 75–84. [Google Scholar]
- Klonus, S.; Ehlers, M. Image fusion using the Ehlers spectral characteristics preservation algorithm. GIScience Remote Sens. 2007, 44, 93–116. [Google Scholar] [CrossRef]
- Ehlers, M.; Klonus, S.; Åstrand, P.J.; Rosso, P. Multi-sensor image fusion for pansharpening in remote sensing. Int. J. Image Data Fusion 2010, 1, 25–45. [Google Scholar] [CrossRef]
- Jagalingam, P.; Hegde, A.V. A review of quality metrics for fused image. Aquat. Procedia 2015, 4, 133–142. [Google Scholar] [CrossRef]
- Wald, L. Data Fusion. Definitions and Architectures-Fusion of Images of Different Spatial Resolutions; Presses del’Ecole, Ecole de Mines de Paris: Paris, France, 2002. [Google Scholar]
- Zhou, J.; Civco, D.L.; Silander, J.A. A wavelet transform method to merge Landsat TM and SPOT panchromatic data. Int. J. Remote Sens. 1998, 19, 743–757. [Google Scholar] [CrossRef]
- Jensen, J.R. Introductory Digital Image Processing: A Remote Sensing Perspective, 3rd ed.; Pearson Education, Inc.: Upper Saddle River, NJ, USA, 2005. [Google Scholar]
- Shao, Y.; Lunetta, S.R.; Wheeler, B.; Iiames, S.J.; Campbell, B.J. An evaluation of time-series smoothing algorithms for land-cover classifications using MODIS-NDVI multi-temporal data. Remote Sens. Environ. 2016, 174, 258–265. [Google Scholar] [CrossRef]
- Li, M.; Zang, S.; Zhang, B.; Li, S.; Wu, C. A review of remote sensing image classification techniques: The role of spatio-contextual information. Eur. J. Remote Sens. 2014, 47, 389–411. [Google Scholar] [CrossRef]
- Lu, D.; Weng, Q. A survey of image classification methods and techniques for improving classification performance. Int. J. Remote Sens. 2007, 28, 823–870. [Google Scholar] [CrossRef]
- Mishra, P.; Singh, D. A statistical-measure-based adaptive land cover classification algorithm by efficient utilization of polarimetric SAR observables. IEEE Trans. Geosci. Remote Sens. 2014, 52, 2889–2900. [Google Scholar] [CrossRef]
- Blaschke, T. Object based image analysis for remote sensing. ISPRS J. Photogramm. Remote Sens. 2010, 65, 2–16. [Google Scholar] [CrossRef] [Green Version]
- Eugenidou, D. Castles of Macedonia and Thrace; Adam Publications: Athens, Greece, 1998; pp. 119–129. [Google Scholar]
- Odysseus. Ministry of Culture and Sports: Dion. 2012. Available online: http://odysseus.culture.gr/h/3/eh352.jsp?obj_id=2508 (accessed on 4 August 2020).
- Odysseus. Ministry of Culture and Sports: Great Thermai of Dion. 2012. Available online: http://odysseus.culture.gr/h/2/eh251.jsp?obj_id=976 (accessed on 4 August 2020).
- Pantermalis, D. For All the Mosaics of the Dionysus Villa. Dion: The Discovery; Adam Publications: Athens, Greece, 1999; pp. 173–183, 186–187, 190, 194–195. [Google Scholar]
- Alevizou, E. Mosaics with Pictorial Representations in Warm Baths of the Roman Imperial Period. Ph.D. Thesis, Aristotle University of Thessaloniki, Thessaloniki, Greece, 2010. [Google Scholar]
- Topcon. OS Series Total Stations: Specifications. 2019. Available online: https://topconcare.com/en/hardware/optical/os-series-total-stations/specifications/ (accessed on 4 August 2020).
- Parrot. Parrot Sequoia+. 2019. Available online: https://www.parrot.com/business-solutions-us/parrot-professional/parrot-sequoia (accessed on 4 August 2020).
- Pix4D. Learn More about Sequoia+. 2019. Available online: https://www.pix4d.com/product/sequoia/faq (accessed on 24 April 2020).
- Fenger-Nielsen, R.; Hollesen, J.; Matthiesen, H.; Sherman Andersen, E.A.; Westergaard-Nielsen, A.; Harmsen, H.; Michelsen, A.; Elberling, B. Footprints from the past: The influence of past human activities on vegetation and soil across five archaeological sites in Greenland. Sci. Total Environ. 2019, 654, 895–905. [Google Scholar] [CrossRef] [PubMed]
- Brooke, C.; Clutterbuck, B. Mapping heterogeneous buried archaeological features using multisensor data from unmanned aerial vehicles. Remote Sens. 2020, 12, 41. [Google Scholar] [CrossRef] [Green Version]
- Hill, A.C.; Laugier, E.J.; Casana, J. Archaeological remote sensing using multi-temporal, drone-acquired thermal and near infrared (NIR) imagery: A case study at the enfield shaker village, New Hampshire. Remote Sens. 2020, 12, 690. [Google Scholar] [CrossRef] [Green Version]
- McLeester, M.; Casana, J.; Schurr, M.R.; Hill, A.C.; Wheeler, J., III. Detecting prehistoric landscape features using thermal, multispectral, and historical imagery analysis at Midewin National Tallgrass Prairie, Illinois. J. Archaeol. Sci. Rep. 2018, 21, 450–459. [Google Scholar] [CrossRef]
- Kaimaris, D.; Karadedos, G.; Georgiadis, C.; Patias, P. Locating and mapping the traces of the covered ancient theater of amphipolis (Eastern Macedonia, Greece). Heritage 2018, 1, 20. [Google Scholar] [CrossRef] [Green Version]
- Jhan, J.P.; Rau, J.Y.; Haala, N.; Cramer, M. Investigation of parallax issues for multi-lens multispectral camera band co-registration. In Proceedings of the International Archives of the Photogrammetry, Remote Sensing and Spatial Information Sciences, 2017 International Conference on Unmanned Aerial Vehicles in Geomatics, Bonn, Germany, 4–7 September 2017; International Society for Photogrammetry and Remote Sensing: Hannover, Germany, 2017; Volume XLII-2/W6, pp. 157–163. [Google Scholar]
- González-Audícana, M.; Saleta, J.L.; Catalán, G.R.; García, R. Fusion of multispectral and panchromatic images using improved IHS and PCA mergers based on wavelet decomposition. IEEE Trans. Geosci. Remote Sens. 2004, 42, 1291–1299. [Google Scholar] [CrossRef]
- Choi, J.; Yu, K.; Kim, Y. A new adaptive component-substitution-based satellite image fusion by using partial replacement. IEEE Trans. Geosci. Remote Sens. 2011, 49, 295–309. [Google Scholar] [CrossRef]
- Wald, L.; Ranchin, T.; Mangolini, M. Fusion of satellite images of different spatial reso-lutions: Assessing the quality of resulting images. Photogrammetric engineering and remote sensing. ASPRS 1997, 63, 691–699. [Google Scholar]
- Ranchin, T.; Aiazzi, B.; Alparone, L.; Baronti, S.; Wald, L. Image fusion—The ARSIS concept and some successful implementation schemes. ISPRS J. Photogramm. Remote Sens. 2003, 58, 4–18. [Google Scholar] [CrossRef] [Green Version]
- Otazu, X.; González-Audícana, M.; Fors, O.; Núñez, J. Introduction of sensor spectral response into image fusion methods-application to wavelet-based methods. IEEE Trans. Geosci. Remote Sens. 2005, 43, 2376–2385. [Google Scholar] [CrossRef] [Green Version]
- Liu, J.G. Smoothing filter-based intensity modulation: A spectral preserve image fusion technique for improving spatial details. Int. J. Remote Sens. 2000, 21, 3461–3472. [Google Scholar] [CrossRef]
- Wang, Z.; Ziou, D.; Armenakis, C. A comparative analysis of image fusion methods. IEEE Trans. Geosci. Remote Sens. 2005, 43, 1391–1402. [Google Scholar] [CrossRef]
- Helmy, A.K.; Nasr, H.A.; El-Taweel, S.G. Assessment and evaluation of different data fusion techniques. Int. J. Comput. 2010, 4, 107–115. [Google Scholar]
- Susheela, D.; Pradeep, K.G.; Mahesh, K.J. A comparative study of various pixel based image fusion techniques as applied to an urban environment. Int. J. Image Data Fusion 2013, 4, 197–213. [Google Scholar]
- Jong-Song, J.; Jong-Hun, C. Application effect analysis of image fusion methods for extraction of shoreline in coastal zone using Landsat ETM+. Atmos. Ocean. Sci. 2017, 1, 1–6. [Google Scholar]
- Gao, F.; Li, B.; Xu, Q.; Zhong, C. Moving vehicle information extraction from single-pass worldview-2 imagery based on ERGAS-SNS analysis. Remote Sens. 2014, 6, 6500–6523. [Google Scholar] [CrossRef] [Green Version]
- Kumar, T.; Verma, K. A theory based on conversion of RGB image to Gray image. Int. J. Comput. Appl. 2010, 7, 7–10. [Google Scholar] [CrossRef]
- Pramod Kaler, P. Study of grayscale image in image processing. Int. J. Recent Innov. Trends Comput. Commun. 2016, 4, 309–311. [Google Scholar]
- Azzeh, A.L.J.; Alhatamleh, H.; Alqadi, A.Z.; Abuzalata, K.M. Creating a color map to be used to convert a gray image to color image. Int. J. Comput. Appl. 2016, 153, 31–34. [Google Scholar]
- Queiroz, L.R.; Braun, M.K. Color to gray and back: Color embedding into textured gray images. IEEE Trans. Image Process. 2006, 15, 1464–1470. [Google Scholar] [CrossRef]
Figure 1.
The city of Thessaloniki and the archaeological site position of Dion.

Figure 2.
Part of (a) the wall of Thessaloniki and (b) the mosaic in the ‘‘Great Thermes’’ of Dion.

Figure 3.
Image, e.g., Near Infrared (NIR) (a) of the wall of Thessaloniki and (b) of the mosaic of the archaeological site of Dion.
Figure 3.
Image, e.g., Near Infrared (NIR) (a) of the wall of Thessaloniki and (b) of the mosaic of the archaeological site of Dion.

Figure 4.
Flowchart of the methodological procedure of the wall’s image processing.

Figure 5.
The band misregistration effect. Part of one shooting scene with the small MS camera on the wall, showing the non-correlation of the bands (white arrows) (a) e.g., bands Green, Red, Red Edge or (b) bands Red, Red Edge, NIR and (c) the correlation result (yellow arrow) of the bands e.g., Red Edge, Green, Red.

Figure 6.
(a) RGB image and (b) MS image (Red, Red Edge, NIR) free from lens distortions (comparison of (b) with original NIR image of Figure 3a).
Figure 6.
(a) RGB image and (b) MS image (Red, Red Edge, NIR) free from lens distortions (comparison of (b) with original NIR image of Figure 3a).

Figure 7.
For the wall (a) the original Pseudo-Panchromatic (PPAN) image and (b) the geometrically corrected PPAN image.
Figure 7.
For the wall (a) the original Pseudo-Panchromatic (PPAN) image and (b) the geometrically corrected PPAN image.

Figure 8.
(a) The geometrically corrected PPAN image of the wall and the section (yellow frame) of the wall on which fused image was created, (b) respectively for the mosaic (red frame).
Figure 8.
(a) The geometrically corrected PPAN image of the wall and the section (yellow frame) of the wall on which fused image was created, (b) respectively for the mosaic (red frame).

Figure 9.
(a) The RGB image (true color), (b) part of the geometrically corrected MS image (Green, Red, NIR, free from lens distortion and non-correlation of bands) of the wall, (c) the classified MS image, (d) the RGB image (true color), (e) the corresponding fused image (Green, Red, NIR), (f) the classified fused image.

Figure 10.
(a) The RGB image (true color), (b) part of the geometrically corrected MS image (Red, Red Edge, NIR, free from lens distortion and non-correlation of bands) of the mosaic, (c) the classified MS image, (d) the RGB image (true color), (e) the corresponding fused image (Red, Red Edge, NIR) and (f) the classified fused image.


Table 1.
Features of Parrot’s small Multispectral (MS) camera Sequoia+.
| Sequoia + Parts | Technical Specifications |
|---|---|
| Multispectral camera (Body) |
|
| Sunshine sensor |
|
Table 2.
Correlation table for the wall’s position.
| Images | |||||||||
|---|---|---|---|---|---|---|---|---|---|
| MS | Fused Image (FI) | ||||||||
| Bands | |||||||||
| 1 | 2 | 3 | 4 | 1 | 2 | 3 | 4 | ||
| MS | 1 | 1 | 0.872 | 0.767 | 0.784 | 0.908 | 0.829 | 0.760 | 0.782 |
| 2 | 0.872 | 1 | 0.923 | 0.924 | 0.747 | 0.897 | 0.848 | 0.860 | |
| 3 | 0.767 | 0.923 | 1 | 0.952 | 0.654 | 0.810 | 0.902 | 0.874 | |
| 4 | 0.784 | 0.924 | 0.952 | 1 | 0.636 | 0.779 | 0.828 | 0.898 | |
| FI | 1 | 0.908 | 0.747 | 0.654 | 0.636 | 1 | 0.909 | 0.830 | 0.833 |
| 2 | 0.829 | 0.897 | 0.810 | 0.779 | 0.909 | 1 | 0.947 | 0.942 | |
| 3 | 0.760 | 0.848 | 0.902 | 0.828 | 0.830 | 0.947 | 1 | 0.967 | |
| 4 | 0.782 | 0.860 | 0.874 | 0.898 | 0.833 | 0.942 | 0.967 | 1 | |
Table 3.
Correlation table for the mosaic’s position.
| Images | |||||||||
|---|---|---|---|---|---|---|---|---|---|
| MS | Fused Image (FI) | ||||||||
| Bands | |||||||||
| 1 | 2 | 3 | 4 | 1 | 2 | 3 | 4 | ||
| MS | 1 | 1 | 0.863 | 0.587 | 0.607 | 0.920 | 0.785 | 0.429 | 0.467 |
| 2 | 0.863 | 1 | 0.780 | 0.793 | 0.774 | 0.898 | 0.587 | 0.625 | |
| 3 | 0.587 | 0.780 | 1 | 0.982 | 0.568 | 0.770 | 0.886 | 0.911 | |
| 4 | 0.607 | 0.793 | 0.982 | 1 | 0.552 | 0.736 | 0.829 | 0.887 | |
| FI | 1 | 0.920 | 0.774 | 0.568 | 0.552 | 1 | 0.859 | 0.558 | 0.569 |
| 2 | 0.785 | 0.898 | 0.770 | 0.736 | 0.859 | 1 | 0.765 | 0.767 | |
| 3 | 0.429 | 0.587 | 0.886 | 0.829 | 0.558 | 0.765 | 1 | 0.985 | |
| 4 | 0.467 | 0.625 | 0.911 | 0.887 | 0.569 | 0.767 | 0.985 | 1 | |
Table 4.
Classification accuracies (user accuracy) of the wall.
| Class Name | MS Image | Fused Image |
|---|---|---|
| Shadow | 100.00% | 100.00% |
| Dark beige stone | 60.00% | 80.00% |
| Plant | 70.00% | 30.00% |
| Brown stone with no light | 70.00% | 100.00% |
| Brown stone with light | 100.00% | 100.00% |
| Dark cement | 90.00% | 90.00% |
| White cement | 90.00% | 90.00% |
| Discolored small bricks | 100.00% | 100.00% |
| Dark small bricks | 60.00% | 90.00% |
| Dark brown stone | 70.00% | 100.00% |
| Overall Classification Accuracy | 81.00% | 88.00% |
| Overall Kappa Statistics | 0.793 | 0.867 |
Table 5.
Classification accuracies (user accuracy) of the mosaic.
| Class Name | MS Image | Fused Image |
|---|---|---|
| White tile | 100.00% | 100.00% |
| Blue-grey tile | 76.67% | 100.00% |
| Light (pale) red tile | 40.00% | 70.00% |
| Dark red tile | 75.00% | 70.00% |
| Light (pale) yellow tile | 65.00% | 100.00% |
| Dark yellow tile | 40.00% | 90.00% |
| Dark blue tile | 50.00% | 60.00% |
| Very dark blue tile | 100.00% | 100.00% |
| Grey tile | 50.00% | 100.00% |
| Overall Classification Accuracy | 69.60% | 87.80% |
| Overall Kappa Statistics | 0.684 | 0.843 |
Table 6.
Area (sq. m.) of wall’s materials.
| Class Name | MS Image | Fused Image |
|---|---|---|
| Shadow | 5.702 | 3.603 |
| Dark beige stone | 1.929 | 3.988 |
| Plant | 1.033 | 0.396 |
| Brown stone with no light | 1.787 | 2.981 |
| Brown stone with light | 3.073 | 1.290 |
| Dark cement | 3.229 | 4.484 |
| White cement | 0.847 | 1.214 |
| Discolored small bricks | 0.214 | 1.562 |
| Dark small bricks | 3.492 | 1.531 |
| Dark brown stone | 4.842 | 5.099 |
| Total | 26.148 | 26.148 |
Table 7.
Area (sq. m.) of mosaic’s materials.
| Class Name | MS Image | Fused Image |
|---|---|---|
| White tile | 0.269 | 0.261 |
| Blue-grey tile | 0.182 | 0.089 |
| Light (pale) red tile | 0.017 | 0.045 |
| Dark red tile | 0.009 | 0.106 |
| Light (pale) yellow tile | 0.071 | 0.070 |
| Dark yellow tile | 0.062 | 0.022 |
| Dark blue tile | 0.099 | 0.093 |
| Very dark blue tile | 0.030 | 0.029 |
| Grey tile | 0.036 | 0.060 |
| Total | 0.775 | 0.775 |
© 2020 by the authors. Licensee MDPI, Basel, Switzerland. This article is an open access article distributed under the terms and conditions of the Creative Commons Attribution (CC BY) license (http://creativecommons.org/licenses/by/4.0/).
Share and Cite
MDPI and ACS Style
Kaimaris, D.; Kandylas, A. Small Multispectral UAV Sensor and Its Image Fusion Capability in Cultural Heritage Applications. Heritage 2020, 3, 1046-1062. https://0-doi-org.brum.beds.ac.uk/10.3390/heritage3040057
AMA Style
Kaimaris D, Kandylas A. Small Multispectral UAV Sensor and Its Image Fusion Capability in Cultural Heritage Applications. Heritage. 2020; 3(4):1046-1062. https://0-doi-org.brum.beds.ac.uk/10.3390/heritage3040057
Chicago/Turabian StyleKaimaris, Dimitris, and Aristoteles Kandylas. 2020. "Small Multispectral UAV Sensor and Its Image Fusion Capability in Cultural Heritage Applications" Heritage 3, no. 4: 1046-1062. https://0-doi-org.brum.beds.ac.uk/10.3390/heritage3040057