1. Introduction
Aqueducts are remarkable masonry infrastructures, as well as built architectural heritage that dates back to Roman civilization. The Romans constructed massive aqueducts from Scotland to Iraq to supply water to their towns and cities. The water brought into the cities from outside sources was used in various ways, from private households, latrines, fountains, and baths to irrigation purposes, nourishing the life in and around the cities. Roman engineers designed the aqueduct systems to carry the collected water with a slight descent to take advantage of the gravitational force in conduits made of stones, bricks, or concrete. These aqueducts supported the population growth and water-rich lifestyle across the Roman Empire, and soon enough, they became a public interest and the objects of civic pride [
1]. Readers are referred to [
2] for an exhaustive review of the Roman and medieval aqueducts and aqueduct technologies.
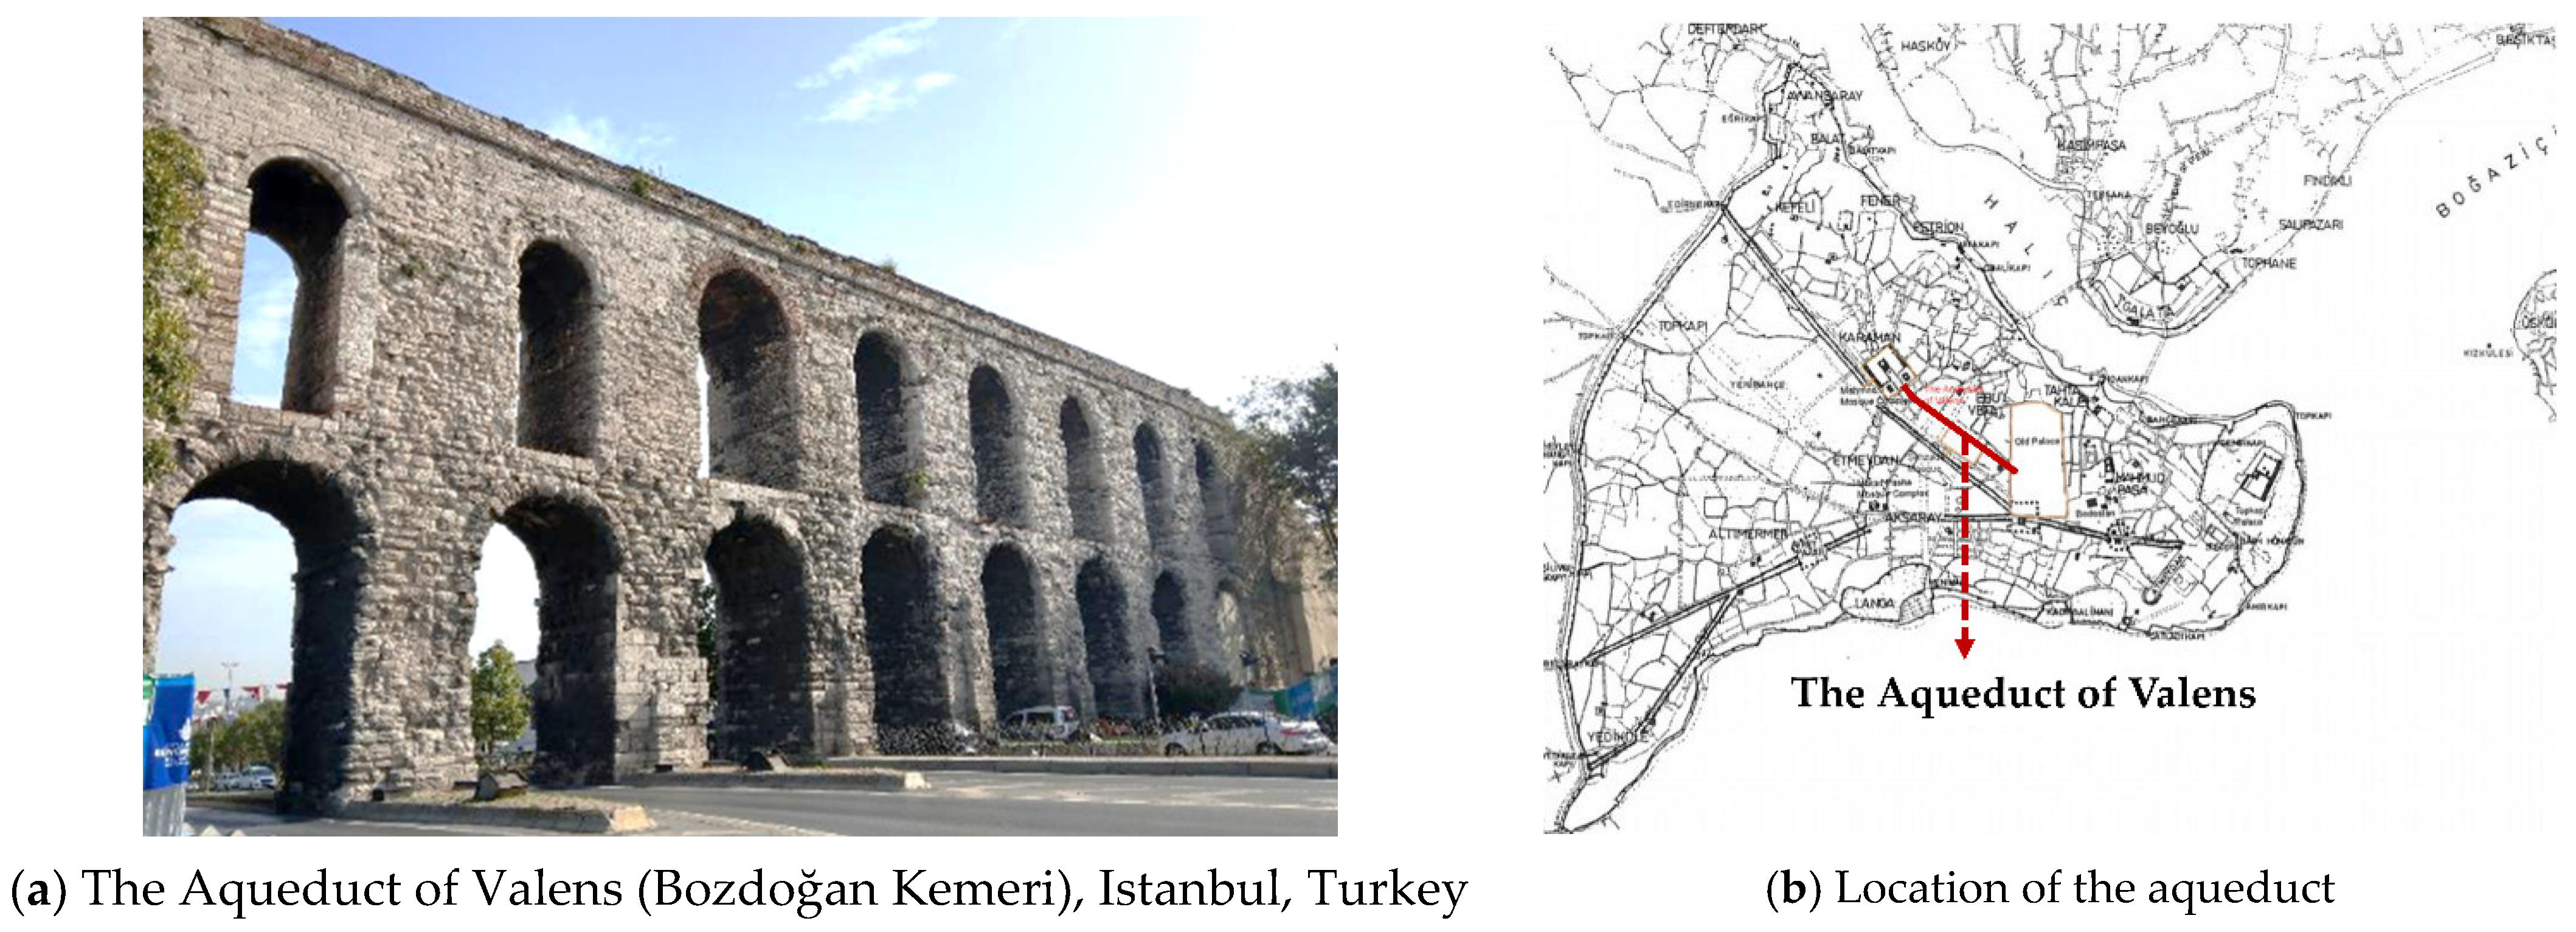
Despite environmental effects and natural hazards, many aqueducts have survived for centuries, and some are still operational. Famous examples of aqueduct architecture include the Pont du Gard (France), Aqueduct of Segovia (Spain), and the Valens Aqueduct (Turkey). The last example stands as the focus of the present research, and is shown in
Figure 1. The Valens Aqueduct (or
Bozdoğan Kemeri in Turkish) was a part of the longest Roman waterline, with a total length of 240 km, and it was completed during the reign of the Roman Emperor Valens (364–378), i.e., the fourth century A.D. [
3]. The Valens Aqueduct was operated to supply water to Constantinople (today’s Istanbul), the capital of the Eastern Roman empire. Throughout the centuries, the aqueduct has suffered from damages and partial collapses due to severe earthquakes and attacks [
4]. Furthermore, the inevitable aging of the material, lack of maintenance, and inappropriate interventions are the factors accelerating the deterioration process of the structure. Although the aqueduct is still functional and an important part of Istanbul’s water transportation network, its safety and integrity have been questioned due to the expectation of a severe earthquake in Istanbul [
5].
Examples of seismic assessments of masonry aqueducts are limited in the literature compared to those of other masonry constructions. Recent examples of masonry arch bridge analyses using three-dimensional (3D) modeling with the finite element (FE) method or discrete element method (DEM) present important findings related to the behavior of masonry arch systems [
6,
7,
8,
9]. However, the behavior of masonry aqueducts, especially ones with two or more tiers and substantial height, is not studied sufficiently, and they are likely to present different structural behaviors. The limited research on masonry aqueducts has concentrated on experimental investigations and structural analyses. In terms of the experimental investigations, obtaining the aqueducts’ modal parameters using operational modal analysis and system identification methods seems to be the most common approach [
10,
11]. Structural analysis examples present a wider variety. Suarez and Bravo [
12] performed a probabilistic structural analysis of an aqueduct in the Alhambra. Andreini et al. [
13] and Mamaklı et al. [
14] performed two-dimensional (2D) and three-dimensional (3D) FE analyses to evaluate the aqueducts’ behavior for conservation purposes. There are other studies where a 3D discrete element model was preferred [
15]. The discrete element method represents the discontinuous nature of masonry structures as a system of discrete blocks interacting along their boundaries. As such, a significant part of the deformations is caused by the relative motion of distinct blocks, in which large deformations and total contact separations can be observed. Mordanova et al. [
16] used a 2D discrete element model to assess the stability of the Claudio Aqueduct in Rome, Italy. Both the in- and out-of-plane seismic capacities of the aqueduct were analyzed, and a value of 0.15 g was obtained before proposing any retrofitting solutions. Furthermore, in a comprehensive study, Drei et al. [
17] performed 2D DEM analyses to assess the seismic behavior of two aqueducts, Aguas Livres in Lisbon and Amoreira in Elvas, both in Portugal. They also investigated the effect of the bond pattern on the out-of-plane capacity of aqueduct piers. The results of their research clearly highlight the importance of the out-of-plane strength of slender aqueduct pillars, which are vulnerable to lateral seismic actions.
The scarcity in the literature may be attributed to the difficulties associated with the seismic assessment of masonry aqueducts. These emerge from the absence of standardized methods, lack of accurate data regarding geometrical and material properties, and the complex morphological features of the load-bearing elements [
18]. While the difficulties co-exist with the necessity to maintain these aqueducts, understanding their seismic behavior is essential and a sign of respect for safeguarding architectural heritage. In this context, the present research aims to achieve two objectives:
To assess the seismic capacity and collapse mechanism of the Valens Aqueduct when subjected to lateral forces (proportional to the mass) using the discrete element method in 3D.
To generalize the findings by quantifying the influence of each of the required input parameters utilized in the discrete element model, i.e., the joint tensile strength, contact stiffness, joint friction angle, and compressive strength of the masonry, and, therefore, provide practical suggestions for the discontinuum analysis of masonry aqueducts.
In the following sections, the employed modeling strategy and theoretical background of the DEM are briefly explained. The applied modeling approach is validated via experimental work on a full-scale unreinforced single-story masonry house that was tested using a tilting test setup. Then, the Valens Aqueduct is analyzed using the validated DEM approach, and several important inferences are made regarding both the applied modeling strategy and the parameters affecting the structural behavior of the aqueduct.
2. Discrete Element Modeling
The computational approaches utilized in the analysis of masonry structures can be categorized as continuum- and discontinuum-based methods. The widely used finite element method (FEM) falls into the former category, which treats the computational domain as a continuous medium incorporating elastic or elasto-plastic material models. The latter is built upon a numerical formulation considering an assembly of separate (or distinct) bodies. The discontinuum-based approaches are commonly referred to as the discrete element method (DEM). However, the term “discrete element” has been used in different computational techniques, such as discontinuous deformation analysis (DDA), the non-smooth contact dynamics method (NSCD), and the combined finite–discrete element method (FDEM). Thus, DEM-based methods can be differentiated in terms of the numerical procedures (i.e., implicit or explicit) and the contact type (i.e., soft or hard contact) that are implemented. The common ground among these modeling approaches is the objective of analyzing failure progression in an unstructured and/or structured discontinuum through a system of discrete bodies where the total joint separations and sliding failure can be simulated. In this study, the distinct (or discrete) element method, originally proposed by Cundall [
19], is utilized using a commercial three-dimensional discrete element code, 3DEC, developed by ITASCA [
20].
The DEM has been an appealing alternative modeling approach for simulating the behavior of masonry structures since the 1990s [
21]. The characteristic features of masonry, such as the units (e.g., stone, clay brick, earthen blocks, etc.) and mortar joints, can be directly taken into account in the discrete element formulation, where the masonry units are replicated via individual blocks and mortar joints are represented as zero-thickness interfaces. Rigid or deformable blocks may be considered to simulate masonry units. The discrete blocks are not necessarily intended to replicate every single unit in the structure, and they may represent more than one masonry unit to prevent unpractical computational costs, as demonstrated for different masonry structures in the literature [
6,
22]. In general, rigid blocks are preferred if the deformations are concentrated at the joints [
23,
24,
25]; otherwise, deformable blocks can be employed with elastic or elasto-plastic constitutive models [
26]. Throughout this research, rigid blocks with six degrees of freedom (three translational and three rotational) are utilized to assess the structural behavior and capacity of the Valens Aqueduct. The mechanical interactions (i.e., inter-block action/reaction forces) among the discrete blocks—replicating the stone skeleton of the discontinuous system—are analyzed based on the dynamic computational procedure of the DEM.
2.1. Computational Procedure of the DEM
The numerical solution scheme of the DEM relies on the explicit integration of the equations of motion for each rigid block in the structural system. The translational motion equation, which is solved for the center of mass of a rigid block, is given in Equation (1).
where
,
,
and
are the displacement vector, the block mass, mass-proportional viscous damping constant, and the gravitational acceleration, respectively. Moreover, the first and second derivatives of the displacement vector, corresponding to the velocity and acceleration of the block centroid, are denoted as
and
, respectively. The sum of forces, which is calculated from contact and external loads, is referred to as
The equation of rotational motion for a rigid body, including a damping parameter (
), is provided in Equation (2).
where
,
,
, and
stand for the angular acceleration vector, angular velocity, sum of moments (including moments produced by contact and applied forces), and moment of inertia, which are calculated approximately based upon the average distance from the centroid of the vertices of the block [
27].
Finally, the viscous damping constant, represented by
is utilized to obtain quasi-static solutions from the dynamic equations by means of dynamic relaxation. In short, 3DEC complies with an adaptive global damping algorithm to control and continuously adjust viscosity such that the ratio of damping power to the rate of change of kinetic energy in the system is kept constant (e.g., 0.5). Thus, when the kinetic energy gets close to zero, the power absorbed by the damping also goes to zero [
28].
The given equations of motion are solved using the central difference method to compute new translational (
) and rotational (
) velocities for each block centroid, which are given in Equations (3) and (4), respectively.
where
,
, and
are the time step and the previous translational and rotational velocities, respectively.
Once the new velocities are obtained, the displacement increments for translation (
) and rotation (
) can be computed as given in Equation (5). Then, the new position of the block centroid is updated based upon the displacement increments, and the contact stresses are calculated, which will be explained in the next section.
It should be noted that the central difference method provides a conditionally stable solution that requires small time-steps to ensure numerical stability. Therefore, 3DEC automatically determines an upper limit for the time step that satisfies the stability criterion in order to capture the inter-block relative displacement during the analysis by simply calculating (: minimum block mass; : maximum contact stiffness in the system).
2.2. Contact Detection and Contact Stress-Displacement Laws
Crack localization is a salient feature of masonry construction; it mostly develops at the mortar joints, especially for the strong-unit–weak-bond assemblies [
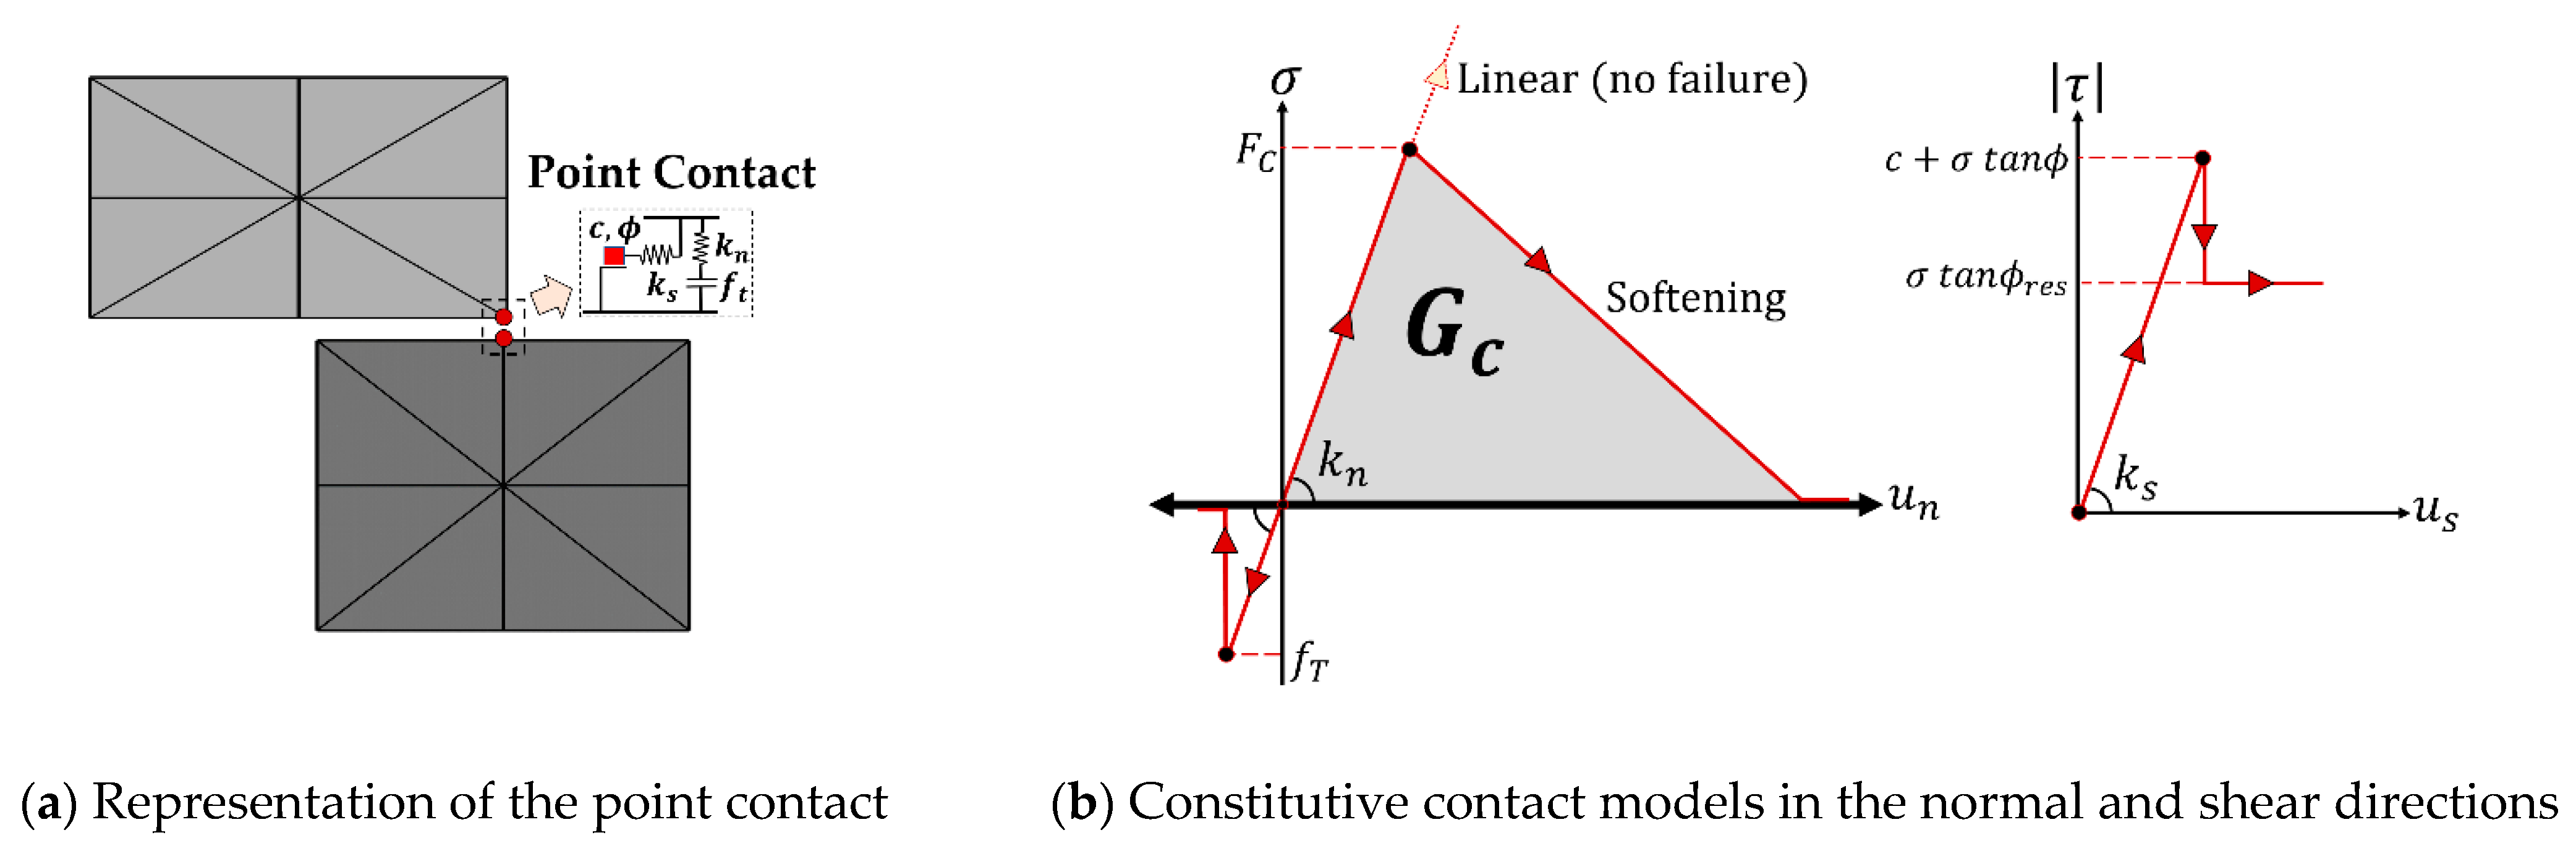
29]. The discrete element modeling framework provides an advantage compared to standard continuum-based computational techniques, where the contact openings, sliding, and total contact detachments are simulated along the boundaries of the generated discontinuum system automatically. First, the adjacent blocks are recognized, and then sub-contacts are defined for each contact point, as illustrated in
Figure 2a. In 3DEC, the common plane (c-p) concept is utilized to detect the neighboring blocks and update the contact conditions during the analysis. The c-p approach includes two parts: (
i) defining a unique plane cutting across the space between two adjacent blocks; (
ii) testing each block individually for a contact using the common plane, which is ultimately defined by solving an optimization problem by minimizing the maximum overlap with either block [
30]. Note that the implemented c-p algorithm is based on geometry and is applied in parallel with the mechanical calculations [
28]. At the end of the contact detection procedure, the contact type, the unit normal vector of the c-p, and the gap or overlap between the blocks in contact are provided. The point-contact types can be vertex-to-face (V.F.) or edge-to-edge (E.E.). Once the contact points are identified, normal and shear springs are assigned in the orthogonal directions (
Figure 2a). Accordingly, at each step, elastic stress increments (normal
and shear
stresses) are calculated for the active contact points based on the relative displacements among the adjacent blocks and are added to old ones to obtain the new contact stresses, as written in Equation (6). Thus, the inter-block action/reaction forces are calculated as a function of relative block displacements at each contact point and are then updated depending on the defined contact stress-displacement law [
31].
where
,
,
and
are the normal spring stiffness (i.e., stress/displacement), shear spring stiffness, and relative displacement in the normal and shear directions for contact points, respectively.
In this study, two contact stress-displacement models are considered in the normal direction. First, no failure condition is assumed in compression at the joints, since the governing failure mechanism in low-bond masonry structures is induced by cracking and sliding failures at the weak mortar joints rather than the lack of compression strength of the composite. Second, a peak compression strength is defined at the joints. In fact, linear compression behavior (i.e., no failure) with a tension cut-off is a common practice in discrete element modeling, as demonstrated in
Figure 2b [
9,
32,
33,
34,
35,
36]. However, it is also important to explore the effect of compression failure on the overall capacity of the structure, given the fact that deterioration and aging are the main factors that may decrease the compressive strength of the material. Thus, both contact models—namely linearly elastic compression behavior and limited compression strength (
) with softening post-peak behavior—are considered in the analyses. In both contact models, the tensile strength (
) is set to zero upon failure (see
Figure 2b). Furthermore, the ultimate compression displacement is determined based on the compression fracture energy (
), which is estimated based on the suggestions given in [
37]. On the other hand, the Coulomb slip-joint model is employed in the shear direction, which requires cohesion (
), as well as the initial and residual friction angle (
ϕ,
) input parameters. Again, similarly to tension failure, the shear stress at the contact points is set to the residual strength once the shear stress has exceeded the capacity, as shown in
Figure 2b. The elastic-softening compression contact model was written in C++ and compiled as a DLL (dynamic link library) in 3DEC via the user-defined constitutive model option. Other contact models are readily available in the standard version of the software (3DEC 5.2).
Finally, to be utilized in the motion equations, the new contact stresses are turned into contact forces when multiplied with the contact area. Hence, a dynamic solution procedure of the DEM is executed in a cycle, where the equations of motions are integrated for new velocities and displacements (Equations (3) and (4)). Then, contact forces are computed based on the defined constitutive models (Equation (6)), which are again utilized in the motion equations. The explicit calculation cycle is repeated at each increment of external loading until the structural system arrives at an equilibrium, which is defined when the unbalanced force ratio (i.e., the ratio between the average unbalanced force magnitude (
) and the average applied force magnitude for all block centroids in the system) is lower than 1 × 10
−5, similarly to [
36].
3. Validation: Tilting Test of Full-Scale Unreinforced Masonry
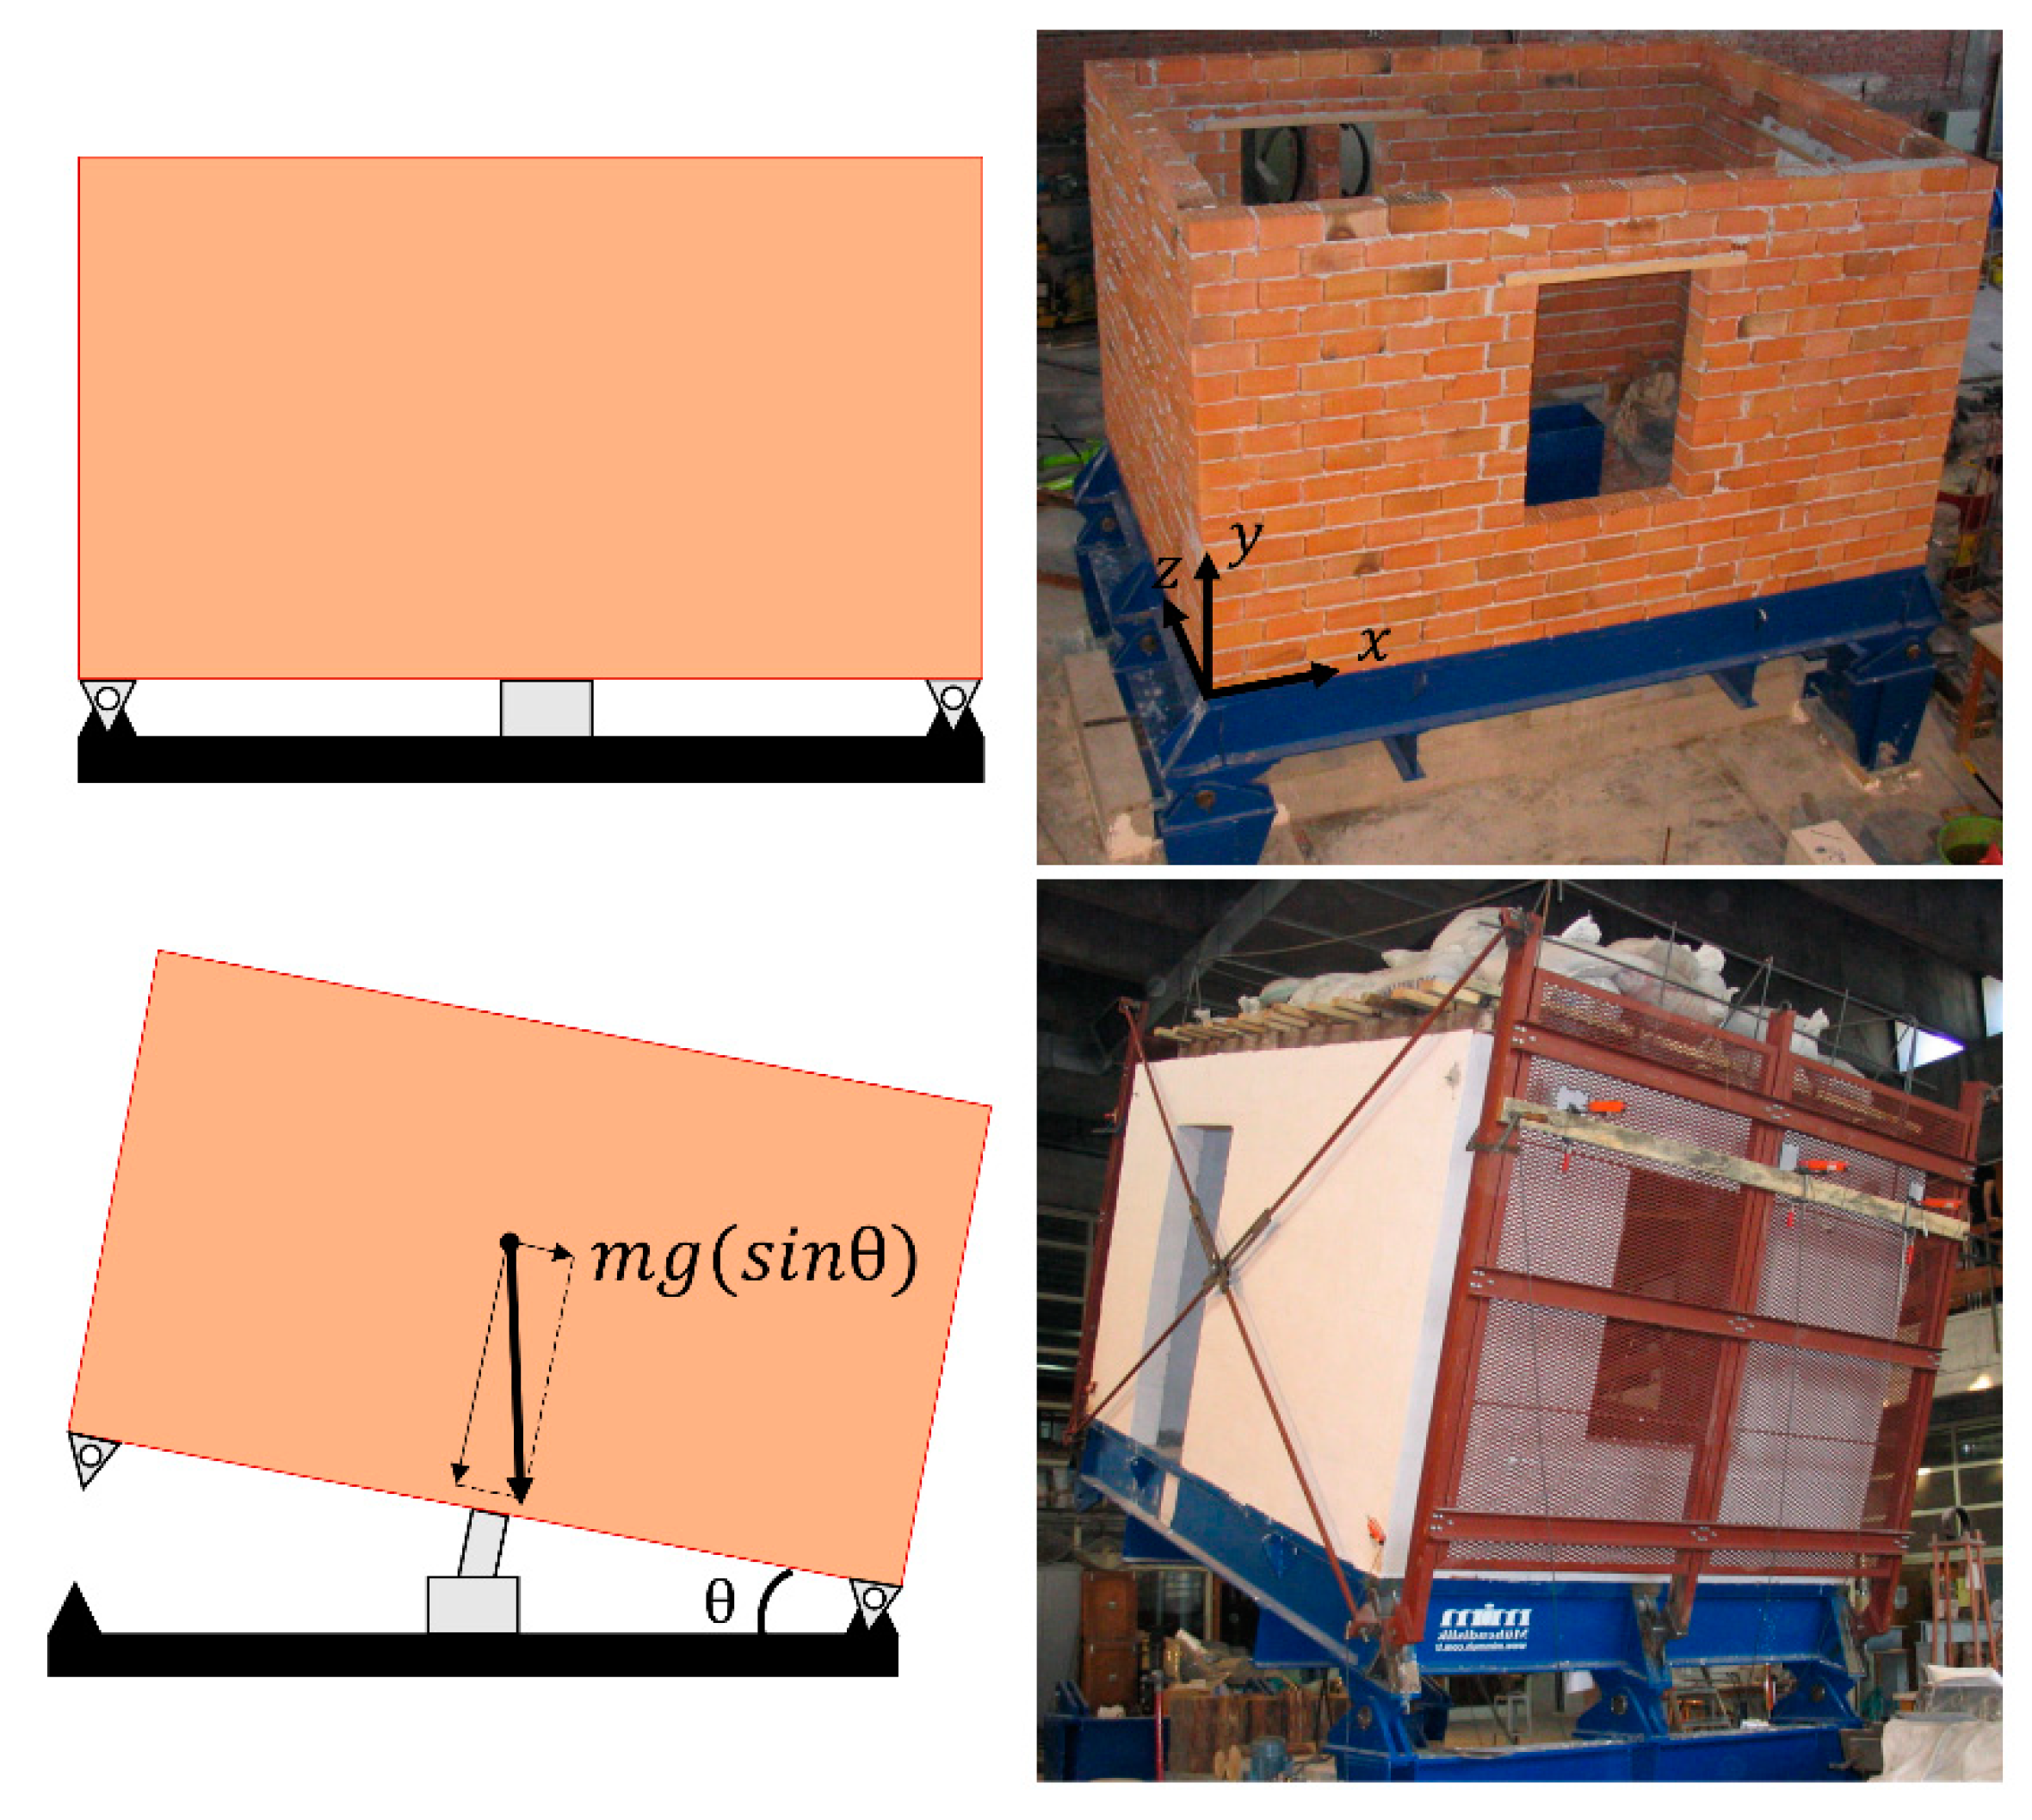
In this section, the employed modeling approach is validated by comparing the analytical results to experimental findings in terms of the collapse mechanism and acceleration vs. displacement response. The validation study comprised a full-scale (1/1) unreinforced single-story masonry house that was tested using a tilting test setup. A tilting test (or tilting table test) provides a first-order seismic assessment, where the mass-proportional forces are indirectly applied by rotating the base platform in a quasi-static fashion. Although a tilting test does not predict a structure’s dynamic behavior, it is still a widely used alternative method, as it provides valuable information about the possible collapse mechanisms and lower-bound seismic capacities for unreinforced masonry constructions, as discussed in [
38].
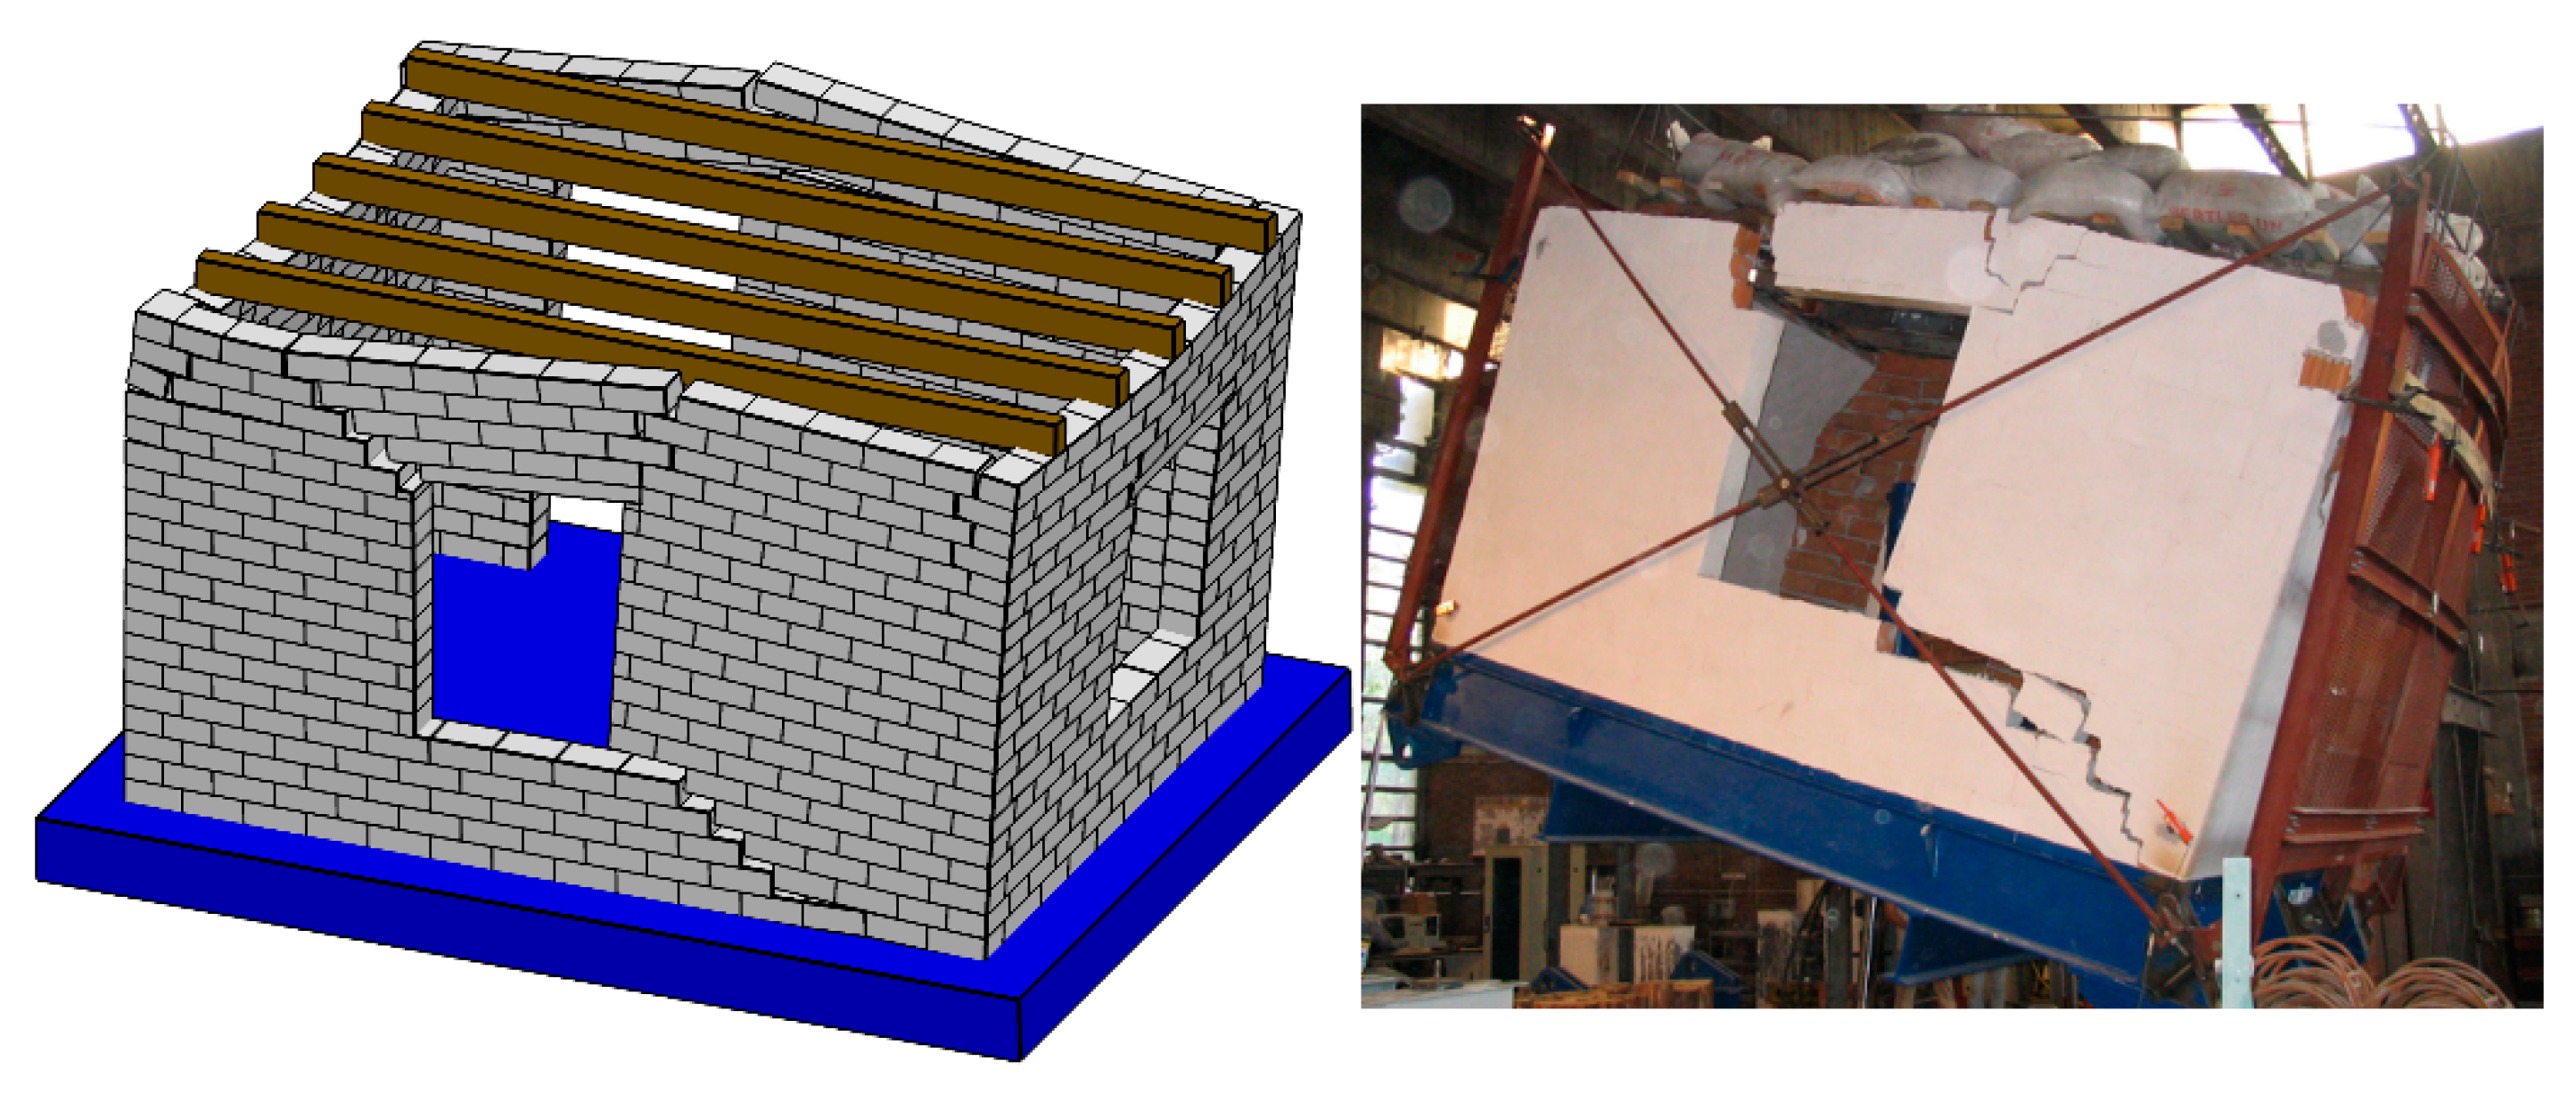
The full-scale single room masonry house was built using standard perforated clay brick and a mortar mixture in proportions of 1:1:7 (cement–lime–sand) and was tested at the Civil Engineering Department’s Structures Laboratory at the Middle East Technical University (METU) in Turkey [
39]. The dimensions of the test specimen were 3 × 4 × 2.4 (width × length × height), along with two windows and one door in the design, as shown in
Figure 3. Furthermore, a roof weight (55 kN) was laid over the wooden logs, which were placed in the tilting direction (
x-axis), as depicted in
Figure 3.
The essential input parameters required for the discrete element model were defined based on similar studies and suggestions available in the literature [
40,
41]. Since rigid blocks were employed, the contact stiffness should represent the composite action of the masonry, including the masonry units and mortar joints. Thus, the normal contact stiffness (
) was predicted based on the ratio of the masonry elastic modulus (
E) and horizontal joint spacing (denoted as
, which includes one brick plus the mortar joint thickness), whereas the contact shear stiffness (
) was calculated through the theory of elasticity (Equation (7)).
where
and
were taken as 0.12 and 0.15 m, respectively.
The geometrical and mechanical properties (if applicable) were taken from the original experimental study [
39,
42]. In
Table 1, the material and contact properties (linear and nonlinear) are given. The residual cohesion (
) was set to zero upon failure at the contacts, while the residual friction angle (
) was kept identical to the initial joint friction angle value, similarly to [
22,
43,
44].
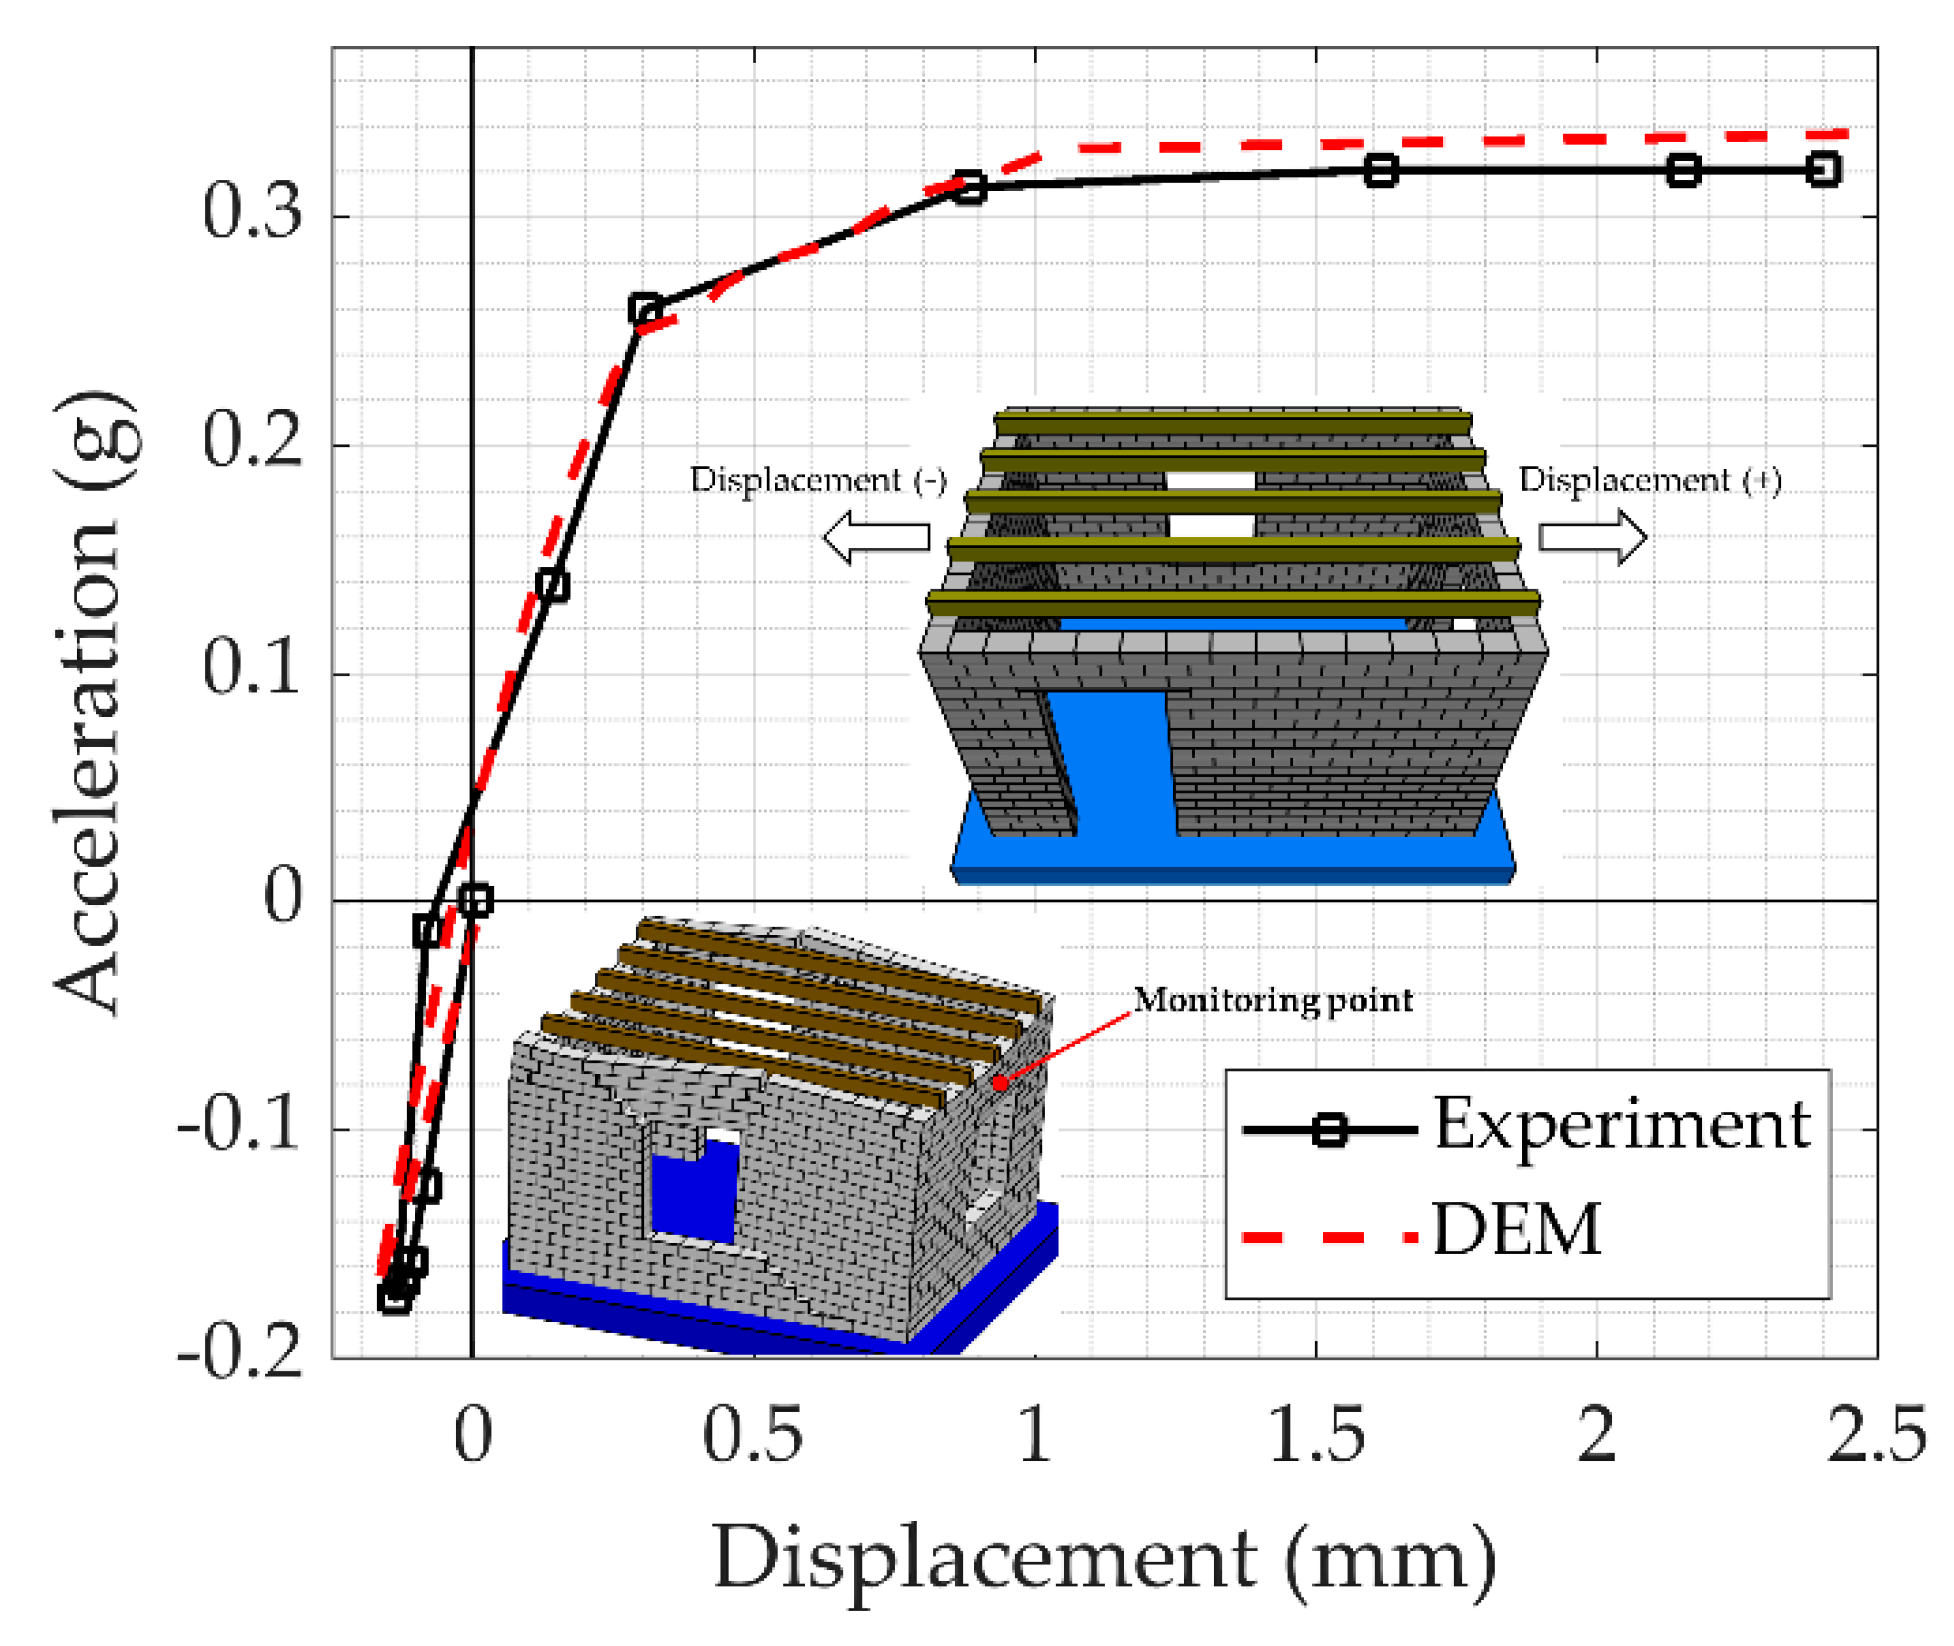
In the experiment, a pseudo-cyclic loading was applied to the structure by first tilting the base platform in the negative x-direction and then in the positive x-direction until the total collapse. The out-of-plane deflection of the walls was measured via displacement transducers (LVDTs). The same loading pattern and monitoring point (see
Figure 4) were considered in the discrete element model.
Figure 4 shows that the acceleration versus displacement response obtained from the computational model was in line with the experimental one, with a maximum acceleration difference of approximately 3%.
Furthermore, the collapse mechanism observed in the numerical model and the original experiment were nearly identical, as presented in
Figure 5. Both the in-plane and out-of-plane mechanisms that were simulated in the discrete element model were compatible with those of the experiment, where the diagonal shear cracks in the longitudinal walls and overturning mechanism of the transverse walls were captured (see
Figure 5). Therefore, the proposed modeling strategy was deemed capable of simulating the expected damage patterns in a masonry structure along with the accurate prediction of its ultimate capacity. As the crack pattern and the structure’s global response were captured accurately via the proposed modeling approach, the validation can be considered acceptable, even though the material properties and structural configurations of the Valens Aqueduct are different from those of the benchmark study. This validation strategy has been proven to be a valuable tool, especially when destructive testing of historical structures is not allowed. In the next section, the same modeling approach is utilized to analyze the Valens Aqueduct.
4. Nonlinear Static Analysis of the Valens (Bozdoğan) Aqueduct
The aqueduct’s overall length within the old city walls reaches 900 m, while the central part with two tiers of arches is approximately 240 m long. The central part’s maximum height is about 28–29 m, whereas the arches’ span length ranges between 2.4 and 6.15 m [
45]. Moreover, the width varies between 3.4 and 5.65 m [
4].
In this research, two discrete element models were prepared, which are referred to as full and partial models. The width was determined to be constant along the aqueduct and was taken as 5.25 m. During the analyses, the bottom (or support) blocks were restrained in all directions in both models. The pushover analyses were conducted in the out-of-plane direction of the aqueduct, as it is considered the weak direction for the structure. Furthermore, the stiffness of the masonry was determined to be 5 GPa based on the previous research [
1,
45], and the approximate nonlinear contact parameters (i.e., tensile strength, cohesion, and friction angle) were taken from related literature sources [
23,
46]. Note that sensitivity analyses are also performed in the following section to clearly observe the effects of linear and nonlinear contact parameters. In
Table 2, the defined material and contact properties are provided; the normal contact stiffness was estimated, similarly to the validation study, by computing
(h: the average horizontal joint spacing was determined to be 0.5 m).
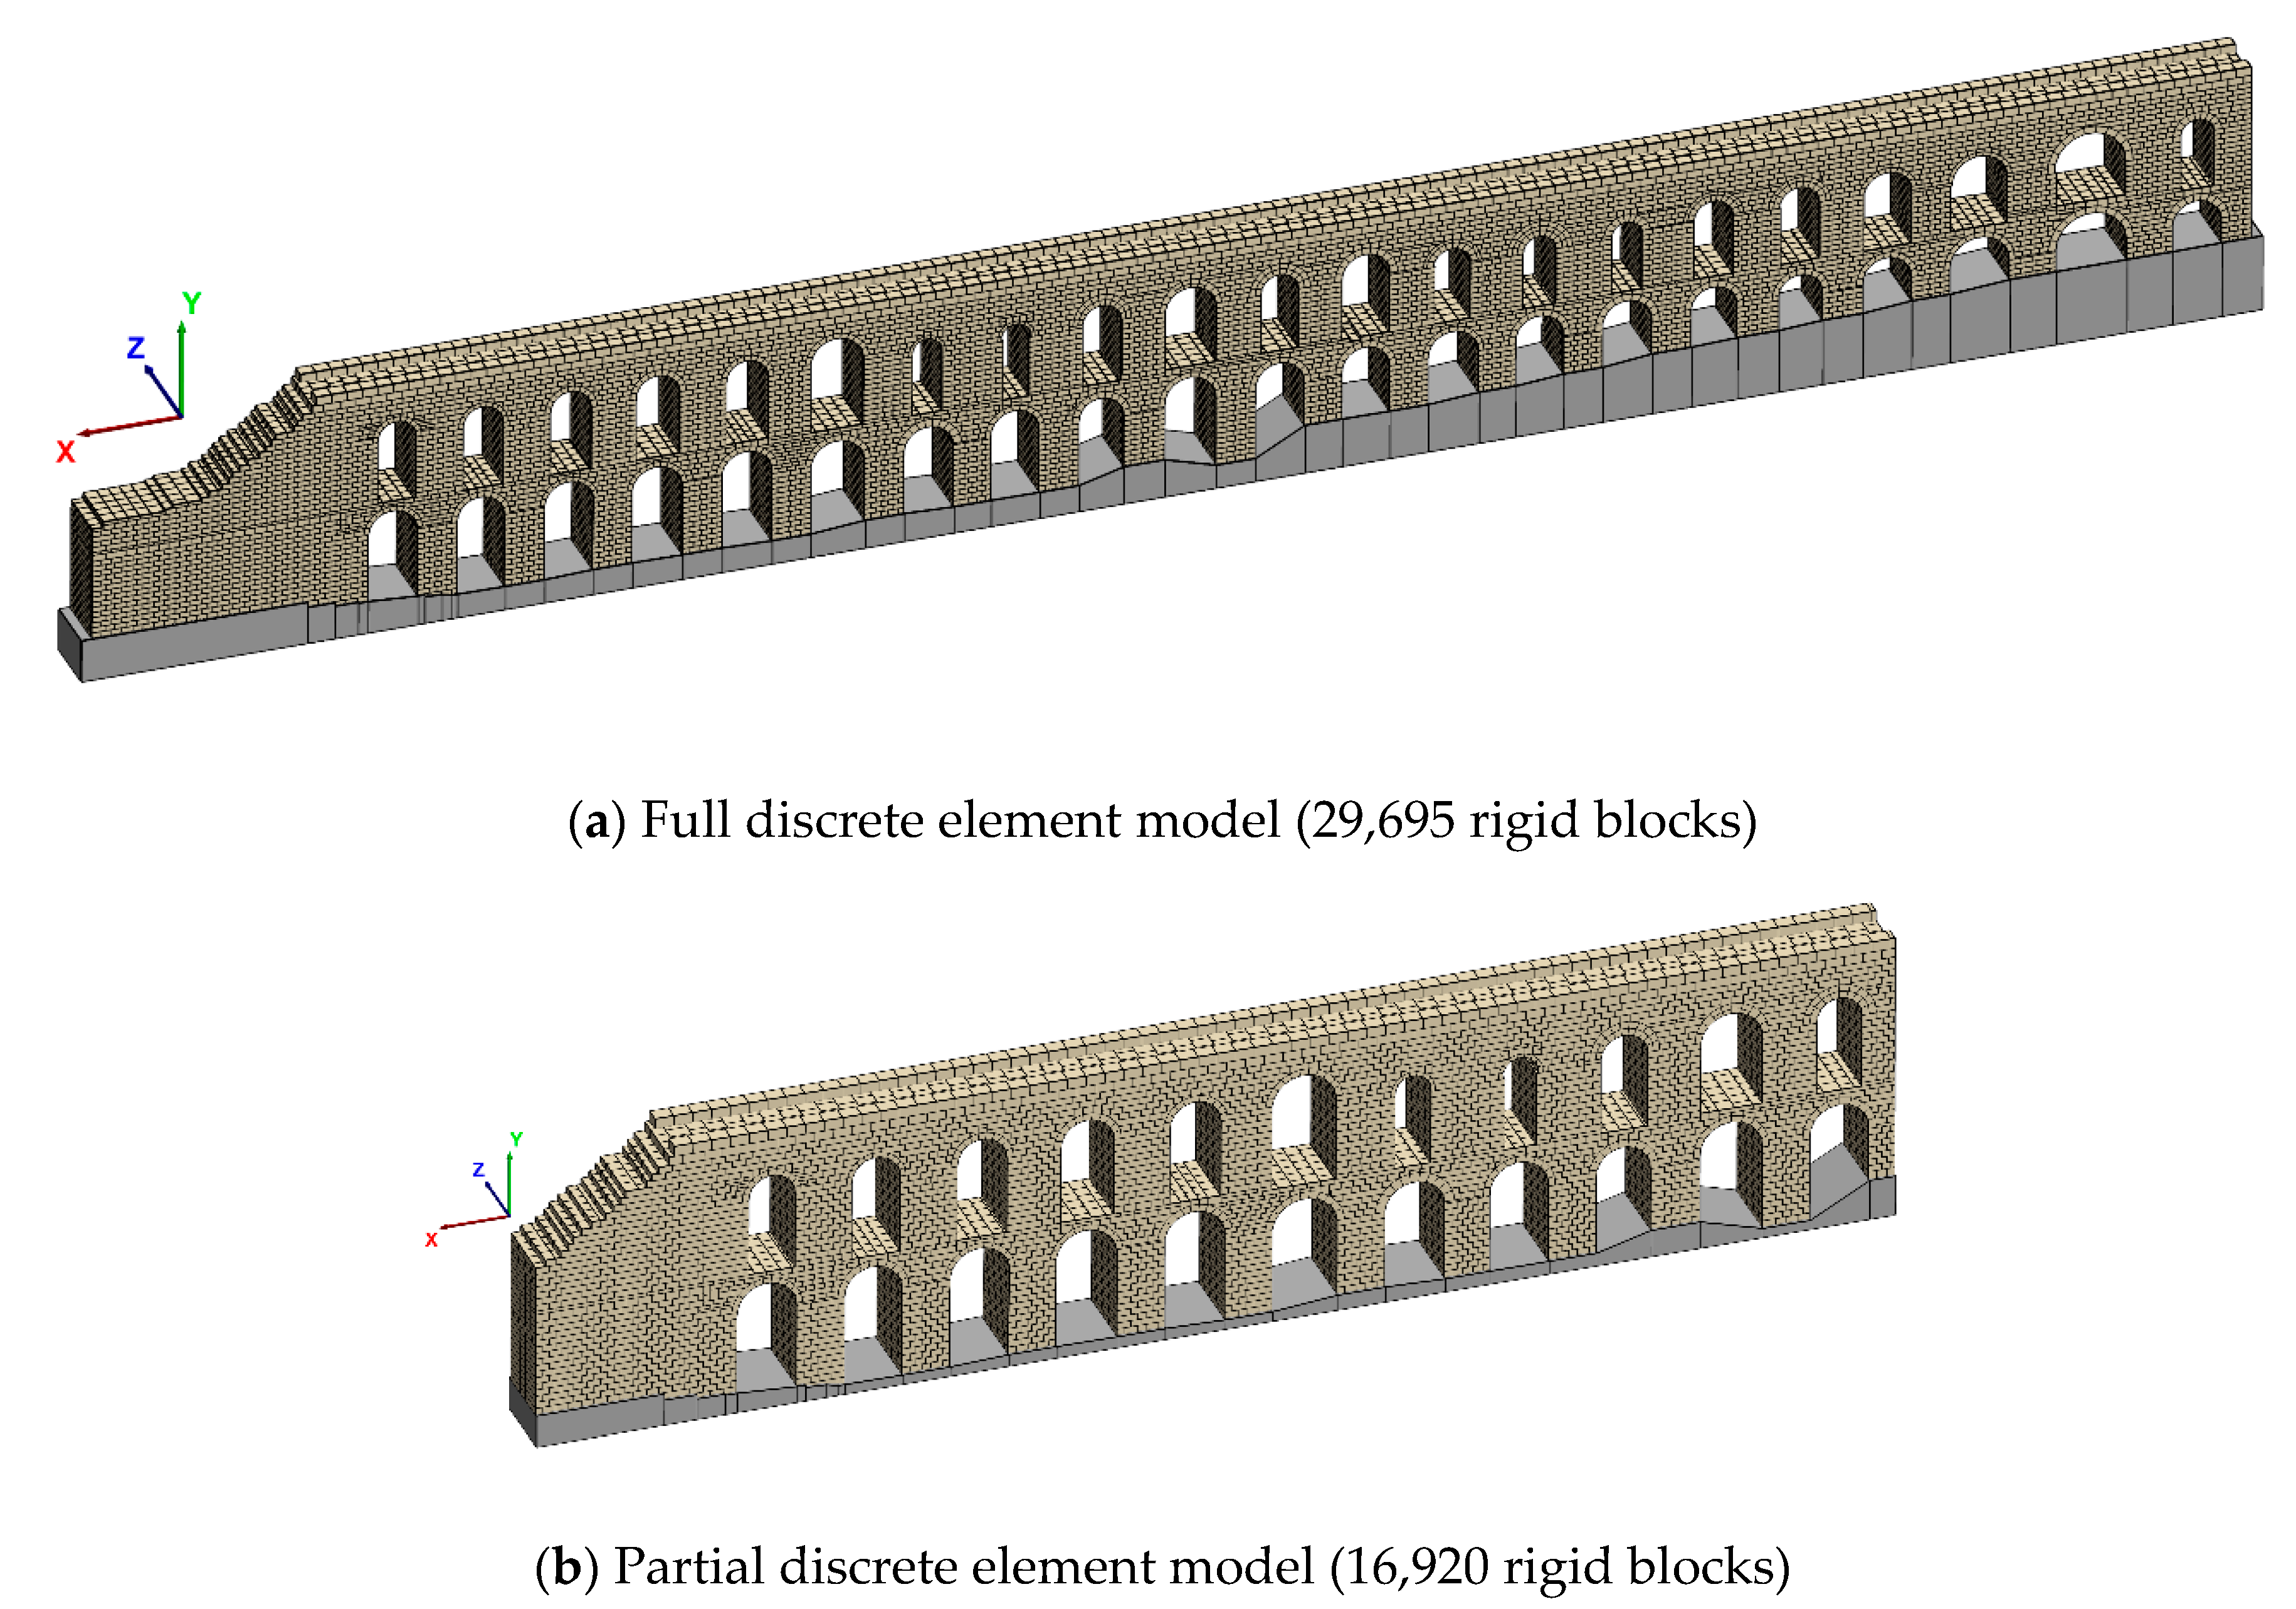
First, the full model, consisting of 29,695 rigid blocks and representing a 195 m long section, was analyzed, as shown in
Figure 6a. The full model was intended to approximately represent the whole central part of the aqueduct. However, it was a very detailed depiction of the Valens Aqueduct, and the computational cost was unfeasible. Therefore, a partial model was also generated by considering a part of the full model that showed the highest displacement response and captured the damage pattern observed in the pushover analysis. The partial model, shown in
Figure 6b, was made up of 16,920 rigid blocks, and it was 102 m long, yielding more computational-cost-effective results. In both cases, the average block height-to-length ratio was determined to be 0.5.
4.1. Pushover Analysis: Collapse Mechanism and Capacity (Full and Partial Discrete Element Models)
A two-step loading protocol was followed during the pushover analysis. Initially, the computational models were brought into a state of equilibrium under the gravity loads. Then, both models (full and partial) were subjected to forces (i.e., towards the out-of-plane direction of the aqueducts, denoted as the
z-axis in
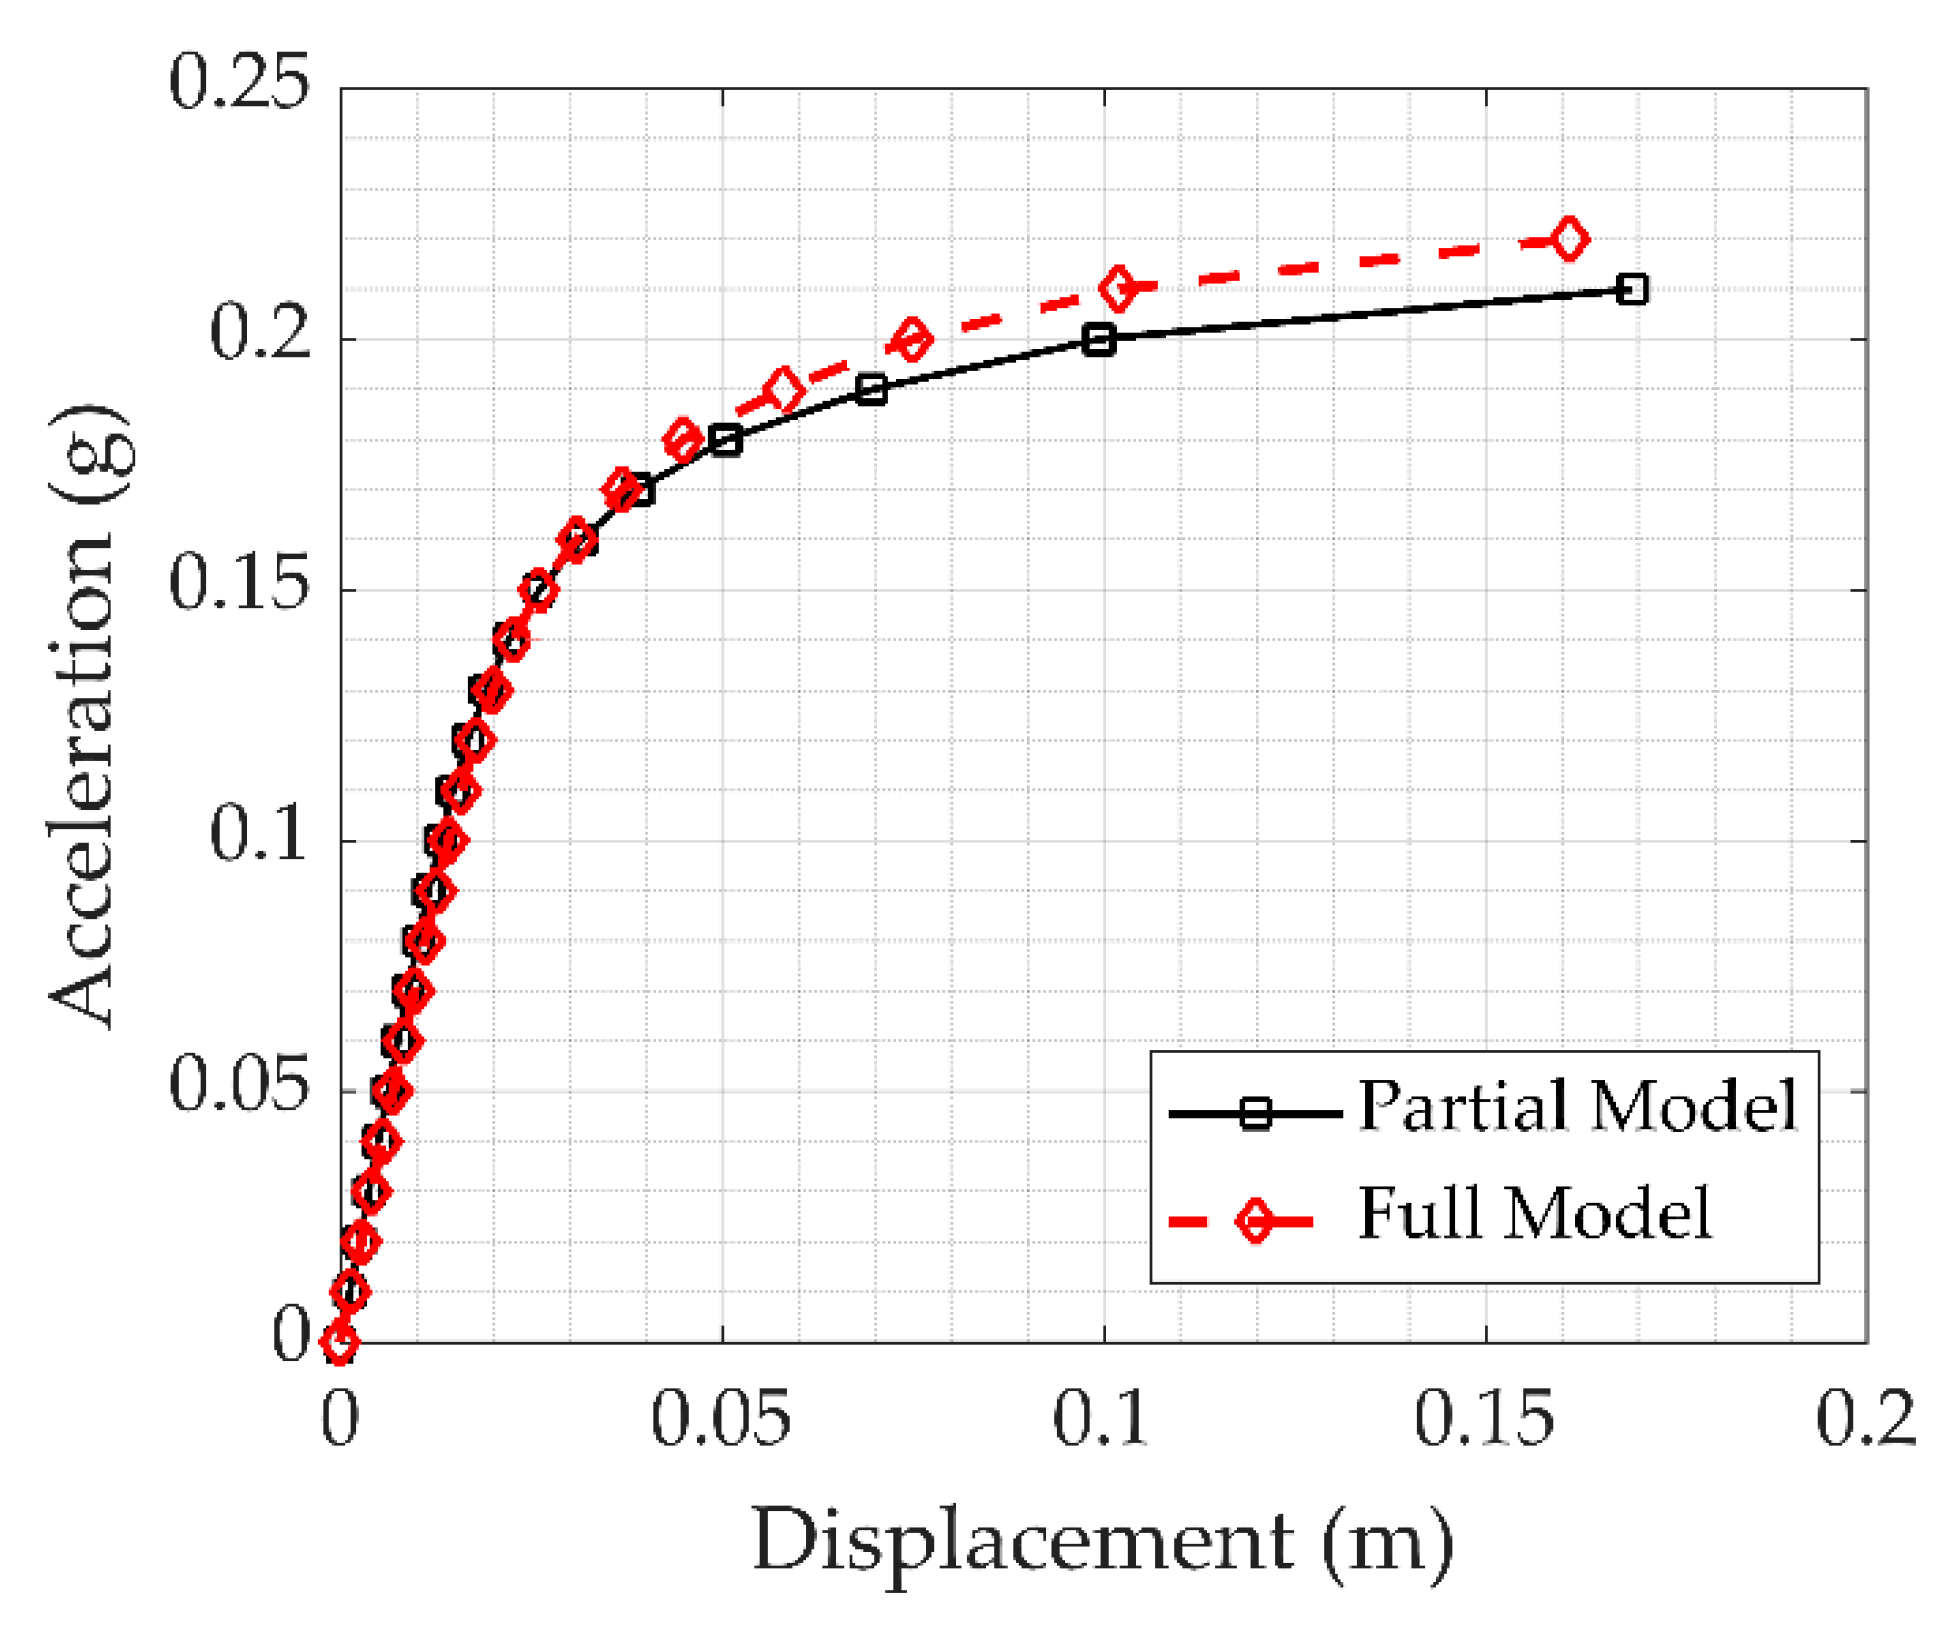
Figure 6) proportional to the mass by exerting lateral acceleration with 0.01 g increments. The results of the pushover analyses were compared in terms of deformation and the corresponding damage patterns. The displacements were monitored from the most deflected block at the upper edge of the structure during the analysis. No discrepancies between the pushover curves in the elastic regime were noted, as shown in
Figure 7. The difference between the two curves became noticeable towards the failure, but remained less than 5%, and 0.22 and 0.21 g seismic capacities were obtained for the full and partial models, respectively. Thus, the results indicate a similar acceleration versus displacement behavior between the two models.
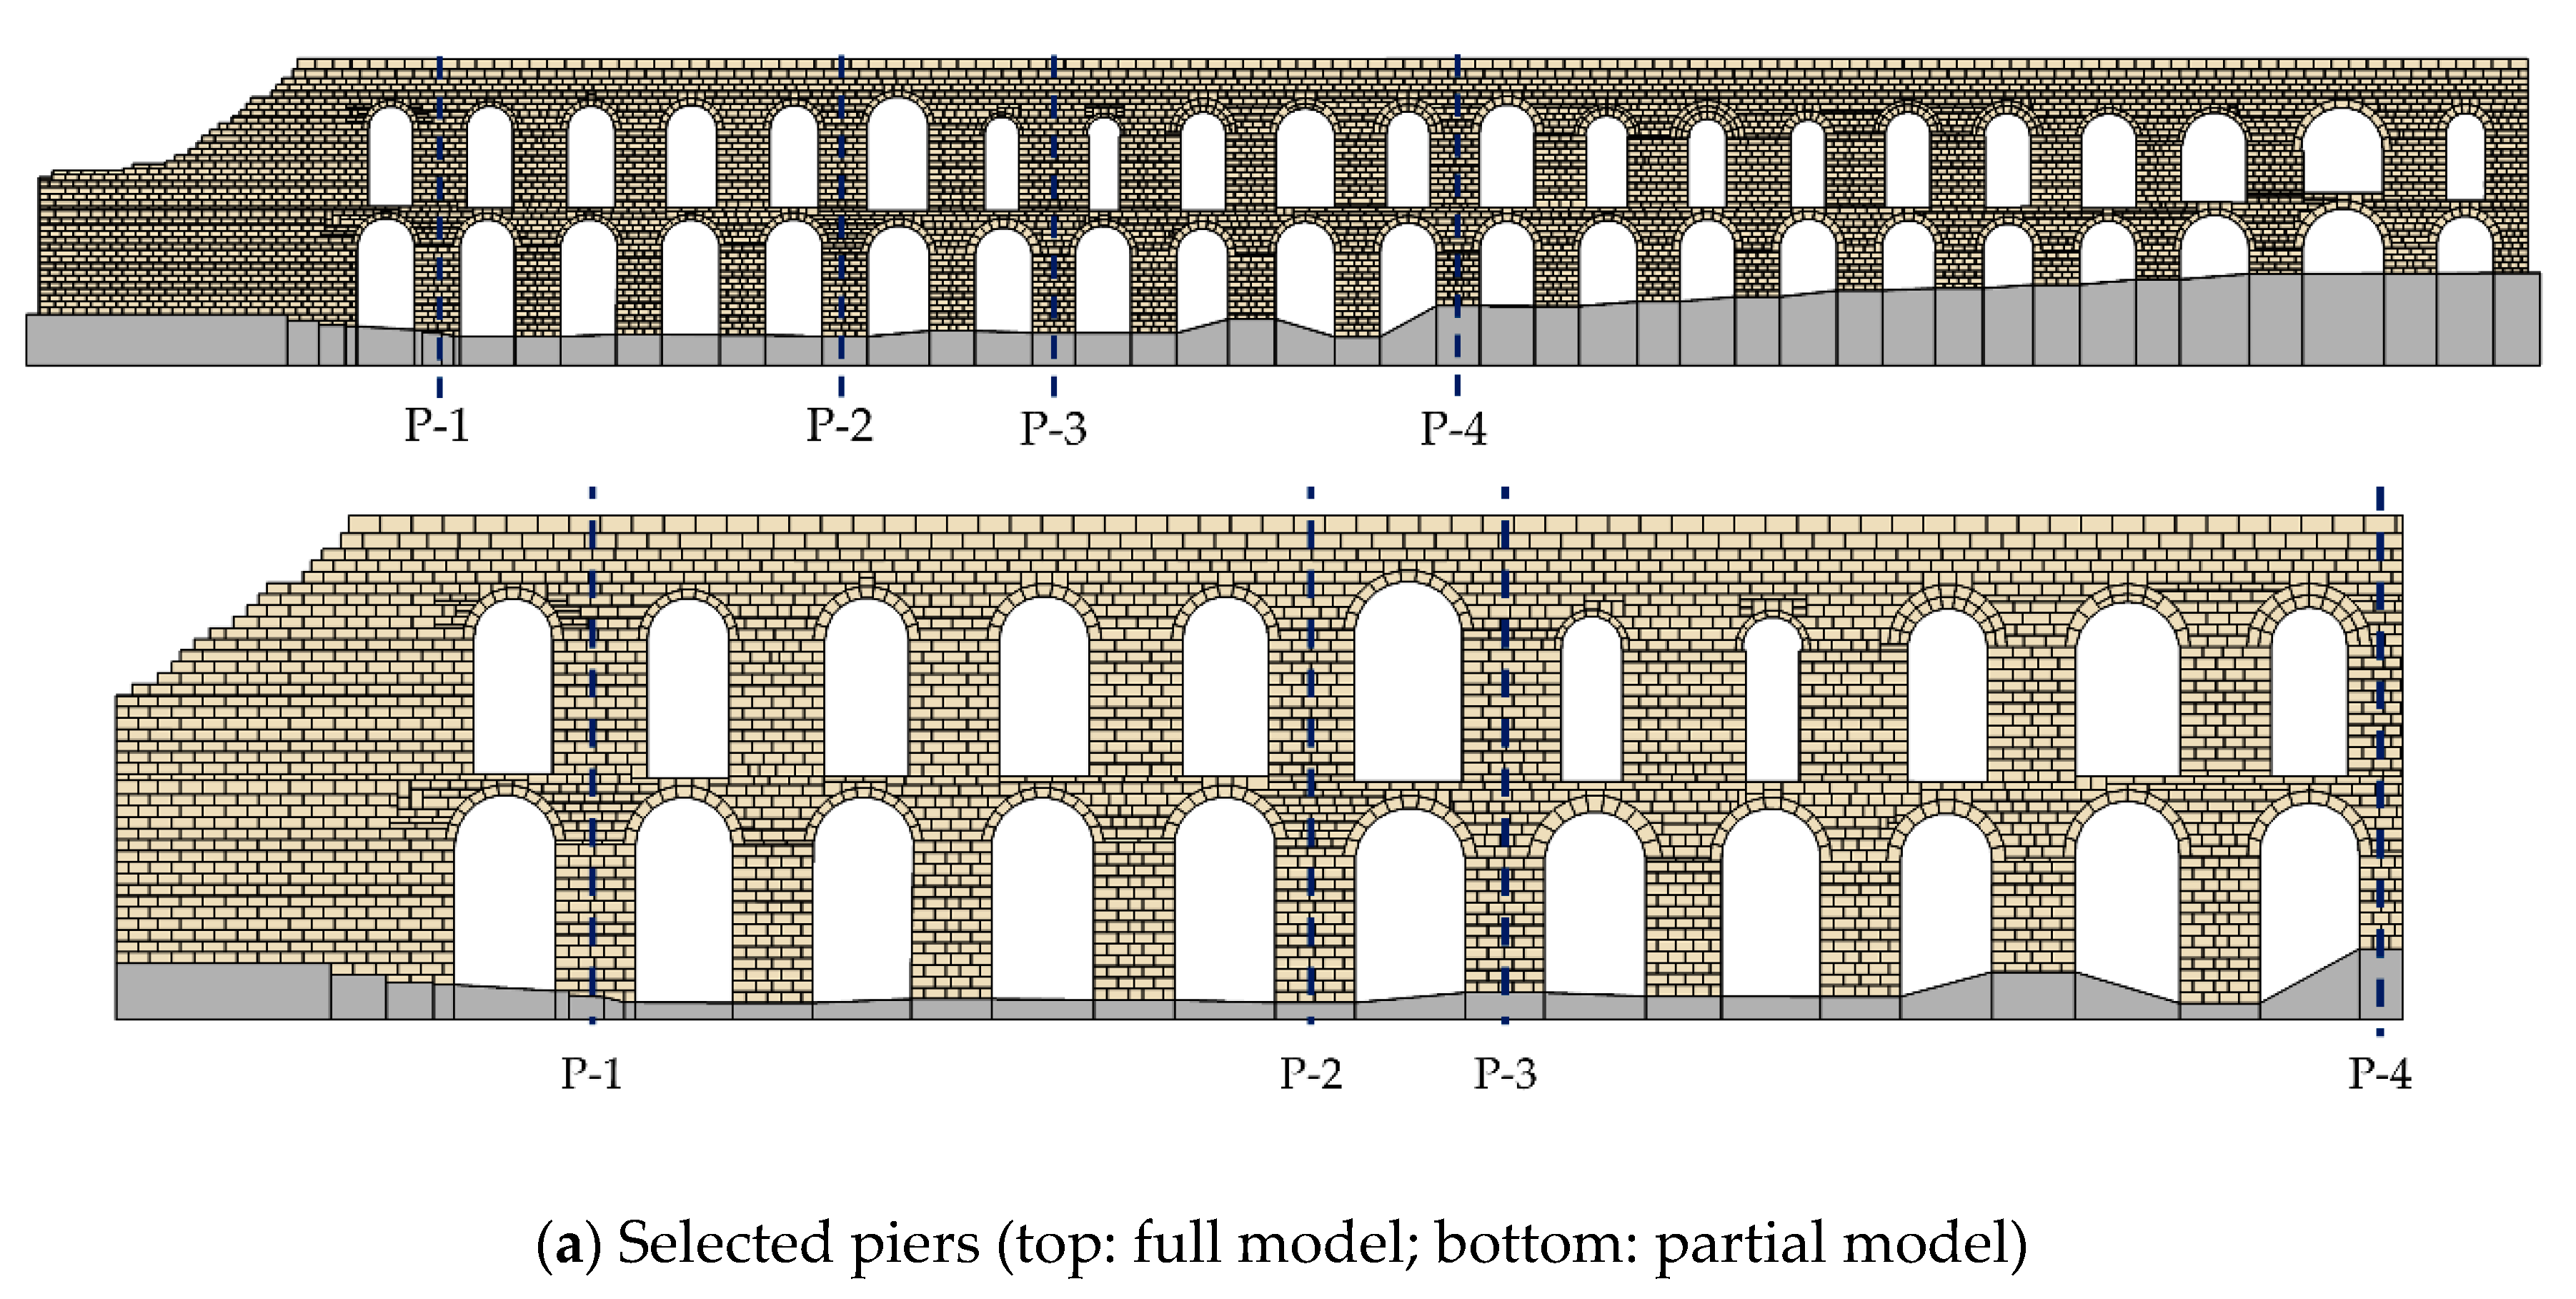
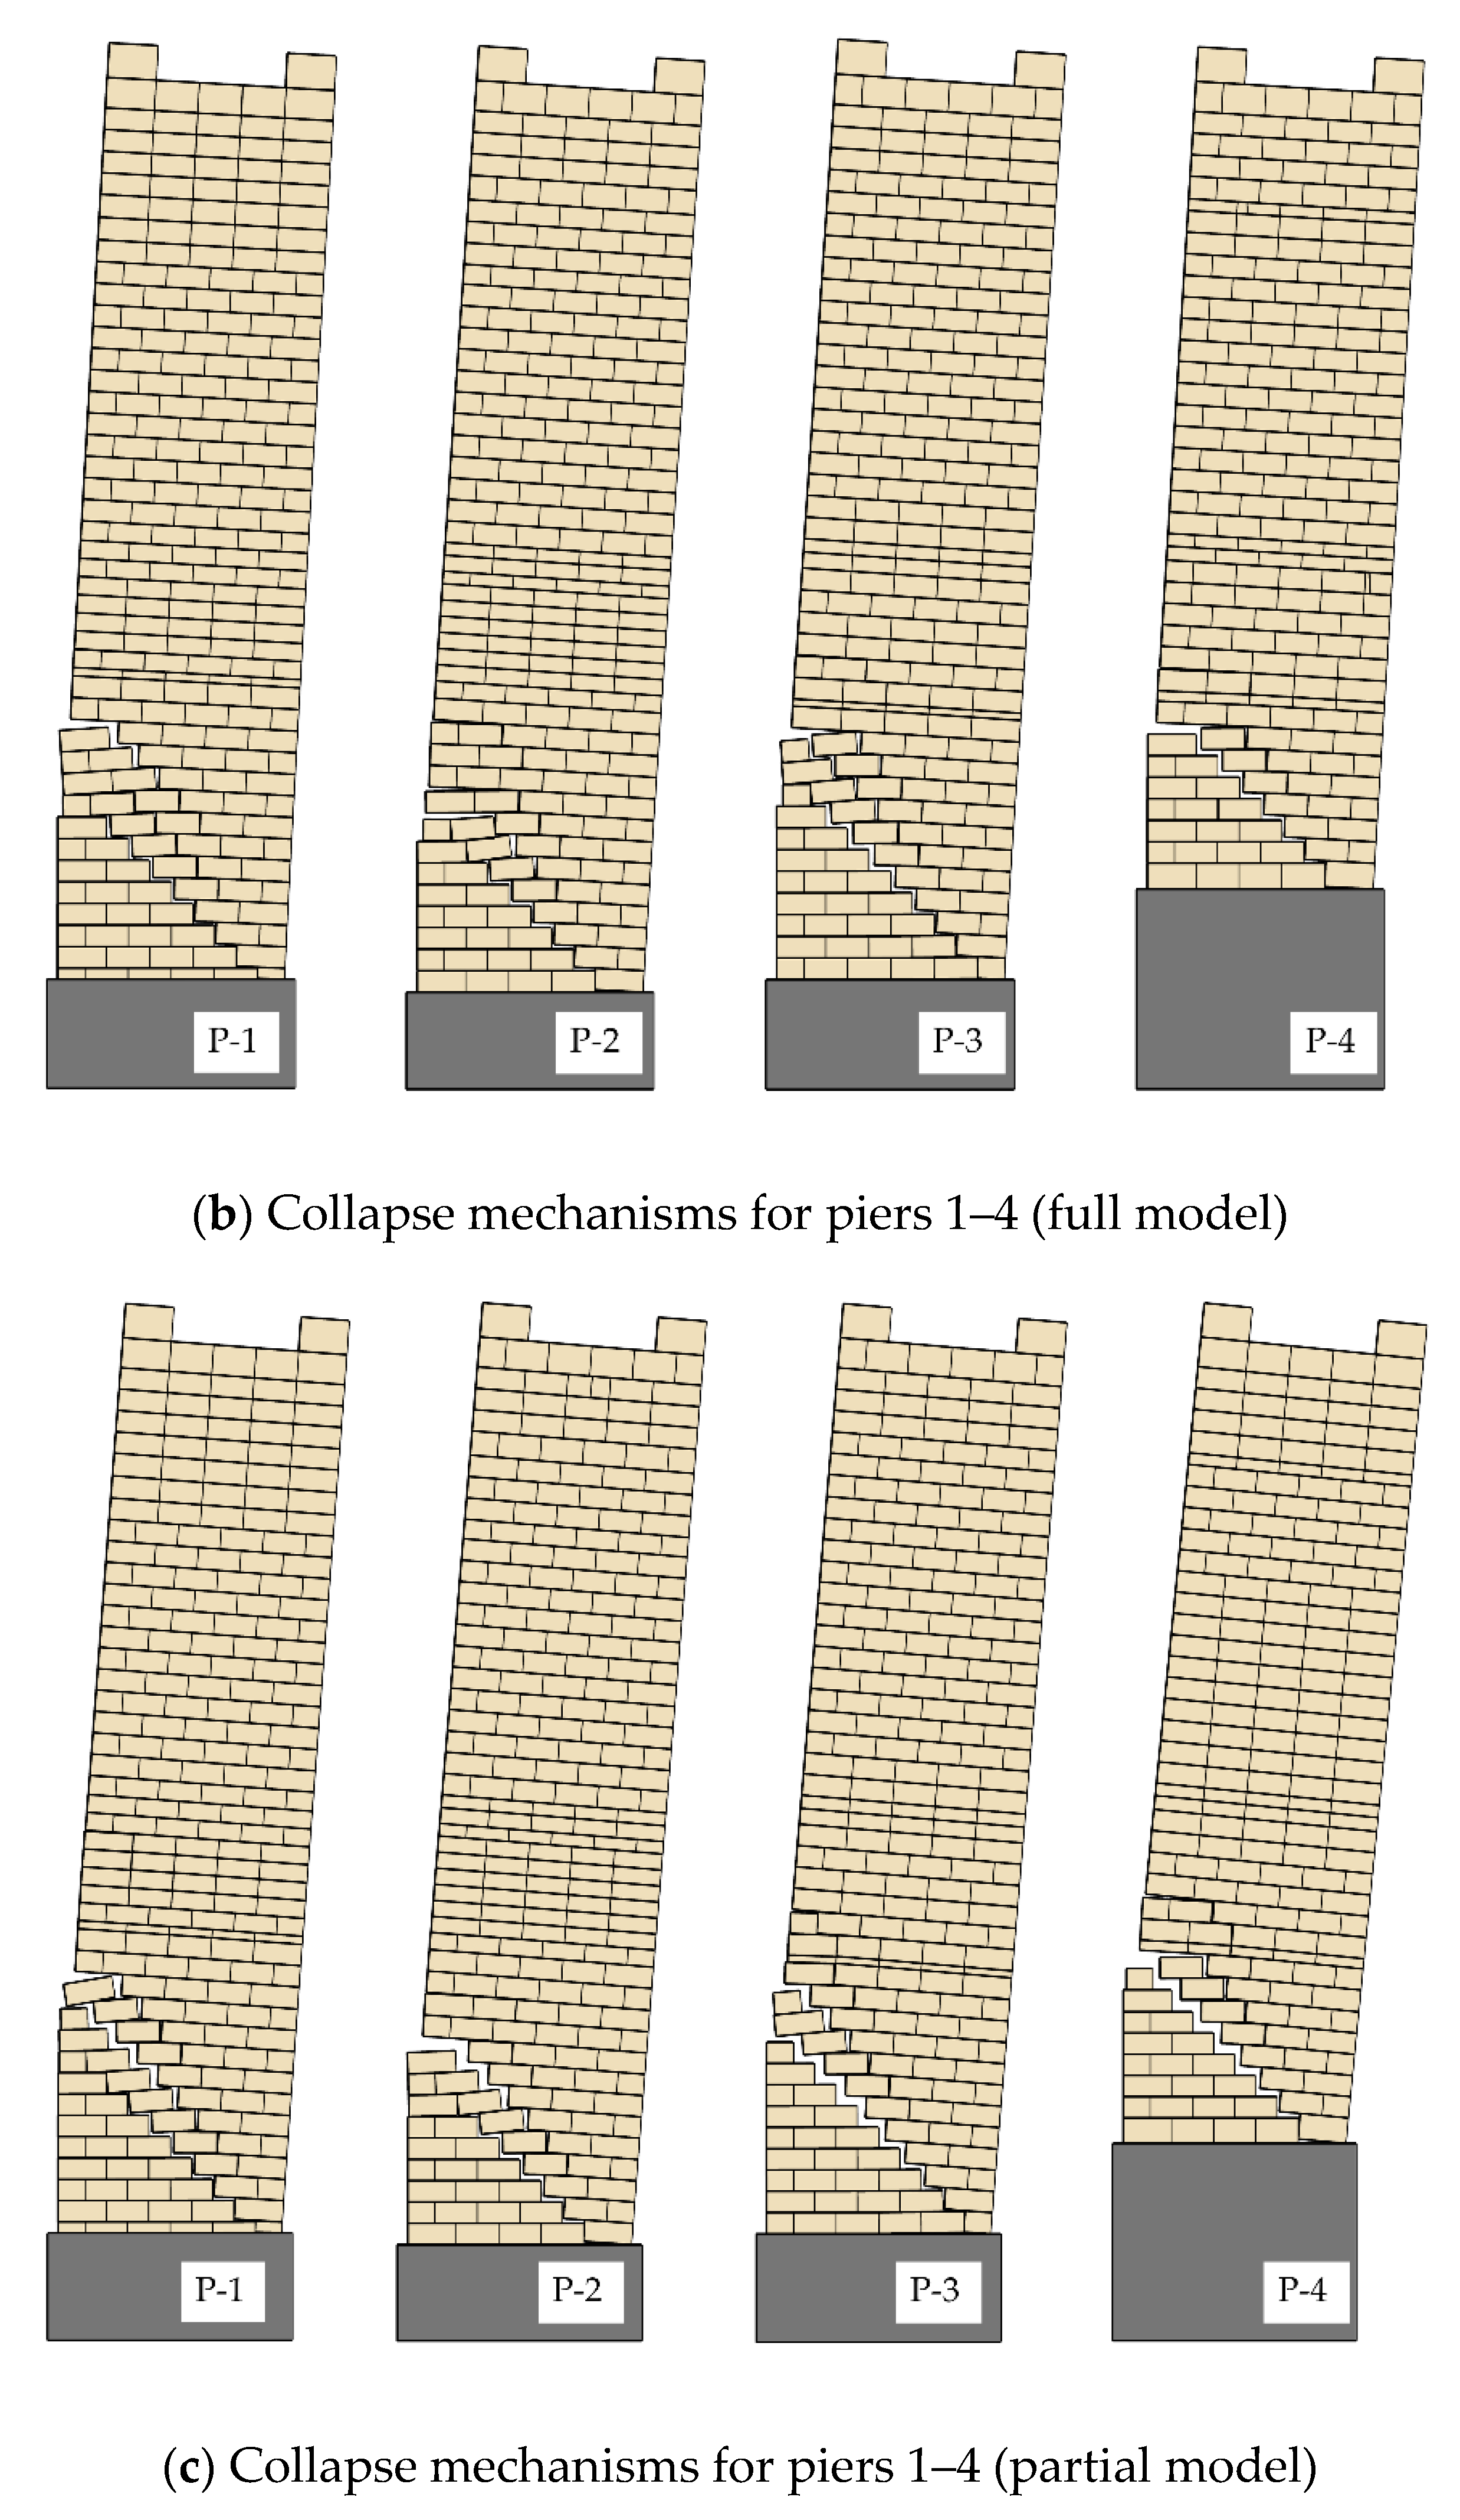
To compare the damage patterns and better visualize the failure mechanism at the piers, four of the severely damaged ones were selected from the analysis, as demonstrated in
Figure 8a. All four piers (captured from the partial and full models) indicated an over-turning collapse mechanism. The joint openings occurred due to higher flexural tensile stresses at the contact points and were followed by the progression of the crack towards the opposite bottom corner (or toe) of the pier, revealing a distinctive diagonal crack (see
Figure 8b,c). This failure mechanism was influenced by the joint tensile strength and the morphology of the wall cross-section, as discussed in [
36,
47]. Since a low tensile strength (i.e., 0.25 MPa) was considered at the joints, the piers demonstrated non-monolithic behavior that could cause successive joint openings, leading to single or multiple diagonal cracks, as can be seen in
Figure 8a,b.
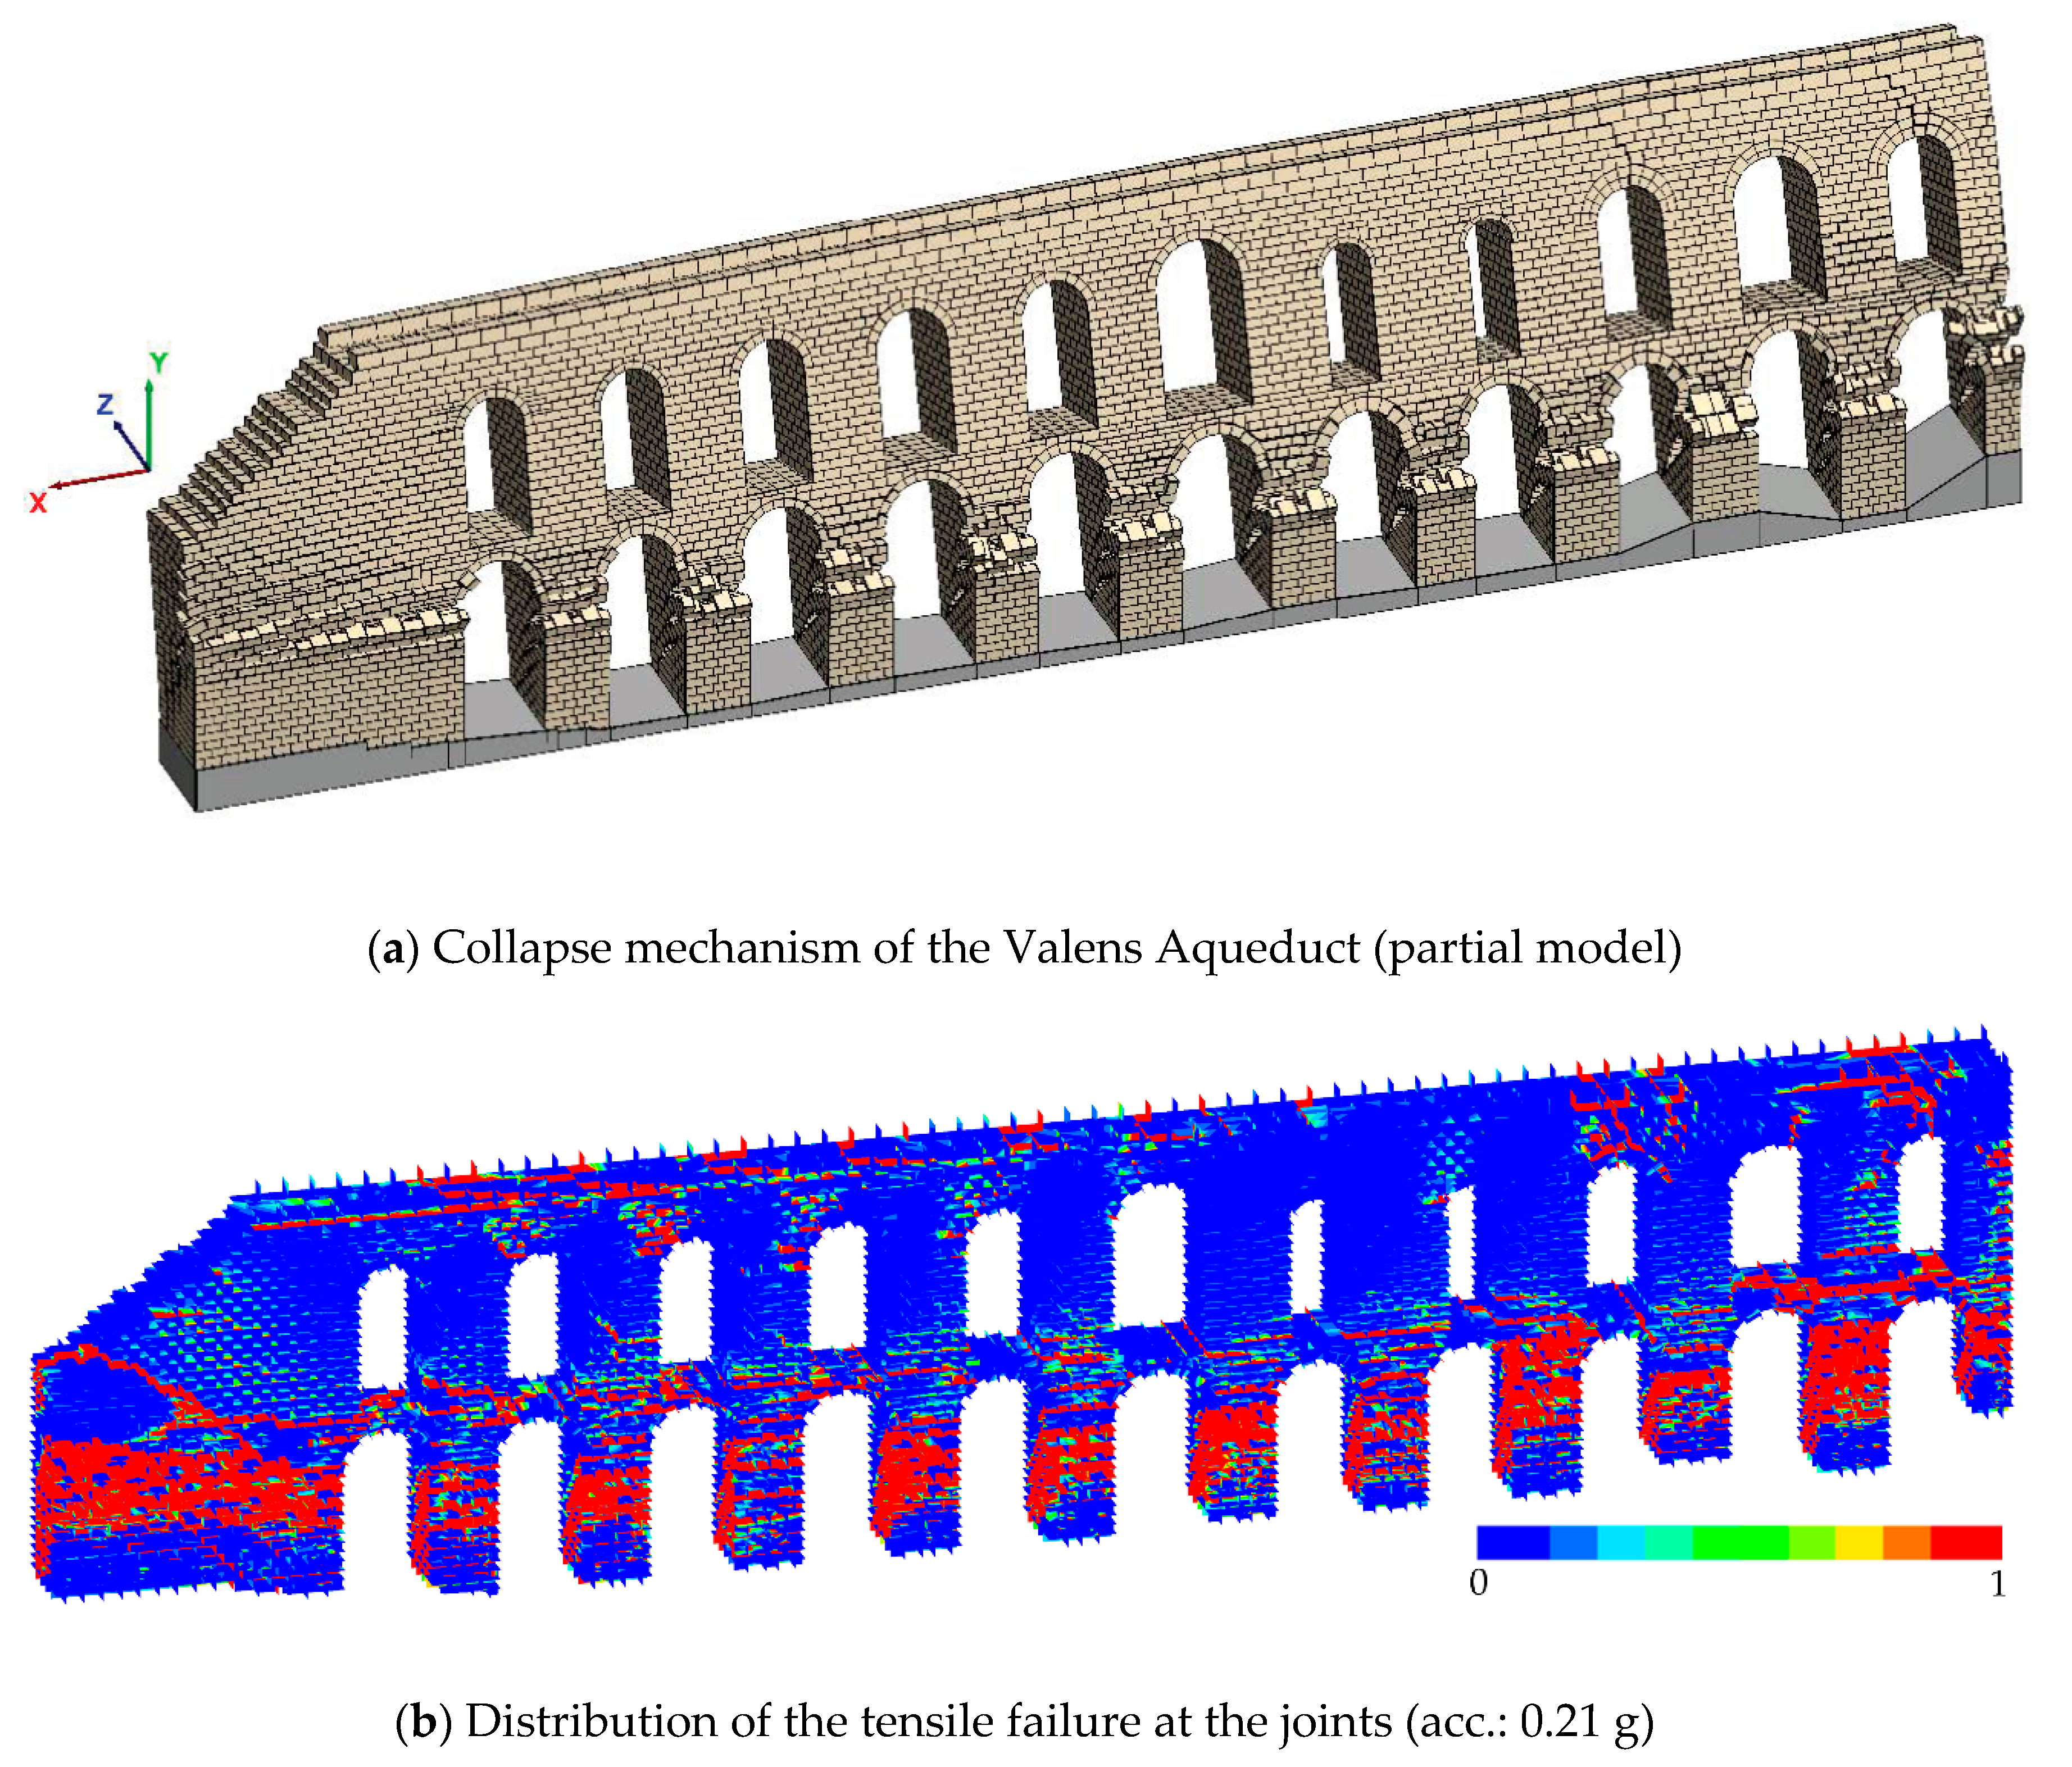
The global structural behavior of the aqueduct is shown in
Figure 9a,b, where the overall deformation and damage regarding joint openings are displayed. The results illustrate the development of contact opening not only in the piers, but also at the side-wall adjacent to the first pier (P-1 in
Figure 8a,b). In
Figure 9b, the tensile failures at the joints and overturning collapse mechanism of the wall can be seen. It is worth noting that the contact opening is represented via a scalar damage parameter (from 0 to 1), in which the full joint opening yields one, whereas zero means that there is no contact opening. Furthermore, substantial contact detachments were detected at the arches along with flexural cracks at the upper part of the spandrel (about the vertical axis) when the aqueduct started to collapse (
Figure 9c).
In line with the previous results, identical collapse mechanisms and structural behaviors were obtained from the partial model, as shown in
Figure 10a. The pushover analysis indicated localized tensile damages in the piers, contact losses in the arches, and cracks along the spandrel walls, as illustrated in
Figure 10b.
Given that both the structural behaviors (crack patterns and the collapse mechanism) and the ultimate capacity estimations are similar, it is beneficial to use the partial model instead of the full model due to the significant reduction in the computational time. As such, the sensitivity analyses regarding the contact properties presented in the next section utilize only the partial model.
4.2. Parametric Study on the Contact Properties (Partial Model)
This section aims to quantify the effects of contact parameters on the displacement response of the discrete element model. Parametric research was performed considering joint properties, namely the joint tensile strength, contact stiffness, joint friction angle, and compressive strength of the masonry. Because the collapse mechanisms did not change with the change in parameters, only the pushover curves are presented in this discussion.
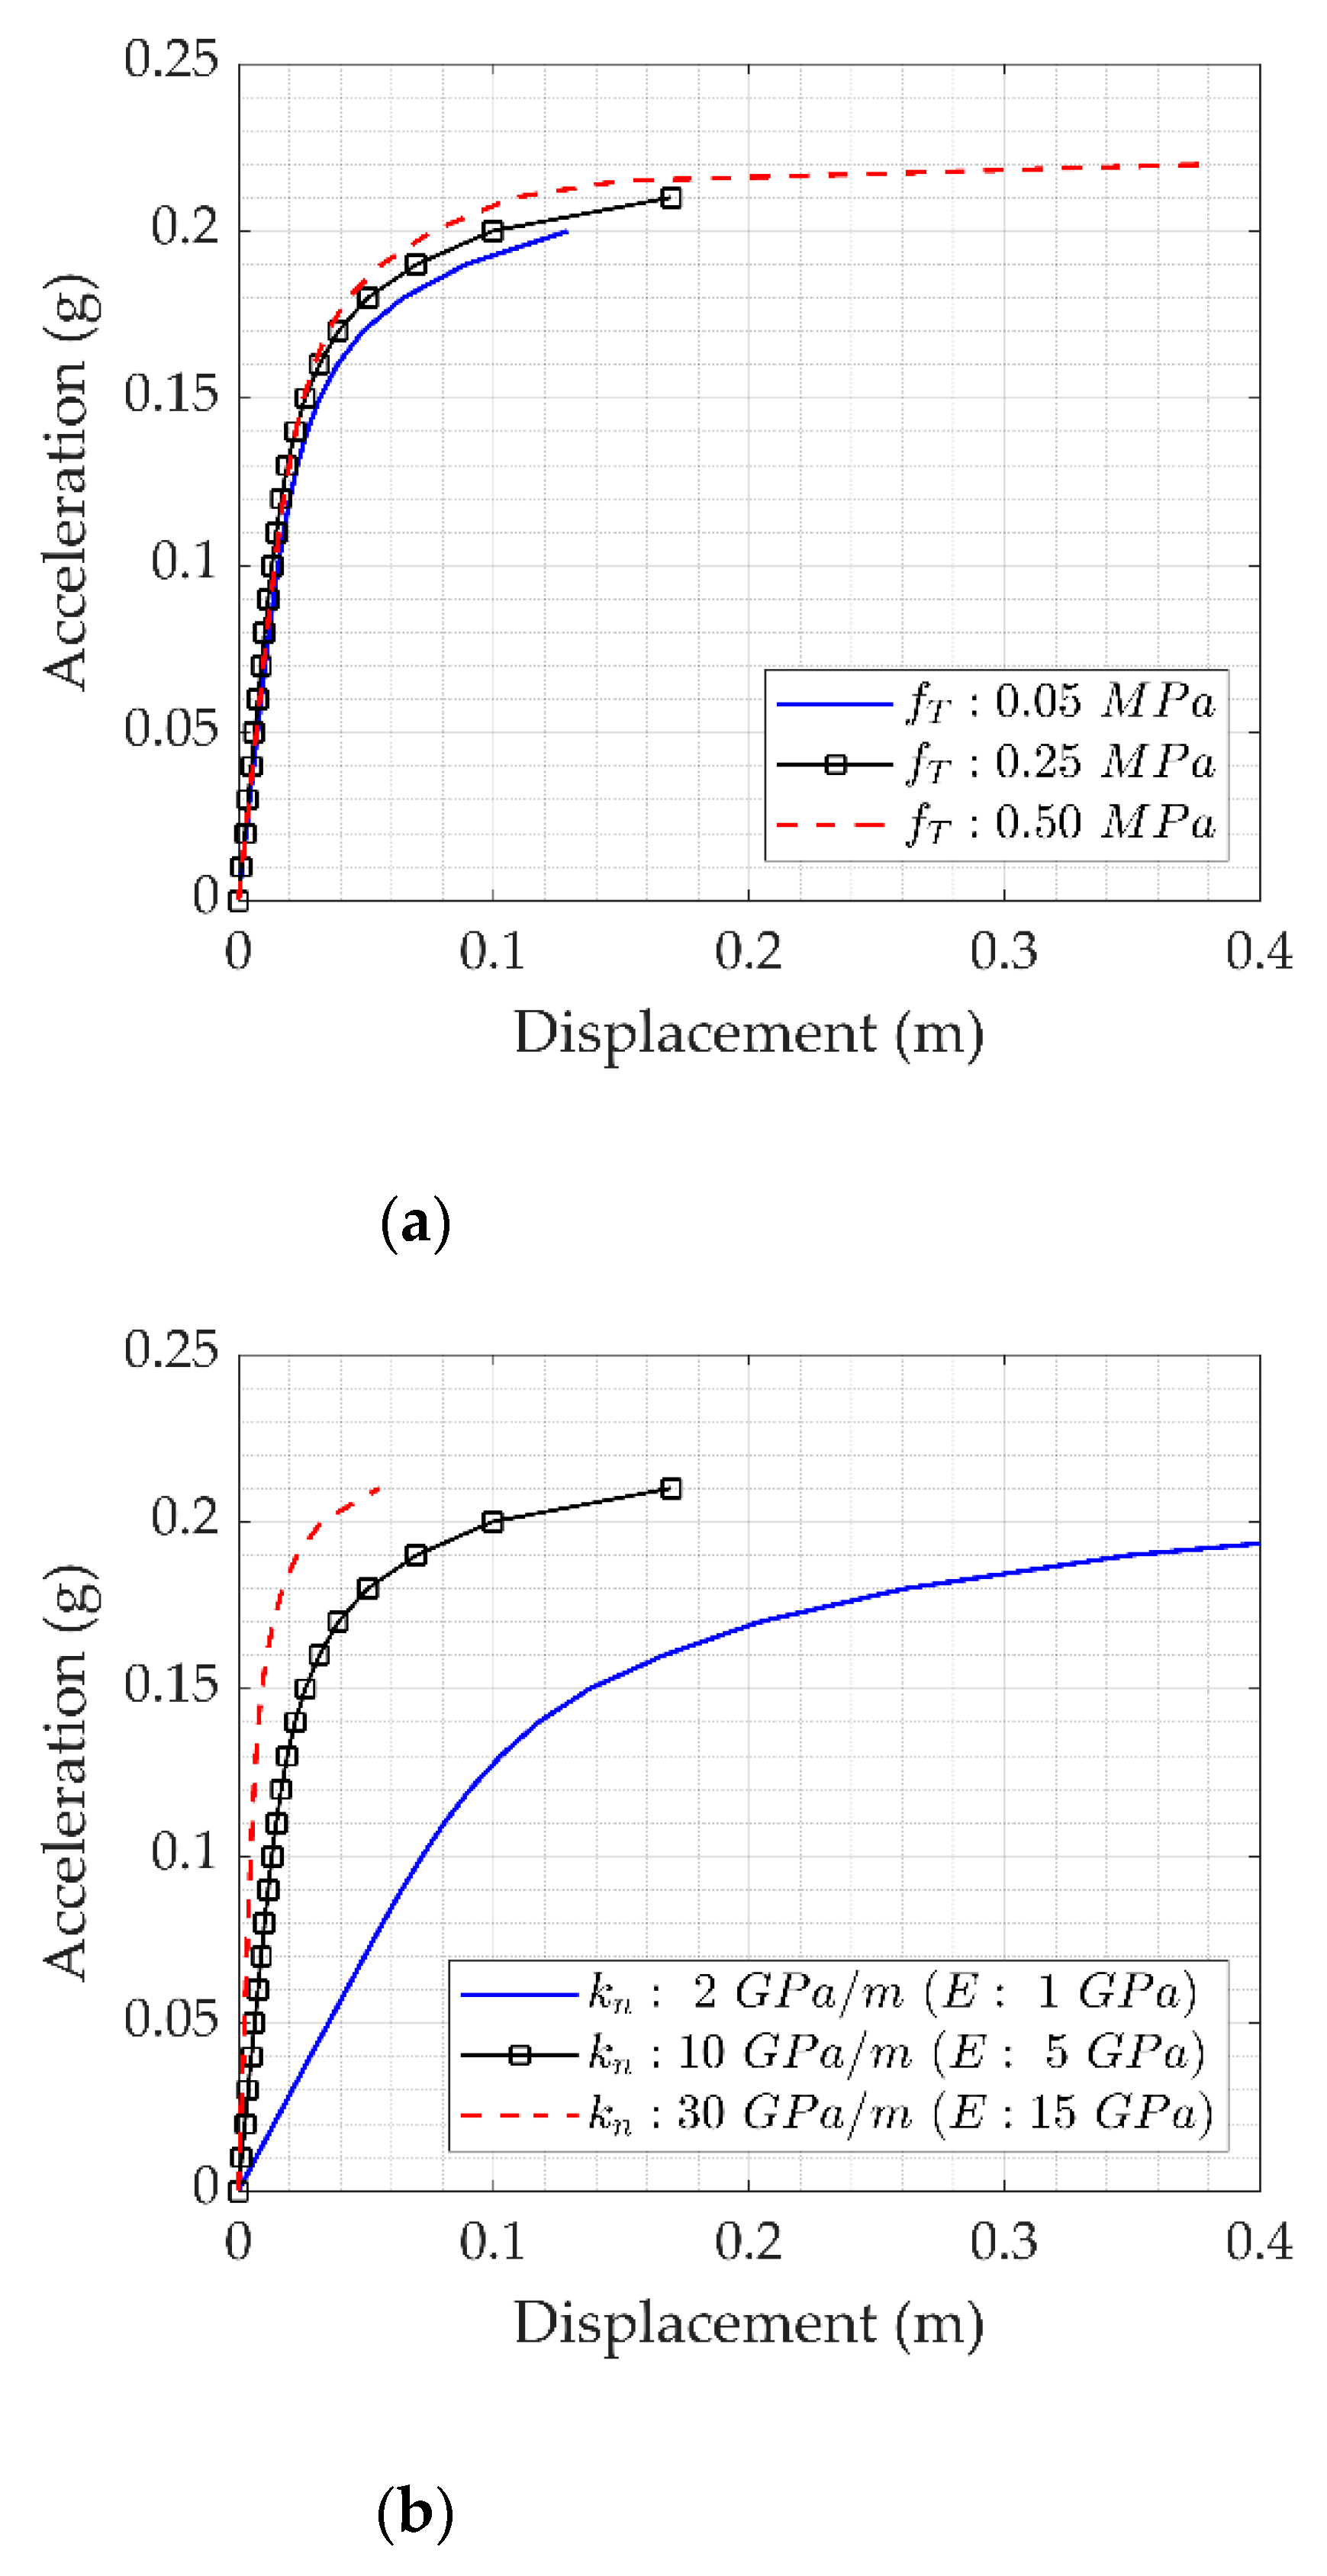
First, the tensile strength was varied from a negligible strength (i.e., 0.05 MPa) to a higher value used for similar structures, representing “good condition” in the bond between the units and mortar, such as 0.5 MPa. The results clearly indicate that when the tensile strength was within the prescribed interval, there was no considerable change in the seismic force capacity, as shown in
Figure 11a. In contrast, the deformation capacity increased significantly. On the other hand, a quite sensitive response to the acceleration was obtained for the contact stiffness, ranging from 2 to 30 GPa/m, which was directly calculated based on the stiffness of the masonry. The results indicated that the stiffness of the aqueduct had a pronounced effect on the behavior and deformation such that the lowest contact stiffness decreased the seismic capacity to 0.19 g with a significant deformation, whereas for higher contact stiffnesses, the capacity converged to 0.21 g with very limited deformation capacity (see
Figure 11b).
Figure 12a,b shows the influence of the joint friction angle and compressive strength on the seismic capacity. The results suggest that the numerical model was less sensitive to the friction coefficient compared to compressive strength, as defined at the joints. It is important to note that the compressive strength of the stone units may vary from 5 to 130 MPa for low- and high-quality limestone [
48]. However, special attention should be paid because the analyses performed here did not take into account the dynamic (or cyclic) behavior of the structure, where a friction coefficient may become more influential. Additionally, the critical value for the compressive strength seemed to be 20 MPa, after which the compression capacity did not influence the failure mechanism, but the structure failed due to the lack of tensile strength (
Figure 12b). In addition, the seismic capacity only increased by 5% when the compressive strength of the masonry was higher than 20 MPa.
4.3. Performance Assessment
This section presents a performance assessment of the Valens Aqueduct, which was carried out to find the performance point in the pushover curve. The behavior of the aqueduct at the expected earthquake hazard level was evaluated, and inferences were made.
The mass proportional pushover (MPP) procedure was performed based on guidance from the literature [
49]. The displacement vector (
Φ), which was obtained from the elastic analysis, was employed as the mode shape vector. In the MPP procedure, the total mass,
M, is used to convert the base shear force (
Vb) of the structure to a single-degree-of-freedom (SDOF) acceleration,
A, such that
. In addition, the SDOF displacement,
D, is calculated as
, where the modal participation factor,
Γ, which controls the transformation from the multi-degree-of-freedom (MDOF) to the SDOF model and vice versa, is obtained using Equation (8).
In this study, the aqueduct’s mass was discretized into eight nodes along the height of the pier that showed the maximum displacements in the pushover analysis. The displacement vector,
Φ, was determined from the lateral displacements of the discretized mass nodes. The modal participation factor and the acceleration–displacement response of the equivalent SDOF system were calculated according to the information provided above. The elastic demand spectrum was determined using the information provided in the Turkish Building Seismic Code [
50]. The elastic design spectrum was generated first by using the structure’s coordinates and setting the local soil conditions as ZB, representing a soil profile with a ground shear wave velocity between 760 and 1500 m/s. The intensity of seismic ground motion was chosen as DD-2, representing a 10% probability of exceedance in 50 years (or a 475 year return period). The acceleration–displacement response of the SDOF system was bi-linearized using the procedure defined in EN 1998-1 [
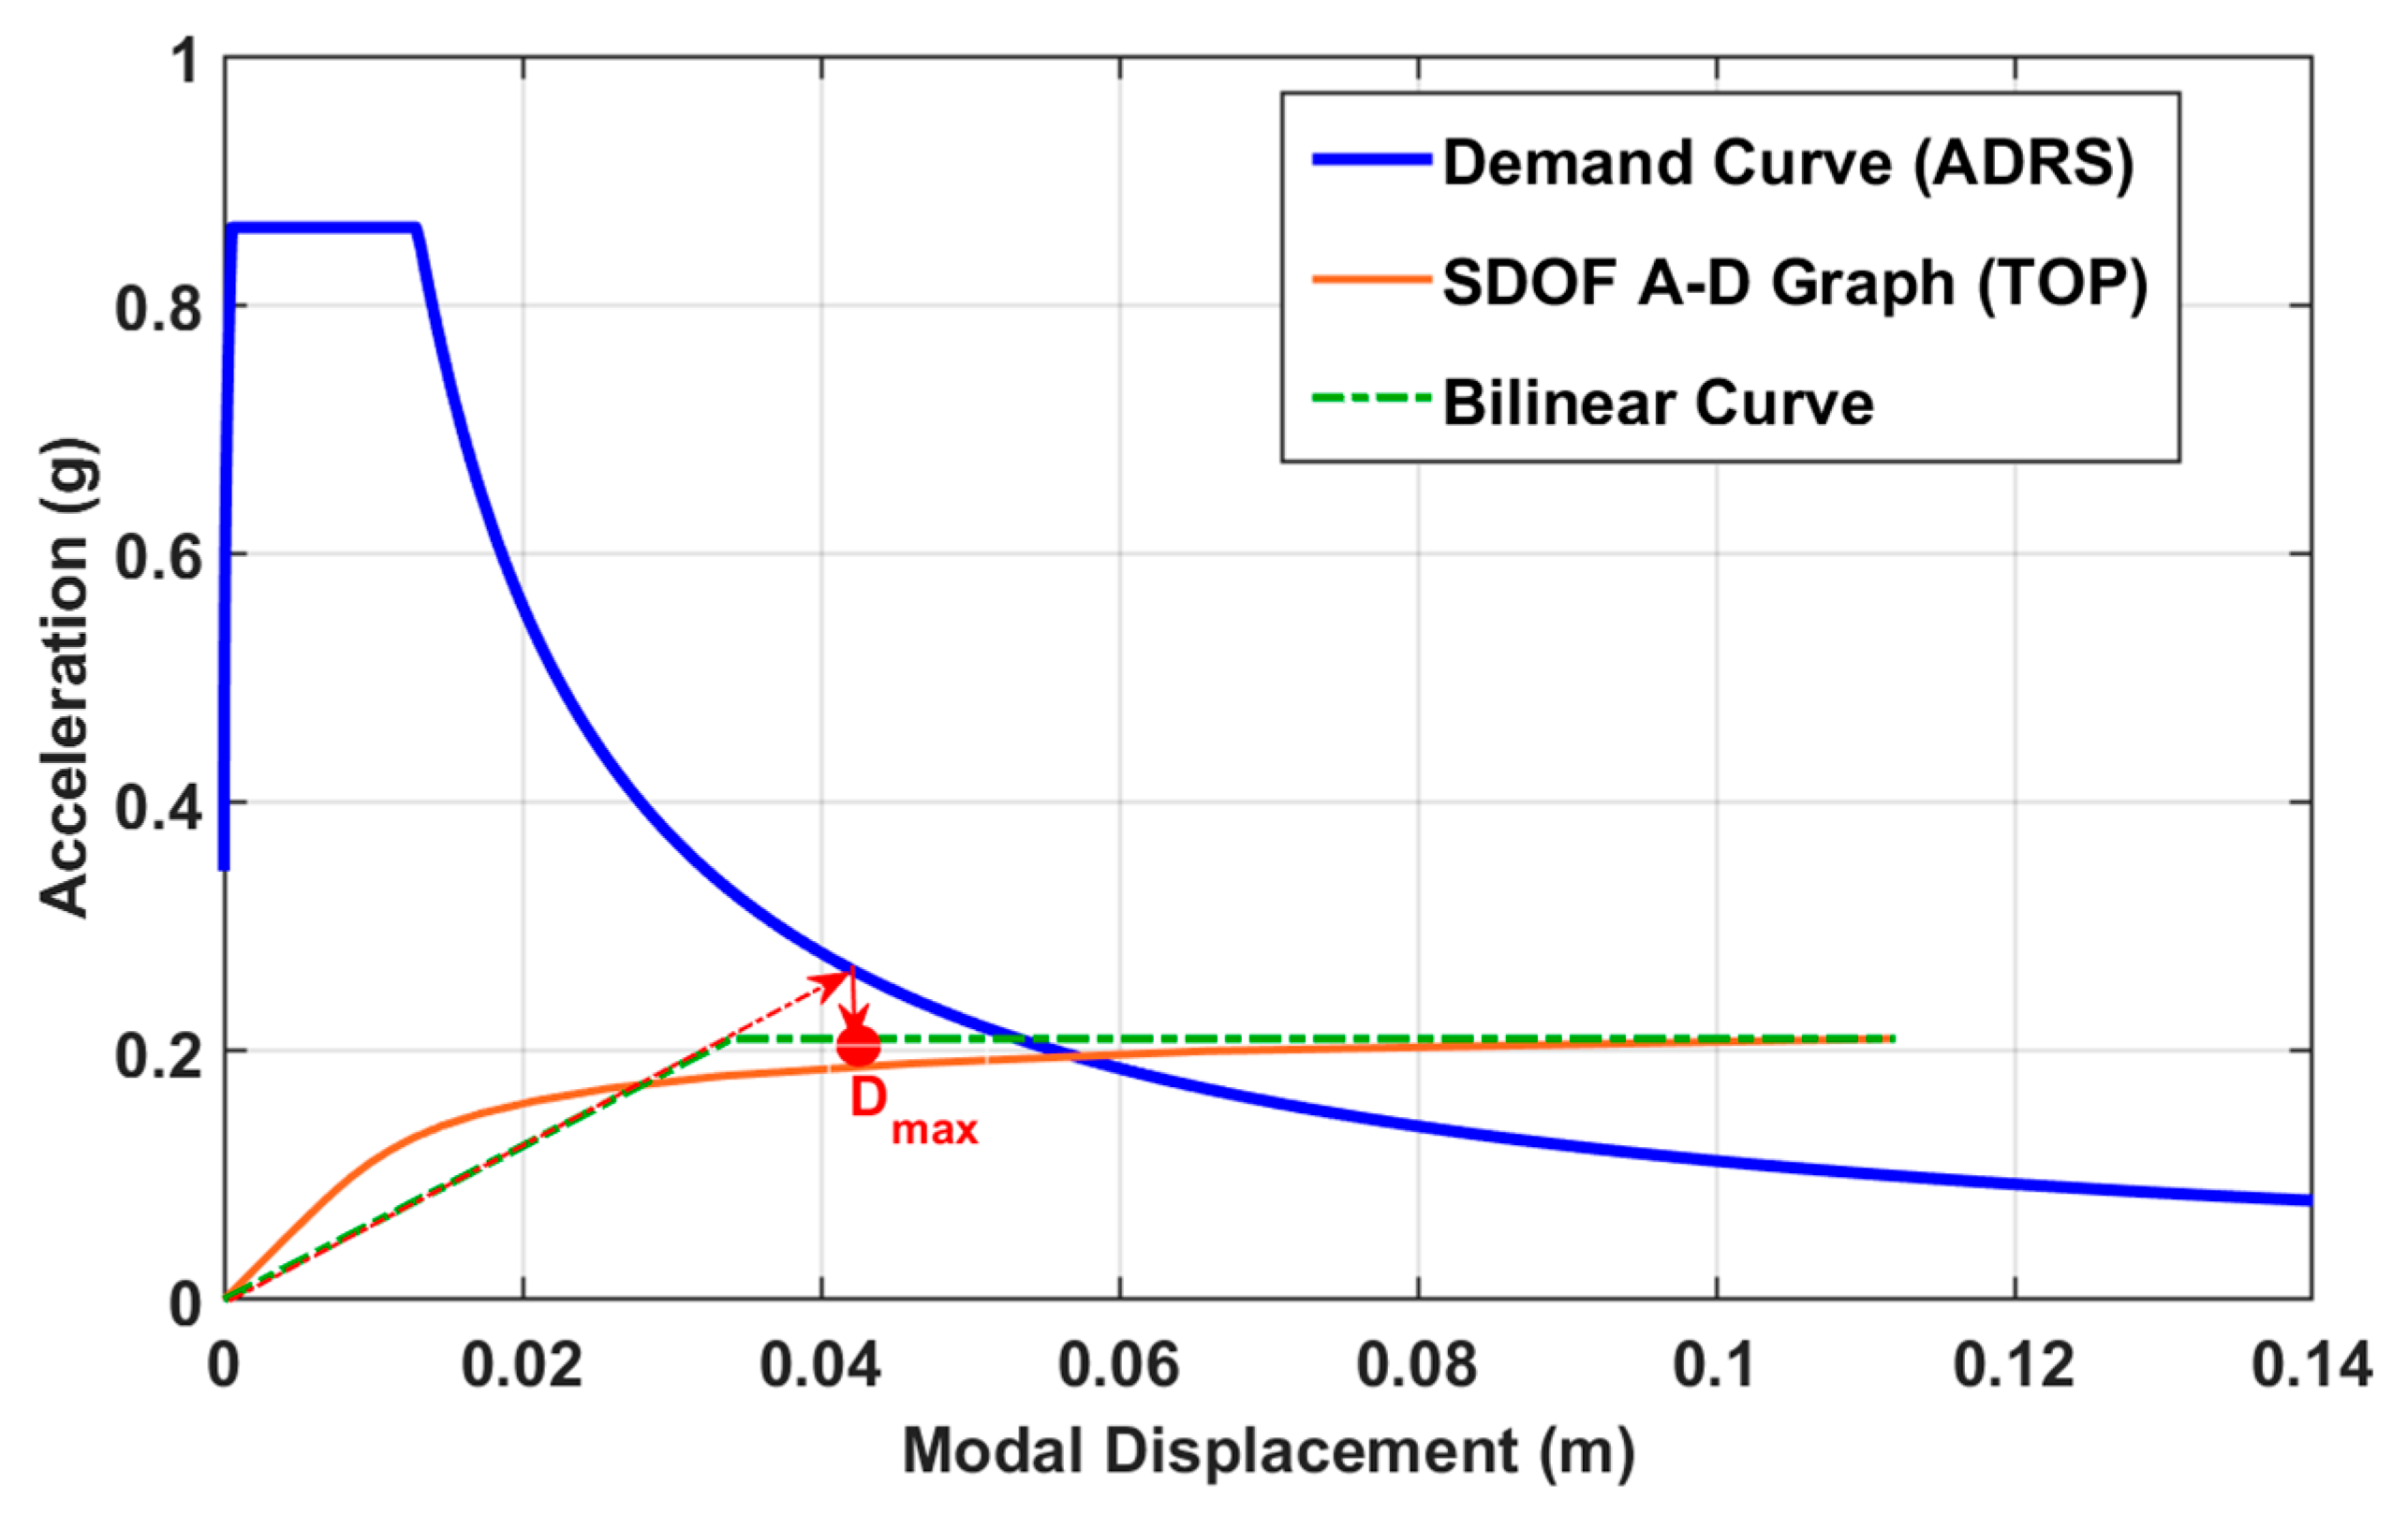
51]. The elastic demand spectrum and the bi-linearized SDOF curve were used to obtain the performance point in the modal domain, as illustrated in
Figure 13. The performance point, D
max, that showed the maximum modal displacement as 4.1 cm was then transformed back into the physical space to determine how much displacement a particular node would undergo during the design-level earthquake. The top discretized node’s displacement was found to be 6.19 cm.
Then, the pushover analysis was performed one more time; however, lateral forces were exerted until the performance point displacement was reached. The aqueduct’s behavior at the performance point displayed considerable damage in the piers and arches, representing diagonal cracking and contact losses, respectively. Moreover, some minor cracks were observed at the spandrel walls, as shown in
Figure 14.
When the aqueduct’s capacity was analyzed, it was seen that the out-of-plane displacements were significant and reasonable. On the contrary, the maximum acceleration response (0.22 g) was even lower than the peak ground acceleration (PGA) of the design-level earthquake (0.39 g). This implies that the Valens Aqueduct is vulnerable to earthquake loading. However, the outcomes of the pushover analyses should be interpreted with caution, since they may provide conservative (lower-bound) results compared to nonlinear time-history analyses, as discussed in previous studies related to masonry arch bridges [
7] and other complex masonry structures [
52,
53]. Hence, a nonlinear time-history analysis is recommended in order to verify the concerns about the vulnerability of this and similar structures to serious seismic events.


