1. Introduction
“Understanding a wall complex” in the regulatory and structural context of buildings is today a challenge that seems to find its solution in the realization of its digital model.
The typical work setting for an architectural survey, still today, is based on the measurement and graphic rendering of a limited number of flat and orthogonal sections, thus configuring the survey and restitution operations as substantially two-dimensional operations, even when topographic or photogrammetric restitution tools are used through the inverse perspective [
1]. However, more and more frequently today, we are witnessing the spread of digital tools and techniques (laser scanning) that enable to operate directly in the three dimensions, in the relief as in the restitution, facilitating the solution of particular problems, difficult to solve by working in two dimensions [
2]. The masonry structure, object of the study, is a Latin cross church with three naves and a transept, whose structure was strongly modified in a 1774 wall complex that rests on a vast underground site, a set of “voids” at below the floor level, which makes the work above very vulnerable and potentially dangerous for the safety of citizens. The Church is in the historical center of Matera, characterized by the presence of underground cavities, variously located along the calcarenite terraces of two valleys flowing into the “Gravina” stream, on which the urban settlement of the “Sassi” was built over the years.
An underground site is a negative space, which generated by the subtraction of matter, a complex space where each element, by its structure, shape, and function, is closely connected to its surroundings.
The presence of these cavities is a serious risk for the safety of the overlying structures and the population, due to the possible sinkhole collapse of the buildings and infrastructures built on them [
3].
Often the signs of the underground structures are not easily readable in the urban context in which they are located and even less correlated to the degeneration processes of the state of conservation of the work, as in the case study. The existing documentation of the Church, in relation to the stratifications and transformations undergone over time, has led to a series of contradictory interpretations on the spatial relationships between the individual environments and the totality of the site investigated. These spatial relationships are difficult to understand due to the complexity of the hypogeal structure, denied to the investigator [
4] and underlying the wall complex.
The assessment of the safety degree of this historic monument is a complex process requiring stability checks that cannot be separated from the timely reconstruction of an overlying hypogeum-structure model that is difficult to create, due to the lack of numerous information: the exact extension and geometry of the underground cavities, the geometry and construction characteristics of the overlying artifacts [
5].
So, this process of knowledge cannot be limited only to the more strictly “physical” knowledge of buildings or artifacts of historical-cultural interest and in general of the cultural heritage of a district, but it is a complex process that must necessarily include the collection of several data and information for the innumerable semantic aspects concerning the various characteristics that form the urban system and influence the state of conservation of a masonry or single building of particular importance.
To date, there is no recognized methodological approach, which, based on the tools of 3D relief and representation, manages to make these underground cities, hidden from the citizens and visitors’ eyes, to dialogue with what is built above, consequently, seismic vulnerability studies, such as those carried out on the Church under study, may be incomplete and do not correspond to a correct management of the territory [
6].
The problem is complex and requires a structure cognitive tool, enabling to frame and correlate all information not only of an archaeological/architectural but also urban and environmental type [
7,
8], generating digital format data, with a good reliability and verified degree.
It is in this context that HBIM (Historical or Heritage Building Information Modeling), a process applied to existing buildings, whether monumental or not, plays an important role in experimentation and research. The basic idea is to increase the potential of the BIM (Building Information Modeling) method, extending its use to the creation of models of existing buildings and historical ones, which, by its nature, is the result of different stratifications and architectural changes over the years.
However, creating a 3D model of a historic building, in which the results of a digital and geometric 3D rendering can be brought together, with the aim of creating intelligent and information-rich models in historic buildings for restoration interventions [
9] and securing, is a current research topic, as, in every context and case study, there is always a lack of clear project documentation, differently found in new projects.
Merging the numerous and detailed information, including semantic [
10], in a geospatial model, describing each structural component, requires valid scientific support in the field of civil engineering and compliance with a constantly evolving legislation, through the definition of specific protocols [
11,
12].
Even if the characteristics are related to each other, by their nature and position, they require advanced digital platforms for the 3D representation of the city in every small part or structural component and the definition of a scientific methodology, to date, hardly validated its processes.
Upstream, it is essential to carry out an accurate historical, geometric, and material investigation of the artifact, without which it would not be possible to plan and better define the subsequent engineering interventions. This phase is fundamental and consists in the survey and subsequent restitution of all the information with acquisition methods capable of focusing and describing every single detail in an effective and complete way [
13], up to obtaining a virtual model particularly faithful to reality.
Downstream of the 3D modeling process and before planning any type of intervention, it is essential to scientifically verify the spatial relationships between the individual structural elements of the model and its relations with the external environment, avoiding any erroneous and contradictory interpretations [
14,
15], that would question the planned intervention.
The goal of this research was the creation of an integrated support system for the assessment of structural safety under vertical loads and seismic vulnerability, the definition of possible intervention solutions on buildings, but in a highly articulated scenario.
For the purposes of the investigation campaign conducted (LC1—Level of knowledge as required by the Ministerial Circular No. 617/2009), the spatial relations deduced on a larger scale in the “full void” of the underground structures of the Rione Sassi were systemized in the City of Matera [
16] with those inferred on a smaller scale, in the mentioned wall complex—Church and Prefecture (building annexed to the Church), avoiding the execution of invasive tests on site [
17] (e.g., flat jacks, diagonal compression, core drilling).
The presence of a relevant crack pattern in some primary structural elements (e.g., columns) of the Church did not permit the execution of invasive tests on site.
As reported in the Ministerial Circular 617/2009 [
18], in existing masonry buildings, the level of knowledge LC1 is considered reached when the geometric survey, limited in situ, checks on the construction details and limited in situ investigations on the properties of the materials, have been carried out (complete survey with graphic rendering of cracking and deformation patterns).
The document first (paragraph 2) examines the Italian legislation and the specifications it requires for the representation of 3D models and the necessary information in the field of construction, recovery, and consolidation interventions, for the purposes of structural analysis as well.
We list, in summary and below, the fundamental steps of the developed methodology:
Search for documentation, historical sources, and preliminary investigations for the identification of any transformation phenomena of an existing masonry building, useful to evaluate the structural behavior;
Design and implementation of a survey campaign with digital terrestrial photogrammetry, laser-scanning, and integrated techniques (photogrammetry and laser-scanning);
Digital reconstruction of the Church, from 3D scanning to mesh modeling and validation of the meshing process;
Geometric analysis for the identification of any displacements and deformations on the 3D mesh model;
Evaluation of the structural behavior of the masonry building, with the use of a 3D model enriched with information resulting from sensors and verification of the representing phenomena process in progress.
The results of the methodology applied to the study case are described below and according to the steps listed above.
2. Regulatory Framework for Construction
In this context, the need to deal with the problems of a monumental complex of historic-artistic value is not an easy task, which in recent years has involved more and more scholars, technicians, and legislators to define common strategies for a good practice to build construction, and their preservation and protection.
In this paragraph, we analyze the Italian regulatory framework concerning the qualitative analysis and assessment of the seismic vulnerability relating to existing masonry buildings, for the purpose of evaluating the structural behavior, with the aim of defining the technical specifications required by the legislation for the construction of an effective 3D model.
The construction of a virtual model of the Church and its associated attributes have allowed a more efficient and less onerous analysis and control than traditional processes, creating a shared and accessible working environment. Making it possible to convey, (without loss of information) all the contributions of the various professionals involved, in a coherent format that makes all the professional roles and responsibilities explicit [
19].
Specifically, the target was to integrate all the information concerning the various surveys. Including: the geo-referenced geographical classification, the geometry of the work, the properties of the materials and technical elements, the information obtained from analogue monitoring operations (with a single central model aimed at a much more incisive reading of the state of conservation of the work), the identification of the causes determining its structural failure, and the need to carry out widespread static consolidation interventions.
2.1. Technical Standards for Construction (NTC)
The new philosophy of dealing with the study of the structure of a building as a whole, and no longer “by parts”, led to the definition of an important text: the “Technical Standards for Construction” [Norme Tecniche per le Costruzioni ndt.—NTC], aimed at the management and safety of the built heritage. The NTC is a document introduced for the first time as the “Unified Text” in 2005 (Ministerial Decree of 14 September 2005), which defined the guidelines for the application of the technical regulations set out in the ordinances issued with the OPCM of 2003 and 2005 (Ordinance n. 3431).
In recent years, the natural disasters that have hit Italy lead to the issuing and updating of new technical regulations [
20].
For instance, the earthquake in L’Aquila was followed by the rapid implementation of the important Ministerial Decree (ndt.—DM) of 2008 which became operative a few months after the tragic event. In addition, the earthquake in central Italy in 2016 was followed by the DM of 2018, underlining the importance of a legislature aimed at preserving the safety of buildings and, consequently, identifying a correct approach before planning interventions on buildings.
The methodology, clearly defined in the above-mentioned documents, starts from an important concept: the “knowledge” of the buildings must precede any intervention.
This need for knowledge has been felt to the extent that legislators have been prompted to include in the latest regulatory texts of the NTC, a specific part dedicated to the survey phase in existing buildings preparatory to interventions, from its totality to the smallest details. It is on the basis of this concept that the Ministerial Circular no. 617 of 2 February 2009, implementing the Ministerial Decree of 14 January 2008 “New Technical Standards for Construction” in chapter 8, introduced the concept of “Level of knowledge” to the “Existing Constructions”, which defines the procedures for the geometric-structural survey, structural details, the mechanical characterization of materials, and the analysis method to be used [
21].
This important chapter is re-drafted in the last revision of the NTC, updated by the Ministerial Decree of 18 January 2018 and applied with Circular no. 7 of 21 January 2019 [
22].
The attention towards the analysis phase is explained in particular in paragraph C8.5 “definition of the reference model for analysis” of the Ministerial Circular 7/2019. It is then explained through sub-paragraphs dedicated to the historical-critical analysis, to the survey and to the characterization of the materials. In the process, the levels of knowledge and the confidence factors are extremely valuable, being considered as indexes of the level of in-depth analysis reached by the surveys. All these procedures enable to identify the correct capacity parameters in correlation to the level of knowledge.
Regarding the levels of knowledge (abbreviated LC [Livelli di Conoscenza ndt.]), concerning geometries, structural organization, construction details and materials, there are three possible degrees of in-depth study reached by the surveys. These degrees are distinct from each other on the basis of the type of surveys and checks carried out on the building: LC1—Limited Knowledge, LC2—Adequate Knowledge, and LC3—Accurate Knowledge.
All Knowledge Levels have the activity of survey in common. This activity must be rendered with the utmost accuracy, playing a role of primary importance.
This concept is discussed in detail in part C8.5.2 of the Ministerial Circular 7/2019 and, in particular for masonry constructions, in sub-paragraph C8.5.2.1., explaining the methods for carrying out the survey according to three “in situ verifications” methods: limited, extensive, and exhaustive verifications, which are characterized by an increasing level of knowledge of the building elements.
The “Limited in situ verifications” are based on visual surveys made using generally the removal of plaster and by testing the masonry, while for the extended and exhaustive verifications, more extensive and widespread exploratory tests are necessary and carried out in a systematic manner.
Whatever the level of “Verification”, the first phase for the building knowledge is entrusted to a careful campaign of geometric-structural survey, direct/indirect, and instrumental, to acquire the necessary information for the characterization of the building.
2.2. Models and Digital Documents According to the Regulations
Unlike a CAD drawing, a virtual model is the product of a well-structured and organic process, which can be expressed as the result of graphic data: a 3D information model, to which are associated non-graphic information, technical data sheets related to materials, timescales, and documentation related to the design, execution, and maintenance of the work.
It is essential to define a precise strategy for data management which, (starting from input data digitized in a common and shared environment), favors every type of correlation for the generation of a final output. Nowadays, the use of information modeling in all its aspects is sparsely growing [
23]. Yet it is the only way to manage information linked both to the territory and to the structural/architectural work [
24] thus identifying, with a wider scope, the multiple interactions of the work with external factors to it and that can condition its state of conservation.
This process is even more effective in presence of complex geometries (such as those linked to the building) together with particular structures such as the hypogea of the City of Matera, where managing three-dimensional trajectories, intersections, and objects is a very complex task.
All this translates into a very high number of elements to manipulate and consequently to model and coordinate. The work has resulted in the integrated modeling, still under development, of a large amount of data coming from the different disciplines, to which as many parameters are associated.
One of the requirements, considered fundamental for the construction of a single federated model, is the adoption of a standard format for the exchange of information between different disciplines to guarantee interoperability, (an essential requirement to complete integration and collaboration between the different actors in a building process) [
25].
Currently, infrastructure modeling is carried out not only using traditional BIM tools, with the integration of visual programming and work implementation tools within the design team, but also with the use of software packages and platforms based on the construction of information on innovative interoperability paradigms.
It was, in fact, the wide use of BIM that moved the competent authorities towards the regulation of this process, thus defining the national UNI 11337 standard [Ente Nazionale Italiano di Unificazione ndt.—UNI], for the digital management of construction information processes. The standard, divided into ten parts, is constantly evolving and regulates the digital management of constructing processes in construction, dealing specifically with: models, processes, and information objects for products and processes, evolution and information development of models, processes, and objects, and information flows in digitized processes (UNI 11337).
At the beginning of 2017, parts 1, 4, 5, and 6 of the regulatory framework have already been published, and have been added to the already existing part 3 (the only part still valid of the old 2009 framework, where 4 years before the PAS the BIM was introduced in a national regulatory text) (UNI 11337:2009).
Only recently the last two parts, considered necessary to deal with important aspects such as administrative management and maintenance, have also been introduced into the regulatory system, completing the overall regulatory framework.
The ninth part of the regulation deals with: the “Due Diligence” and digital survey (point clouds, thermographies, tomographies, etc.), the construction rules of the company’s “Collaboration Platforms” (above the object libraries and ACDat/CDE order sharing environments) and, first of all, the digital “Fascicolo del Costruito” (Building File), consisting in the building dossier (to understand not only the construction but also how to deal with the infrastructures and the anthropomorphic environment) and the stage of development (to understand the information management in operation in the life cycle).
Part 10 of the standard, on the other hand, addresses the new BIM issues towards administrative management aspects; what in Building Smart International (BSI) is called e-permit BIM. After a series of tests performed on: SCIA, DIA, and Build Permit, the UNI table has decided to address this aspect of digital information management [
26].
It is well known that the standard is applicable to any type of (resulting) product in the sector, be it a building or an infrastructure, and to any type of process of conception, production, or operation, aimed at the new construction as well as the conservation and/or requalification of the built environment or heritage.
Therefore, thanks to the UNI11337 [
27,
28] standard, another way of approaching and solving certain problems in an efficient and effective way is also being discovered: uses and objectives of the model, Levels of Detail (LOD) for restoration and equipment, LOD for the life cycle, naming by attributes, administrative verification and digital protocol, collaboration platform, information management manual, detection models, etc.
The principle is to “virtualize” any information content (processed in Word format, graphic tables, DWG, etc.) through the regulations, thus introducing a representation both in a graphic sense (2D, 3D, etc.) and in a documental sense (spreadsheets, metadata, PDF, etc.) of the model elements. Objects are described on the basis of specific “development levels”, more than just detail levels (LOD); specifically, UNI 11337-4:2017, distinguishes between LOG (level of development of objects—geometric attributes) and LOI (level of development of objects—information attributes) [
29].
In the case study, the real object to be “virtualized” is very complex, as it is a historical structure that presents structural irregularities and asymmetries, to the point that, for the initial structural analysis conducted by structural engineers, it was necessary to adopt suitable safety coefficients (confidence factors “Fc > 1”) that had to take into account the cognitive uncertainty of the geometry, as well as the schematization of the mechanical characteristics, constraint, and load applied (limited Lc confidence level).
A further problem is the context in which the real object is found: on a larger scale in the “void in full” (typical of the hypogeal structures of the stone districts) and on a smaller scale in a complex structural organism under examination (Church and Prefecture) where, due to the monumental characteristics of the structures, it is impossible to disregard the modeling of underground works (due to the presence of the hypogea, an integral and underground part of the Church, and which have made the process of “virtualization” even more complex).
Unlike building constructions, where the information model is limited to the main work and at most to its context, in the design of an infrastructure, that also develops underground all the interactions it has with the surrounding environment, must be taken into account. However, while the BIM approach guarantees a series of tools for the modeling of civil works, currently there is no coded system for the introduction of terrain modeling parameters relating to areas with a higher level of “sinkhole” risk into the process. These areas are classified taking into account the thickness of the calcarenite covering according to the relationship to the loads transmitted to the ground by the structures, but whose evaluation is complex and cannot be separated from the reconstruction of a geometric and geomechanical model of the hypogeal-structures ensemble.
In addition to this, the wide variety of construction techniques and materials used in masonry construction makes it even more complex to model the structural behaviour of the building, questioning the reliability of the results in safety assessment.
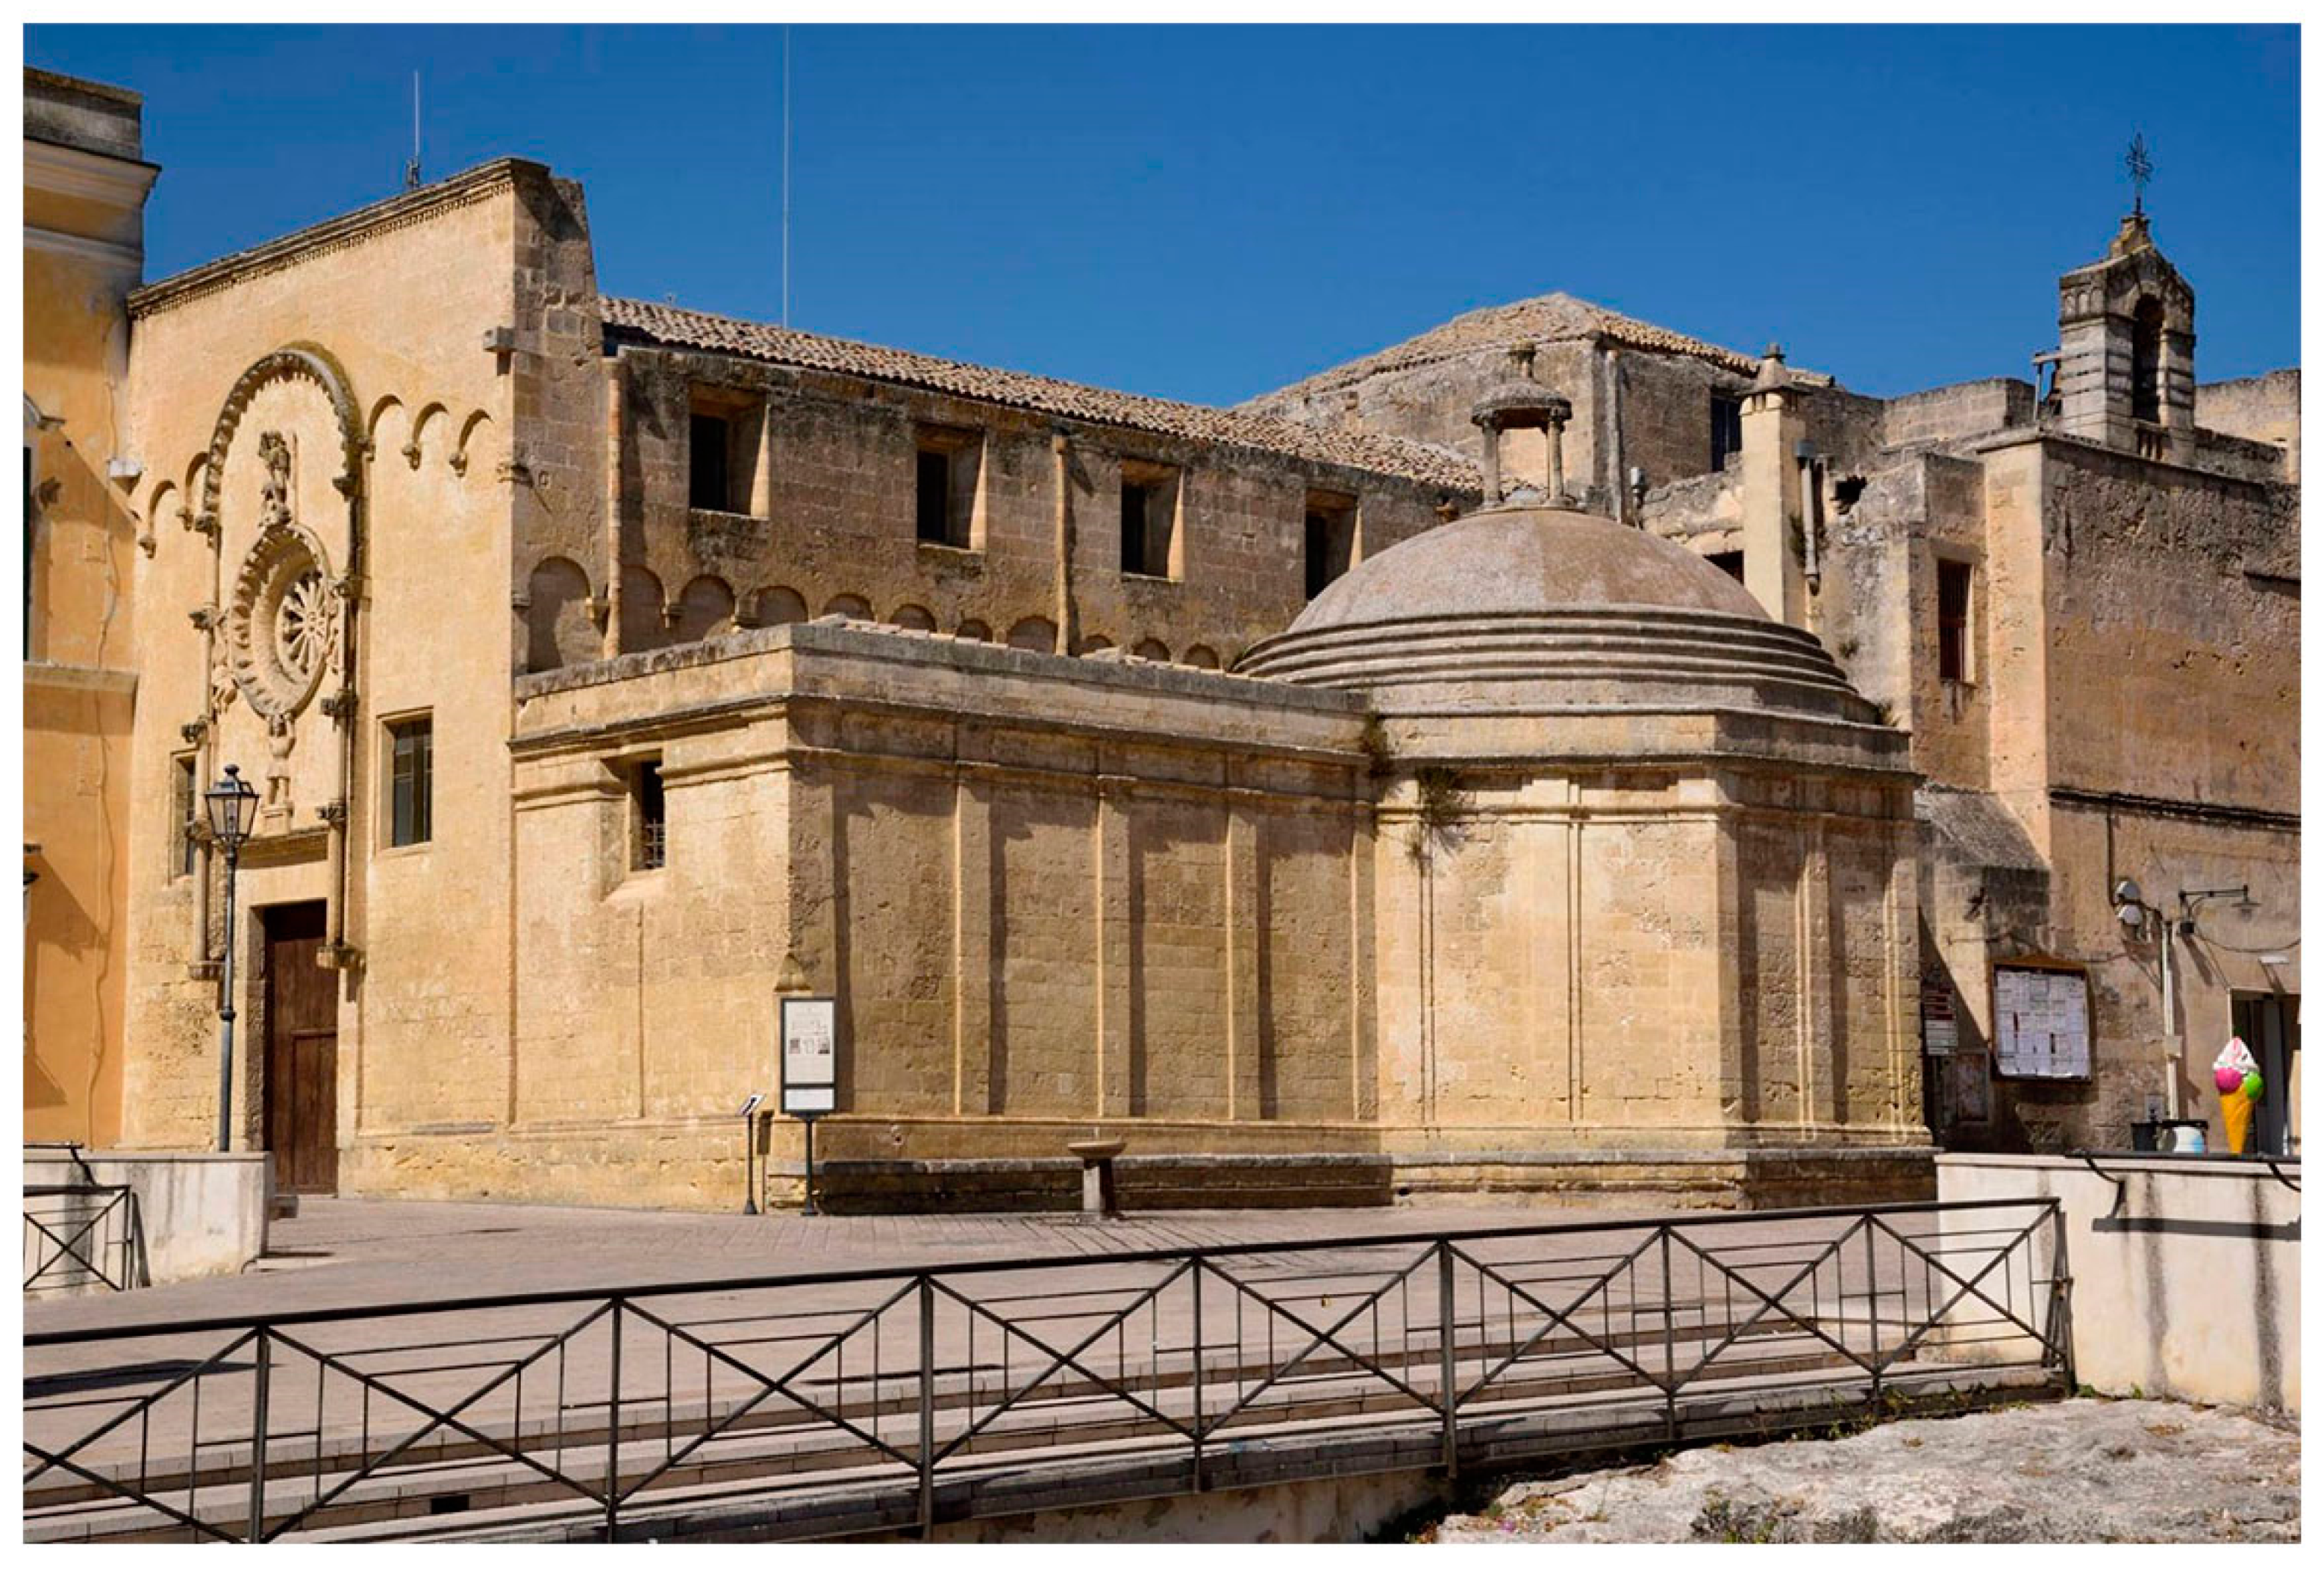
3. Case Study: The Church of San Domenico in Matera
The Church of San Domenico, located in the central Piazza Vittorio Veneto in the Sassi district of Matera, is one of the oldest religious complexes in the city. It was built in 1230 next to which was once the convent of San Domenico, now the seat of the Prefecture (
Figure 1).
The historic building has a Latin cross plan with a transept, main nave, and two aisles, but, like any religious buildings, it has undergone various changes and transformations over the years [
5,
30,
31]. At the end of the 1500s, the “Chapel of the Madonna del Rosario” was added to the right-side aisle with an octagonal base, hemispherical coffered dome, and lantern. In the seventeenth century, the Church was enlarged through the construction of the two lateral naves, with the consequent modification of the right side, and the wooden trussed roof of the central nave was replaced with a large barrel vault in tuff ashlars, modifying the original sloping elevation to the current one with a truncated shape.
Between the 17th and 18th centuries, the wooden choir loft was installed in the internal area above the main door together with a majestic organ. Finally, in the twentieth century, a library complete with shelves and heavy paper volumes was set up in the rooms of the Prefecture, above the left aisle.
The hypogea below the church were initially intended for residential or warehouse use until the edict of Saint Cloud of 12 June 1804, but, subsequently, were adapted to rock necropolis to satisfy the need to identify a place where burials could be carried out.
In 1880, the municipal administration decided to arrange this area, with leveling and paving, to make it the main square of the city (Piazza Vittorio Veneto); the arrangements significantly changed appearance and the intended use of most of the hypogea, which were in fact hidden. After the flood of 24 October 1928, the consolidation work and clearing of the accumulated rubble were carried out, during which most of the underlying underground complex was highlighted [
5].
Unfortunately, over time, some of these interventions have proved deleterious to the static safety of the supporting structures, so much so as to cause serious disruption to the entire religious complex. Consequently, since 2014, access to the public has been forbidden, as a series of cracks have appeared, both on the internal pillars and on the perimeter walls of the Church.
4. Methodology
The proposed methodological approach intends to develop a single knowledge model which, by integrating the innovative survey and 3D representation technologies, is able to put together and correlate all the information available on each element of the study wall complex, including the information that can be deduced from “in-visible” elements, such as those in underground realities, proceeding from the urban scale to the architectural/archaeological one, with subsequent in-depth phases.
After a documentary research activity and the retrieval of other scientific surveys on the studied site, areas and elements for which it is considered necessary to acquire further metric data are identified, using the integrated IT methodologies (laser scanning, photogrammetry, etc.) [
32] with the aim of creating an accurate digital and three-dimensional replica of the wall complex, essential for defining the geometric/spatial relationship between the urban environment and the underground cultural heritage.
4.1. Research of Documentation, Historical Sources, and Preliminary Investigations
In this phase, the research is basically aimed at retrieving documentation, including digital ones, or at previous seismic vulnerability studies. Historical and archival data are found (documents, bibliography, photographs and historical data, historical iconography, ancient plans), consenting to identify the transformations that the site, object of study, has undergone over the years.
4.2. Direct, Indirect Survey and 3D Modeling
In order to proceed with the virtualization of this real object (taking into account the entire structural complexity), it is very important to achieve an adequate level of knowledge of the existing building and its load-bearing masonry, considering fundamental and at the basis of this process, the survey of the work.
This is how the investigation process involved leads an integrated survey campaign conducted with the latest generation direct and indirect instrumental techniques, but, above all, non-invasive and therefore indispensable for state of conservation of the architectural work.
The digital model built in this phase is no longer a simple virtual duplicate of the object of study but becomes an accurate tool that meets the needs of monitoring, allowing, in real time, the close exploration of parts located in inaccessible points or dangerous areas.
4.2.1. The Survey of the Church of San Domenico in Matera
The survey operation usually develops in various stages. It is based primarily on knowledge of the work to be surveyed. Talking about understanding the work means not only analyzing the historical, archival, and bibliographic documentation of the artifact, but also collecting a whole range of information relating to its appearance and its components, observed during an accurate survey of it. This initial investigation work is particularly significant because it allows a considerable saving of time in the subsequent phase of choosing the techniques to be used for the survey [
33].
In the case study of the San Domenico Church, some critical issues immediately emerged. The natural lighting coming from the openings of the façades was not sufficient to adequately illuminate the side aisles of the church and, moreover, artificial lighting was also totally absent, so it was necessary to think immediately of additional lighting by means of a set of LED spotlights. Another complication came from the high height of the places (height of the main nave 11.30 m, height of the dome on the altar 13.90 m) which needed to be reached to collect the decorative details present there, that is why it was decided to adopt particularly performing stands for supporting the instrumentation at height. Working on an artifact of such considerable size, with an area of about 450 square meters and in the presence of very complex decorative architectural forms, led to a survey campaign organized by parts, working on single area at a time, without neglecting any area and organizing data processing more easily in post-production.
4.2.2. The Choice of the Survey Method
On the basis of the above observations, it is evident that the choice of the survey method, with which to operate, essentially depended on two distinct parameters: the dimensional and qualitative characteristics of the architectural building [
34] and one of the main purposes for which the survey had to be carried out, namely the analysis of the crack pattern.
Thanks to the development of modern technologies and continuous experimentation in the field, the survey techniques, today, have been particularly perfected, so as to allow the survey of an asset with a high degree of detail and precision. In particular, the survey method was to merge both the laser scanner techniques and those of digital photogrammetry, with the aim of achieving a much more in-depth control of the architectural object as a whole, defining a three-dimensional geometric model in a very precise and detailed way and allowing to know: the configuration of the structures, the crack pattern, the present instability that is not always able to perceive with a precise analysis.
It is known, in fact, that the laser scanner has the ability to generate a point cloud from which it is possible to develop a polygonal mesh of high geometric precision, at the expense of insufficient chromatic information deriving from a photographic support that is not really performing [
35].
On the other hand, digital photogrammetry is able to generate a very high quality chromatic texture very close to reality on a mesh model which, however, does not possess the geometric precision of a laser scanner [
36].
For the needs, therefore, connected to the case study, it was evident that using only one of the two techniques would not have completely fulfilled the purpose of the survey, but, by integrating the two methodologies together, it was possible to enhance the best aspects of both: the geometrically very precise of one and the particularly realistic texture of the other [
37].
Two different and separate surveys were then carried out on site, using both the laser scanner and digital photogrammetry and, in the post-production phase, the data were integrated each other [
38].
4.2.3. The Survey with the Laser Scanner
The survey with laser scanner (Riegl VZ-400) included 63 station points (45 internal and 18 external). In total, the instrument performed 78 scans: 58 inside the church and 20 outside, even at 60°, 90° and lifting it up to 5 m high using a Manfrotto stand. In addition, further scans were also performed only on the lesions of the crack pattern. Despite the use of the stand, however, the laser scanner was not able to detect the decorations of the upper areas of the altars and the lunettes of the vault of the main nave, hidden by the bands of projecting cornices. In this case, photogrammetric technology has perfectly integrated the missing information.
4.2.4. The Survey with Digital Photogrammetry
The photogrammetric survey was performed with the 3DEYE system (
https://www.microgeo.it/ (accessed on 24 February 2021)) consisting of a simple and manageable structure that allows you to reach even difficult to access points thanks to the telescopic rod in carbon fiber (reaches up to 10 m in height). The camera used was a Sony DSC QX30 with a resolution of 20 Mpx, mounted on a remote-controlled stabilizer to manage the orientation of the shots from the ground. With this instrumentation, by setting the rod at different heights, a total of 5400 photographic images were taken to detect the interiors and 900 for the fronts and external covers.
The Survey of the Interiors
The photogrammetric survey of the interior of the Church was greatly affected by the lack of adequate lighting of the rooms. In fact, it is known that digital photogrammetry is a detection method that returns excellent results if it works in the presence of good lighting [
39].
So, we tried to increase the light contribution by using a series of stands (1.7 m high), equipped with 4 additional led spotlights of 5000 lumens each, so as to increase the diffused light contribution in particularly shaded areas. The same problem also arose for the shots to be made at high altitude. In this case, it was necessary to modify the 3DEYE instrumentation experimenting a new approach. The telescopic rod has been fitted, at its end, with an aluminum housing, on which two 11 Watt led lighting bodies have been installed which, to lighten the weight of the entire structure, have been deprived of the supplied batteries and powered from the ground through the use of cables tied along the road. The same goes for the 3DEYE system and camera, deprived of their corresponding batteries and powered by cables.
As usual, the photographic images were performed with a vertical and horizontal overlap between the contiguous frames of 60–80% and with an orientation of the camera axis perpendicular to the shooting surface where the surfaces appeared opaque and an angle of incidence of about 60° in the presence of shiny surfaces [
40].
The shooting distance was kept at about 2 m, while where the surfaces were homogeneous and without decoration, it was reduced to increase the photographic detail. In this way, the point cloud development software was able to identify more easily the homologous points between one shot and the next.
The External Survey
The photogrammetric method has achieved excellent results (accuracy 1.4 cm) for the relief of external elevations and roofs thanks to the presence of natural lighting. The relief of the fronts was quick and easy, unlike the relief of the roofs. The presence of the Prefecture building has imposed a ban on flying over the area with the drone for safety reasons. This obstacle has led to the adoption of new measures with the telescopic rod, preparing an alternative approach. The shots, carried out directly on the roof, required the use of the rod to its maximum extent and with inclinations of even less than 10°, in order to be able to reach the most remote points. This need required to further lighten the structure of the camera, also eliminating the remote-controlled stabilizer and hooking it directly to the final pin. These data were found to be of fundamental importance for the complete reconstruction of the religious complex because they integrated the survey carried out with the laser scanner from the ground, objectively unable to reach these surfaces even though using the stand.
4.2.5. The Relief of the Crack Pattern
In order to have a very detailed survey of the crack pattern, it was necessary to carry out a further high-precision photogrammetric survey (accuracy 1 mm) of the areas affected by the lesions only. For this purpose, some punctual recovery stations have been set up, at a distance of about one meter from each lesion. A tripod equipped with diffused artificial lighting was used together with a professional reflex camera with medium focal length lens (50 mm) and minimum distortion and aberration values. The shots were taken perpendicular to the area to be detected in order to obtain an advanced photographic detail.
4.2.6. The Output of the Realized Surveys
The target of the survey was to obtain a 3D model with a level of accuracy capable of returning the crack pattern present in the religious structure, as a reference point and information base for the failure monitoring system and useful after the planning of the structural consolidation works. With the use of the laser scanner, it was possible to collect a series of information on the geometry of the architectural artifact, generating a very precise and detailed point cloud. In addition, another series of information relating mainly to the color of the materials was collected through the digital photogrammetric survey, thus creating a 3D model containing a global vision of the instability of the entire religious structure and able to monitor the eventual evolution of injuries over time.
In fact, from the examination of the crack mapping the Church and the results of the verifications, in the structural organism both with vertical and seismic loads, it is clear that there is a need to carry out widespread interventions of static consolidation of the work in order to guarantee the levels of safety required by the current standard, at least only considering vertical loads. Investigations of the current state of the building will make it possible to acquire an in-depth knowledge of the building and to contribute to its conservation over time-through the use and elaboration of a restoration project consistent with the principles of the work.
4.2.7. The Creation of the 3D Mesh Model Generated by the Integrated Survey Aimed at the Knowledge of the Artefact
From the products made with the two survey techniques and the different point clouds, in the post processing phase, a 3D model with a high geometric precision (accuracy 0.9 cm) and a particularly realistic color rendering was produced, through the application and experimentation of a specific methodology described below.
4.2.8. The Post-Processing Method
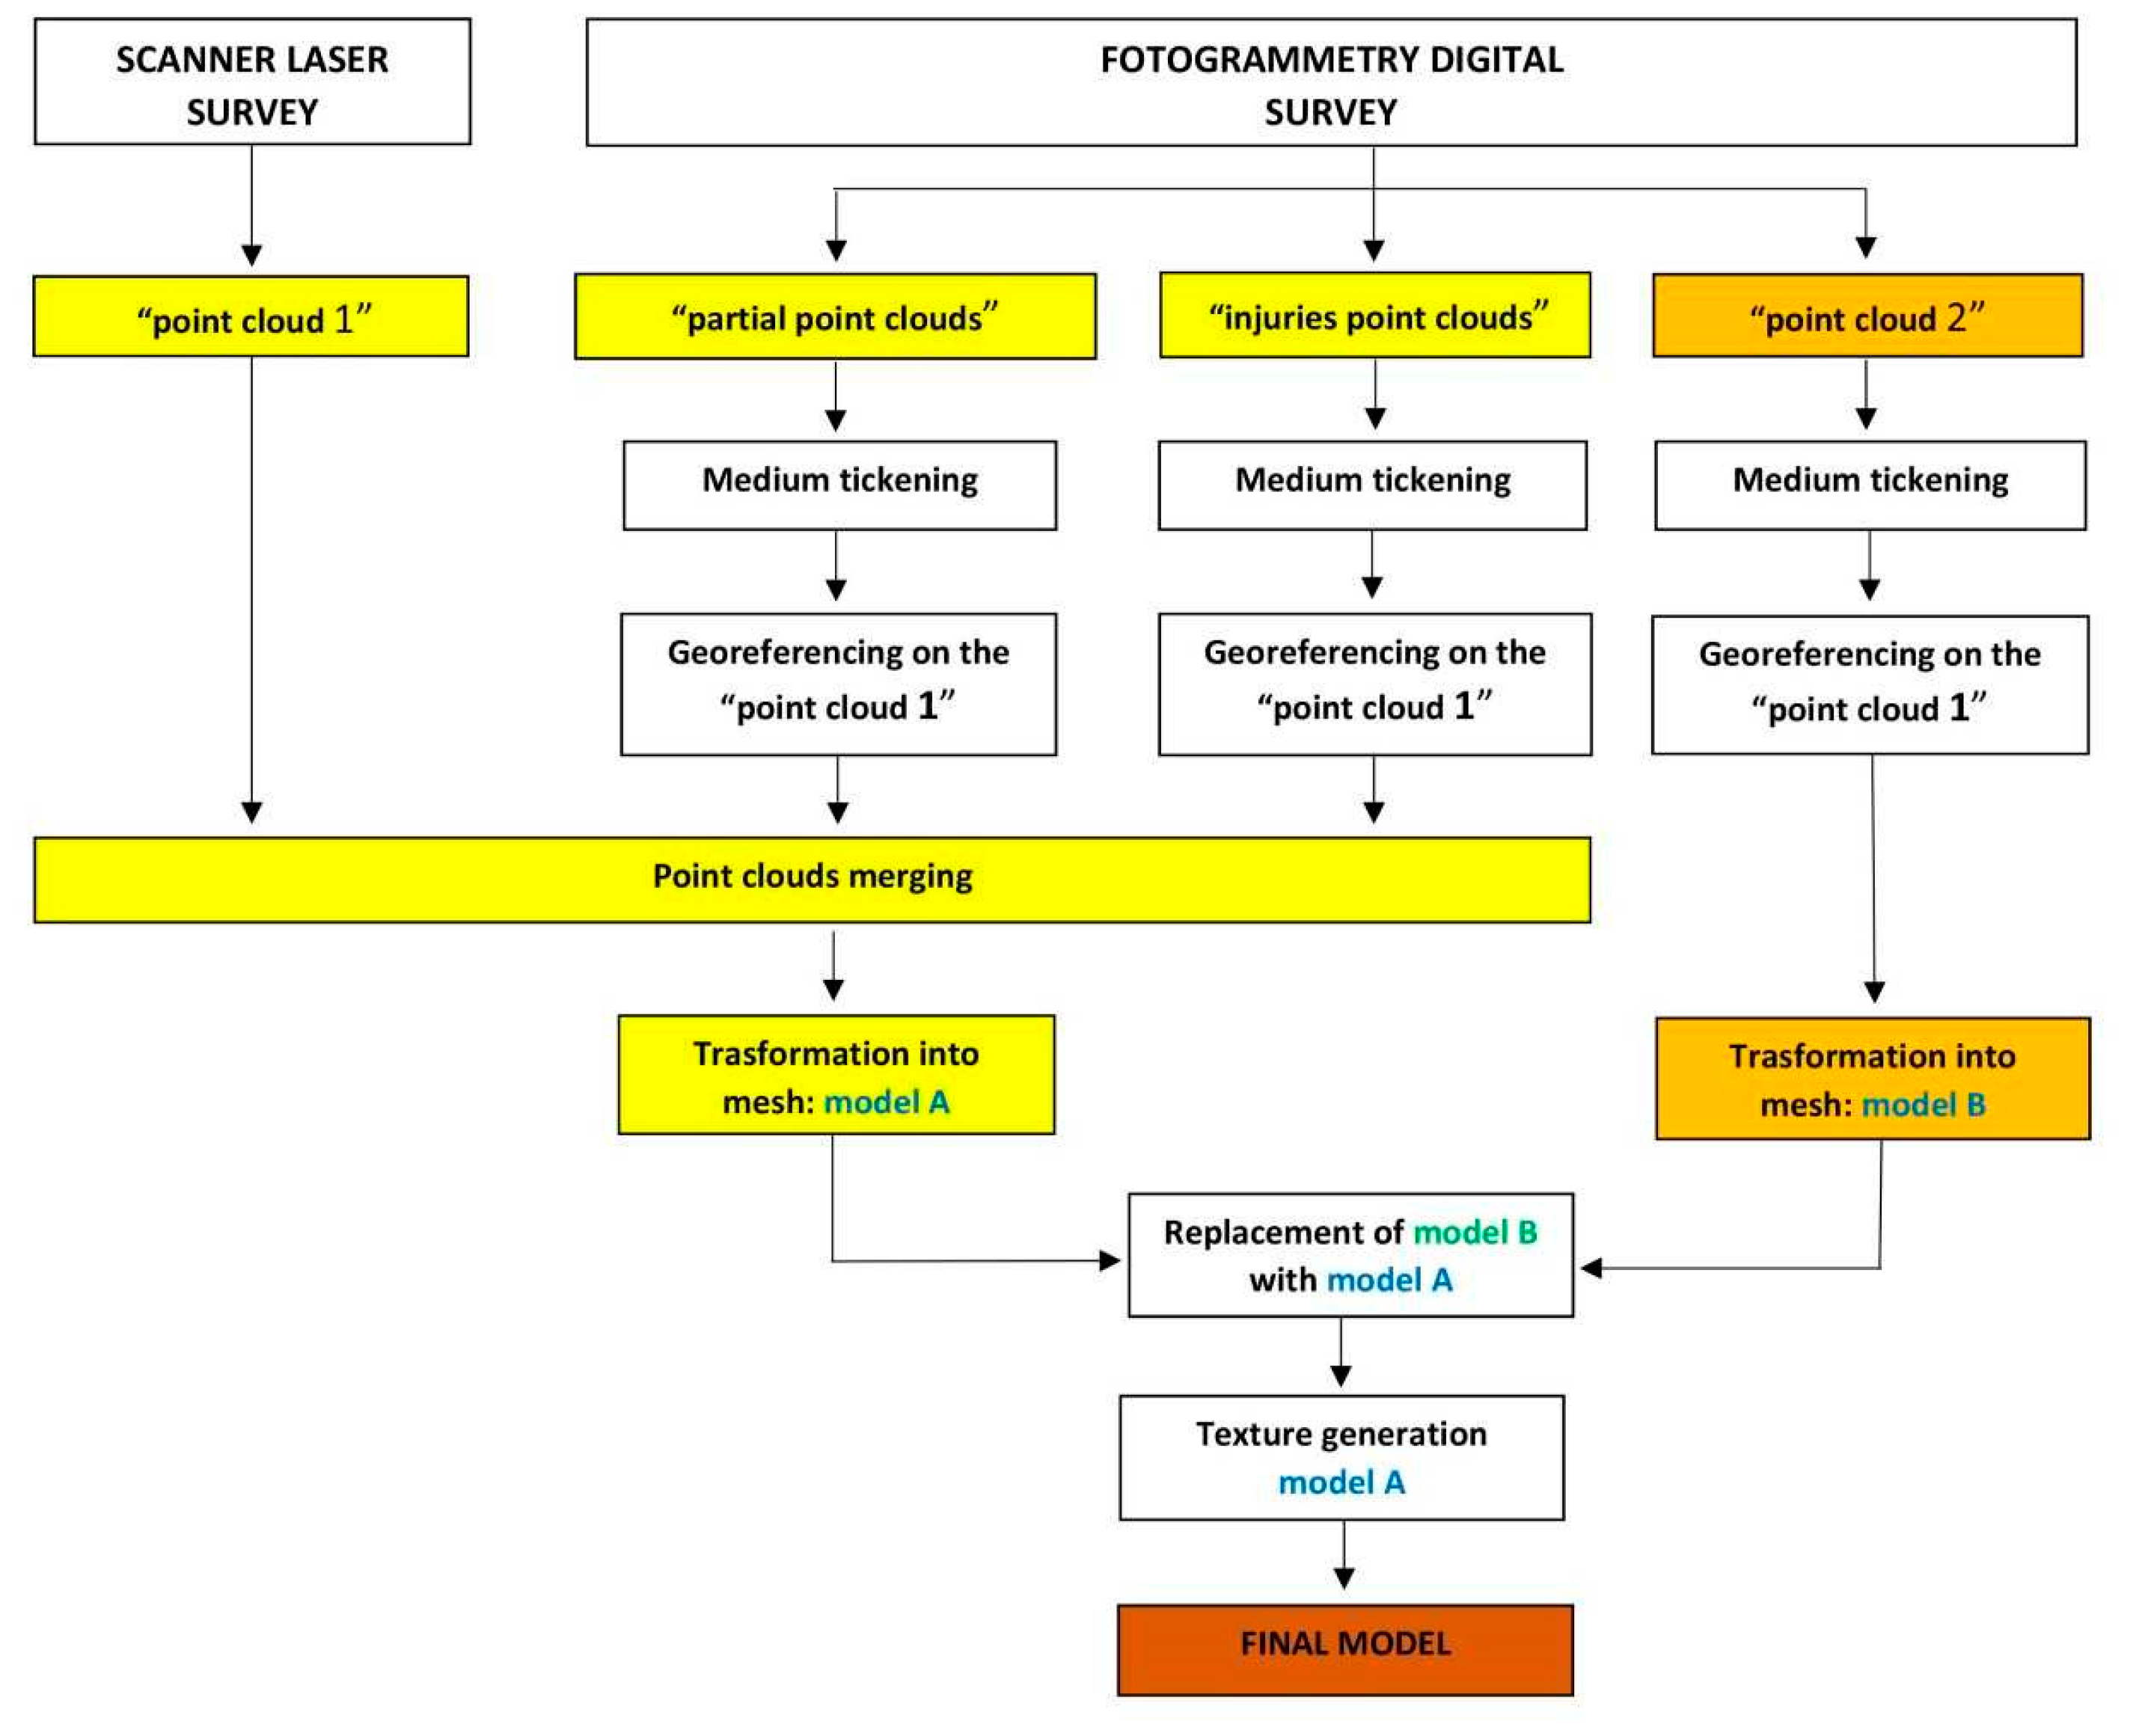
The complete 3D model of the San Domenico Church was created by integrating four different groups of data, coming from laser scanning and digital photogrammetry. Below is a brief description of the work phases.
Construction of the “point cloud 1” resulting from the survey with a laser scanner of particular geometric precision with missing data due to the inability of the tool to reach certain areas.
Construction of the “partial point clouds” deriving from the photogrammetric survey of the areas not detected by the laser scanner.
Construction of the “injures point clouds” deriving from the photogrammetric survey.
Union of the above-mentioned point clouds to create a single model and transformation into mesh in order to obtain “model A” without texture.
Construction of the “point cloud 2” deriving from the photogrammetric survey and transformation into mesh so as to obtain the “model B” without texture.
Replacement of “model B” with model A “and generation of the texture to obtain the “final model”.
The “Point Cloud 1” Generated by the Survey with Laser Scanner
The information acquired with laser scanner technology brings with it a series of both geometric and semantic data, giving the possibility to know the material, historical, and technological specificities of the building. For this reason, the point cloud generated by laser scanning, with the use of targets, formed the basis of the final 3D model of the Church under study.
In the case of San Domenico Church, being the religious complex very articulated, to avoid overloading the software in data processing, the point cloud produced by each scan were processed in parts.
Each single point cloud (scanposition), processed with the RiscanPro 1.2.4 software (
http://www.riegl.com accessed on 24 February 2021), after being subjected to an initial “filtering” operation to eliminate the “noise”, coming from objects and people extraneous to the scene, has been transformed into a polydata. So, with a “multi station adjustment” operation, the different scans were brought closer together. After the registration of the different polydata, the combine date operation was carried out semi-automatically, matching the various scans (scanposition) into a single point cloud (point cloud 1). In this processing phase, it is essential to establish the degree of decimation of the cloud, in order to lighten it as much as possible without losing the quality of the detail.
The “point cloud 1” created in such a way, unfortunately presented data gaps, attributable to the inability of the instrument to reach certain areas and to the inability of the RiscanPro software to transform this point cloud into mesh, as the software manages data of a punctual type only and is able to carry out only small triangulations (mesh) of flat areas, such as facade elevations, with unsatisfactory results.
However, the ability of laser scanning to generate particularly precise point clouds remains undoubted [
41], such to return the geometry of the artifact in a very detailed way, a fundamental characteristic for achieving the research objective and considering this product the basis of the final three-dimensional model of the Church.
The “Partial Point Clouds” Created by Digital Photogrammetry Survey
In order to fill the gaps that have been created in the “points cloud 1” generated by laser scanning, a series of “partial point clouds” have been built taking into consideration the data deriving from the photogrammetric survey, through 12 Ground Control Points (GCP), materialized with 12 photogrammetric targets. Digital photogrammetry is a very widespread survey technique in the architectural field which, from the analysis of several photos depicting the same object, is able to obtain three-dimensional models that are more realistic than the greater will be the quantity and quality of the images. It permits to identify the metric data of objects very quickly and with good accuracy (internal 0.9 cm and external 1.4 cm), uses handy and cheap tools and allows the operator to easily interact with the data collected, giving him the ability to process them very quickly [
42].
The 3DEYE system used for the photogrammetric survey of the of San Domenico Church has produced several “partial point clouds” which have been processed by the Agisoft Photoscan software (
https://www.agisoft.com/ (accessed on 24 February 2021)) [
43]. These clouds were built through the recognition of multiple homologous points, the software identified on the photographic images. After the calibration of the camera used, created with the use of Agisoft Lens software, the images were aligned in order to identify the position and orientation of each one in space (the same in which the shots were actually taken).
The alignment involved a semi-automatic operation, where the operator intervened only to define the processing mode of the point cloud between low, medium, high, and super-high.
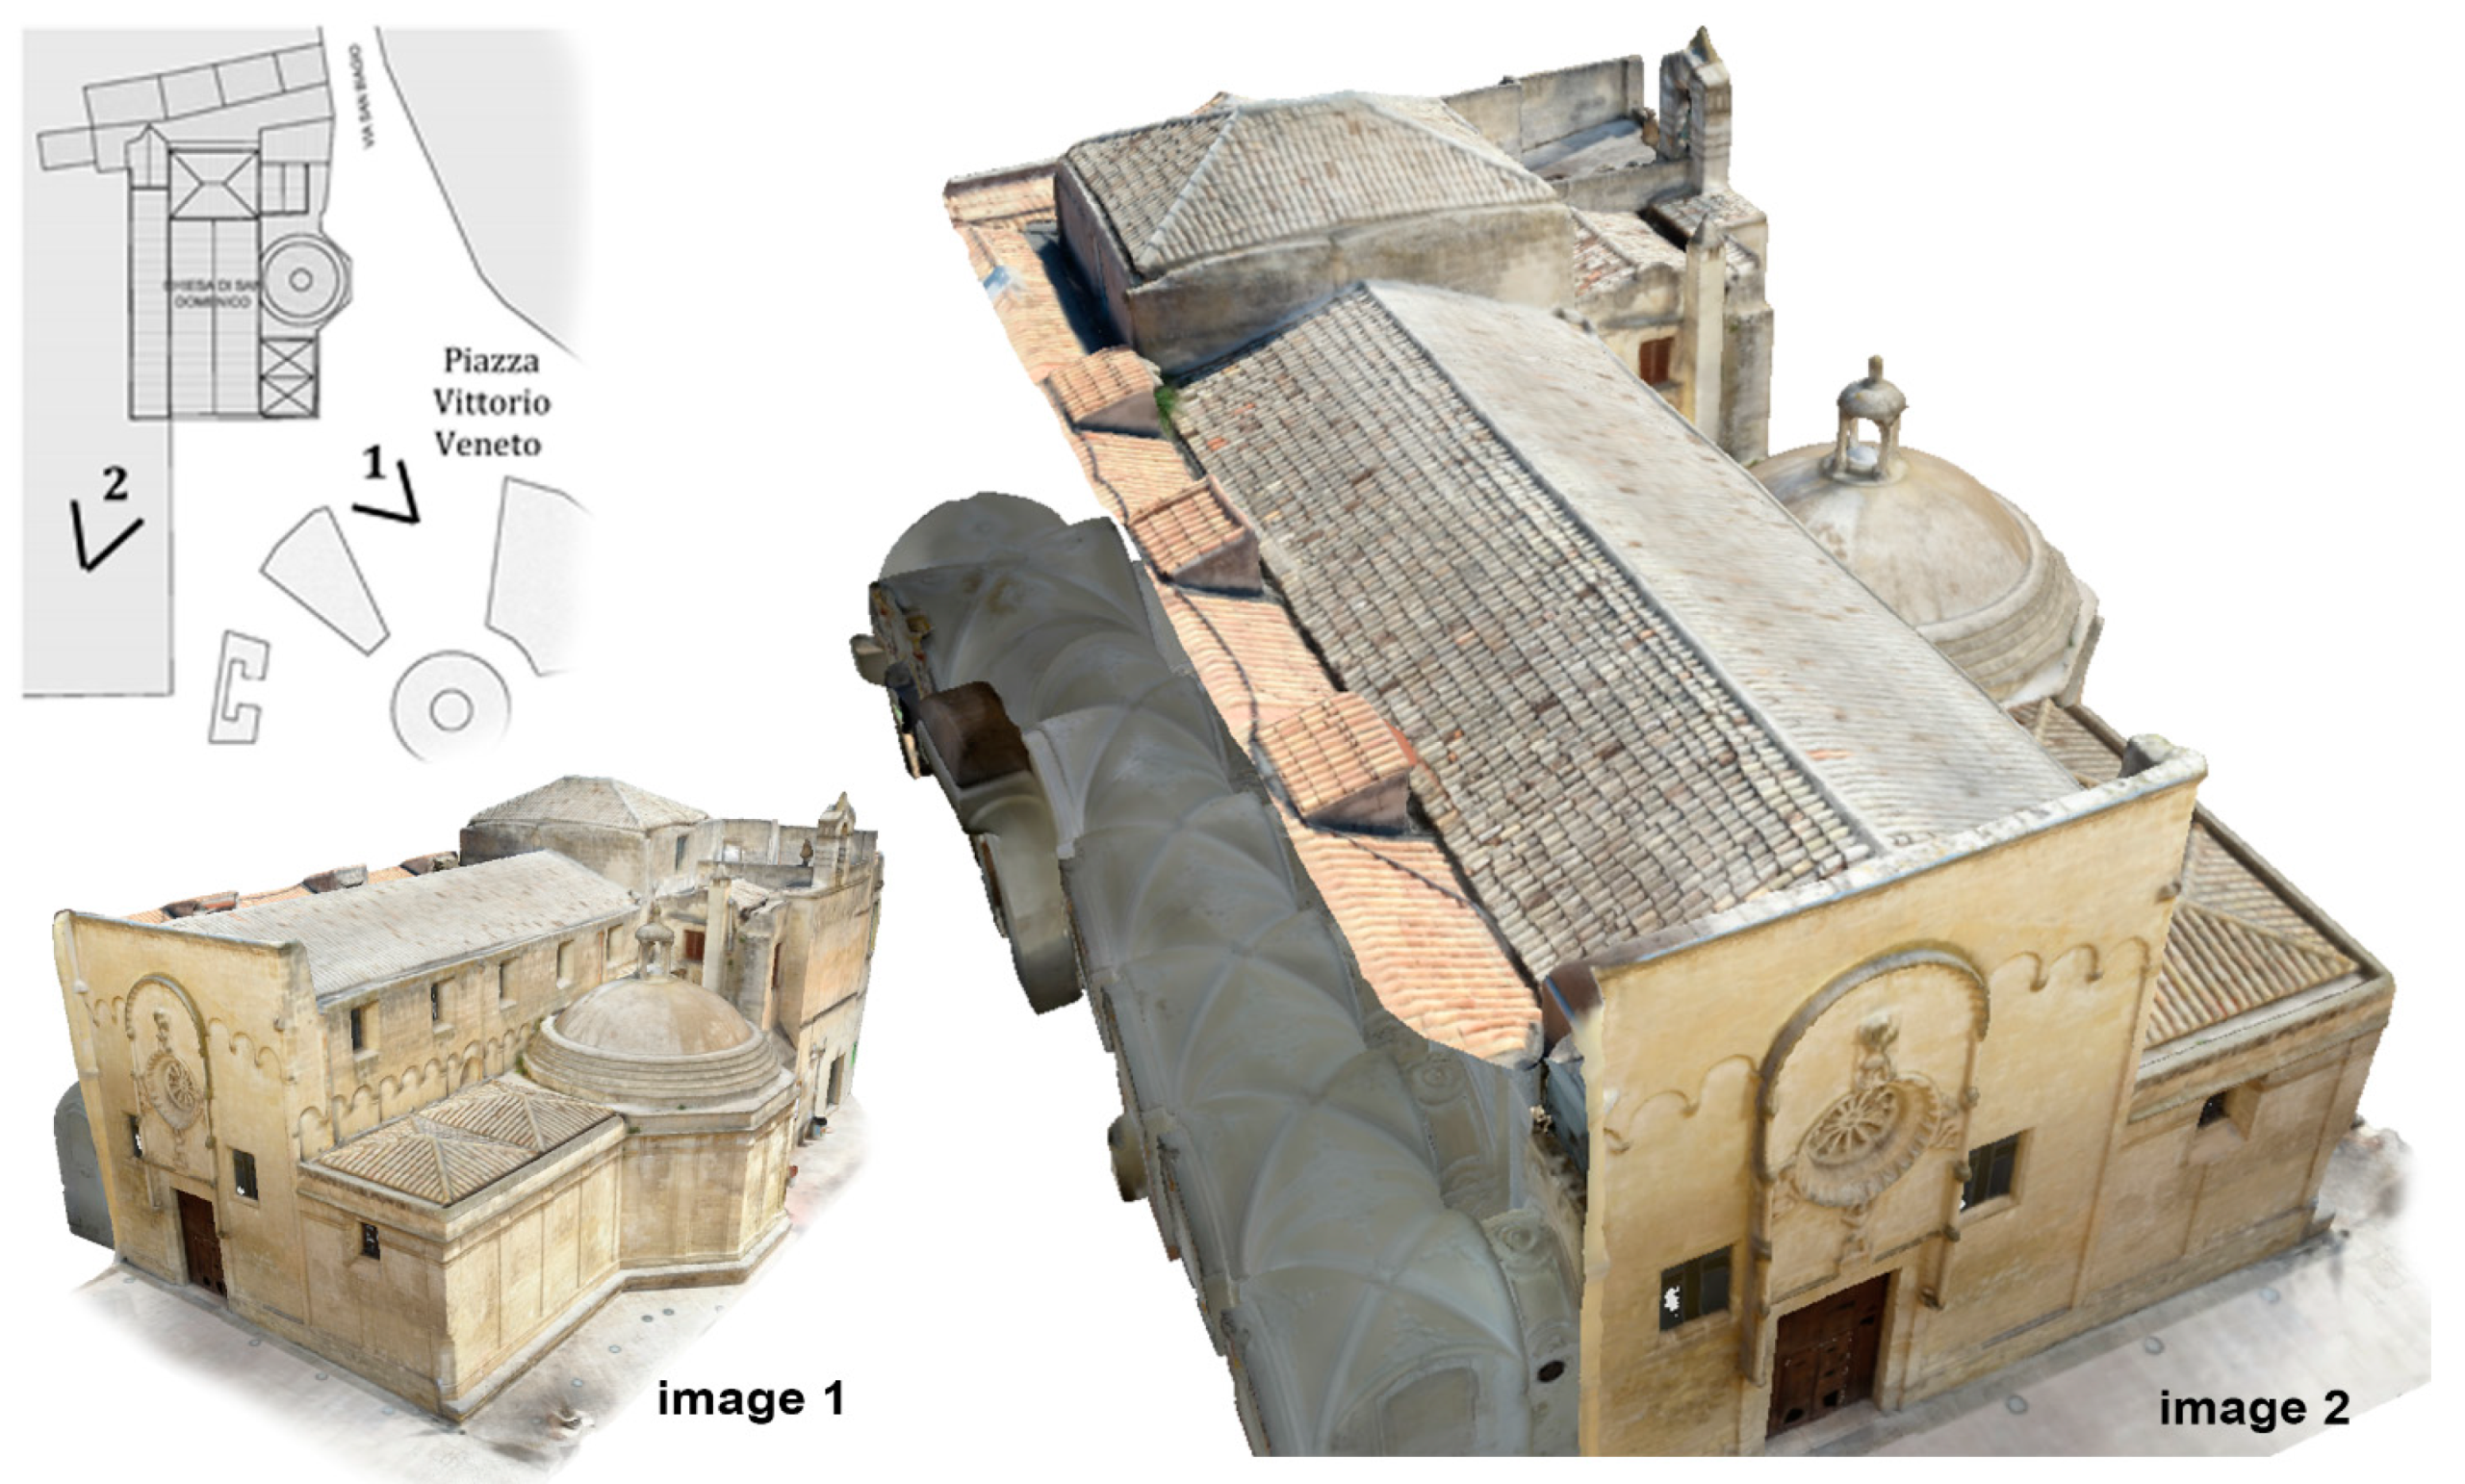
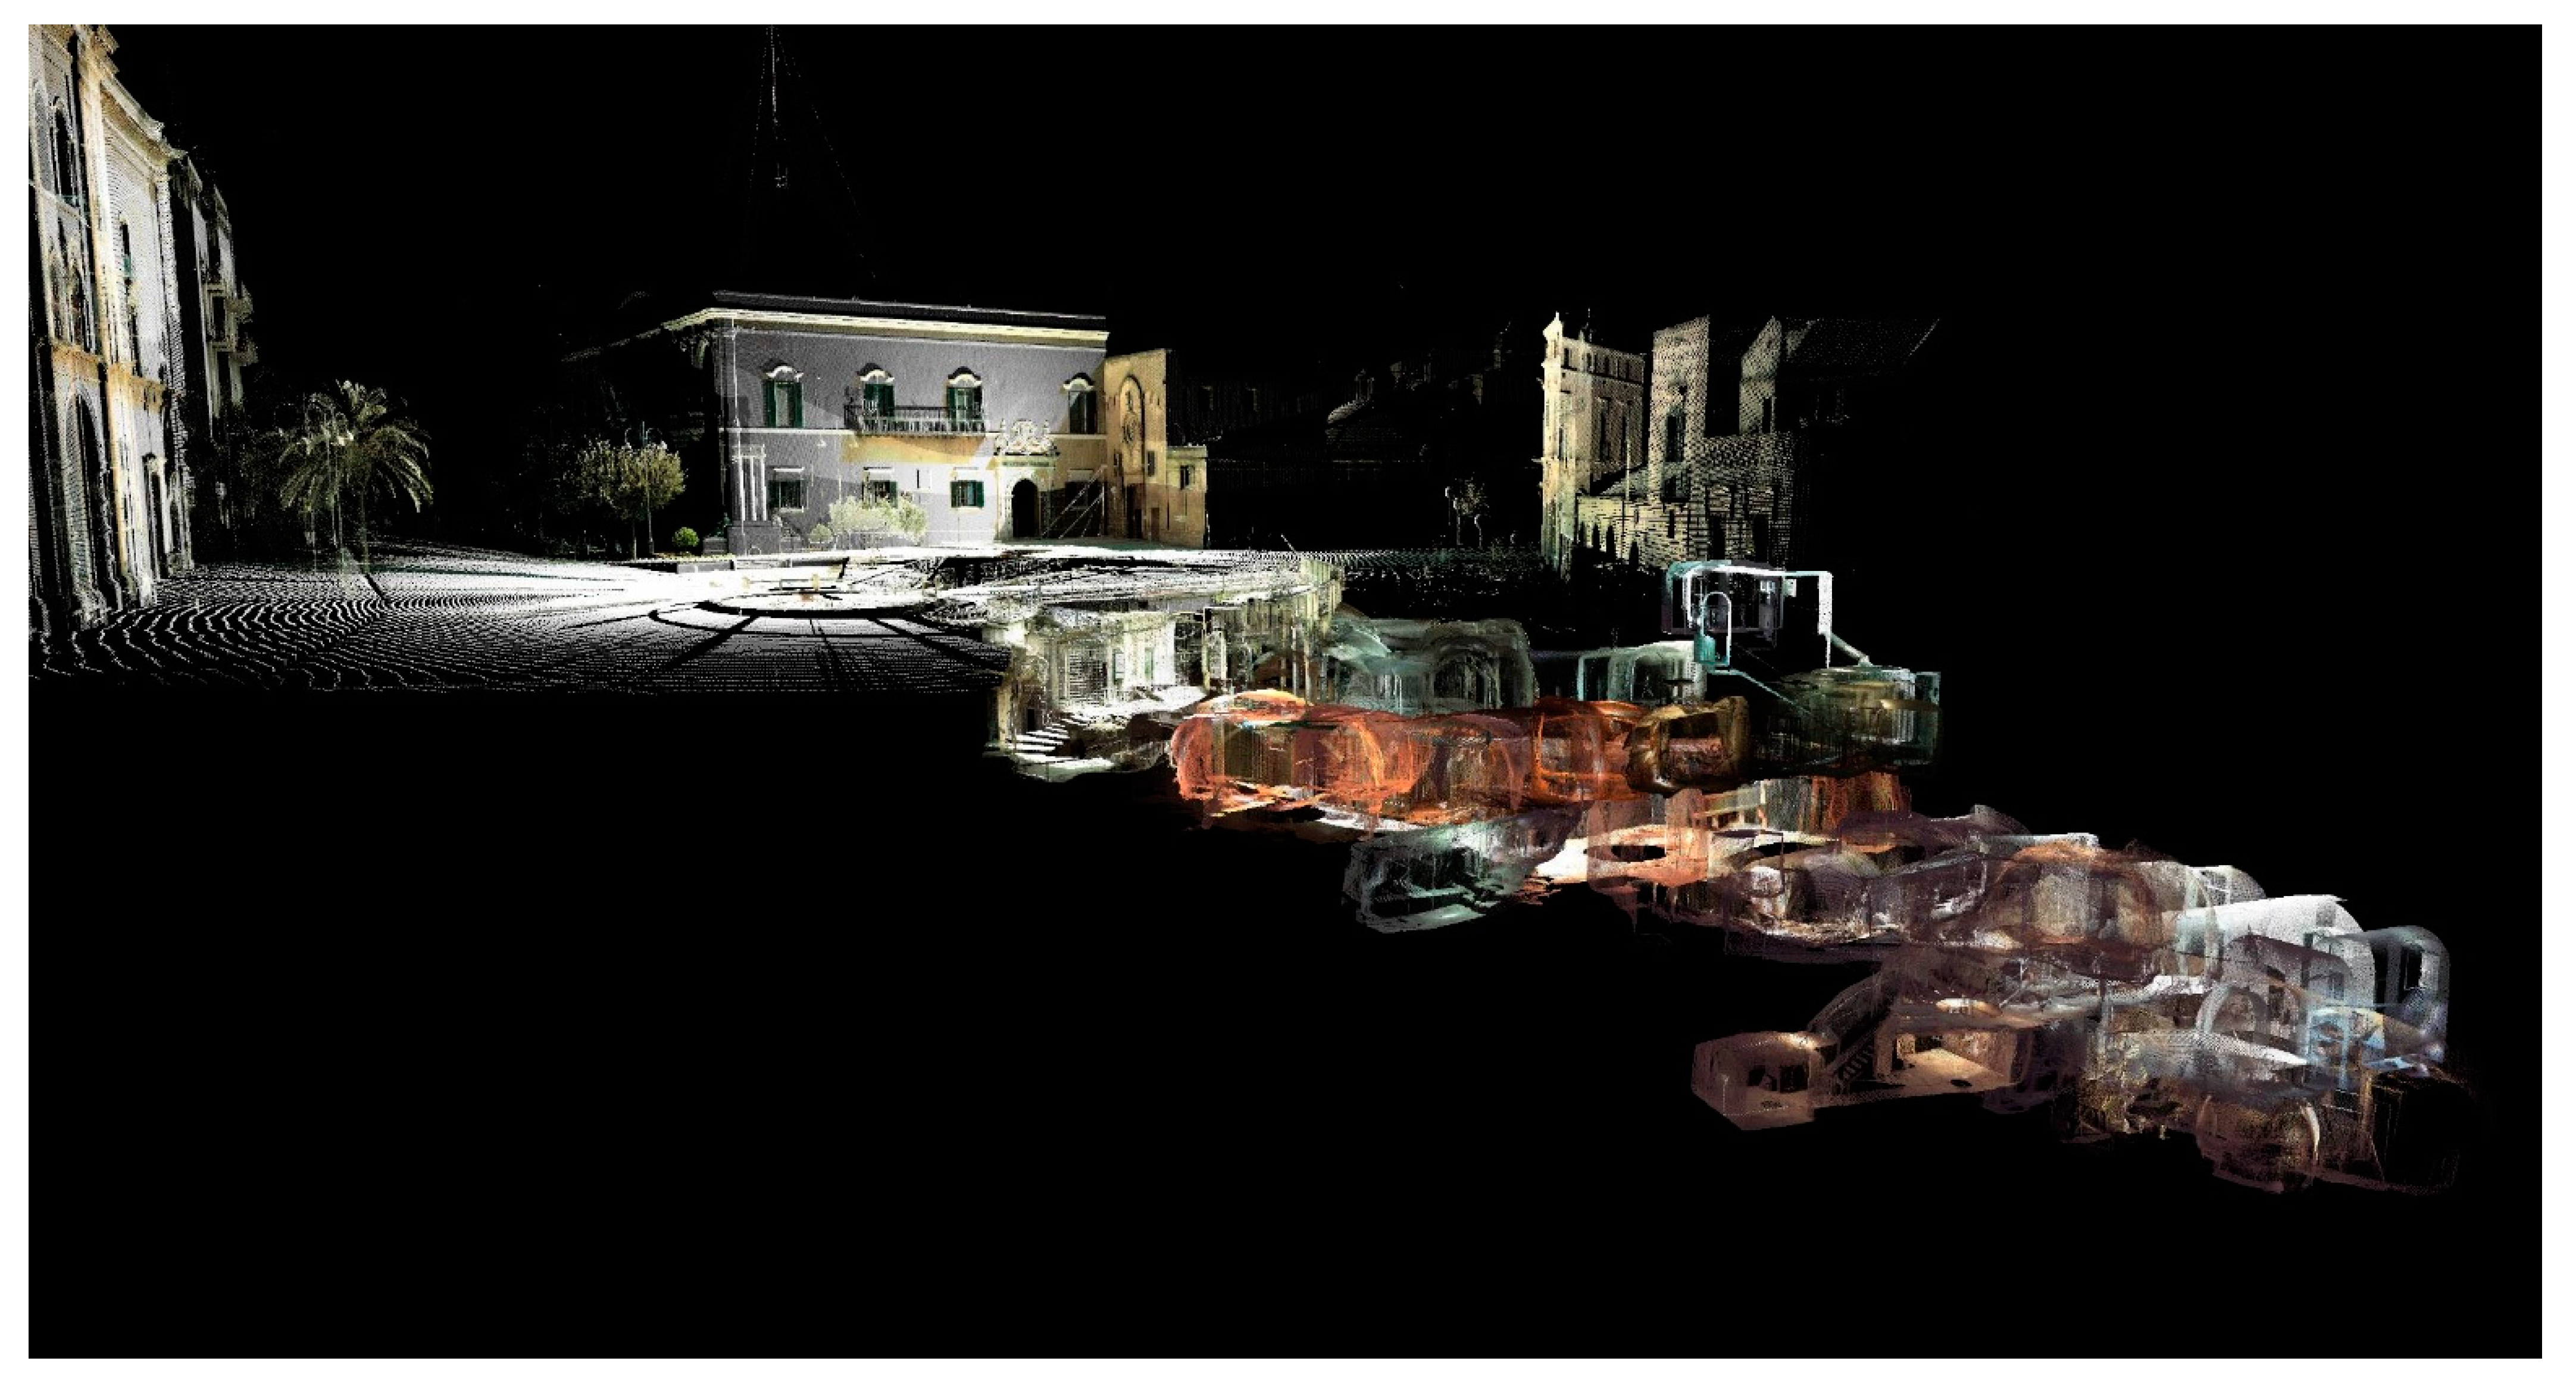
To build the “partial point clouds”, it was defined a medium thickening, compatible with the “points cloud 1” and using an analogous reference system (see
Figure 2). The latter operation was of considerable importance because it prepared the “partial point clouds” for the subsequent data integration operation. In this way, the limit of the laser scanner, linked to the difficulty of reaching all the areas to be detected and therefore the impossibility of returning a complete point cloud (
Figure 3), has been overcome thanks to the information coming from the photogrammetric scan, acquiring much more data, even in the most hidden areas and in the highest areas.
The “Injures Point Clouds” Created by Digital Photogrammetry Survey
The survey of the crack pattern was performed only on the portions of masonry affected by the instability. The “injures point clouds” were processed by Agisoft Photoscan software. To correct machine lens errors, the previously developed camera calibration file was imported before performing camera alignment. The images were aligned in a high mode, able to identify more accurately the position and orientation in the space of the related cameras.
Finally, each point cloud of each lesion was georeferenced on the “point cloud 1” (see
Figure 2). With the aim of obtaining a precise union of the parts, a single precaution was adopted: from the “point cloud 1”, the parts relating to the injuries were completely eliminated (see
Figure 2) before proceeding with the importation of each single cloud (
Figure 3).
The Generation of “Model A”
Once the three groups of point clouds listed above were created, they were joined in order to build a single cloud of the architectural artifact with high geometric detail (see
Figure 2).
The integration of the missing data took place within the Geomagic Wrap software (
https://www.3dsystems.com/ (accessed on 24 February 2021)) where the missing parts from the “partial point clouds” were first added to the “point cloud 1” coming from the laser scanner, then the parts relating to the “injures point clouds “ generated by digital photogrammetry. The point cloud thus obtained, complete in all its parts, after being decimated in the flat areas (floor, smooth walls), was transformed into a surface, thus obtaining a complete and geometrically well-defined mesh model, the “model A” (see
Figure 2). The flat parts of the point cloud have been decimated by specifying a minimum distance of 5 cm.
In this way, the limit of the laser scanner, linked to the impossibility of transforming the “point cloud 1” into mesh, has been exceeded. With this methodology, the mesh has been perfected, carrying out considerable improving operations: repair of disconnected components, smoothing of the mesh to reduce noise, reconstruction of missing parts, and finally lightening of the model, carrying out a further decimation (minimum distance 10 cm) of the mesh without losing the degree of detail set to.
The Generation of “Model B”
The “model A”, to enrich the realistic effect sought, is completed with the addition of the texture of the materials, in reference to the real architectural artifact. This operation was performed within the Agisoft Photoscan software, generating thus a new complete type (model B), with the use of digital photogrammetry.
To create “model B”, a new point cloud was built from the data coming from the photogrammetric survey: “points cloud 2” (see
Figure 2).
This point cloud was first thickened with a “medium” resolution (see
Figure 2) in order to define only the shape of the artifact, then placed in the same reference system as the “point cloud 1” (see
Figure 2), then transformed into a mesh so as to obtain “model B” without texture.
This step is essential to ensure the success of the next operation. If the software did not have a structured model inside it, that is a model indissolubly linked to the grip points of the uploaded photographic images, it could not in any way generate the projection of the images on the final surface of “model A”.
The Final 3D Model
The last step of the involved methodology replacing “model B”, deriving from digital photogrammetry with “model A”, coming from laser scanning and the projection on it of the texture being from the photogrammetric survey images.
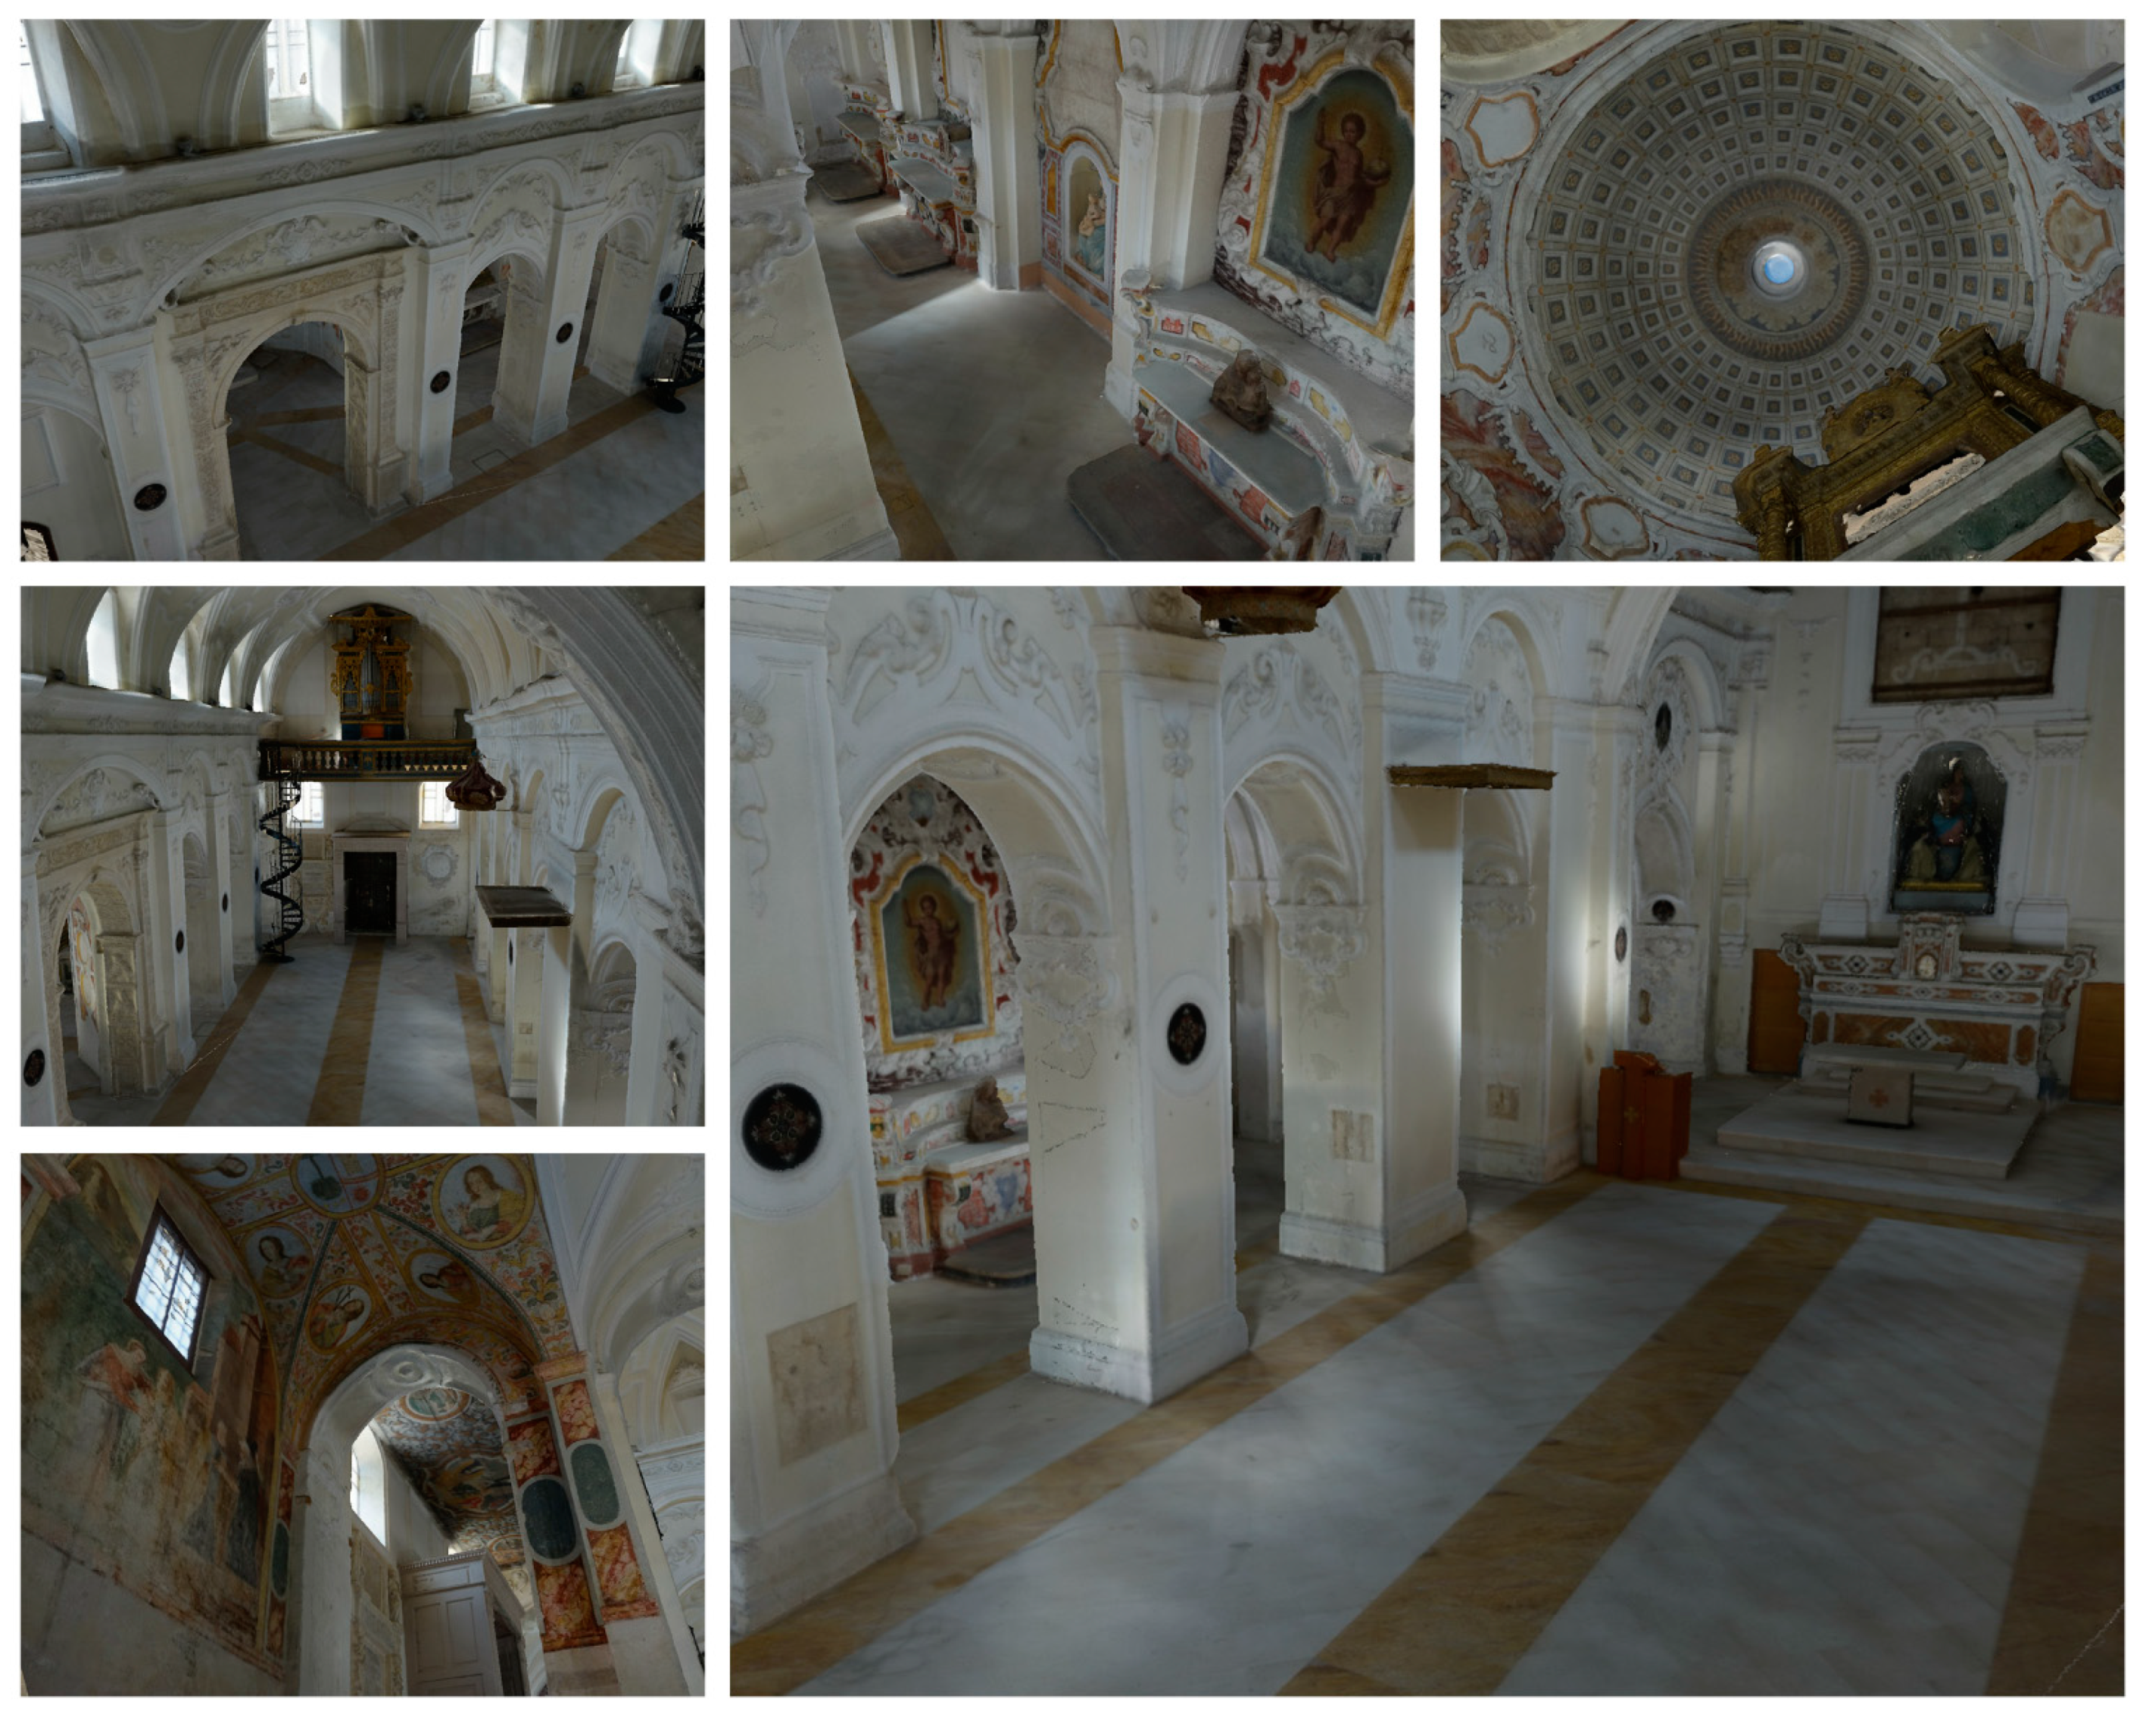
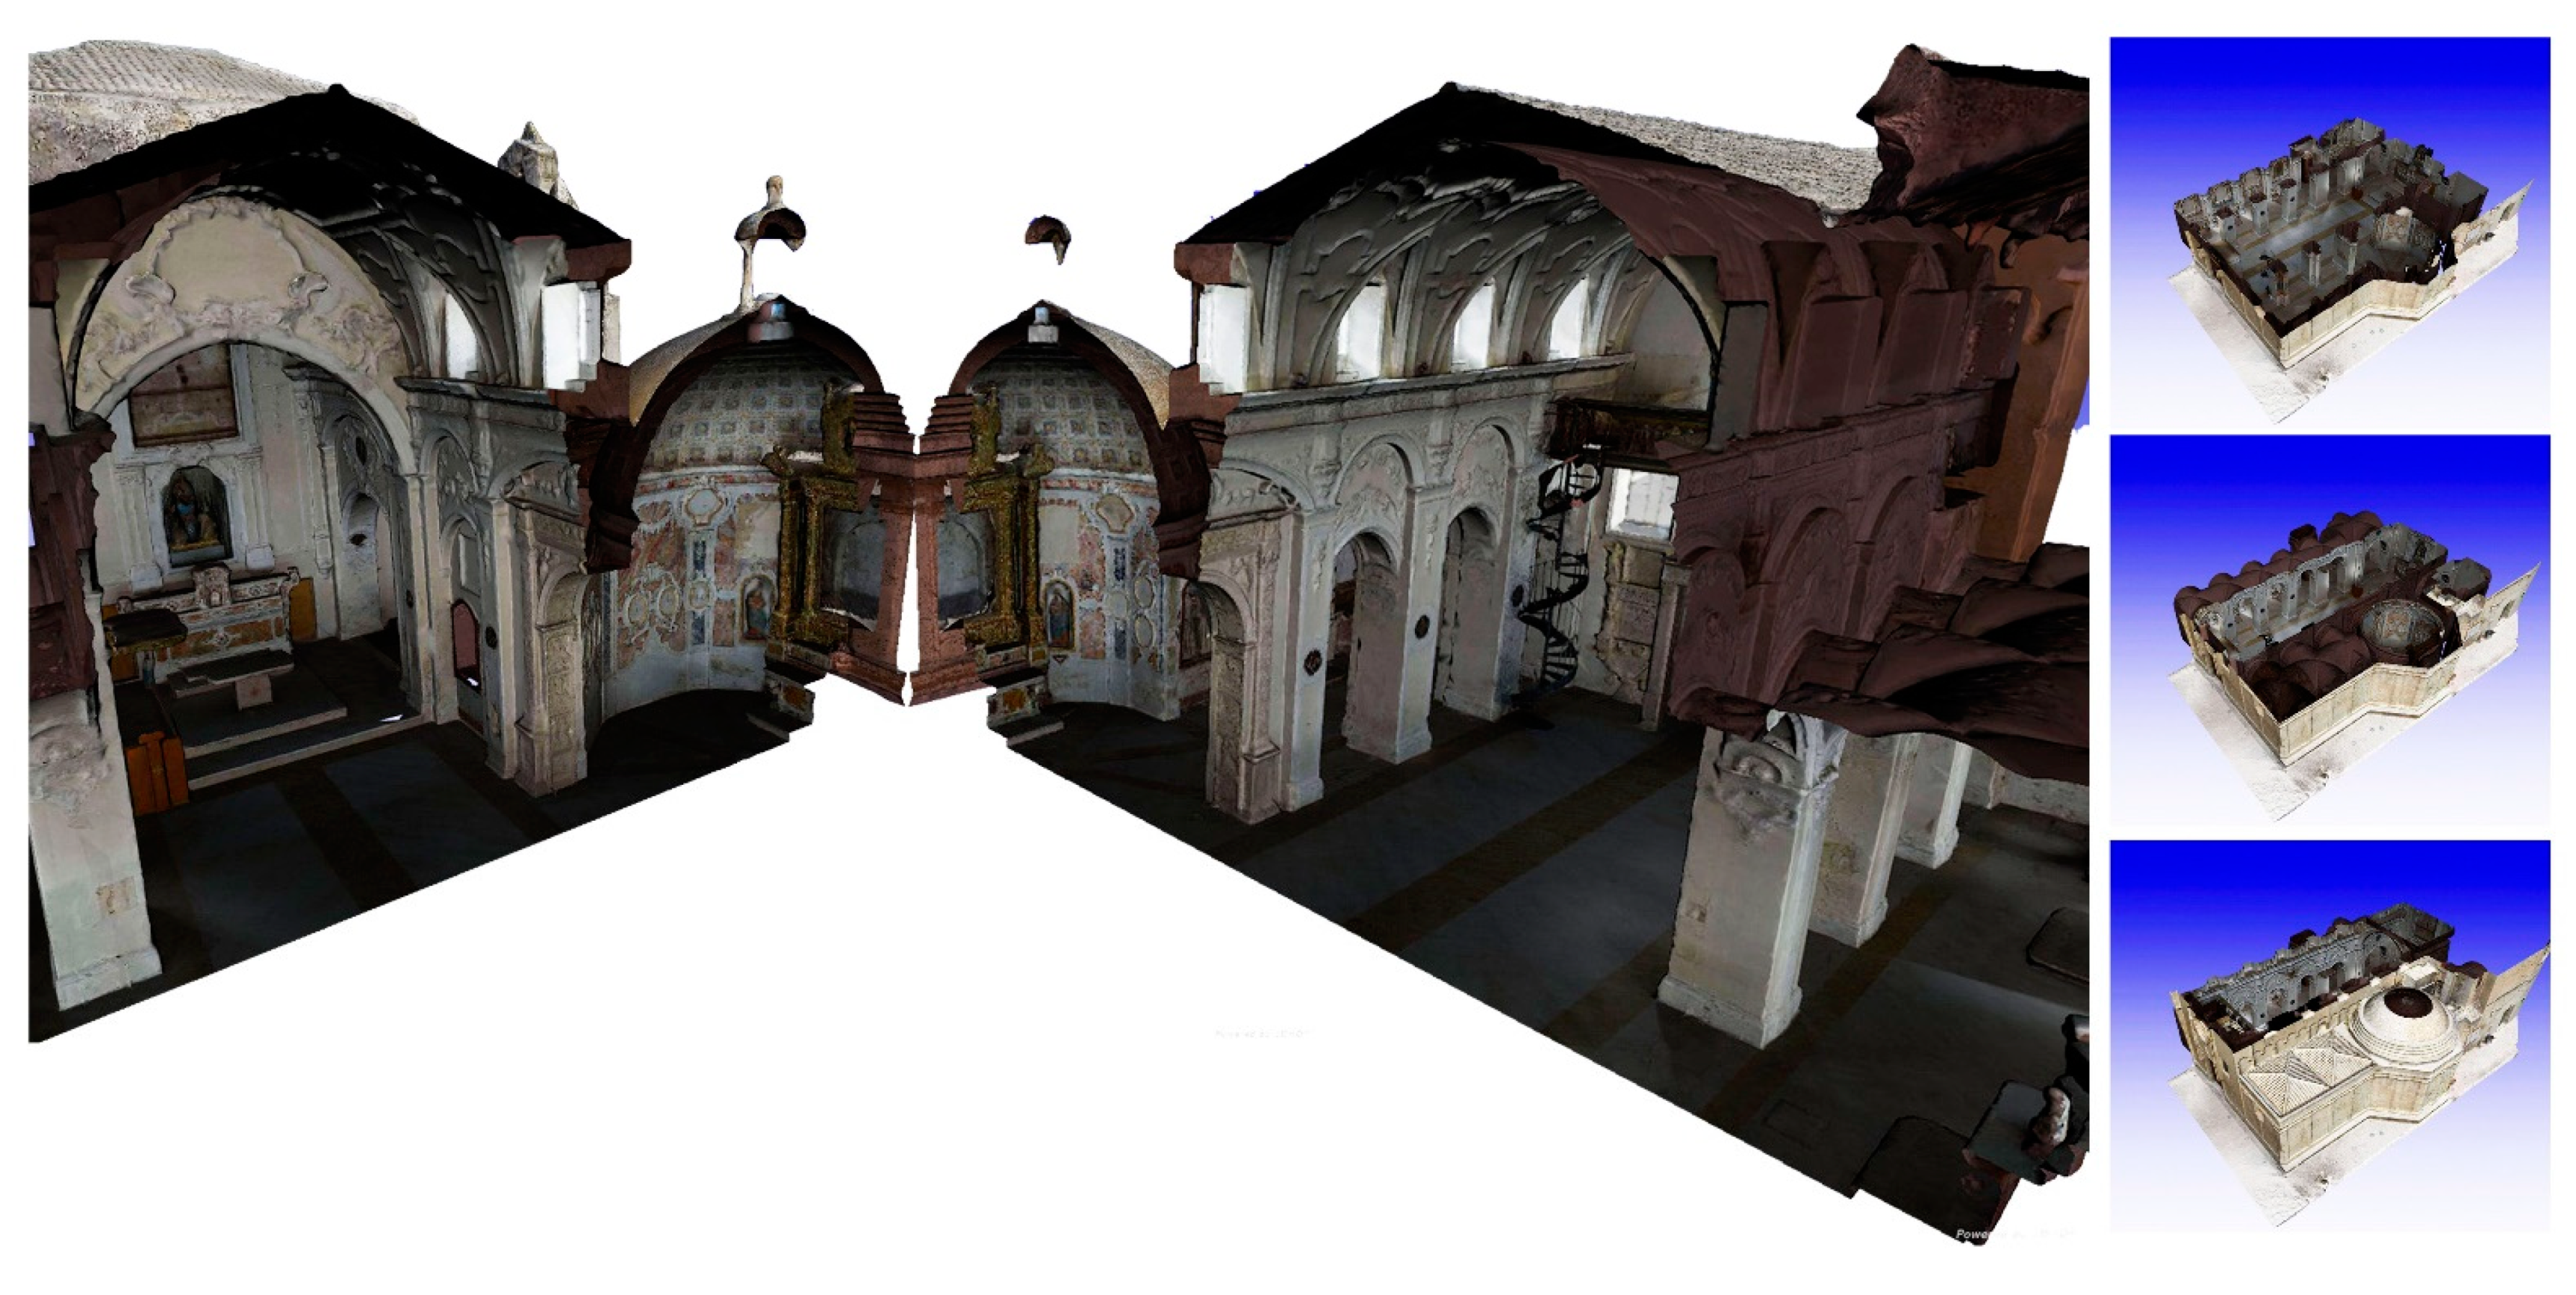
The replacement operation took place directly in the Agisoft Photoscan software, where the high-quality images, originating from the photogrammetric survey, were projected onto the new surface of “model A”. It is in this action that the potential of the software platforms used emerge that, in an automatic way, have made possible to carry out a photo blending operation, ensuring a diffused homogeneity of brightness on all the images and avoiding sudden changes in color between both images (
Figure 4).
This is a particularly advantageous aspect if we consider the high number of images used during the texturing phase of modeling which, in a reasonable time, are processed and amalgamated with each other, recreating a particularly realistic chromatic information of the surfaces (
Figure 5).
The created three-dimensional model is a final product of high geometric perfection and high quality of colour rendering [
44].
The methodology identified has created a 3D mesh model that can also be shared within web pages, while maintaining good color quality of lighting and contrast. This result was achieved by increasing the brightness and contrast of the model by about 30% and altering the colorimetric value of the acquired data.
For the research purposes, the objective was to create an innovative 3D mesh model, a “smartly functional” urban model developed on the fusion of the two approaches: the first with an integrative approach, where the city is modeled on layers and geospatial content which, by stratifying and integrating, creates additional elements to the model; the second more constructive and design oriented, where the construction details of the city are mostly maintained and enhanced.
In a simple geospatial model, the characteristics relate to each other, by nature and position, in the innovative environment created. The numerous and detailed information, including semantic ones, describing each structural component of the model, are integrated with the built environmental elements.
This includes the advantage of easily adapting the information related to the internal and external environments to the data source as well, not only mapping the structure of the building, but modeling and organizing the information in a semantic and three-dimensional model of an entire and wider area in the heart of the “Rione Sassi”.
4.3. Geometric Analysis of the Actual Displacements, Distortions, and Deformations on the 3D Mesh Model
In this phase, a geometric analysis is made to investigate the structural alterations of the building structure. Thus, the 3D mesh model becomes the starting point for the verification of the geometric/spatial interpretative hypotheses gradually formulated; first on the basis of the materials collected during the historical research and analysis of preliminary investigations, and subsequently on the spatial correlations between the various underground environments and between these and the wall complex. Downstream the seismic vulnerability assessment conducted for the macro elements, after identifying the response in terms of collapse mechanisms due to loss of equilibrium and the consequent transformation into a kinematics of one or more portions of the masonry, we proceed to the evaluation of the overturning hypotheses, displacements, and collapses on the 3D model.
In principle, the possible collapse mechanisms are infinite, since each structure can be arbitrarily transformed into a kinematics by inserting suitable breaking planes and hinges. In the usual practice, we tend to restrict the analysis to a few significant cases on the basis of knowledge of construction techniques and observation of the damage of similar structures. In the variety of construction techniques, dimensions, and shapes with which churches of different periods and importance are presented, we proceed to a classification of the architectural elements, to which corresponds, in general, a largely autonomous structural behavior, favored precisely the type of each product. However, for the purposes of the macro-element seismic vulnerability analysis, we proceed with a simplification and schematization of the artifacts into macro-elements necessary for a simplified analysis of the seismic response. Only subsequently, for each macro-element, the main collapse mechanism is evaluated.
For the purpose of a more accurate evaluation of the results obtained in this phase, therefore, we proceed first of all with the geometric analysis of each architectural element.
So, as reported in the Ministerial Circular 617/2009, in existing masonry buildings, the level of knowledge LC1 is considered reached when the geometric survey, the limited in situ checks on the construction details, and limited in situ investigations on the properties of the materials, have been carried out (Complete survey with graphic rendering of cracking and deformation patterns).
Subsequently, we proceed to the static monitoring of the structures with a network of sensors (IoT), with the definition of a plane (sensor plane), built on the basis of the results obtained from the geometric analysis of the 3D mesh model.
4.4. Digital Enhancement of the 3D Model with Real-Time Data (IoT)
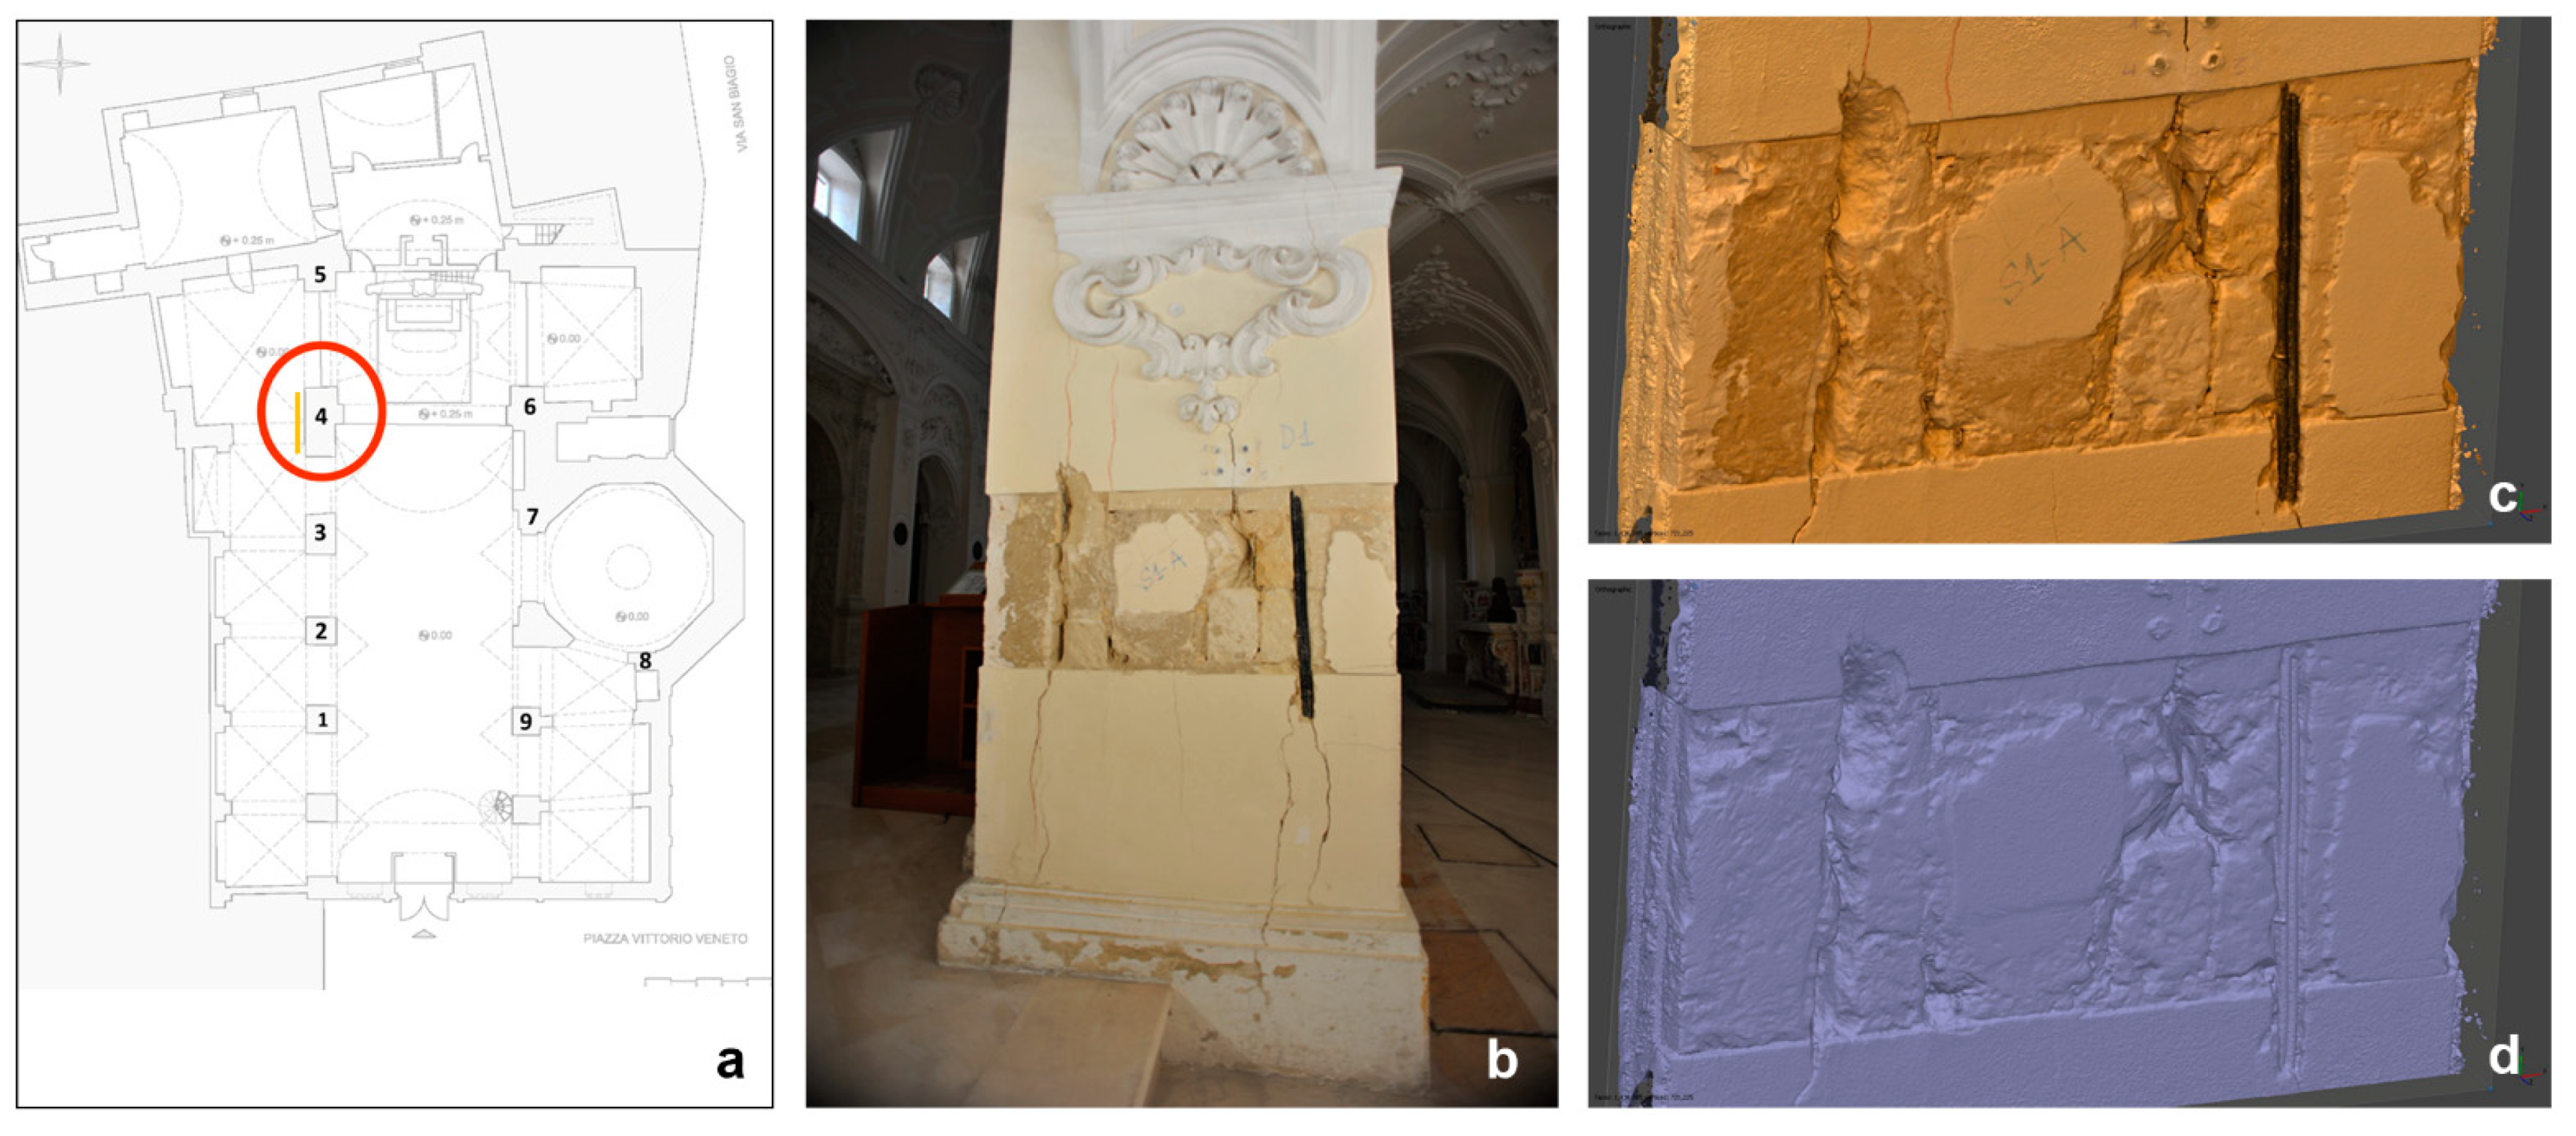
The 3D model is enriched with a further sense, the realistic one, where the methodological approach allows to represent physical reality, through an “augmented” virtual model, transforming it into a digital product, physically enriched by the integration of IoT and therefore representative of a constantly evolving reality and updating of physical phenomena (real-time). In the damaged building, in effect, it is considered of primary importance to examine the lesions (see
Figure 6) in their characteristics and their development, with the aim of defining the origin of the causes and therefore preparing an adequate recovery or restructuring plan. The solution, planned for the possible evaluation of the pushing actions of arches and vaults not properly absorbed, considers the use of a sensor system (IoT), enabling the measurement of deformations through the use of strain gauges and the measurement of any relative rotations through the installation of vertical and horizontal biaxial inclinometers. The check is carried out at intervals of one minute.
4.5. Spatial Information in Real-Time: IoT and the 3D Model
The development of a 3D mesh model, coming from the merger of acquisitions of the modern laser scanner and photogrammetric detection techniques, has offered several advantages, generating an effective management tool for all phases relating to the study of the vulnerability of structural and non-structural elements.
The acquisition of monthly data and the subsequent processing of these allowed a rigorous metric-dimensional control of the geometric shape of the work, providing an archive of heterogeneous, well-structured, integrated, and preparatory information for any subsequent interventions on the building.
The graphic rendering of the data, acquired with direct and indirect detection, has allowed the elaboration of new cognitive data, considered by the structuralists being the scientific basis for conducting more critical, reliable, and verifiable analysis, aimed at deepening and interpreting the characteristics and particular configuration of the infrastructure also within a BIM environment. A single information base was thus created, in which to integrate the assessments and data got from the 3D model with data from sensors and configured within an IoT network [
45], in order to develop a structural monitoring system and a small prototype for the management of the city of the Sassi, based on a GIS type application framework and available on the web [
46,
47].
Specifically, the ultimate goal is to integrate information from IoT physical sensors with the “virtual sensors” ones and coming from the representation of the real object and its state (contextual and spatial information). The Ministerial Circular 617/2009 also prescribes, for all three levels of knowledge (LC), the geometry of the structure that must be defined by a specific survey on site, thus identifying the position of any niches, cavities, and flues that may weaken the masonry involved, as well as detecting the vaults and horizontals also (typology and warping), a series of on-site checks and investigations on the construction details, on the properties of the materials and entire relief of the graphic rendering about cracking and deformation frames.
This ambitious goal necessarily involved in-depth study and a specific research activity oriented to communication standards for in situ and real-time acquisition and integration for this type of data [
48]. The goal was, therefore, to create an effective static structural monitoring model and the development of a highly integrated system, where the use of sensors must be able to provide a very precise and detailed picture of the environment in which there is the structure, capable to identify and return those spatial information in real-time, useful for potential analysis and assessments of the conservation status of the work, with the ambition to identify, even in advance, the problems causing damage to the Opera [
49].
Structural monitoring was also integrated with the acquisition of environmental parameters (temperature, humidity in contact, and relative humidity of the environment), with the aim of evaluating their impact on the degree of resistance of the structures and the possible presence of humidity in the tuff bank.
The examination of the crack pattern and the results of the verifications, in the structural organism with both vertical and seismic loads, clearly indicate the need to carry out widespread static consolidation interventions of the Church, in particular, to guarantee the safety levels required by the regulations currently in force, with respect to vertical loads.
The Wireless Sensor Network
The case study, therefore, also contemplates the development of an IoT platform in the cloud for the static monitoring of the seismic risk wall infrastructure, subject to safety measures. In order to use the wireless sensors, to monitor the factors affecting the static nature of the work, a monitoring plan has been developed to identify the type of sensor, the number of IoT devices (sensors and gateways), and their precise positioning and preparation inside the Church.
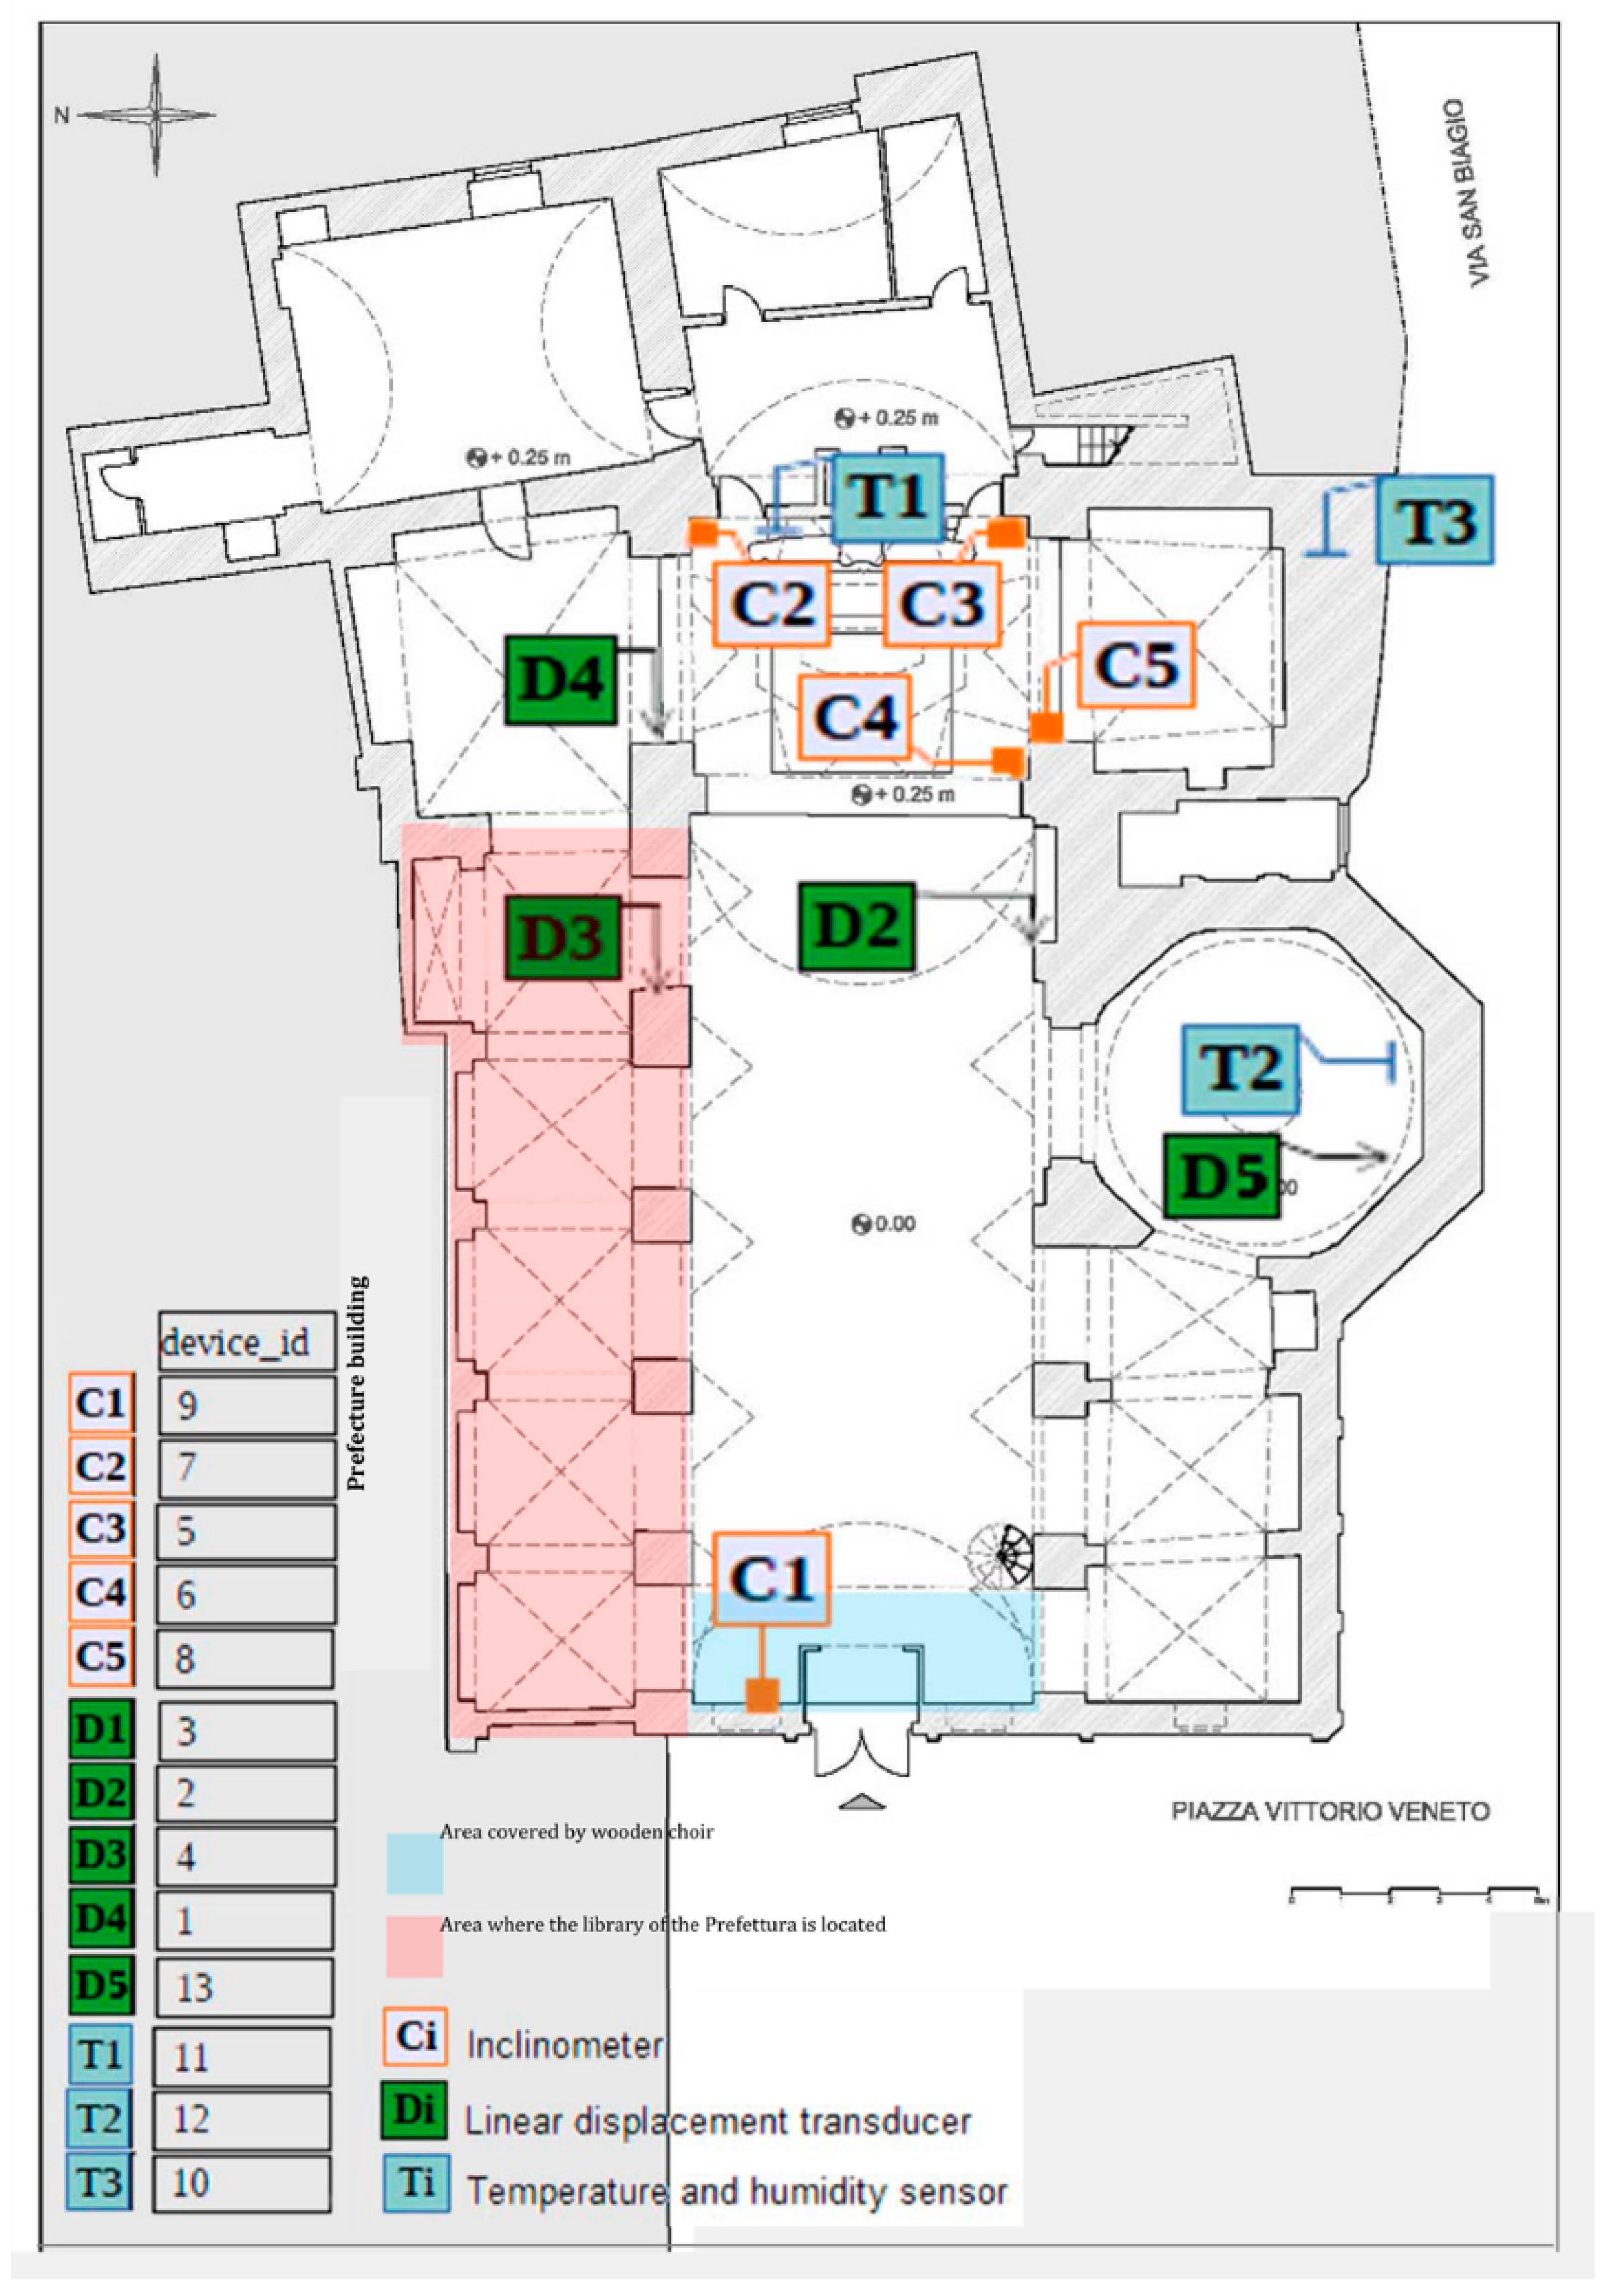
The data emerging from the crack pattern, which includes various points of the church, led to the creation of a monitoring system with IoT devices connected to the 5G network, capable of checking the elements of the infrastructure and the wear to which they are subjected. For the case study, in fact, the devices adopted within the Church are: linear displacement transducers, inclinometers, internal temperature and humidity sensors, and external temperature, humidity, and pressure sensor (
Figure 7).
The single injured element was monitored by means of high sensitivity linear displacement transducers. The network of wireless sensors installed collects and sends data through an NB-IoT gateway (5G connection) to a cloud software platform that receives the data and analyzes it. The data is collected and stored on a digital platform as well displayed through a user-friendly and usable web application, where the end user from any device (PC, tablet, or smartphone) and without any need of specific software can view and analyze the collected data. The static structural monitoring IoT system made possible to manage a large number of connected sensors, even of different types, through a simple user interface (dashboard). From a software point of view, an innovative IoT network infrastructure was thus created, equipped with a modular, efficient, scalable, replicable, and simple architecture, capable of managing a large amount of data in an effective and secure way.
The platform was also designed and built for possible and future developments, from the generation of on-site implementations, end-to-end 5G network functionality to the use of other communication protocols on the public network or LPWAN (Low-Power Wide-Area Network).
5. Results and Discussion
From the critical analysis of the preliminary investigations, combined with the interpretations of the geometries deriving from the 3D mesh model, many results have been obtained that characterize the structural behavior of the wall structure.
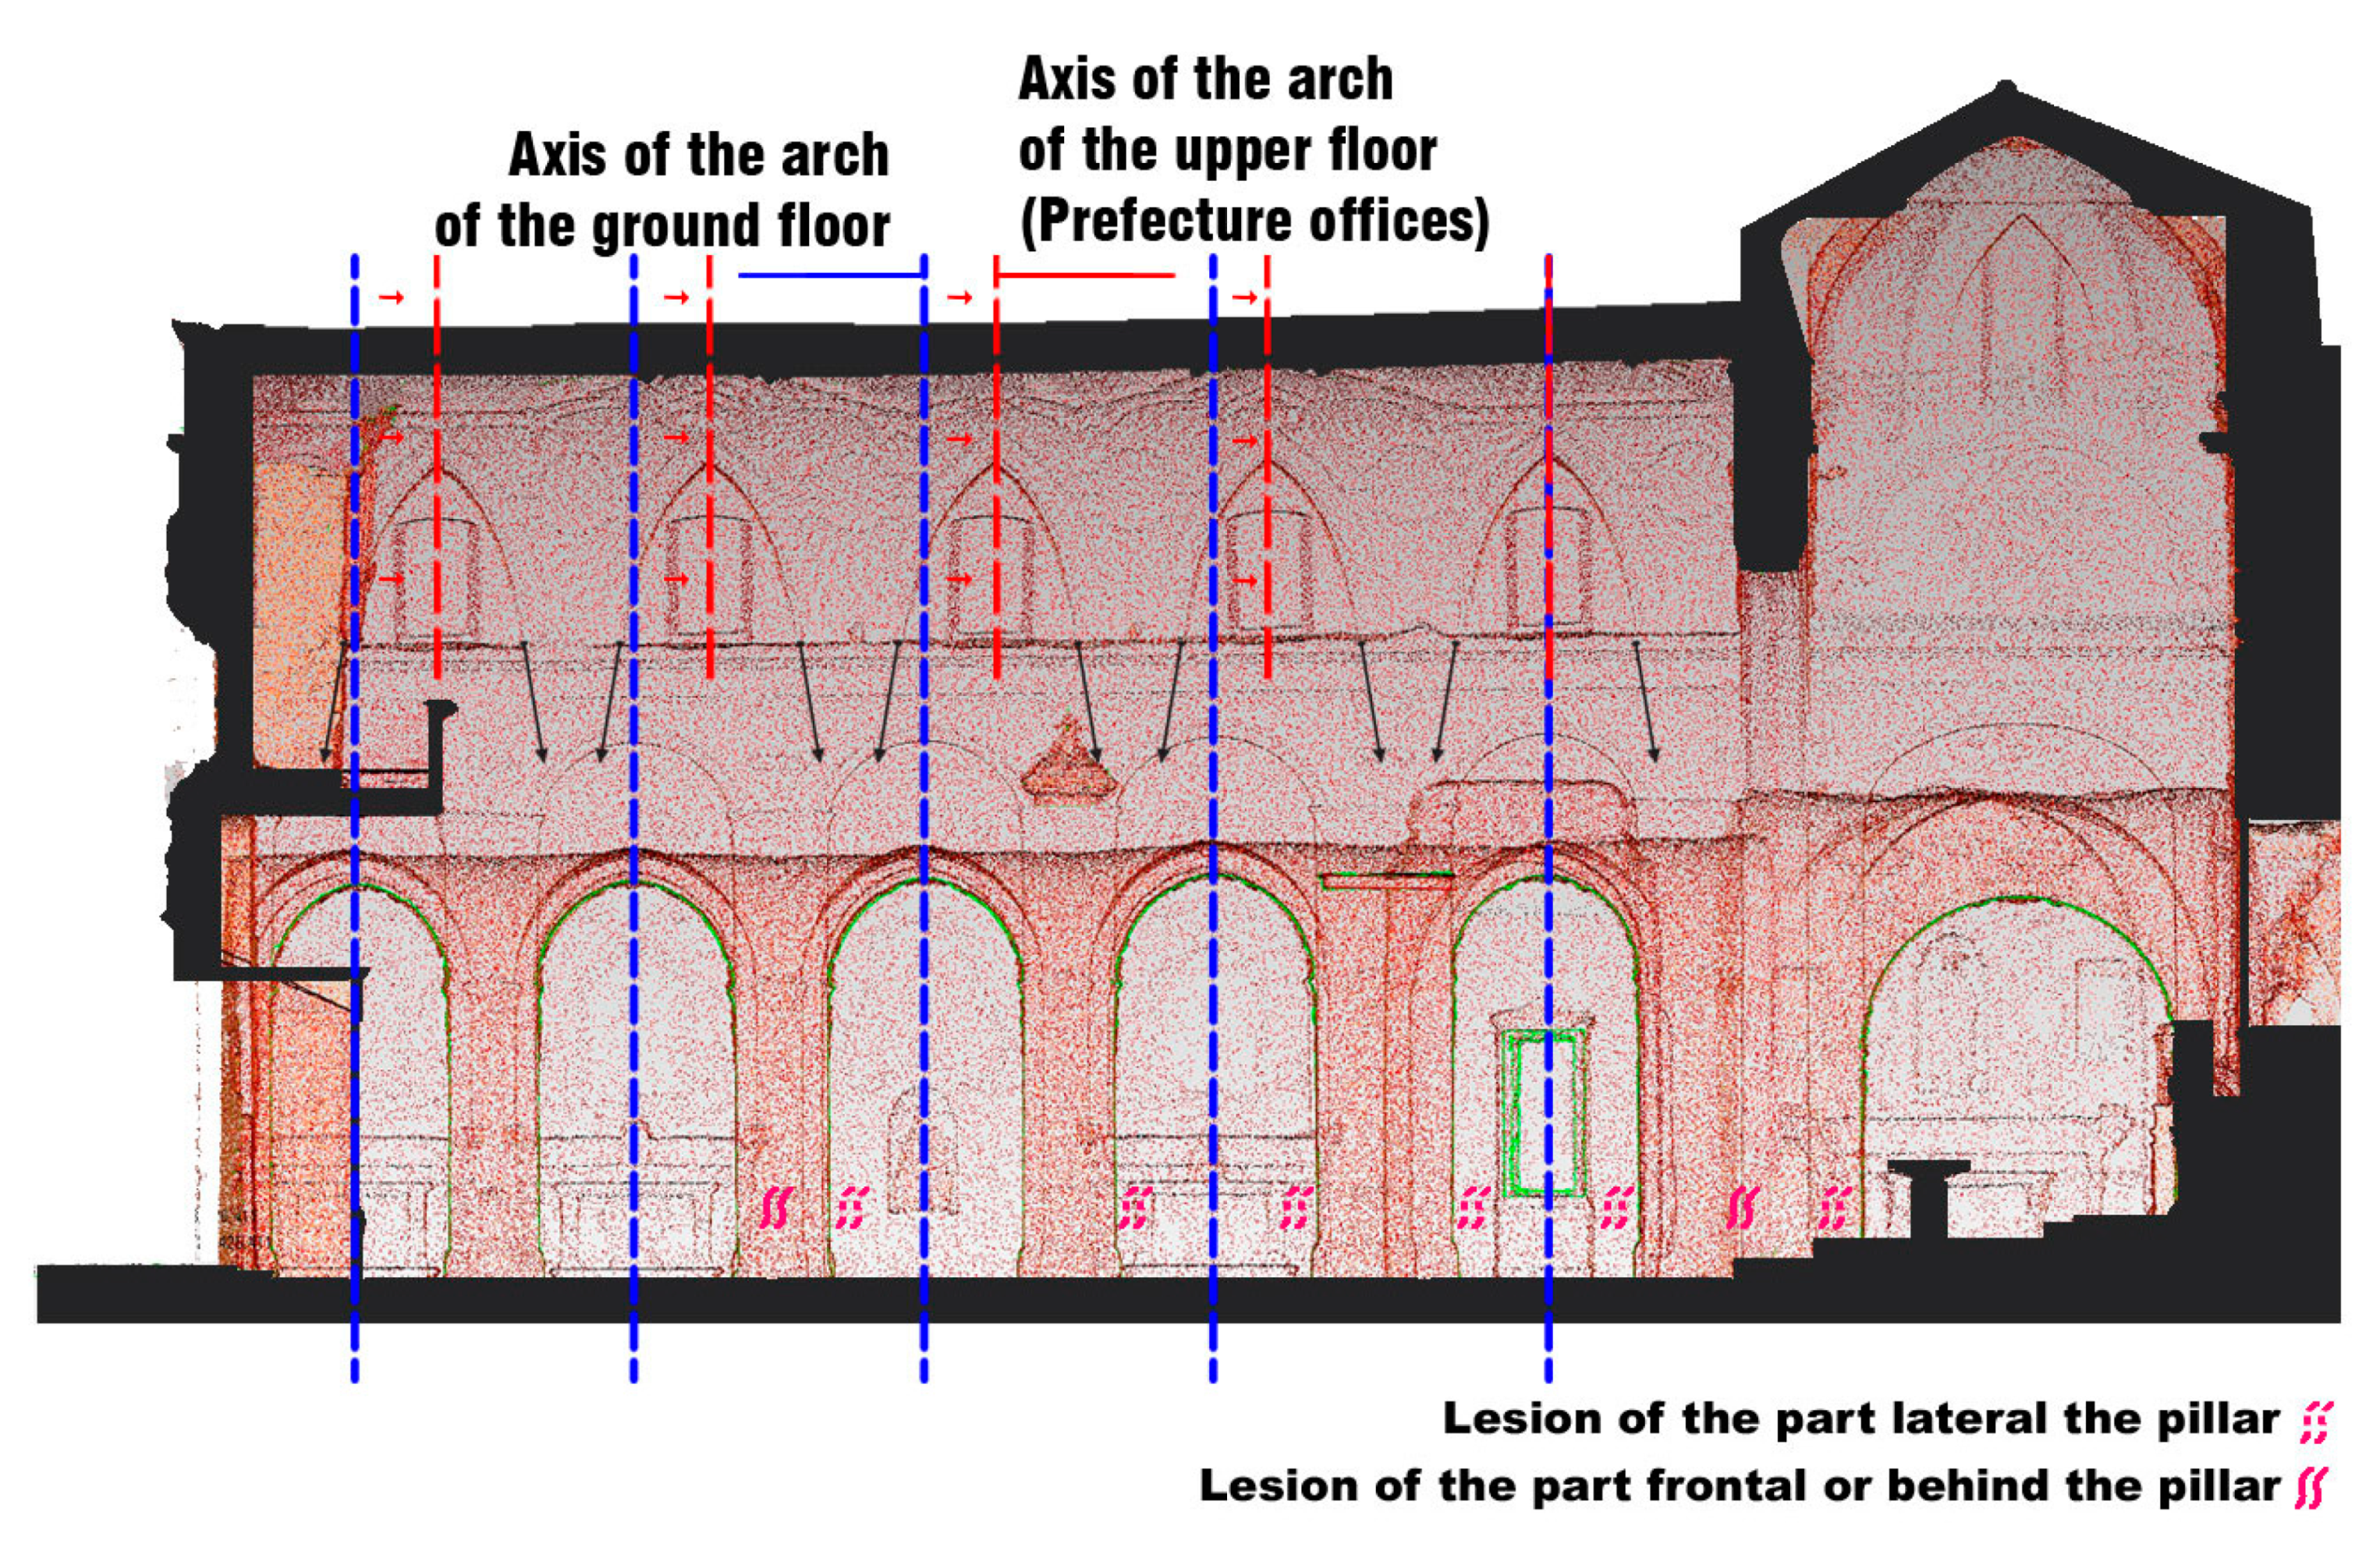
The major structural problems that have emerged to date confirm the thrusting actions of arches and vaults which, not properly absorbed, determine a state of stress, mainly, in the load-bearing elements of the central nave, generating a significant partialization of the resistant sections.
In this regard, numerous geometric analyzes of the architectural elements on the 3D model were produced, evaluating the position of arches and pillars and elaborating significant sections, which highlight the thrust actions on arches and vaults and vertical loads not aligned with the lower structures (see
Figure 8).
In a seismic vulnerability study, the structuralists hypothesize that the instability on the row of pillars of the left aisle was also accentuated by the weight coming from the halls of the library of the Prefecture, as the presence of heavy shelving has certainly increased the load acting on the underlying pillars, contributing to the appearance of the lesions along the shafts of the columns.
The rooms of the Prefecture are located in structurally adjacent areas with respect to the rooms of San Domenico Church, therefore, as for the assessments with vertical loads, these rooms are directly influenced by the minimum security conditions dictated by the structures of the Church.
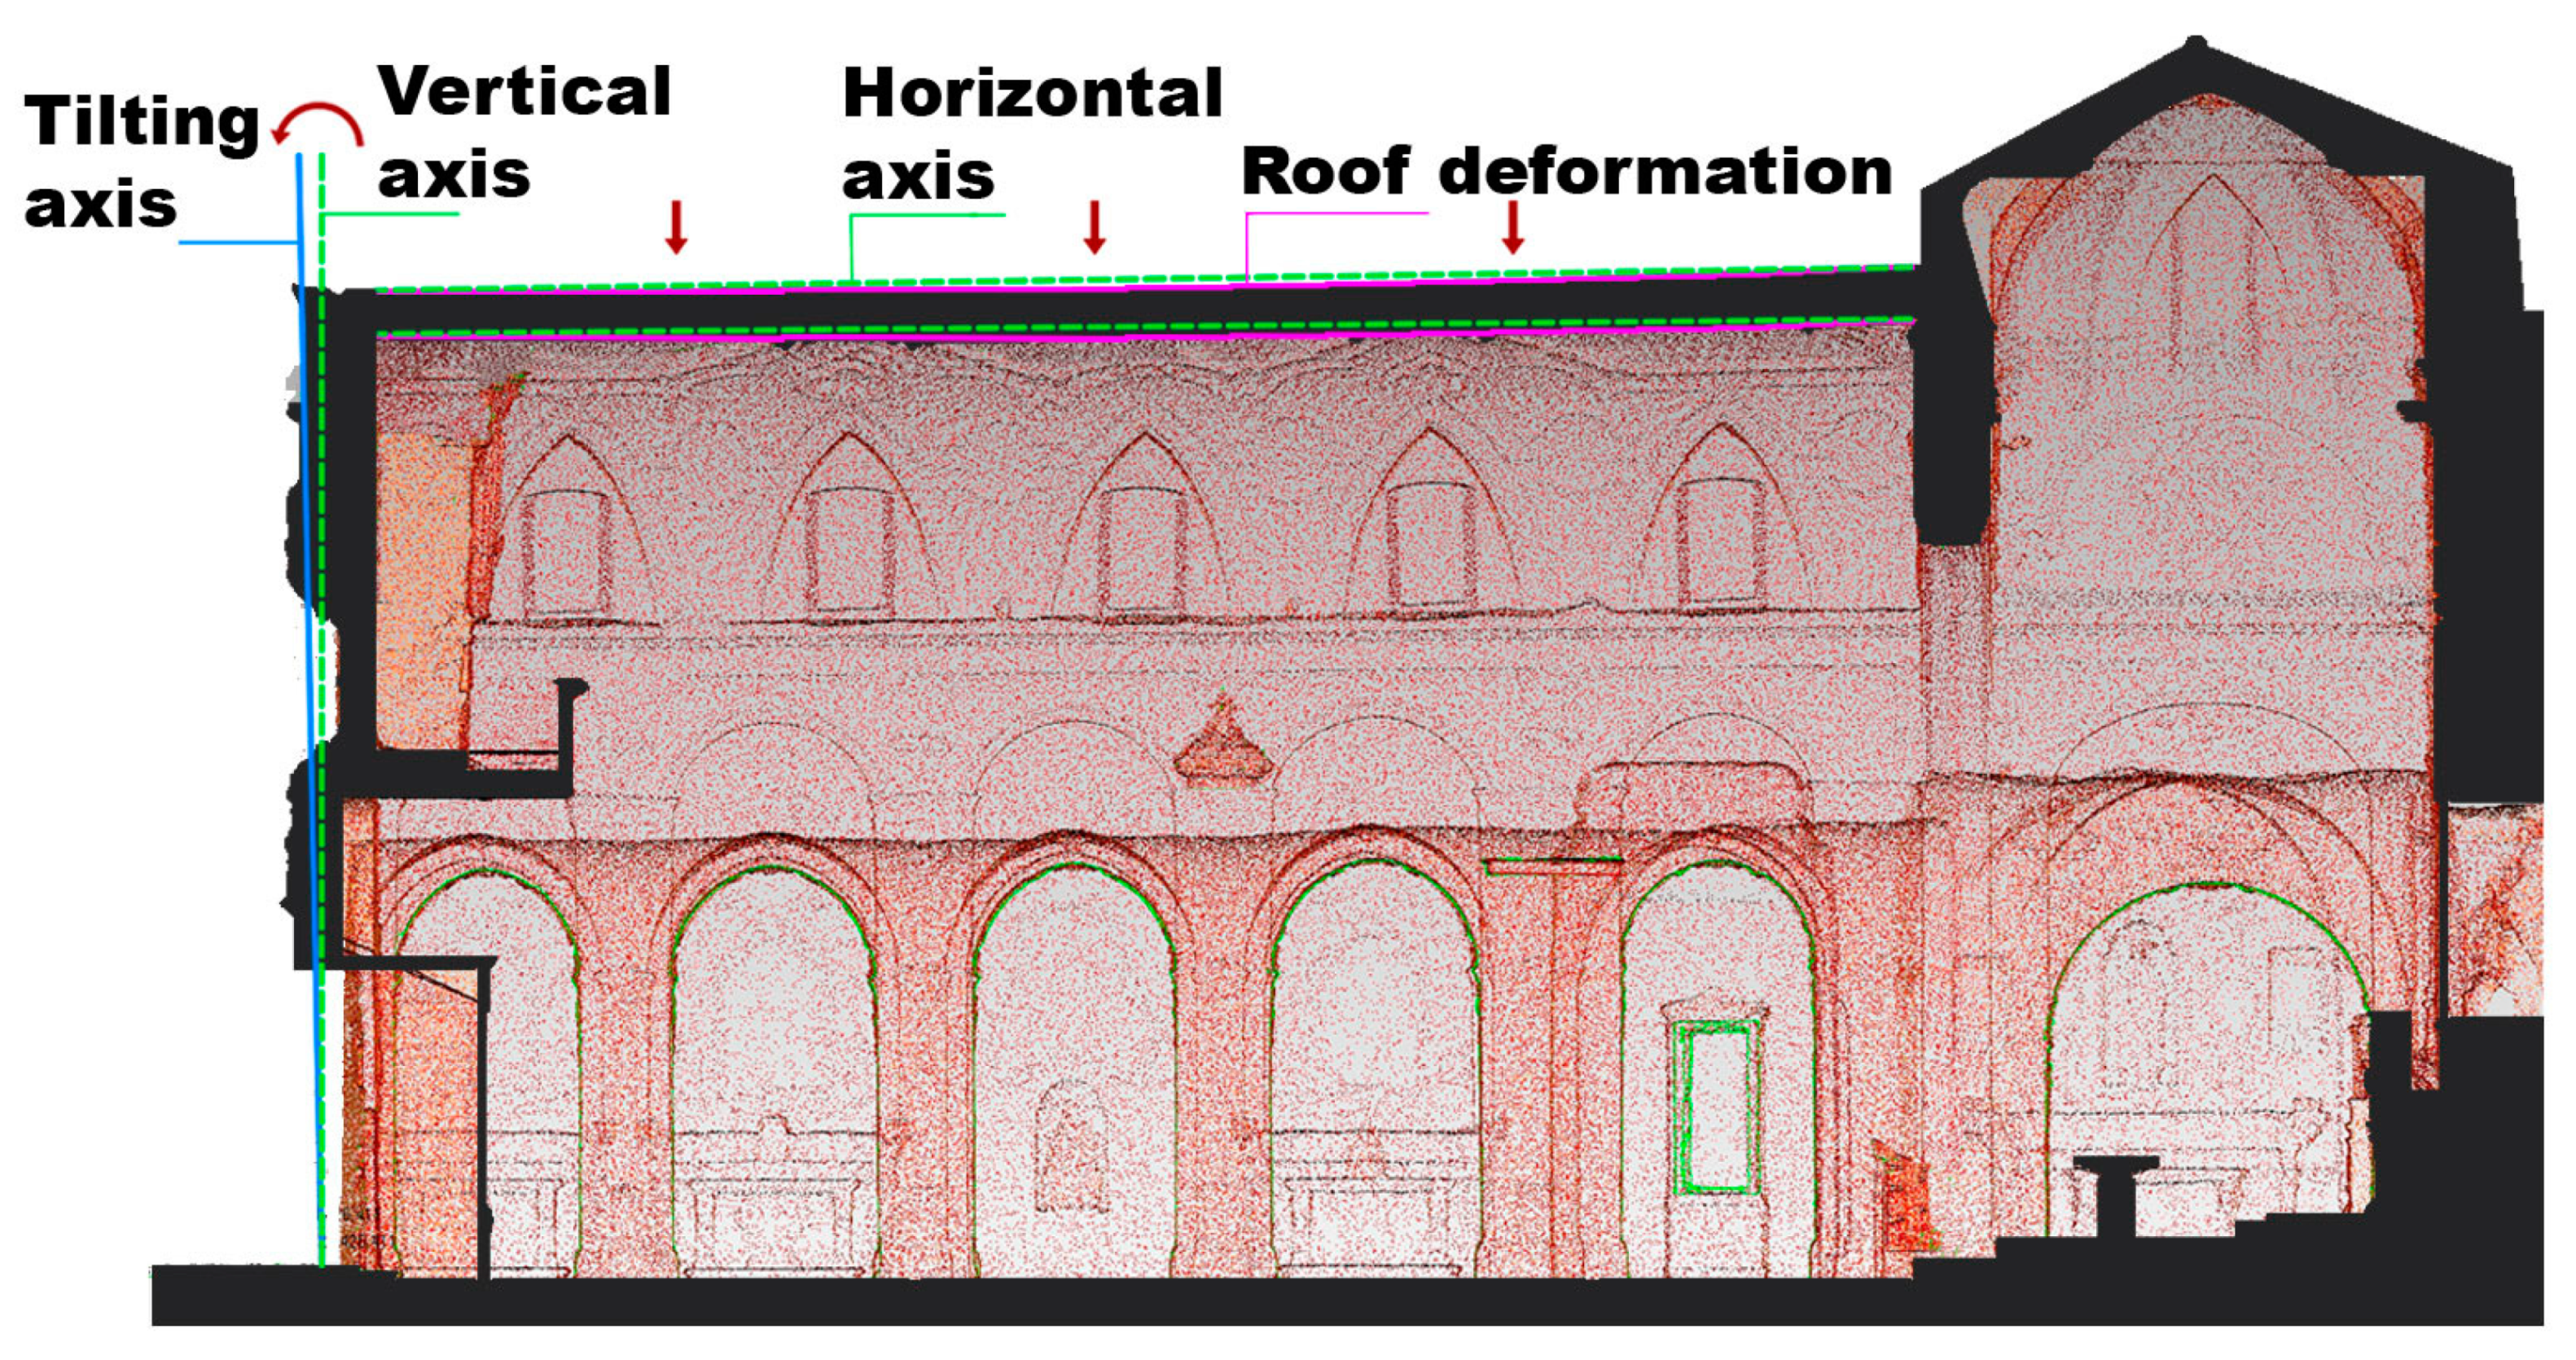
The roof of the main nave is particularly affected by the collapse of the underlying structures, in fact it has, on the extrados, an area of instability and depression.
Thus, the evaluation of any deformations of the roof in the 3D mesh model was carried out, finding a significant lowering of the roof in the center of the central nave (see
Figure 9).
The group of technicians, responsible for designing the safety of the Church, also assume that the widespread instability is also attributable to the phenomena of infiltration and rising damp from the underground rooms opening below the entire surface of the complex. In fact, further cracks are evident both on the shafts of the columns on the right side and at the base of the pillars supporting the dome of the altar (see
Figure 6 lesions).
This instability cause is due to the fact that the structural organism is a complex “suspended” above the underground Matera, or rather, above a very particular place, the “Palombaro Lungo”, currently the largest cistern to collect rainwater in the world, with a capacity of 5 million liters of water, 16 m deep and 50 m long, which is the result of several artificial excavations carried out starting from the 16th century.
The cistern dates back to the 19th century and was rediscovered only in 1991 thanks to some scholars, led by Enzo Viti from Matera, an expert in the “underground Matera” [
50].
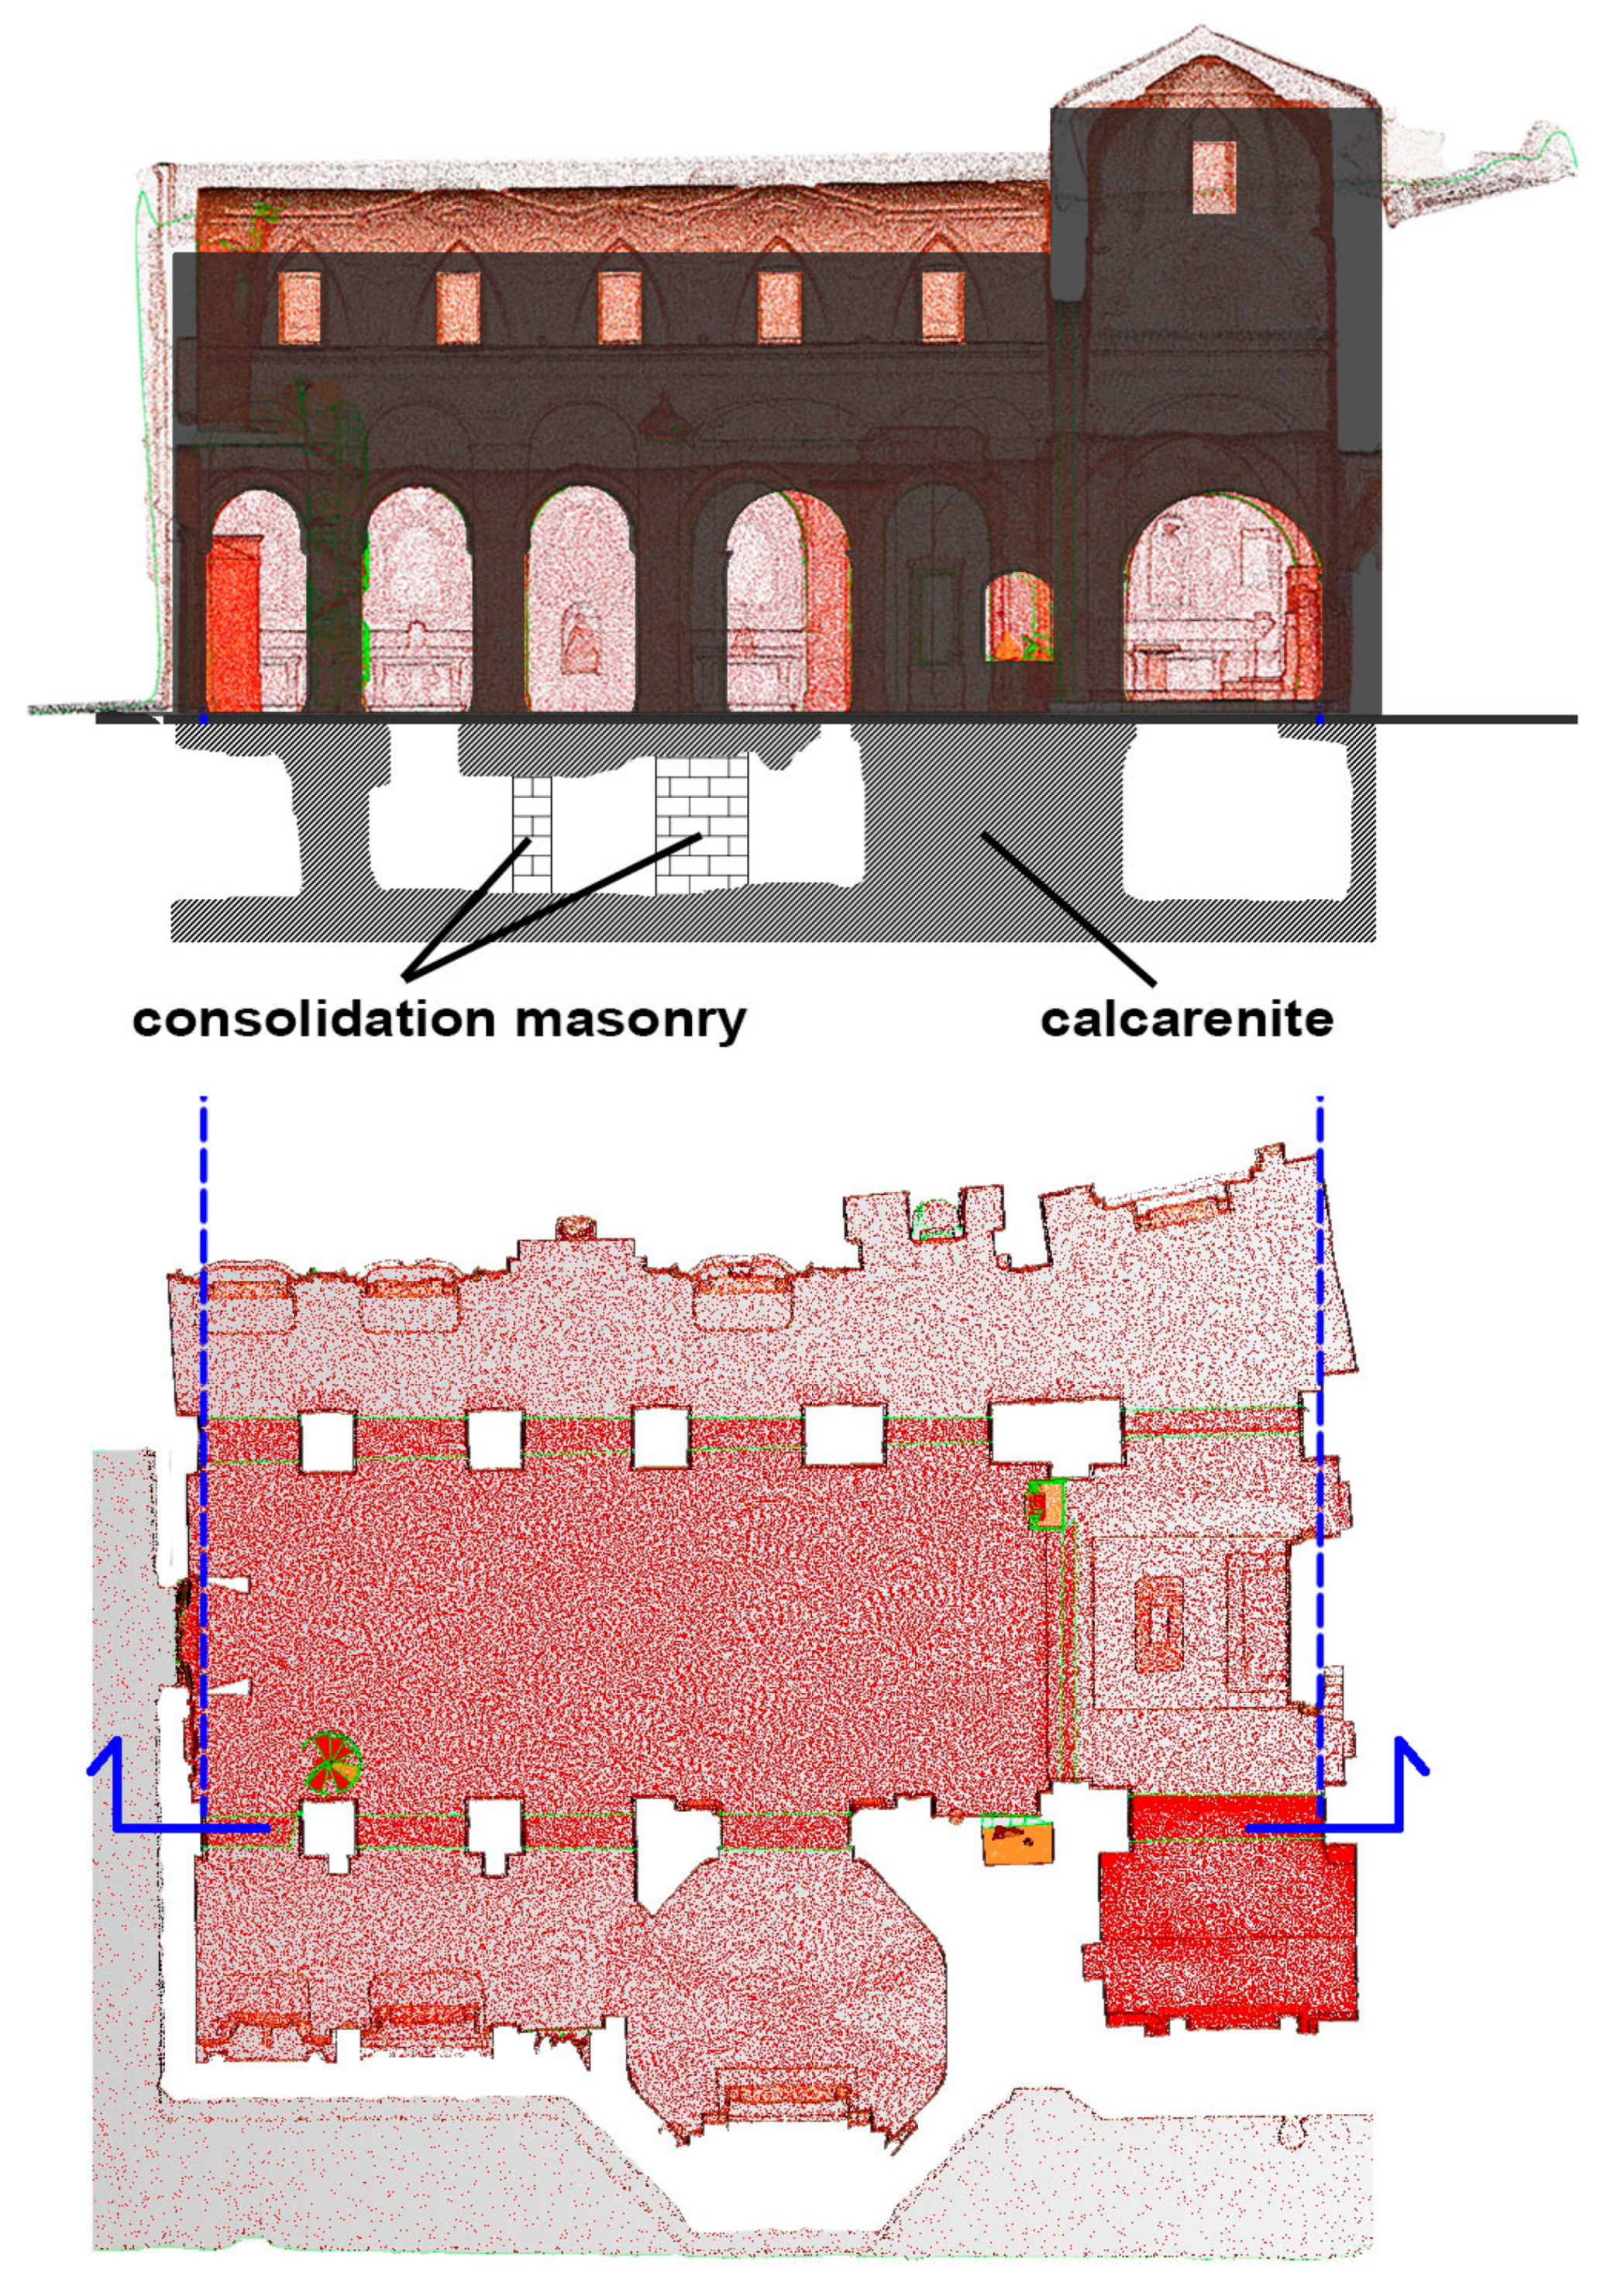
An important laser scanner survey of the whole area below the complex was also identified (see
Figure 10) for the geometric analysis, extended to the hypogeal-church structure, proving to be a valuable investigation tool for “invisible” areas. The underground space, above the complex, is in the “heart” of the city of Matera and spreads over four levels of superimposed hypogea, also extending below one of the most important and popular squares in the city of Matera—Piazza “Vittorio Veneto”. This survey allowed the evaluation of important geometries and the identification of the layers of the walls of “tuff” (calcarenite [
51]) that distance the four levels of superimposed hypogea and the thickness of the walls.
For the safety conditions assessment, with regard to the “sinkhole” risk, of the San Domenico church structures and the adjoining Prefecture of Matera, the entire geometric and geomechanical model of the hypogeum-structures was analyzed. From the study of the mapping of the underlying underground cavities produced by geologists [
5], areas in which the thickness of the calcarenite cover is small in relation to the loads transmitted to the ground by the structures have been identified. From a first analysis of vertical loads, it would seem that the crack pattern and the structural failures observed in the church of San Domenico are located precisely in correspondence with those structural elements that fall in the areas where the thickness of the calcarenite is minimal (see
Figure 11). However, the reconstruction of these sections of the hypogeum-church complex does not justify the contradictory result that the columns, currently more in absolute disrepair (triumphal arch of the Church), have more regular and on average thicker calcarenite thicknesses than the others [
5].
The major criticalities in seismic conditions (SLV—Limit State for Safeguarding Life), as already highlighted also for the analyses with only vertical loads, concern the triumphal arch and the structure of the cross over the altar.
The vertical actions stress the four columns of the altar but also the thrusts, due to the triumphal arches and the lateral ones that support the vault of the cross and the pushing actions determine on the perimeter columns a state of strained pressure deflection.
The vertical actions on the four columns of the altar, together with the thrusts due to the triumphal and lateral arches that support the cross vault, determine thrusting actions on the perimeter columns, generating a state of deflected pressure.
In succession, we find the response of the main nave with the activation of the overturning mechanism of the unloading piers of the barrel vault to support the roof. The façade of the church also needs interventions to block the overturning kinematics as well as the tympanum, where the activation of the inclined hinge is mainly due to the presence of the rose window and the facade windows (see
Figure 9).
Relatively to the portions of the building located on the structural vertical with respect to private premises, the assessments with seismic loads highlight, for the SLV limit state, the possibility of activating the tilting mechanism outside the plane for the wall facing via “San Biagio”, in absence of an effective contribution of the tie rods present today. Therefore, the need to continuously monitor the complex organism arose.
The examination of the crack pattern and the results of the verifications, in the structural organism with both vertical and seismic loads, clearly indicate the need to carry out widespread static consolidation interventions of the Church, in particular, to guarantee the safety levels required by the regulations currently in force, with respect to vertical loads.
Because of this situation, already in 2018, the Municipality decided to monitor, first with analog and then digital and remote (IoT) techniques (still in progress), the crack pattern present inside the Church, through a complete survey of the building, in order to be able to intervene in a targeted manner in the focal points. From the combination of the information collected directly from the premises involved in the study and from what can be directly defined from the analysis of the construction phases of the monumental complex (historical-critical analysis of the building), a program of investigations was immediately defined for a better identification of the structural organism, of the types and characteristics of the materials, but, above all, a current verification of the condition of the hypogea present in the area affected by the buildings (Church and Prefecture).
5.1. “Smartly Functional” Urban 3D Model Interface
The created 3D model has therefore become a great resource for knowledge of architecture, a volume and surface meter complete with all three-dimensional data, which can also be integrated with other external metric information (coming from direct surveys or maps), a true own container loaded with a field of exclusive information. At the same time, the 3D model proved to be a valuable means of safeguarding the architectural artifact and passing on its knowledge to future generations. With this aim, the study also evaluated the possibility of importing the object into a web viewer where, in addition to the ability to rotate and inspect the architectural artifact, it is also possible to measure and section it along the X, Y, Z axes, using simple and intuitive tools. The software examined was 3DHOP (3D Heritage Presenter), a program developed by the ISTI Institute of the CNR (
Figure 12).
Doubtless the three-dimensional model, in its virtual form, could also become a new way of “representing” reality, as the framework allows you to efficiently stream high-resolution 3D models.
With the use of 3DHOP, it is possible to interconnect the 3D model display with other elements and alphanumeric information, creating integrated presentations (3D + multimedia), which enrich the model [
52].
Even through the use of apps, it would be possible to enrich it with additional visual and non-visual information, thanks to the latest generation digital devices (VR viewers, augmented reality) to enhance and disseminate knowledge even to an audience of simple history and culture enthusiasts, with the aim of disseminating the highly scientific contents of the research in an engaging and exciting way and making the “invisible” visible.
5.2. The Results Achieved by Static Structural Monitoring
An analysis of the data acquired by the monitoring system does not exclude structural failure phenomena attributable to the surrounding environment in which the building is located, which to date is completely altered if compared to the time of its construction. The church, in fact, is located in the “Rione Sassi” and in the center of the city of Matera, appointed European Capital of Culture in 2019, where the evolution of urbanization or the vibrations, due to the nearby passage of heavy vehicles or daily traffic of the commercial activities sprung up next to the Church, are all considered potential causes of deterioration. The spatial information found by the IoT network and the re-examination of the lesions, in their characteristics and their development, have allowed an assessment of the origin of the causes and the preparation of an adequate plan of remediation or restructuring of the work. In an exhaustive manner and for the purposes of assessing the state of conservation of the building, the Church monitoring campaign was also conducted through the continuous monitoring of the internal microclimate, analyzing the variations of its main components (temperature, relative humidity, specific humidity) and the damp content of the walls, useful tools to define not only the type of degradation in progress but also its critical degree.
The major structural problems emerging to date confirm the thrusting actions of arches and vaults which, not properly absorbed, determine a state of stress, mainly, in the load-bearing elements of the central nave, generating a significant partialization of the resistant sections.
The state of stress, associated with the current maintenance deficit of the premises, especially with regard to significant infiltration and humidity phenomena, has determined the current state of emergency and the need to provide, in a short time, for consolidation and the construction of a suitable plan of provisional works, that envisages, in particular, the shoring of the vaults of the left aisle of the Church up to the level of the hypogea and the encircling of the damaged columns.
5.3. The Advantages and Disadvantages of an IoT Platform in the Cloud for Monitoring Purposes
According to a study and analysis in comparison of 26 IoT Cloud platforms [
53] of their adequacy in specific domains of the application field, it seems that the Cloud paradigm has favored the growth of well-oriented platforms for device management, data management and applications, while managing heterogeneity, analysis, and visualization [
54] do not find sufficient technological support. Visualization is essential for an IoT application since it allows interaction between the end user and the IoT environment. Today’s technologies, touch screens of tablets or smartphones, have made intelligent applications more intuitive. Furthermore, extracting and displaying meaningful information effectively from raw data (data logger) is not a trivial operation and involves the design of events oriented both to the simple display of raw data (typical dashboards) and to the display of modeled one, answering to the needs of the end user. Different situations can, therefore, be represented and formalized, determining, by virtue of different needs, the help of different resources and the integration of a different number of modules that interact with each other.
The technological solution, in fact, does not only come from the sensors, but from the way in which they have been chosen and positioned, which software they will use the data collected to carry out analyzes, calculations, and simulations, which will give them the right value and, very often, also from the planning of the activities that will be done on the information obtained.
This makes the design of the architecture and the definition of the operational functions that each component must satisfy very problematic. In this design context, the adoption of a reference standard is even more complex, but considered indispensable and decisive for design purposes, since, in the last decade, the decentralized and chaotic spread of these technologies and the management of heterogeneous and very varied among them have never been formalized in a reference structure for the composition of the entire stack of an IoT architecture.
Consequently, the ability to combine and synthesize data flows, services, and applications from different IoT platforms is a further challenge for the world of research, with the aim of expanding the applications by creating higher level services, where the services of specific systems are integrated into a design approach of federated services and the centrality of data is the real added value of this approach.


