1. Introduction
In every archaeological excavation in the world, a variety of pottery fragments (shortly called sherds) are excavated by archaeologists. Reconstructions of ancient finds from fragments can help archaeologists to analyze data and to understand past life [
1,
2]. Since fragments are typically found in large numbers with a wide variety of sizes and types, their reassembling to get the original shape is very time-consuming and costly [
3]. This issue has always been a concern for archaeologists because the reconstruction process is carried out manually, requiring a great deal of effort [
4,
5].
Advancements in low-cost and high-volume acquisition devices and computer systems have provided new tools for archaeologists to face the problem of reconstruction and improve the efficiency of work [
6,
7,
8]. In recent years, computer-aided reconstruction systems have been developed to assist archaeologists. Visualization and computer vision techniques, such as image processing and pattern recognition, have been applied in the reassembling of archaeological finds to facilitate their analysis and understandings [
5,
6,
7,
8,
9]. These applications were carried out in two-dimensional (2D) or three-dimensional (3D) space [
6,
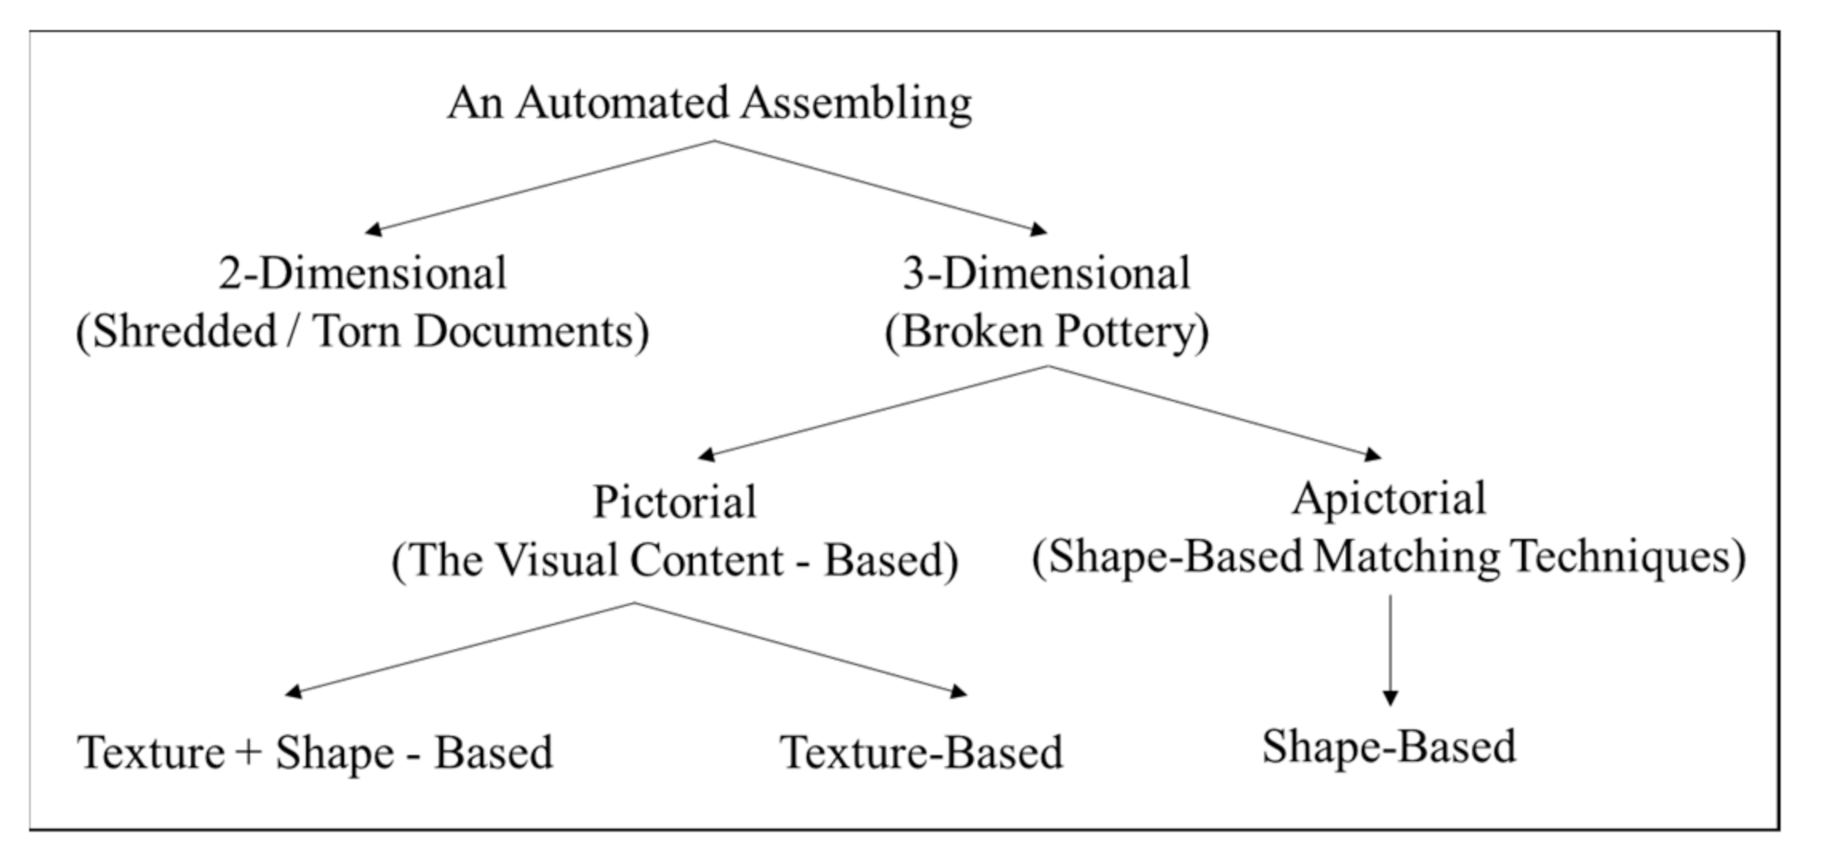
7]. These studies can be categorized into two groups: an automated assembling of shredded/torn documents (2D) and broken pottery (3D). The reconstruction of torn documents is done to retrieve the documents’ actual text, an important process in forensics [
10,
11]. In the second group, the purpose is to find solutions for reassembling broken and fragmented pottery [
12,
13,
14]. An automated solution for each group can be divided into shape-based matching techniques (apictorial) or techniques that analyze the visual content of the fragments (pictorial) [
6]. This categorization is shown in
Figure 1.
Of all the artifacts recovered from archaeological excavations, pottery is one of the most significant because ceramic preserves better when compared with other typical materials of archaeological finds. The 3D pottery reconstruction is conducted according to processes including data acquisition and pre-processing, feature extraction, classification, and matching [
6,
15].
The classification and reconstruction of objects starting from their fragments is one of the most critical tasks for archaeologists. Therefore, it is very useful to provide automated methods to assist them in the reassembling process [
16,
17]. For this step, there are two principal modes: supervised and unsupervised. In supervised mode, some information remains about the original objects and the classification is done according to specific classes [
18,
19]. On the contrary, in the second one, there is no previous information about the original objects. So, the classification is conducted based on the similarities between features describing the fragments [
20,
21,
22]. For the second mode, the feature extraction for classification is an essential part of pattern recognition, where the feature vector is a list of descriptions that includes sufficient information to identify a pattern [
8,
23]. In the literature, a variety of features were used to classify and reconstruct fragments, and a review of these methods up to 2019 is proposed in Reference [
24].
Among studies performed before 2005, most of the researchers were focused on procedures based on the profile of fragments as features. Freeman and Garder presented a procedure that enables a digital computer to solve apictorial jigsaw puzzles. In their research, the only available information is the shape of the pieces [
25]. A procedure to represent the profile of original ancient pottery is proposed by Hall and Laflin. For this purpose, the proposed method, first, approximates the profile of three-dimensional (3D) solids of revolution with B-spline curves; then, these profiles are saved for subsequent display and statistical analysis [
18]. Sablating and Menard proposed two acquisition methods for archaeological finds that could help the archaeologist in his work. They focused on the acquisition methods for their complete automatization, minimizing errors in the output. To get a 3D surface representation of a sherd, they tested the shape obtained by a structured light scanner. Then, they presented the outlooks for a computer-based automatic classification of archaeological finds [
19]. An efficient procedure for reassembling unknown two-dimensional broken objects is described by Leitao and Stolfi. Their procedure compares the curvature-encoded fragment outlines using an incremental dynamic programming sequence-matching algorithm [
26]. Papaioannou and Karabassi in 2002 and 2003 presented two innovative methods for the combination of three-dimensional object parts to reconstruct the original objects. These methods are based on the geometric features of the fragments. The core of their methods is a matching error estimation algorithm based on the distance between the facing fragment sides [
14,
17]. Kampel and Sablatnig developed a solution for automated documentation of archaeological pottery, which also leads to a complete 3D model starting from fragments: the 3D reconstruction is performed by a matching algorithm based on a point-by-point distance between facing outlines of profiles [
13].
After that period, attention to some other features such as surface color and texture was increased for finding pairwise matches between adjacent fragments [
27]. Huang et al. presented an approach for automatic reassembly of 3D fragment solids based on the type of patch-based surface features. In this work, the features are characterized by clusters and overlapping [
12]. Brown et al. present an inexpensive system for acquiring the information of fragments, such as shape, color, plaster surface texture, and surface roughness. Their proposed system to match the fragments has achieved high precision [
10]. Toler-Franklin et al. suggested a multiple-feature approach for determining matches between small fragments of archaeological artifacts, including color maps, normal maps, and 3D meshes. Their approach was tested on three datasets of fresco fragments, achieving a correct percentage of the features selected by 90%, and a non-match of 78% [
28]. Belenguer and Vidal presented a global registration technique for archaeological fragments’ reconstruction. In their work, they applied a hierarchical search technique to align fragments [
7]. A novel method for the detection of conjugate fragments is proposed by Flippas and Georgopoulos. In this method, the Fragmatch algorithm is applied for the global and the partial matching of surfaces. This proposed method is based on the comparison of vectors and surfaces [
8].
All these methods are based on the processing of a manifold 3D model of the fragment. To date, the 3D fragments’ scanning represents the bottleneck in the automatic analysis of large quantities of fragments. From the direct experience of the authors, the process to get a valid discrete geometric model requires, for each sherd, a mean time of about 30 min. To overcome this limitation, another type of study on fragments’ classification was proposed by Rasheed and Nordin [
29]. They focused on an approach based on edge detection from 2D images of the sherd and the polynomial function algorithm. In their approach, the edge curve as the feature is extracted for each fragment. Next, the polynomial function algorithm is applied on the edge of fragments to obtain the vectors of coefficients. Finally, the classification process is conducted based on the correlation of the coefficients. The edge curve of each fragment has complex and nonlinear behavior [
29]. With the increasing complexity of edge curve behavior, the use of nonlinear regression (for example, the polynomial function algorithm) loses its performance to fit the curve. This problem becomes more pronounced when there is high volatility in curve behavior [
30]. Therefore, nonparametric regression methods are more efficient because of their properties in the approximation of functions. In the related literature of nonparametric regression approaches, the wavelet transform method is more popular than other nonparametric methods for modeling this type of curve [
31].
In this paper, a new semi-automatic method based on the analysis of edges of 2D images is proposed. The paper describes the clusterization and matching of fragments based on coefficients correlation obtained with the wavelet transformation method by considering edge curves as features. The rest of this paper is organized as follows: In
Section 2, the theoretical foundations of wavelet transformation are presented. In
Section 3, the proposed approach is described. The next section gives details of the experiments and results. Finally,
Section 5 concludes the paper with several remarks.
2. Wavelet Transformation
For weathering and time, the fragments are often found damaged and worn; as a result, the edge curve of each sherd has a noisy, complex, and nonlinear shape. In these cases, nonparametric regression could be implemented as a powerful method to approximate curves [
31]. The purpose of nonparametric regression is to obtain a regression function with the least number of coefficients while having a good fitting of the curves [
30].
A general regression model can be represented as follows:
where
i is a counter for profiles,
is the independent variable,
is the error term, and
is the regression term. In nonparametric regression, this equation should be rewritten as:
where
is the vector of coefficients and
is the basis function, which can be substituted by Fourier, wavelet, spline, or kernel. In the proposed method, we applied wavelet for its capabilities, which will be discussed in the following.
Wavelets are basis functions used to form an orthonormal basis. These basis functions are used to express a particular set of functions whose squares must be integrable. Each orthonormal basis is made using father and mother wavelets that are displayed with and , respectively.
One of the useful properties of the
wavelet transformation is the analysis of functions in both frequency and spatial domains. This is done by decomposing the function into some base functions, which are generated by
father and
mother wavelets. The function is decomposed by
low-pass and
high-pass filters. Processing the function into the
low-pass filter, approximation coefficients are obtained (
regression coefficients). Thus, these coefficients represent the low-frequency components of a function or main signal. The
detail coefficients (
error term or
noises) result by processing the function into the
high-pass filter. These coefficients contain high-frequency components of the function [
30].
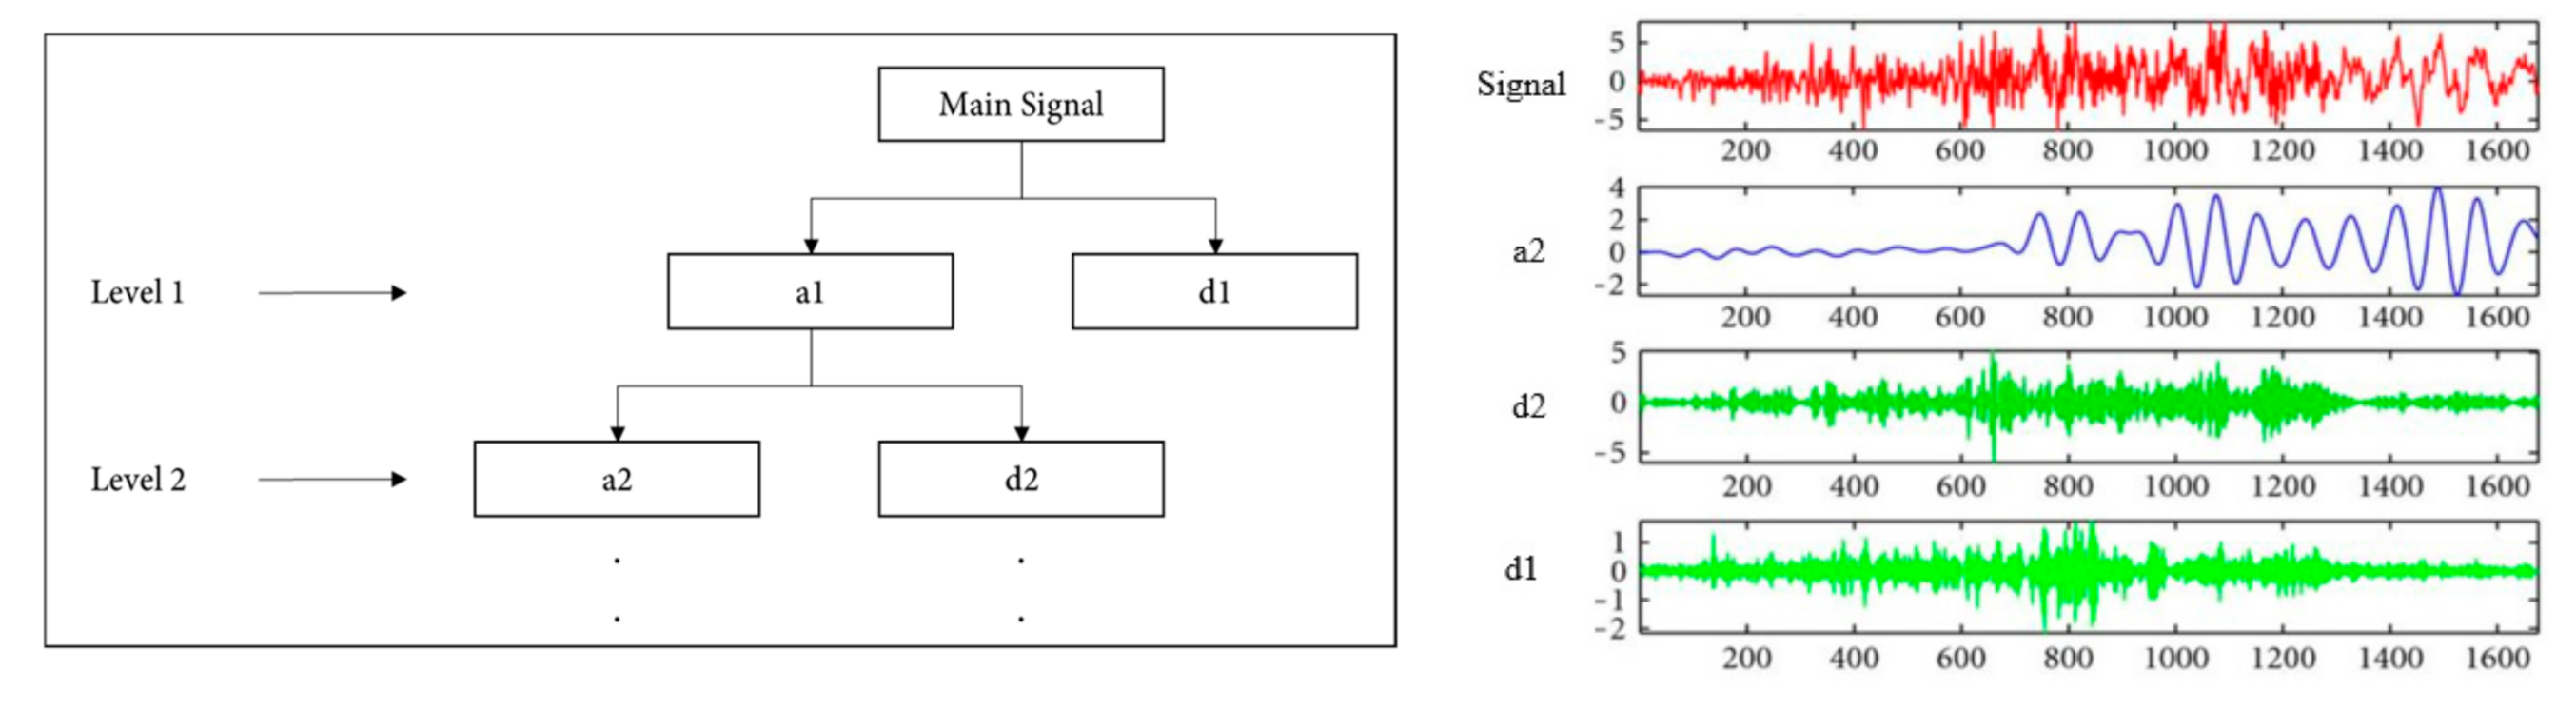
Figure 2 illustrates the decomposition approach based on wavelets.
In
Figure 2, it is seen that, for the first level of decomposition, the signal is decomposed into an approximate part (a1) and a detail part (d2). For the next level of decomposition, a1 is decomposed into a new approximate part (a2) and a new detail part (d2). This process should be repeated up to the desired level of decomposition. At this level, the approximation part has the principal features of the main signal. The approximated part will be like the main signal and has many coefficients at lower decomposition levels. Therefore, there is a direct relationship between the number of coefficients and the similarity of the approximate part with the main signal. Regarding these two factors, the level of decomposition is determined by the user [
30].
There are many options available for
father and
mother, such as
“Haar”, “Daubechies”, and
“Mexican hat”. Each of these basis functions has specific properties, suitable to the particular case under consideration [
32]. In the proposed method, the basis function named
“Daubechies” is applied for its computational simplicity [
31]. Readers are referred to References [
33,
34] for more information about
Daubechies basis functions.
The
for
forms an orthonormal basis. Let
and
be the translation and dilation of
and
, respectively. Each function
can be represented by Equation (1) based on the
father and
mother functions [
33].
In Equation (3), is the inner product of the and the father function, , and is the inner product of the and the mother function, . These coefficients are called wavelet coefficients. The parameter indicates the lowest level of decomposition.
3. The Proposed Approach
In order to cluster sherds belonging to the same pottery and match the fragments, the proposed approach considers their 2D edge curves. As mentioned above, the difficulty in implementing this method is for these curves, coming from real 3D sherds, that have complex and nonlinear behavior. Considering these properties, it is required to use nonparametric regression methods to fit them. One of the most important and widely used methods in this field is the wavelet transformation.
The proposed approach, whose diagram is shown in
Figure 3, comprises four primary stages:
Data Acquisition and Processing,
Edge Detection,
Coefficient Approximation,
Clusterization and Matching.
The first stage includes image acquisition by a camera and the subsequent processing to improve the contrast of the features that will be extracted. Then, in the second stage, the 2D edge curves of fragments are extracted by applying the Canny filter algorithm. After that, the wavelet transformation method is used to fit and to approximate the edge curves: approximation coefficients are obtained by processing the edge curves into the low-pass filter. In the last stage, the clusterization and matching are done based on a correlation between coefficients.
In the following, the stages of the proposed approach are described.
3.1. Data Acquisition and Processing
At this stage, the 2D images of the fragments’ fractured areas are captured. Each fragment is locked on a support to position the camera as perpendicular as possible to the fractured area to be photographed. The edges have to be in focus, and the flash must not generate artifacts on digital images. The method does not have a defined protocol for the stage of acquiring the images, since the high-pass filter in wavelet transformation (as described in
Section 2) can denoise the effects of the camera flash or the variability of the lighting.
3.2. Edge Detection
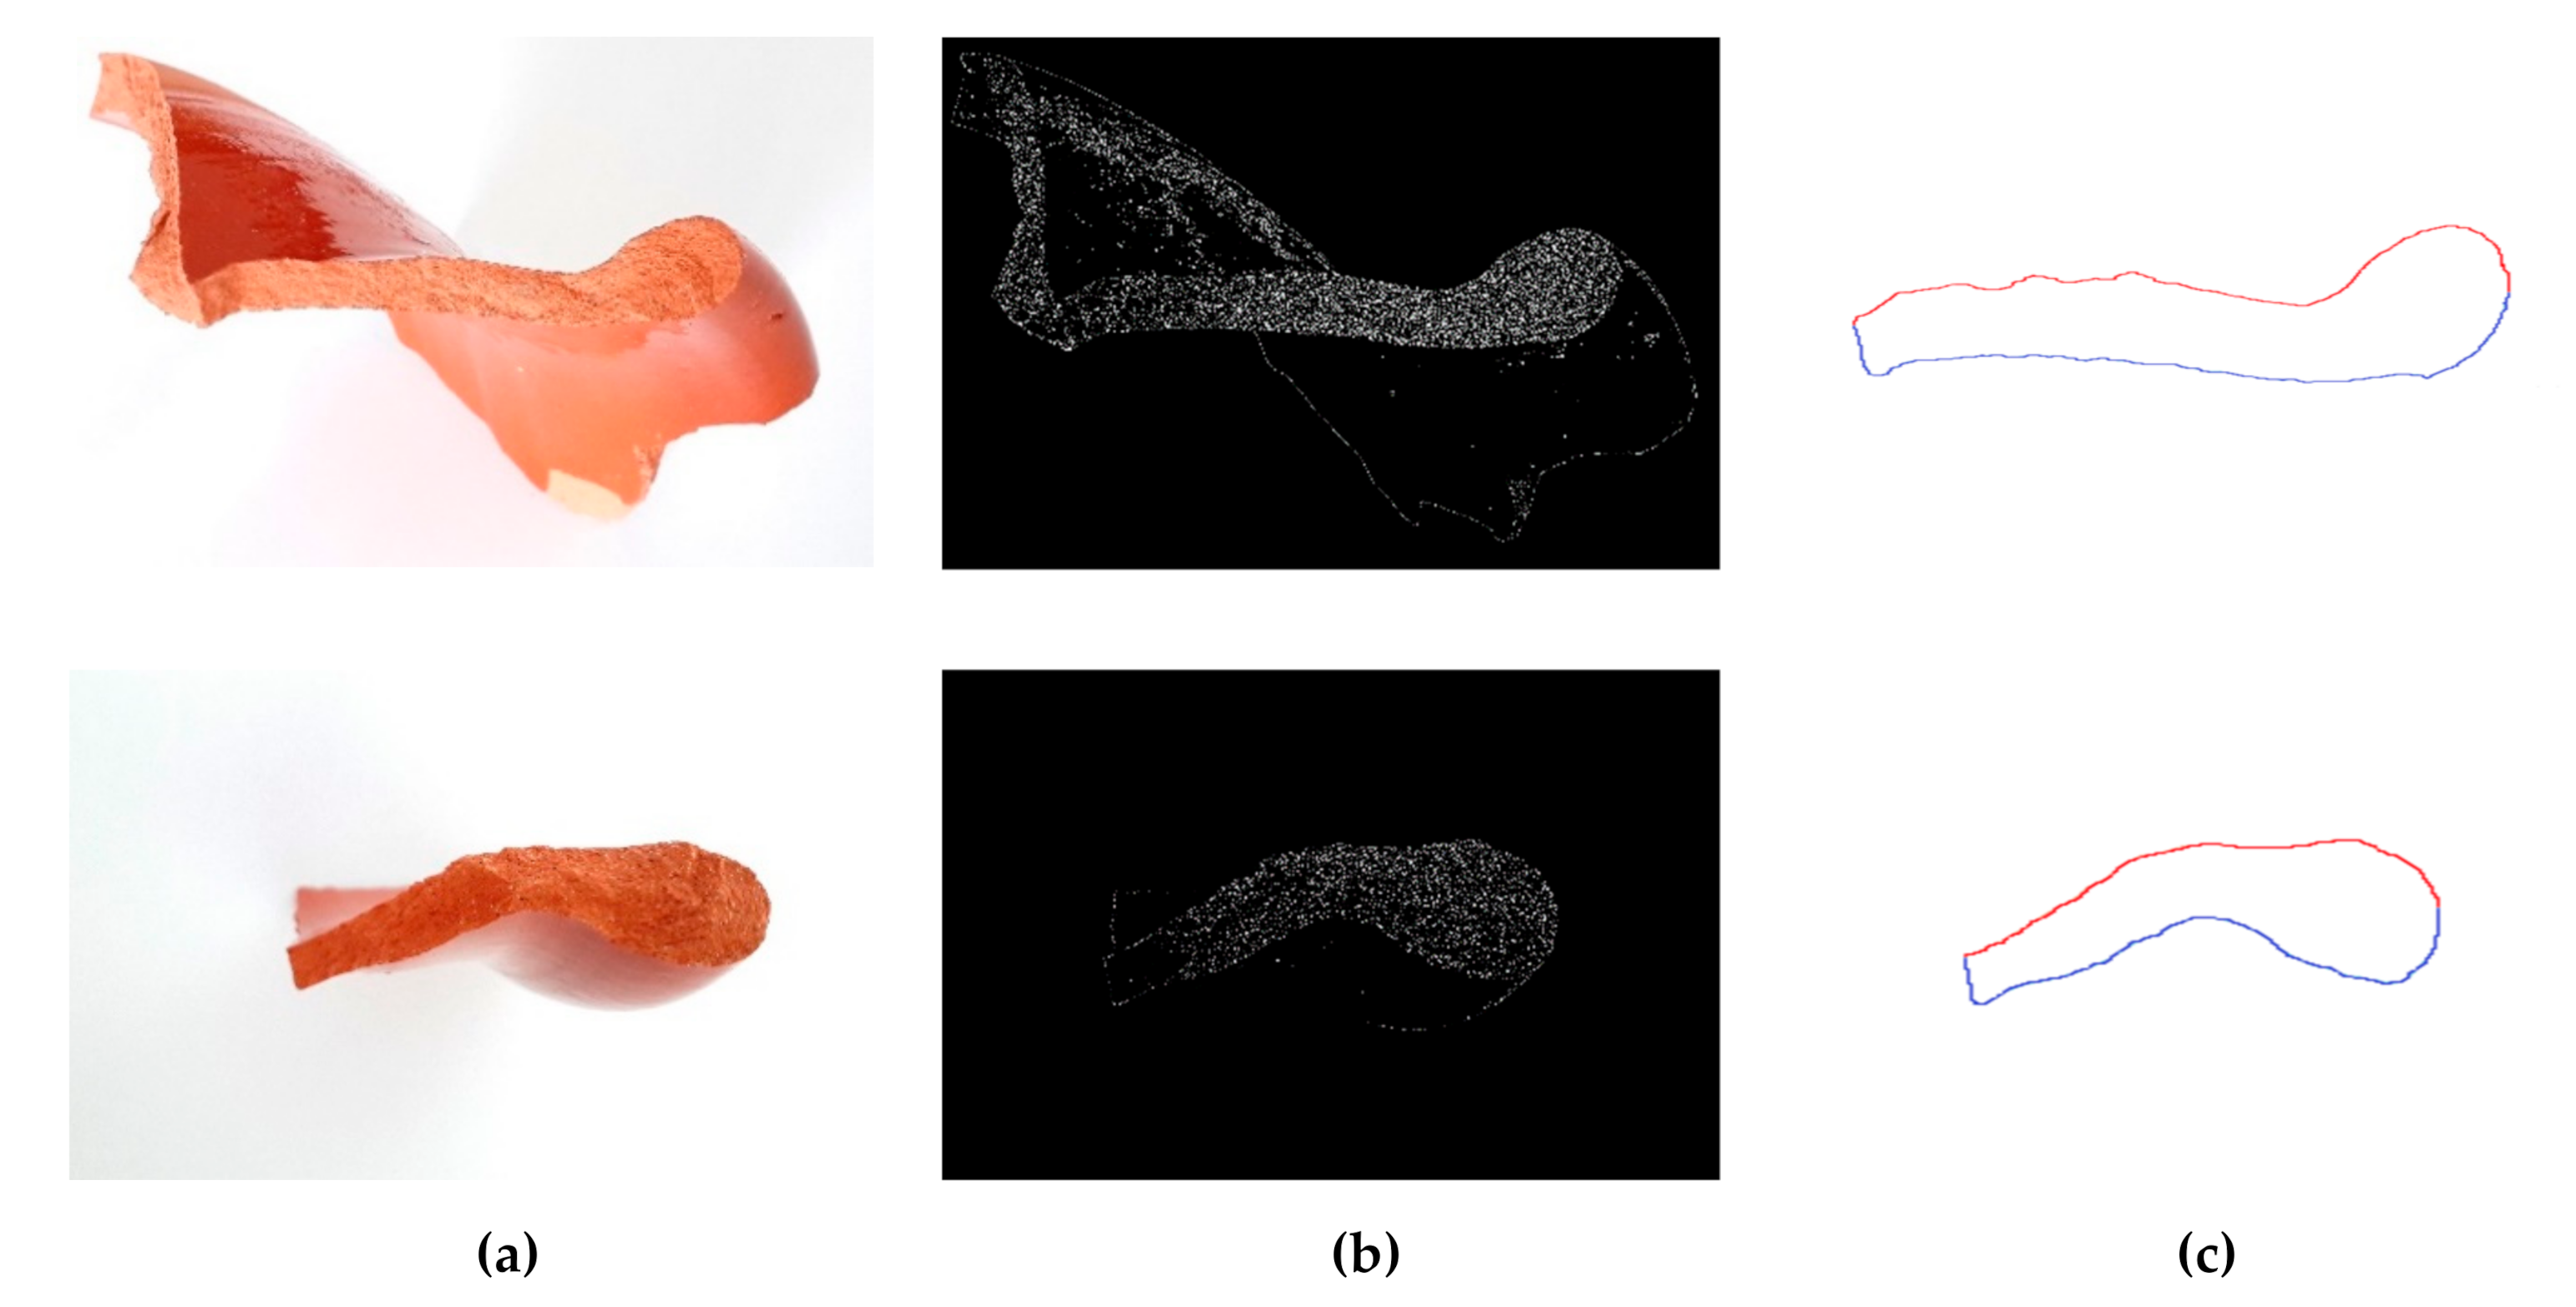
After obtaining images of fragments, feature extraction should be done to achieve the most relevant information from the original data. For this purpose, edge detection methods are applied to extract edge curves as features. Edge detection includes a variety of mathematical methods having the purpose of identifying points in a digital image, in which the image brightness changes sharply or, more formally, has discontinuities. The points in which image brightness changes sharply are typically organized into a set of curved line segments termed edge curves. In this study, the Canny filter algorithm is implemented to accurately obtain the edges of the pottery fragments [
35]. In
Figure 4b, the result of applying the algorithm is presented. In the next step, the operator erases all the points outside the area of interest of the fractured surface; the remaining points, related to the edge curve, are recorded based on their position in the image. Then, these points are drawn in a two-dimensional plane (
Figure 4c).
It should be noted that it is necessary to divide the obtained curve into two parts in the next stage. The reason is the nature of wavelet transform in the approximation of functions in series. Each part is used as an input signal in the following stages. The division scheme is the method used in Reference [
29], in which the outline is converted into parts in a time series. As shown in
Figure 4c, the edge curves are divided into two parts: red (upper edge part) and blue (lower edge part).
3.3. Coefficients Approximation
In this stage, the wavelet transformation method is used as a powerful method for edge curves’ approximation. The aim of this method is to obtain a regression function with the least number of coefficients, and a good fit to the curves.
By applying the wavelet transformation method at a predetermined level of decomposition, the signal is decomposed into a detailed part and an approximated one. Since the resulting detailed parts represent noises, the denoising step is performed by decomposition; so, this part is ignored for the next steps. On the other hand, the approximated part represents a curve that is like the main signal and has a good fit for it. This part is defined as approximation coefficients
, which are obtained by computing the inner product of the main signal,
, and the
father function,
:
where
is the index for decomposition levels and
is the index for coefficients. These obtained coefficients are used to cluster and match fragments in the next stage.
3.4. Clustering and Matching
The aim of this study is to cluster sherds belonging to the same pottery and match fragments based on the 2D edge curves. After computing all approximation coefficients for all fragments, the correlation coefficient is used as a measure of the similarity between the edge curves of fragments.
The correlation coefficient is a statistical measure that calculates the strength of the relationship between the relative movements of two variables. The values range between −1.0 and 1.0. A correlation of −1.0 shows a perfect negative correlation, while a correlation of 1.0 shows a perfect positive correlation. A correlation of 0.0 shows no relationship between the two variables. There are several types of correlation coefficient formulas. One of the most commonly used formulas in statistics is Pearson’s correlation coefficient [
36]:
where
is the correlation between the input coefficients vectors
x and
y, n is the number of coefficients in each signal, and
is:
Positive if xk and yk tend to be simultaneously greater than, or simultaneously less than, their respective means.
Negative if xk and yk tend to lie on opposite sides of their respective means.
The stronger either tendency is, the larger the absolute value of the correlation coefficient. So, in the proposed method, the matching between the two fragments is verified when high correlation values are obtained considering both edge curves.
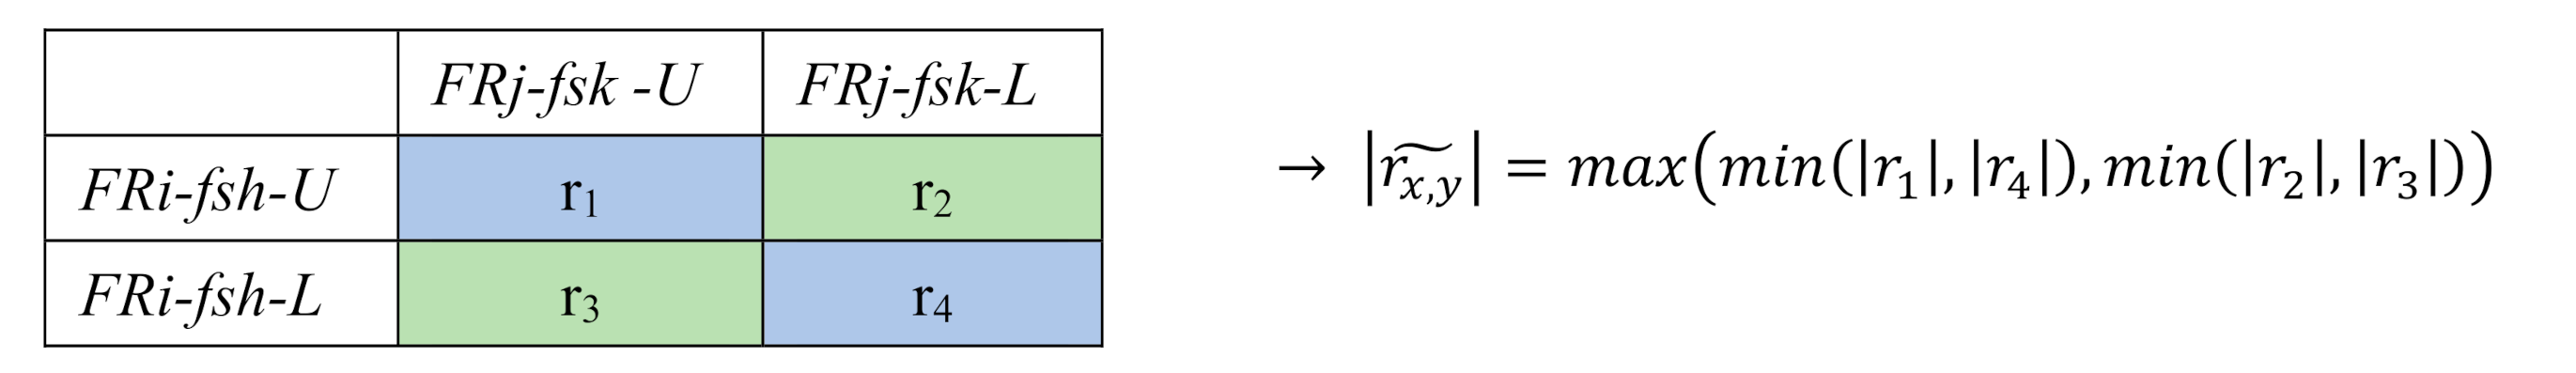
With the aim to set the threshold value of
for identifying the fragments matching, for each fragments couple and for each couple of fractured surfaces, the
value is determined as reported in
Figure 5. In what follows, the labelling of each fragment, each fractured surface, and each approximated curve is carried out by using the following notation: FRi-fsk-U (Fragment #i, fractured surface #k, upper curve), FRi-fsk-L (Fragment #i, fractured surface #k, lower curve).
4. Experiments and Results
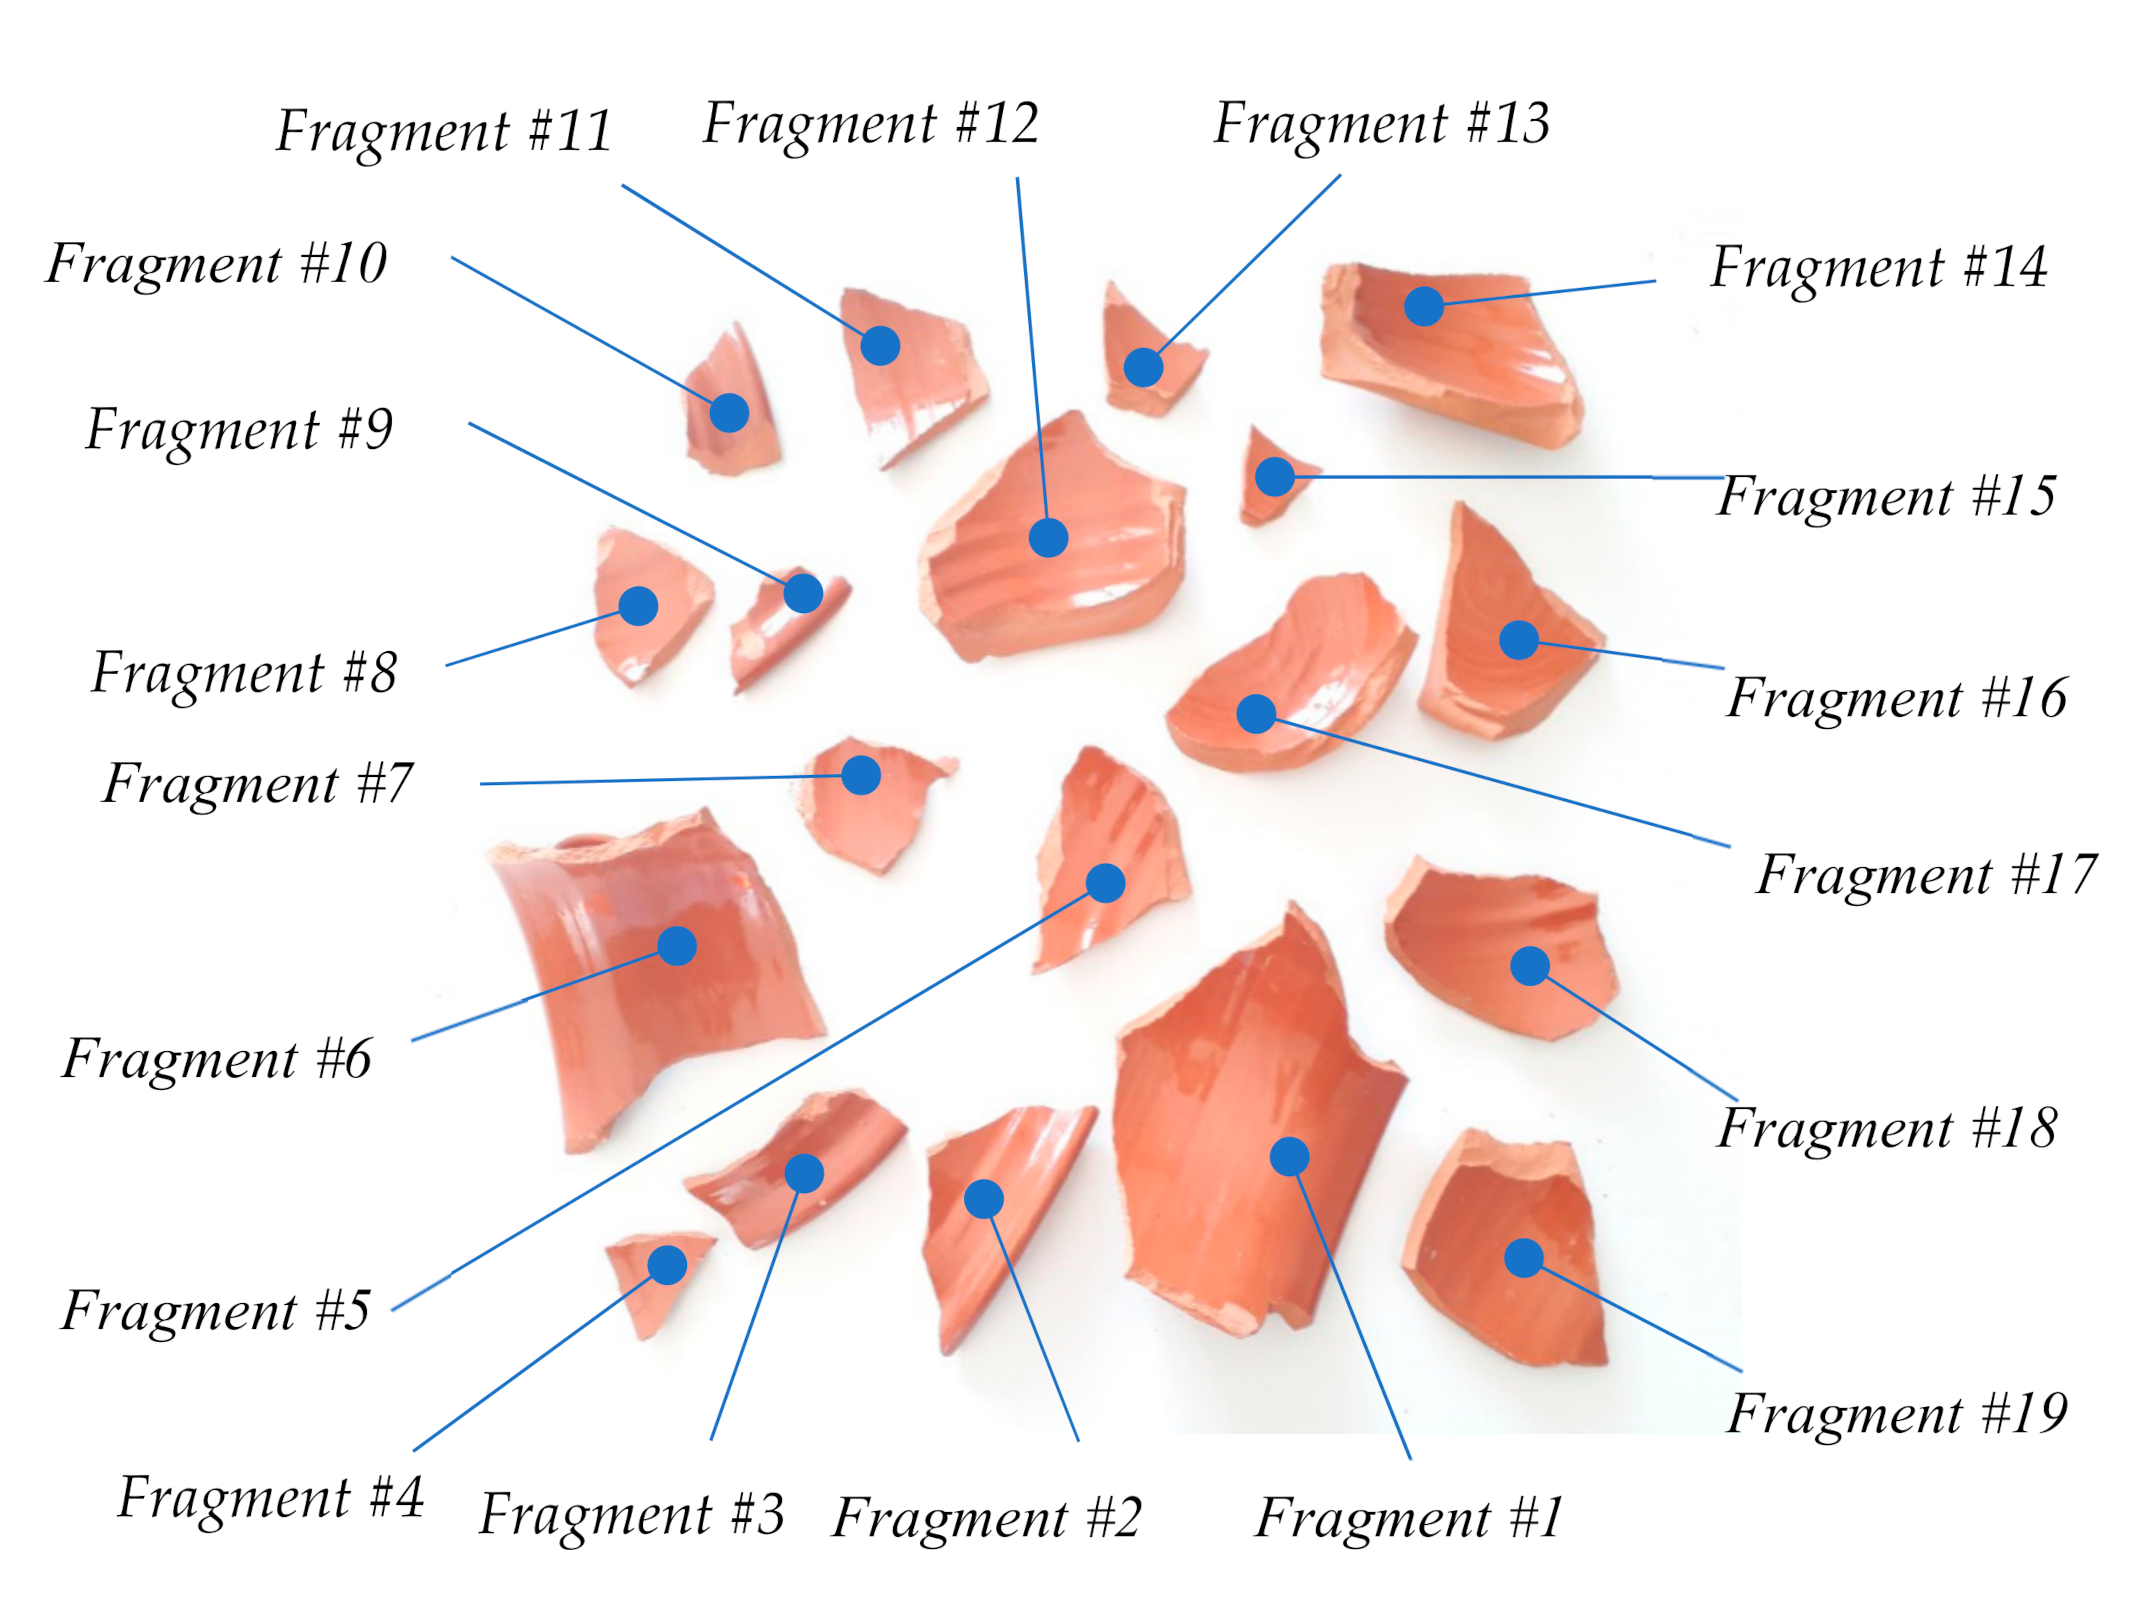
In order to quantify the performances of the proposed matching algorithm, its implementation in an original software package coded in MATLAB has been applied to match 19 fragments of modern broken pottery (
Figure 6). The choice of this type of test case, where the matching between the fragments is known, allows for analyzing the performance of the method, highlighting its limitations.
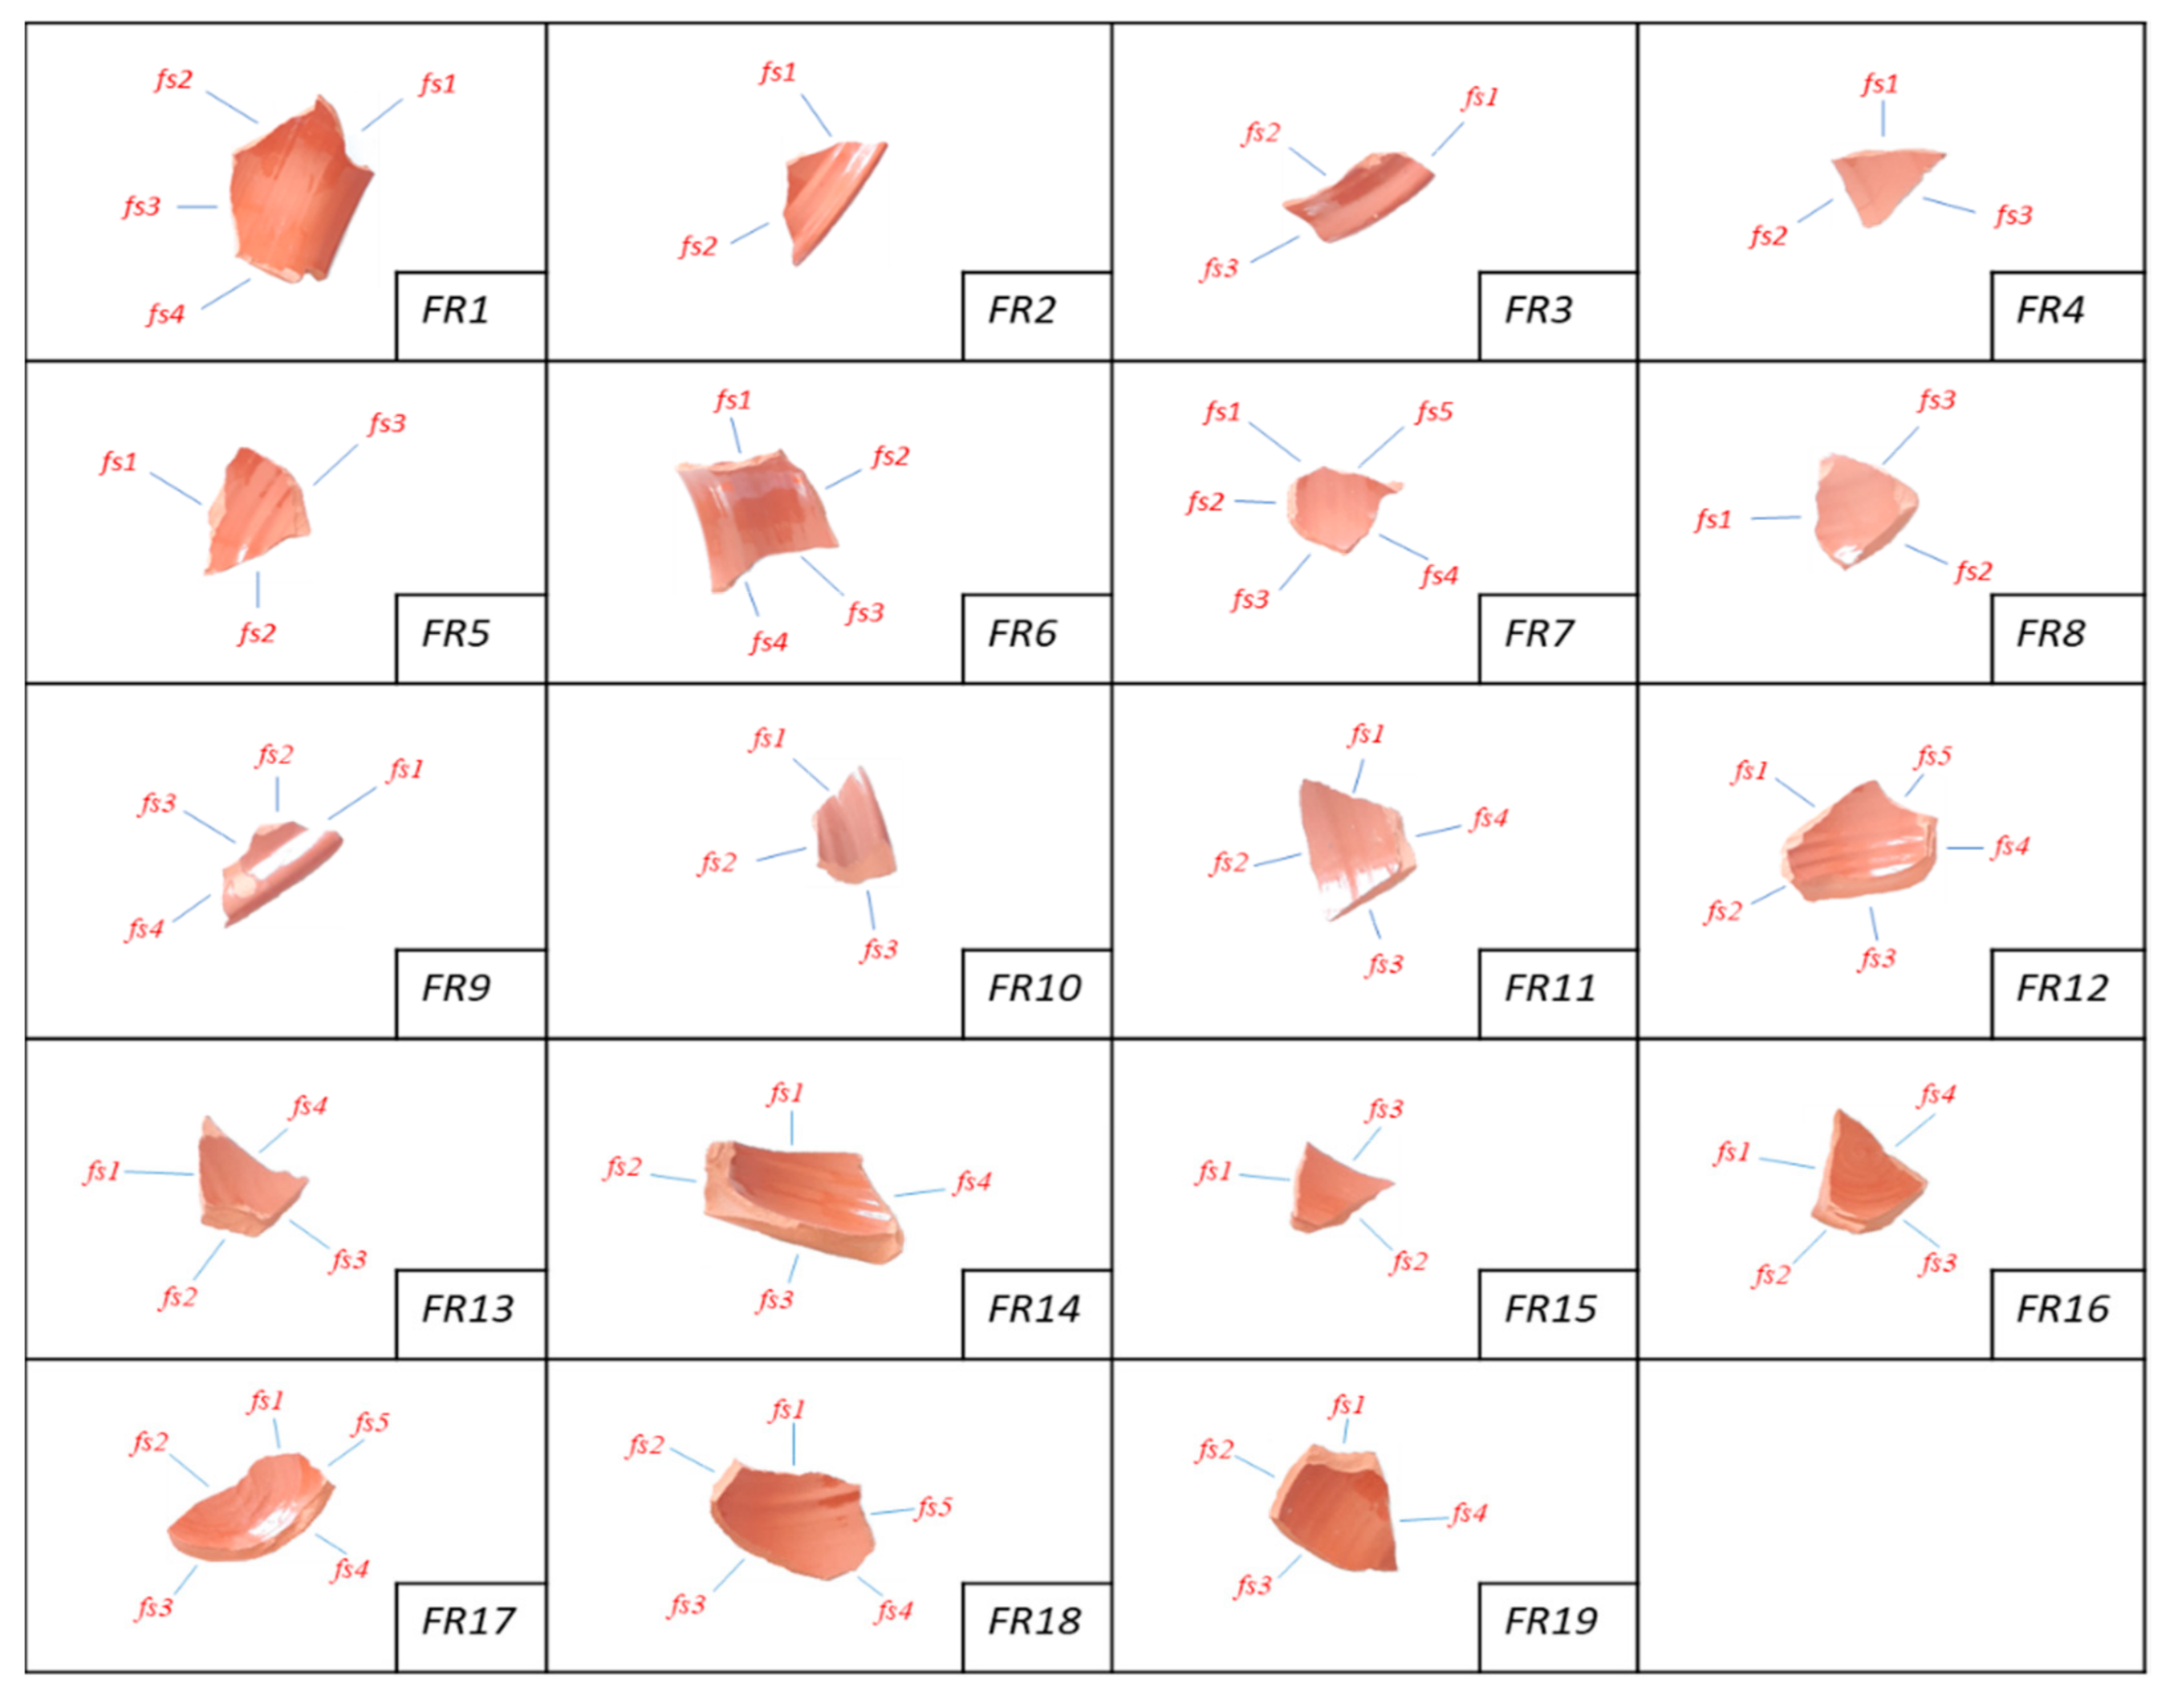
The fragments have different sizes ranging between 3 and 24 cm in width and 2–17 cm in length. In the proposed experimentation, a camera Canon EOS 1300D with a resolution of 13 MP is used to capture images of the fractured surface of fragments. Thereby, each image of the fragments has a resolution of 4128 × 3096 pixels. In
Figure 7, the labelling and location of fracture surfaces related to each fragment is shown.
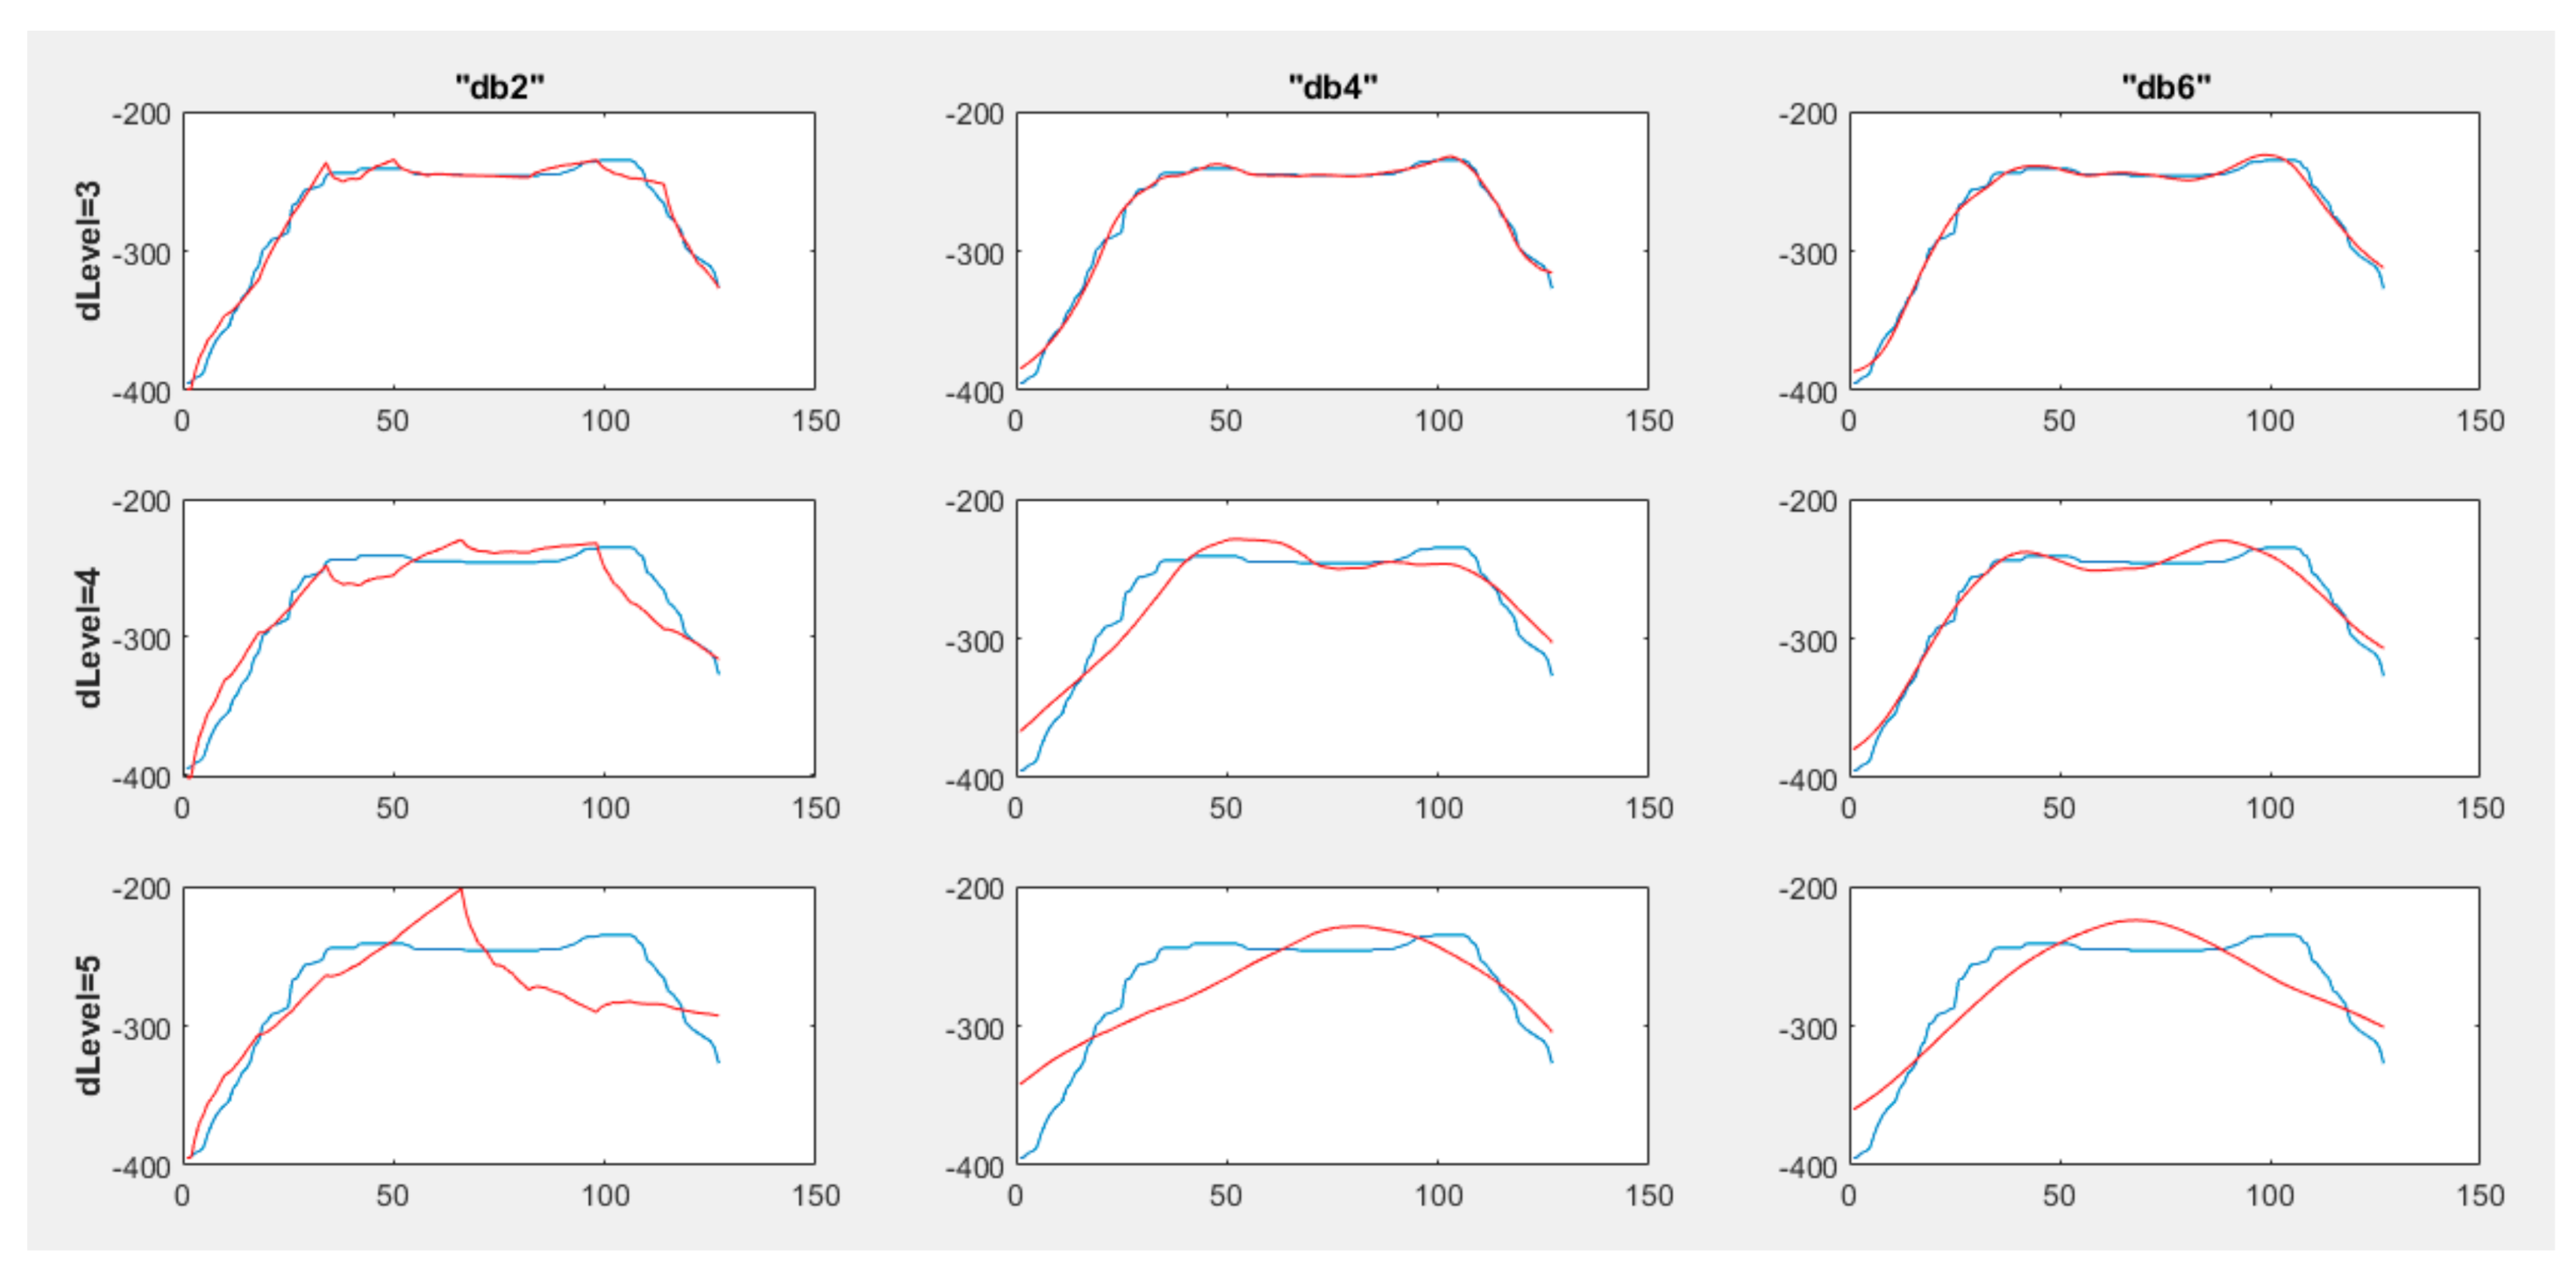
The wavelet transformation method proposed in this paper needs two input parameters: the type of basis function and the decomposition level. With the aim to find the right compromise between approximation quality and calculation time and resources, preliminary experimentation has been carried out on all fragments. For example, the results obtained for the upper part of the edge curve for fragment #2 (FR2-fs1-Up) are presented for different basis functions and decomposition levels (see
Figure 8). The error term is calculated based on the average absolute value of the distance between the profile (blue) and the approximating curve (red). As shown in
Table 1, the least value results with the basis function, “db4” (“db4” = Daubechies w/4 vanishing moments), and the decomposition level, “3”. Since this combination also gave rise to the best performance for the other fragments’ edge curves, it has been used in the following experimentation.
After tuning the parameters, the wavelet transformation method is applied to each obtained signal to calculate the coefficients of the corresponding approximating curve. Since 71 fractured surfaces were segmented from the 19 fragments, the analysis has been carried out on 142 signals. Once the coefficients of the approximating curves are known, the next step is to calculate, in a factorial way, the Pearson’s correlation coefficient (3) among fractured surfaces of each couple of fragments. For example, let us consider fragments #1 and #2:
Table 2 reports the computed correlation coefficients between the segmented fractured surfaces.
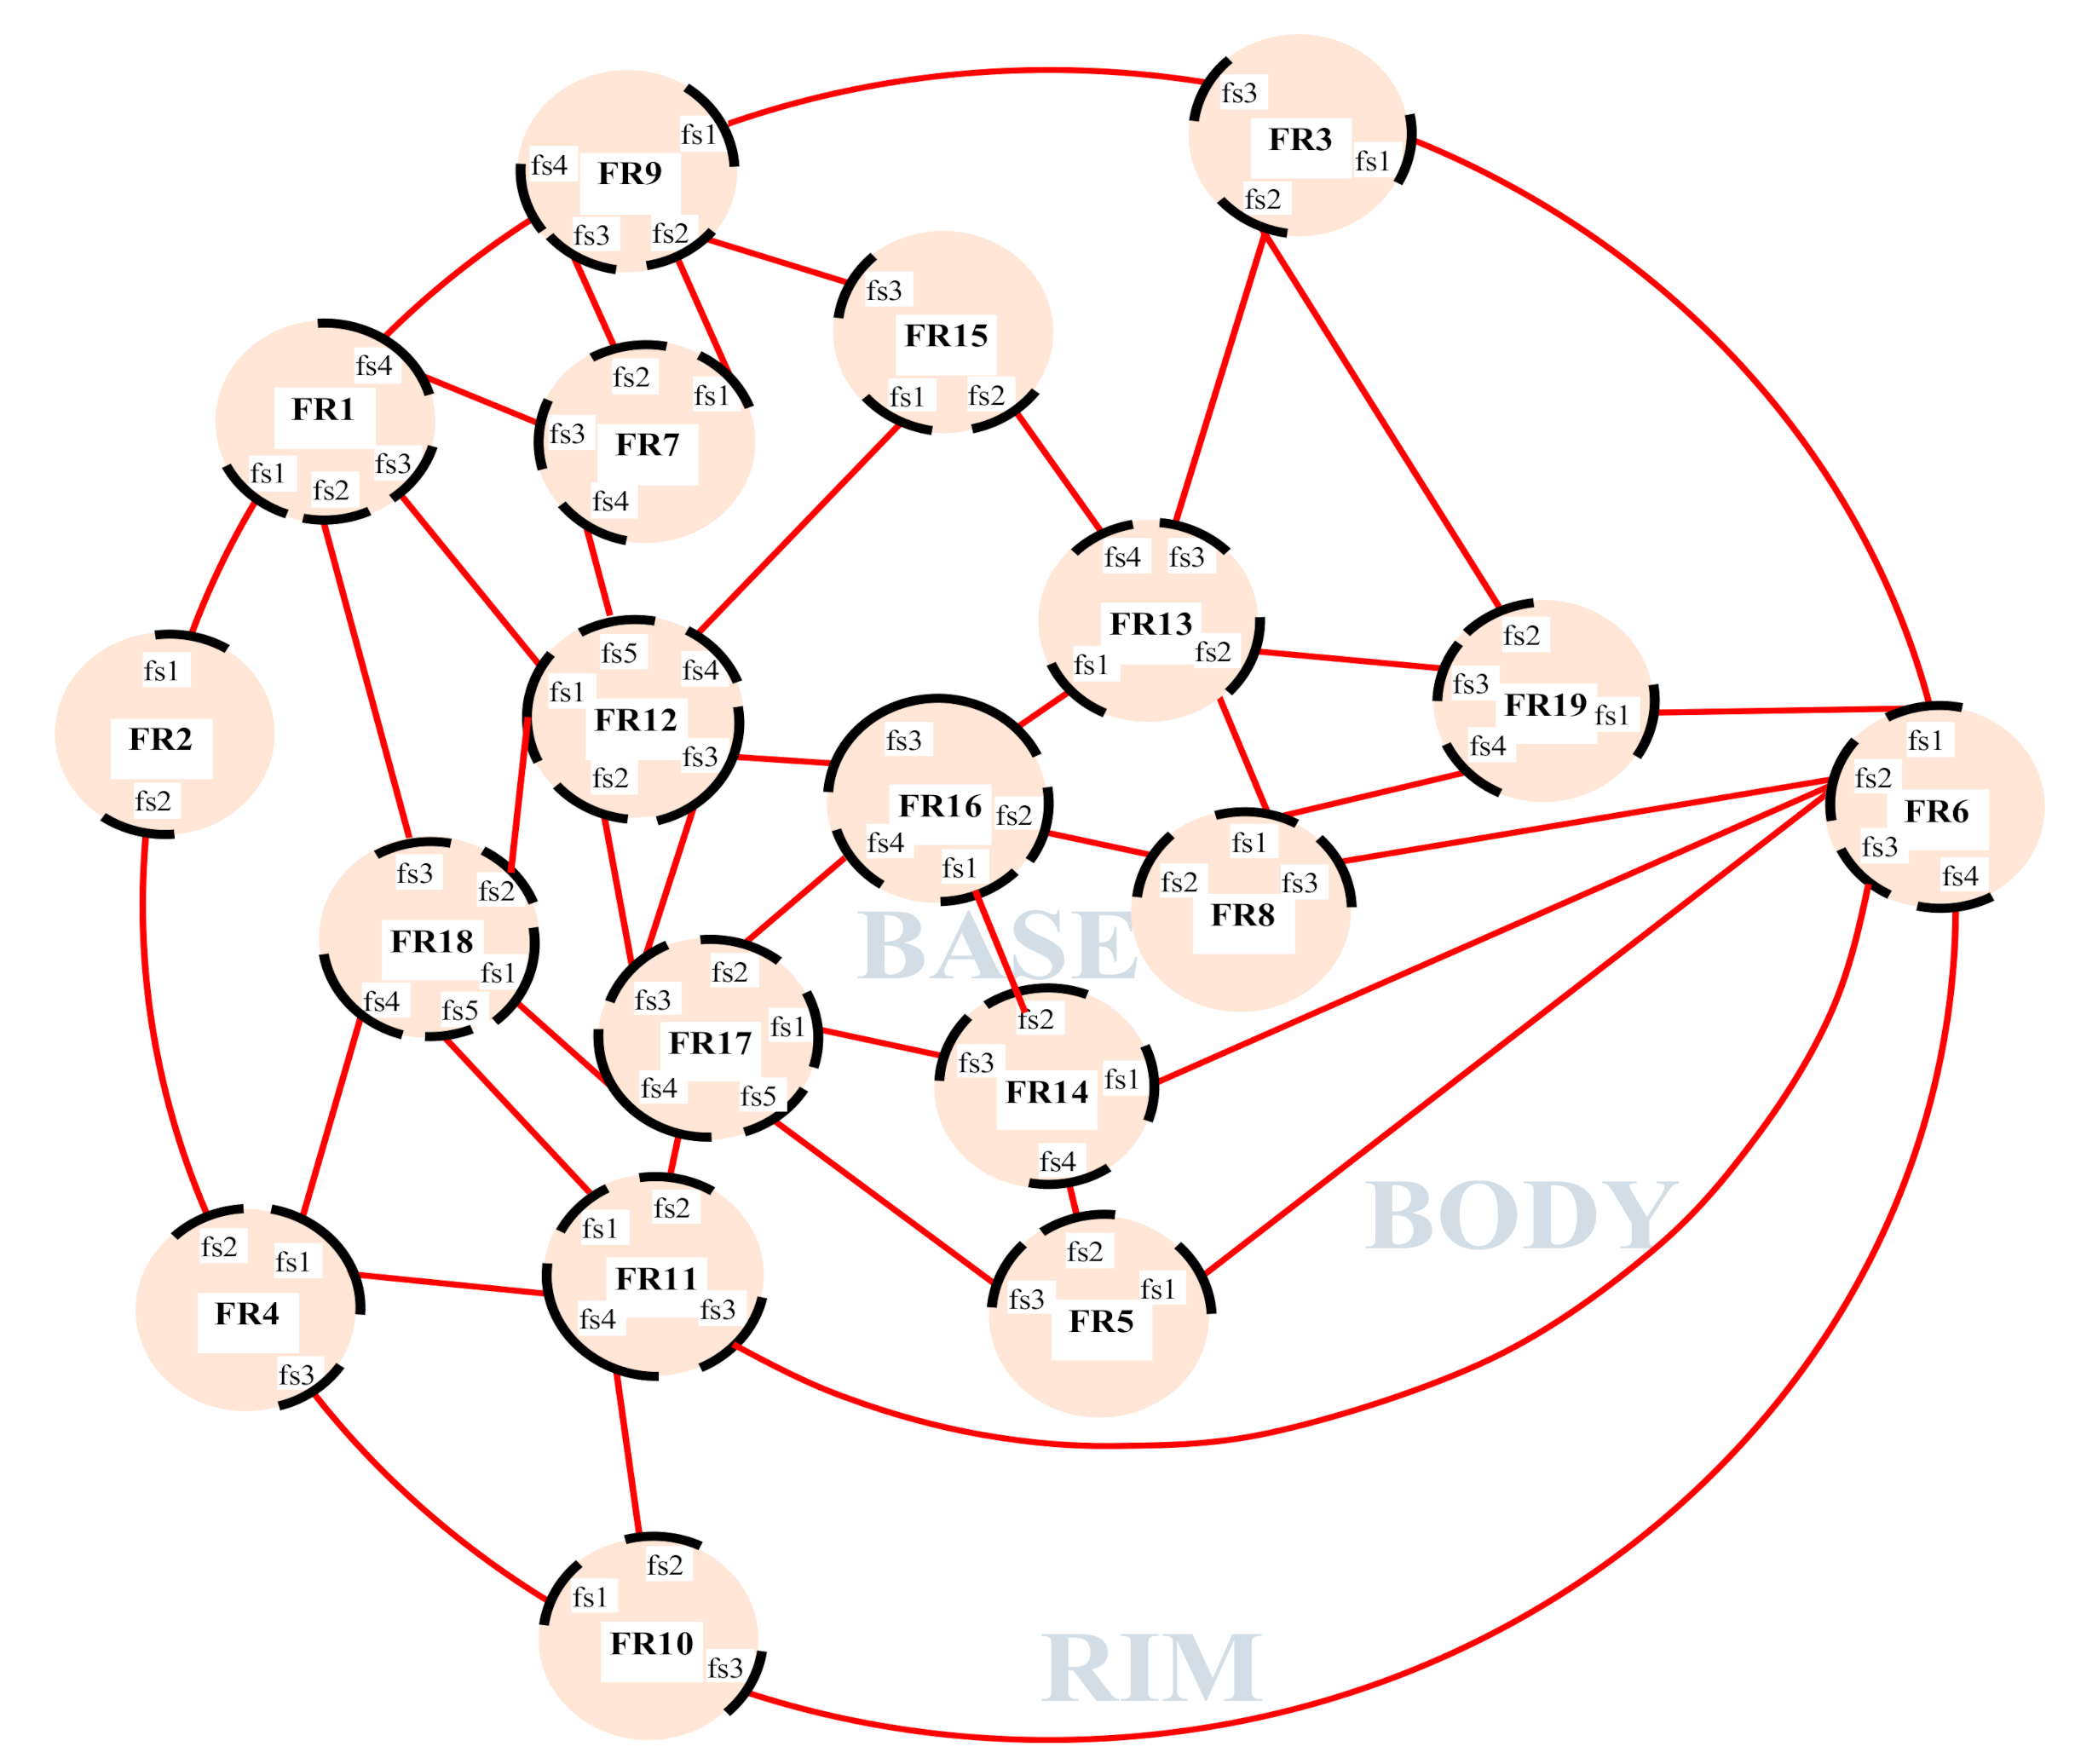
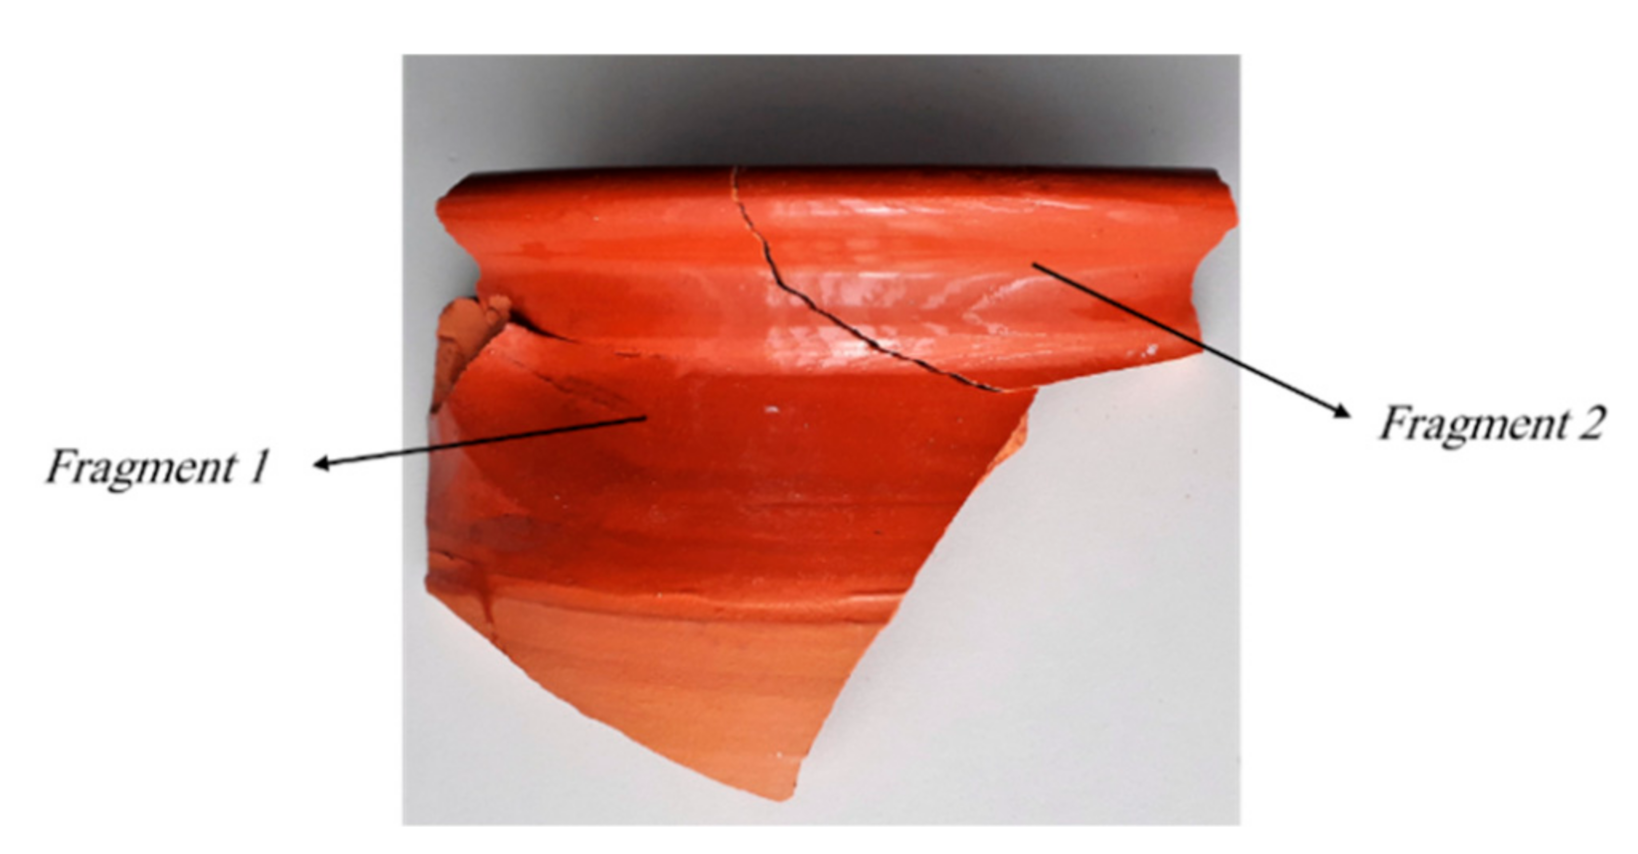
Between the lower and upper curves of FR1’s fs1 and FR2’s fs2, correlation coefficients of −0.803 and −0.765 have been calculated, and these high values are related to the matching between the two fracture surfaces, as shown in
Figure 9. In
Figure 9, the red line addresses matching sides between two fragments. In the background of the same figure, the position of the sherd inside the pottery is distinguished among rim, wall, and base. The rim is the top of the ceramic, near the orifice, whereas the base is the lower part of the surface of the ceramic artifact, which extends from the extreme bottom to the axis [
22].
The picture in
Figure 10 highlights how the recognition of this matching has been correctly performed for noisy, irregular, and curved fracture lines (FR1-fs1 and FR2-fs1).
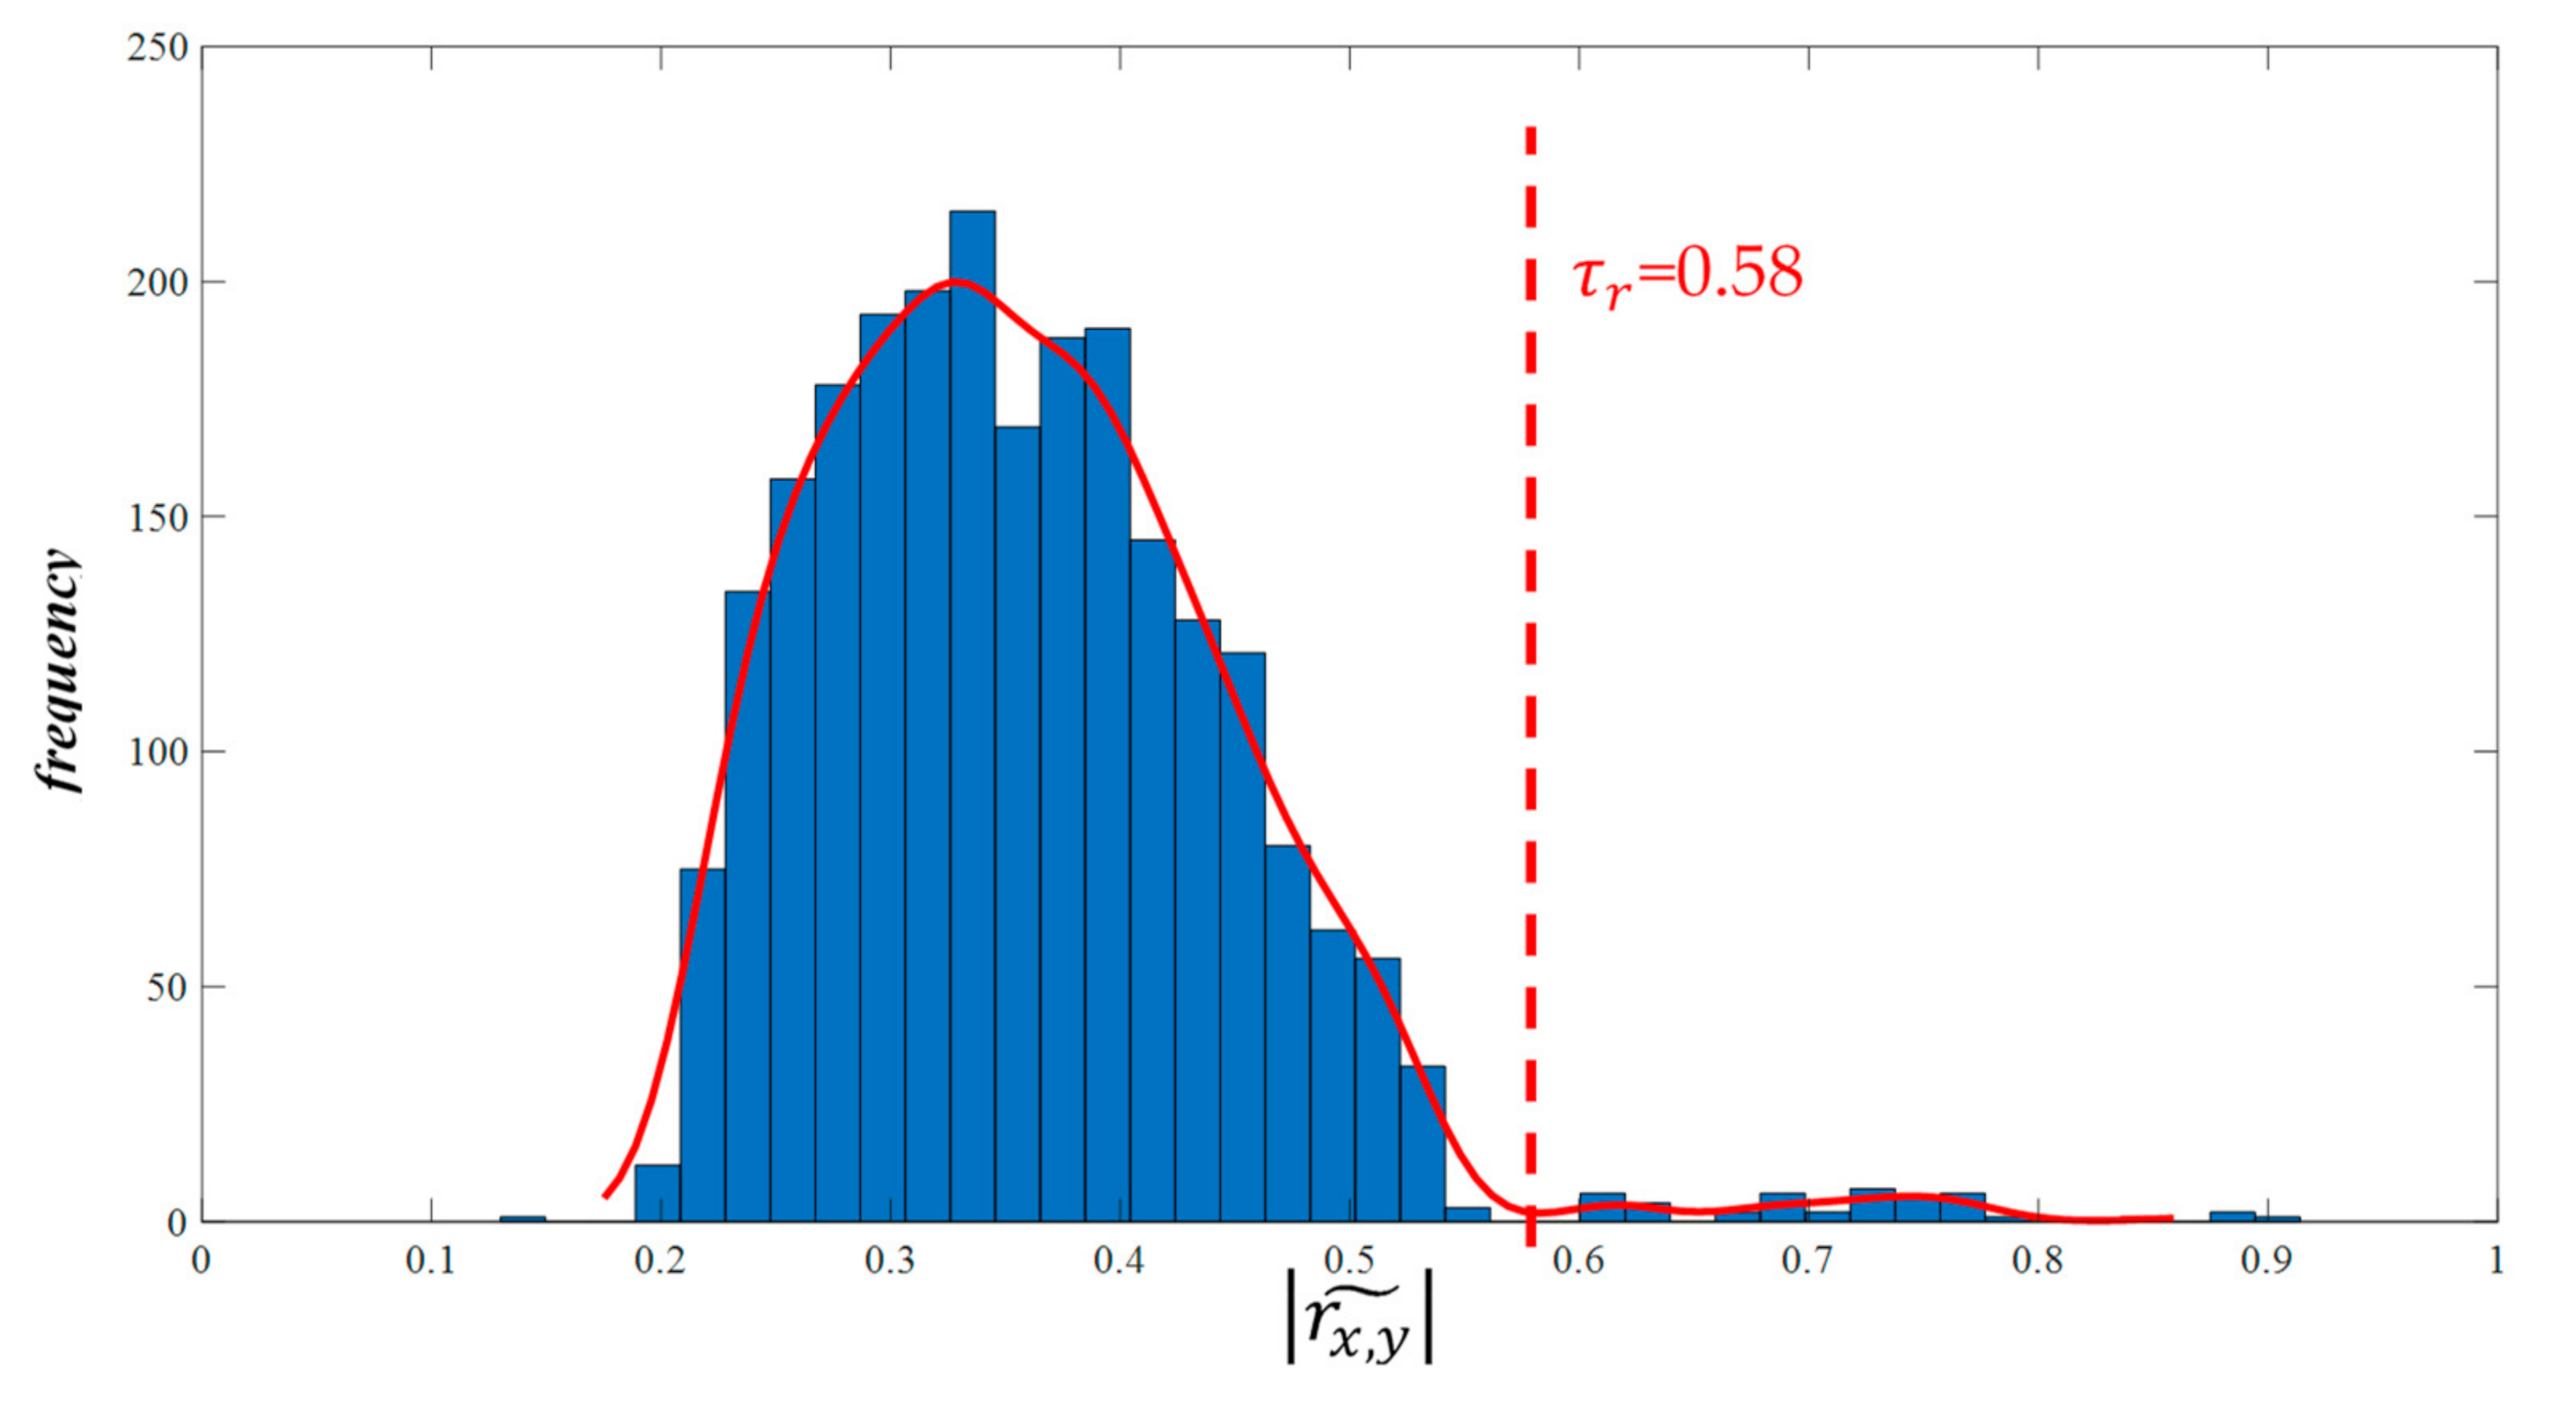
One of the major problems in all the methods proposed in the literature to recognize edges matching concerns the identification of threshold values. They are largely affected by the sherd curvatures and the state of preservation of the fractured surface. Consequently, there is not a single value for the threshold index which may yield good results in every case. In the proposed method, the threshold value is chosen by analyzing the distribution of values of
. Since the histogram of
values should represent a bi-modal distribution (one mode for fractured surfaces to be joined and a mode for other ones) (
Figure 11), the threshold value,
, is set in correspondence of the first minimum of the approximating curve; in this case, 0.58. By using this threshold value:
42 of 43 matches are correctly recognized,
1 false negative is obtained for FR13-fs2/FR19 fs2,
1 false positive is obtained for FR1-fs3/FR2-fs2.
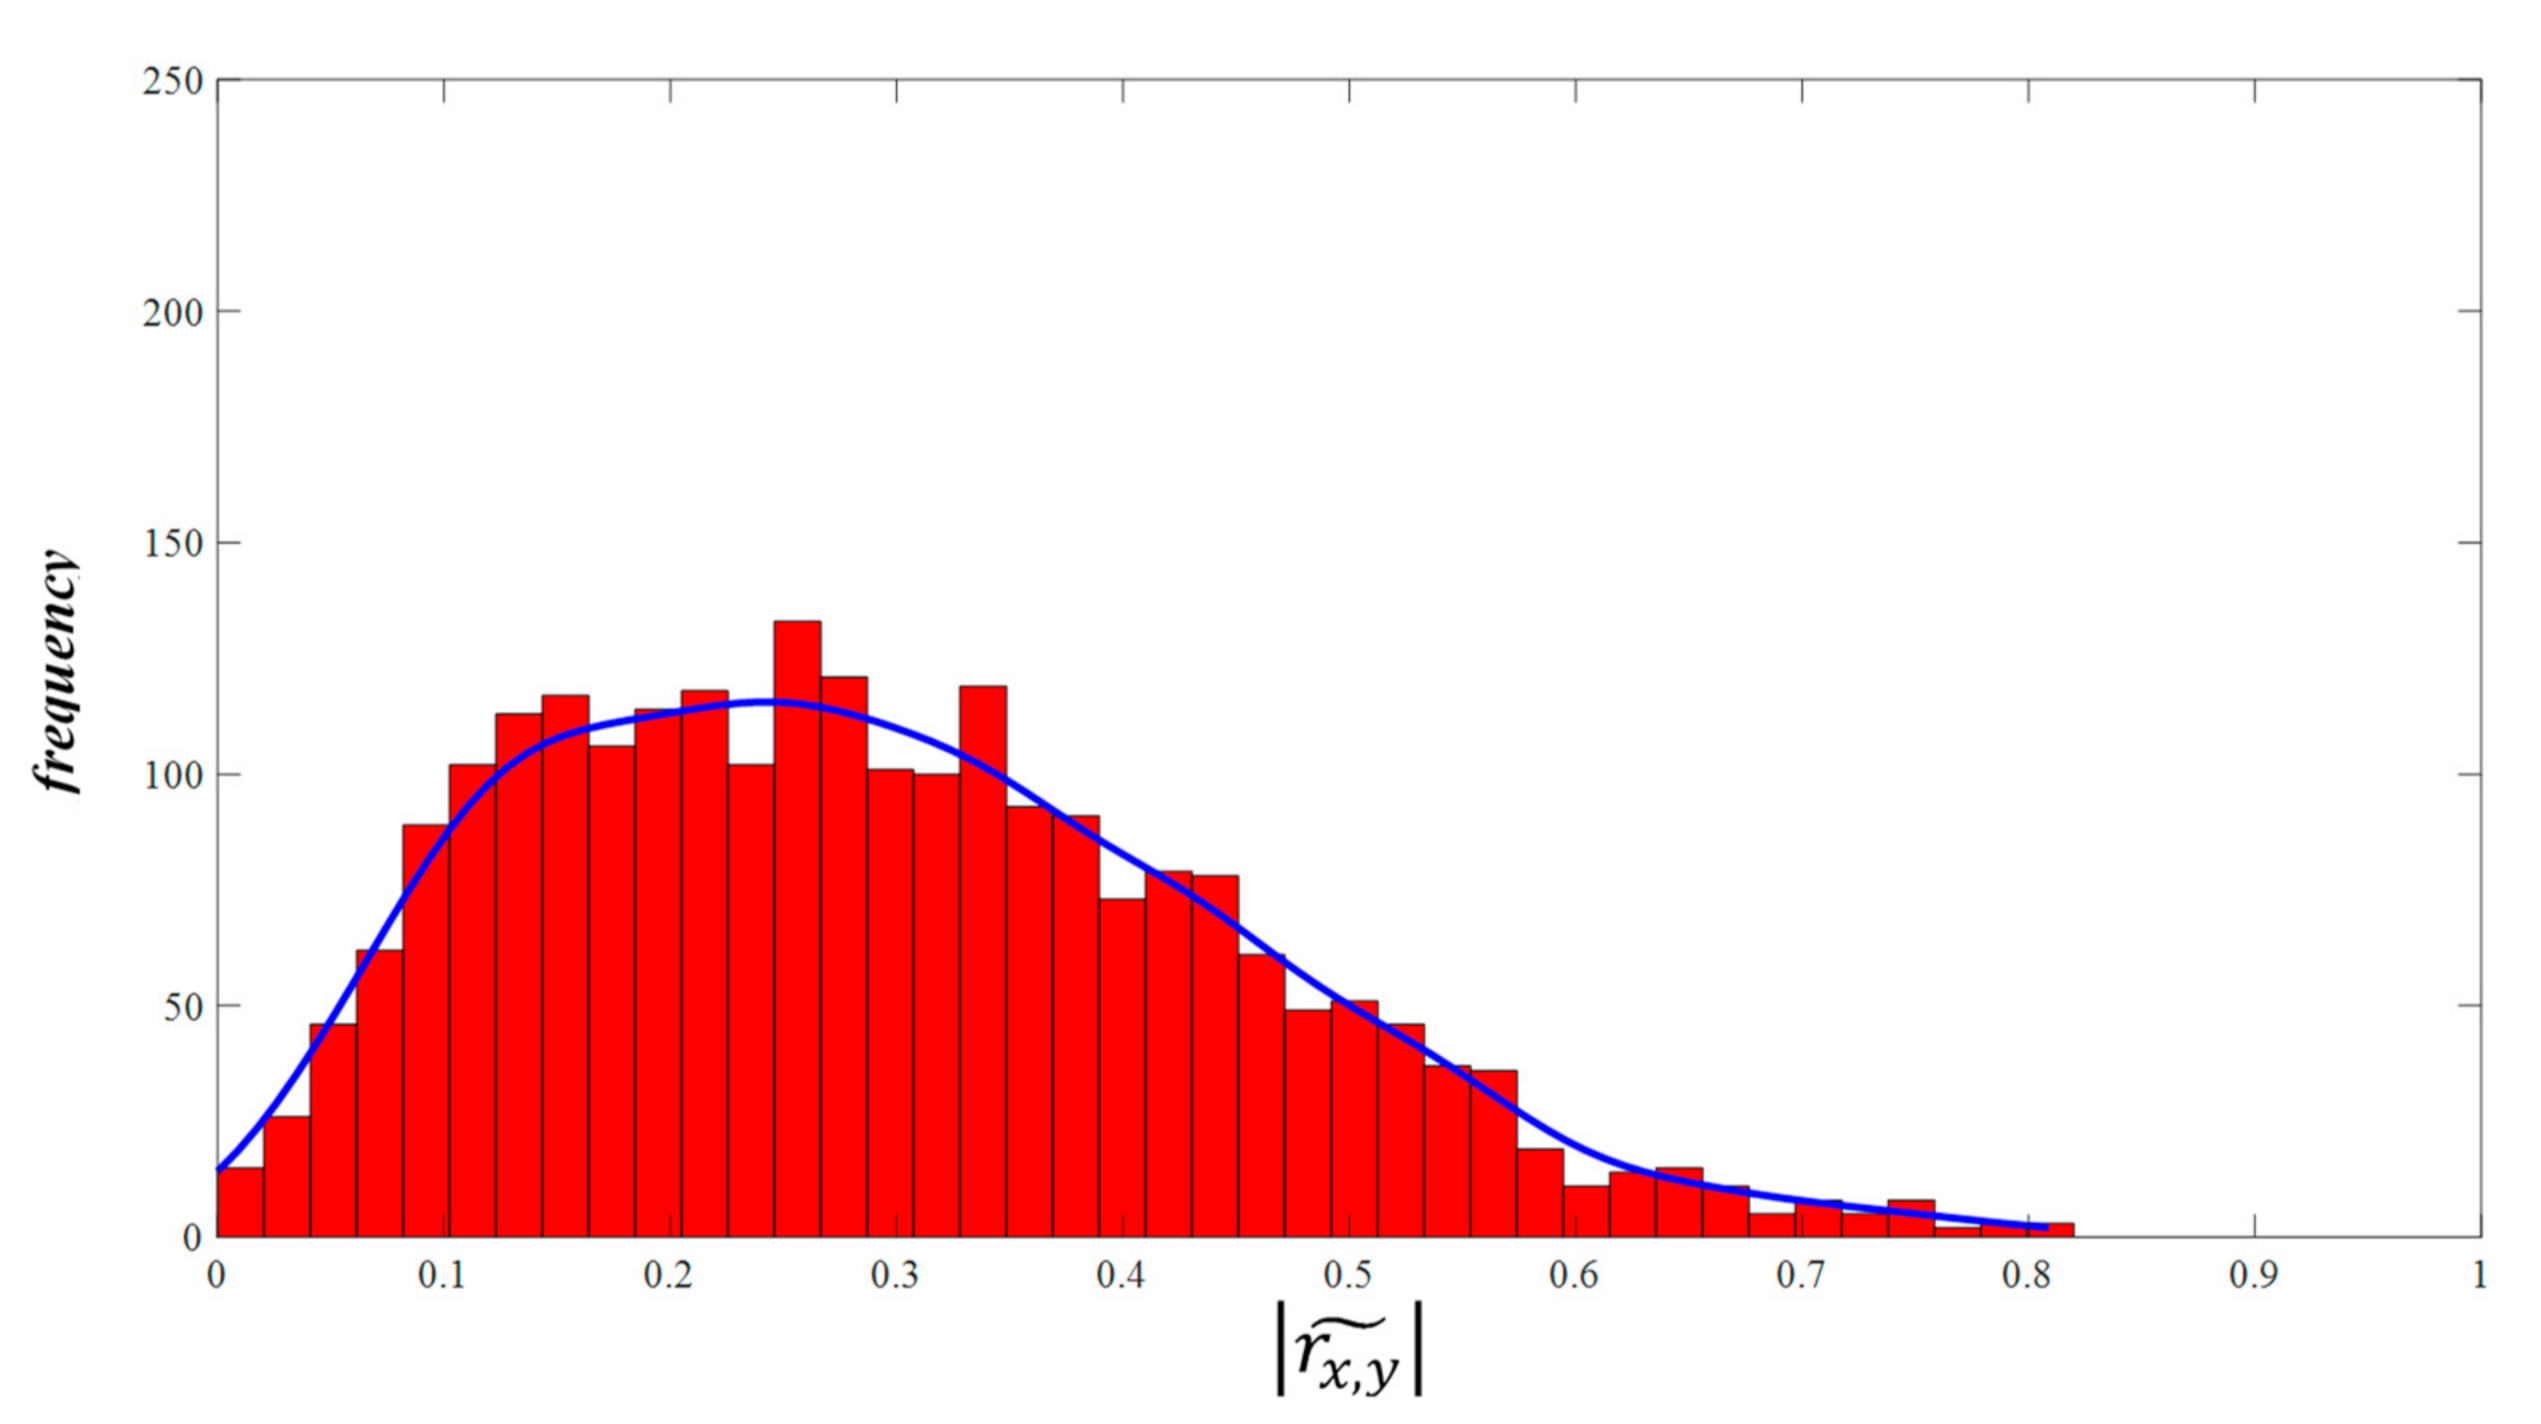
The performances of the proposed method are compared with those of the method presented by Rasheed and Nordin in Reference [
29].
Figure 12 shows the obtained histogram of
for the analysis of 142 signals considered here by using our implementation of Reference [
29]. Since this histogram does not show a bi-modal trend, the results obtained from the method as the threshold value varied were analyzed.
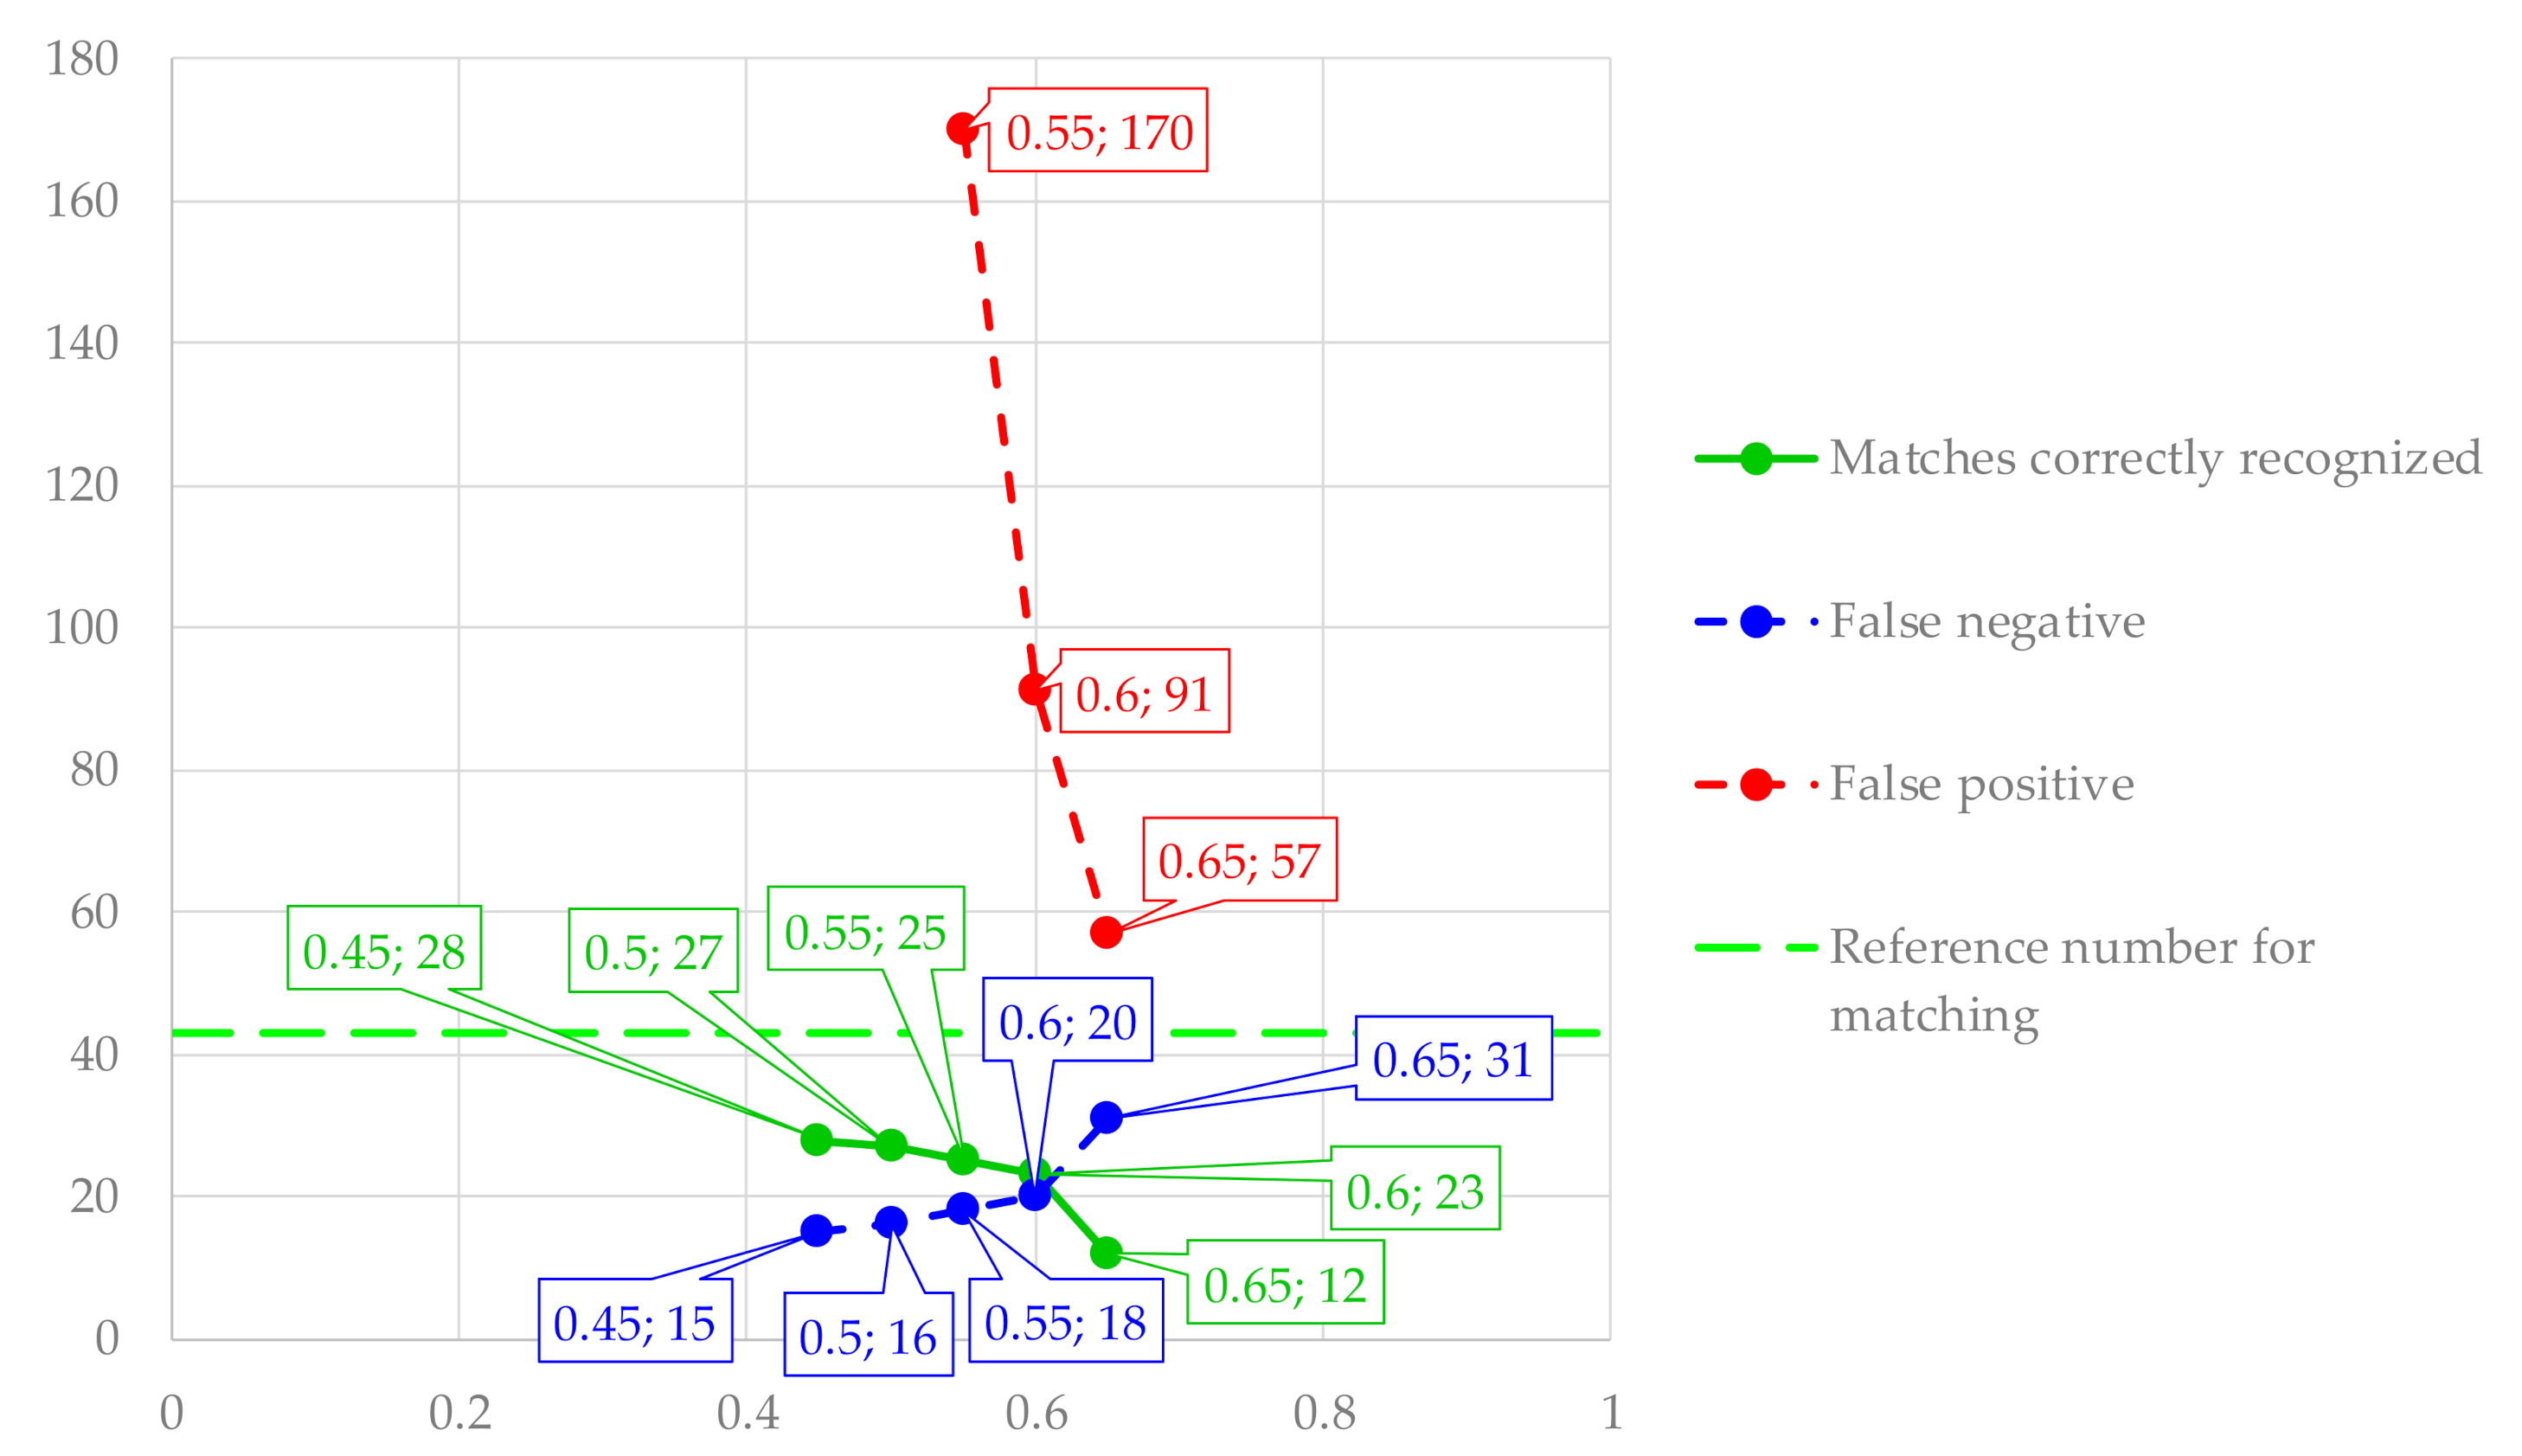
Figure 13 shows the trend of matches correctly recognized, false negatives, and false positives regarding the threshold value. The proposed method seems to be more robust in the fragments matching detection when compared with the state-of-the-art.
5. Conclusions
Reconstructions of ancient finds can help archaeologists to analyze data and understand past life. Advancements in low-cost, high-volume acquisition devices and computer systems have provided new tools (such as 3D laser scanners, machine vision systems, machine learning, and artificial neural networks) for archaeologists to face the problem of reconstruction and improve the efficiency of their work.
The most recent methods for pottery reassembling from its fragments are based on the processing of manifold 3D models. To date, the 3D fragments’ scanning represents the bottleneck in the automatic analysis of large quantities of fragments, requiring, for each sherd, a mean time of about 30 min. In this paper, a semi-automatic approach was proposed for the reconstruction of archaeological pottery fragments based on 2D edge curves. For this purpose, the edge curves were extracted from the fragments’ image, considering the curves as features. Next, the wavelet transformation method was applied to the edge curves, in order to obtain the approximation coefficients. Then, the correlation coefficients between fragments were computed and the matching of fragments was done by comparing the values of correlation coefficients.
To quantify the performance of the proposed approach, 19 fragments of modern broken pottery, with known matching, have been analyzed. This experimentation also resulted in the correct recognition for curved noisy fractured surfaces with a success rate of 95.3%. The comparison with the state-of-the-art [
29] showed that the proposed method achieved much better results.
As with all methods based on 2D images, the verified failures of the method are to be searched in the two manual steps:
This results in false negatives or positives if the 3D lines to be analysed coming from two different fragments are acquired with inclinations too different regarding their normal.
Once the potentialities of the method and its robustness regarding the state-of-the-art are verified, future efforts will be addressed to:
Implement the proposed method in user-friendly software to start massive field experimentation with real sherds.
Consider other denoising methods to take into account all the items affecting the result of the image processing.
Extend the method in the analysis of 3D edges extracted from 3D models of the fragments.
The concrete benefits that can be obtained with the application of this method in the field concern the speed-up of the assembly process of ceramics from fragments, which would avoid the archaeologist having to try all the combinations in a factorial way.


