
Different Models, Different Outcomes? A Comparison of Approaches to Land Use Modeling in the Dutch Limes


1
Faculty of Humanities, Vrije Universiteit Amsterdam, 1081 HV Amsterdam, The Netherlands
2
SPINLab/School of Business and Economics, Spatial Economics, Vrije Universiteit Amsterdam, 1081 HV Amsterdam, The Netherlands
*
Author to whom correspondence should be addressed.
†
These authors contributed equally to this work.
Heritage 2021, 4(3), 2081-2104; https://0-doi-org.brum.beds.ac.uk/10.3390/heritage4030118
Submission received: 30 July 2021
/
Revised: 26 August 2021
/
Accepted: 30 August 2021
/
Published: 1 September 2021
(This article belongs to the Special Issue Geocomputation and Remote Sensing for Modelling in Landscape Archaeology)
Abstract
:Current advances in spatial simulation bring unprecedented possibilities for spatio-temporal modeling. In this paper, we focus on modeling the impact of settlement on land use in the Roman period in the Dutch river area, on the northern frontier of the Roman Empire. During this period, the area witnessed a strong population increase that put more demands on the available land to produce food, not only for the local population, but also for the soldiers stationed on the frontier and the citizens of the newly founded towns. We compare an agent-based model (ABM) of agricultural production in the region (ROMFARMS), and a model using the Past Land Use Scanner (PLUS. Both were used to estimate the effects of increased agricultural demand through simulations of food production, taking into account the available workforce and the productivity and availability of suitable land. However, how should we evaluate the model outcomes? What are the advantages and limitations of each? We discuss issues of scale, temporal resolution and model inputs, together with questions of technical implementation and validation. In this way, we aim to point the way to future researchers to implement these approaches effectively in other contexts.
1. Introduction
Current advances in spatial simulation now bring unprecedented possibilities for spatio-temporal modeling. In this paper, we compare two approaches to model the impact of settlement on land use in the Roman period in the Dutch river area, on the northern frontier (limes) of the Empire. After the arrival of the Romans around 15 BCE, the area witnessed a strong increase in population, putting more demands on the available land to produce food and wood, not only for the local population, but also for the soldiers stationed on the frontier and the citizens of the newly founded towns.
Estimating the spatial effects of this increased agricultural demand through time can be approached through simulations of food production, taking into account the available workforce and the productivity and availability of suitable land. This paper will provide a comparison of an agent-based model (ABM) of agricultural production in the region by Joyce (ROMFARMS; [1,2]), and a model using the Past Land Use Scanner (PLUS) by De Kleijn and colleagues [3]. The ABM is fine-grained, simulating agricultural production at the household level; the PLUS model provides a spatial simulation framework that integrates economic and demographic factors with physical environmental factors and simulates land use on a regional level by applying a logit-type approach that simulates competition for land.
Both approaches provide solutions to similar questions, but how should we evaluate these outcomes within the general context of the debate on land use and agricultural production in the region? What are the advantages and limitations of each? We will discuss issues of scale, temporal resolution and model inputs, together with questions of technical implementation and validation of the model outcomes. In this way, we hope to point the way to future researchers to implement these approaches effectively in other contexts.
1.1. Background: Archaeology, Landscape and Agricultural Production
The Dutch limes zone roughly comprises a 50 km wide strip in the middle of the Netherlands, stretching from the North Sea until Germany over a distance of approximately 150 km from west to east. To the north, the zone is bordered by the course of the Rhine, which was established as the northern frontier of the Roman Empire around the middle of the first century CE (Figure 1).
This region has undergone considerable environmental and anthropogenic change over the past 2000 years, leading to substantial changes in river courses, coastline, vegetation and land use. This means that no meaningful historical and archaeological analysis of the Dutch limes zone can be undertaken without a reconstruction of its paleogeography. Fortunately, a paleogeographical map of the north-western part of the limes zone is already assembled on the basis of an extensive database of geological bore holes combined with detailed LiDAR-based elevation data [4,5].
On the basis of this reconstruction, we can broadly distinguish three major landscape zones in the Roman period from east to west. To the east of the current city of Utrecht, the landscape was dominated by fluvial landforms: river beds, levees and flood basins. These areas were mostly suitable for all kind of agricultural activities and posed no serious challenges for settlement and transport apart from the major river crossings. To the west of Utrecht, up to the coastal dune area, the landscape was much wetter. Here, the levees only occupied narrow strips of land surrounded by vast areas of marshland and peat. Opportunities for settlement and agriculture were much more limited here. Finally, the coastal dune area formed a narrow strip of more elevated terrain that was eminently suitable for human occupation. Palaeobotanical evidence indicates that the limes zone was already largely deforested before the Roman period [6]. Rural settlement densities in the preceding Late Iron Age are thought to have been relatively low. A significant rise in the number and size of settlements has been extensively documented in the Early Roman B and Middle Roman A periods (25–150 CE; [7,8,9,10,11,12]). This is followed by a drastic decline in settlement density in the second half of the third century CE, which is usually linked to the collapse of the Dutch limes as a frontier [13,14]. In fact, recent research suggests that the whole area was almost completely depopulated by the end of the third century [13,15].
Apart from the rural settlements, non-rural settlements started to appear in the area during the Early and Middle Roman period. The forts, associated vici and the urban centers were all installed by the Romans, and there is no clear evidence of rural settlements developing independently into real villages during the Roman period. Growth of the ‘urban’ population is therefore closely tied to the military occupation of the area, with vici appearing alongside the forts mainly from 70 CE onwards.
Population estimates for the 2nd century CE range from 8000–16,800 for the Cananefatian civitas [10,16], and from 13,500–117,800 for the Batavian area [7,8,12]. This large range is mainly due to lack of information on the actual site density but it should be noted that, whatever the estimate used, the proportion of non-rural population in the area, in particular during the first part of the Middle Roman period, must have been substantial.
Before the Romans arrived, it is supposed that the local population engaged in subsistence production only. A modest surplus of cereals could be achieved ([1]; see Section 3.3.3), but was probably not actively pursued. The arrival of the Romans implied a fundamental change. A new and substantial demand for (forced) agricultural surplus production was created because of the deployment of troops in the region and the associated immigration of dependents, officials, craftsmen and others not involved in agricultural production, and because of taxation.
Evidence for surplus agricultural production in the Dutch limes zone has been mounting for some time [7,9,17,18,19], and since the study region did not see the widespread development of specialized villa settlements, surplus production of in particular cereals and meat must have been achieved by the local communities.
However, relatively little is known on the extent of this local production potential and regional-scale impacts on the landscape. The scarce and isolated character of the available archaeological evidence makes it problematic to estimate the extent of local food production.
Van Dinter, Kooistra and colleagues [6,19] were the first to attempt to systematically research the land-use impact of the Roman military and vici inhabitants in western part of the Lower Rhine delta. They analyzed whether the local population could supply the Roman army in 70 CE and 140 CE. For this they have, through extensive calculations, estimated the required food and wood and translated these demands into hectares of land. By confronting these with available land resources, they reconstructed the impact of the Roman presence on land use and concluded that the rural population and the landscape could meet the (reconstructed) additional demand for food, but that the availability of land for animal husbandry was too limited.
1.2. Motivation for Using Simulation Modeling
The importance of land and labor within agriculture is undoubted and a discussion of the different strategies of agricultural production must include an explicit analysis of the relative importance of land and labor as limiting factors. The calculations undertaken by Van Dinter, Kooistra and colleagues [6,19] are valuable to gauge the overall agricultural production potential of the region, but they did not experiment with a wider variety of scenarios of surplus production to estimate the development of production capacity and demand as a function of not just land and produce, but also of labor force and consumer population.
Additionally, their models did not accommodate the spatial effects of increasing demands on land. In addition, as a departure from static landscape capacity models, the simulation of the agriculture of the region as a dynamic process involving stochastic variables (random distribution of resources and fluctuating yields) was necessary.
For this reason, the Finding the limits of the limes project [20] set out to explore these methods within the context of the Dutch limes, using Agent-Based Modeling (ABM) as the primary tool to understand agricultural production at the settlement and regional level, which resulted in the ROMFARMS ABM [1]. At the same time, De Kleijn and colleagues [12] added spatial interactions and economic competition by the development of the Past Land Use Scanner (PLUS), which was developed within the context of the HERCULES project [21].
Within simulation models the real world is translated into a collection of variables linked by mathematical or logical conditions [22]. One of the major challenges is the integration of sociological factors. Especially on site catchment and household-level various researchers have effectively attempted to integrate complex cultural and sociological factors (e.g., [23,24,25,26]). The integration of sociological factors in simulation models that perform on a larger, regional area are scarce. In particular, the seminal work done by Kohler and colleagues [27,28] showed the possibilities for modeling and evaluating scenarios of the longer-term development of subsistence economy and population at the regional scale.
2. A Comparison of Approaches
The ROMFARMS ABM and the PLUS are very different, and yet they show a large number of similarities in their philosophy and outcomes. How then should we assess the value of the models within the context of the research questions at hand? Formal assessment frameworks for comparing simulation models have been suggested that range from purely theoretical [29] and methodological [30] to application-specific [31,32,33], or focused on validation and verification of the model outcomes [34,35].
For a systematic comparison of the two model approaches, we defined four criteria. The first two are related to more general aspects of the modeling approaches, whereas the last two are focused on the specific archaeological case study, thus are useful when different simulation models are focused on the same period and region.
- (a)
- Methodological and Conceptual
For this criterion, we consider the underlying mechanics of the selected modeling approaches. We compare the theoretical frameworks underlying the models and assess the different methodologies. Furthermore, we compare the spatial and temporal scope and limits of both models.
- (b)
- Technical
For a technical comparison of the two simulation models, we look at the software used and the computational resources required. Furthermore, we consider the level of reproducibility and ease of use of the models. In this regard it is important whether the software is free and open-source software, but also how well it interacts with other packages.
- (c)
- Application
With this criterion, we seek to understand how the aims and setup of the models compare. For this, we take a closer look at the assumptions made for the modeling and the experimental runs performed in relation to the model outcomes. This criterion is thus focused on the archaeological context to which both models have been applied.
- (d)
- Validation
For this criterion, we look at the internal consistency of the models and compare the archaeological insights that the modeling frameworks have produced. We will review the different conclusions drawn and their implications for the archaeological case study.
3. Comparison of the PLUS and ROMFARMS
3.1. Methodological and Conceptual
In order to compare the PLUS model and ROMFARMS at the methodological and conceptual level, the following section will first provide an abridged description of both models, followed by highlighting the similarities and differences.
3.1.1. The PLUS Simulation Model
The PLUS simulation model is based on a simulation tool aimed at predicting future land use, the Land Use Scanner (LUS; [36]). The model estimates the impact on future land use of various social economic scenarios which are based on trends and policy decisions. From a theoretical point of view, it builds upon the so-called First Law of Geography formulated by Tobler as “everything is related to everything else, but near things are more related than distant things” [37]. It mimics competition for land among different use types, based on spatial economic theory [38]. It uses different scenario inputs which can be compared to expected trends, and is foremost used as a heuristic modeling framework. The PLUS can thus be used in an analogous way to develop and test specific archaeological hypotheses.
The core mechanism of the PLUS integrates economic and demographic factors with physical environmental ones to simulate past land use. Within the modeling framework, a distinction is made between the regional demand for certain land-use types and the local suitability for these types. To determine the demand and suitability, the following main driving factors are distinguished: economic, socio-cultural, technological, spatial, environmental and political. These have been translated to local suitability by looking at distance relations, physical characteristics of the landscape, limitations resulting from military and political processes and available techniques to work the land, and a regional demand by combining economic and demographic scenarios. The expected demand and suitability constitute the input for the allocation procedure of the model, based on McFadden’s discrete choice theory [39], where the probability of selecting a certain alternative is dependent on the utility of that specific alternative in relation to the total utility of all alternatives. This means that the probability of a certain type of land use at a certain location is based on the utility of that location for that specific type of use in relation to the total utility of all possible uses.
The model is grid-based and aggregates all data to 100 × 100-m cells. From a technical perspective, the resolution of the model can be much higher. This however, would give a false impression of its accuracy since it is not meant to understand local site mechanics, but is intended to analyze and simulate land-use change at a regional scale.
3.1.2. ROMFARMS
The ROMFARMS model was developed by Joyce [1] to better understand the interplay and dependencies of the factors involved in agricultural production in the area. The primary research questions investigated were (1) to understand how different agricultural behaviors impact productivity, and (2) to evaluate the feasibility and effectiveness of different strategies of arable farming and animal husbandry in the region for obtaining surplus production (Figure 2). It thus also primarily serves a heuristic purpose, which is a major characteristic of ABM use in archaeology [40]. It was developed in NetLogo v. 6.0.2 [41], a software environment that was created to model complex systems dynamics [42,43], to generate estimates of agricultural production under different scenarios of land availability, workforce size and production strategies. Underlying the model are specific theories on agricultural production (see Section 3.3.1) and demographic development in the region in the Roman period, and its relationship to labor and land availability.
ROMFARMS is a discrete patch model comprising of cells each representing 1 hectare that simulates agricultural production at the household level. This level of detail was chosen since many of the hypotheses concerning the feasibility of agricultural production in the region are based on an understanding of the choices that individual households will have made to achieve subsistence and surplus production.
ROMFARMS can be used to predict agricultural yields under a wide range of scenarios. These estimates can then be confronted with archaeological data and hypotheses, for example on taxation levels, in order to evaluate their plausibility. While scenarios and inputs were only developed for the specific context of the case study, the model is sufficiently generic to be applied in other geographic and chrono-cultural settings.
3.1.3. Comparison
A major difference between ROMFARMS and the PLUS is found in their approach to modeling.
In ROMFARMS, interactions between agents, coupled to stochasticity, can generate dynamics that are different each time the model is run, even when the input parameters stay the same. The PLUS model, on the other hand, assumes a mathematical relationship between the factors determining demand for and allocation of land, based on a trade-off between suitability and accessibility. Given certain inputs, the model produces exactly the same output each time it is run.
A distinct disadvantage of ABM in this respect is that it can slow down the modeling, since it will consider the (inter)actions of all agents in the modeled system. Mathematical models are much easier to implement, but also assume that the underlying (causal) mechanisms of the model are sufficiently understood and empirically tested. This is precisely where simulating socio-economic dynamics of the past finds a fundamental challenge. ABM can play an important role in elucidating the plausibility of supposed mathematical relationships, but it does not escape the necessity of defining cause-effect chains, and of estimating sufficiently realistic parameter values. A clear example of this is the way in which demography is modeled in various archaeological studies. Many of these use dynamical systems equations, derived from ecology, that can be used to model the carrying capacity of populations under various ecological pressures (e.g., [44,45,46,47]). These, however, do not offer a very realistic emulation of human population dynamics, that are being governed not just by ‘natural’ factors, but also by social and cultural norms, and by economic and political structures that can influence people’s choices and abilities to start families, to raise a certain number of children, and to migrate [48]. All these are, however, much more complex to model.
3.1.4. Spatial vs. Non-Spatial
In ROMFARMS, accurate spatial prediction of land use is not aimed for. In order to understand whether available land may be a limiting factor for agriculture, a few simple rules are applied. Suitability values are determined by the user at the start of the model run, or can be derived from GIS maps. Land use requirements for arable farming are then calculated on the basis of population size, the available grain stores and external demand. The suitable land closest to the settlement is then allocated as ‘arable land’. A patch of arable land can, however, not revert back to ‘non-arable’.
Use as forest is determined at the start of the simulation as a random distribution of forested patches, with initial forest density set by the user. This forest can be removed and taken into use as arable land if needed. The remaining land will have no land use allocated. Animal husbandry, which will take place in these non-allocated zones, is thus not linked to specific patches for pasture and meadows.
The PLUS modeling framework simulates the land use based on different demographic scenarios. By estimating the population size, it is reconstructed how much food would be required to feed that population, which can be translated to a number of hectares needed to produce this food. In the PLUS this demand is then confronted with the local suitability—e.g., distance relations, political and physical characteristics of the land—for these types of land use, which then results in a spatial distribution of the various land use types. In the case study by De Kleijn and colleagues [3], the regional demand is determined by calculating the number of calories needed by all forts and settlements and relating that to the yield of certain types of land use. By supporting these assumptions with archaeological evidence—e.g., average settlement size or physical traces of certain agricultural activities—different scenarios for the demand were determined and used as input for the model. The location of land use is then determined by evaluating land suitability and proximity to settlement, with suitable land close to settlements being the most attractive, regardless of the size of settlement population. In a follow-up study by Van Lanen and colleagues [12], the demand was determined by a non-spatial demographic model.
Comparing ROMFARMS and the PLUS, we thus see that competition for land is not fully implemented in ROMFARMS but is central in the PLUS. While this does not necessarily invalidate the conclusions drawn on the limitations of land availability from the model, it does hinder a direct comparison of both approaches.
3.1.5. Dealing with Time
In ROMFARMS, the correct sequential execution of the agents’ actions is crucial for getting the desired model results. Setting the time step at one year, as was done in ROMFARMS, inevitably simplifies a model of agricultural production, with processes being treated as sequential or simultaneous when in practice they may not be. For example, fuel collection occurs multiple times throughout the year depending on the value of the parameter ‘collection frequency’. In addition, collection and production of timber can occur multiple times in one step of the simulation as foragers require multiple trips to collect sufficient timber. The simulation of processes multiple times within each step, significantly increases processing time, which restricts the number of scenarios that can be feasibly simulated.
Additionally, the effects of small variations will add up in the longer run. Increasing annual population growth from, e.g., 0.2% to 0.5% makes a substantial difference in outcomes after running the model for 100 ‘years’. Uncertainties in the inputs can thus lead to increasingly diverging outcomes the longer the model is run.
In the PLUS modeling framework, the temporal dimension is foremost determined by the demand and not directly integrated in the simulation process. Land use is only determined for a single moment in time. It does include modeling outcomes of previous periods in the suitability for later periods, but this has only very limited effects on the simulation outcomes. Comparing the temporal approaches, the PLUS is thus focused on snapshots in time whereas in ROMFARMS temporality is an integral part of the model.
A summary of the conceptual and methodological comparison is provided in Table 1.
3.2. Technical
As stated, ROMFARMS was programmed in NetLogo, a free and open-source software that was designed as a high-level programming language, using an object-oriented approach that also allows novice programmers to quickly set up agent-based simulations. It also comes with a large library of models that can be re-used and adapted for specific applications (http://ccl.northwestern.edu/netlogo/models/community/; http://modelingcommons.org/, accessed on 31 August 2021). Adapting the NetLogo source code, however, is much more complicated. Extensions can be programmed and linked to NetLogo using any language that targets the Java Virtual Machine.
Running simulations programmed in NetLogo is very easy. Its input and output screens, while graphically fairly basic, can be easily set up and adapted to monitor inputs, progress and outcomes of the simulations. In this way, it also allows for easy experimentation with the parameters involved, but parameters can also be set directly in the NetLogo code. Setting up complex models like ROMFARMS, however, requires users to have more advanced skills in programming.
In NetLogo, spatial interactions are the default, but the software is not very efficient at spatial analysis for lack of a true GIS data structure, even when it has a GIS extension that offers basic functions for analysis [49]. ‘Patches’ in NetLogo are comparable to grid cells in GIS, and can carry various attributes that can be queried by location, distance and even neighborhood, but working with multiple grid layers is not possible. Additionally, it has no in-built functions to perform spatial analyses.
However, NetLogo comes with a number of extensions that will allow users to do more advanced tasks, such as importing GIS layers, performing network analysis and run Python or R code in NetLogo. In this way, it aims to offer a good compromise between accessibility and performance, since certain tasks are more efficiently achieved in other software environments.
NetLogo’s output options are somewhat limited. The BehaviorSpace tool, intended to quickly run ‘parameter sweeps’ of the models, produces flat text tables that need post-processing in order to generate useful summaries of the results. Users will mostly have to define other specific outputs within the model code. In cases like ROMFARMS, where a large number of simulations has to be run, this is a significant hindrance for efficient model sensitivity analysis and comparison.
For larger simulations, NetLogo eventually runs into limitations of computing resources [40]. This means that there is an upper limit of the number of agents that can be simulated and as a result, the ROMFARMS study region was split into 100 × 100 km blocks, since it would be impossible to run the scenarios for the whole area without resorting to High Performance Computing. Owing to this, the effects and impact of limiting factors on agriculture in the whole macro-landscape could not be simulated.
The PLUS was designed as an extension to the Land Use Scanner [3,38,50] and uses the Free and Open Source GIS software GeoDMS, that is foremost designed to be highly efficient for raster-based calculations and allows to easily run multiple scenarios for different input parameters [51]. The GeoDMS can be used as a stand-alone software, but is often used in combination with QGIS or ArcGIS. It produces a native file for the configuration that can be edited in any simple text editor, making it adjustable and easy to integrate it as a script in other software environments using common programming languages like Python. As data input and output it foremost uses open file formats for tabular and spatial raster-based and vector-based data. It can handle common raster and vector datatypes and is capable of exporting the data into known GIS file types like .tif or .shp.
3.3. Application
To compare the models on the application to the specific region and period this section will discuss the aims, setups and experiment runs of both models after which a comparison between the two is made.
3.3.1. ROMFARMS
Setup
In ROMFARMS, both randomly generated and reconstructed landscapes can be used in the simulation, depending on the tested scenario. The landscape is represented by three possible units: levees, floodplains and other (marshlands and open water). This classification is based on the assessment of land use types at the site of Tiel-Passewaaij [52], with levees being available for arable land and settlement, floodplains for animal husbandry, and other units not available for agriculture.
The basic unit of analysis in ROMFARMS is the settlement, which can comprise one to five households. A household in ROMFARMS is considered one couple with any dependent children, elderly or unmarried adults. The number of households in each settlement at initialization is the maximum number of households. During a simulation, the number of married couples with dependents in each settlement may drop below the maximum number of households but cannot exceed it; extra households will ‘emigrate’.
At the start of each simulation, settlements are inhabited by one adult male and female per household and four individuals between 0 and 15 per household, with ages of children generated randomly. Settlements start each simulation with one herd of sheep, cattle or horse containing thirty adult animals. In addition, each settlement is provided with a catchment area containing all cells within a 10 km round trip from the settlement. A settlement’s catchment area contains all arable land and woodland on levees that a settlement has access to. Whether the arable land and woodland remains available for use depends on whether other agents have already made use of it. After initialization of the simulation, settlements then undertake arable farming, animal husbandry and fuel acquisition, and compete for land when necessary, in time steps of one calendar year. Additionally, settlements will collect timber construction wood once every twenty years. ROMFARMS is described in detail in [1] and can be accessed from https://0-doi-org.brum.beds.ac.uk/10.5281/zenodo.5236448, accessed on 31 August 2021.
Experiments Run
The scenarios tested were developed to analyze the feasibility and effectiveness of agricultural strategies to obtain surplus production, which has been central to much of the debate summarized in Section 1.1.
Three basic scenarios of arable farming were simulated: subsistence-only production, intensification and extensification, following De Hingh [53], and assuming no significant difference in yield for the two main cereal crops grown, barley and emmer wheat [19,54]. In the case of subsistence-based farming, settlements aim for a sufficiently high yield to feed the households, but will not strive to generate any meaningful surplus. Both intensification and extensification, on the other hand, aim to maximize yields. It should be noted that both strategies can be applied simultaneously. However, in order to better understand the effects of each, they were modeled as separate scenarios. Extensification (in the sense of Boserup; [55,56]) seeks to maximize the amount of arable land cultivated. Remaining surpluses will thus all be used to sow uncultivated land in the next year. Extensive agricultural strategies were assumed by Kooistra, Van Dinter and colleagues [19,54], with greater areas of arable land cultivated compared to the preceding Late Iron Age, but with no change in how it was cultivated. Annual cereal yields per hectare are estimated at 1000 kg, of which 800 kg is available for consumption, and the remainder kept for the next sowing season [19], with a fallow period of one year (two-course rotation). Intensification, on the other hand, attempts to increase yields while cultivating the same amount of arable land. In ROMFARMS, intensification is simplified to the application of manure. This eliminates the use for a fallow period, and increases the yield per hectare with 15 kg for each kg of nitrogen applied [1]. Zooarchaeological evidence points to such an intensive arable farming strategy [52,57,58], predominantly in the eastern part of the Dutch limes zone.
It is important to underline that these scenarios, while based on theoretical models of economic optimization, are not meant to imply that ‘rational’ farming strategies were consciously pursued. A multitude of other factors, including social and cultural norms, will have influenced farming choices. Additionally, the availability of information on expected crop yields, farming techniques and external demand will have determined whether farmers could reliably predict the economic outcomes of their farming strategies.
On the basis of running these scenarios, a comparison was made of the cost-effectiveness of arable intensification and extensification. Costs for extensification incorporated the area of extra land cultivated and labor needed to cultivate this extra land. Costs for intensification incorporated the labor costs to produce the manure required in addition to the labor costs for sowing, ploughing, harvesting and the incorporation of manure into cultivated land.
Finally, simulating agriculture using landscapes reconstructed from paleogeographic data enabled an analysis of land as a limiting factor. Owing to restrictions in computer processing power, the whole Lower Rhine delta was divided into 32 equal-sized sub-regions of 100 km2 which cover most of the area inhabited during the end of the pre-Roman Iron Age and Roman period (Figure 3). The natural landscape of each of these sub-regions presented different possibilities and challenges for agricultural (surplus) production [6], that is furthermore dependent on the population density. Rural settlement densities for each sub-region were calculated from a dataset of findspots. A dataset of military settlements, towns and vici was also compiled to estimate possible demand in each of the sub-regions in the Early and Middle Roman periods.
However, this approach is likely to suffer from edge effects. Settlements near the borders of the sub-regions may have suitable land available in neighboring sub-regions that is currently not considered because the demand for land is confined within the boundaries of sub-regions. Technically it is possibly to relax this constraint, but this has not yet been implemented in the model.
3.3.2. The PLUS
The PLUS was developed primarily to study the impact of the Romans on the land use in the Lower Rhine. By simulating various scenarios for the land use in this period at a regional level, the model could test the validity of the hypothesis by Van Dinter and colleagues [19] that 50% of the cereal production took place locally. By extending their work with spatial interactions and economic competition, their findings were re-evaluated.
Setup
As input for the PLUS, extensive calculations were made to estimate the amount of cereal that would have been needed to feed the local population and the Roman soldiers. These estimates could then be translated to different demands of land use. Next, the local suitability was determined by assigning relative suitability scores to the various reconstructed palaeogeographical units, combined with travel distance relationships and buffers of cleared areas around the known Roman watch towers. Feeding these figures into the allocation procedure of the PLUS allowed to simulate whether the hypothesis of 50% local production was feasible. In addition to the spatial modeling, De Kleijn and colleagues [3] also estimated whether the locally available labor force would be sufficient to work the amount of land that would be needed for the different scenarios. It distinguishes three types of land use related to food production: arable farming for the production of cereal, meadow and pasture. It uses the same assumptions as the ROMFARMS extensification scenario for annual cereal yield, i.e., 1000 kg per hectare, of which 800 kg is available for consumption [19], with a fallow period of one year. Furthermore, the model includes woodland, water, residential areas and military zones. Woodland is integrated as a passive land-use type, allowing it to be replaced by the food producing land-use types. Other land-use types, like water bodies and known locations of settlements are approached as static elements in the simulation process, which basically means that these are excluded from the land-use allocation process.
Experiments Run
To run the models, the area delimited by van Dinter and colleagues [19] was selected (Figure 4). The local suitability for the different land-use types remained the same, the major variance that was included in the various runs was the demand. For both 70 CE and 140 CE, eleven scenarios were run in which the amount of the local food surplus as share of the total amount of required food in the region was used as input. By simulating the land use in steps of 10% surplus it could be estimated if there would have been sufficient suitable land available for the production of cereal for the Roman military. Besides the availability of land, De Kleijn and colleagues [3] also considered the labor force. It was calculated that every settlement could provide a labor force that could work a maximum of 25.6 ha. Combing the capacity of the labor force with the simulated land use allowed to re-evaluate the hypothesis whether 50% of the cereal could indeed be locally produced as surplus by the local population. By simulating various scenarios, the maximum capacity of the landscape combined with the workforce could be determined.
3.3.3. Comparison
Level of Detail
In ROMFARMS, a trade-off needed to be made between simplicity and detail. For example, animal husbandry strategies include only basic exploitation strategies where kill-off patterns maximize the return of a single product. The results are just some of the possible ways that farmers in the past could manage animals. Similarly, different strategies of arable farming concern only the investment of land and labor. Other strategies, such as multiple croppings each year or mixed cropping are not considered.
Some of the processes simulated in ROMFARMS have also been simplified for the purpose of efficiency of the simulation. The sub-model of population dynamics, for example, is significantly less complex than that produced by Verhagen and colleagues or Danielisová and Štekerová [25,59]. This has an impact on the results generated by ROMFARMS as rural demand of resources and labor supply are dependent on populations in the landscape. ROMFARMS also lacks a simulation of the soil nutrient cycle (cf. [25,60]). The impact of manuring or fallowing on soil productivity are considered only superficially, despite the potential impact that soil nutrients could have had on arable yields in the past.
Additionally, the ROMFARMS model was not designed to make accurate predictions about where arable farming, animal husbandry and wood collection took place. The landscape was classified into three units, with no competition for land use possible between these units, although settlements might compete for the same piece of land. In the reconstructed landscapes, the location of the settlements was not fixed, only the number of settlements was based on the densities observed in the archaeological record.
In contrast, the PLUS departs from known settlement locations, and applies a more sophisticated landscape classification and rules for competition for land. Where the PLUS heavily relies on a suitability for certain land use types which is used and weighted as input in the allocation process, ROMFARMS only considers zones as either suitable or non-suitable for a specific land use. Simplification of landscapes simulated by ROMFARMS also concerns scenarios with homogeneous occupation by settlements of the same sizes. Such landscapes are not realistic, but landscapes were simulated this way to produce a range of possible results from minimum to maximum population sizes.
ROMFARMS was also implemented based on a discrete patch model wherein cells have only one landscape element or use. This will have caused the overestimation of certain resources such as grassland, arable land or woodland. In addition, defining landscape suitability as suitable or not suitable for different parts of the agricultural economy is a more simplistic approach than that undertaken by de Kleijn and colleagues [3].
Further simplifications include the restricted inclusion of adaption of agriculturalists in ROMFARMS. The impact and adoption of mitigating strategies when settlements experience fuel or grain deficits have not been included. Neither have the impact or adoption of strategies when settlements experience labor shortages.
Scenario Building
Additionally, the scenarios used in ROMFARMS and the PLUS are different. Whereas ROMFARMS specifically aimed to compare different archaeological hypotheses that can be linked to archaeological data at a more abstract level, the PLUS model was designed to model the development of land use during a very specific timeframe, the period 70–140 CE. Where it concerns the analysis of limitations to land use, ROMFARMS will signal land availability problems within a sub-region, but will not simulate direct competition for land between settlements.
In order to understand land use patterns in the first century CE for the Roman limes zone in the western part of Netherlands the PLUS has been applied for 70 CE and 140 CE to re-examine the assumption by Van Dinter and colleagues [19] that 50% of the cereals consumed by the Romans was locally produced and the other half imported. To analyze if this percentage is feasible for both time periods, a set of scenarios was developed with different percentages of locally produced cereals, combined with a reconstruction of the local suitability and the locally available labor force. A series of simulations were then run to test the capacity of the land and the availability of labor from the local population.
The study showed that, for 70 CE, the demand for cereals could be met for all scenarios with the available land and labor force. For 140 CE, the demand for cereals could in most scenarios not be met, caused by a shortage of suitable land. The models suggest that labor force was not a limiting factor. Thus, it is concluded that the hypothesis that 50% of the cereal for the Roman military and vici inhabitants was produced locally seems to hold for 70 CE, but not for 140 CE (Figure 5).
The results of the ROMFARMS simulations showed that the two surplus arable strategies of intensification and extensification provide different advantages to settlements, depending on the availability of land and labor. Under intensification, the land cost per ton of surplus grain is lower than under extensification. This indicates that intensification is a more advantageous strategy when the availability of arable land is reduced. Extensification, on the other hand, uses less labor per ton of surplus than intensification. Accordingly, despite overall higher absolute labor costs, extensification would be a more beneficial strategy should the availability of labor be restricted.
Using a dataset of castella, castra, towns and vici, the demand for grain in each sub-region was estimated. Two scales of supply network were envisaged. The micro-regional supply network is one where consumer-only settlements were supplied by rural agrarian settlements located in the same micro-region. The macro-regional supply network was denoted as a supply network where all rural settlements were involved in the supply of all military and civil settlements.
Changes in demand and supply were observed over time with an increasing demand from military and civil settlements from the Early to the Middle Roman period, as well as increases in rural settlement density. These changes resulted in only slight variations in the pattern of surplus and deficits calculated for sub-regions however. Owing to the variation in settlement density in sub-regions, the surpluses produced in the sparsely populated peat regions produce smaller quantities of surplus grain than the more densely occupied regions in the central part of the Lower Rhine delta.
The results of these comparisons (Figure 6 and Figure 7) showed that for grain supply for human consumption, a micro-regional supply network was infeasible in many scenarios, especially with small settlements possessing only one to two households. The amount of grain that can be supplied is also lower when settlements undertake arable intensification. Only in scenarios where settlements comprised three or five households, a majority of the grain required for either human consumption or to be used as fodder could be supplied on a micro-regional scale when settlements undertake arable extensification. However, archaeological evidence indicates that small settlements were much more common [8,19,61]. Macro-regional supply would thus seem better suited to respond to the demands of castra, castella, towns and vici for grain.
3.4. Validation
Validation of the models has been approached in three different ways:
- Is the model internally consistent, in other words, are there no programming errors?
- Does the model produce outcomes that can be used to test existing hypotheses?
- Does the model produce outcomes that can be used for prediction?
3.4.1. Validation of Code
NetLogo does not provide extensive code checking tools, which means that validation of code will have to come from peer-reviewing it and subjecting it to sensitivity analysis. The ODD protocol [62,63,64] is very helpful to understand the intended operation of the code and can be accompanied by a description of the decision-making elements [65]. A formal, ‘computational’ ontology, would be preferable to describe models in an unambiguous way [33], but so far this is an approach that is not customarily applied, at least not in archaeology.
The code written for ROMFARMS was submitted to external review, and can thus be supposed to have been set up correctly, but a formal ODD description was not made because of the complexity of the model. Its workings are, however, described in detail by Joyce [1]. A recent sensitivity analysis [66] of the ROMFARMS code confirmed that it functions as could be expected on the basis of the model description, but also revealed an as yet unexplained discontinuity in grain production and fuel collection around the thirtieth time step of the modeling, possibly pointing to a coding error. Clearly, this shows how important it is that code is open to scrutiny and improvement. The use of open-source software is a prerequisite for that. Unlike other disciplines, however, archaeology still lacks a good infrastructure and ecosystem for collaborative code writing and review. Even when some initiatives are on the way in this respect (e.g., NASA; https://archaeology-abm.github.io/NASA/, accessed on 31 August 2021; Open Modeling Foundation; https://openmodelingfoundation.org/, accessed on 31 August 2021), many existing computer models are currently not extensively scrutinized and updated.
In the PLUS, this is also an issue. The user does not have to do all the programming since basic tasks are handled by GeoDMS, a software package that goes through normal stages of open-source code development. However, in order to run the models the user still needs to program it. A formal code review of the models produced by De Kleijn, Van Lanen and colleagues [3,12], however, was not undertaken.
3.4.2. Validation of Hypotheses
Both the PLUS and ROMFARMS were designed to assess the plausibility of prevailing hypotheses of land use and agricultural production, but the models do not reach equivalent conclusions. The PLUS model, that was only run for the western part of the regions, indicates that a 50% local production of cereals was feasible in the early stages of the Roman period (70 CE). This largely confirms the hypotheses drawn up by Kooistra, Groot, Van Dinter and colleagues [6,17,19,54]. By 140 CE, however, when settlement densities were highest, the model indicates that land was a severely limiting factor for surplus production. The ROMFARMS calculations, taking into consideration a larger area, suggest that this land shortage may have been compensated by the availability of land in the eastern part of the river area and further south down the coast. Additionally, the intensification scenario was not considered in the PLUS and thus the model could possibly have underestimated productivity. Both models suggest that micro-regional supply will not have been enough to meet local demand, since surplus production per settlement must have been modest, even when all available land is taken into cultivation.
The ROMFARMS results further suggest that available workforce must have posed major limitations to increasing agricultural yields whereas the PLUS models do not flag this as a major issue. This may be due to the fact that ROMFARMS also considers the role of animal husbandry and fuel collection in the agricultural labor cycle.
3.4.3. Validation of Predictions
Both ROMFARMS and the PLUS were used to make predictions of surplus production and land use allocation on the basis of scenarios that are thought to be archaeologically plausible. The actual outcomes of the models are restricted to a limited number of measures: yields (estimated in calories), and the area taken up by land use types (in hectares). The PLUS also predicts the spatial allocation of land use categories. Quantitative archaeological evidence for surplus production is almost absent, making it impossible to validate the predicted yields with any certainty. These aspects would however lend themselves to partial validation by analyzing archaeological evidence for agricultural and/or other land uses in the vicinity of known settlements. This, however, would take substantial (field)work before it can provide a statistical validation of the model outcomes.
By examining the variation of the allocated land uses in the PLUS in relation to the suitability it was observed that less suitable areas would in some cases be taken into cultivation in order to meet demand. It thus also reveals patterns in land-use that might indicate areas of potential archaeological value that have hitherto been underexplored. This implies that we should reassess the archaeological and paleo-vegetation studies for those areas, or reconsider the model assumptions in relation to the share of locally produced food.
4. Discussion
Both ROMFARMS and the PLUS have their pros and cons in the way they are set up and executed. Some of the limitations signaled are conceptual, in particular the choice of scenarios and the definition of model inputs, other are more of a technical nature.
4.1. Technical Compatibility
From a computational perspective, it is easier to upscale NetLogo models and model outputs for use in the PLUS than the other way around. Implementing large-scale spatial simulations in NetLogo will simply be too inefficient. In principle, NetLogo could be linked to the PLUS by developing a new extension. However, the main bottleneck will still be the handling of (too) many agents.
Some aspects of the PLUS model that can be implemented in ROMFARMS are found at the conceptual level, such as a more sophisticated definition of land suitability and the allocation of land use around settlements. However, running an adapted model over larger areas will run into the same problems of limited computational resources and cumbersome handling of model outputs. Integrating the two into one system would thus lead to computational ‘overkill’, with less and less opportunity to control the simulation results. Even resorting to High-Performance Computing will not be a final solution since NetLogo has no options for code parallelization [40].
4.2. Inputs
As with all simulation modeling, the input parameters determine the results. The PLUS model heavily relied on the study by Van Dinter and colleagues [19], whereas ROMFARMS took in a wider range of studies. Model parameters such as the settlements’ assumed requirements for arable and pasture land are often debatable, e.g., where it concerns the practices of fallowing and manuring, and the wide ranges cited in literature imply that the range of possible model outcomes is correspondingly large.
Additionally, only broad assumptions can be made about the typical size of a settlement in the region, with most sites only identified from surface findspots and few remains of actual buildings found. Vossen [8] argued that large settlements were exceptional in the region, and this was confirmed by an analysis of the available findspot information [61]. Van Dinter and colleagues assumed 1.5 households as the average size of a rural settlement [19]. Landscapes occupied homogeneously by same-size settlements are unrealistic. Still, if the occupation of landscapes by small settlements was the norm, the results from scenarios with settlements of one or two households better reflect the situation in the past.
Several limitations were identified during the implementation of ROMFARMS and the simulation of scenarios. Firstly, the availability of data to produce assumptions was not consistent. For some aspects of the agricultural economy, no data from either regional specific or analogous research was available. When data was available, it was rarely available directly from archaeological sources from the Dutch Roman limes zone. For example, no data from archaeological, ethnographic or experimental studies was available to provide assumptions of the time taken to undertake agricultural tasks such as manuring, processing of timber or the production of hay fodder for example. Certain assumptions were therefore generated from reasonable estimates.
In cases where previous research indicated a lack of agreement, ROMFARMS has taken the mean of available assumptions. The implication is that estimates of quantities of agricultural production or labor costs for different strategies are tentative even when making use of the best available domain knowledge. When more domain knowledge becomes available, the model can only improve as its assumptions can be updated and amended.
Another aspect is that the settlements integrated in both models are all known sites from archaeological research activities (i.e., excavations, surveys and historical sources). Obviously, this inventory is not complete, and some settlements may not even be archaeologically traceable. It has been presumed that up to 50% of Roman sites in the area have not been detected yet [67], but this estimate is probably too pessimistic given the intensive research history of the area [61]. However, exact dating of the sites usually proves to be problematic. This could mean, for example, that the conclusions drawn for the 70 CE and 140 CE land-use allocation scenarios in the PLUS are not as certain as they might appear from the modeling. A higher density of settlement, for example, would have a marked effect on the available land which is already relatively scarce in some zones.
4.3. Issues of Scale
In current modeling approaches in archaeology, ABM simulation seems to be the dominant application. This is partly because it can cater to the geographical scale that archaeologists are most comfortable with, the local and (micro-)regional. ABM can be seen as a variant or extension of the older approach of microsimulation [68]. It is designed for modeling interactions at the individual scale, which usually also implies a limited geographical and temporal scale. Spatial modeling studies of human spatial behavior at the continental or even global scale covering large time periods (e.g., [69,70,71,72]), are typically inspired by other disciplines, in particular ecology, climatology and geography. At the intermediate level (macro-regional/national), however, we notice a lack of archaeological spatial simulation models, with some exceptions (e.g., [46]). This is, we think, where a system like the PLUS has a clear added value.
Inherent to any spatial modeling approach the PLUS simplifies reality. In case of arable farming, for example, the modeling framework is configured to simulate this land-use type to an area within one-hour walking distance from a settlement. This rule has a significant impact on the results. It might have been that people were willing to travel longer to their lands or that arable farming was more systematically organized. Here, the results thus provide interesting leads to formulate hypotheses considering the land organization. Furthermore, this study has not differentiated different types of settlements. The analysis could greatly benefit from having more detailed data on estimated sizes of individual settlements to provide more variation in associated land-use patterns and available workforce.
4.4. Outcomes and Validation
The conclusions drawn on basis of the simulation results are not assumed to represent actual yields of land and labor expenditure in the past. However, by simulating using a range of possible assumptions, the bandwidth of outputs will include a result that is representative of the situation in the past.
In order to deal with uncertainties, the modeling frameworks apply a range of scenarios. The scenarios discussed in this article foremost focus on the spatial implications of local surplus production of cereals, but the model can also be implemented to test different hypotheses and validate the associated assumptions. In the case of ROMFARMS, scenarios of agricultural intensification and extensification were explored in detail, and separate scenarios were run for animal husbandry and wood collection to estimate their impact on land use and labor force. In the PLUS, no such detailed explorations were made, so this could be a worthwhile addition for its future application.
In the case presented, economic aspects and, to a limited extent, sociological and cultural factors have been integrated with physical environmental factors. Both the PLUS and ROMFARMS are capable of integrating more sociological and cultural factors relating to the demand for land or the spatial preferences for performing land-use related activities. The models can thus contribute to the challenge identified by Lake [22] to integrate sociological factors in spatial simulations. The modeling approach and tools constitute a dynamic research instrument that can be transferred other regions and cases as well. As demonstrated in this article, the modeling framework aids archaeologists to generate a better understanding of past spatial dynamics and the relationship between people and landscape.
4.5. Complementarity of Approaches
The main differences between the two approaches are found in the geographical scale applied and the type of predictions made. The PLUS aims for spatially explicit predictions of land use over large areas, without explicitly considering the dynamics of demography. ROMFARMS intends to model farming output under a wide range of conditions, without attempting to predict land allocation. Consequently, the models cannot be used for the same purpose, but elements of each might enhance the outcomes of the other. A recent study [66] showed that replacing parts of the ROMFARMS code with alternative code from the Artificial Anasazi model [44,73] (‘docking’) can be effective for understanding the equivalence of modeling approaches, and even to detect programming errors. The main challenge is to understand what parts of the code can be profitably re-used in other systems.
In the case of the PLUS, the limitation on the number of scenarios is not a consequence of computational limitations. The backdrop for the model is directly derived from the archaeological evidence to answer the question if space could have been a limiting factor to agricultural production. So, the location and number of settlements is currently static and does not allow for differently sized settlements, or different population age structures. Similarly, animal husbandry and arable farming practices are modeled as single strategies. The more detailed and speculative approach of ROMFARMS could thus be useful to explore a larger variety of theoretical models in the PLUS: what are the spatial effects on land use when agricultural strategies change under different economic, environmental and political circumstances?
ROMFARMS, on the other hand, might be extended with more advanced spatial allocation rules to arrive at more realistic spatio-temporal outcomes. The rule-based system used in the PLUS allowing for competition between settlements can be directly implemented, and more realistic models of settlement location can be easily applied as well. This could be useful, for example, to understand when tipping points are reached in a specific socio-economic scenario. However, as mentioned, upscaling ROMFARMS to the large number of agents needed for the whole study region would be unfeasible.
5. Conclusions
In this paper, we set out to compare two simulation models of past land use applied to the case of the Roman frontier zone in the Dutch river area. ROMFARMS and the PLUS share many characteristics in how they handle their inputs and simulate land use requirements to test hypotheses on the feasibility of surplus agricultural production for the military and civilian population. However, they also use different approaches to tackle this research ow question. While ROMFARMS focuses on experimentation with different scenarios of agricultural production at the household level, the PLUS concentrates on predicting the allocation of land use and the corresponding agricultural yield in the area for a specific point in time. ROMFARMS is based on NetLogo, which allows for easy experimentation with various parameters but slows down execution with larger numbers of simulations and larger areas. The PLUS, on the other hand, can quickly run a multitude of scenarios over large areas, but is restricted by not including an explicit demographic model. Clearly, ROMFARMS could thus profit from a more efficient handling of large (spatial) datasets, whereas the PLUS could benefit from implementing more sophisticated scenarios of agricultural production and demographic development.
However, while both models can be highly complementary, tools that allow for transferring approaches and principles between the models are currently lacking. It is therefore a priority that model code will become more easily re-usable between modeling environments, not just by following the FAIR software principles (https://fair-software.nl, accessed on 31 August 2021), but also by actively (re-)testing and repurposing software code. Currently, however, archaeology is still lacking an infrastructure and best practices for this. It is hoped that this paper will contribute to developing these.
Author Contributions
Conceptualization, P.V. and M.d.K.; methodology, P.V., M.d.K. and J.J.; software, J.J. and M.d.K.; validation, M.d.K., J.J. and P.V.; formal analysis, M.d.K., J.J. and P.V.; writing—original draft preparation, P.V. and M.d.K.; writing—review and editing, P.V., M.d.K. and J.J. All authors have read and agreed to the published version of the manuscript.
Funding
This research was partially funded by NWO (the Netherlands Organisation for Scientific Research) under the VIDI Innovational Research Incentives Scheme (project number 276-61-005). Furthermore, it received funding from the European Union’s Seventh Framework Programme for research, technological development and demonstration under grant agreement no 603447 (FP7, Collaborative Project: HERCULES http://www.hercules-landscapes.eu/, accessed on 31 August 2021).
Institutional Review Board Statement
Not applicable.
Informed Consent Statement
Not applicable.
Data Availability Statement
Not applicable.
Conflicts of Interest
The funders had no role in the design of the study; in the collection, analyses, or interpretation of data; in the writing of the manuscript, or in the decision to publish the results.
References
- Joyce, J.A. Farming along the Limes. In Using Agent-Based Modelling to Investigate Possibilities for Subsistence and Surplus-Based Agricultural Production in the Lower Rhine Delta between 12 BCE and 270 CE; Vrije Universiteit Amsterdam: Amsterdam, The Netherlands, 2019. [Google Scholar]
- Joyce, J. Modelling agricultural strategies in the Dutch Roman limes zone via agent-based modelling (ROMFARMS). In Finding the Limits of the Limes. Modelling Demography, Economy and Transport on the Edge of the Roman Empire; Verhagen, P., Joyce, J., Groenhuijzen, M.R., Eds.; Simulation Studies in Archaeology; Springer: New York, NY, USA, 2019; pp. 109–128. [Google Scholar]
- de Kleijn, M.; Beijaard, F.; Koomen, E.; van Lanen, R. Simulating Past Land Use Patterns: The Impact of the Romans on the Lower-Rhine Delta in the First Century AD. J. Archaeol. Sci. Rep. 2018, 20, 244–256. [Google Scholar] [CrossRef]
- van Dinter, M. The Roman Limes in the Netherlands: How a Delta Landscape Determined the Location of the Military Structures. Neth. J. Geosci. 2013, 92, 11–32. [Google Scholar] [CrossRef]
- Groenhuijzen, M.R. Palaeogeographic Analysis of the Dutch Part of the Roman Limes and Its Hinterland; Vrije Universiteit Amsterdam: Amsterdam, The Netherlands, 2018. [Google Scholar]
- Kooistra, L.I.; van Dinter, M.; Dütting, M.K.; van Rijn, P.; Cavallo, C. Could the Local Population of the Lower Rhine Delta Supply the Roman Army? Part 1: The Archaeological and Historical Framework. J. Archaeol. Low Ctries. 2013, 4, 5–23. [Google Scholar]
- Willems, W.J.H. Romans and Batavians. A Regional Study in the Dutch Eastern River Area; University of Amsterdam: Amsterdam, The Netherlands, 1986. [Google Scholar]
- Vossen, I. The possibilities and limitations of demographic calculations in the Batavian area. In Kontinuität und Diskontinuität. Germania inferior am Beginn und am Ende der römischen Herrschaft. Beiträge des deutsch-niederländischen Kolloquiums in der Katholieke Universiteit Nijmegen (27. bis 30.06. 2001); Grünewald, T., Seibel, S., Eds.; Walter De Gruyter: Berlin, Germany, 2003; pp. 414–435. [Google Scholar]
- Vos, W.K. Bataafs Platteland. Het Romeinse Nederzettingslandschap in Het Nederlandse Kromme-Rijngebied; Nederlandse Archeologische Rapporten; Rijksdienst voor het Cultureel Erfgoed: Amersfoort, The Netherlands, 2009; Volume 35. [Google Scholar]
- Buijtendorp, T. Forum Hadriani. De vergeten stad van Hadrianus: Ontwikkeling, Uiterlijk en Betekenis van het “Nederlands Pompeji”; Vrije Universiteit Amsterdam: Amsterdam, The Netherlands, 2010. [Google Scholar]
- Verhagen, P.; Joyce, J.; Groenhuijzen, M. Modelling the Dynamics of Demography in the Dutch Roman Limes Zone. In Proceedings of the LAC 2014 Conference, Rome, Italy, 19–20 September 2014; Vrije Universiteit Amsterdam: Amsterdam, The Netherlands, 2016. [Google Scholar]
- van Lanen, R.J.; de Kleijn, M.T.M.; Gouw-Bouwman, M.T.I.J.; Pierik, H.J. Exploring Roman and Early-Medieval Habitation of the Rhine-Meuse Delta: Modelling Large-Scale Demographic Changes and Corresponding Land-Use Impact. Neth. J. Geosci. 2018, 97, 45–68. [Google Scholar] [CrossRef] [Green Version]
- Heeren, S. The depopulation of the Lower Rhine region in the 3rd century. An archaeological perspective. In The Roman Villa of Hoogeloon and the Archaeology of the Periphery; Roymans, N., Derks, T., Hiddink, H., Eds.; Amsterdam University Press: Amsterdam, The Netherlands, 2015; pp. 269–292. [Google Scholar]
- Groenewoudt, B.J.; van Lanen, R.J. Diverging Decline. Reconstructing and Validating (Post-)Roman Population Trends (AD 0-1000) in the Rhine-Meuse Delta (the Netherlands). Post-Class. Archaeol. 2018, 8, 189–218. [Google Scholar]
- de Bruin, J. Rurale Gemeenschappen in de Civitas Cananefatium 50-300 Na Christus; University of Leiden: Leiden, The Netherlands, 2017. [Google Scholar]
- Bloemers, J.H.F. Rijswijk (Z.H.), “De Bult”, Eine Siedlung der Cananefaten; Rijksdienst voor het Oudheidkundig Bodemonderzoek: Amersfoort, The Netherlands, 1978. [Google Scholar]
- Groot, M.; Heeren, S.; Kooistra, L.I.; Vos, W.K. Surplus Production for the Market? The Agrarian Economy in the Non-Villa Landscapes of Germania Inferior. J. Roman Archaeol. 2009, 22, 231–252. [Google Scholar] [CrossRef]
- Heeren, S. Romanisering van Rurale Gemeenschappen in de Civitas Batavorum: De Casus Tiel-Passewaaij; Nederlandse Archeologische Rapporten; Rijksdienst voor het Cultureel Erfgoed: Amersfoort, The Netherlands, 2009. [Google Scholar]
- van Dinter, M.; Kooistra, L.I.; Dütting, M.K.; van Rijn, P.; Cavallo, C. Could the Local Population of the Lower Rhine Delta Supply the Roman Army? Part 2: Modelling the Carrying Capacity Using Archaeological, Palaeo-Ecological and Geomorphological Data. J. Archaeol. Low Ctries. 2014, 5, 5–50. [Google Scholar]
- Verhagen, P.; Joyce, J.; Groenhuijzen, M.R. (Eds.) Finding the Limits of the Limes. Modelling Demography, Economy and Transport on the Edge of the Roman Empire; Simulation Studies in Archaeology; Springer: New York, NY, USA, 2019. [Google Scholar]
- Kolen, J.; Crumley, C.; Burgers, G.J.; von Hackwitz, K.; Howard, P.; Karro, K.; de Kleijn, M.; Löwenborg, D.; van Manen, N.; Palang, H.; et al. HERCULES: Studying Long-Term Changes in Europe’s Landscapes. Analecta Praehist. Leiden. 2015, 45, 209–219. [Google Scholar]
- Lake, M.W. Trends in Archaeological Simulation. J. Archaeol. Method Theory 2014, 21, 258–287. [Google Scholar] [CrossRef] [Green Version]
- Goodchild, H.; Witcher, R.E. Modelling the agricultural landscapes of Republican Italy. In Agricoltura e Scambi nell’Italia Tardo Repubblicana; Carlsen, J., Lo Cascio, E., Eds.; Edipuglia: Rome, Italy, 2010; pp. 187–220. [Google Scholar]
- Whitley, T.G.; Moore, G.; Goel, G.; Jackson, D. Beyond the Marsh: Settlement Choice, Perception and Spatial Decision-Making on the Georgia Coastal Plain. In Making History Interactive. Computer Applications and Quantitative Methods in Archaeology (CAA), Proceedings of the 37th International Conference, Williamsburg, VA, USA, 22–26 March 2009; Frischer, B., Webb Crawford, J., Koller, D., Eds.; Archaeopress: Oxford, UK, 2010; pp. 380–390. [Google Scholar]
- Danielisová, A.; Olševičová, K.; Cimler, R.; Machálek, T. Understanding the Iron Age Economy: Sustainability of Agricultural Practices under Stable Population Growth. In Agent-Based Modeling and Simulation in Archaeology; Wurzer, G., Kowarik, K., Reschreiter, H., Eds.; Springer: Cham, Switzerland, 2015; pp. 205–241. [Google Scholar]
- McGlade, J.; van der Leeuw, S.E. (Eds.) Time, Process and Structured Transformation in Archaeology, 1st ed.; One World Archaeology; Routledge: London, UK, 1997; ISBN 978-1-315-88770-8. [Google Scholar]
- Kohler, T.A. Putting social sciences together again: An introduction to the volume. In Dynamics in Human and Primate Societies: Agent-Based Modelling of Social and Spatial Processes; Kohler, T.A., Gumerman, G.J., Eds.; Oxford University Press: New York, NY, USA, 2000; pp. 1–44. [Google Scholar]
- Kohler, T.A.; Varien, M.D. (Eds.) Emergence and Collapse of Early Villages Models of Central Mesa Verde Archaeology; Origins of Human Behavior and Culture; University of California Press: Berkeley, CA, USA, 2012. [Google Scholar]
- Wegener, M. Land-Use Transport Interaction Models. In Handbook of Regional Science; Fischer, M.M., Nijkamp, P., Eds.; Springer: Berlin/Heidelberg, Germany, 2014; pp. 741–758. ISBN 978-3-642-23429-3. [Google Scholar]
- Koomen, E.; Stillwell, J. Modelling Land-Use Change. In Modelling Land-Use Change; Koomen, E., Stillwell, J., Bakema, A., Scholten, H.J., Eds.; The GeoJournal Library; Springer: Dordrecht, The Netherlands, 2007; Volume 90, pp. 1–22. ISBN 978-1-4020-6484-5. [Google Scholar]
- Couclelis, H. “Where Has the Future Gone? ” Rethinking the Role of Integrated Land-Use Models in Spatial Planning. Environ. Plan. Econ. Space 2005, 37, 1353–1371. [Google Scholar] [CrossRef]
- Matthews, R.B.; Gilbert, N.G.; Roach, A.; Polhill, J.G.; Gotts, N.M. Agent-Based Land-Use Models: A Review of Applications. Landsc. Ecol. 2007, 22, 1447–1459. [Google Scholar] [CrossRef] [Green Version]
- Parker, D.C.; Entwisle, B.; Rindfuss, R.R.; Vanwey, L.K.; Manson, S.M.; Moran, E.; An, L.; Deadman, P.; Evans, T.P.; Linderman, M.; et al. Case Studies, Cross-Site Comparisons, and the Challenge of Generalization: Comparing Agent-Based Models of Land-Use Change in Frontier Regions. J. Land Use Sci. 2008, 3, 41–72. [Google Scholar] [CrossRef] [PubMed] [Green Version]
- Axtell, R.; Axelrod, R.; Epstein, J.M.; Cohen, M.D. Aligning Simulation Models: A Case Study and Results. Comput. Math. Organ. Theory 1996, 1, 123–141. [Google Scholar] [CrossRef] [Green Version]
- Pontius, R.G.; Castella, J.-C.; de Nijs, T.; Duan, Z.; Fotsing, E.; Goldstein, N.; Kok, K.; Koomen, E.; Lippitt, C.D.; McConnell, W.; et al. Lessons and Challenges in Land Change Modeling Derived from Synthesis of Cross-Case Comparisons. In Trends in Spatial Analysis and Modelling; Behnisch, M., Meinel, G., Eds.; Geotechnologies and the Environment; Springer International Publishing: Cham, Switzerland, 2018; Volume 19, pp. 143–164. ISBN 978-3-319-52520-4. [Google Scholar]
- Koomen, E.; Hilferink, M.; Borsboom-van Beurden, J. Introducing Land Use Scanner. In Land-Use Modelling in Planning Practice; Koomen, E., Borsboom-van Beurden, J., Eds.; GeoJournal Library; Springer: Dordrecht, The Netherlands, 2011; Volume 101, pp. 3–21. ISBN 978-94-007-1821-0. [Google Scholar]
- Tobler, W.R. A Computer Movie Simulating Urban Growth in the Detroit Region. Econ. Geogr. 1970, 46, 234. [Google Scholar] [CrossRef]
- Hilferink, M.; Rietveld, P. LAND USE SCANNER: An Integrated GIS Based Model for Long Term Projections of Land Use in Urban and Rural Areas. J. Geogr. Syst. 1999, 1, 155–177. [Google Scholar] [CrossRef] [Green Version]
- McFadden, D. Modelling the choice of residential location. In Spatial Interaction Theory and Planning; Karlsqvist, A., Lundqvist, L., Snickars, F., Weibull, J., Eds.; North Holland: Amsterdam, The Netherlands, 1978; pp. 75–96. [Google Scholar]
- Romanowska, I.; Crabtree, S.A.; Harris, K.; Davies, B. Agent-Based Modeling for Archaeologists: Part 1 of 3. Adv. Archaeol. Pract. 2019, 7, 178–184. [Google Scholar] [CrossRef] [Green Version]
- Wilensky, U. NetLogo; Center for Connected Learning and Computer-Based Modeling, Northwestern University: Evanston, IL, USA, 1999. [Google Scholar]
- Situe, S.; Wilensky, U. NetLogo: A Simple Environm 2004. Available online: http://ccl.northwestern.edu/papers/netlogo-iccs2004.pdf (accessed on 31 August 2021).
- Abbott, R.; Hadžikadić, M. Complex Adaptive Systems, Systems Thinking, and Agent-Based Modeling. In Advanced Technologies, Systems, and Applications; Hadžikadić, M., Avdaković, S., Eds.; Lecture Notes in Networks and Systems; Springer: Cham, Switzerland, 2017; pp. 1–8. [Google Scholar]
- Axtell, R.L.; Epstein, J.M.; Dean, J.S.; Gumerman, G.J.; Swedlund, A.C.; Harburger, J.; Chakravarty, S.; Hammond, R.; Parker, J.; Parker, M. Population Growth and Collapse in a Multiagent Model of the Kayenta Anasazi in Long House Valley. Proc. Natl. Acad. Sci. USA 2002, 99, 7275–7279. [Google Scholar] [CrossRef] [Green Version]
- Sørensen, B. Demography and the Extinction of European Neanderthals. J. Anthropol. Archaeol. 2011, 30, 17–29. [Google Scholar] [CrossRef]
- Balbo, A.L.; Rubio-Campillo, X.; Rondelli, B.; Ramírez, M.; Lancelotti, C.; Torrano, A.; Salpeteur, M.; Lipovetzky, N.; Reyes-García, V.; Montañola, C.; et al. Agent-Based Simulation of Holocene Monsoon Precipitation Patterns and Hunter-Gatherer Population Dynamics in Semi-Arid Environments. J. Archaeol. Method Theory 2014, 21, 426–446. [Google Scholar] [CrossRef] [Green Version]
- White, A.A. Mortality, Fertility, and the OY Ratio in a Model Hunter-Gatherer System. Am. J. Phys. Anthropol. 2014, 154, 222–231. [Google Scholar] [CrossRef] [Green Version]
- Verhagen, P. Modelling the dynamics of demography in the Dutch Roman limes zone: A revised model. In Finding the Limits of the Limes. Modelling Demography, Economy and Transport on the Edge of the Roman Empire; Verhagen, P., Joyce, J., Groenhuijzen, M.R., Eds.; Simulation Studies in Archaeology; Springer: New York, NY, USA, 2019; pp. 43–59. [Google Scholar]
- Davies, B.; Romanowska, I.; Harris, K.; Crabtree, S.A. Combining Geographic Information Systems and Agent-Based Models in Archaeology: Part 2 of 3. Adv. Archaeol. Pract. 2019, 7, 185–193. [Google Scholar] [CrossRef] [Green Version]
- Koomen, E.; Loonen, W.; Hilferink, M. Climate-Change Adaptations in Land-Use Planning. A Scenario-Based Approach. In The European Information Society; Bernard, L., Friis-Christensen, A., Pundt, H., Eds.; Lecture Notes in Geoinformation and Cartography; Springer: Berlin/Heidelberg, Germany, 2008; pp. 261–282. ISBN 978-3-540-78945-1. [Google Scholar]
- Lavalle, C.; Baranzelli, C.; e Silva, F.B.; Mubareka, S.; Gomes, C.R.; Koomen, E.; Hilferink, M. A High Resolution Land Use/Cover Modelling Framework for Europe: Introducing the EU-ClueScanner100 Model. In Computational Science and Its Applications—ICCSA 2011; Murgante, B., Gervasi, O., Iglesias, A., Taniar, D., Apduhan, B.O., Eds.; Lecture Notes in Computer Science; Springer: Berlin/Heidelberg, Germany, 2011; Volume 6782, pp. 60–75. ISBN 978-3-642-21927-6. [Google Scholar]
- Groot, M.; Kooistra, L.I. Land Use and Agrarian Economy in the Roman Dutch River Area. Internet Archaeol. 2009, 27. [Google Scholar] [CrossRef]
- De Hingh, A.E. Food Production and Food Procurement in the Bronze Age and Early Iron Age (2000-500 BC): The Organisation of a Diversified and Intensified Agrarian System in the Meuse-Demer-Scheldt Region (The Netherlands and Belgium) and the Region of the River Moselle (Luxemburg and France); Archaeological Studies Leiden University, Faculty of Archaeology, Leiden University: Leiden, The Netherlands, 2000; ISBN 978-90-76368-07-8. [Google Scholar]
- Kooistra, L.I. Borderland Farming: Possibilities and Limitations of Farming in the Roman Period and Early Middle Ages between the Rhine and Meuse; Van Gorcum: Assen, The Netherlands, 1996; ISBN 978-90-232-3199-8. [Google Scholar]
- Boserup, E. Conditions of Agricultural Growth; G. Allen and Unwin: London, UK, 1965. [Google Scholar]
- Ellis, F. Peasant Economics: Farm Households and Agrarian Developoment, 2nd ed.; Wye Studies in Agricultural and Rural Development; Cambridge University Press: Cambridge, UK; New York, NY, USA, 1993; ISBN 978-0-521-45711-8. [Google Scholar]
- Groot, M. Surplus production of animal products for the Roman army in rural settlement in the Dutch river area. In Feeding the Roman Army: The Archaeology of Production and Supply in NW Europe; Stallibrass, S., Thomas, R., Eds.; Oxbow Books: Oxford, UK, 2008; pp. 83–98. ISBN 978-1-84217-323-7. [Google Scholar]
- Groot, M. Livestock for Sale: Animal Husbandry in a Roman Frontier Zone: The Case Study of the Civitas Batavorum; Amsterdam Archaeological Studies; Amsterdam University Press: Amsterdam, The Netherlands, 2016; ISBN 978-94-6298-080-8. [Google Scholar]
- Baum, T. Simulating Land Use of Prehistoric Wetland Settlements: Did Excessive Resource Use Necessitate a Highly Dynamic Settlement System? In Simulating Prehistoric and Ancient Worlds; Barceló, J.A., del Castillo, F., Eds.; Computational Social Sciences; Springer: Cham, Switzerland, 2016; pp. 255–280. [Google Scholar]
- Baum, T.; Mainberger, M.; Taylor, T.; Tinner, W.; Hafner, A.; Ebersbach, R. How Many, How Far? Quantitative Models of Neolithic Land Use for Six Wetland Sites on the Northern Alpine Forelands between 4300 and 3700 Bc. Veg. Hist. Archaeobotany 2020, 29, 621–639. [Google Scholar] [CrossRef]
- Verhagen, P.; Joyce, J.; Groenhuijzen, M.R. Finding the Limits of the Limes: Setting the Scene. In Finding the Limits of the Limes; Verhagen, P., Joyce, J., Groenhuijzen, M.R., Eds.; Computational Social Sciences; Springer International Publishing: Cham, Switzerland, 2019; pp. 1–19. ISBN 978-3-030-04575-3. [Google Scholar]
- Grimm, V.; Berger, U.; Bastiansen, F.; Eliassen, S.; Ginot, V.; Giske, J.; Goss-Custard, J.; Grand, T.; Heinz, S.K.; Huse, G.; et al. A Standard Protocol for Describing Individual-Based and Agent-Based Models. Ecol. Model. 2006, 198, 115–126. [Google Scholar] [CrossRef]
- Grimm, V.; Berger, U.; DeAngelis, D.L.; Polhill, J.G.; Giske, J.; Railsback, S.F. The ODD Protocol: A Review and First Update. Ecol. Model. 2010, 221, 2760–2768. [Google Scholar] [CrossRef] [Green Version]
- Grimm, V.; Railsback, S.F.; Vincenot, C.E.; Berger, U.; Gallagher, C.; DeAngelis, D.L.; Edmonds, B.; Ge, J.; Giske, J.; Groeneveld, J.; et al. The ODD Protocol for Describing Agent-Based and Other Simulation Models: A Second Update to Improve Clarity, Replication, and Structural Realism. J. Artif. Soc. Soc. Simul. 2020, 23, 7. [Google Scholar] [CrossRef] [Green Version]
- Müller, B.; Bohn, F.; Dreßler, G.; Groeneveld, J.; Klassert, C.; Martin, R.; Schlüter, M.; Schulze, J.; Weise, H.; Schwarz, N. Describing Human Decisions in Agent-Based Models–ODD + D, an Extension of the ODD Protocol. Environ. Model. Softw. 2013, 48, 37–48. [Google Scholar] [CrossRef]
- Weijgertse, S. What Is in the Black Box? Assessing the Equivalence of Different Algorithms from Similar Model Components in Archaeological Agent-Based Land-Use Models; University of Leiden: Leiden, The Netherlands, 2020. [Google Scholar]
- Deeben, J.; Groenewoudt, B.J.; Hallewas, D.P.; van Rooijen, C.A.M.; Zoetbrood, P.A.M. In Search of the Archaeological Resource. Ber. Van Rijksd. Voor Het Oudheidkd. Bodemonderz. 2006, 46, 113–126. [Google Scholar]
- Gilbert, N.; Troitszch, K.G. Simulation for the Social Scientist; Open University Press: Bristol, PA, USA, 2005; ISBN 978-0-335-21600-0. [Google Scholar]
- Klein Goldewijk, K.; Beusen, A.; Van Drecht, G.; De Vos, M. The HYDE 3.1 Spatially Explicit Database of Human-Induced Global Land-Use Change over the Past 12,000 Years: HYDE 3.1 Holocene Land Use. Glob. Ecol. Biogeogr. 2011, 20, 73–86. [Google Scholar] [CrossRef]
- Kaplan, J.O. Integrated Modeling of Holocene Land Cover Change in Europe. Quat. Int. 2012, 279–280, 235–236. [Google Scholar] [CrossRef]
- Dermody, B.; van Beek, R.P.H.; Meeks, E.; Klein Goldewijk, K.; Scheidel, W.; van der Velde, Y.; Bierkens, M.F.P.; Wassen, M.J.; Dekker, S.C. A Virtual Water Network of the Roman World. Hydrol. Earth Syst. Sci. 2014, 18, 5025–5040. [Google Scholar] [CrossRef] [Green Version]
- Romanowska, I.; Gamble, C.; Bullock, S.; Sturt, F. Dispersal and the Movius Line: Testing the Effect of Dispersal on Population Density through Simulation. Quat. Int. 2017, 431, 53–63. [Google Scholar] [CrossRef] [Green Version]
- Janssen, M.A. Understanding Artificial Anasazi. J. Artif. Soc. Soc. Simul. 2009, 12, 13. [Google Scholar]
Figure 1.
Paleogeographic reconstruction of the Dutch limes zone with Roman sites, after [5].
Figure 1.
Paleogeographic reconstruction of the Dutch limes zone with Roman sites, after [5].

Figure 2.
Schematized workflow in ROMFARMS, after [2].
Figure 2.
Schematized workflow in ROMFARMS, after [2].

Figure 3.
Paleogeographic reconstruction of the Dutch limes zoneshowing the location of 32 sub-regions used in ROMFARMS. After [2].
Figure 3.
Paleogeographic reconstruction of the Dutch limes zoneshowing the location of 32 sub-regions used in ROMFARMS. After [2].


Figure 5.
Realization of arable farming use according to different local production scenarios (in percentages) for 70 CE and 140 CE for the different sub regions. Source: [3].
Figure 5.
Realization of arable farming use according to different local production scenarios (in percentages) for 70 CE and 140 CE for the different sub regions. Source: [3].

Figure 6.
Percentage of total arable land available used per sub-region in scenarios with homogenous occupation by settlements with one (black) or five (grey) households using settlement densities from the Middle Roman Period A. Source: [2].
Figure 6.
Percentage of total arable land available used per sub-region in scenarios with homogenous occupation by settlements with one (black) or five (grey) households using settlement densities from the Middle Roman Period A. Source: [2].

Figure 7.
Percentage of grain demand per micro-region containing a castellum, castra and/or vicus and total macro-regional demand that can be fulfilled by supply in each micro-region from settlements with one (black) and five households (grey) during the Middle Roman Period A when demand was highest. Source: [3].


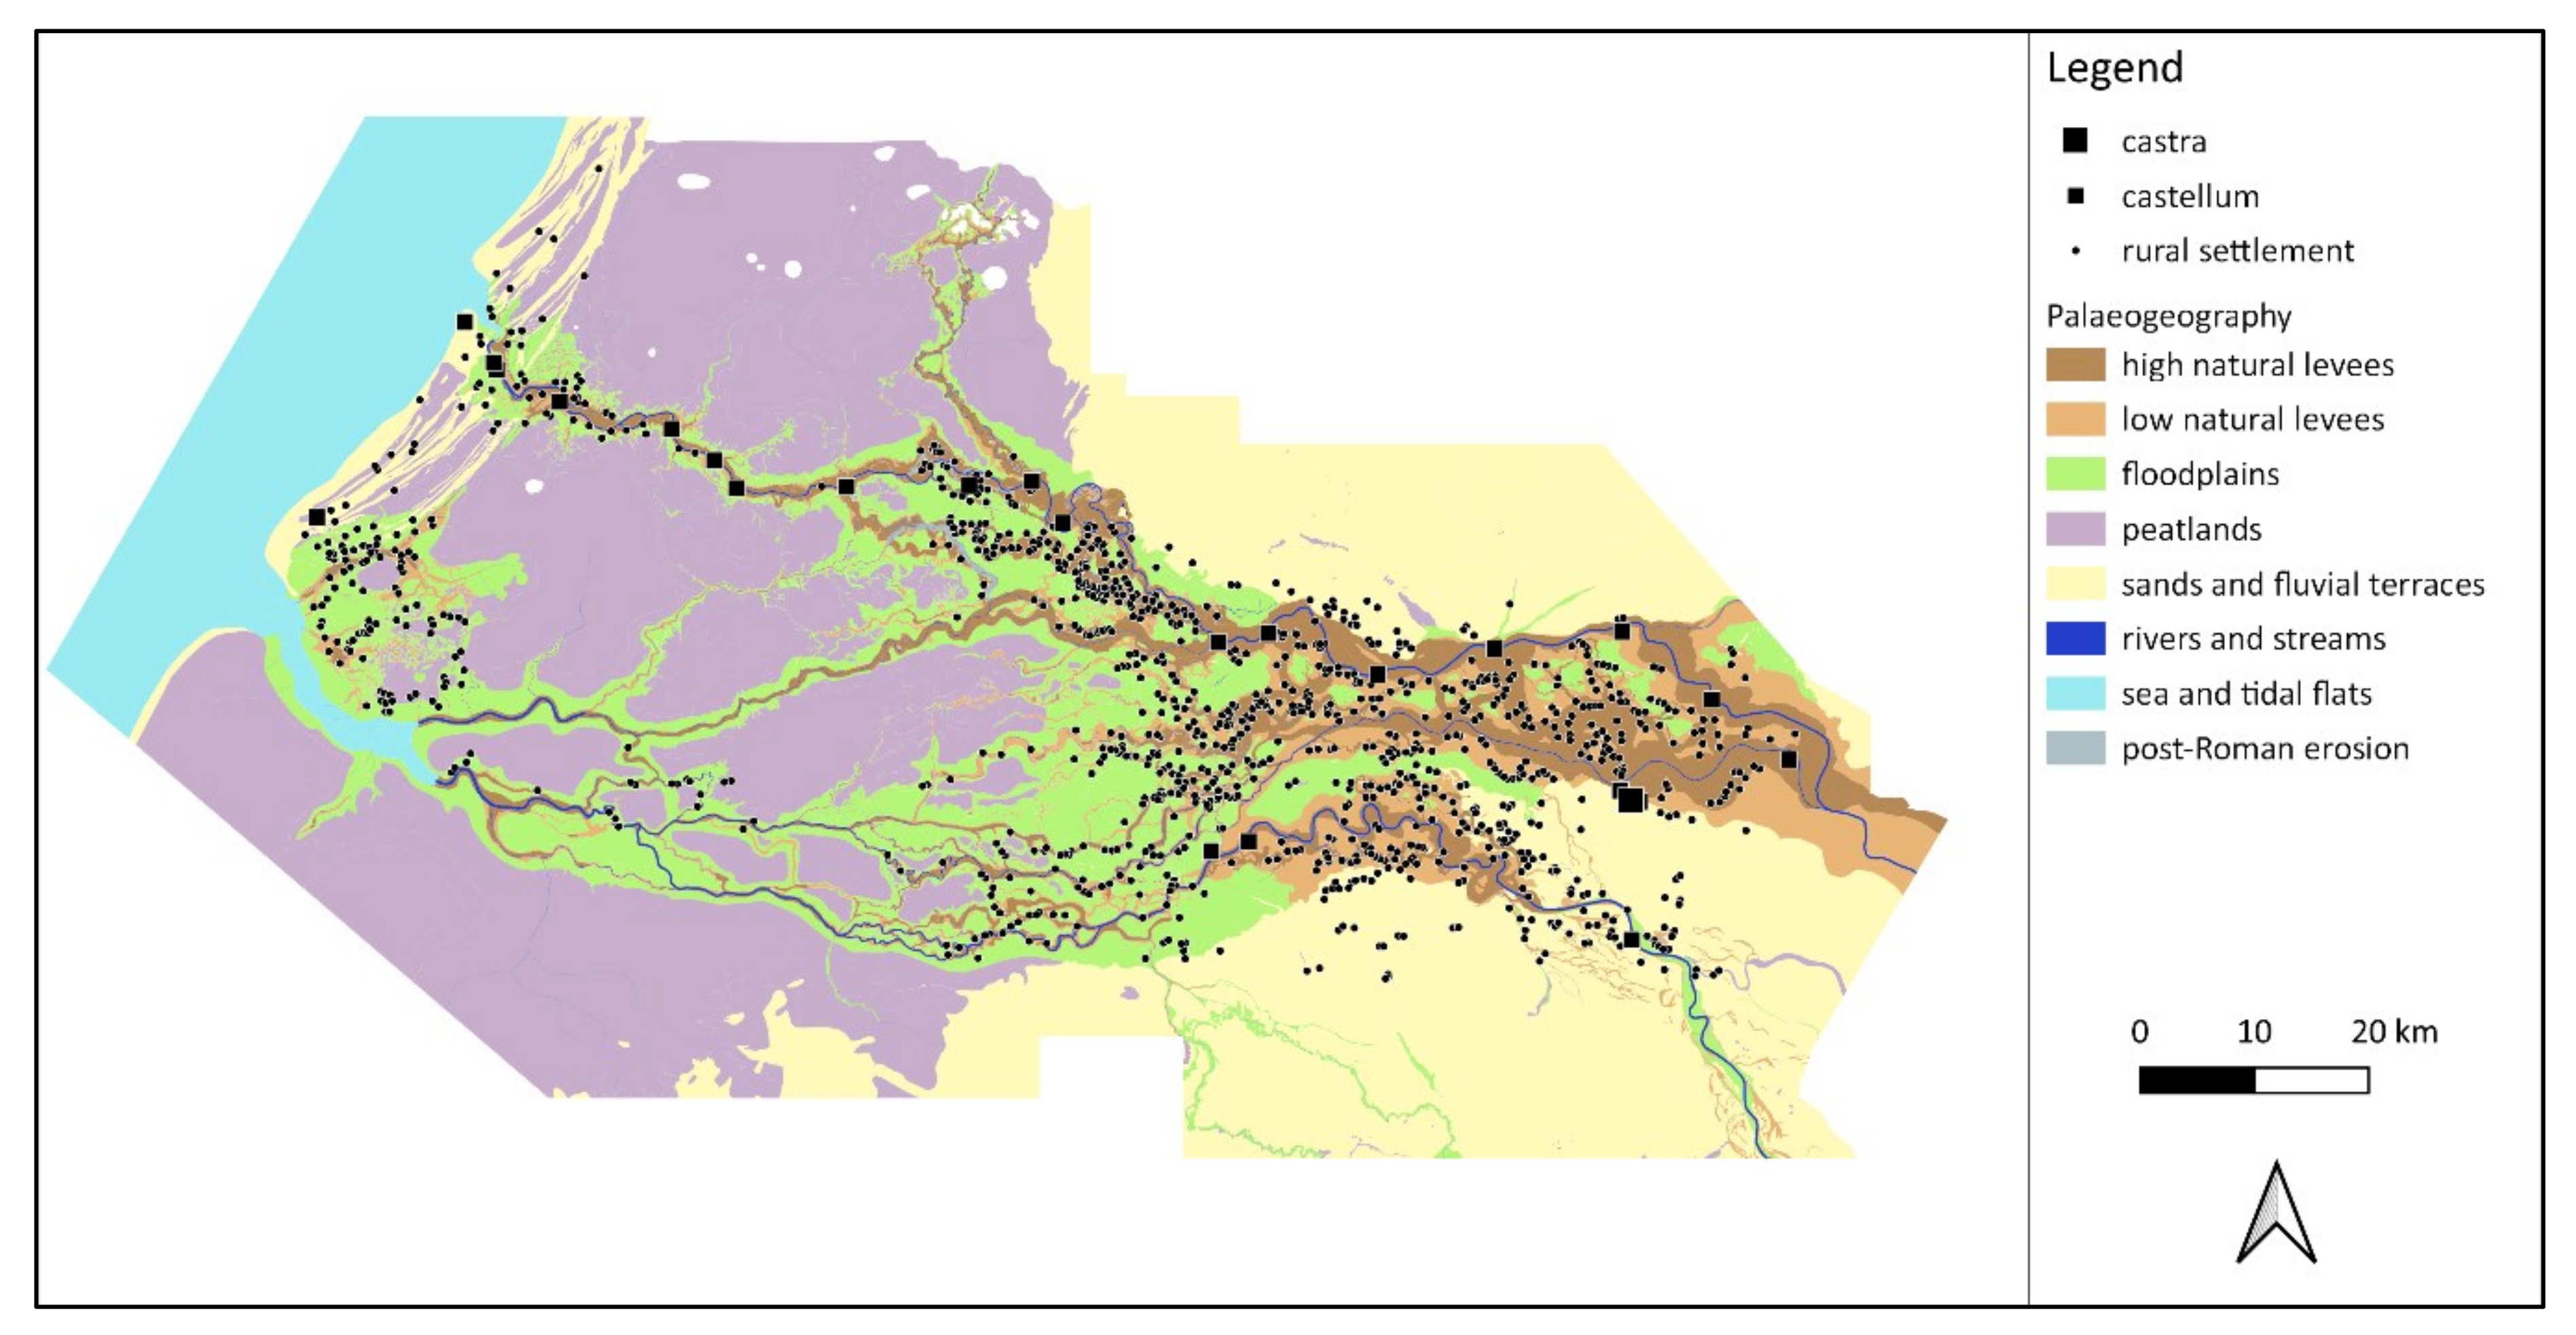
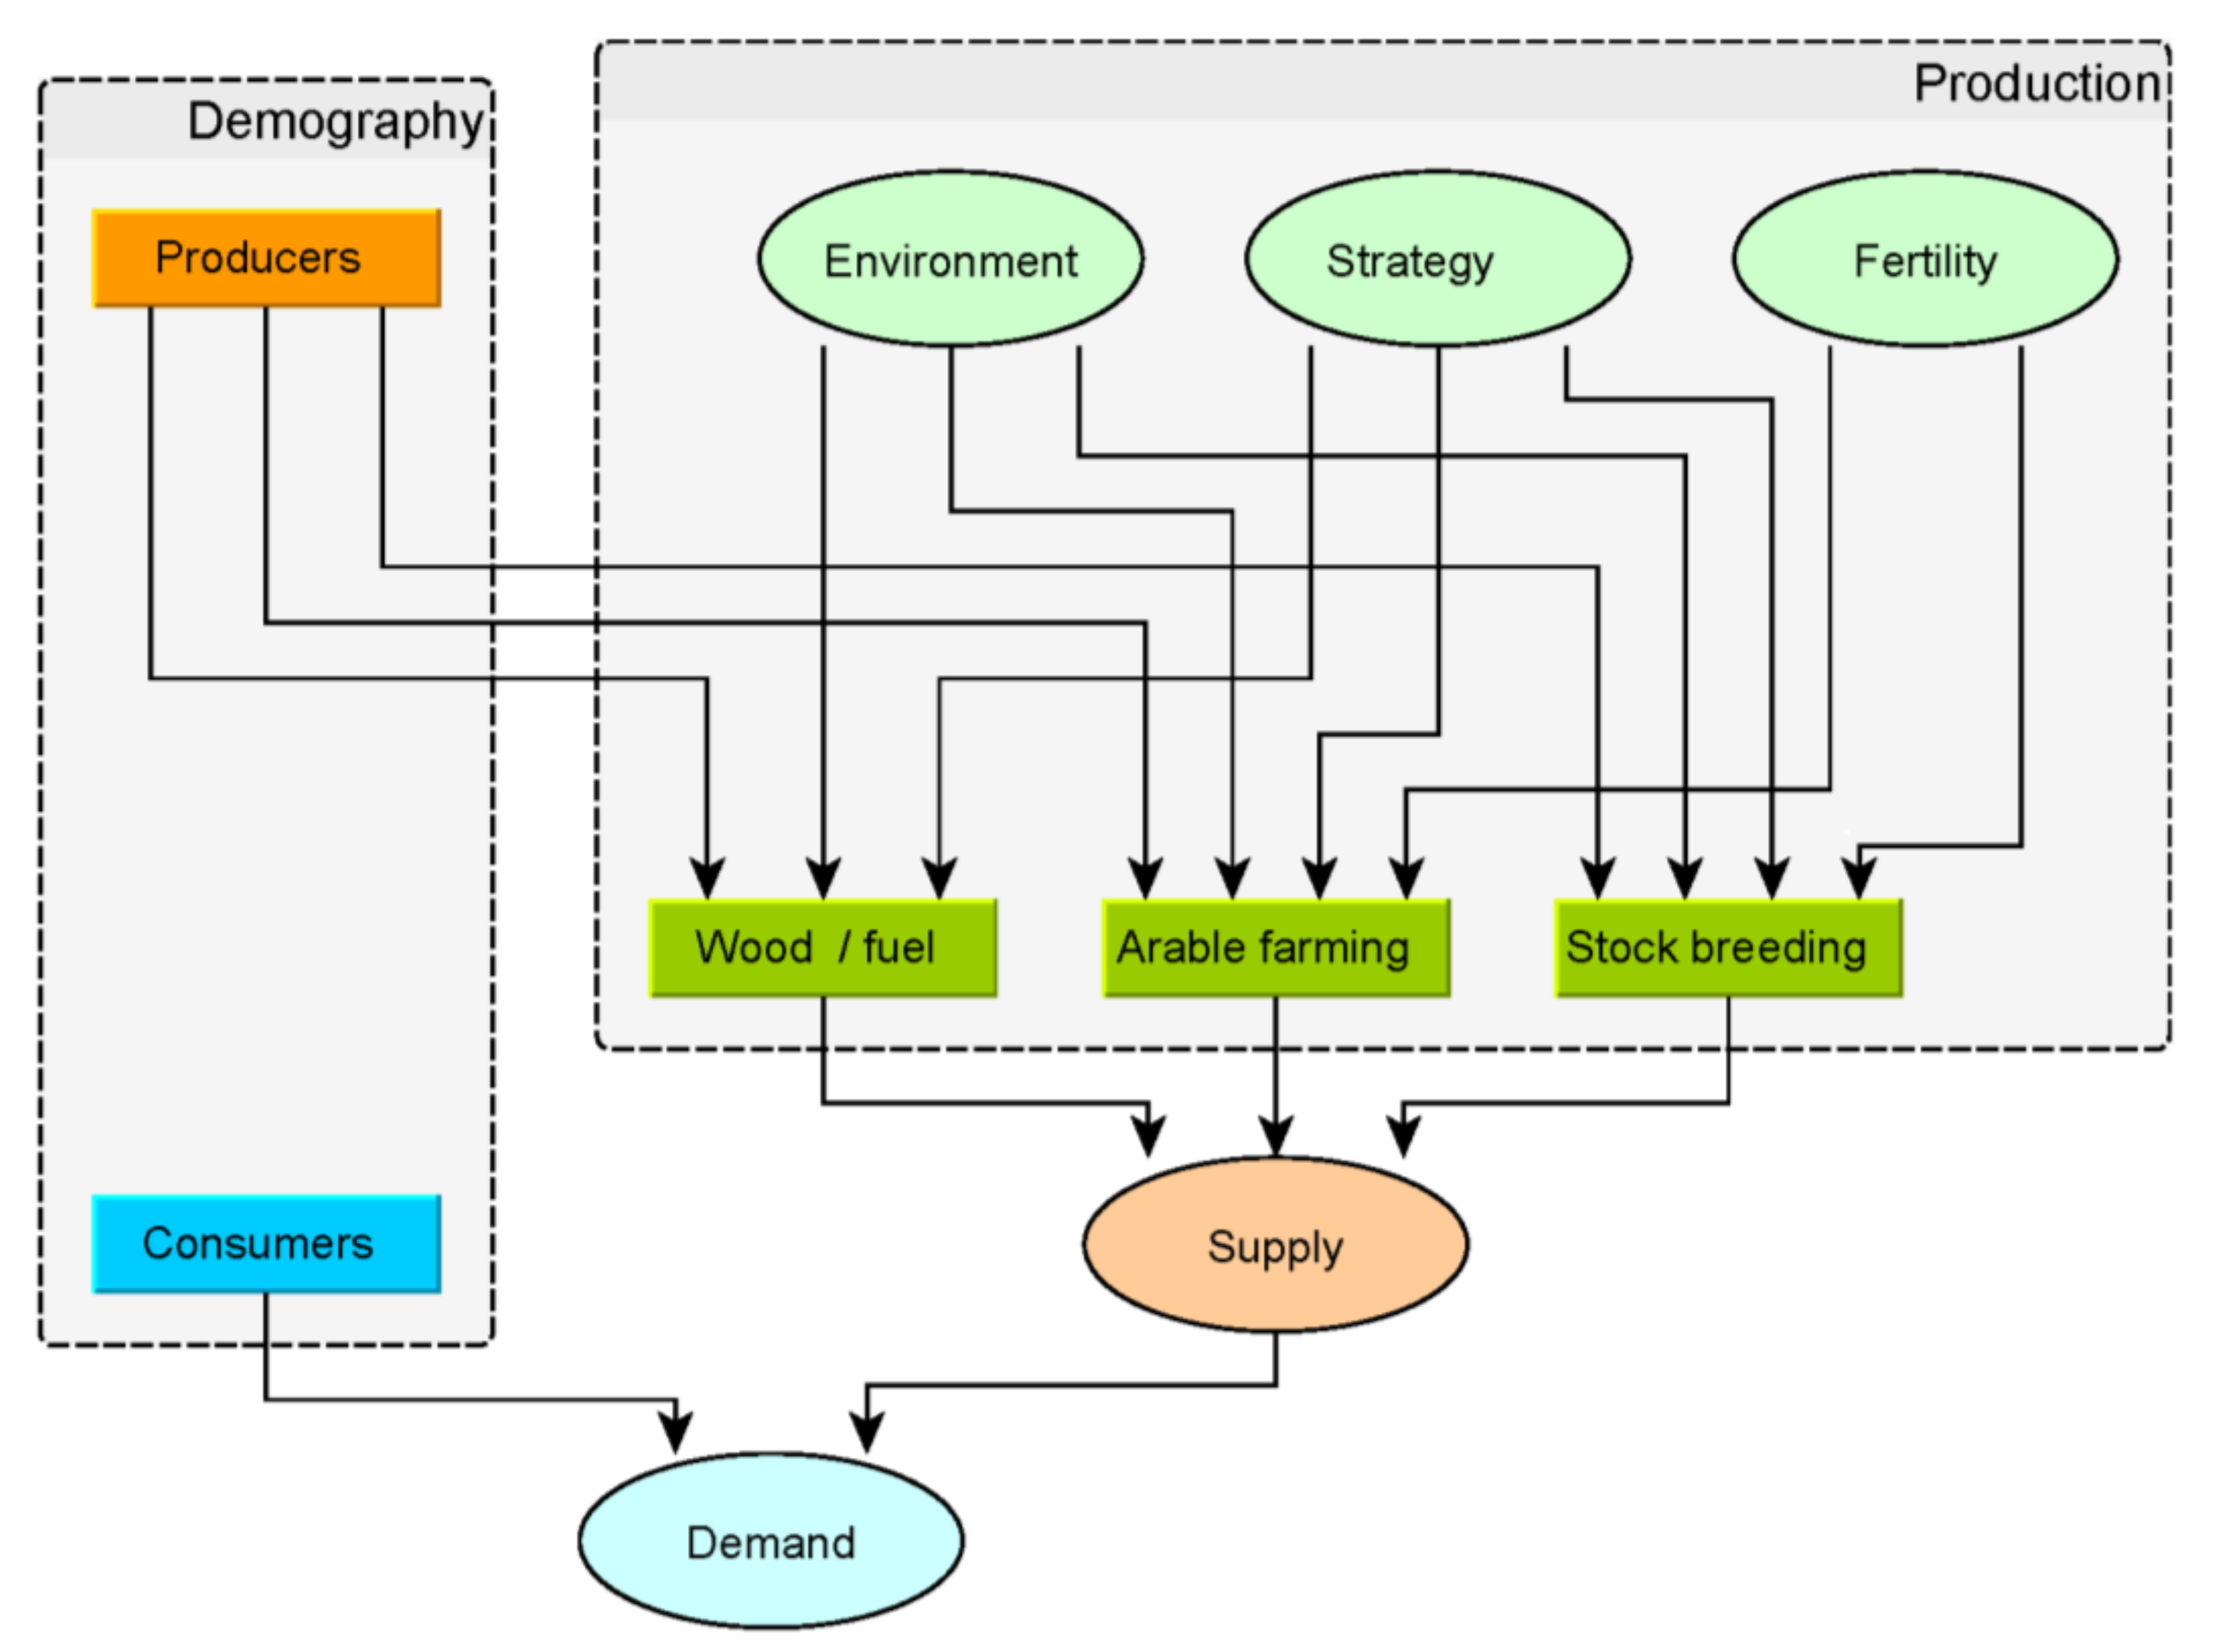
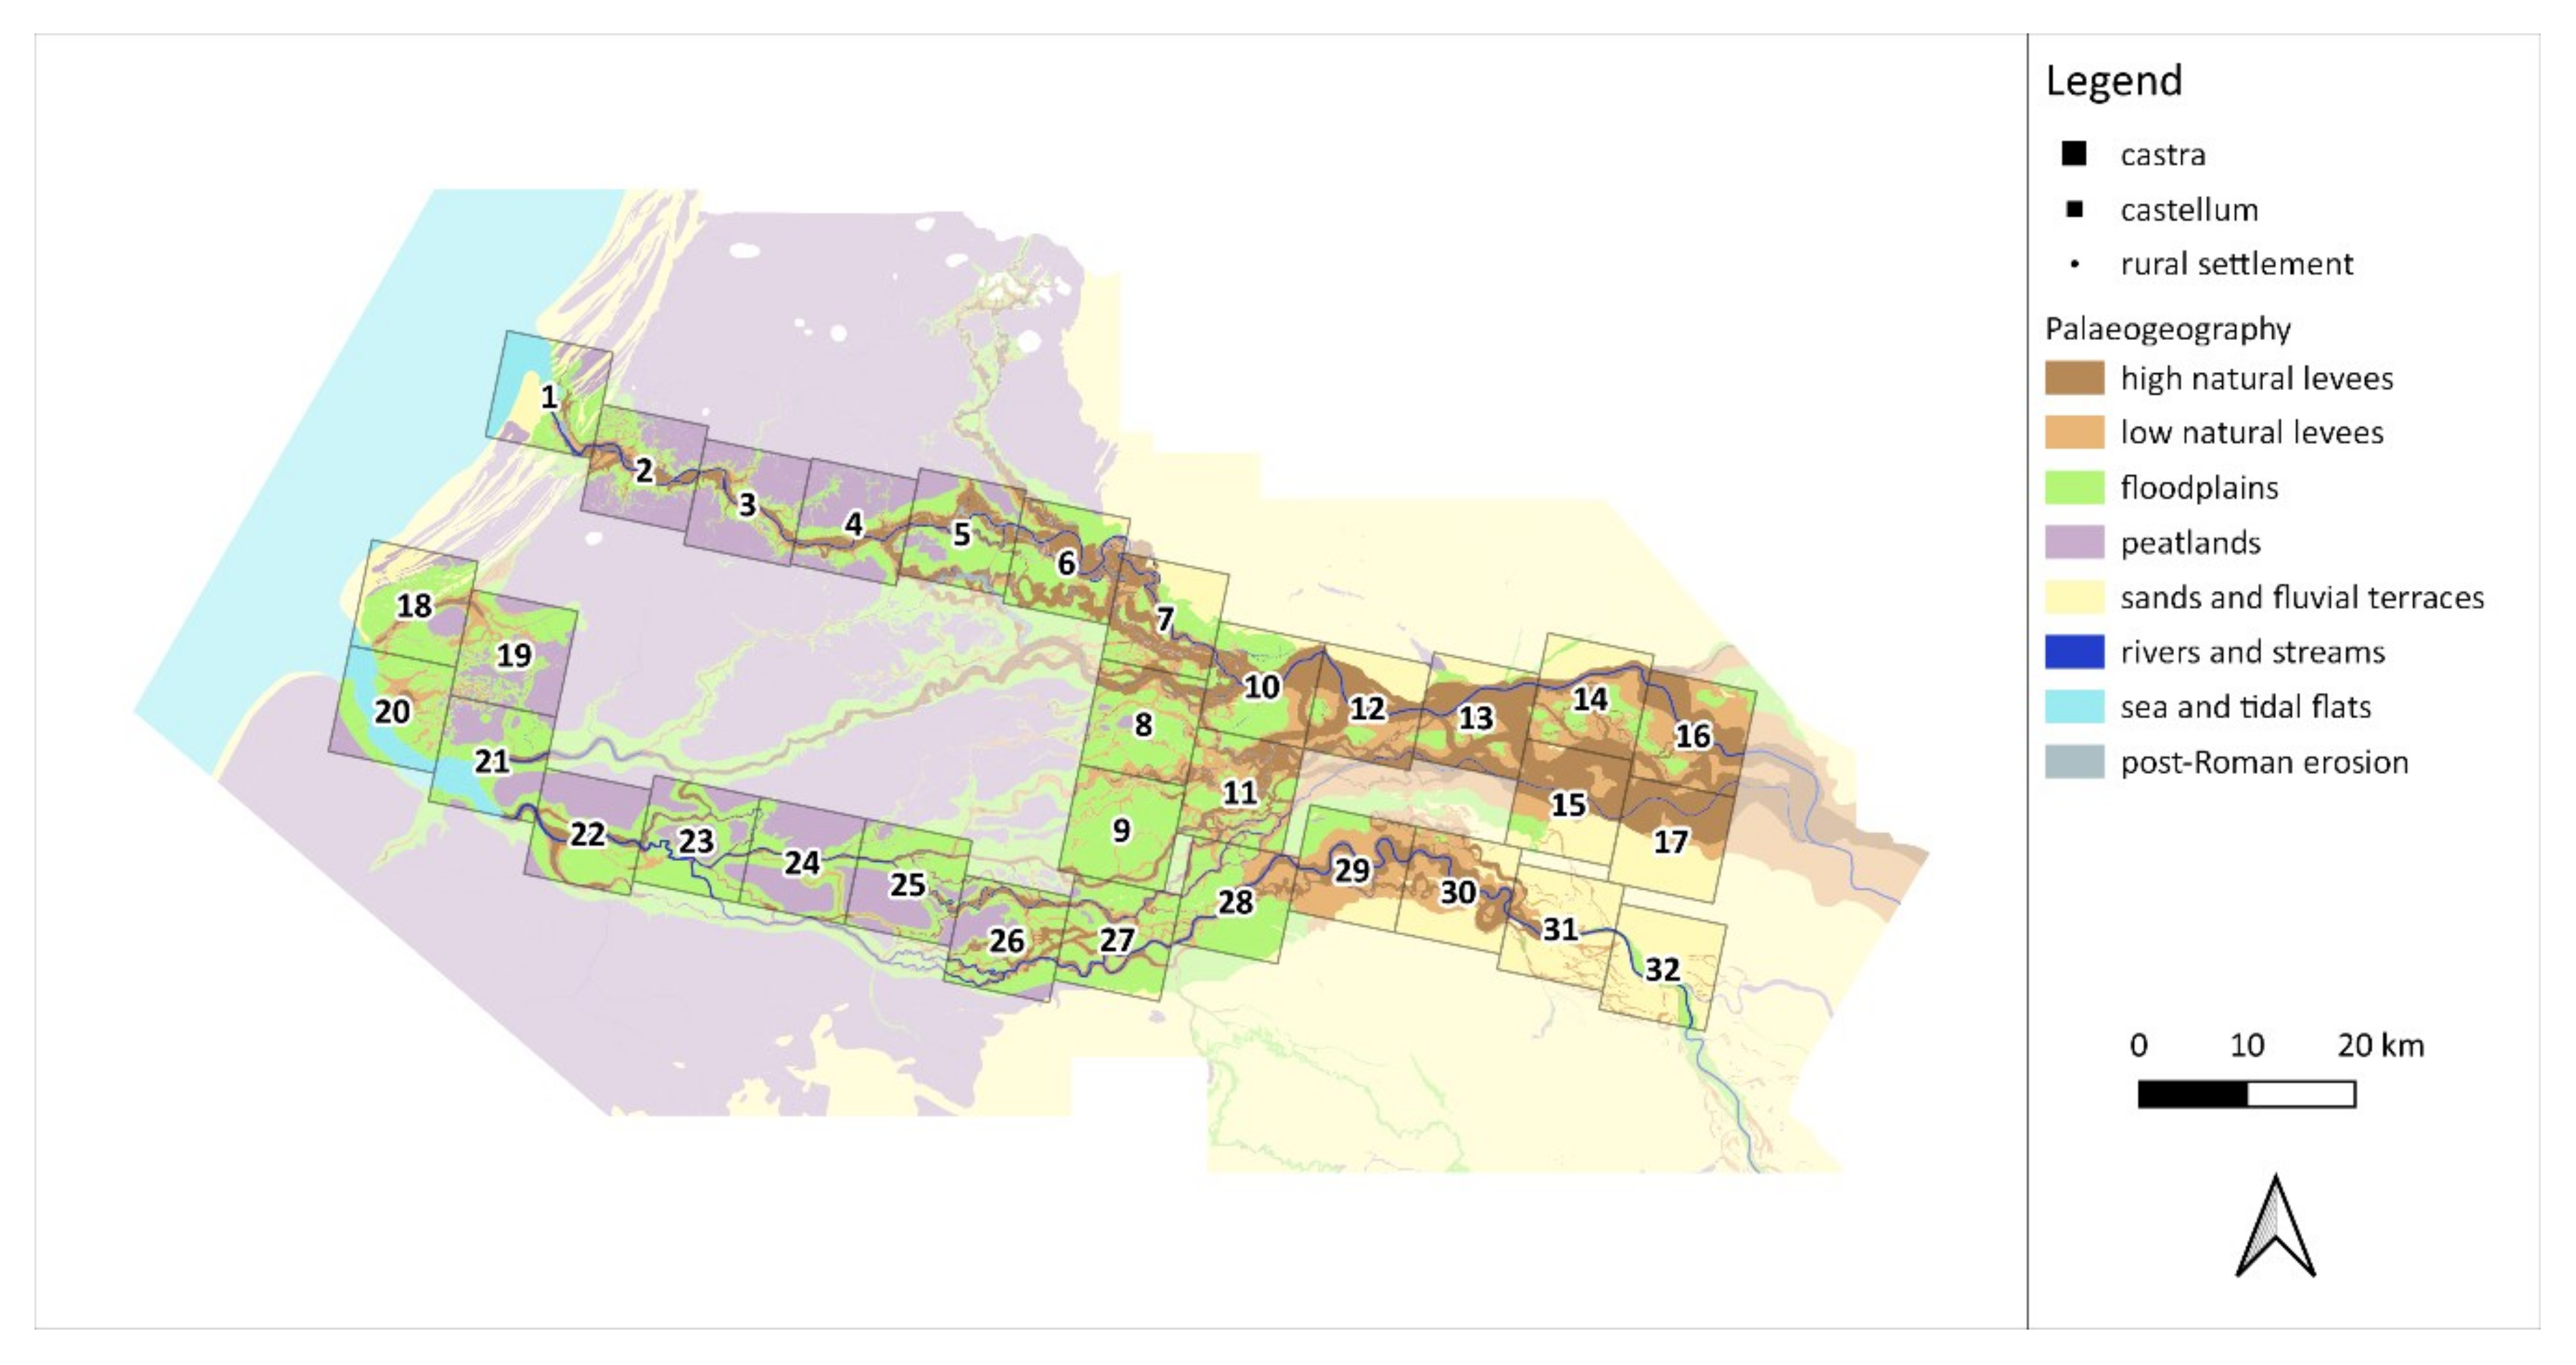
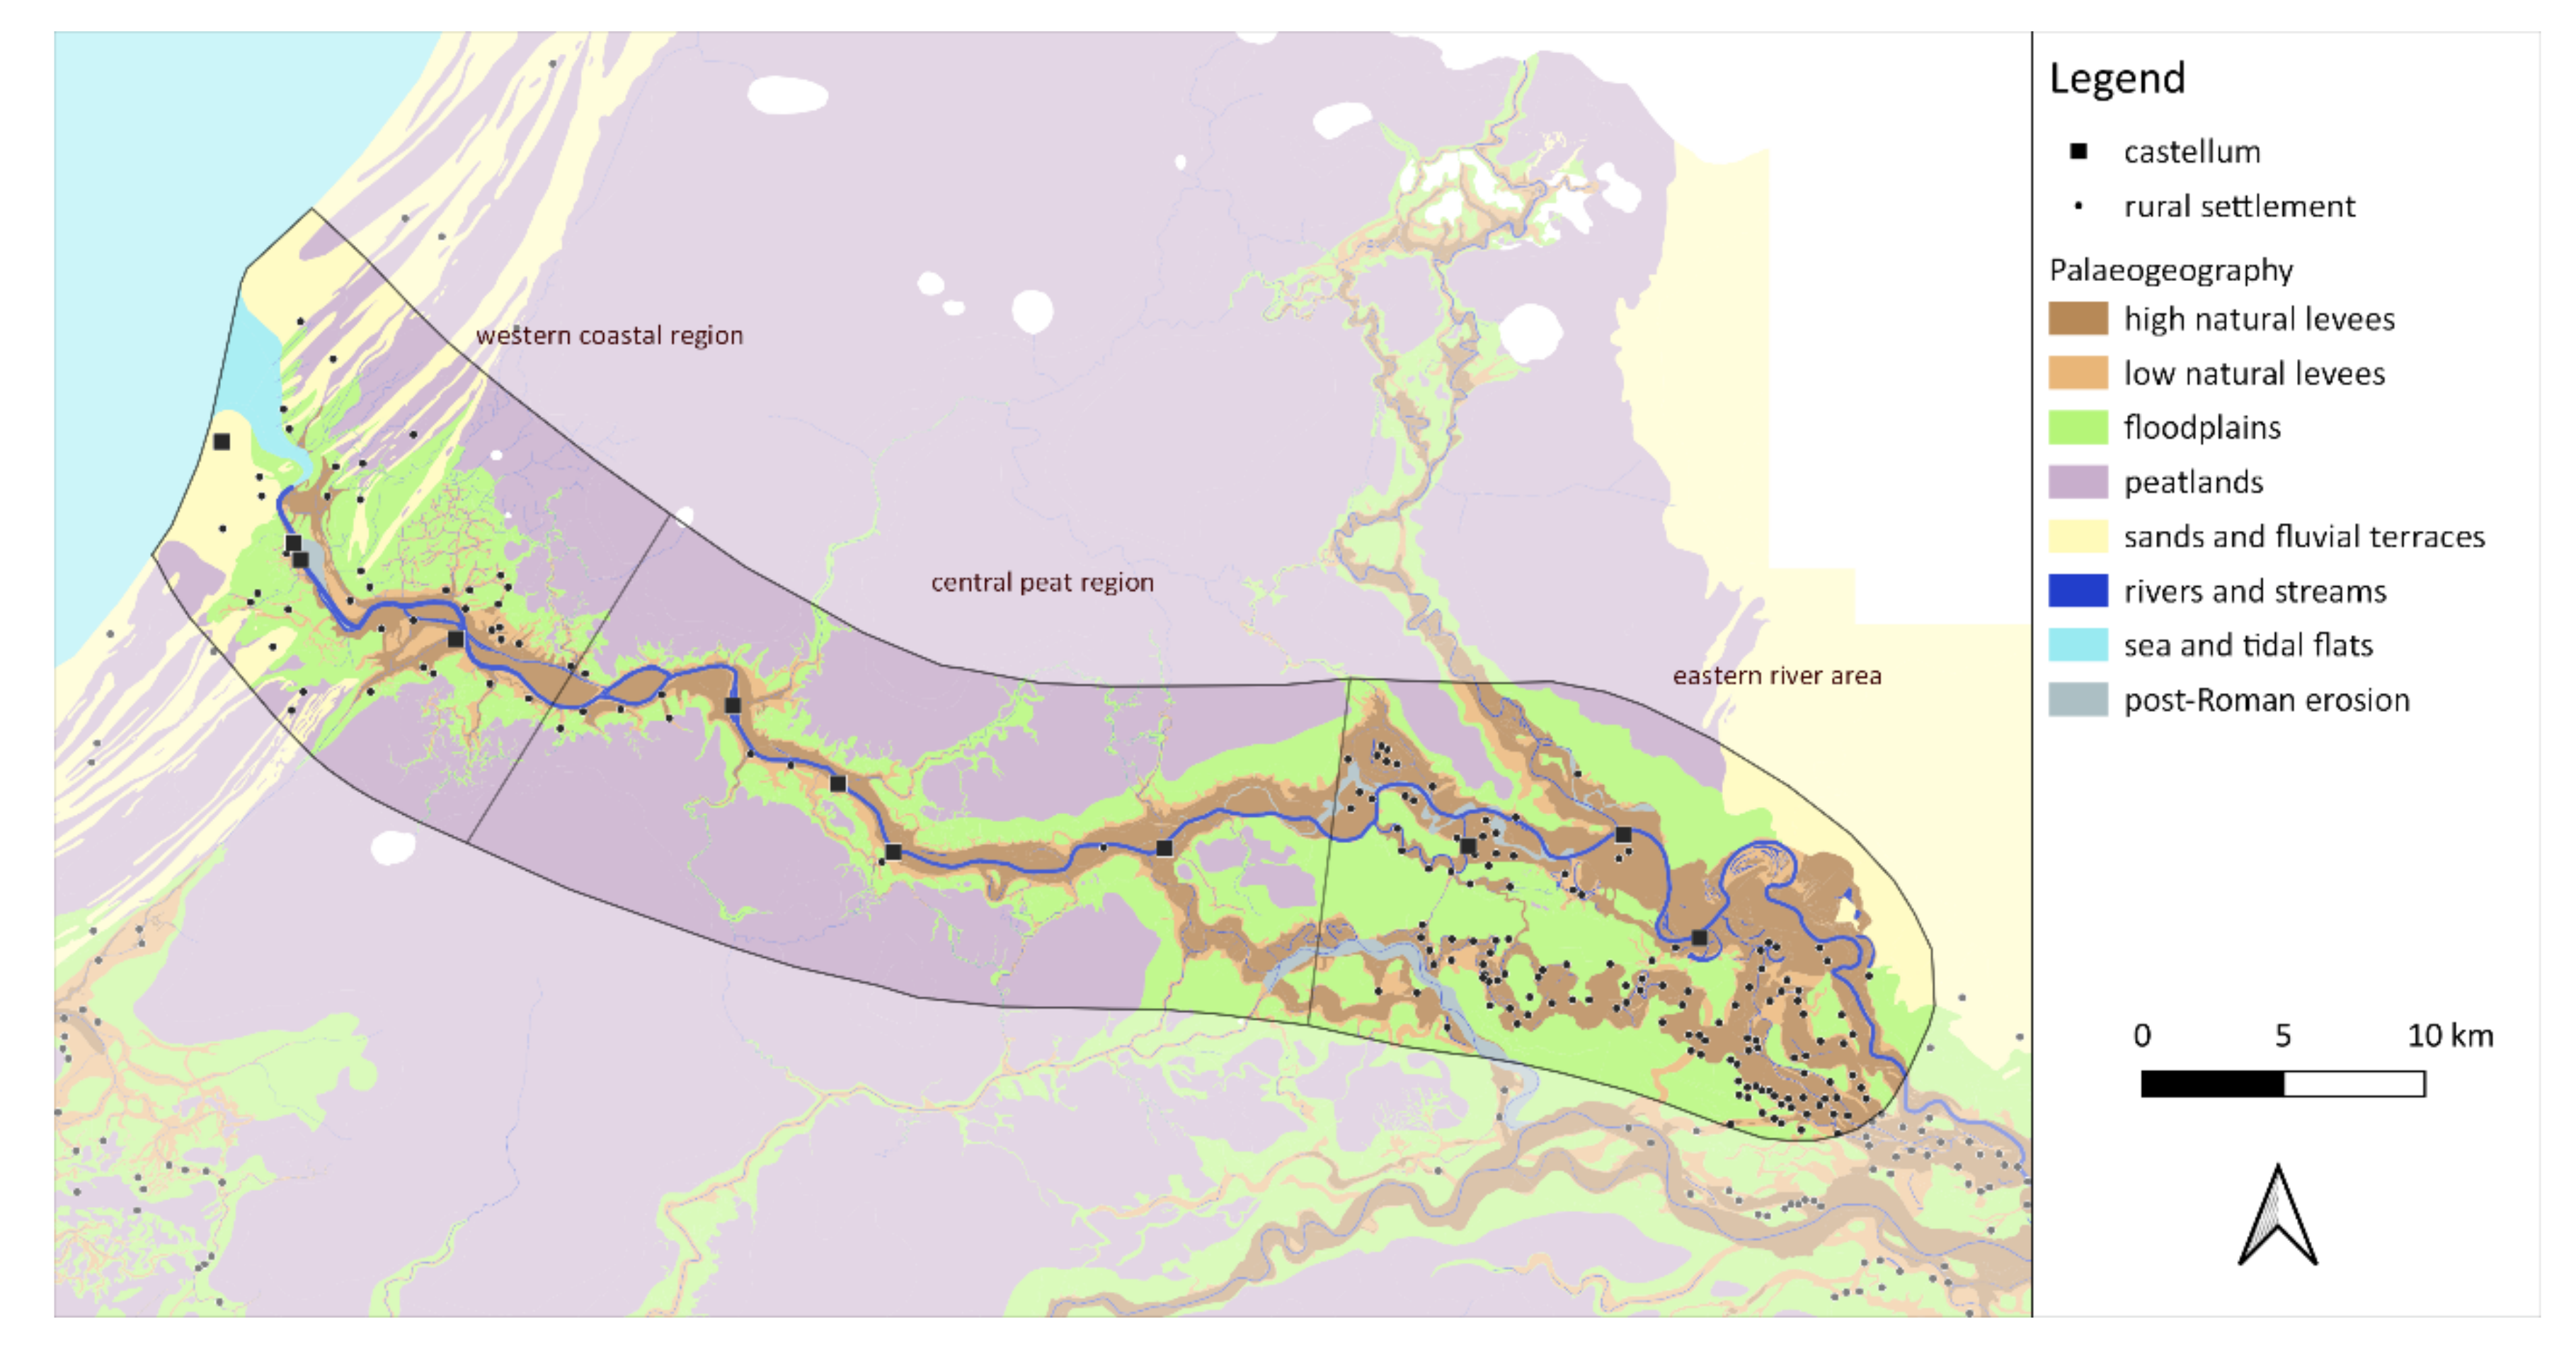
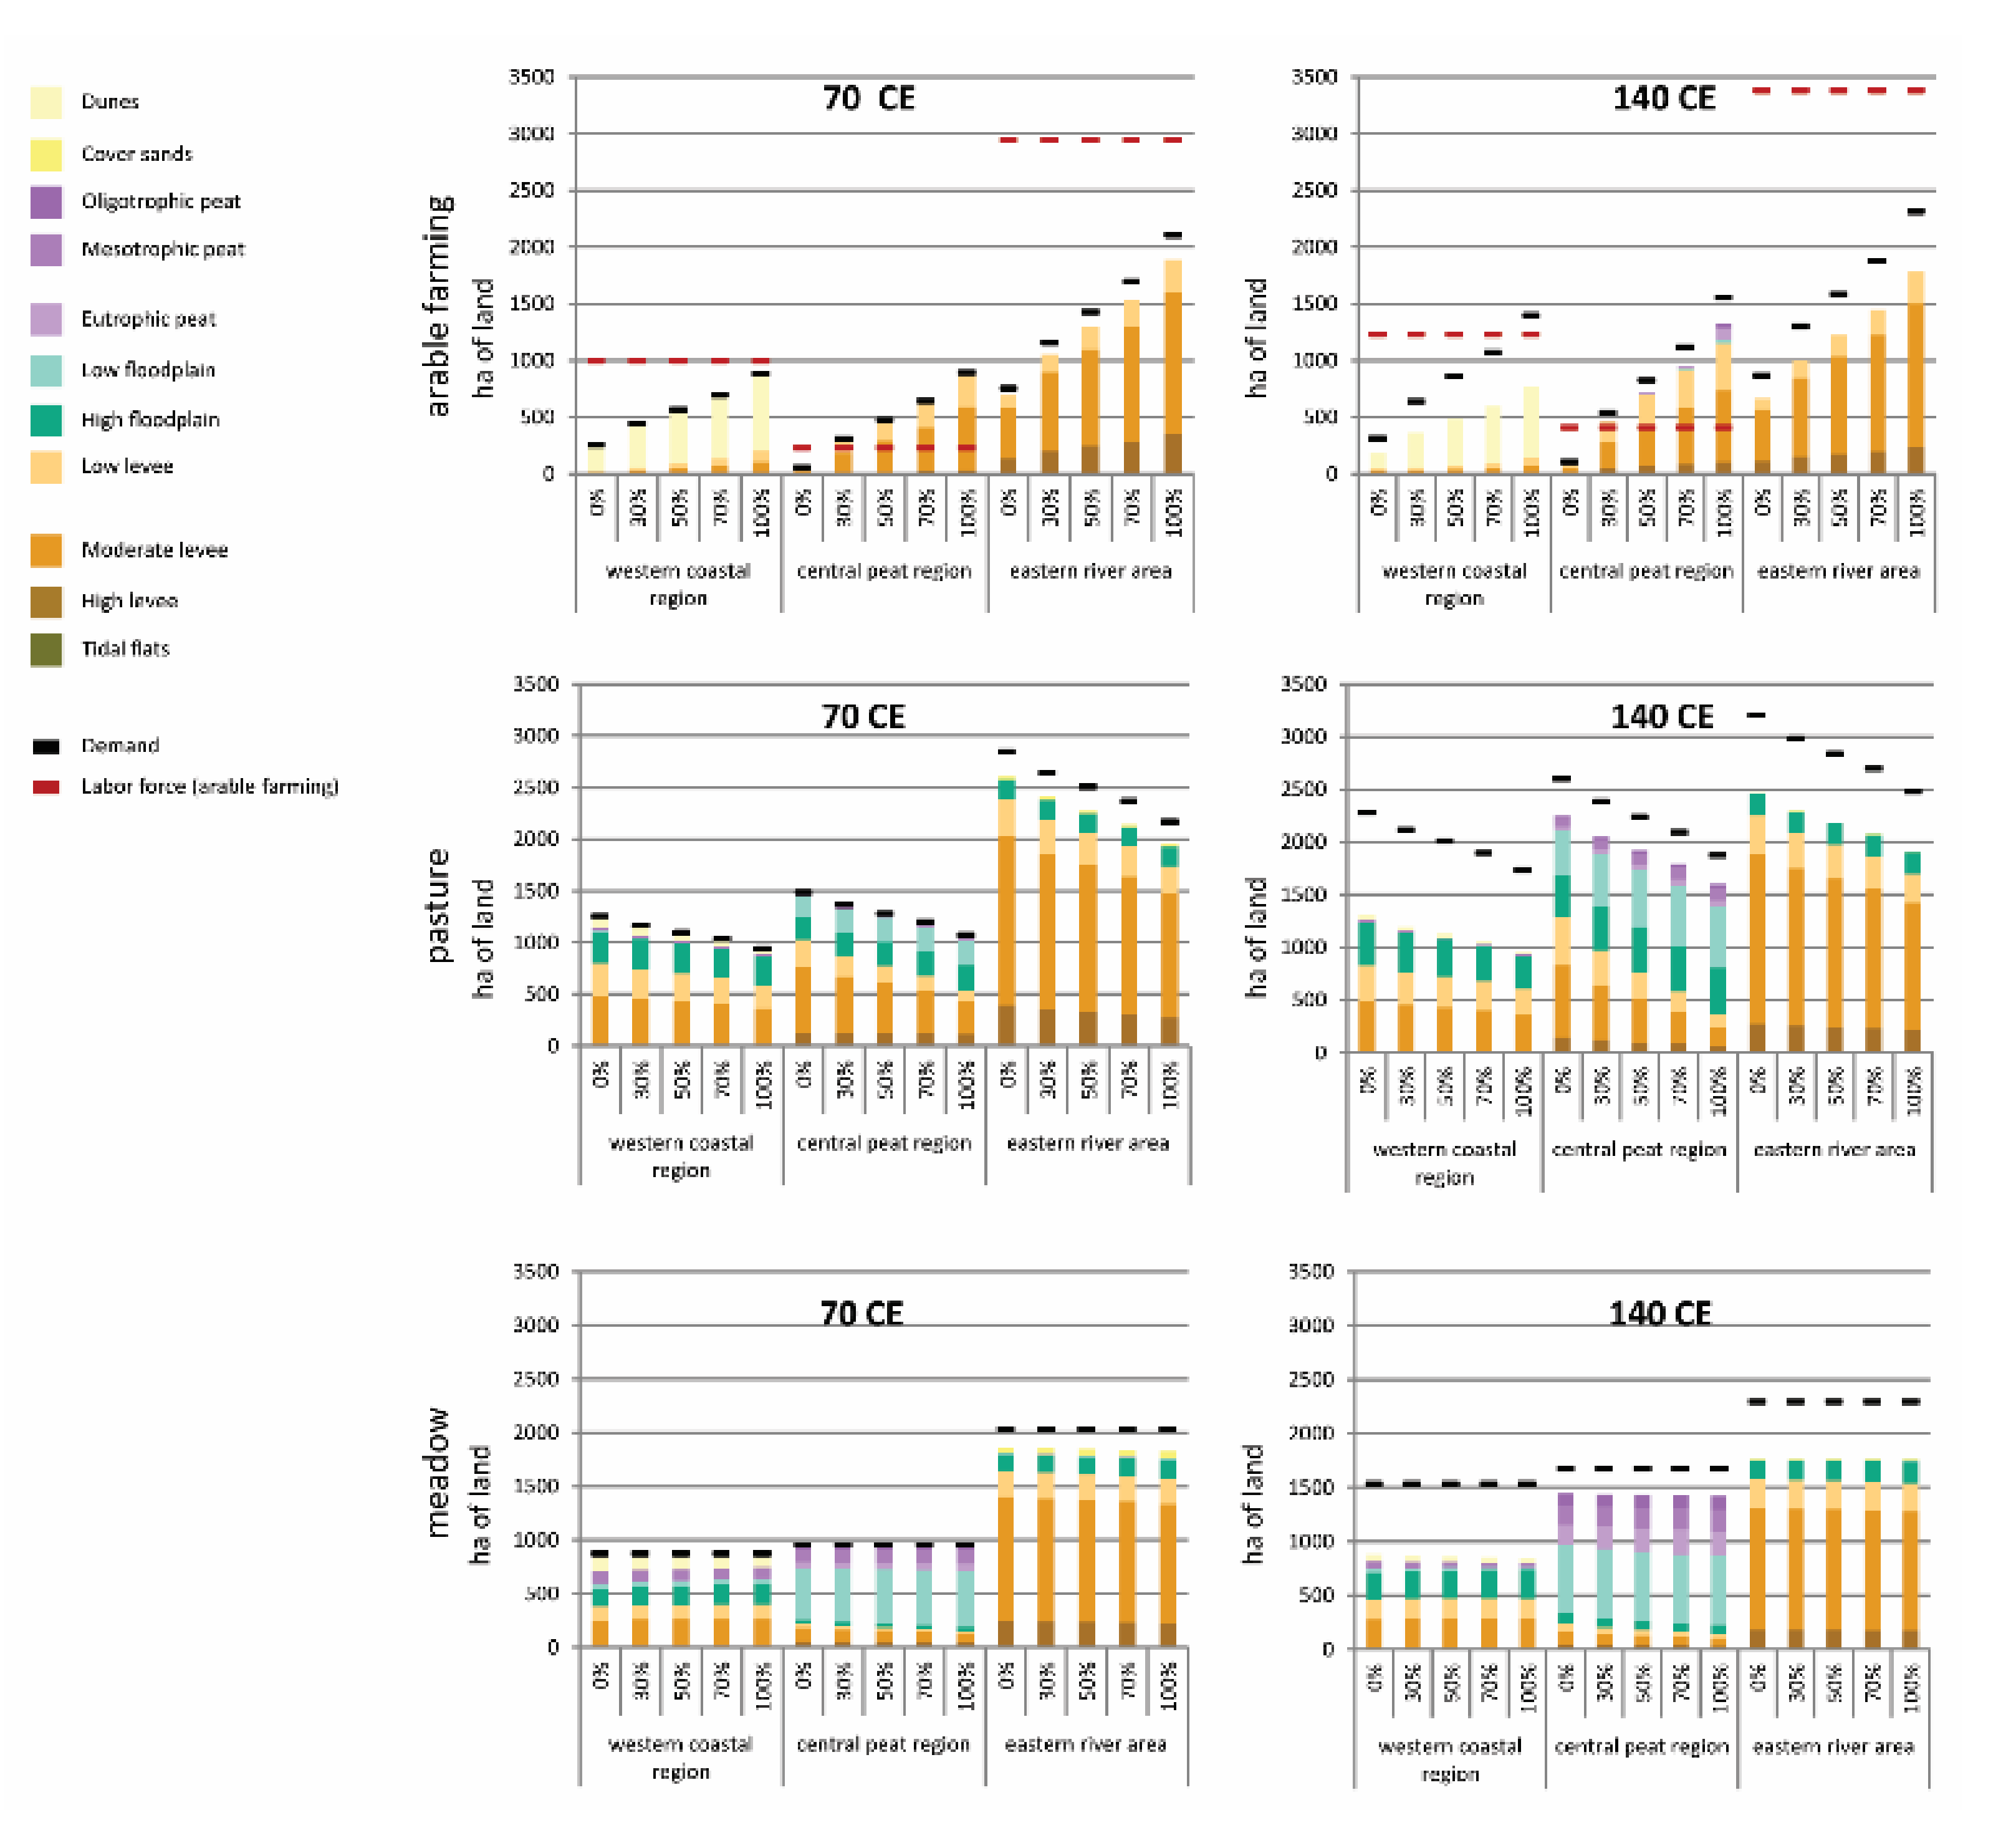
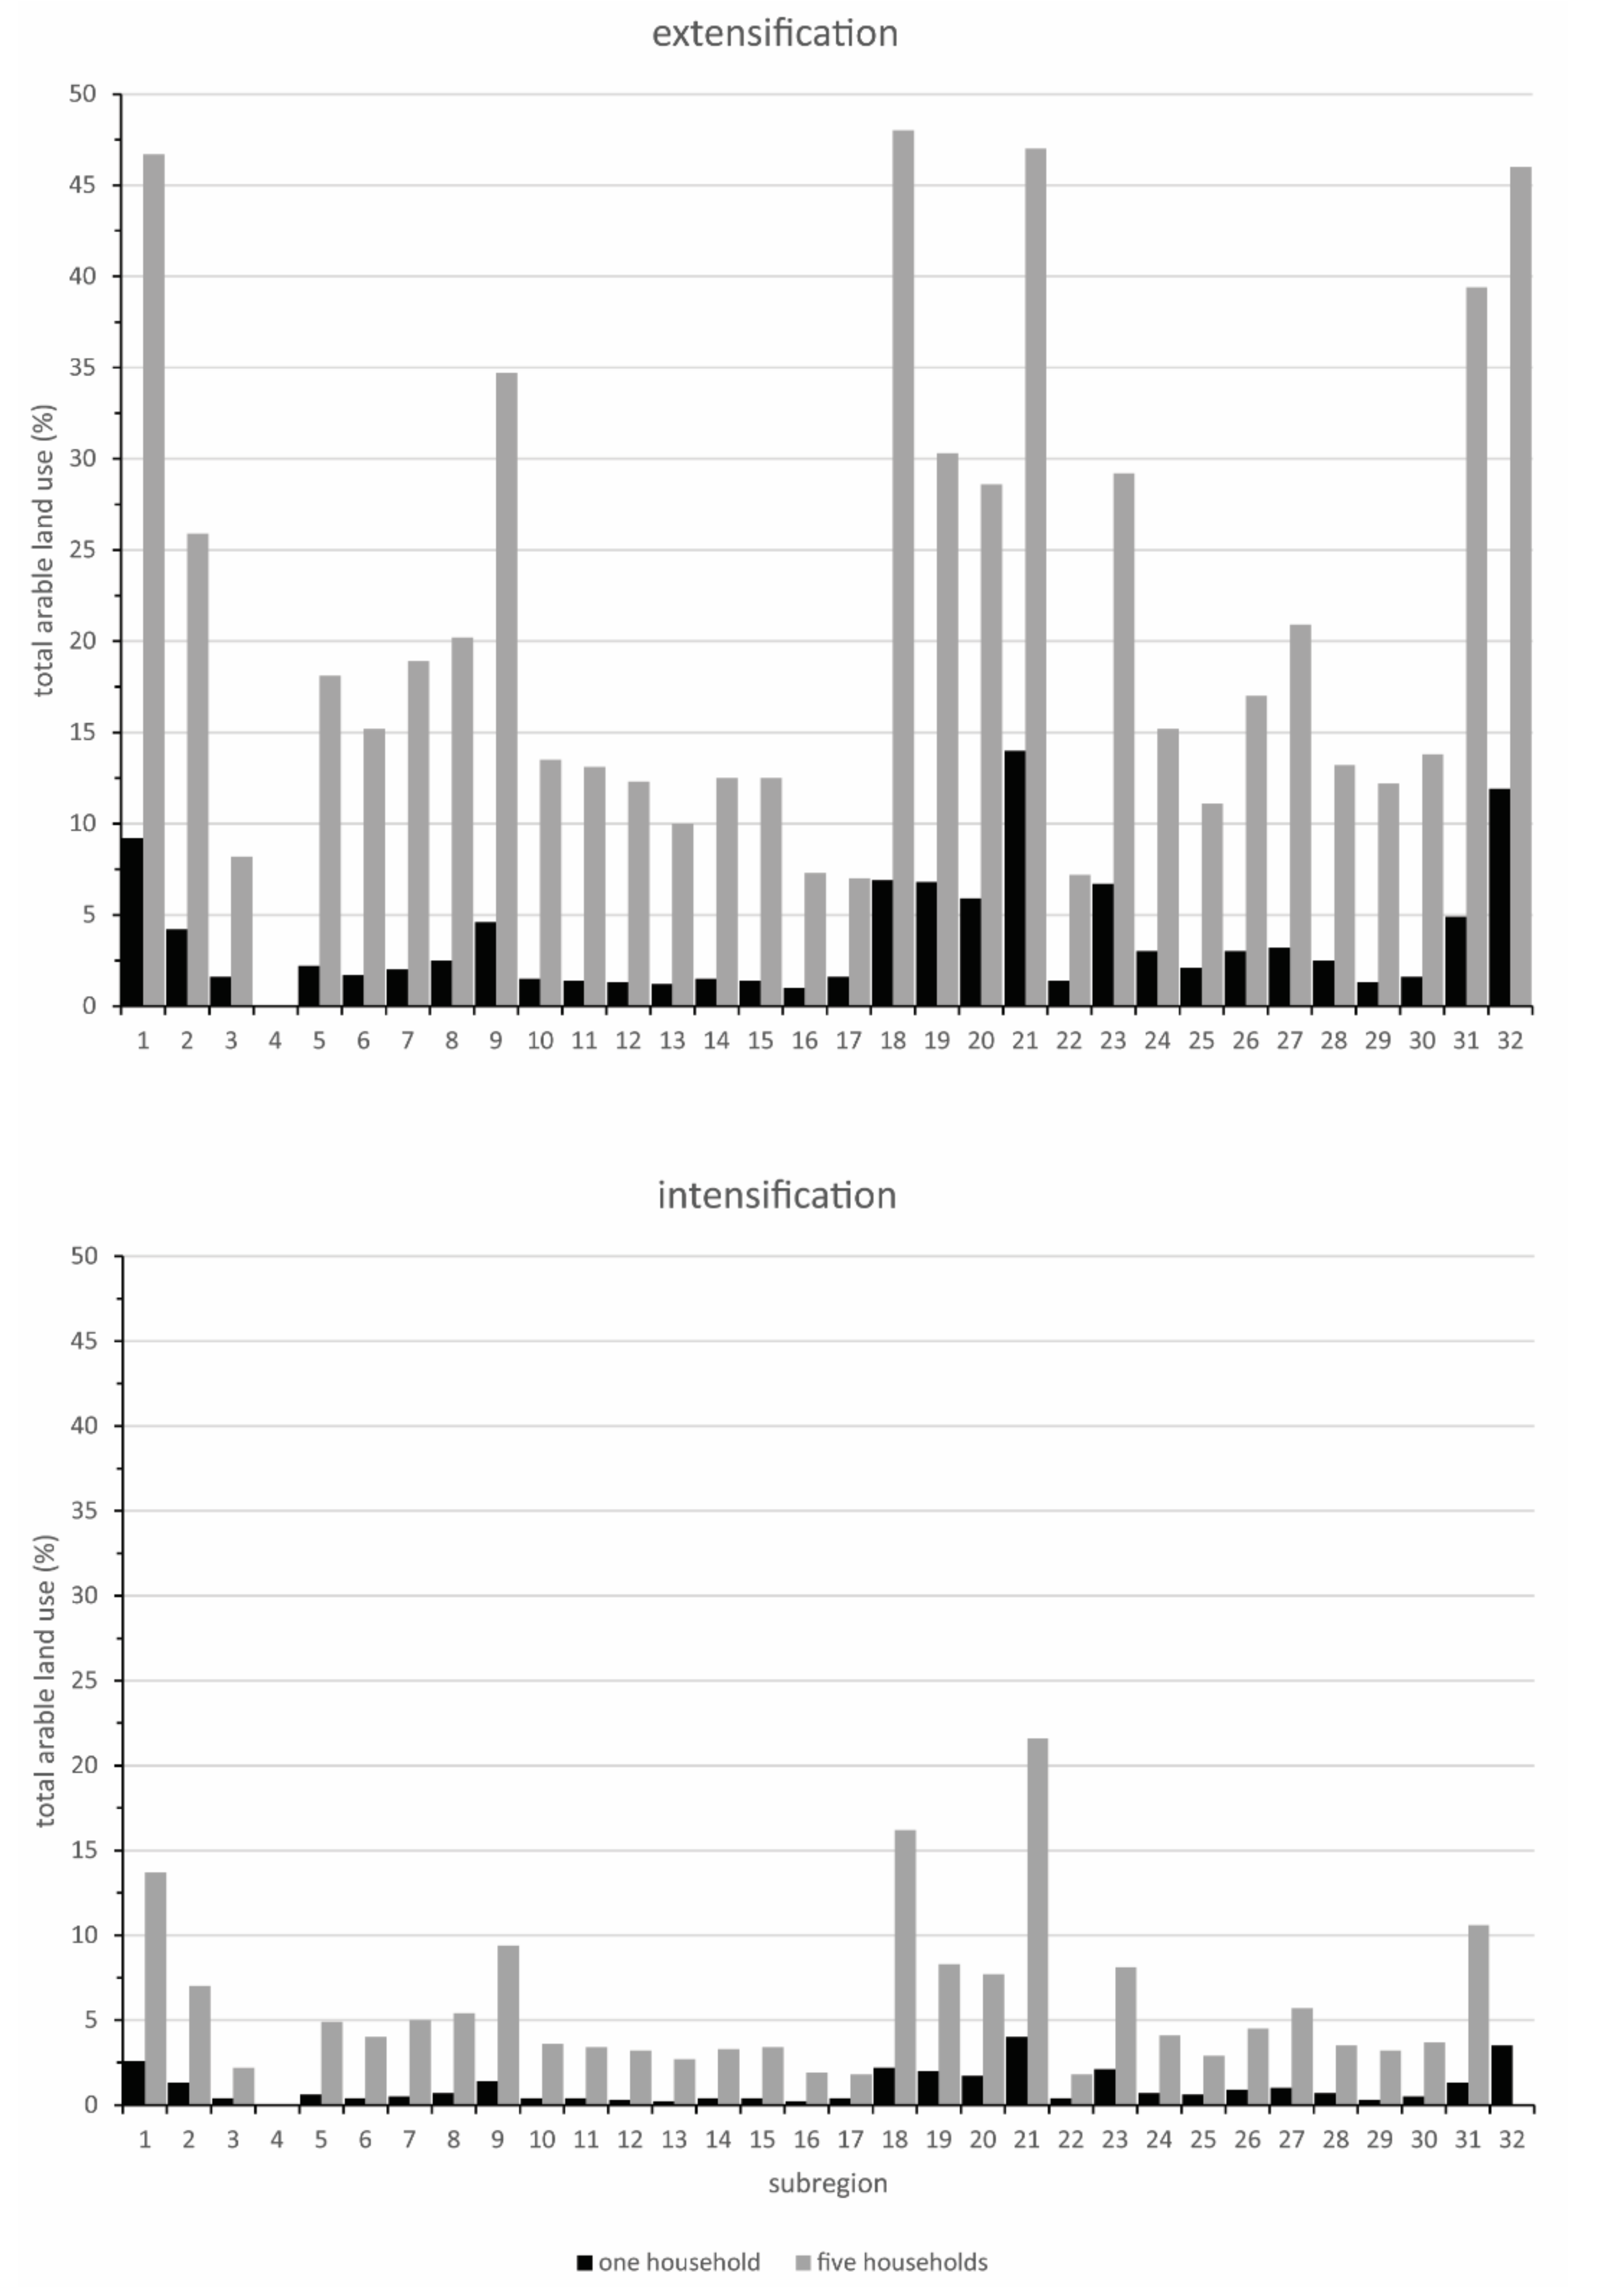
Table 1.
Conceptual and methodological comparison PLUS ROMFARMS.
| Aspect | ROMFARMS | PLUS |
|---|---|---|
| Modeling approach |
|
|
| Spatial Resolution |
|
|
| Temporal resolution |
|
|
| Spatial vs. non spatial |
|
|
Publisher’s Note: MDPI stays neutral with regard to jurisdictional claims in published maps and institutional affiliations. |
© 2021 by the authors. Licensee MDPI, Basel, Switzerland. This article is an open access article distributed under the terms and conditions of the Creative Commons Attribution (CC BY) license (https://creativecommons.org/licenses/by/4.0/).
Share and Cite
MDPI and ACS Style
Verhagen, P.; de Kleijn, M.; Joyce, J. Different Models, Different Outcomes? A Comparison of Approaches to Land Use Modeling in the Dutch Limes. Heritage 2021, 4, 2081-2104. https://0-doi-org.brum.beds.ac.uk/10.3390/heritage4030118
AMA Style
Verhagen P, de Kleijn M, Joyce J. Different Models, Different Outcomes? A Comparison of Approaches to Land Use Modeling in the Dutch Limes. Heritage. 2021; 4(3):2081-2104. https://0-doi-org.brum.beds.ac.uk/10.3390/heritage4030118
Chicago/Turabian StyleVerhagen, Philip, Maurice de Kleijn, and Jamie Joyce. 2021. "Different Models, Different Outcomes? A Comparison of Approaches to Land Use Modeling in the Dutch Limes" Heritage 4, no. 3: 2081-2104. https://0-doi-org.brum.beds.ac.uk/10.3390/heritage4030118