
Traditional and Modern Plasters for Built Heritage: Suitability and Contribution for Passive Relative Humidity Regulation


Abstract
:1. Introduction
2. Materials and Methods
2.1. Materials and Fresh State Characterization
- A commercially available earthen plastering mortar (E) composed of clayish earth, mixed-grade sand of 0–2 mm, and barley straw fibers cut to less than 30 mm [20] mechanically mixed in the laboratory with addition of 20% by mass of water, as recommended by the producer (Embarro).
- Three pastes (not containing sand) designed as finishing restoration products [21] for old Portuguese interior finishings based on powder hydrated lime CL90-S (CL) and calcium sulphate hemihydrate–gypsum (G): CL70_G20, CL50_G50, and G. The CL70_G20 was formulated using 70% hydrated lime, 20% gypsum, and 10% calcitic aggregate (<45 µm), with an addition of 0.1% of a water-retaining methylcellulose-based agent and 0.02% of a set retarder to assess the required workability. The same retarder in the same proportions was added to CL50_G50 (50% hydrated lime and 50% gypsum), designed to mould on-site elements for gypsum plaster decoration. G was produced for restoration of precast elements with 100% of calcium sulphate hemi-hydrate. All the percentages are by mass.
- One plastering mortar made of hydrated lime (CL) and one made of natural hydraulic lime 3.5 (NHL), both mixed with siliceous sand from the Tagus River (0–4 mm) with a volumetric ratio of 1:3, corresponding to 1:13 and 1:6.7 by mass, respectively [22].
2.2. Hardened State General Test Methods
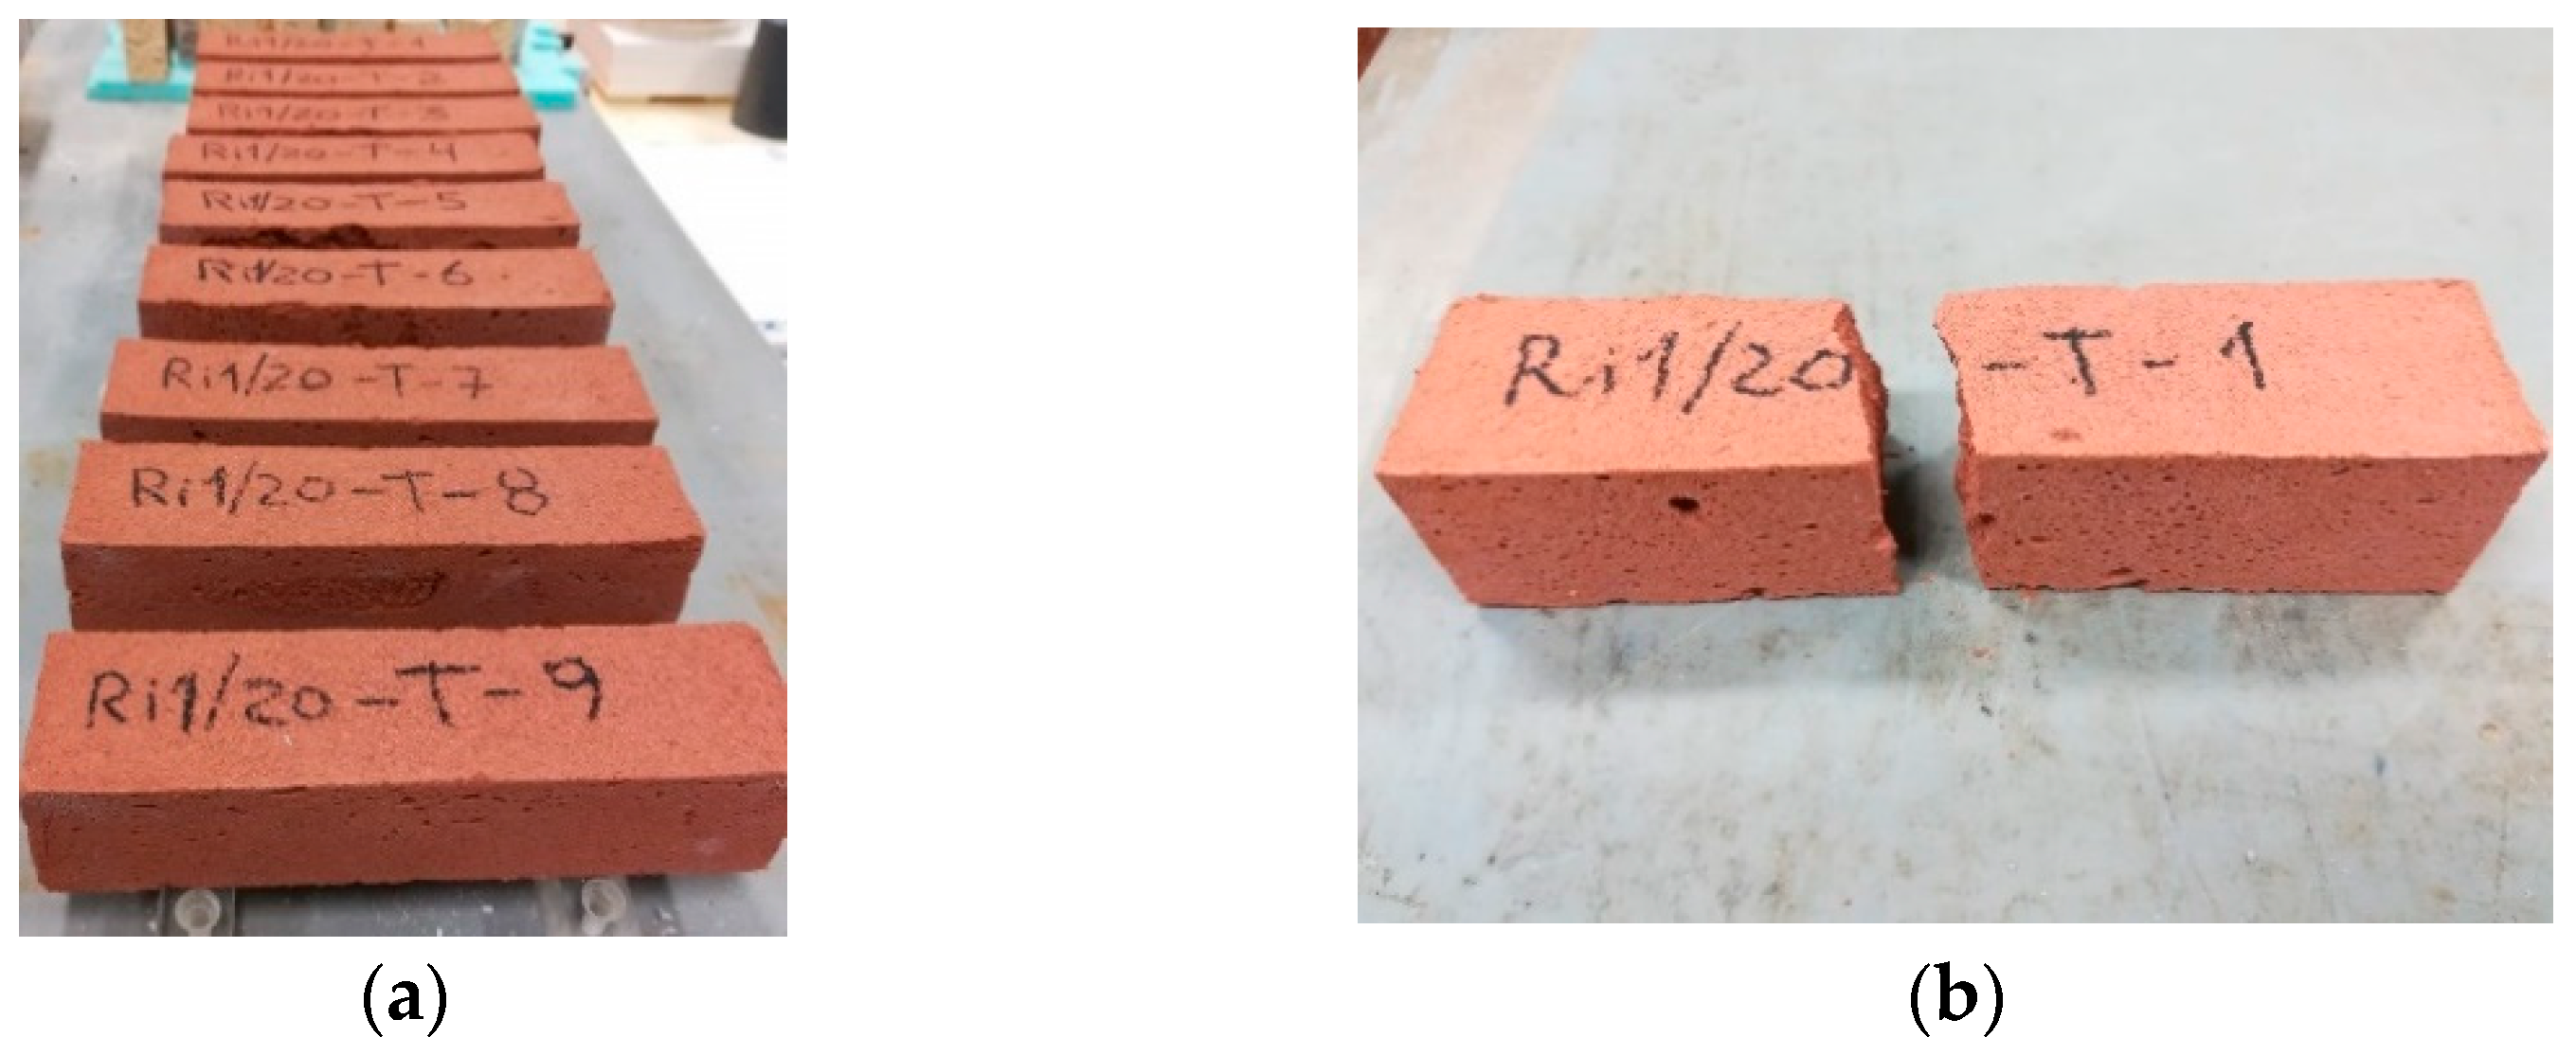
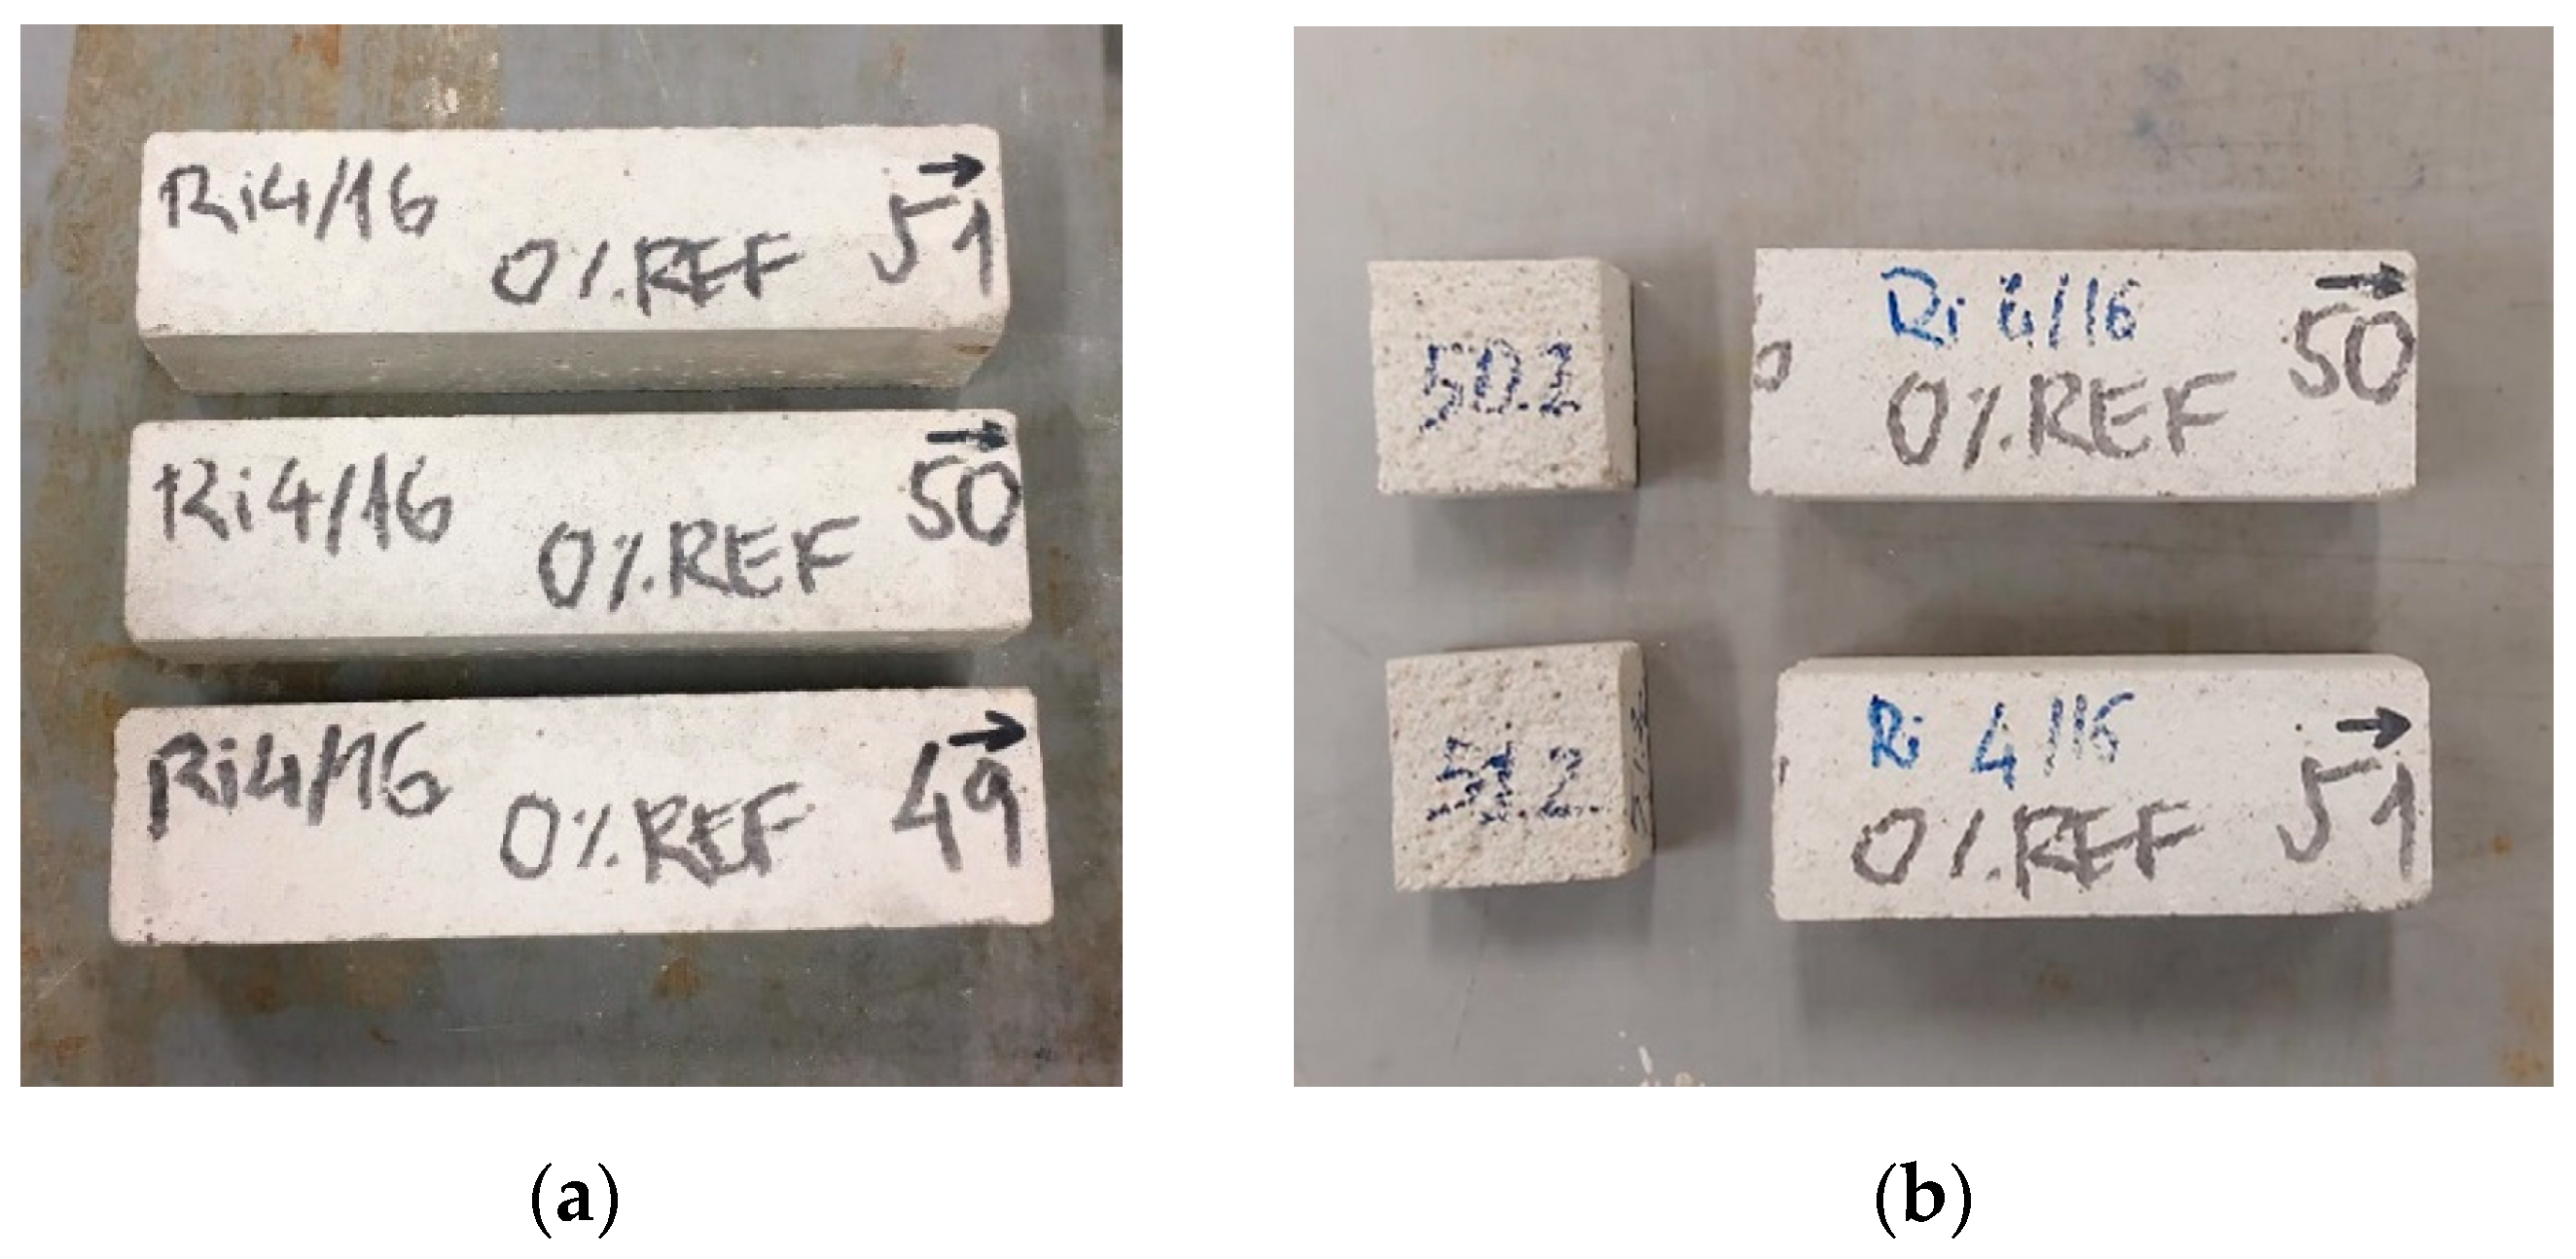
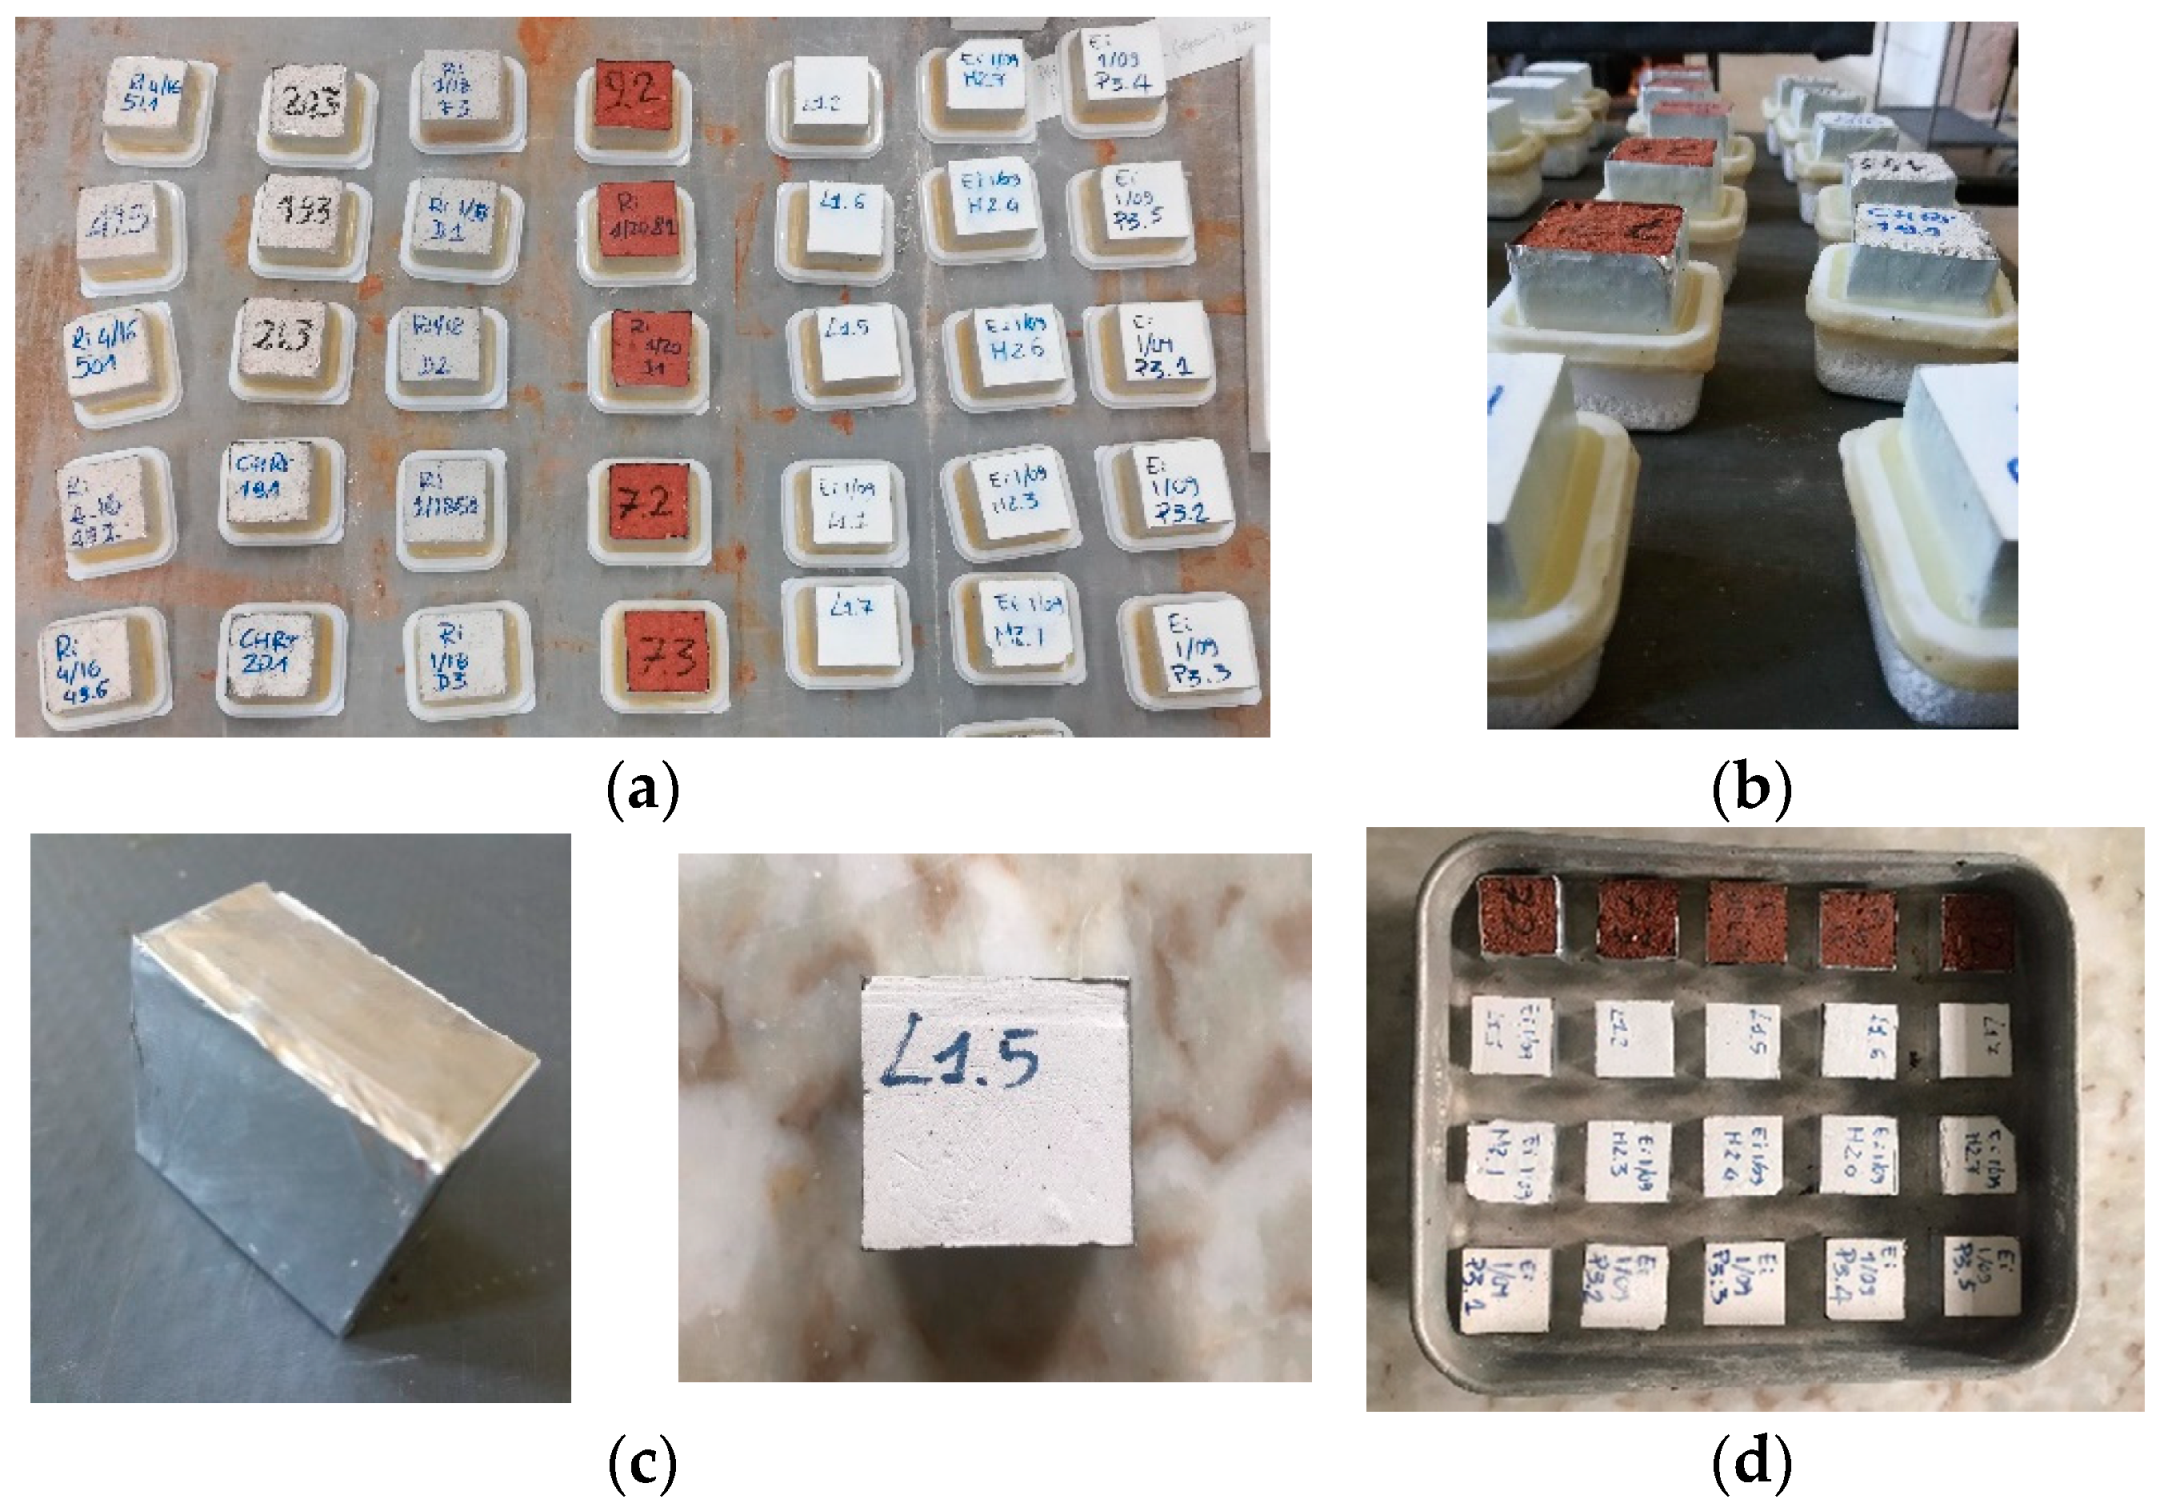
2.3. Preparation of the Specimens
2.4. Relative-Humidity-Dependent Properties Test Methods
2.4.1. Water Vapour Permeability
2.4.2. Adsorption/Desorption
2.4.3. Sorption Isotherms
2.4.4. Moisture Buffering Value
3. Results
3.1. Plasters General Characteristics
3.2. Water Vapour Permeability
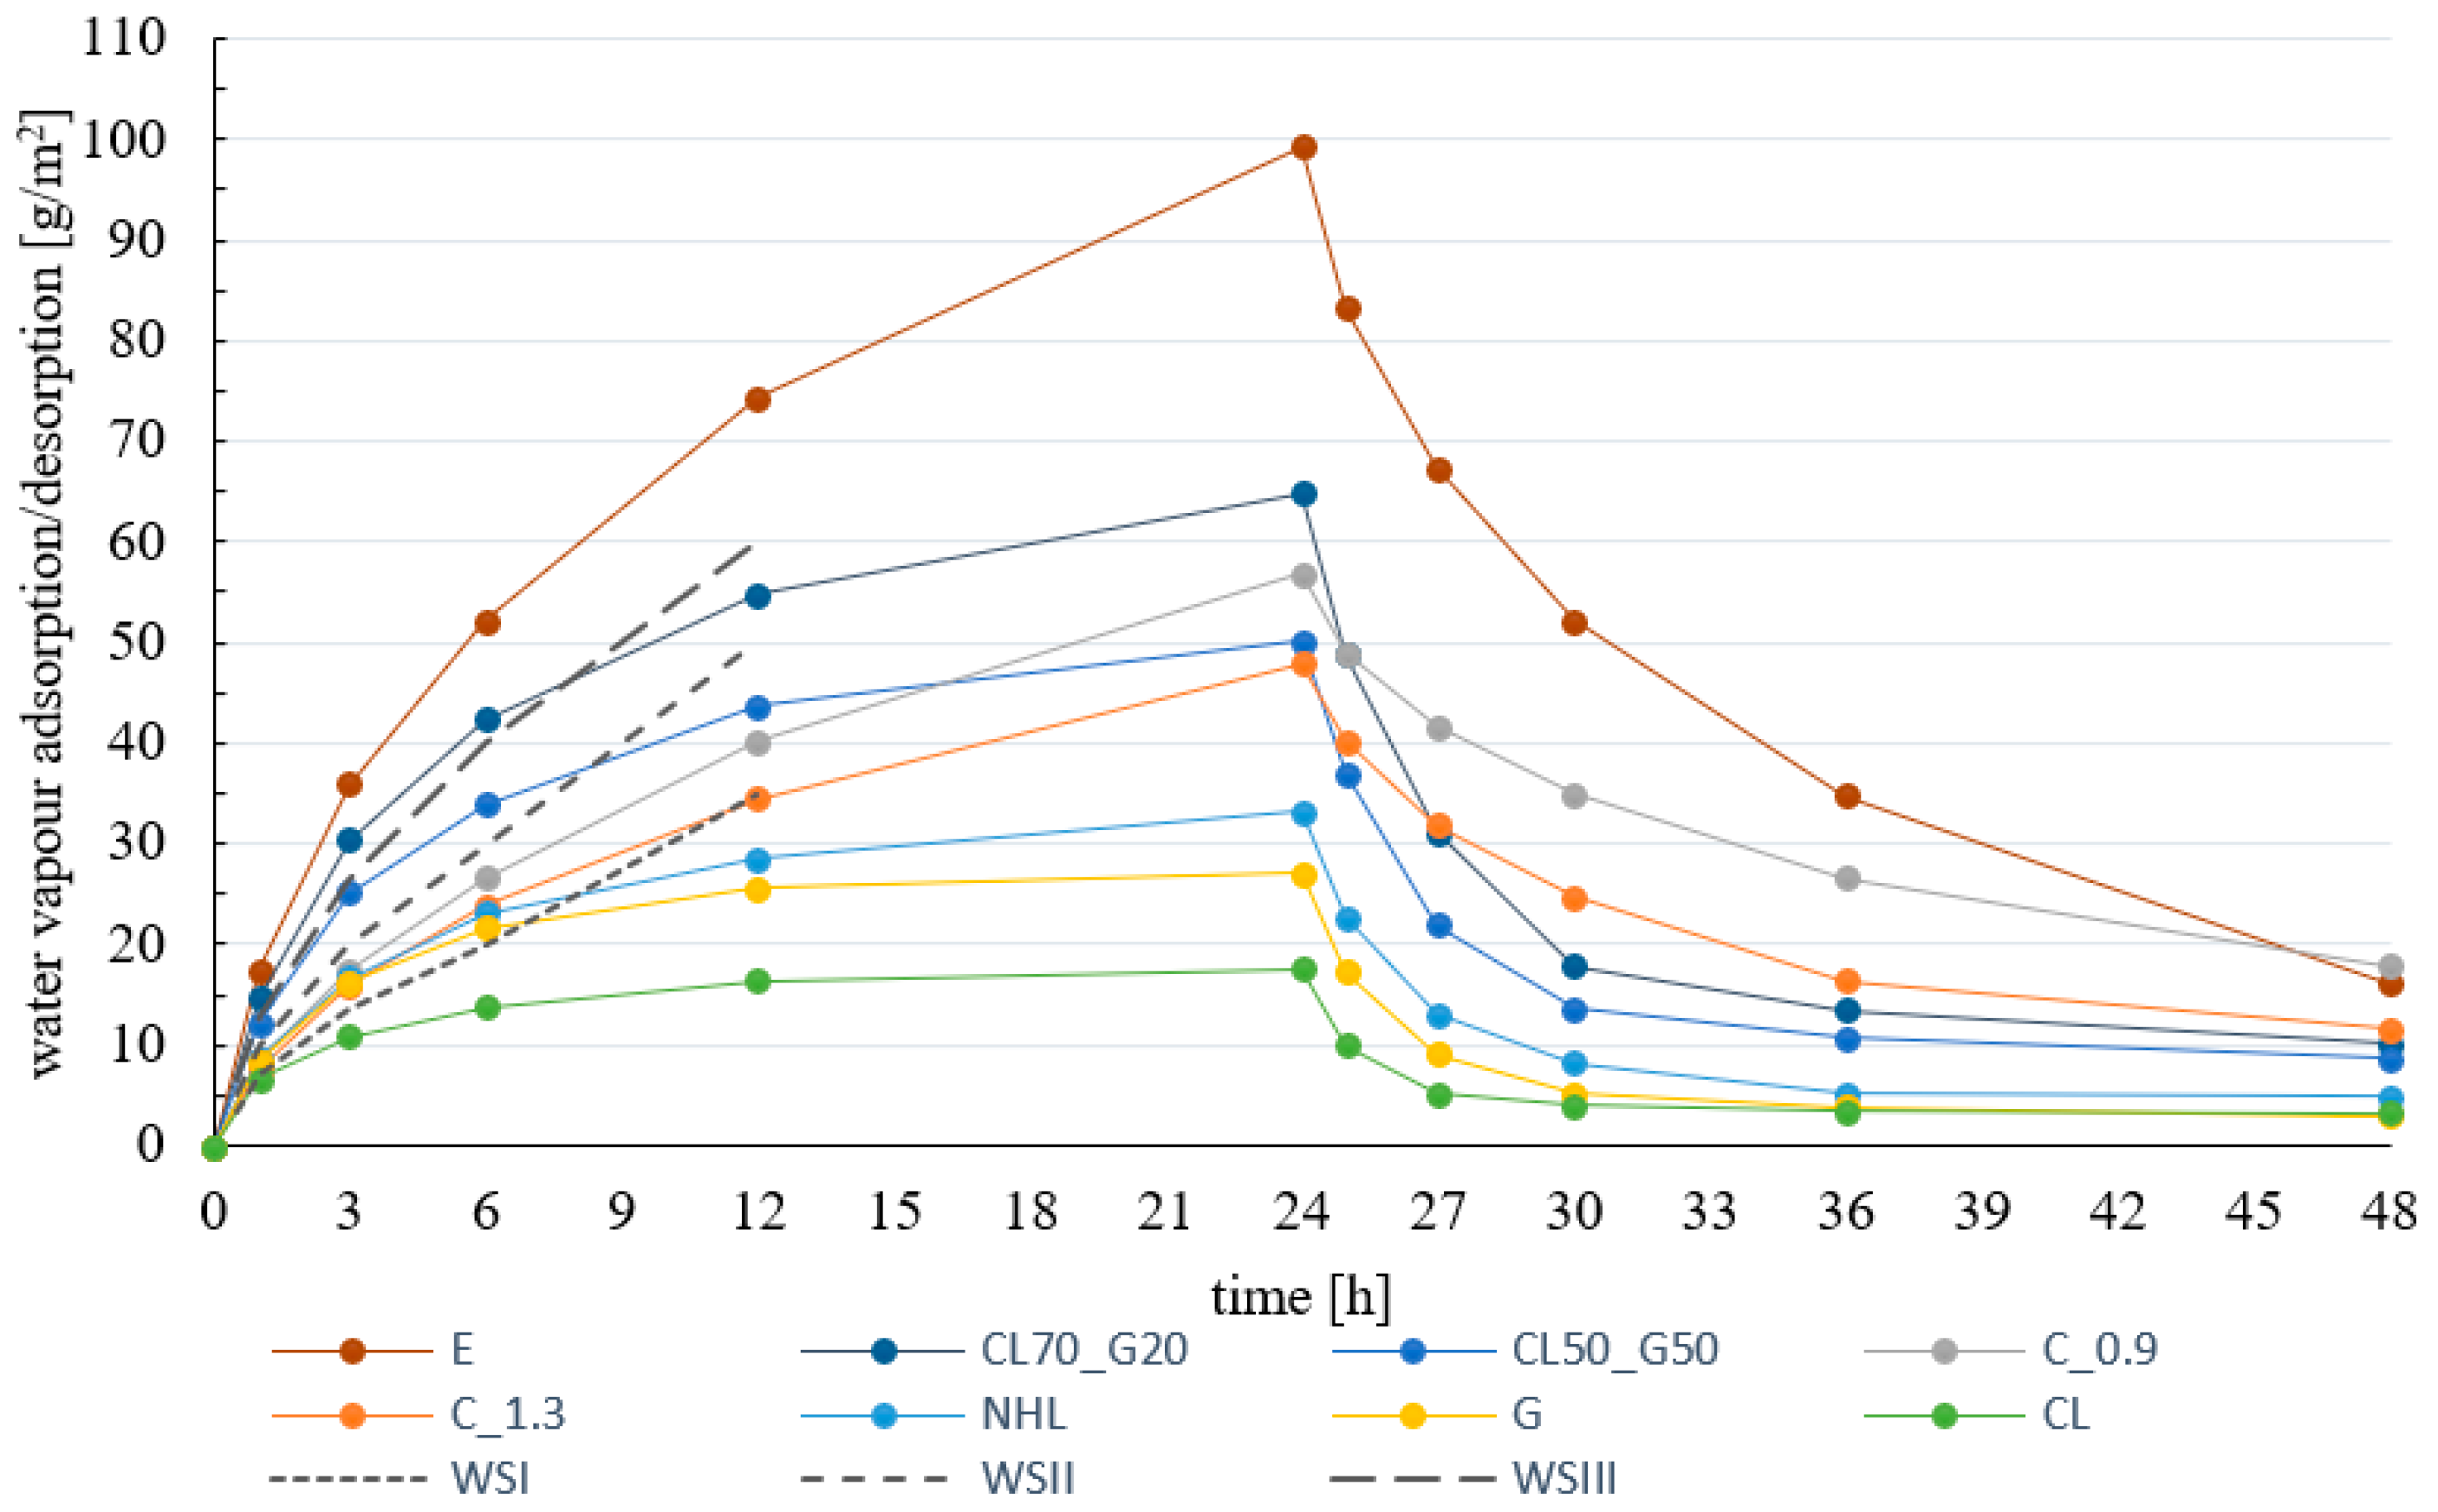
3.3. Adsorption/Desorption
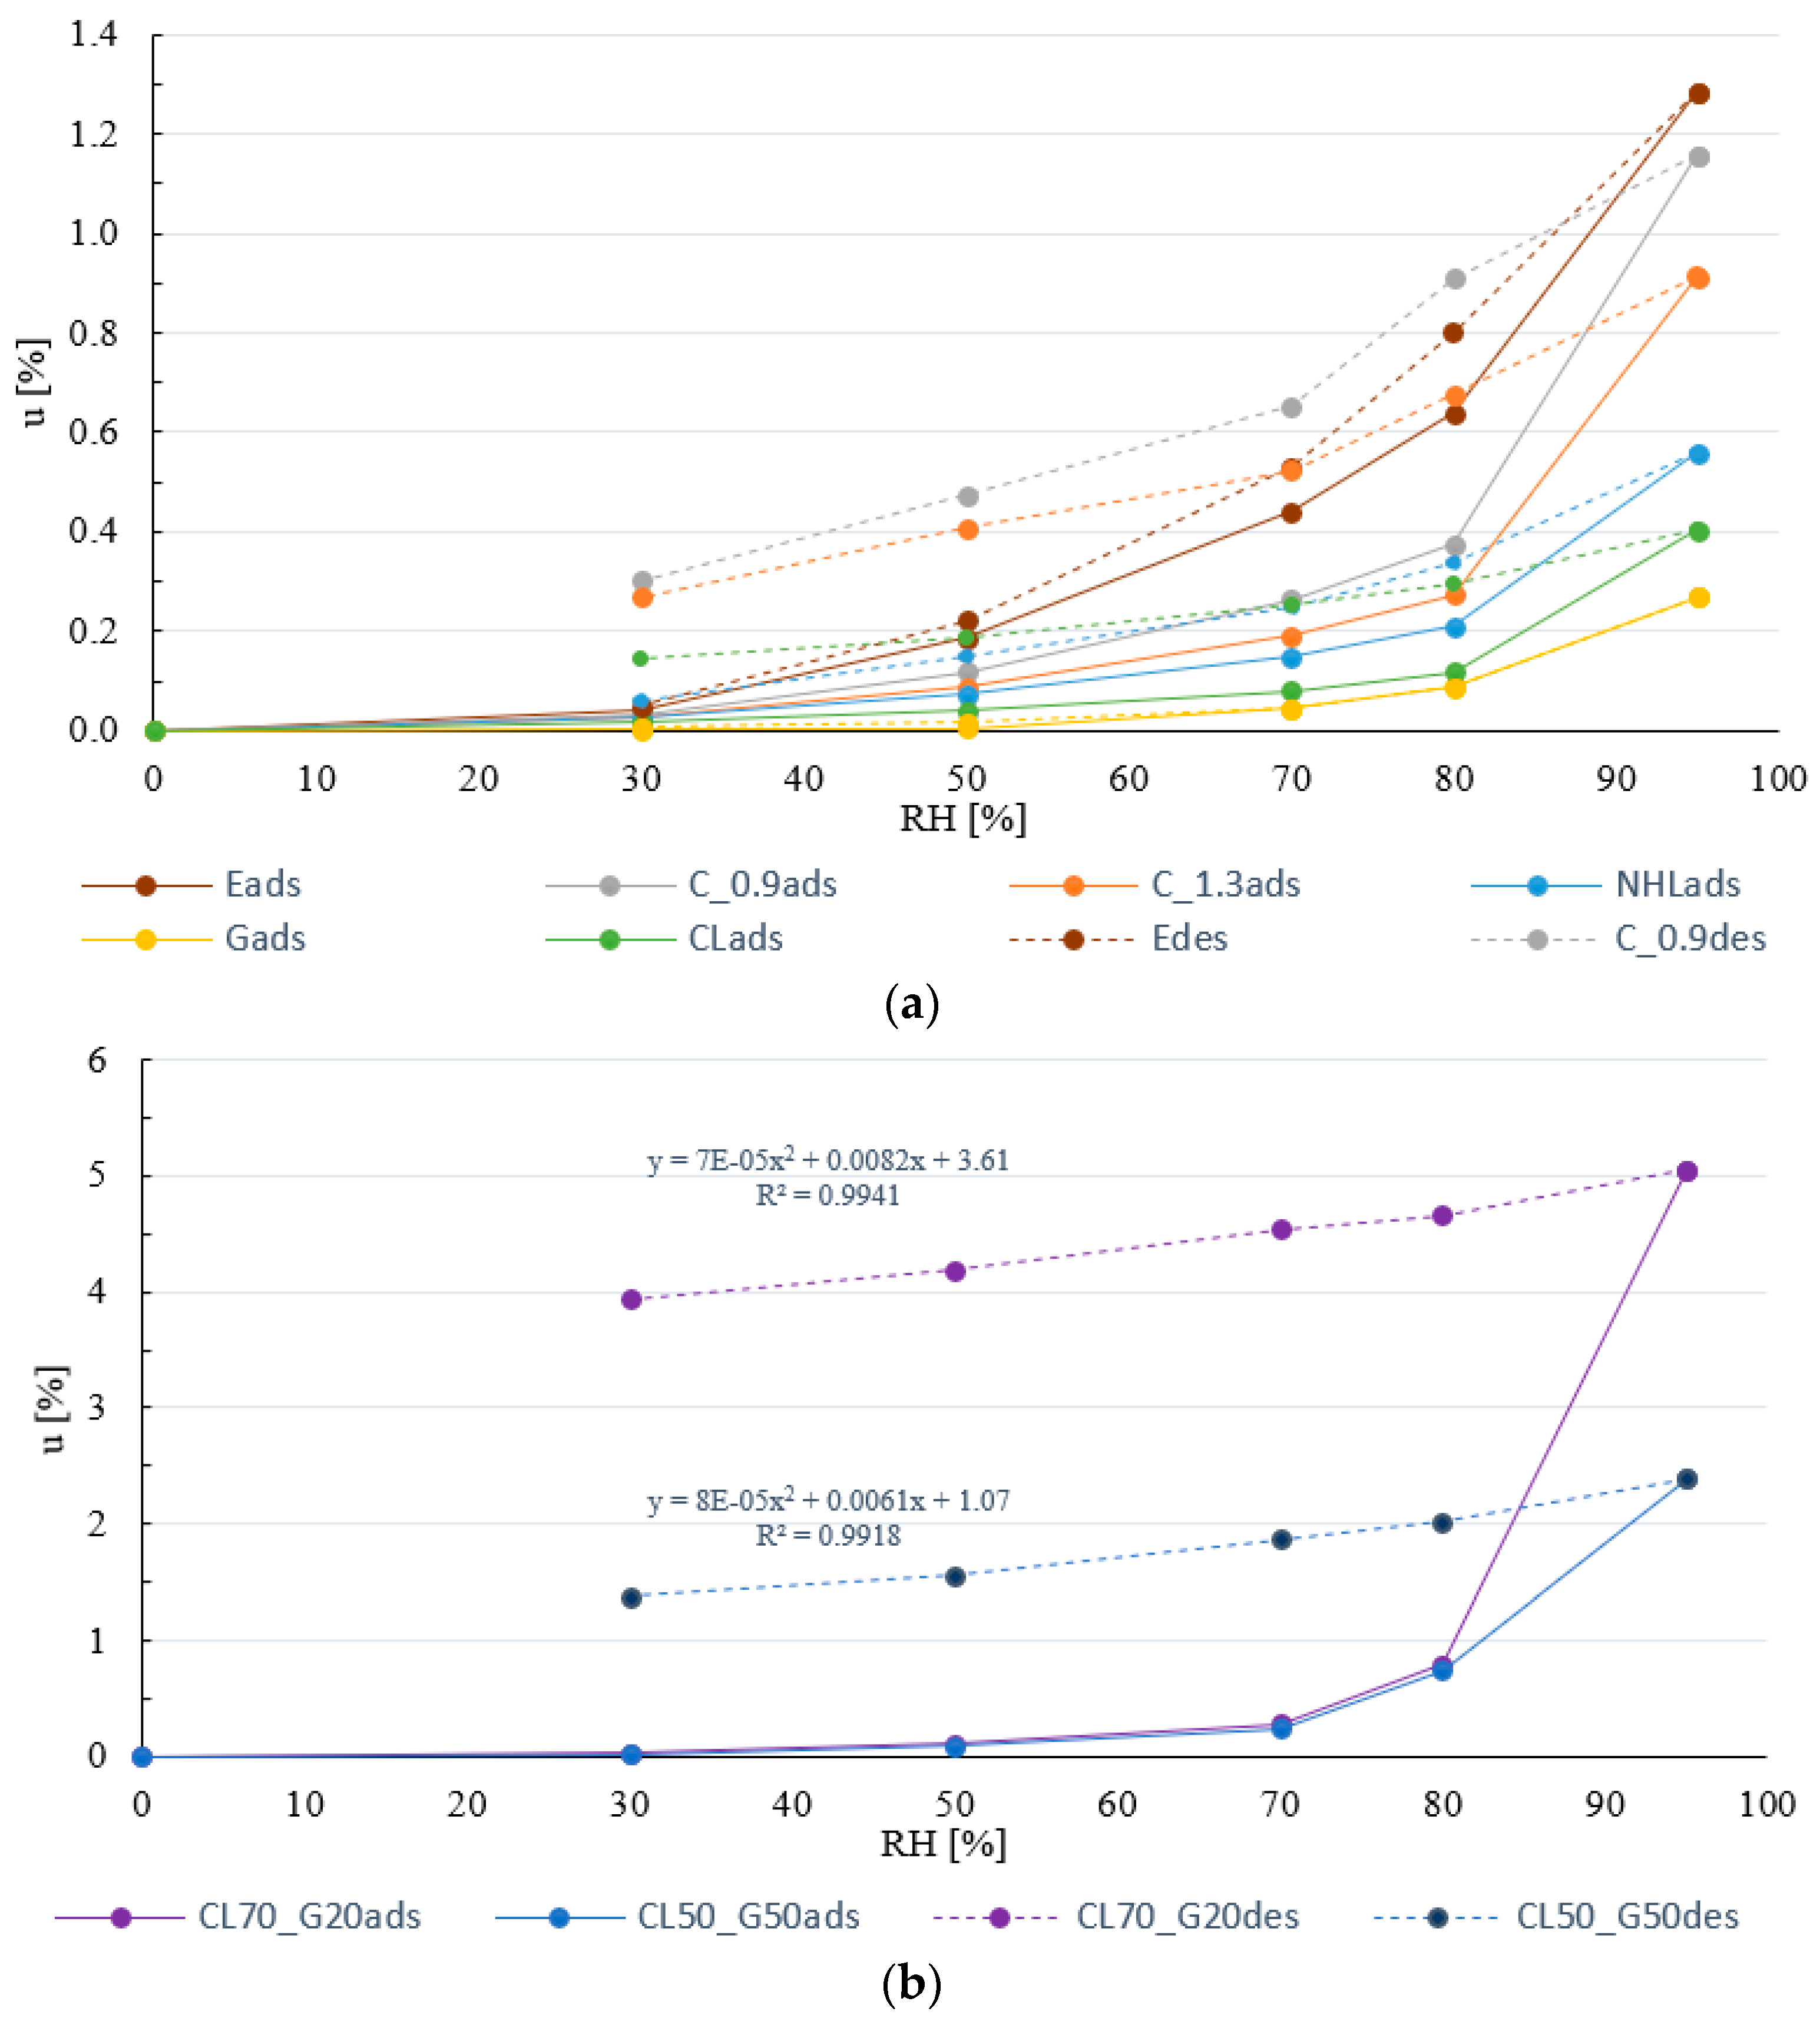
3.4. Sorption Isotherms
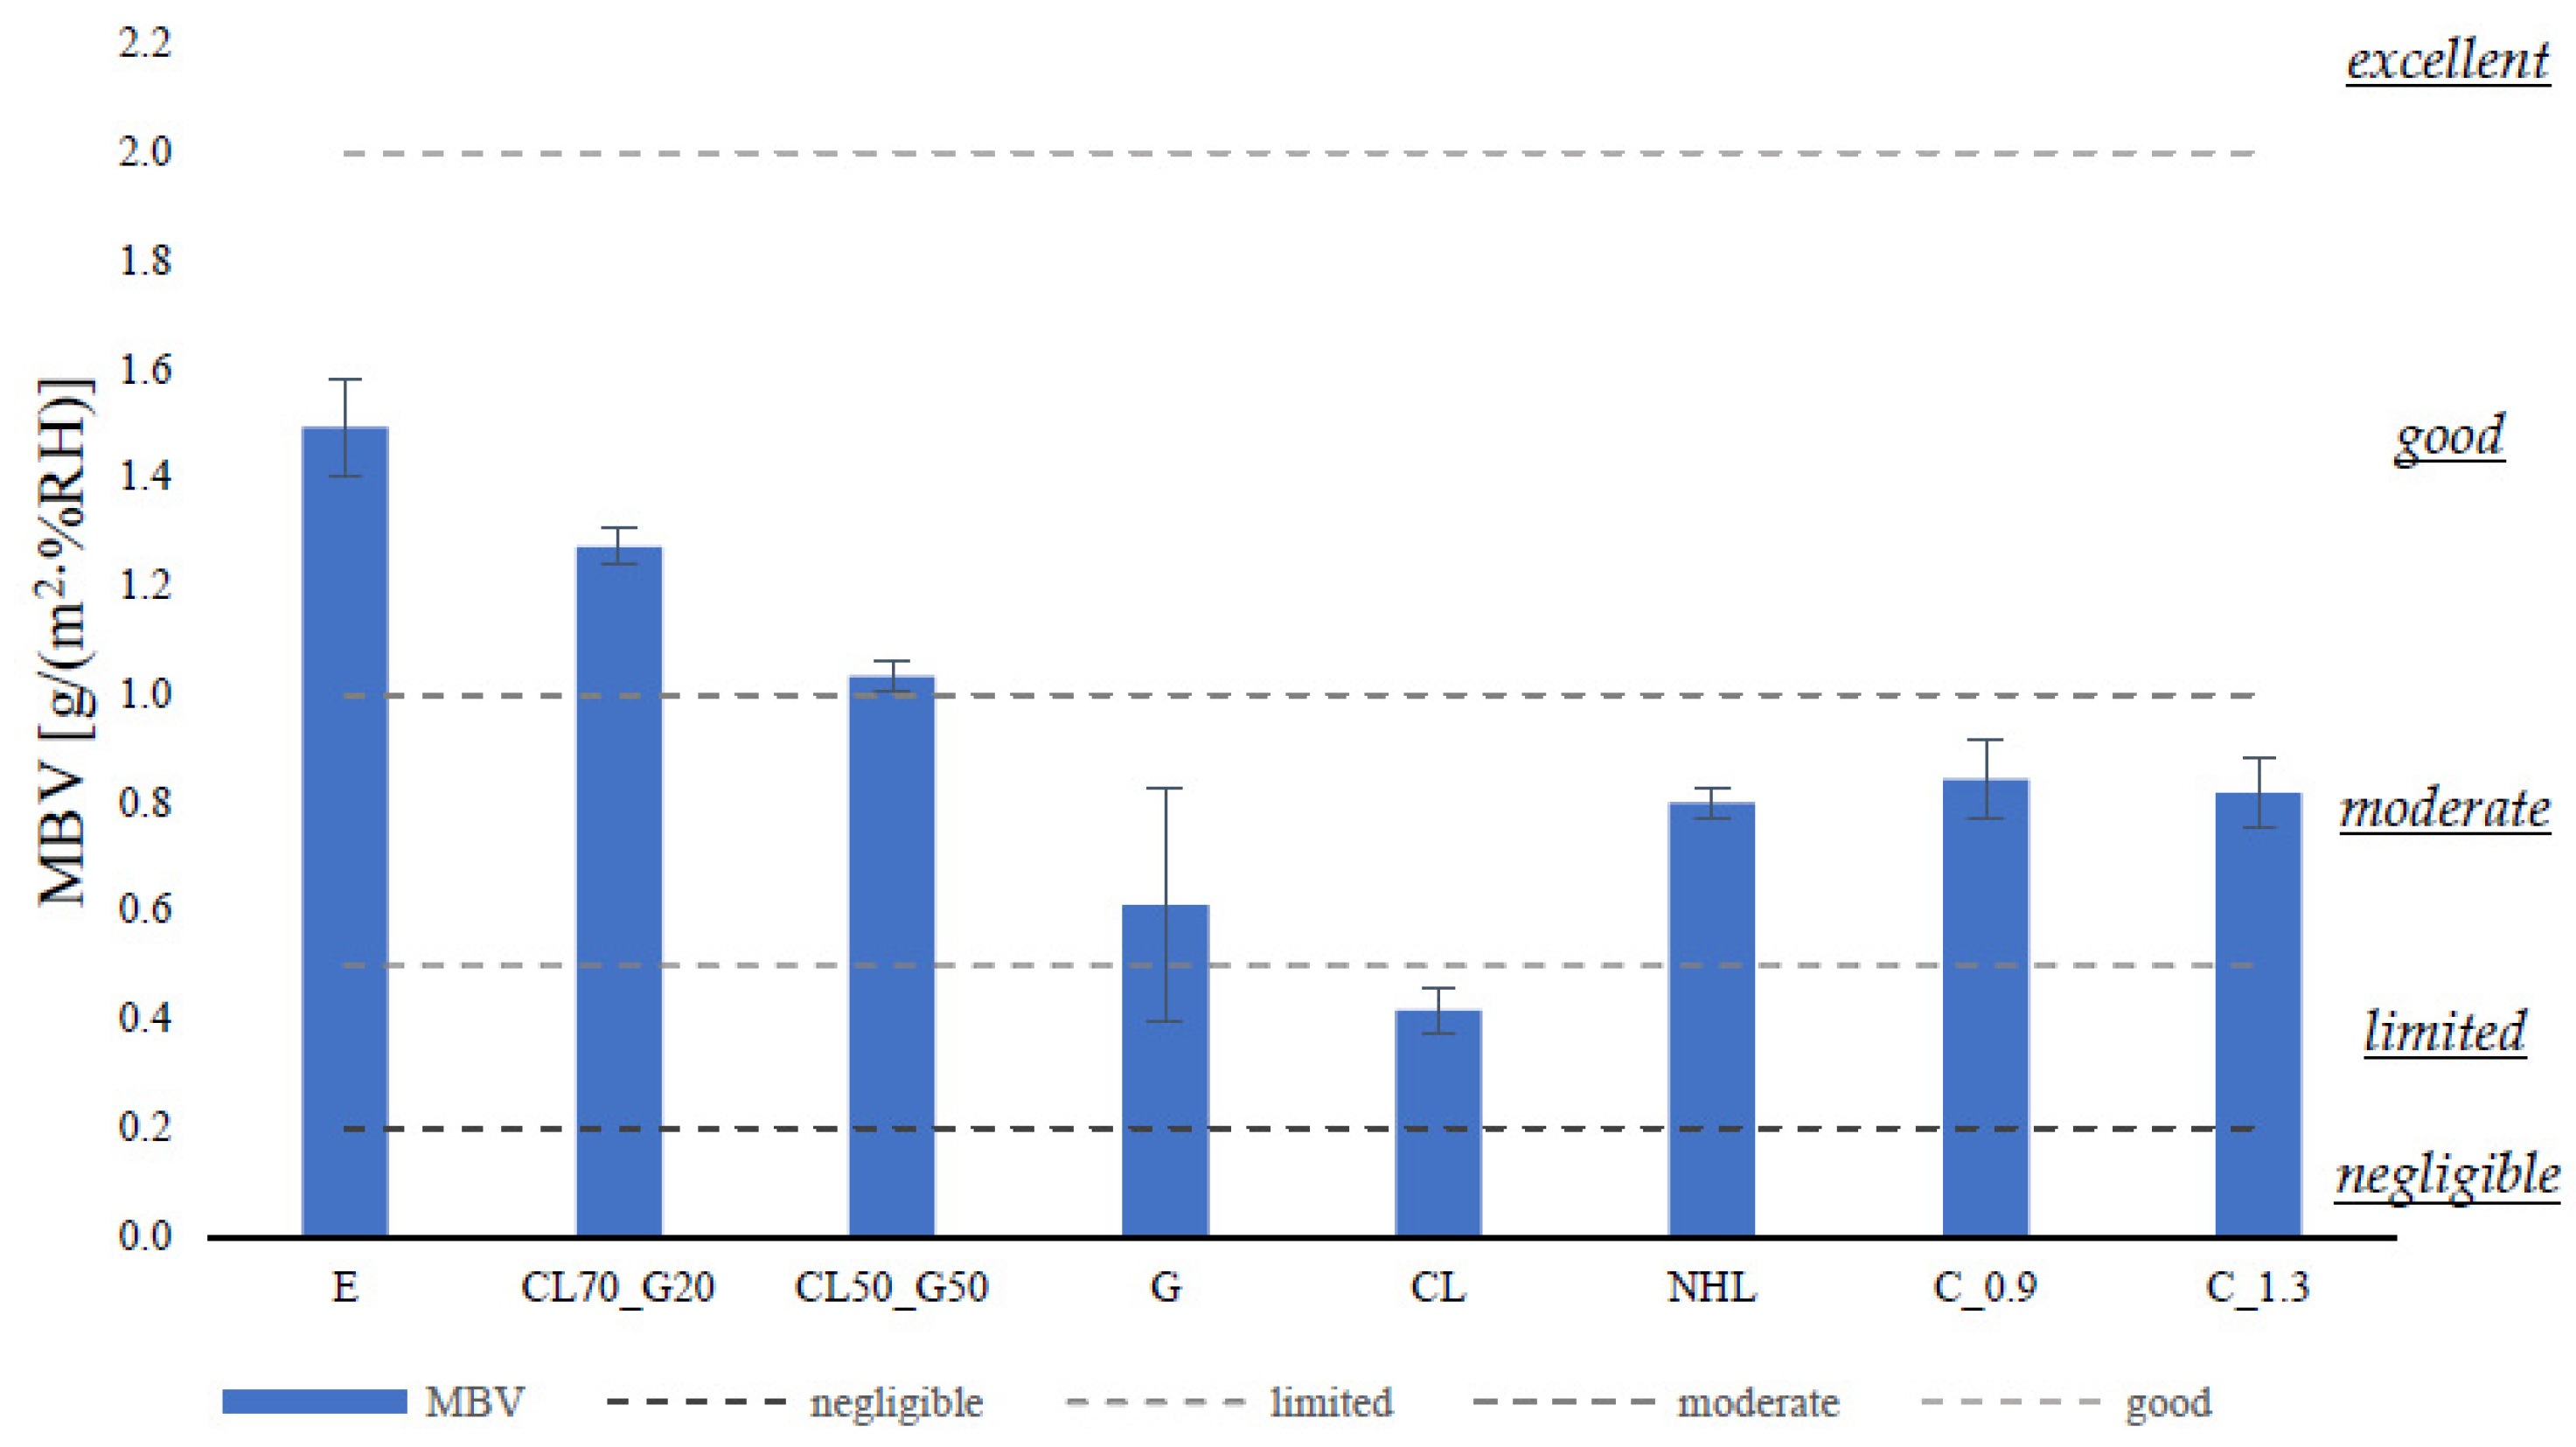
3.5. Moisture Buffering Value
4. Discussion
5. Conclusions
- The three finishing pastes, designed for restoration of historic plaster finishings, showed an open porosity and dry bulk density compatible with requirements for restoration plasters, a mechanical strength above the limit, and a good water vapour permeability for that type of application. The high compressive and flexural strength decreased with the addition of air lime, together with an increase in hygroscopicity. Hence, for moisture passive regulation, the combinations of gypsum and air lime were more suitable than the pure gypsum paste. The latter indeed presented a very low moisture capacity: in static condition, the maximum value of moisture adsorbed was the lowest between all the tested coatings; after 12 h of adsorption, it was probably saturated, and no additional moisture was adsorbed, which was reflected in a moderate moisture buffering value. The CL_Gs, instead, presented a good moisture buffering, and also were very suitable for passive regulation.
- The earth plaster E fulfilled the requirements for mechanical compatibility, together with some of the requirements for physical compatibility with water vapour. There was no doubt that this plaster was the most suitable for moisture passive regulation: it showed high hygroscopicity in dynamic and static conditions. Adsorption capacity exceeded the 24 h test, and it was classified as good for moisture buffering.
- The NHL plaster, in terms of compatibility, complied with the same requirements as the earth plaster. Concerning the RH-dependent properties, when tested for adsorption/desorption in static and dynamic conditions, its behaviour was moderately good. Moreover, it showed a moisture buffering value similar to the cement plasters.
- The CL plaster met the mechanical requirement for compatibility, and its water vapour permeability was considered adequate for application as a restoration plaster. Its adsorption and desorption were the lowest when tested dynamically, and were still very low when tested in steady states. Furthermore, its moisture buffering value was the lowest, classified as limited.
- The cement plasters were the least suitable for application in historical buildings, as expected. They did not comply with any of the requirements, especially the C_0.9, which was considered the least-compatible choice for substitution in old buildings. They showed the lowest water vapour permeability and slow adsorption and desorption, but their moisture content at high RH was quite significant when tested in a steady state. Their moderate classification for moisture buffering made these plasters a possible choice for application in modern building where their passive regulation can be improved.
Author Contributions
Funding
Acknowledgments
Conflicts of Interest
References
- Specification for Mortar for Masonry—Part 1: Rendering and Plastering Mortar; EN 998-1; European Committee for Standardization: Brussels, Belgium, 2003.
- Veiga, R. Air lime mortars: What else do we need to know to apply them in conservation and rehabilitation interventions? A review. Constr. Build. Mater. 2017, 157, 132–140. [Google Scholar] [CrossRef]
- Freire, M.T.; Veiga, M.D.R.; Silva, A.S.; de Brito, J. Studies in ancient gypsum based plasters towards their repair: Physical and mechanical properties. Constr. Build. Mater. 2019, 202, 319–331. [Google Scholar] [CrossRef]
- Candeias, A.E.; Nogueira, P.; Mirão, J.; Santos, A.S.; Veiga, R.; Gil, M.C.; Ribeiro, I.; Seruya, A.I. Characterization of ancient mortars: Present methodology and future perspectives. In Proceedings of the Workshop on Chemistry in the Conservation of Cultural Heritage: Present and Future Perspectives, Perugia, Italy, 19–22 March 2006; p. 4. [Google Scholar]
- Gomes, I.; Faria, P. Repair mortars for rammed earth constructions. In Proceedings of the XII DBMC 12th International Conference on Durability of Building Materials and Components, Porto, Portugal, 12–15 April 2011; p. 2208, ISBN 9789727521326. [Google Scholar]
- Veiga, R.; Faria, P. The role of mortars in the durability of ancient walls. In Proceedings of the CirEA2018 Conferência Internacional Sobre Reabilitação de Estruturas Antigas de Alvenaria, Lisboa, Portugal, 5 June 2018; pp. 1–15, ISBN 978-972-8893-67-5. (In Portuguese). [Google Scholar]
- Padfield, T. Humidity buffering of the indoor climate by absorbent walls. In Proceedings of the 5th Symposium on Building Physics in the Nordic Countries, Göteborg, Sweden, 24–26 August 1999; Volume 2, pp. 637–644. [Google Scholar]
- Rode, C.; Peuhkuri, R.H.; Mortensen, L.H.; Hansen, K.K.; Time, B.; Gustavsen, A.; Ojanen, T.; Ahonen, J.; Svennberg, K.; Harderup, L.E.; et al. Moisture Buffering of Building Materials; BYG Report R-127; Technical University of Denmark, Department of Civil Engineering: Lynby, Denmark, 2005. [Google Scholar]
- Ramos, N.; Delgado, J.; de Freitas, V. Influence of finishing coatings on hygroscopic moisture buffering in building elements. Constr. Build. Mater. 2010, 24, 2590–2597. [Google Scholar] [CrossRef]
- Arundel, A.V.; Sterling, E.M.; Biggin, J.H.; Sterling, T.D. Indirect health effects of relative humidity in indoor environments. Environ. Health Perspect. 1986, 65, 351–361. [Google Scholar] [PubMed] [Green Version]
- Wolkoff, P. Indoor air humidity, air quality, and health—An overview. Int. J. Hyg. Environ. Health 2018, 221, 376–390. [Google Scholar] [CrossRef] [PubMed]
- Fang, L.; Clausen, G.; Fanger, P.O. Impact of temperature and humidity on the perception of indoor air quality. Indoor Air 1998, 8, 80–90. [Google Scholar] [CrossRef]
- Posani, M.; Veiga, M.D.R.; de Freitas, V.P. Towards resilience and sustainability for historic buildings: A review of Envelope retrofit possibilities and a discussion on hygric compatibility of thermal insulations. Int. J. Arch. Herit. 2019, 15, 807–823. [Google Scholar] [CrossRef]
- McGregor, F.; Heath, A.; Shea, A.; Lawrence, M. The moisture buffering capacity of unfired clay masonry. Build. Environ. 2014, 82, 599–607. [Google Scholar] [CrossRef] [Green Version]
- Zhang, M.; Qin, M.; Rode, C.; Chen, Z. Moisture buffering phenomenon and its impact on building energy consumption. Appl. Therm. Eng. 2017, 124, 337–345. [Google Scholar] [CrossRef]
- Sesana, E.; Gagnon, A.S.; Bertolin, C.; Hughes, J. Adapting cultural heritage to climate change risks: Perspectives of cultural heritage experts in Europe. Geosciences 2018, 8, 305. [Google Scholar] [CrossRef] [Green Version]
- Posani, M.; Veiga, M.D.R.; De Freitas, V.P.; Kompatscher, K.; Schellen, H. Dynamic hygrothermal models for monumental, historic buildings with HVAC systems: Complexity shown through a case study. E3S Web Conf. 2020, 172, 15007. [Google Scholar] [CrossRef]
- Veiga, M.D.R.; Fragata, A.; Velosa, A.; Magalhães, A.C.; Margalha, G. Lime-based mortars: Viability for use as substitution renders in historical buildings. Int. J. Arch. Heritage 2010, 4, 177–195. [Google Scholar] [CrossRef]
- Ranesi, A.; Veiga, M.R.; Faria, P. Plasters for rehabilitation—Relevant requirements and characteristics. In 4° Encontro de Conservação e Reabilitação de Edifícios—ENCORE; LNEC—Laboratório Nacional de Engenharia Civil: Lisbon, Portugal, 2020; p. 551, (In Portuguese). [Google Scholar] [CrossRef]
- EMB01, Clay Plaster Embarro Universal Thecnhical Sheet. Available online: https://www.embarro.com/wp-content/uploads/1-CLAY-PLASTER-EMBARRO-UNIVERSAL.pdf (accessed on 1 February 2020).
- Freire, M.T. Restoration of Ancient Portuguese Interior Plaster Coatings: Characterization and Development of Compatible Gypsum-Based Products. Ph.D. Thesis, Instituto Superior Técnico, Universidade de Lisboa, Lisbon, Portugal, 2016. [Google Scholar]
- Santos, A.R. The Influence of Natural Aggregates on the Performance of Replacement Mortars for Ancient Buildings: The Effects of Mineralogy, Grading and Shape. Ph.D. Thesis, Instituto Superior Técnico, Universidade de Lisboa, Lisbon, Portugal, 2019. [Google Scholar]
- Pederneiras, C.M.; Veiga, R.; De Brito, J. Rendering mortars reinforced with natural sheep’s wool fibers. Materials 2019, 12, 3648. [Google Scholar] [CrossRef] [Green Version]
- Farinha, C.B.; de Brito, J.; Veiga, R. Assessment of glass fibre reinforced polymer waste reuse as filler in mortars. J. Clean. Prod. 2018, 210, 1579–1594. [Google Scholar] [CrossRef]
- Earth Plasters—Requirements, Test and Labelling; DIN 18947; German Institute for Standardization: Berlin, Germany, 2018.
- Gypsum Binders and Gypsum Plasters—Part 2: Test Methods; EN 13279-2; European Committee for Standardization: Brussels, Belgium, 2004; replaced in 2014.
- Methods of Test for Mortar for Masonry—Part 3: Determination of Consistence of Fresh Mortar (by Flow Table); EN 1015-3; European Committee for Standardization: Brussels, Belgium, 1999.
- Pederneiras, C.M.; Veiga, R.; de Brito, J. Physical and mechanical performance of coir fiber-reinforced rendering mortars. Materials 2021, 14, 823. [Google Scholar] [CrossRef]
- Methods of Test for Mortar for Masonry—Part 6: Determination of Bulk Density of Fresh Mortar; EN 1015-6; European Committee for Standardization: Brussels, Belgium, 1998.
- Methods of Test for Mortar for Masonry—Part 11: Determination of Flexural and Compressive Strength of Hardened Mortar; EN 1015-11; European Committee for Standardization: Brussels, Belgium, 1999.
- Methods of Test for Mortar for Masonry—Part 10: Determination of Dry Bulk Density of Hardened Mortar; EN 1015-10; European Committee for Standardization: Brussels, Belgium, 1999.
- Natural Stone Test Methods—Determination of the Dynamic Modulus of Elasticity (by Measuring the Fundamental Resonance Frequency); EN 14146; European Committee for Standardization: Brussels, Belgium, 2004.
- Natural Stone Test Method—Determination of Real Density and Apparent Density, and of Total and Open Porosity; EN 1936; European Committee for Standardization: Brussels, Belgium, 2006.
- Methods of Test for Mortar for Masonry—Part 18: Determination of Water Absorption Coefficient Due to Capillary Action of Hardened Mortars; EN 1015-18; European Committee for Standardization: Brussels, Belgium, 2002.
- Conservation of Cultural Property—Test Methods—Determination of Water Absorption by Capillarity; EN 15801; European Committee for Standardization: Brussels, Belgium, 2009.
- Hygrothermal Performance of Building Materials and Products—Determination of Water Vapour Transmission Properties—Cup Method; ISO 12572; International Organization for Standardization: Geneva, Switzerland, 2016.
- Hygrothermal Performance of Building Materials and Products—Determination of Hygroscopic Sorption Properties; ISO 12571; International Organization for Standardization: Geneva, Switzerland, 2013.
- Lima, J.; Faria, P.; Silva, A.S. Earth plasters: The influence of clay mineralogy in the plasters’ properties. Int. J. Arch. Heritage 2020, 14, 948–963. [Google Scholar] [CrossRef]
- Pavlíková, M.; Kapicová, A.; Pivák, A.; Záleská, M.; Lojka, M.; Jankovský, O.; Pavlík, Z. Zeolite lightweight repair renders: Effect of binder type on properties and salt crystallization resistance. Materials 2021, 14, 3760. [Google Scholar] [CrossRef]
- Černý, R.; Kunca, A.; Tydlitát, V.; Drchalová, J.; Rovnanikova, P. Effect of pozzolanic admixtures on mechanical, thermal and hygric properties of lime plasters. Constr. Build. Mater. 2006, 20, 849–857. [Google Scholar] [CrossRef]
- Mazhoud, B.; Collet, F.; Pretot, S.; Chamoin, J. Hygric and thermal properties of hemp-lime plasters. Build. Environ. 2016, 96, 206–216. [Google Scholar] [CrossRef]
- Cascione, V.; Maskell, D.; Shea, A.; Walker, P.; Mani, M. Comparison of moisture buffering properties of plasters in full scale simulations and laboratory testing. Constr. Build. Mater. 2020, 252, 119033. [Google Scholar] [CrossRef]
- Liuzzi, S.; Rubino, C.; Stefanizzi, P.; Petrella, A.; Boghetich, A.; Casavola, C.; Pappalettera, G. Hygrothermal properties of clayey plasters with olive fibers. Constr. Build. Mater. 2018, 158, 24–32. [Google Scholar] [CrossRef]
- McGregor, F.; Fabbri, A.; Ferreira, J.; Simões, T.; Faria, P.; Morel, J.-C. Procedure to determine the impact of the surface film resistance on the hygric properties of composite clay/fibre plasters. Mater. Struct. 2017, 50, 193. [Google Scholar] [CrossRef]
- Cachová, M.; Vejmelková, E.; Koňáková, D.; Keppert, M. Influence of finely ground brick on hydric properties of lime plasters. In Proceedings of the 4th European Conference of Mechanical Engineering, Paris, France, 29–31 October 2013; pp. 117–121. [Google Scholar]
- Vejmelková, E.; Koňáková, D.; Čáchová, M.; Keppert, M.; Černý, R. Effect of hydrophobization on the properties of lime–metakaolin plasters. Constr. Build. Mater. 2012, 37, 556–561. [Google Scholar] [CrossRef]
- Vejmelková, E.; Keppert, M.; Kersner, Z.; Rovnanikova, P.; Černý, R. Mechanical, fracture-mechanical, hydric, thermal, and durability properties of lime–metakaolin plasters for renovation of historical buildings. Constr. Build. Mater. 2012, 31, 22–28. [Google Scholar] [CrossRef]
- Buratti, C.; Belloni, E.; Merli, F. Water vapour permeability of innovative building materials from different waste. Mater. Lett. 2020, 265, 127459. [Google Scholar] [CrossRef]
- Giosuè, C.; Pierpaoli, M.; Mobili, A.; Ruello, M.L.; Tittarelli, F. Influence of binders and lightweight aggregates on the properties of cementitious mortars: From traditional requirements to indoor air quality improvement. Materials 2017, 10, 978. [Google Scholar] [CrossRef] [Green Version]
- Frattolillo, A.; Giovinco, G.; Mascolo, M.; Vitale, A. Effects of hydrophobic treatment on thermophysical properties of lightweight mortars. Exp. Therm. Fluid Sci. 2005, 29, 733–741. [Google Scholar] [CrossRef]
- Methods of Test for Mortar for Masonry—Part 19: Determination of Water Vapour Permeability of Hardened Rendering and Plastering Mortars; EN 1015-19; European Committee for Standardization: Brussels, Belgium, 1998.
- Santos, T.; Gomes, M.I.; Silva, A.S.; Ferraz, E.; Faria, P. Comparison of mineralogical, mechanical and hygroscopic characteristic of earthen, gypsum and cement-based plasters. Constr. Build. Mater. 2020, 254, 119222. [Google Scholar] [CrossRef]
- Santos, T.; Silva, V.; Faria, P. Earthen Mortars—Hygrotermal Behaviour as a Function of Grain Size Distribution of Sand. Construção Mag. 2015, 68, 28–30. (In Portuguese) [Google Scholar]
- Santos, T.; Faria, P.; Silva, V. Characterization of premixed earth mortars. In Proceedings of the Argmassas 2014—Simpósio de Argamassas e Soluções Térmicas de Revestimento, Coimbra, Portugal, 5–6 June 2014; ITeCons: Coimbra, Portugal, 2014; pp. 1–12. (In Portuguese). [Google Scholar]
- Jiang, Y.; Phelipot-Mardele, A.; Collet, F.; Lanos, C.; Lemke, M.; Ansell, M.; Hussain, A.; Lawrence, M. Moisture buffer, fire resistance and insulation potential of novel bio-clay plaster. Constr. Build. Mater. 2020, 244, 118353. [Google Scholar] [CrossRef]
- Lima, J.; Faria, P. Eco-efficient earthen plasters: The influence of the addition of natural fibers. In Natural Fibres: Advances in Science and Technology Towards Industrial Applications. From Science to Markets; Fangueiro, R., Rana, S., Eds.; RILEM Bookseries; Springer: Dordrecht, The Netherlands, 2016; Volume 12, pp. 315–327. [Google Scholar]
- Maddison, M.; Mauring, T.; Kirsimäe, K.; Mander, U. The humidity buffer capacity of clay-sand plaster filled with phytomass from treatment wetlands. Build. Environ. 2009, 44, 1864–1868. [Google Scholar] [CrossRef]
- Lima, J.; Faria, P.; Silva, A.S. Earthen plasters based on illitic soils from barrocal region of algarve: Contributions for building performance and sustainability. Key Eng. Mater. 2016, 678, 64–77. [Google Scholar] [CrossRef]
- Lima, J.; Correia, D.; Faria, P. Earthen plasters: The influence of the addition of gypsum and of the grain size distribution of sand. In Proceedings of the ARGAMASSAS 2016—II Simpósio de Argamassas e Soluções Térmicas de Revestimento, Coimbra, Portugal, 16–17 June 2016; ITeCons: Coimbra, Portugal, 2016; pp. 119–130. (In Portuguese). [Google Scholar]
- López-Arce, P.; Gómez-Villalba, L.; Martinez-Ramirez, S.; de Buergo, M.; Fort, R. Influence of relative humidity on the carbonation of calcium hydroxide nanoparticles and the formation of calcium carbonate polymorphs. Powder Technol. 2011, 205, 263–269. [Google Scholar] [CrossRef] [Green Version]
- Roels, S.; Janssen, H. Is the moisture buffer value a reliable material property to characterise the hygric buffering capacities of building materials? Working paper A41-T2-B-05-7 for IEA Annex 41 project. In Whole Building Heat Air and Moisture Response; EBC: Birmingham, UK, 2005. [Google Scholar]
- Thomson, M.L.; Lindqvist, J.-E.; Elsen, J.; Groot, C.J.W.P. Porosity of historic mortars. In Proceedings of the 13th International Brick and Block Masonry Conference, Amsterdam, The Netherlands, 4–7 July 2004. [Google Scholar]
- Freire, M.T.; Veiga, M.D.R.; Silva, A.S.; de Brito, J. Restoration of ancient gypsum-based plasters: Design of compatible materials. Cem. Concr. Compos. 2021, 120, 104014. [Google Scholar] [CrossRef]
- Santos, T.; Faria, P.; Silva, V. Can an earth plaster be efficient when applied on different masonries? J. Build. Eng. 2019, 23, 314–323. [Google Scholar] [CrossRef]


| Pastes and Mortars | Ref. | Month-Year of Production | Binder | Aggregate | b/a Ratio | w/b Ratio | Flow (mm) | BD (kg/dm3) | |
|---|---|---|---|---|---|---|---|---|---|
| G | [21] | 04-2012 | G (100%) | – | – | 0.7 | 190 ± 5 | nf | |
| CL50_G50 | [21] | 03-2012 | G (50%) | CL (50%) | – | – | 0.8 | 165 ± 5 | nf |
| CL70_G20 | [21] | 03-2012 | G (20%) | CL (70%) | CA (10%) | – | 1.0 | 165 ± 5 | nf |
| E | – | 02-2020 | IE | SS02 | nf | 0.2 ’ | 171 ± 10 | 1.95 | |
| CL | [22] | 03-2016 | CL 90-S | TR04 | 1:3 | 2.8 | 151 ± 5 | nf | |
| NHL * | – | 03-2016 | NHL 3.5 | TR04 | 1:3 | 1.4 | 150 ± 5 | nf | |
| C_0.9 | [23] | 10-2018 | CEM II/B-L 32.5N | SS02 | 1:4 | 0.9 | 140 ± 3 | 2.00 | |
| C_1.3 | [24] | 07-2017 | CEM II/B-L 32.5N | SS02 | 1:4 | 1.3 | 161 ± 1 | 1.97 | |
| Pastes and Mortars | Specimens | |||
|---|---|---|---|---|
| S1 (mm) | S2 (mm) | d (mm) | Mass (g) | |
| G | 40 | 40 | 21 | 34 |
| CL50_G50 | 40 | 40 | 21 | 34 |
| CL70_G20 | 38 | 38 | 21 | 29 |
| E | 39 | 40 | 22 | 58 |
| CL | 40 | 40 | 23 | 57 |
| NHL | 40 | 40 | 21 | 55 |
| C_0.9 | 40 | 40 | 22 | 64 |
| C_1.3 | 40 | 40 | 22 | 60 |
| Pastes and Mortars | Ref. | Test Age | OP (%) | BD (kg /m3) | Fs (MPa) | Cs (MPa) | DME (GPa) | CC (kg/(m2min0.5)) | W24h 1 (kg/m2) |
|---|---|---|---|---|---|---|---|---|---|
| G | [14] | 2 y | 46.1 | 1128 | 2.42 ± 0.11 | 5.19 ± 0.27 | 5.04 ± 0.01 | 6.42 | 71.26 |
| CL50_G50 | [14] | 2 y | 48.4 | 1104 | 1.61 | 3.24 ± 0.31 | 2.35 ± 0.01 | 6.23 | 76.26 |
| CL70_G20 | [14] | 2 y | 50.7 | 1031 | 1.55 | 3.03 ± 0.40 | 1.87 ± 0.00 | 4.49 | 78.92 |
| E | – | 120 d | – | 1743 ± 0.01 | 0.45 ± 0.04 | 0.82 ± 0.05 | 3.50 ± 0.01 | – | – |
| CL | [15] | 90 d | 25.8 | 1720 | 0.39 | 0.55 | 2.72 | 1.71 | 31.00 |
| NHL * | – | 90 d | 26.2 | 1780 | 0.15 ± 0.02 | 0.35 ± 0.002 | 1.86 ± 0.07 | 2.4 | 36.50 |
| C_0.9 | [16] | 28 d | 20.2 | 1919 | 2.56 ± 0.21 | 9.66 ± 0.11 | 16.2 ± 0.9 | 0.43 * | 24.30 * |
| C_1.3 | [17] | 2 y | 22.4 | 1875 | 2.00 ± 0.31 | 5.98 ± 0.79 | 10.1 ± 0.8 | 1.55 (1 y) | 17.47 2 (1 y) |
| Requirements | [18] | – | – | – | 0.20–0.70 | 0.40–2.50 | 2.00–5.00 | – | – |
| Pastes and Mortars | d (mm) | ΔM 24 h (g) | Q ((kg/s) × 10−9) | Wp (ng/m2∙s∙Pa) | WVP (kg/(m∙s∙Pa))∙10−12 | µ (-) | Sd (m) |
|---|---|---|---|---|---|---|---|
| G | 20.69 | 0.30 | 3.43 | 1718 | 35.53 ± 1.2 | 5.49 | 0.055 |
| CL50_G50 | 21.06 | 0.30 | 3.54 | 1775 | 37.36 ± 1.2 | 5.22 | 0.052 |
| CL70_G20 | 20.91 | 0.29 | 3.38 | 1802 | 37.68 ± 1.6 | 5.18 | 0.051 |
| E | 22.43 | 0.15 | 1.69 | 960 | 21.50 ± 0.8 | 9.07 | 0.091 |
| CL | 22.52 | 0.20 | 2.31 | 1166 | 26.24 ± 0.5 | 7.43 | 0.074 |
| NHL | 21.12 | 0.17 | 1.97 | 991 | 20.92 ± 0.8 | 9.32 | 0.093 |
| C_0.9 | 22.01 | 0.07 | 0.86 | 434 | 9.55 ± 0.8 | 20.42 | 0.204 |
| C_1.3 | 21.59 | 0.11 | 1.25 | 624 | 13.48 ± 1.2 | 14.48 | 0.144 |
| Pastes and Mortars | WVP (10−12 kg/(m∙Pa∙s)) | Resistance Factor µ (–) | ||||
|---|---|---|---|---|---|---|
| Result | Range * | Result | Range * | |||
| Gypsum | 35.5 | ▲ | 21.9–29.2 | 5.5 | ▼ | 7.0–9.1 |
| Gypsum + lime | 37.4 37.7 | ▲ ▲ | 28.9 | 5.2 5.2 | ▼ ▼ | 6.7 |
| Clay | 21.5 | ▲ | 7.8–8.8 | 9.1 | ▼ | 22.1–25.0 |
| CL90 | 26.2 | ▲ | 5.3–16.0 | 7.4 | ▼ | 12.2–37.1 |
| NHL3.5 | 20.9 | ▲ | 9.9 | 9.3 | ▼ | 19.6 |
| Cement ** | 9.5 13.5 | 4.9–14.0 | 14.5 20.4 | 13.9–40.0 | ||
| Pastes | Test Age | WVP (kg/(m∙Pa∙s)) E-11 | Sd (m) (d = 10 mm) | ||
|---|---|---|---|---|---|
| Wet Cup | Dry Cup (8 y) | Wet Cup | Dry Cup (8 y) | ||
| G | 90 days | 4.915 | 3.553 | 0.035 | 0.055 |
| 2 years | 3.169 | 0.057 | |||
| CL50_G50 | 90 days | 2.036 | 3.736 | 0.100 | 0.052 |
| 2 years | 2.397 | 0.083 | |||
| CL70_G20 | 90 days | 3.282 | 3.768 | 0.054 | 0.051 |
| 2 years | 2.269 | 0.081 | |||
| Plaster | Adsorption (g/m2) | Desorption (g/m2) | Ref. | |||
|---|---|---|---|---|---|---|
| (12 h) | (24 h) | (12 h) | (24 h) | |||
| Clay | Ep | 74.43 ± 4.42 | 99.35 ± 4.89 | 34.76 ± 1.56 | 16.10 ± 1.51 | Present study |
| <80 | 104 | >10 and <20 | <10 | [52] | ||
| >60 | – | ≈0 | – | [53] | ||
| <130 | – | ≈60 | – | [53] | ||
| 67.7 | – | – | – | [54] | ||
| 68.5 | – | – | – | [54] | ||
| 105.3 | – | – | – | [54] | ||
| Ef | >60 and <80 | – | – | – | [55] | |
| >80 and <100 | – | <20 | – | [53] | ||
| <70 | ≈ 80 | ≈12 | ≈ 5 | [56] | ||
| >21 and <38 | - | 0 | - | [57] | ||
| E | >60 | 76 | <10 | <5 | [52] | |
| ≈80 | – | ≈ 0 | – | [53] | ||
| ≈100 | ≈20 | [53] | ||||
| ≈60 | >70 | >10 | <15 | [58] | ||
| ≈70 | ≈85 | ≈18 | >10 | [58] | ||
| ≈80 | <100 | <25 | >10 | [58] | ||
| ≈85 | ≈110 | ≈30 | [58] | |||
| <70 | ≈ 85 | ≈ 20 | ≈10 | [56] | ||
| ≈80 | ≈83 | ≈ 10 | ≈0 | [59] | ||
| ≈60 | ≈78 | [59] | ||||
| 60 | 70 | >10 and <20 | <10 | [38] | ||
| 30 | – | 0 | – | [57] | ||
| EK | 30 | 35 | ≈0 | 0 | [38] | |
| EB | 110 | 140 | >30 and <40 | ≈10 | [38] | |
| Cement | C | 34.49 ± 3.02 | 47.99 ± 7.79 | 16.45 ± 2.13 | 11.54 ± 2.14 | Present study |
| 40.21 ± 3.45 | 56.84 ± 5.27 | 26.59 ± 3.15 | 17.89 ± 2.06 | Present study | ||
| 40 | 40 | ≈0 | ≈0 | [52] | ||
| Gypsum | G | 25.54 ± 13.42 | 27.15 ± 16.62 | 3.90 ± 2.54 | 3.03 ± 1.96 | Present study |
| G | 22 | 22 | ≈0 | ≈0 | [52] | |
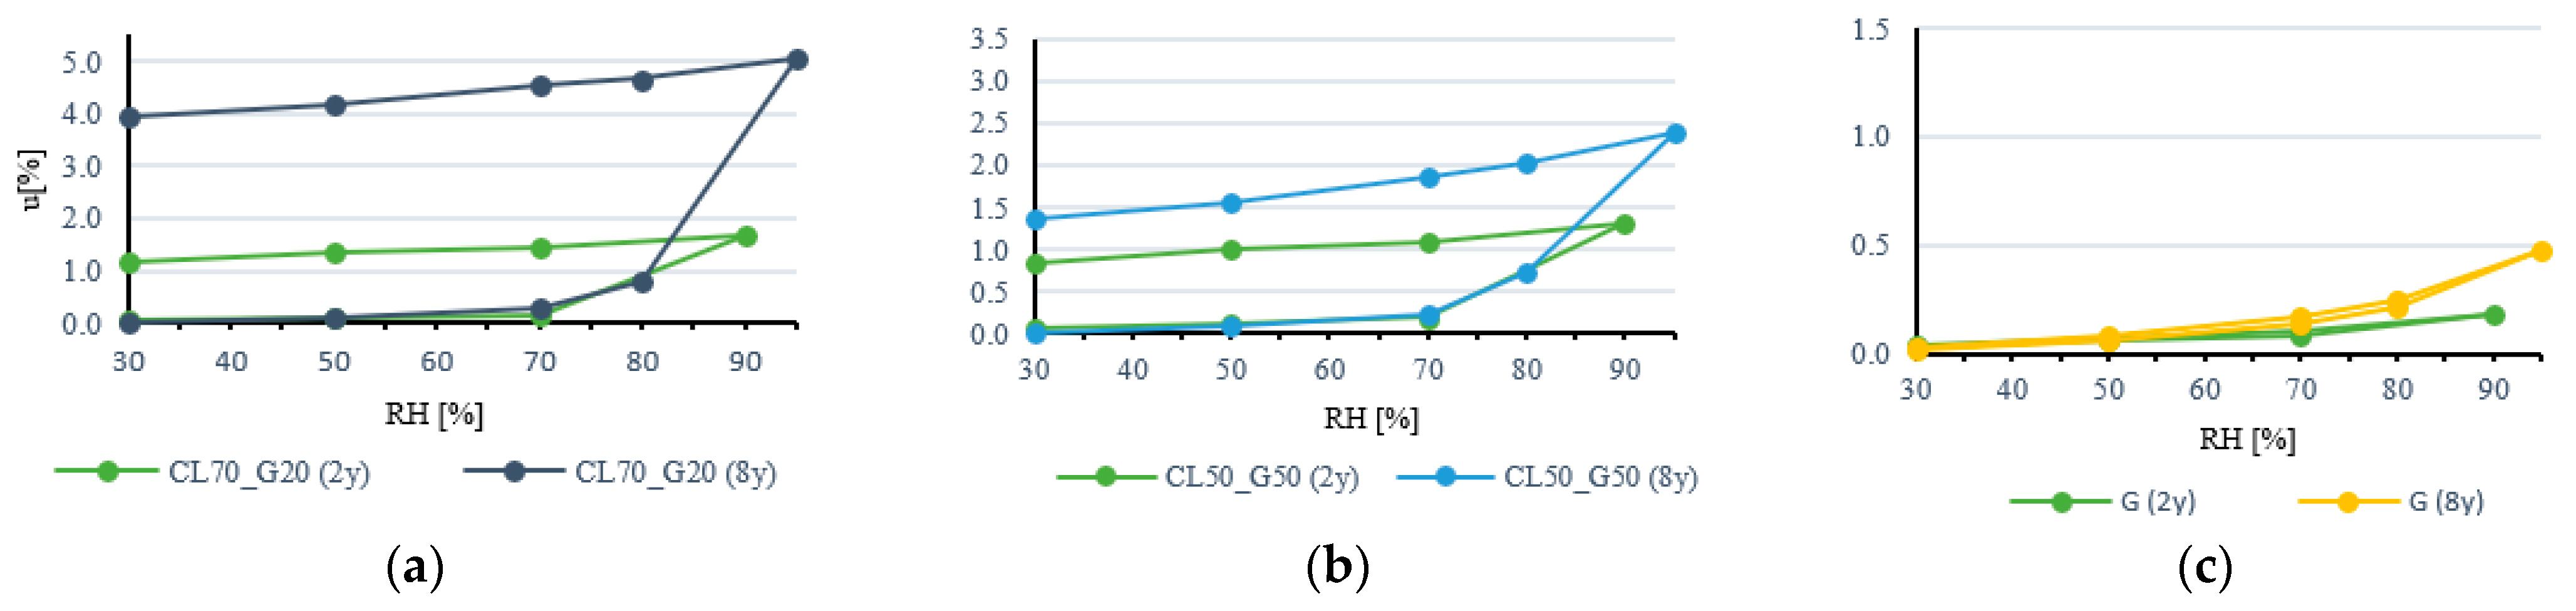
| MC (%) | CL70_G20 | CL50_G50 | G | |||||||||
|---|---|---|---|---|---|---|---|---|---|---|---|---|
| RH (%) | 8 y | 2 y | 8 y | 2 y | 8 y | 2 y | ||||||
| AV | SD | AV | SD | AV | SD | AV | SD | AV | SD | AV | SD | |
| 30 | 0.03 | 0.003 | 0.05 | 0.004 | 0.02 | 0.002 | 0.06 | 0.004 | 0.02 | 0.002 | 0.03 | 0.003 |
| 50 | 0.11 | 0.004 | 0.09 | 0.049 | 0.10 | 0.002 | 0.11 | 0.005 | 0.06 | 0.005 | 0.06 | 0.003 |
| 70 | 0.28 | 0.004 | 0.16 | 0.059 | 0.24 | 0.006 | 0.19 | 0.003 | 0.14 | 0.046 | 0.08 | 0.003 |
| 80 | 0.80 | 0.074 | – | – | 0.74 | 0.036 | – | – | 0.21 | 0.090 | – | – |
| 90 | – | – | 1.67 | 0.037 | – | – | 1.30 | 0.094 | – | – | 0.18 | 0.009 |
| 95 | 5.05 | 0.129 | – | – | 2.39 | 0.172 | – | – | 0.48 | 0.270 | – | – |
| 80 | 4.66 | 0.180 | – | – | 2.03 | 0.185 | – | – | 0.25 | 0.088 | – | – |
| 70 | 4.54 | 0.237 | 1.44 | 0.036 | 1.87 | 0.185 | 1.09 | 0.096 | 0.17 | 0.044 | 0.10 | 0.008 |
| 50 | 4.19 | 0.260 | 1.33 | 0.037 | 1.56 | 0.176 | 1.00 | 0.094 | 0.08 | 0.017 | 0.07 | 0.007 |
| 30 | 3.94 | 0.267 | 1.17 | 0.035 | 1.37 | 0.179 | 0.84 | 0.092 | 0.03 | 0.006 | 0.04 | 0.008 |
| Pastes and Mortars | WVP (kg/(m∙s∙Pa)) × 10−12 | MC(12 h) (g/m2) | MC30 (%) | MC50 (%) | MC70 (%) | MC80 (%) | MC95 (%) | MC80 (%) | MC70 (%) | MC50 (%) | MC30 (%) | MBV (g/(m2%RH)) |
|---|---|---|---|---|---|---|---|---|---|---|---|---|
| G | 35.53 | 25.5 | 0.02 | 0.06 | 0.14 | 0.21 | 0.48 | 0.25 | 0.17 | 0.08 | 0.03 | 0.61 |
| CL50_G50 | 37.36 | 43.6 | 0.02 | 0.10 | 0.24 | 0.74 | 2.39 | 2.03 | 1.87 | 1.56 | 1.37 | 1.03 |
| CL70_G20 | 37.68 | 54.8 | 0.03 | 0.11 | 0.28 | 0.80 | 5.05 | 4.66 | 4.54 | 4.19 | 3.94 | 1.27 |
| E | 21.50 | 74.4 | 0.04 | 0.19 | 0.44 | 0.64 | 1.29 | 0.80 | 0.53 | 0.22 | 0.05 | 1.49 |
| CL | 26.24 | 16.5 | 0.02 | 0.04 | 0.08 | 0.12 | 0.40 | 0.30 | 0.25 | 0.19 | 0.14 | 0.42 |
| NHL | 20.92 | 28.6 | 0.03 | 0.07 | 0.15 | 0.21 | 0.56 | 0.34 | 0.25 | 0.15 | 0.06 | 0.80 |
| C_0.9 | 9.55 | 40.2 | 0.03 | 0.12 | 0.26 | 0.38 | 1.16 | 0.91 | 0.65 | 0.47 | 0.30 | 0.84 |
| C_1.3 | 13.48 | 34.5 | 0.03 | 0.09 | 0.19 | 0.27 | 0.91 | 0.68 | 0.52 | 0.41 | 0.27 | 0.82 |
Publisher’s Note: MDPI stays neutral with regard to jurisdictional claims in published maps and institutional affiliations. |
© 2021 by the authors. Licensee MDPI, Basel, Switzerland. This article is an open access article distributed under the terms and conditions of the Creative Commons Attribution (CC BY) license (https://creativecommons.org/licenses/by/4.0/).
Share and Cite
Ranesi, A.; Faria, P.; Veiga, M.d.R. Traditional and Modern Plasters for Built Heritage: Suitability and Contribution for Passive Relative Humidity Regulation. Heritage 2021, 4, 2337-2355. https://0-doi-org.brum.beds.ac.uk/10.3390/heritage4030132
Ranesi A, Faria P, Veiga MdR. Traditional and Modern Plasters for Built Heritage: Suitability and Contribution for Passive Relative Humidity Regulation. Heritage. 2021; 4(3):2337-2355. https://0-doi-org.brum.beds.ac.uk/10.3390/heritage4030132
Chicago/Turabian StyleRanesi, Alessandra, Paulina Faria, and Maria do Rosário Veiga. 2021. "Traditional and Modern Plasters for Built Heritage: Suitability and Contribution for Passive Relative Humidity Regulation" Heritage 4, no. 3: 2337-2355. https://0-doi-org.brum.beds.ac.uk/10.3390/heritage4030132