
A System for Monitoring the Environment of Historic Places Using Convolutional Neural Network Methodologies


1
Peoples Friendship University of Russia (RUDN University), 6 Miklukho-Maklaya Street, 117198 Moscow, Russia
2
National Research Council, Istituto di Ingegneria del Mare (INM), 139 Rome, Italy
3
National Research Council, Istituto di Analisi dei Sistemi ed Informatica, LabGeoInf, Via dei Taurini, 19, I-00185 Rome, Italy
*
Author to whom correspondence should be addressed.
Heritage 2021, 4(3), 1429-1446; https://0-doi-org.brum.beds.ac.uk/10.3390/heritage4030079
Submission received: 25 May 2021
/
Revised: 13 July 2021
/
Accepted: 20 July 2021
/
Published: 28 July 2021
(This article belongs to the Special Issue Cultural Heritage and Archaeology in a Digitalized World: Methods and Practices)
Abstract
:This work aims to contribute to better understanding the use of public street spaces. (1) Background: In this sense, with a multidisciplinary approach, the objective of this work is to propose an experimental and reproducible method on a large scale. (2) Study area: The applied methodology uses artificial intelligence to analyze Google Street View (GSV) images at street level. (3) Method: The purpose is to validate a methodology that allows us to characterize and quantify the use (pedestrians and cars) of some squares in Rome belonging to different historical periods. (4) Results: Through the use of machine vision techniques, typical of artificial intelligence and which use convolutional neural networks, a historical reading of some selected squares is proposed, with the aim of interpreting the dynamics of use and identifying some critical issues in progress. (5) Conclusions: This work validated the usefulness of a method applied to the use of artificial intelligence for the analysis of GSV images at street level.
1. Introduction
Google Maps and Street View were not developed for scientific research; however they create interesting research possibilities in the urban environment. Google Street View (GSV) was released in 2007 and differs from traditional mapping software by directly capturing the visual aspect at ground level. By blending together images taken from different angles, Street View creates what appears to be a seamless tour of the city streets and can give the feeling of “being there” [1]. GSV’s images have been studied in the computer vision community, although they were not created for research.
At different times and modalities, these studies included the auditing of public open spaces [2,3], or neighborhood environmental audits [4,5,6,7], or recognizing urban identities [8], or acoustic comfort [9], or the comfort of sensations [10], or aspects of sociability, or attachment to place [11].
There are other sources of data that can be used to understand, study and measure the urban environment.
For example, remote sensing with high spatial resolution has been used for the study of street greenery in historic centers [12], for the estimation of the height of buildings and for the extraction of features in the historical urban landscape and for the classification of roofs in the historic center of Rome [13].
However, remote data with high spatial resolution are not always available. Furthermore, the profile view of road landscapes, which people experience and see from eye level, is different from the top view captured in remotely sensed images [1,14]. These differences can be overcome with manual inventories and field surveys; however, the collection of data in situ is laborious, time-consuming and allows for detection errors, especially if carried out by non-experts or volunteers [15]. GSV data, in addition to being available to everyone, through the historical series also allow to us to understand the evolution in the short term.
However, their use in the context of knowledge of urban cultural heritage, in particular regarding the use of public spaces with historical and architectural value, is still very limited and not fully explored. GSV images, when paired with computer vision and machine learning algorithms such as neural networks, offer a new way of seeing.
Urban heritage is now recognized as a social whole that changes over time and space in response to different social, economic and political processes. The conservation of the urban heritage is no longer focused exclusively on the protection of historical assets, but also on the management of change at the city level [16,17,18]. In this regard, the UNESCO “Recommendation” (2011) defines the historical urban landscape as “the result of a historical stratification of cultural and natural values and characters, composed of both buildings, open spaces, green and not, and aspects topographical, hydrological and natural, to include perceptions and visual relationships” [19]. The “Recommendation” proposes that public spaces not only be definitively recognized as an integral part of the historical urban landscape, but above all become an asset to be valued. In fact, it suggests an approach that aims to preserve the “quality of the human environment” and to improve “the productive and sustainable use of open spaces, recognizing their dynamic and changing character over time and promoting social and functional diversity (…) in a balanced and sustainable relationship between urban areas and the natural environment” [19].
In Italy, Legislative Decree 42/2004 defines cultural assets, that therefore need to be protected, including “public squares, streets and other urban open spaces of artistic or historical interest”, as an expression of the “vocational matrix of a place, or its social and testimonial value” [20].
In this study, attention was paid to a particular aspect of our historical heritage: squares. These have been essential elements in the life of the city and a focal point for social life. Today, the historic squares, considering their undisputed and multifaceted value for the entire community, still offer a precious space within historical scenarios that deserve the greatest attention. Consequently, a thorough understanding of them has important implications for urban geography, urban planning and public health; those who investigate the urban environment, its interactions and its implications on human well-being can greatly benefit from it. The analysis and interpretation tools for public spaces of historical and architectural value, in addition to being open to participation and collaboration between different knowledge and skills, require a dynamic approach capable of grasping the different functions and relationships, as envisaged in the UNESCO Recommendation cited above [19]. These technologies all have the potential to help in gaining a better understanding of the use of public spaces at the street level and in studying social phenomena through new tools [21]
Another aim of this study is to stimulate and increase interdisciplinary discussion on the use of “big data” online and on recent computational advances. The results are helpful for planning and design and, in particular, for the use and enhancement of cultural and environmental heritage. The methodology proposed in this study can be used for environmental audits related to the use of space with motorized and non-motorized activities, the presence of tourists, the sense of safety and comfort, for example by automatically detecting benches, trees, street lamps, etc., [22,23,24]. This people-focused study, in order to inform decision-making, will help to improve understanding of urban heritage and the divergences between experts and users at the level of use of the city.
2. Study Area
Rome represents an interesting testing ground, because it has a great variety of historic squares that are points of attraction in the city. Due to the variety of situations present, it is difficult to establish criteria for the selection of the squares under study. To try to overcome the difficulties inherent in the choice and in order to obtain information that is as coherent, objective and reliable as possible, we identified the working hypothesis that selected the study areas based on the availability of GSV data; data from May 2018 (before SARS-CoV-19) and September 2020 (full pandemic) were selected. The selection of squares was made on the basis of the availability of images for both years considered (2018 and 2020).
GSV’s images are not always constant over time and space, and therefore the selection of squares was also dictated by the availability and updates available online. The choice to acquire the images in two different periods (pre COVID-19 and full pandemic) was motivated by the need to have a comparative picture that is as truthful as possible.
It was not possible to overcome the limitations imposed by the GSV images dictated by the time of observation: time of day, time of week and time of year. Another limit to the work was imposed by the non-availability of images where there are traffic restrictions. This is the case of Piazza Navona and Piazza del Popolo, where the acquisitions were instead captured at the limits of accessibility, safeguarding the overall view (presence of people, cars, bicycles, etc.).
The images of each square were sorted by historical period: medieval, Renaissance-Baroque, or nineteenth century (Table 1).
3. Materials and Methods
As per Table 1, two significant sample images were collected and processed for each square. The images processed in this work through machine vision techniques were all virtual; it is possible to use the same method even with real images taken in a different time frame [25]; for the analysis of temporal comparison [26], it is important that the framing of the scene is always the same [27,28,29]. The choice of the most suitable network for training in the specific application domain focused on convolutional neural networks (CNN), which are a regularized version of the multilayer perceptive networks, also defined as deep neural networks [30,31,32,33,34]. Deep learning is an important part of machine learning, and deep learning algorithms rely on neural networks. Below are the general and CNN-specific features of a machine learning network [35,36].
3.1. Neural Networks
Artificial neural networks are systems used in the field of artificial intelligence that are vaguely inspired by the biological neural networks of animals [37]. These systems, similarly to biological neural networks, base their operation on the learning ability that allows one to perform operations thanks to the pre-programmed knowledge and what they learn in the environment in which they operate [38], therefore, they are generally not programmed in a specific way or in any case with specific rules. In image recognition, in a first phase, an artificial neural network can learn to identify objects by means of manual identification and memorization [39,40]. Later, the result of this learning serves to identify specific objects in new images that are completely different from those used to instruct the system previously.
3.2. Architecture of a Neural Network
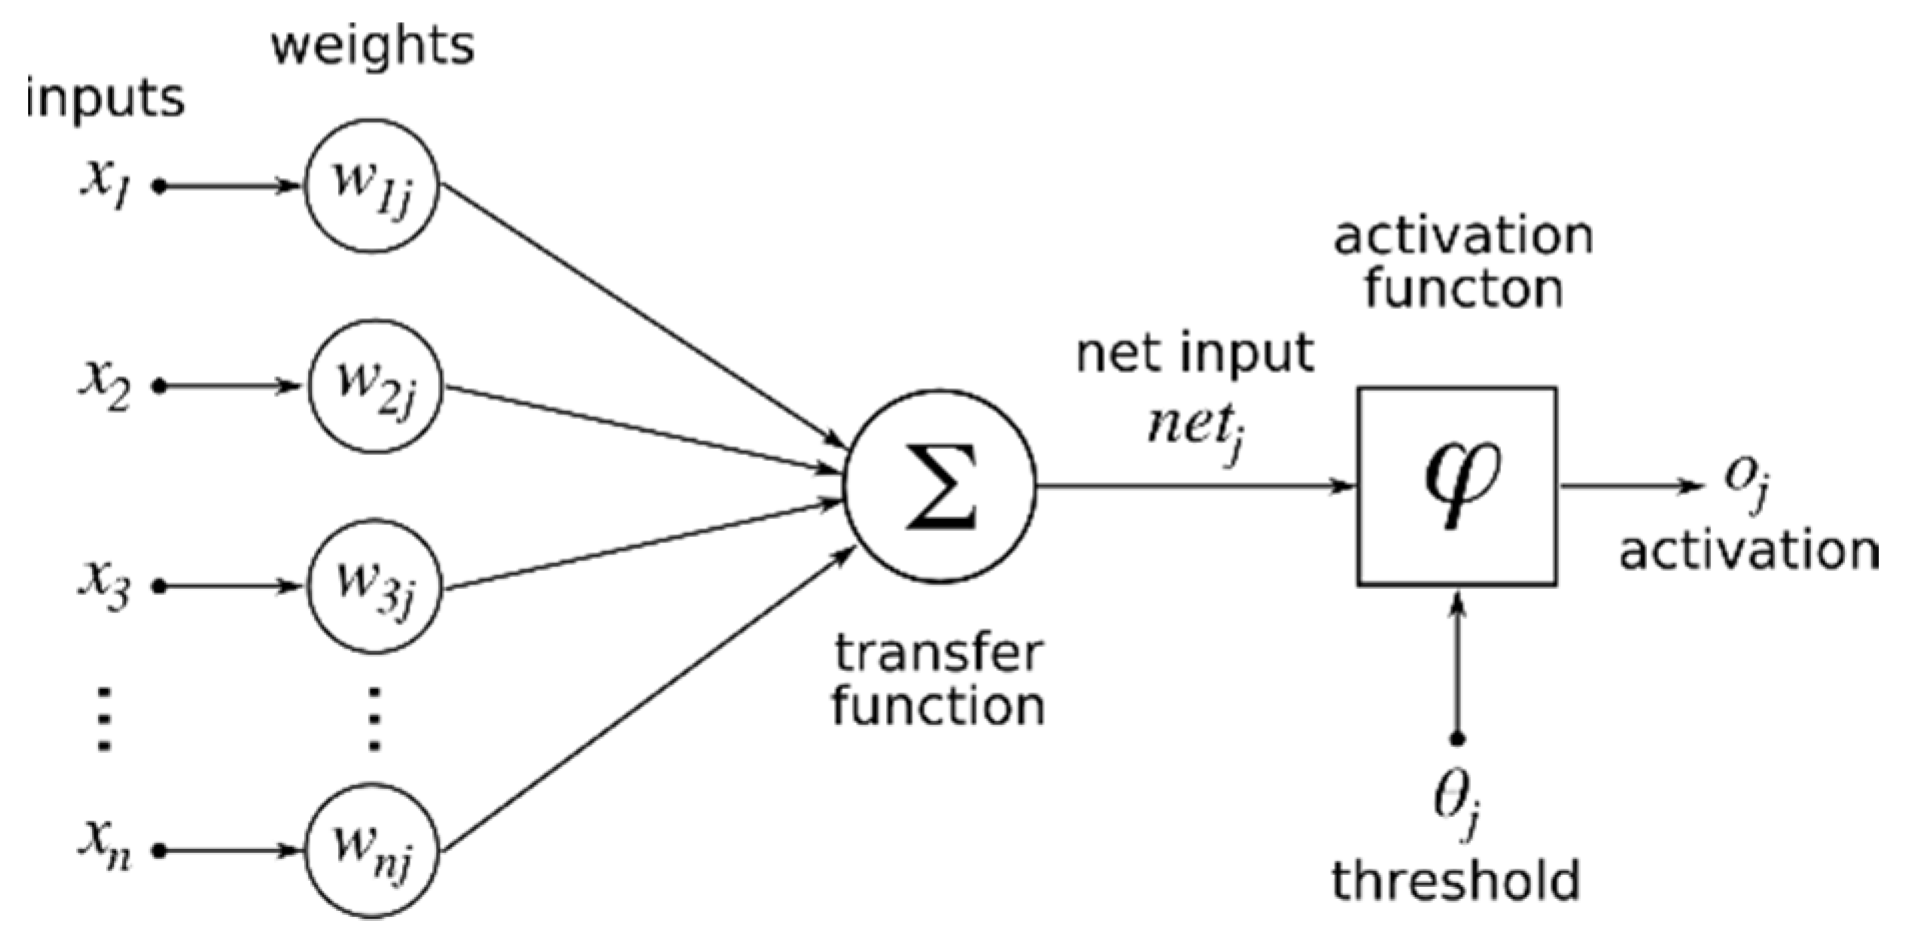
The architecture of artificial neural networks is composed of artificial neurons, which try to replicate the concept of a biological neuron that receives different inputs; the inputs are combined with their internal state and with a predetermined optional threshold using a certain activation function; the output is produced using a different function (Figure 1). The network also consists of connections; each connection transmits the output of a neuron as an input to another neuron, and a weight value is assigned to each link by the emitting neuron which determines the importance of that link [41,42]. Each neuron can have multiple input and output connections. The propagation function computes the input of a neuron from the output of its predecessor and its connection as a weighted sum. To this can be added a further term bias.
3.3. Perceptron
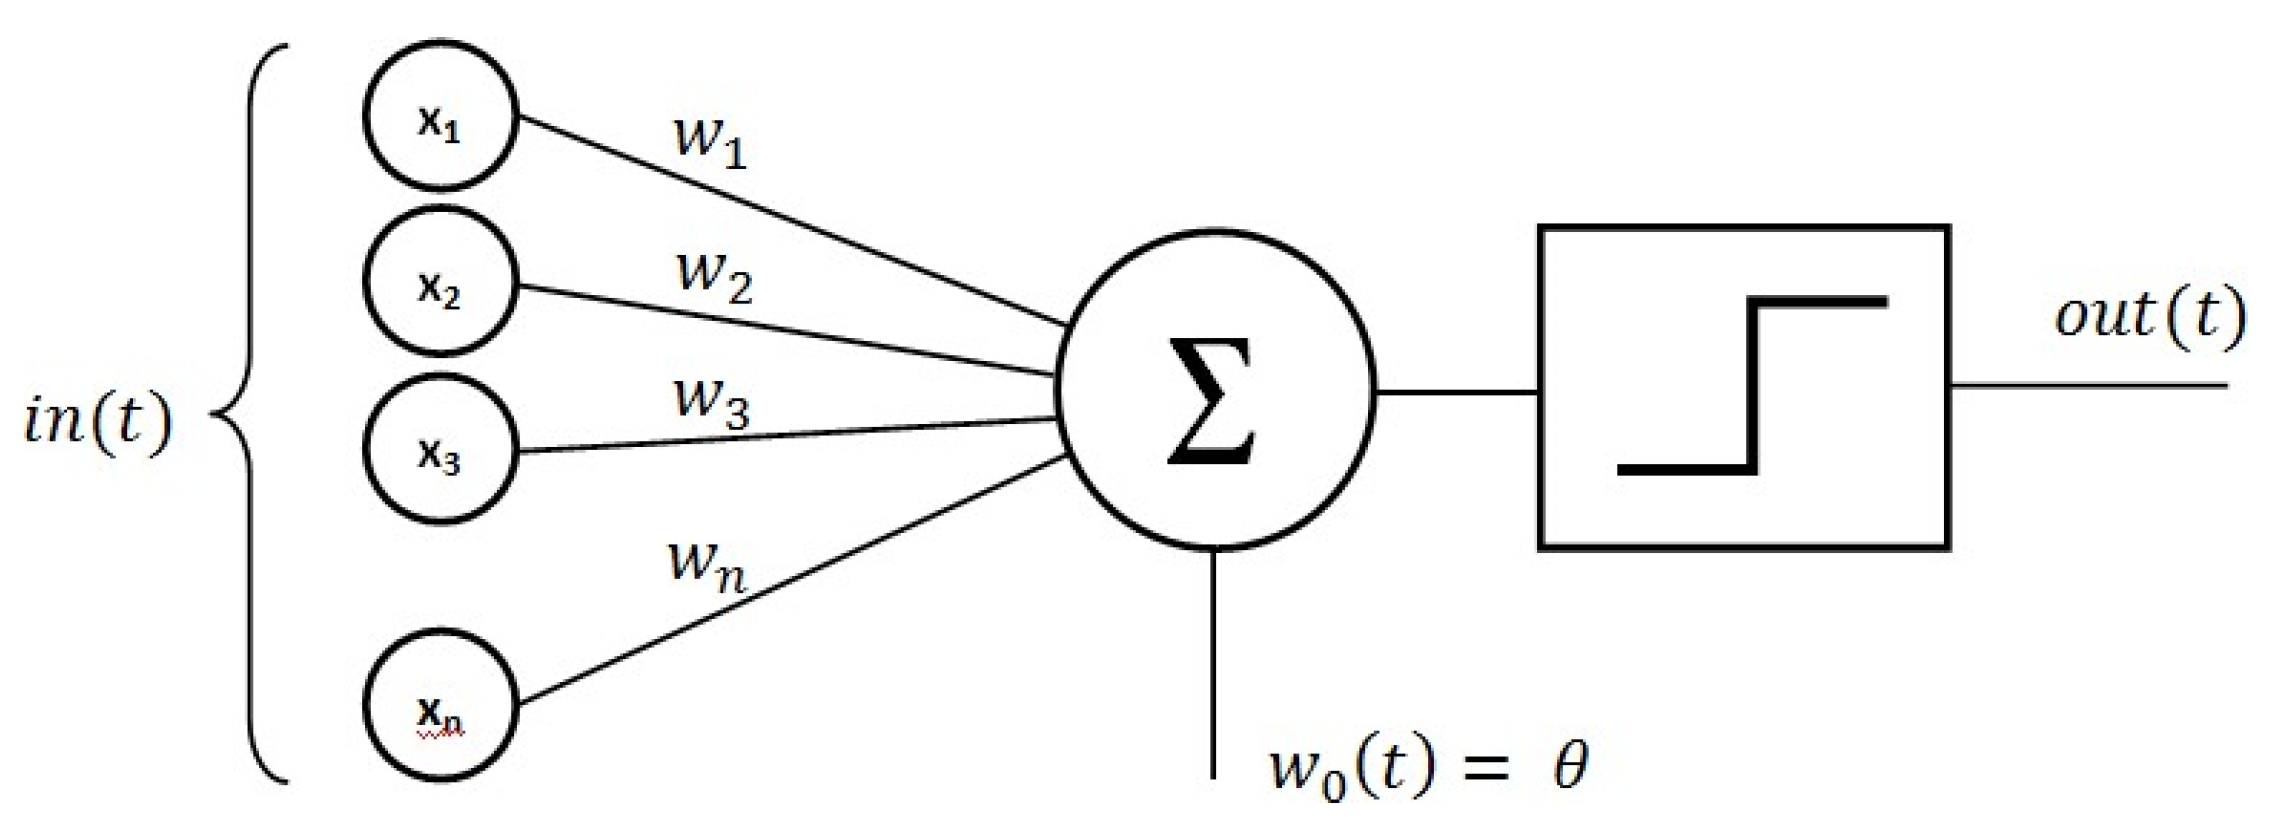
The percepter is an algorithm for the supervised learning of binary classifiers of artificial neural networks [43,44]. The binary classifier is a function that can understand when an input, represented by a vector of numbers, belongs to a certain class. It is therefore a linear classifier that makes its predictions based on a linear prediction function by combining a set of weights with a vector of characteristics (Figure 2). Single-layer perceptrons are capable of learning only linearly separable patterns. Perceptrons with a second layer are used for complex classification tasks, which are able to solve many problems otherwise solvable with separations.
The perceptron can be seen as an algorithm that, receiving an input of a vector x with the values (x₁, x₂, xₘ), returns a value that can be 0 or 1, and the following function is defined:
where w is the vector of weights and b is the bias, w is a vector of weights as real values, and w ∙ x is the scalar product:
f(x) = {1 if (w ⋯ x + b) > 0
0 𝑜𝑡ℎ𝑒𝑟𝑤𝑖𝑠𝑒
3.4. Learning
Learning is a phase that allows a network to better process a type of data, analyzing samples of that same type of data. Learning involves adjusting the weights and thresholds to increase the accuracy of the operation and therefore the result by minimizing the observed error. Learning is considered finished when the review of new analyses does not considerably reduce the error. Generally, even after the end of the learning phase, the error percentage never reaches 0; however, if this value is too high, then the network probably needs to be redesigned.
This is done practically by defining a cost function that is periodically evaluated during learning; learning continues as long as the output error continues to decrease significantly. The learning rate defines the size of the steps that the learning model takes to adjust the error in each observation. A high learning rate reduces learning time but reduces accuracy; instead, a slow learning speed slows the process down, but could potentially increase accuracy.
Optimizations, through the use of algorithms such as Quickprop, are generally aimed at speeding up error minimization; other improvements that aim to improve reliability are also taken into consideration. To avoid fluctuations within the network, such as the alternation of connection weights, and to improve the convergence rate, an adaptive learning rate is used that increases or decreases as needed. The concept of momentum allows the balance between the gradient and the previous change; this concept must be weighed in such a way that the weight adjustment depends for some degrees on the previous change.
3.5. Convolutional Neural Network
In the deep learning discipline, a convolutional neural network (CNN) is a class of deep neural networks and is generally used to analyze images. CNNs are also known as “space invariant artificial neural networks” (SIANN) due to their architecture based on weight sharing and symmetrical translation characteristics [45,46].
These networks are applied in image recognition, image classification, image analysis in the fields of medicine, natural language processing and time series in finance. In a convolutional neural network, each neuron receives inputs from a certain number of positions in the successive layers; in a completely connected layer, as already seen, each neuron receives input from each element of the previous layer, while in a convolutional layer the neurons receive input only from the components of a restricted area of the previous layer. This area is generally square in shape, for example 10 × 10 pixels, and is called the receptive field with respect to the single neuron, referring, as already seen, to the operating logic of the animal visual cortex.
This receptive field in the case of a completely connected layer corresponds to the entire previous layer, while in the case of a convolutional layer, it is a subset of the same. The working area of the original image in the receptive field increases more and more as the system analyzes the following layers of the network in depth; this is because the various convolutional layers and therefore the various convolution operations take into consideration the value of the specific pixel, but also the value of some of the pixels that surround it.
Each neuron in the artificial neural network generates an output by applying a specific function to the inputs arriving from the receptive field of the previous layer. This function is determined by a weight vector and a bias value. Learning then proceeds with the interactive updating of these weights and this bias. The weight vector and the bias are called filters and represent particular characteristics of the input; these filters can be shared by different neurons significantly reducing the amount of memory required for the various computations. This characteristic is typical of convolutional artificial neural networks (CNN). In particular, both for performance and for the adequacy of the networks in the specific job, the YOLO V3 network was chosen, which uses 53-layer Darknet-53 as a feature extractor. The two most important parts of Darknet-53 are Convolutional and ResNet. The 1 × 1 pixel convolution can compress the number of channels of the feature map to reduce model computation and parameters. The 3 × 3 pixels multiple convolution turns out to be nonlinear for a large convolution layer of the filter, making the decision function more conclusive. ResNet can make a network deeper, faster, and easier to optimize, with fewer parameters and less complexity than other models; therefore, it can solve the deep network problem regarding degradation and learning difficulties. Darknet-53 performs a total of five dimensionality reductions on operations. The number of rows and columns belong to the matrix of characteristics of each dimension. The level of reduction reduces by half, while the depth doubles compared to the previous one. In this work, it was decided to divide learning into two categories:
- the first category of prediction is defined by real images taken in environments with different lighting and different scenarios;
- the second category of prediction is defined by virtual images taken by GSV.
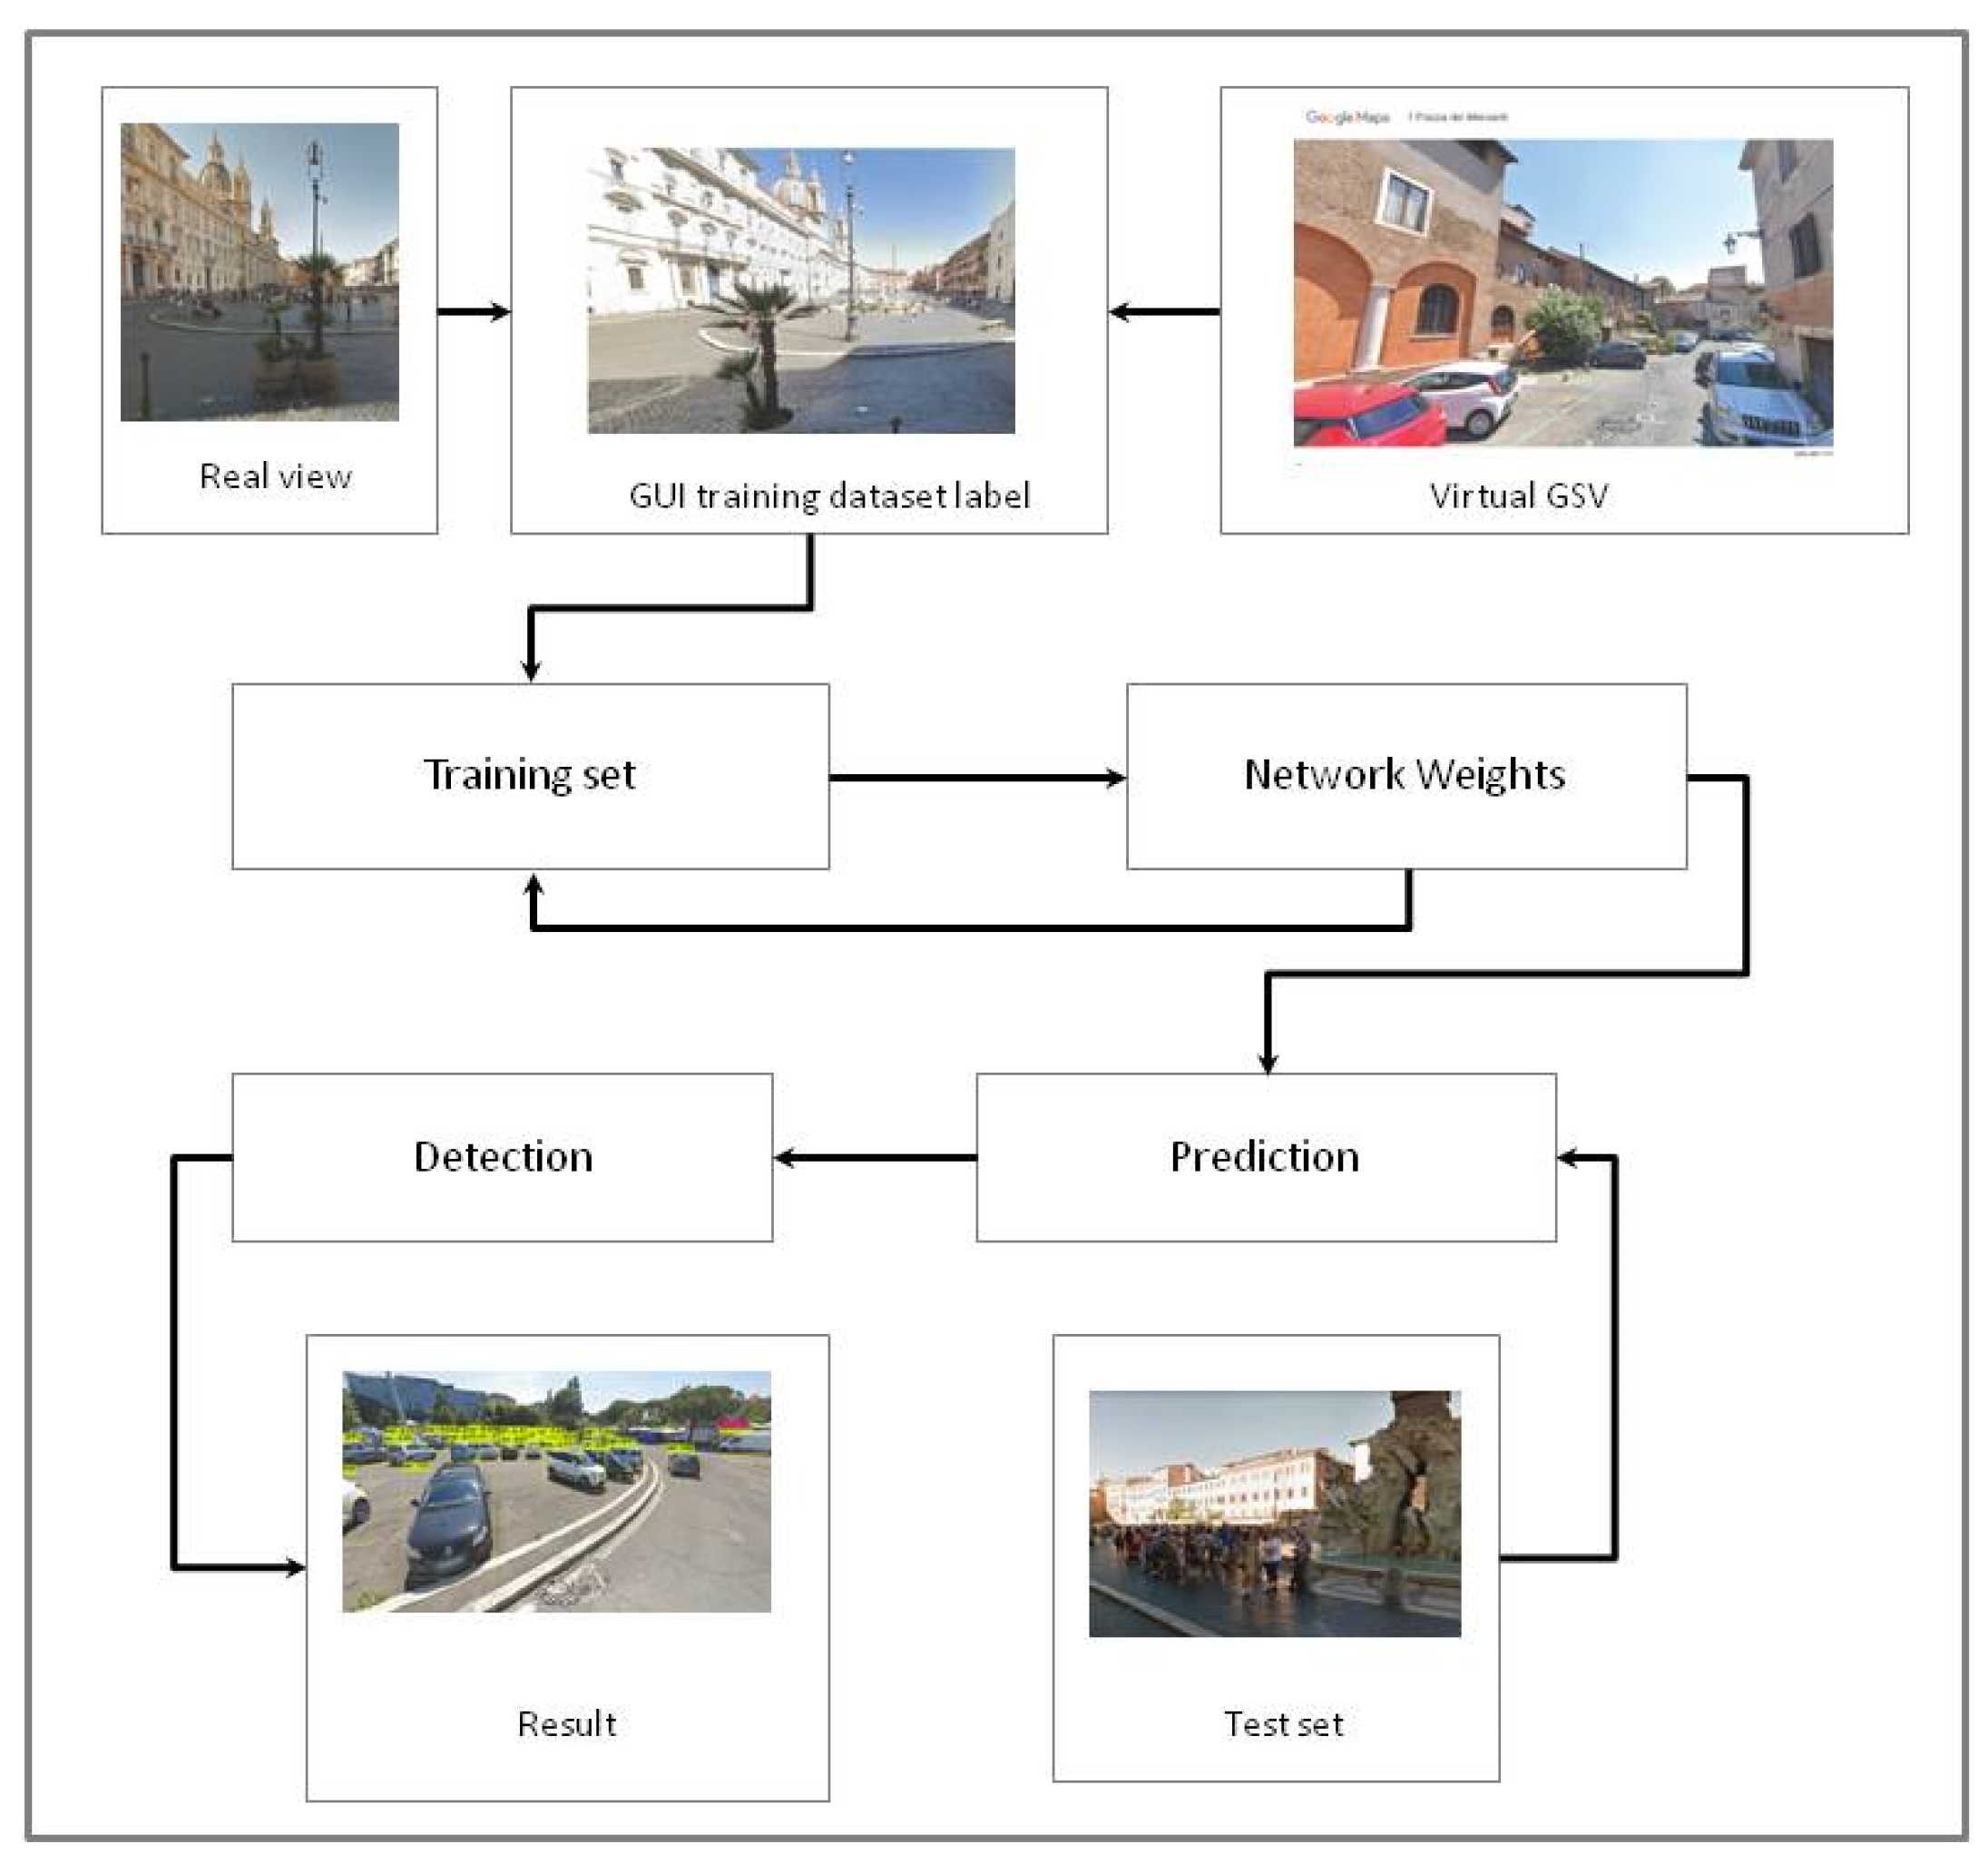
The two categories are used for training the deep learning network; the error between the aforementioned value and the real value is calculated by the loss function (MSE, MAE, Huber Loss) using the backpropagation of the error in the neural network and constantly adjusting the weight of each convolutional layer of the network to complete the training of the model. With this process outlined in Figure 3, which represents the algorithm pipeline, the loss function determines the direction in which the model is trained [47].
In the images of the elaborations, the percentages of recognition of the objects according to the classified categories are clearly visible (see Table 2); in many cases, when visibility is good, 100% accuracy is attained. However, in all cases where the accuracy is below 50%, the category prediction is always correct.
4. Results
The processing results are summarized in Table 3:
4.1. The Medieval Squares
The two aforementioned squares are located in the Trastevere district, to the right of the Tiber, below Tiber Island; this area in the Middle Ages had its spaces subordinated to the activities of the port of Ripa Grande, and had strategic points for the control of the Cestio and Rotto bridges [48].
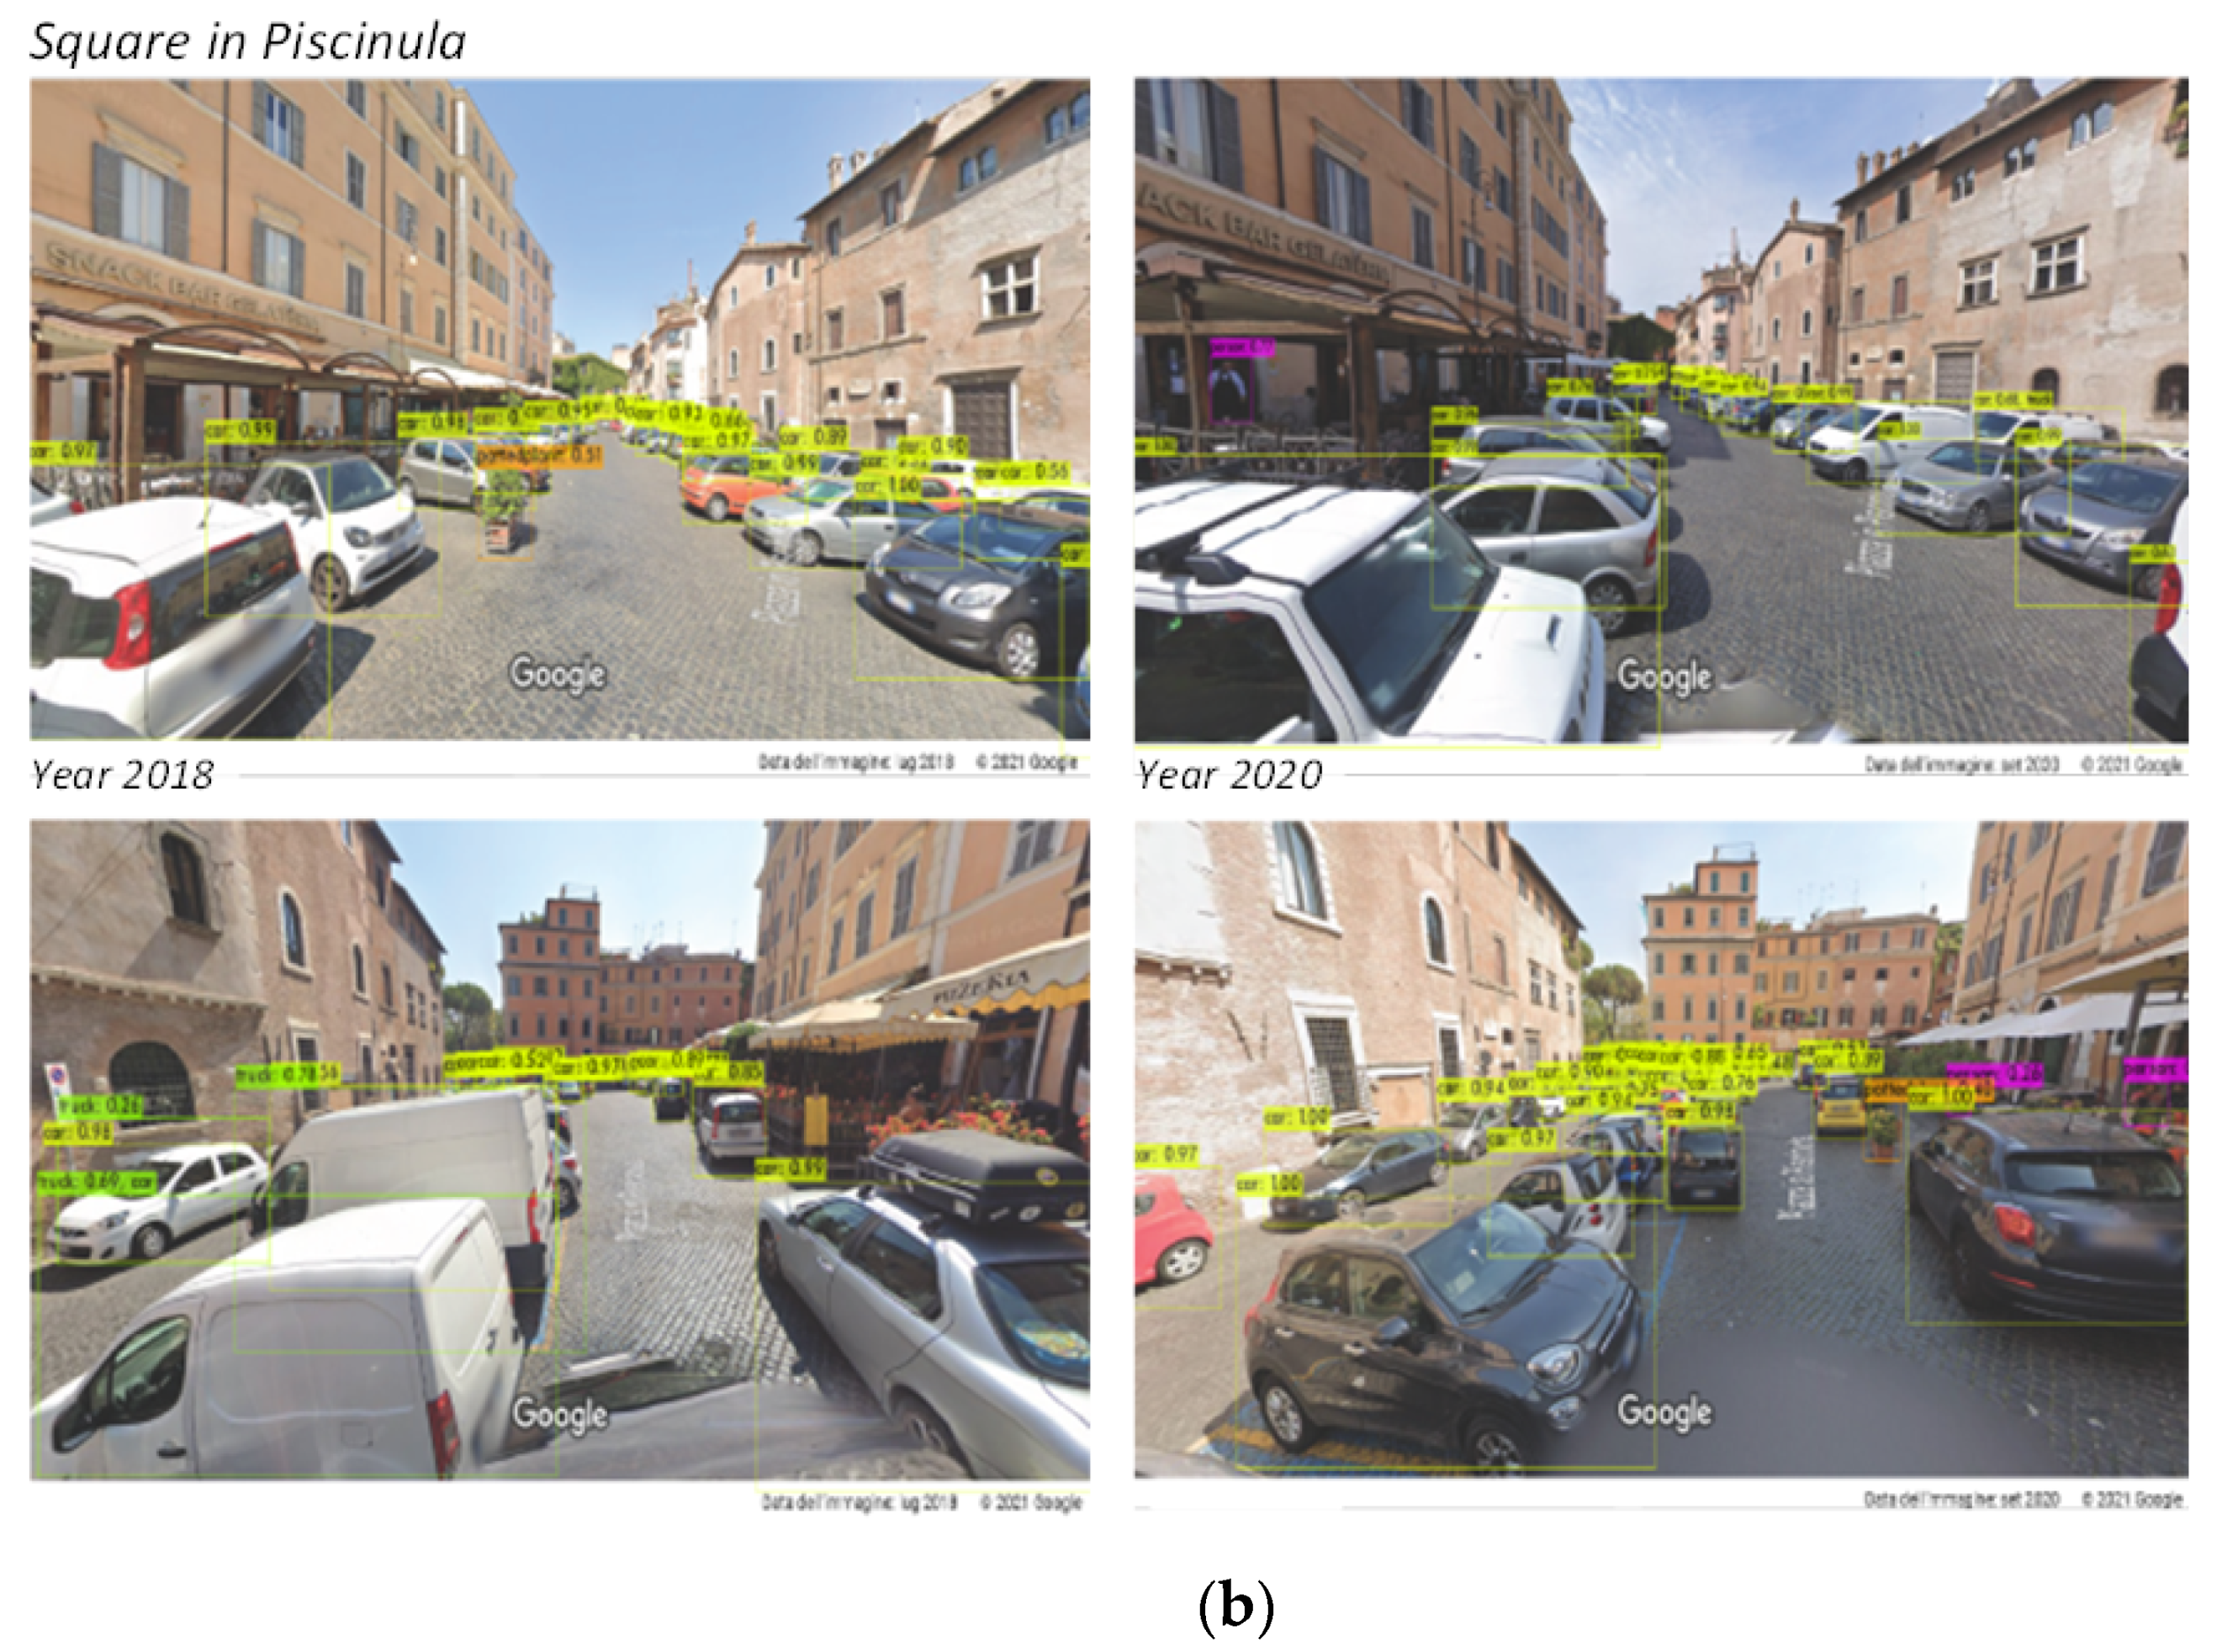
The square, used as a place of sociality and collective recognition, played an essential role in the Middle Ages in the urban scenario, where people met in a space rich in history and art, sharing daily life in its various aspects (economic, religious and political); the images of Piazza dei Mercanti and Piazza in Piscinula confirm a change (Figure 4a,b. The elaborations of Piazza dei Mercanti in 2018 featured 29 parked cars, 2 vans, 1 bicycle, and only the presence of 1 person. The situation is similar in 2020, with 25 parked cars and 2 umbrellas; with an area of about 711 square meters, we can estimate a percentage of about 25% of the square being designated for parking spaces for parked cars.
Near Piazza dei Mercanti, we find Piazza in Piscinula (11th century). In this area, some important medieval buildings mentioned by Sitte (1980) [49] are recognizable in the elaborate images; they are the “closed” circumscribed spaces, large “excavated” courtyards that isolate the square from the rest of the town [49]. These characteristics also correspond to the concept of the medieval square: a finished place, distinct from the rest of the city [50,51].
The elaborations of Piazza in Piscinula confirm that the parking spaces represent 25% of the surface of the square (1100 m2); in addition, the almost complete absence of people, with three in 2018 and one in 2020, represents a clear sign of the incongruous use of public space.
Both squares, Mercanti and Piscinula, despite having unique architectural characteristics, due to the presence of the remains of medieval architecture, are open-air car parks, a condition obviously unsuitable to encourage outdoor activities and to induce people to stop and enjoy themselves during the day [51]. In this regard, Lauria (2017) [52] asserts that the improper use of space represents an easily recognizable manifestation of residuality; however, it is very difficult to define. It can be assessed by each of its inhabitants as “adequate” for some types of activities and “inadequate” for others. This can also happen within the same urban context. It all depends on the personal point of view of the inhabitant, on his contingent or structural needs, on his wealth of experience, and “social categories”: between tourists and residents, between the elderly and the young, between the rich and the poor, between pedestrians and motorists, and so on. For example, in some artistic cities, tourism in a hurry constitutes a critical element so strong that it compromises the emotional relationship between public space and the resident community. Having said that, with due caution, it can be said that “inappropriate” activities limit the free use of urban space by the majority of inhabitants, inhibiting the typical functions of public space (walking, meeting, talking, pausing, playing, etc.); furthermore, “inappropriate” activities weaken the “social” potential of the public space.
It is also true that deserted spaces, especially in the artistic cities most affected by mass tourism, such as Rome and specifically the medieval district, could, if properly equipped, represent for the visitor a moment of rest, of respite from the incessant rhythm of the city; in the tranquility, they could help a tourist to appreciate the beauty of the present urban landscape.
4.2. The Renaissance Squares
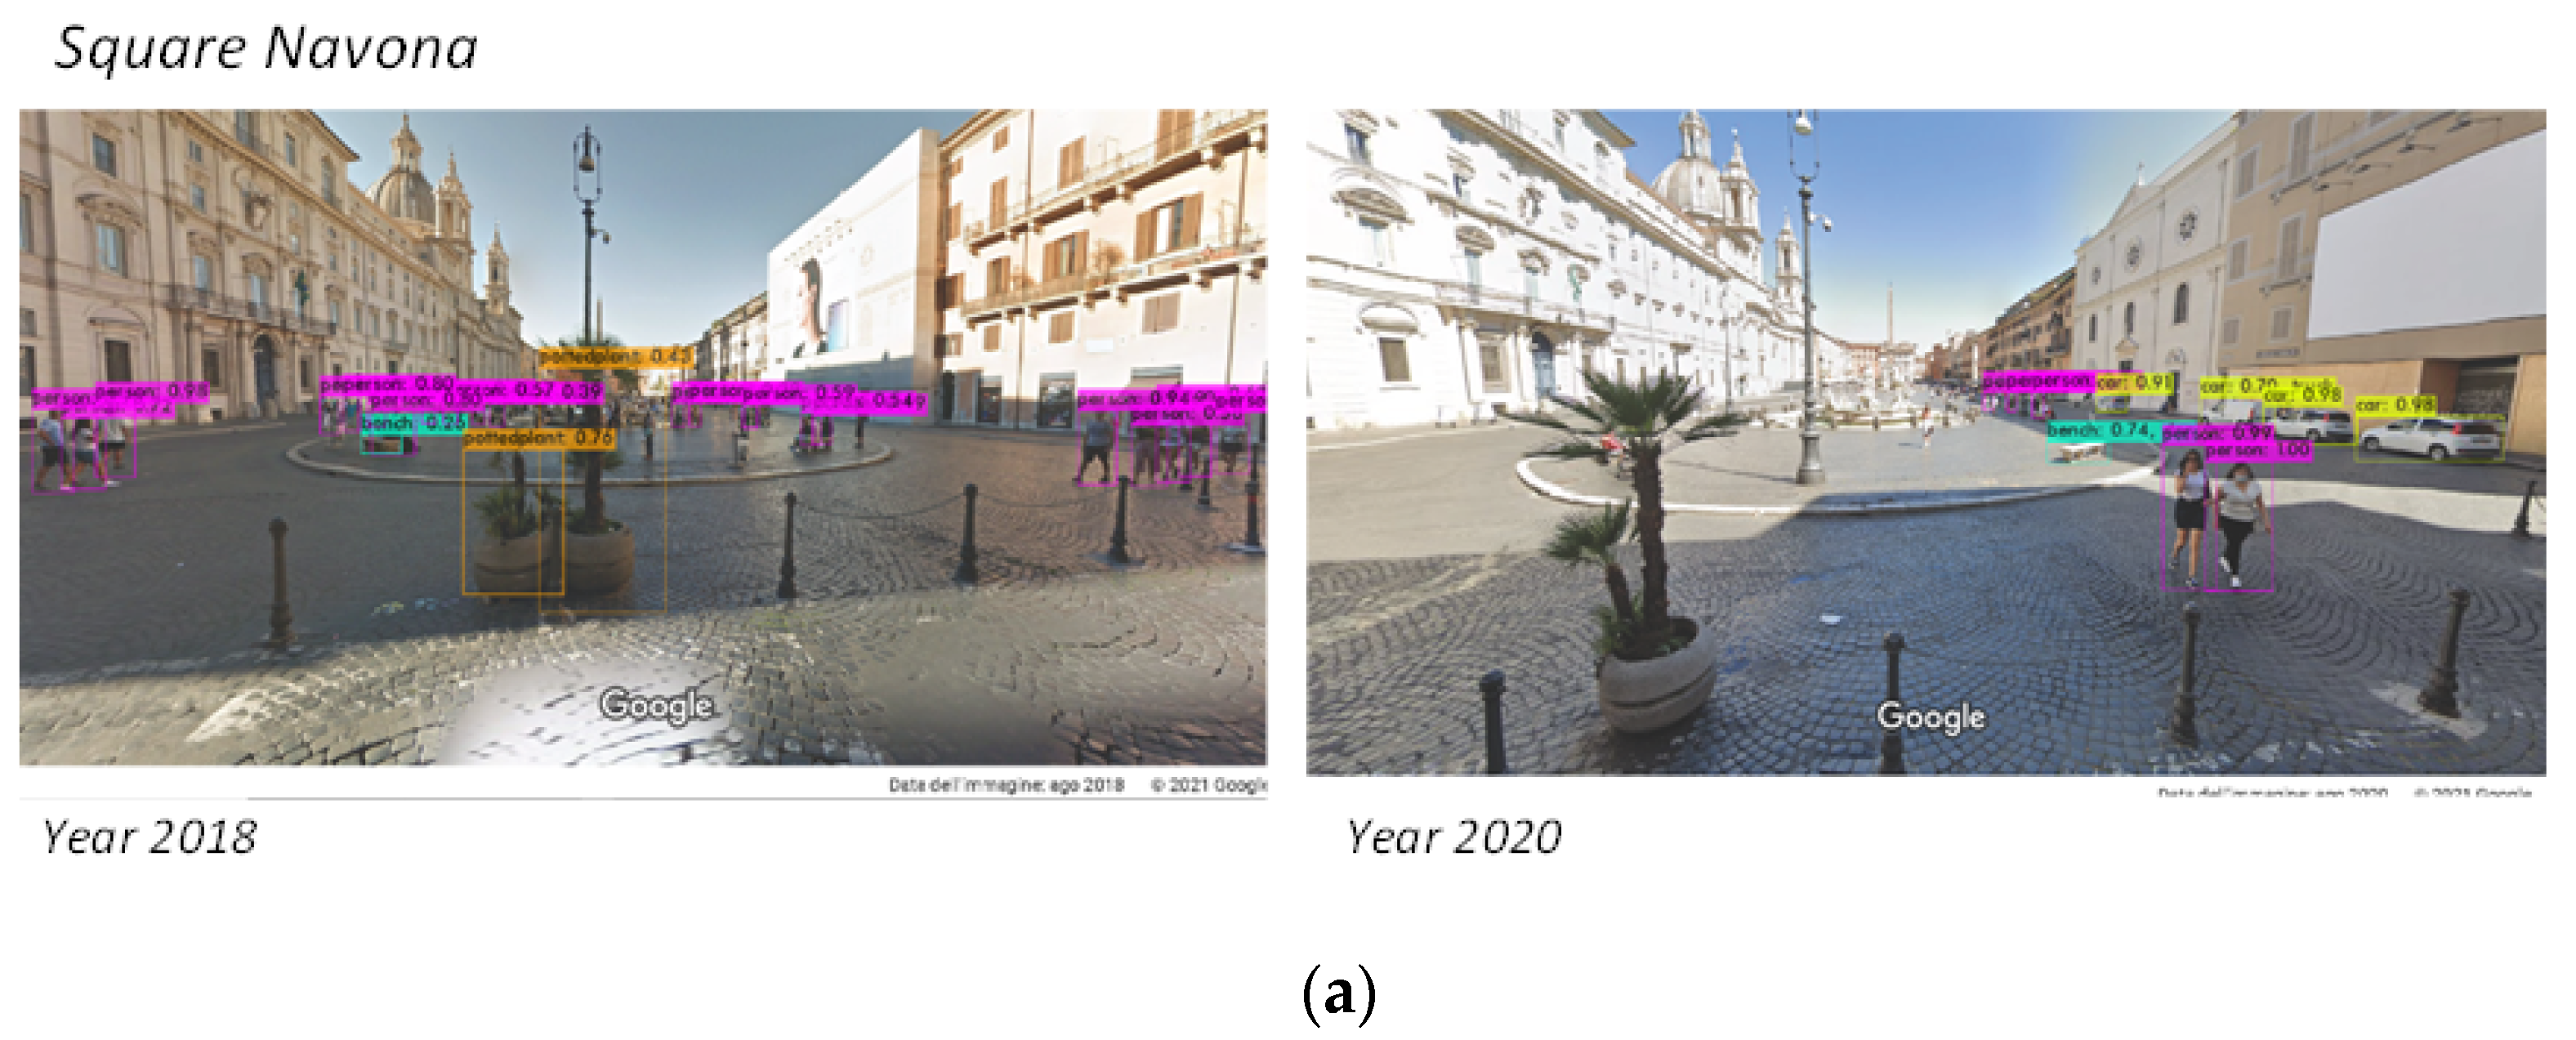
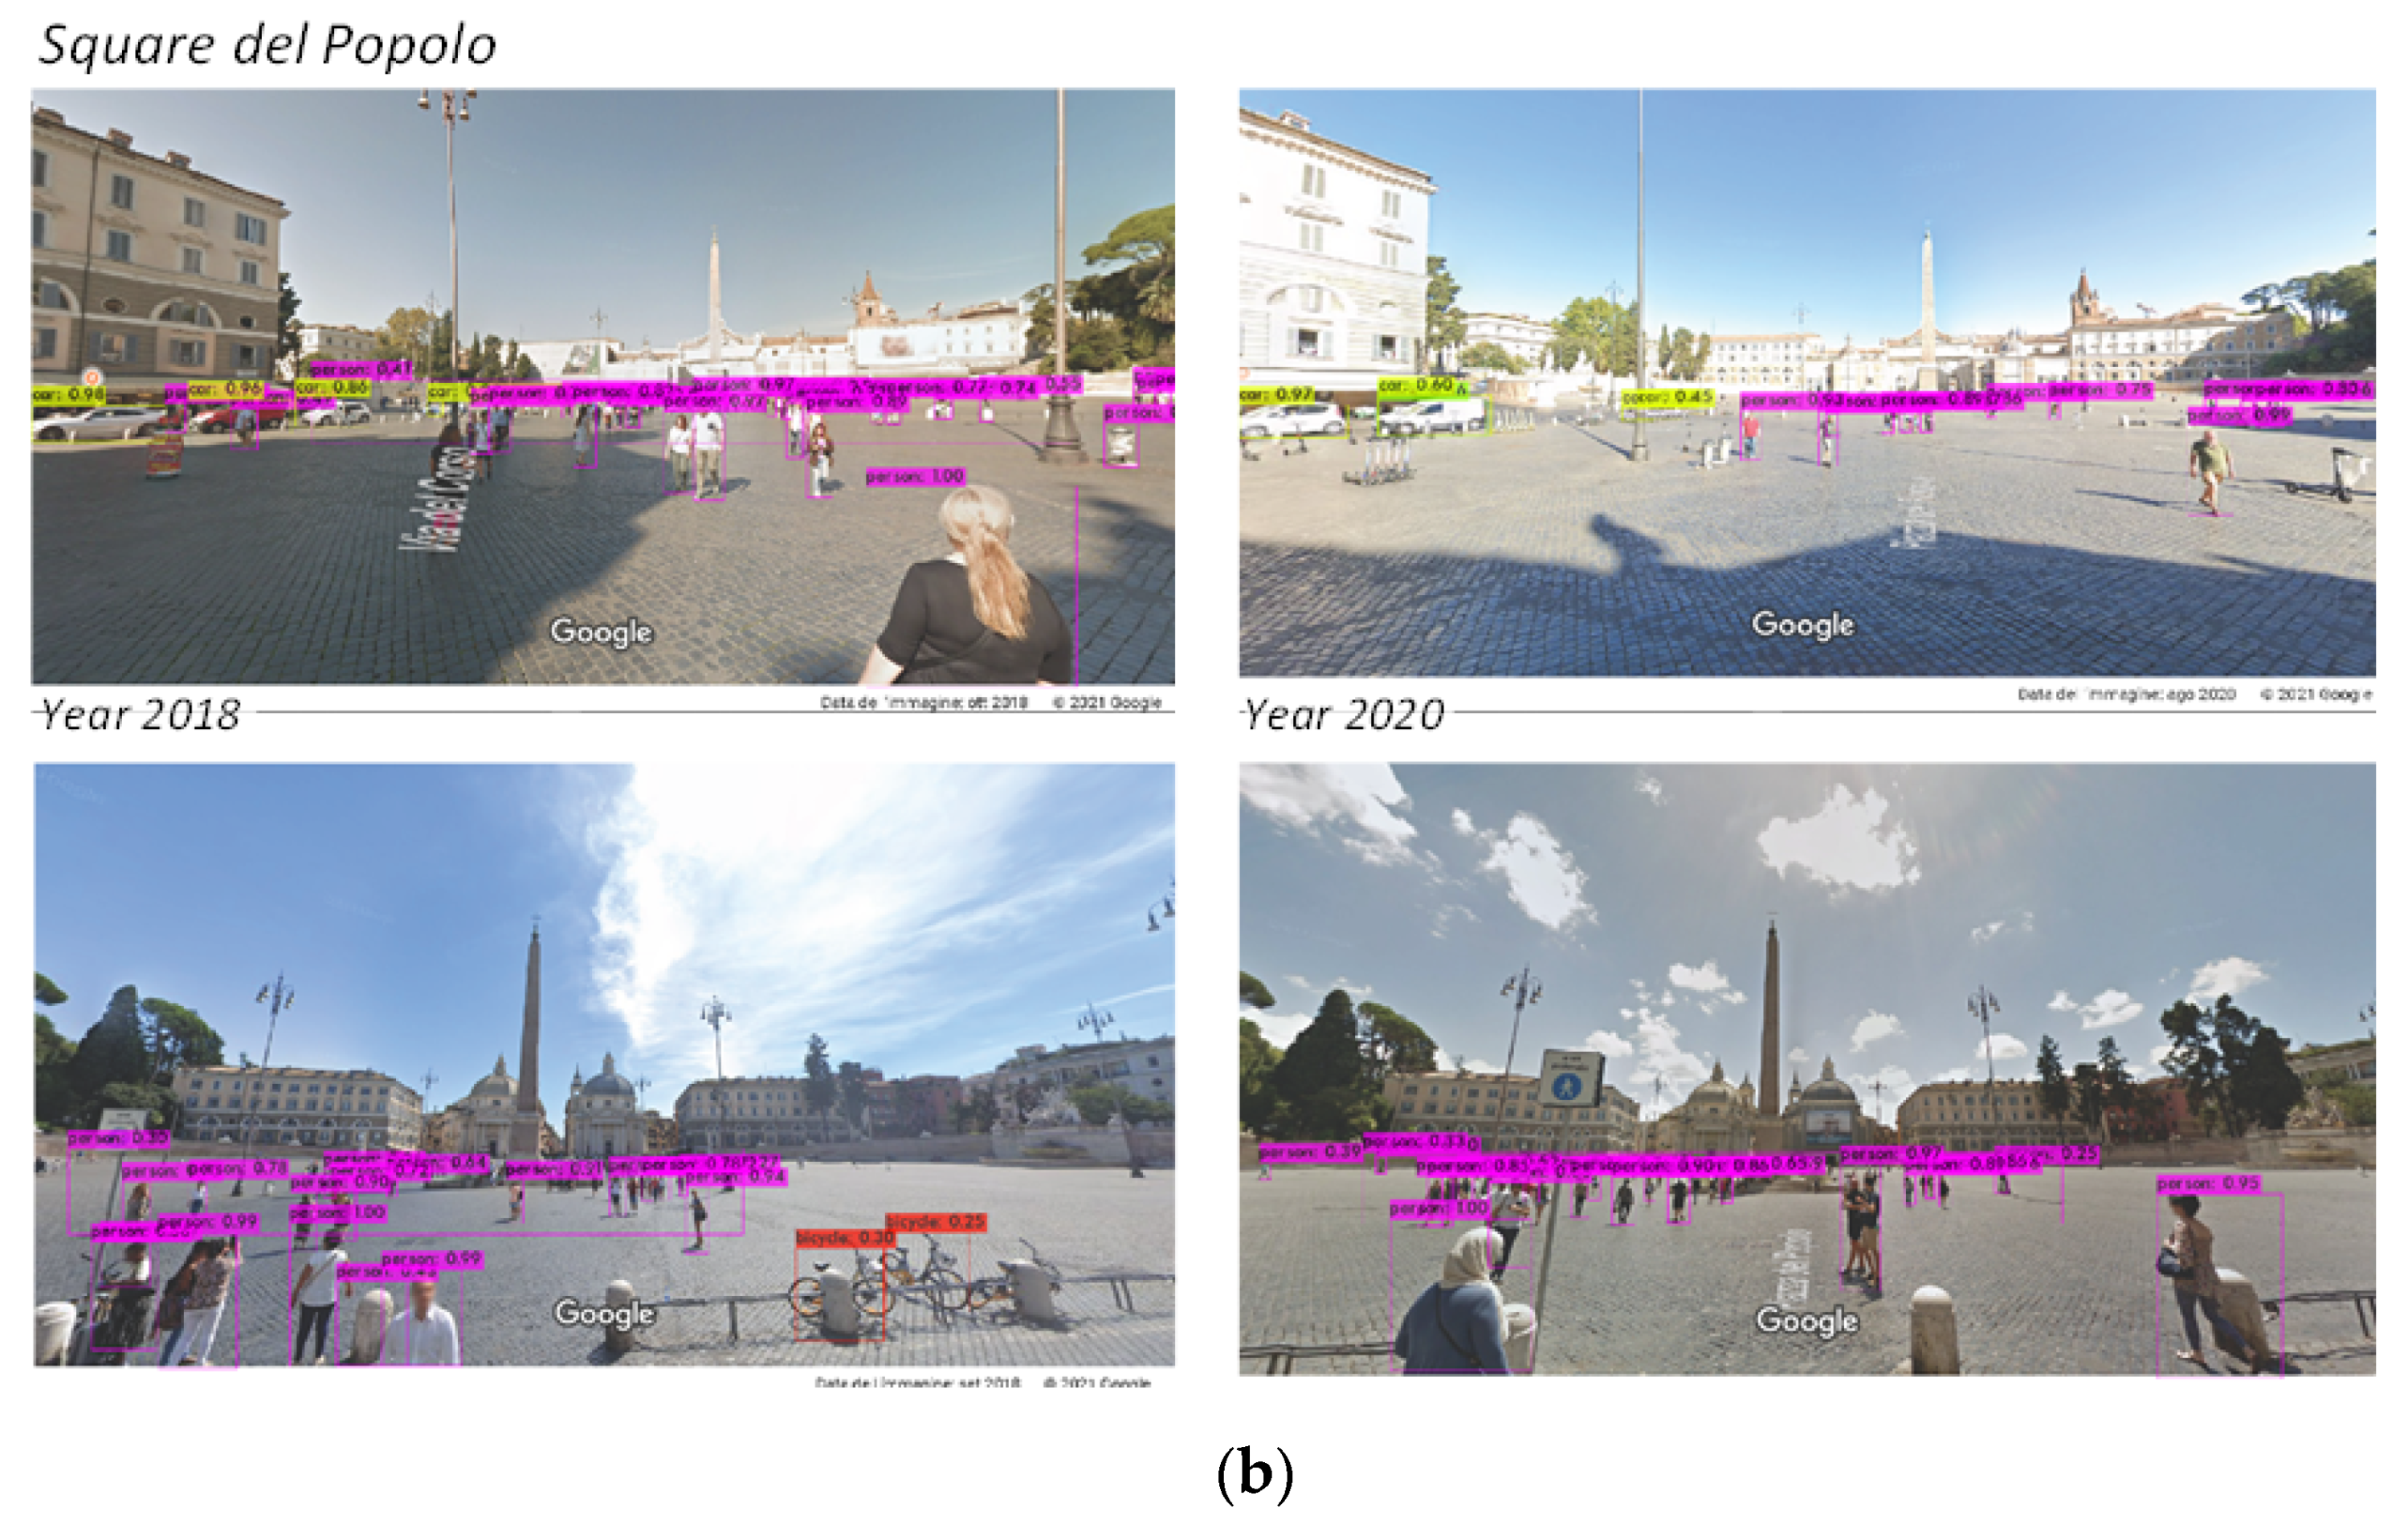
The results of the elaborations with the neural networks are reported in Figure 5a,b and in Table 5.
What is surprising in the elaborate images, besides the large size, is the shape of these squares (Figure 5a,b). In this regard, Sitte (1889) [53] pointed out that “in the Renaissance and even more so in the Baroque, architects were more concerned with the shape of the Squares than with their functionality”, “They refer to ideal theoretical models in which beauty derives from the rational harmony of mathematical laws and the use of perspective”. “Many times they are an element of pure urban beautification, rather than an element of utility” (Norberg, 1998).
Piazza Navona is located in what was once the Campo Marzio. It is a space with an unusual shape, and has great potential that has fascinated many architects (Schultz 1980; 1998) [54,55]. It was the era between the Renaissance and the Baroque that transformed the ancient space into a great scenography of power (the living room of Rome). Two famous architects, Bernini and Borromini, measured their skills in a competition that had the Piazza and its buildings as its theater: the church of S. Agnese (1657); Palazzo Doria Panphilj (1644); the Fountain of the Rivers (1650); the Fountain of Neptune and Fountain del Moro (1655) were all built during this era. The end result was a fantastic and engaging outdoor space, an enclosed stage of power [54].
The classified image shows in all its beauty the elongated shape of Piazza Navona, having an area of approximately 12,000 square meters. Today, the square is a large pedestrian area with the presence of outdoor activities, bars and restaurants that in our latitude make it usable all year round. The elaborations, limited to only two access points to the square (as a pedestrian area), highlight the presence of people in groups (21 people in 2028 and 5 in 2020), which is certainly an important indicator of urban vitality.
Franck and Stevens (2007) [56] observed that the activities that take place in a public space can be substantially reduced to two types: voluntary and induced activities. The first are those determined by people’s desires: e.g., to rest, read a book, run, meet someone, buy something, etc.; the latter are instead stimulated by a space thanks to its characteristics and the opportunities it offers at a given moment: e.g., bathe in a fountain on a hot day, dance when you hear music, sit on a step or wall, pick some flowers, etc. In the first case, individuals look for a place suitable for the functions they want to perform; in the second case, however, it is the space that stimulates people to carry out certain actions. When both voluntary and induced activities meet, that “magic”, in the sense of attractiveness which is recognized as having a value linked to being experienced, is created which gives the space a unique role, which favors opportunities for encounter, which stimulates the occurrence of spontaneous events, which allows the discovery of the unexpected space where they grow and intertwine sensory and emotional relationships.
To the right of the Tiber river, at a distance of 1800 m from St. Peter’s Square, there is one of the most important elements of the Baroque city: Piazza del Popolo (Figure 6). The elaboration highlights the complex of the square consisting of two large structures linked together: the gigantic elliptical basin and the Porta del Popolo located to the north (for centuries, it was the privileged access route into the city from the north).
One cannot help but notice in the elaborations the vast basalt flooring, equal to an area of 11,000 square meters. The center is characterized by a travertine obelisk dating back to the pharaoh Ramses II and a fountain designed by Giacomo della Porta.
The shape of the square assumed its current shape only at the end of the 19th century, designed by the architect Giuseppe Valadier. If in previous times the square was a place to stop, the baroque squares became places to stroll [57].
Until 1998, this square was a large parking lot for the city; later, it took on new life after being pedestrianized; currently, it is occasionally used for large events. Despite the fact that the elaboration highlights the presence of people in the vastness of the space of great historical and architectural value—26 people in the year 2018 and 13 in the year 2020—given the vastness of the square, a feeling of emptiness is perceived. In this regard, Carmona (2010) [58,59] stated that the absence of specific functions due to its scarce use does not make public spaces particularly lively; on the contrary, these can be monotonous and boring and not very attractive spaces in which to walk, meet, talk, stop, play, etc., even in the absence of traffic and parked cars.
The Center for Public Space Research, in its numerous studies on public space, has repeatedly underlined the relationship between life on the street, the number of people and events produced and the time spent outdoors, demonstrating how the decrease in opportunities to spend time in the open air contributes proportionally to the decrease in the vitality of a given area. Furthermore, by bringing together and “mixing” various types of activities in the same spatial context, the moments of spending time outdoors can be intensified and, therefore, the social relations between those who use the square.
4.3. Squares of the Nineteenth Century
The results of the elaborations with the neural networks are reported in Figure 6a,b and in Table 6.
Along with the technological evolution of transport systems that have forced cities to adapt their public spaces to rail, trams and cars, since the nineteenth century the industrial revolution has led to changes in urban structures to facilitate the mobility of people and goods [60]. The shape, size and furnishings of the twentieth century squares followed the functional needs that were gradually emerging [61].
The scale factor is completely different from that of previous eras: no longer the man’s meter, but the vehicle’s meter. The squares are no longer felt as a living organism, in the medieval or Renaissance manner, but as a large network of nodes that connect the great road itineraries together [62]. In Rome, under the Giolitti government (1903–1921), new districts and new squares were built, including Piazza Mazzini, Piazza Cavour, Piazza Risorgimento, Piazzale degli Eroi.
Observing the image of Piazza Mazzini (Figure 6a,b), the “swirling” large open and circular space is amazing, with a ring road that runs all around the square and leaves very little space for pedestrians to cross (one pedestrian in 2018 and one in 2020). At its center is a large flowerbed bordered by trees which, with a large fountain called the “garden fountain”, is the centerpiece of the neighborhood.
Piazza Mazzini, despite being a place in the center of the city and having valuable architectural features, is a space entirely dedicated to cars (27 in 2018 and 15 in 2020), which effectively “block” the usability of the space. A post office, banks and shops overlook the square, surrounded by parking spaces; this condition reduces social relations and diminishes the “public” role of the urban space [63] by discouraging the pedestrian mobility of the neighborhood. Cars, stationary and/or moving, represent a powerful obstacle to the usability and perception of public space.
Environmental factors, noise and atmospheric pollution produced by car traffic, influence the accessibility of a square, the usability and pleasantness of the meeting and rest spaces and can encourage or hinder the permanence of the inhabitants, the performance of certain activities, spontaneous aggregation and social cohesion and mutual understanding between people. The meaning of the word Piazza, as we get closer to the present, has been lost, replaced with the words Piazzale, Largo, open space, or large space. Piazzale degli Eroi is an example of this; it was also conceived as facilitating the functioning of the traffic, crossed by thousands of cars every day (Figure 6a,b).
The image processing shows the almost absolute presence of cars and the almost complete absence of pedestrians. Almost imperceptible, in the center of the square, there is the fountain of the Peschiera Aqueduct; inaugurated in 1949, made of concrete and travertine, this fountain is currently experiencing unstoppable deterioration; it is guarded by seagulls and garbage (bottles, weeds, various waste items) that are disfiguring the newly restored work. The processed GSW images also show that this part of the city does not offer the ideal environmental conditions to be frequented or used appropriately by the inhabitants. In this regard, Galderisi (2009) asserts that the human being has a great ability to adapt, but environmental factors, such as, for example, the intensity of traffic, air quality, acoustic quality, visual and light quality, play an important role in a person’s choices when accessing urban spaces and, more generally, in determining the quality of a public space and its livability.
In this context, there are some interesting initiatives promoted by the European Union Member States and local authorities, aimed at reducing cities’ environmental pollution generated by smog and noise produced by cars.
In particular, we note the European Union project “European Green Capital Award” which annually recognizes the city which, through development programs and interventions to protect and safeguard traditions, best promotes environmental improvement and sustainable development. Among the projects, it is interesting to note the work carried out by the Agència d’Ecologia Urbana de Barcelona, which develops sustainability plans and indicators aimed at reducing energy consumption and emissions, improving environmental conditions and the livability of the city. In this project, issues such as mobility, energy, waste, water, biodiversity and social cohesion are taken into consideration. Since the last century, very few squares have been built, only traffic intersections. The public buildings built recently (ministries, post offices and justice buildings, stations, theaters, etc.), instead of having a vast open space at the front, were lined up along the streets without demonstrating any difference compared to the residential houses. Many of the pre-existing squares have been used for the functioning of public buildings with the aim of facilitating access—for example, the parking of a maximum number of vehicles without hindering traffic, allowing the possibility of rapid and almost instant displacement for security reasons [62,63,64,65,66].
New data opportunities have emerged in recent decades for scholars seeking to better measure the physical environment of our cities as a manifestation of the history and culture of their inhabitants or the way we live in the urban environment. In fact, GSV imagery has been recognized as one of the most promising sources of data with visual information readily available with global coverage, offering access to anyone with an Internet connection. As a confirmation of this study, the processed images of some squares in Rome acquired by GSV confirmed that with an interdisciplinary approach, it is possible to extract information with a high level of spatial accuracy.
Google Street View is a component of Google Maps and Google Earth that serves millions of people every day with images captured in many cities. These images all have the potential to help us study our environment in ways never imagined or possible before, and are changing the way we can analyze and understand individual and collective human behavior. For example, a reliable alternative for remote location audits and a more resource-efficient (time and cost) substitute for on-site audits.
The use of GSV images in research, despite as offering great advantages, also has limitations; for example, they do not capture all environmental features, such as noise, pollution or perceived safety, and they only offer unique points of view (stationary at the time of capture). In this regard, this study has shown that the presence of stationary and/or moving cars, repeated over time, allows us to make a number of immediate considerations, such as noise and air pollution produced by car traffic. Other, less immediate but nevertheless effective considerations such as the performance of the functions typical of squares (walking, strolling, meeting, talking, stopping, playing, etc.) are inhibited by the presence of cars, which in any case impoverish the ‘social’ potential of public space. In general, it is also true that the understanding of the context in which certain characteristics of the environment under study appear, for example the emotions or sensations that a place can transmit, can be more difficult to understand in virtual audits than in field visits, even though data processing can involve millions of images. An inherent limitation of the technology used for GSV images is that they are collected from vehicles, so they may differ from a pedestrian’s perspective. Finally, a further limitation of using multiple GSV images is that they can have time lags of up to years between them; in fact, the update frequency remains uncertain, and varies from months to years, and also varies in space and differs in update rate.
Although in this study we show the reliability of GSV images to better understand the use of public spaces at street level, we believe that GSV is one of the useful sources, but is not the only or the universal solution. Social media users are constantly generating land use information in the form of text, images and videos. These heterogeneous data could in the near future be further studied because they are much more timely and abundant than GSV images. In summary, it is easy to foresee future studies using a hybrid method that merges GSV images with social media data to better understand the veracity of the environment.
5. Conclusions
This work has validated the relevance of a method applied to the use of artificial intelligence for the analysis of GSV images at street level. This method offers an innovative and scientifically valid contribution in the field of site monitoring in a purely objective mode, as it uses quantitative assessment techniques that are not susceptible to interpretation. The limitations that these techniques may have are understandable, but they can be improved by increasing our scientific knowledge. In this work, as a first experiment, only some elements of some squares in Rome in different historical periods have been characterized and quantified. We plan to provide, in a future work, a wider classification of more elements including in dynamic mode using the video surveillance systems already installed in some places. Using the video surveillance cameras, it will be possible to obtain dynamic monitoring of the places, both of moving and static elements, in real time. These techniques set up in this way can provide a significant improvement in the monitoring of places that need constant control in a smart city logic, while always preserving all of the ethical and privacy aspects as much as possible.
Furthermore, through the historical reading, an attempt was made to interpret the dynamics of current use, trying to identify some critical issues that exist.
The uncontrolled use of private cars reduces social relations and impoverishes the ‘public’ role of urban space, discouraging pedestrian mobility within the neighborhood or district. This is the case with medieval squares (Piscinula and Mercanti) and 19th century squares (Mazzini and Eroi). Cars, stationary and/or in motion, are a powerful obstacle to the usability and perception of public space. Virtually attractive green spaces, when located close to busy roads, are often not frequented most of the time because no one wants to stop, play, talk with others in the open air in a noisy and smog-filled place such as Piazza Mazzini. In concrete terms, these are factors that influence the accessibility and usability of squares and impoverish the public role of urban space.
The work will continue with other applications in other squares, given the small number of squares selected in this study and the limits imposed by the GSV images dictated by the time of observation, including the time of day, day of the week, and time of year. Nonetheless, the study, although limited, has made it possible to reflect on the use of certain squares. In particular, it emerged that there is no single element that makes a great square, despite the undisputed historical and architectural value of the squares we examined. It is certainly important to eliminate motorized traffic with its negative effects on air quality and noise. To restore vitality to the squares, the determining factor is what we have called “magic”, i.e., the harmony of space enriched by functional variety. Exploiting the capacity of urban space to be attractive can also encourage the presence of different functions, at the same or different times of the day (a market in the morning, a refreshment and meeting place in the afternoon, a favorite place for young people to meet in the evening). This apparently simple combination is unfortunately still difficult to create.
Squares are places in the city where the presence of the inhabitants could take shape as a nodal point of collective life to create aggregation. A sense of community can be found in the squares, being the right place where the whole community can recognize itself as a concrete realization of its own identity, for example by organizing events and meetings; this also means that its structures and furnishings can be made to measure for everyone, flexible, modifiable, transportable, and removable.
The study, which will be extended to more squares and different historical periods, has the potential to contribute to a better understanding of the use of public spaces at street level, as well as to stimulate and advance interdisciplinary discussion on the use of “big data” and recent computational advances, for planning and design in particular, and for the use and enhancement of cultural and environmental heritage. The authors hope that work of this kind can help in bridging the gap between experts and users at the city level in order to inform decision-making.
Author Contributions
Conceptualization, M.D.M., L.F. and M.M.; Data curation, M.D.M., L.F. and B.O.V.; Methodology, L.F. and M.M.; Software, M.M.; Supervision, L.F. and M.M. All authors have read and agreed to the published version of the manuscript.
Funding
This research received no external funding.
Acknowledgments
The author wishes to thank Cinzia Crenca for her technical research support.
Conflicts of Interest
The authors declare no conflict of interest.
References
- Li, X.; Ratti, C.; Seiferling, I. Mapping Urban Landscapes Along Streets Using Google Street View. In Advances in Cartography and GIScience. ICACI 2017. Lecture Notes in Geoinformation and Cartography; Peterson, M., Ed.; Springer: Cham, Switzerland, 2017. [Google Scholar] [CrossRef]
- Edwards, N.; Hooper, P.; Trapp, G.S.; Bull, F.; Boruff, B.; Giles-Corti, B. Development of a Public Open Space Desktop Auditing Tool (POSDAT): A remote sensing approach. Appl. Geogr. 2013, 38, 22–30. [Google Scholar] [CrossRef]
- Taylor, B.T.; Fernando, P.; Bauman, A.E.; Williamson, A.; Craig, J.C.; Redman, S. Measuring the quality of public open space using Google Earth. Am. J. Prev. Med. 2011, 40, 105–112. [Google Scholar] [CrossRef]
- Charreire, H.; Mackenbach, J.; Ouasti, M.; Lakerveld, J.; Compernolle, S.; Ben-Rebah, M.; McKee, M.; Brug, J.; Rutter, H.; Oppert, J.-M. Using remote sensing to define environmental characteristics related to physical activity and dietary behaviours: A systematic review (the SPOTLIGHT project). Health Place 2014, 25, 1–9. [Google Scholar] [CrossRef]
- Rundle, A.G.; Bader, M.D.; Richards, C.A.; Neckerman, K.M.; Teitler, J.O. Using Google Street View to audit neighborhood environments. Am. J. Prev. Med. 2011, 40, 94–100. [Google Scholar] [CrossRef] [PubMed] [Green Version]
- Odgers, C.L.; Caspi, A.; Bates, C.J.; Sampson, R.J.; Moffitt, T.E. Systematic social observation of children’s neighborhoods using Google Street View: A reliable and cost-effective method. J. Child Psychol. Psychiatry 2012, 53, 1009–1017. [Google Scholar] [CrossRef] [Green Version]
- Griew, P.; Hillsdon, M.; Foster, C.; Coombes, E.; Jones, A.; Wilkinson, P. Developing and testing a street audit tool using Google Street View to measure environmental supportiveness for physical activity. Int. J. Behav. Nutr. Phys. Act. 2013, 10, 103. [Google Scholar] [CrossRef] [Green Version]
- Li, X.; Zhang, C.; Li, W.; Kuzovkina, Y.A. Environmental inequities in terms of different types of urban greenery in Hartford, Connecticut. Urban For. Urban Green. 2016, 18, 163–172. [Google Scholar] [CrossRef]
- Yang, W.; Kang, J. 2016 Acoustic comfort evaluation in urban open public spaces. Appl. Acoust. 2016, 66, 211–229. [Google Scholar] [CrossRef]
- Xiao, J.; Tait, M.; Kang, J. A perceptual model of smellscape pleasantness. Cities 2018, 76, 105–115. [Google Scholar] [CrossRef] [Green Version]
- Gehl, J.; Svarre, B. How to Study Public Life; Island Press: London, UK, 2013. [Google Scholar] [CrossRef] [Green Version]
- Edwards, B.; Frasch, T.; Jeyacheya, J. Evaluating the effectiveness of land-use zoning for the protection of built heritage in the Bagan Archaeological Zone, Myanmar—A satellite remote-sensing approach. Land Use Policy 2019, 88, 104174. [Google Scholar] [CrossRef]
- Fiumi, L. Surveying the roofs of Rome. J. Cult. Herit. 2012, 13, 304–313. [Google Scholar] [CrossRef]
- Yang, J.; Zhao, L.; Mcbride, J.; Gong, P. Can you see green? Assessing the visibility of urban forests in cities. Landsc. Urban Plan. 2009, 91, 97–104. [Google Scholar] [CrossRef]
- Nowak, D.J.; Hirabayashi, S.; Bodine, A.; Greenfield, E. Tree and forest effects on air quality and human health in the United States. Environ. Pollut. 2014, 193, 119–129. [Google Scholar] [CrossRef] [Green Version]
- Van Oers, R. Towards new international guidelines for the conservation of Historic Urban Landscapes (HUL). City Time 2007, 3, 43–51. Available online: http://www.ceci-br.org/novo/revista/docs2008/CT-2008-113.pdf (accessed on 21 July 2021).
- Bandarin, F.; Van Oers, R. The Historic Urban Landscape: Managing Heritage in an Urban Century; Wiley Blackwell: Hoboken, NJ, USA; West Sussex: Chichester, UK, 2012; ISBN 978-1-119-96809-2. [Google Scholar]
- Veldpaus, L.A.; Pereira, R.B.J.F. Colenbrander Urban heritage: Putting the past into the future Hist. Environ. Policy Pract. 2013, 4, 3–18. [Google Scholar] [CrossRef]
- UNESCO Recommendation on The Historic Urban Landscape; UNESCO World Heritage Center: Paris, France, 2011. Available online: http://www.stellenboschheritage.co.za/forum/news/the-approved-unesco-historic-urban-landscape-recommendation (accessed on 21 July 2021).
- Decreto Legislativo 42/2004, Codice Dei Beni Culturali e Del Paesaggio, ai Sensi Dell’Articolo 10 Della Legge 6 Luglio 2002, n. 137. (GU Serie Generale n.45 del 24-02-2004—Suppl. Ordinario n. 28). Available online: https://www.gazzettaufficiale.it/atto/serie_generale/caricaDettaglioAtto/originario?atto.dataPubblicazioneGazzetta=2004-0224&atto.codiceRedazionale=004G0066&elenco30giorni=false (accessed on 21 July 2021).
- Arribas-Bel, D. Accidental, open and everywhere: Emerging data sources for the understanding of cities. Appl. Geogr. 2014, 49, 45–53. [Google Scholar] [CrossRef] [Green Version]
- Özer, Ö.; Kubat, A.S. Walking initiatives: A quantitative movement analysis. In Proceedings of the 6th International Space Syntax Symposium, İstanbul, Turkey, 12–15 June 2007. [Google Scholar]
- Hajrasouliha, A.; Yin, L. L’impatto della connettività della rete stradale sul volume pedonale. Studi Urbani 2015, 52, 2483–2497. [Google Scholar] [CrossRef]
- Carmona, M.; Heath, T.; Oc, T. Luoghi Pubblici: Spazi Urbani, 2nd ed.; Routledge: Oxford, UK, 2010; ISBN 9781856178273. [Google Scholar]
- Mazzei, M. An Unsupervised Machine Learning Approach for Medical Image Analysis. In Advances in Information and Communication. FICC 2021. Advances in Intelligent Systems and Computing; Arai, K., Ed.; Springer: Cham, Switzerland, 2021; Volume 1364. [Google Scholar] [CrossRef]
- Mazzei, M.; Palma, A.L. Spatial multicriteria analysis approach for evaluation of mobility demand in urban areas. In Computer Science (Including Subseries Lecture Notes in Artificial Intelligence and Lecture Notes in Bioinformatics) Book; Springer: Cham, Switzerland, 2017. [Google Scholar] [CrossRef]
- Uijlings, J.; van de Sande, K.; Gevers, T.; Smeulders, A. Selective Search for Object Recognition. Int. J. Comput. Vis. 2013, 104, 154–171. [Google Scholar] [CrossRef] [Green Version]
- Girshick, R.; Donahue, J.; Darrell, T.; Malik, J. Rich feature hierarchies for accurate object detection and semantic segmentation. In Proceedings of the IEEE Conference on Computer Vision and Pattern Recognition, Seattle, WA, USA, 21–23 June 2014. [Google Scholar]
- Gulli, A.; Kapoor, A.; Pal, S. Deep Learning with TensorFlow 2 and Keras, Packt, 2019 F.Rosenblatt, The perceptron: A probabilistic model for information storage and organization in the brain. Psychol. Rev. 1958, 65. [Google Scholar]
- Mazzei, M.; Palma, A.L. Analysis of Localization and Space Interaction Models. Proposal of very good linked model applied to a study area for the localization of a large shopping mall. GEOMEDIA 2014, 18 (Suppl. 1), 265–275. [Google Scholar]
- Mazzei, M.; Palma, A.L. Spatial Statistical Models for the Evaluation of the Landscape. In Computational Science and Its Applications—ICCSA 2013. ICCSA 2013. Lecture Notes in Computer Science; Murgante, B., Ed.; Springer: Berlin/Heidelberg, Germany, 2014; Volume 7974. [Google Scholar] [CrossRef]
- Mazzei, M.; Palma, A.L. Comparative Analysis of Models of Location and Spatial Interaction. In Computational Science and Its Applications—ICCSA 2014. ICCSA 2014. Lecture Notes in Computer Science; Murgante, B., Ed.; Springer: Cham, Switzerland, 2014; Volume 8582. [Google Scholar] [CrossRef]
- Mazzei, M. An Unsupervised Machine Learning Approach in Remote Sensing Data. In Computational Science and Its Applications—ICCSA 2019. ICCSA 2019. Lecture Notes in Computer Science; Murgante, B., Ed.; Springer: Cham, Switzerland, 2019. [Google Scholar] [CrossRef]
- Mazzei, M. Software development for unsupervised approach to identification of a multi temporal spatial analysis model. In Proceedings of the 2018 International Conference on Image Processing, Computer Vision, and Pattern Recognition, IPCV 2018, Las Vegas, NV, USA, 30 July–2 August 2018; pp. 85–91. Available online: https://csce.ucmss.com/cr/books/2018/LFS/CSREA2018/IPC3126.pdf (accessed on 21 July 2021).
- Nosratabadi, S.; Mosavi, A.; Keivani, R.; Ardabili, S.; Aram, F. State of the Art Survey of Deep Learning and Machine Learning Models for Smart Cities and Urban Sustainability; Springer: Cham, Switzerland, 2019. [Google Scholar]
- European Parliament, P9_TA(2020)0162 Setting up a Special Commettee on Artificial Intelligence in a Digital Age, and Defining Its Responsabilities, Numerical Strength and Term Of Office, 2020.
- Amato, F.; Tonini, M.; Murgante, B.; Kanevski, M.F. Fuzzy definition of rural urban interface: An application based on land use change scenarios in Portugal. Environ. Model Softw. 2018, 104, 171–187. [Google Scholar] [CrossRef]
- He, K.; Gkioxari, G.; Dollar, P.; Girshick, R. Mask R-CNN. In Proceedings of the IEEE International Conference on Computer Vision, Venice, Italy, 22–29 October 2017. [Google Scholar]
- Hinton, G.; Osindero, S.; Teh, Y. A fast learning algoritm for deep belief nets. Neural Comput. 2006, 18, 1527–1554. [Google Scholar] [CrossRef] [PubMed]
- Redmon, J.; Divvala, S.; Girshick, R.; Farhadi, A. You Only Look Once: Unified, Real-Time Object Detection. In Proceedings of the IEEE Conference on Computer Vision and Pattern Recognition, Las Vegas, NV, USA, 27–30 June 2016. [Google Scholar]
- Zou, Z.; Shi, Z.; Guo, Y.; Ye, J. Object Detection in 20 years: A Survey. arXiv 2019, arXiv:1905.05055. [Google Scholar]
- Krizhevsky, A.; Sutskever, I.; Hinton, G. ImageNet Classification with Deep Convolutional Neural Networks. Adv. Neural. Inf. Process. Syst. 2012, 25, 1097–1105. [Google Scholar] [CrossRef]
- Naphade, M.; Wang, S.; Anastasiu, D.; Tang, Z.; Chang, M.; Yang, X.; Zheng, L.; Sharma, A.; Chellappa, R.; Chakraborty, P. The 4th AI City Challenge, 2020. Available online: https://arxiv.org/abs/2004.14619 (accessed on 21 July 2021).
- Analide, C.; Novais, P.; Camacho, D.; Yin, H. Intelligent Data Engineering and Automated Learning—IDEAL 2020; Springer: Berlin/Heidelberg, Germany, 2020. [Google Scholar]
- Commissione Europea, COM(2020) 65 Final–Libro Bianco Sull’intelligenza Artificiale—Un Approccio Europeo All’eccellenza E Alla Fiducia”, 2020.
- Mazzei, M.; Di Guida, S. Spatial data warehouse and spatial OLAP in indoor/outdoor cultural environments. In Computer Science (Including Subseries Lecture Notes in Artificial Intelligence and Lecture Notes in Bioinformatics); Springer: Cham, Switzerland, 2018. [Google Scholar] [CrossRef]
- Ranjbarnia, B.; Murgante, B.; Molaei, Q.M.; Rustaei, S. A comparative study employing CIA methods in knowledge-based urban development with emphasis on affordable hous-ing in Iranian cities (case: Tabriz). In Proceedings of the ICCSA 2017, Trieste, Italy, 3–6 July 2017; LNCS. Gervasi, O., Ed.; Springer: Cham, Switzerland, 2017; Volume 10407, pp. 485–501. [Google Scholar] [CrossRef] [Green Version]
- Guidoni, E. Le Piazze dal Medioevo aLL’OTTOCento: Progettazione, Vedute, Metrologia; Grandi Opere; Kappa: Roma, Italy, 2006; ISBN 9788878906532. [Google Scholar]
- Sitte, C. L’arte di Costruire le Città, 1980 Jaca Book, Milano; EAN: Milano, Italy, 1980; ISBN 9788816416109. [Google Scholar]
- Conti, F. Piazze D’Italia; Touring Club Italiano: Milano, Italy, 2005; pp. 8–21. ISBN 88-365-3498-8. [Google Scholar]
- Piccinato, L. Urbanistica Medievale; Dedalo Libri: Bari, Italy, 1978; pp. 61–89. [Google Scholar]
- Lauria, A. Piccoli Spazi Urbani, Valorizzazione Degli Spazi Residuali in Contesti Storici E Qualità Sociale; Liguori Editore: Napoli, Italy, 2017; ISBN 978-88-207-6745. [Google Scholar]
- Sitte, C. Der Städtebau Nach Seiner Künstlerischen Grundsätzen, Wien 1889 (trad. it. L’arte di costruire le città); EAN: Milano, Italy, 1889; ISBN 9788816400658. [Google Scholar]
- Norberg-Schulz, C. Architettura Barocca; Electa: Milano, Italy, 1998; ISBN 9788843524617. [Google Scholar]
- Norberg-Schulz, C. Architettura Tardobarocca; Electa: Milano, Italy, 1980. [Google Scholar]
- Franck, K.A.; Stevens, Q. Loose Space. Possibility and Diversity in Urban Life; Routledge: New York, NY, USA, 2007; ISBN 9780415701174. [Google Scholar]
- Aymonino, A.; Mosco, V.P. Spazi Pubblici Contemporanei, Architettura a Volume Zero; Skira Editore: Milan, Italy, 2006; ISBN 13978-8876242724. Available online: https://www.ibs.it/spazi-pubblici-contemporanei-architettura-a-libro-vari/e/9788876242724 (accessed on 21 July 2021).
- Carmona, M. Contemporary Public Space: Critique and Classification, Part One: Critique. J. Urban Des. 2001, 15, 123–148. Available online: https://0-www-tandfonline-com.brum.beds.ac.uk/doi/abs/10.1080/13574800903435651 (accessed on 21 July 2021). [CrossRef]
- Carmona, M. Contemporary Public Space, Part Two: Classification. J. Urban Des. 2010, 15, 157–173. Available online: https://0-www-tandfonline-com.brum.beds.ac.uk/doi/abs/10.1080/13574801003638111 (accessed on 21 July 2021). [CrossRef]
- Cicalò, E. Spazi Pubblici. Progettare la Dimensione Pubblica Della Città Contemporanea; Franco Angeli: Milan, Italy, 2009; ISBN 108876242724. [Google Scholar]
- Rossi, S. Roma Struttura Dinamica, Universale di Architettura, Collana Diretta da Bruno Zevi, n. 22 Officine Grafiche Artistiche; Officine Grafiche Artistiche Locality: Torino, Italy, 1997. [Google Scholar]
- Insolera, I. Roma Moderna. Un Secolo Di Storia Urbanistica 1870–1970; Einaudi: Roma, Italy, 2001; ISBN 13978-8806159313. [Google Scholar]
- Galderisi, A. Politiche della sosta e qualità dell’ambiente urbano. TeMA—Territ. Mobilità Ambiente 2009, 2, 7–16. Available online: http://eprints.bice.rm.cnr.it/607/ (accessed on 21 July 2021).
- Capasso, A.; Bellomo, M. Piazze e Città. In Luoghi Urbani Tra Pedonalità e Commercio; Prismi: Napoli, Italy, 2001; ISBN 978-8870650297. [Google Scholar]
- Augé, M. Straniero a me Stesso: Tutte le Mie vite di Etnologo; Bollati, B., Ed.; 2011; ISBN 9788833922294. Available online: https://www.bollatiboringhieri.it/libri/marc-auge-straniero-a-me-stesso-9788833922294/ (accessed on 21 July 2021).
- Abdelhakim, H.; Djamel, A. Assessment of the Intensity of Use of Public Places. Int. J. Innov. Stud. Sociol. Humanit. 2020, 5. [Google Scholar] [CrossRef]
Figure 1.
Artificial neuron.

Figure 2.
Perceptron.

Figure 3.
Schema proposed.

Figure 4.
Subsequently elaborated images of Piazza dei Mercanti (a) and Piazza in Piscinula (b). Both are seen from two different angles and with two acquisitions in the years 2018 and 2020.
Figure 4.
Subsequently elaborated images of Piazza dei Mercanti (a) and Piazza in Piscinula (b). Both are seen from two different angles and with two acquisitions in the years 2018 and 2020.


Figure 5.
Square Navona (a) and square del Popolo (b), respectively, with two acquisitions from the years 2018 and 2020.
Figure 5.
Square Navona (a) and square del Popolo (b), respectively, with two acquisitions from the years 2018 and 2020.


Figure 6.
Square Mazzini (a) and Large square degli Eroi (b), respectively, with two acquisitions from the years 2018 and 2020.
Figure 6.
Square Mazzini (a) and Large square degli Eroi (b), respectively, with two acquisitions from the years 2018 and 2020.


Table 1.
List of squares selected in the study.
| Square | Historical Period |
|---|---|
| Dei Mercanti | Medieval |
| In Piscinula | Medieval |
| Navona | Renaissance—Baroque |
| Del Popolo | Renaissance—Baroque |
| Degli Eroi | nineteenth century |
| Giuseppe Mazzini | nineteenth century |
Table 2.
Category prediction for Square Navona (2020).
| Category | Accuracy |
|---|---|
| person | 48% |
| person | 61% |
| person | 79% |
| bench | 74% |
| dog | 30% |
| car | 91% |
| person | 99% |
| car | 70% |
| truck | 30% |
| person | 100% |
| car | 98% |
| car | 98% |
| person | 48% |
| person | 61% |
| person | 79% |
| bench | 74% |
| dog | 30% |
| car | 91% |
| person | 99% |
| car | 70% |
| truck | 30% |
| person | 100% |
| car | 98% |
| car | 98% |
Table 3.
Summary of the processing.
| Year | Images | Car | Truck | Bus | Person | Motorbike | Bicycle | Skateboard | Umbrella | Bench | Potted Plant | Dog | Total |
|---|---|---|---|---|---|---|---|---|---|---|---|---|---|
| 2018 | Square dei Mercanti | 13 | 1 | 1 | 1 | 16 | |||||||
| 2018 | Square dei Mercanti | 16 | 2 | 18 | |||||||||
| 2020 | Square dei Mercanti | 13 | 2 | 15 | |||||||||
| 2020 | Square dei Mercanti | 12 | 12 | ||||||||||
| 2018 | Square in Piscinula | 17 | 3 | 20 | |||||||||
| 2018 | Square in Piscinula | 21 | 1 | 22 | |||||||||
| 2020 | Square in Piscinula | 24 | 2 | 1 | 27 | ||||||||
| 2020 | Square in Piscinula | 17 | 1 | 1 | 19 | ||||||||
| 2018 | Square Navona | 21 | 1 | 2 | 24 | ||||||||
| 2020 | Square Navona | 4 | 1 | 5 | 1 | 1 | 12 | ||||||
| 2018 | Square del Popolo | 4 | 26 | 30 | |||||||||
| 2018 | Square del Popolo | 19 | 2 | 21 | |||||||||
| 2020 | Square del Popolo | 4 | 1 | 13 | 18 | ||||||||
| 2020 | Square del Popolo | 22 | 22 | ||||||||||
| 2018 | Square Mazzini Mazzini | 31 | 1 | 1 | 33 | ||||||||
| 2018 | Square Mazzini Mazzini | 26 | 7 | 2 | 35 | ||||||||
| 2020 | Square Mazzini Mazzini | 29 | 1 | 1 | 2 | 33 | |||||||
| 2020 | Square Mazzini Mazzini | 25 | 1 | 1 | 27 | ||||||||
| 2018 | Large square degli Eroi | 27 | 27 | ||||||||||
| 2018 | Large square degli Eroi | 16 | 1 | 3 | 20 | ||||||||
| 2020 | Large square degli Eroi | 15 | 3 | 1 | 1 | 1 | 21 | ||||||
| 2020 | Large square degli Eroi | 16 | 2 | 1 | 19 | ||||||||
| 2018 | Square Cina | 23 | 1 | 24 | |||||||||
| 2018 | Square Cina | 26 | 1 | 1 | 28 | ||||||||
| 2020 | Square Cina | 30 | 2 | 32 | |||||||||
| 2018 | Square Largo Terzo Millennio | 12 | 2 | 14 | |||||||||
| 2018 | Square Largo Terzo Millennio | 29 | 1 | 30 | |||||||||
| 2020 | Square Largo Terzo Millennio | 20 | 20 | ||||||||||
| 2020 | Square Largo Terzo Terzo Millennio | 6 | 4 | 10 |
Table 4.
Shows the results of the processing.
| Year | Images | Car | Truck | Bus | Person | Motorbike | Bicycle | Skateboard | Umbrella | Bench | Potted Plant | Dog | Total |
|---|---|---|---|---|---|---|---|---|---|---|---|---|---|
| 2018 | Square dei Mercanti | 13 | 1 | 1 | 1 | 16 | |||||||
| 2018 | Square dei Mercanti | 16 | 2 | 18 | |||||||||
| 2020 | Square dei Mercanti | 13 | 2 | 15 | |||||||||
| 2020 | Square dei Mercanti | 12 | 12 | ||||||||||
| 2018 | Square in Piscinula | 17 | 3 | 20 | |||||||||
| 2018 | Square in Piscinula | 21 | 1 | 22 | |||||||||
| 2020 | Square in Piscinula | 24 | 2 | 1 | 27 | ||||||||
| 2020 | Square in Piscinula | 17 | 1 | 1 | 19 |
Table 5.
Results of the processing.
| Year | Images | Car | Truck | Bus | Person | Motorbike | Bicycle | Skateboard | Umbrella | Bench | Potted Plant | Dog | Total |
|---|---|---|---|---|---|---|---|---|---|---|---|---|---|
| 2018 | Square Navona | 21 | 1 | 2 | 24 | ||||||||
| 2020 | Square Navona | 4 | 1 | 5 | 1 | 1 | 12 | ||||||
| 2018 | Square del Popolo | 4 | 26 | 30 | |||||||||
| 2018 | Square del Popolo | 19 | 2 | 21 | |||||||||
| 2020 | Square del Popolo | 4 | 1 | 13 | 18 | ||||||||
| 2020 | Square del Popolo | 22 | 22 |
Table 6.
Results of the processing.
| Year | Images | Car | Truck | Bus | Person | Motorbike | Bicycle | Skateboard | Umbrella | Bench | Potted Plant | Dog | Total |
|---|---|---|---|---|---|---|---|---|---|---|---|---|---|
| 2018 | Square Mazzini Mazzini | 31 | 1 | 1 | 33 | ||||||||
| 2018 | Square Mazzini Mazzini | 26 | 7 | 2 | 35 | ||||||||
| 2020 | Square Mazzini Mazzini | 29 | 1 | 1 | 2 | 33 | |||||||
| 2020 | Square Mazzini Mazzini | 25 | 1 | 1 | 27 | ||||||||
| 2018 | Large square degli Eroi | 27 | 27 | ||||||||||
| 2018 | Large square degli Eroi | 16 | 1 | 3 | 20 | ||||||||
| 2020 | Large square degli Eroi | 15 | 3 | 1 | 1 | 1 | 21 | ||||||
| 2020 | Large square degli Eroi | 16 | 2 | 1 | 19 |
Publisher’s Note: MDPI stays neutral with regard to jurisdictional claims in published maps and institutional affiliations. |
© 2021 by the authors. Licensee MDPI, Basel, Switzerland. This article is an open access article distributed under the terms and conditions of the Creative Commons Attribution (CC BY) license (https://creativecommons.org/licenses/by/4.0/).
Share and Cite
MDPI and ACS Style
Maria, M.D.; Fiumi, L.; Mazzei, M.; V., B.O. A System for Monitoring the Environment of Historic Places Using Convolutional Neural Network Methodologies. Heritage 2021, 4, 1429-1446. https://0-doi-org.brum.beds.ac.uk/10.3390/heritage4030079
AMA Style
Maria MD, Fiumi L, Mazzei M, V. BO. A System for Monitoring the Environment of Historic Places Using Convolutional Neural Network Methodologies. Heritage. 2021; 4(3):1429-1446. https://0-doi-org.brum.beds.ac.uk/10.3390/heritage4030079
Chicago/Turabian StyleMaria, Massimo De, Lorenza Fiumi, Mauro Mazzei, and Bik Oleg V. 2021. "A System for Monitoring the Environment of Historic Places Using Convolutional Neural Network Methodologies" Heritage 4, no. 3: 1429-1446. https://0-doi-org.brum.beds.ac.uk/10.3390/heritage4030079